workforce of the future appendix - pwc · 4 workforce of the future: the views of 10,000 workers...
TRANSCRIPT
www.pwc.com/futureworkforce
Workforce of the futureThe views of 10,000 workers

Contents
Key findings 4
Confidence in the future 6
Work: What do you value? 12
Confidence in skills? 17
Conclusion 28
The messages for leaders 29
About our survey 30
2 Workforce of the future: The views of 10,000 workers

ForewordWe are in the midst of one of the most important periods of change in the workplace that we are likely to see in our lifetime. No one really knows how our world will be shaped by technology, what the future of work will look like, or whether work and employment as we know them will even exist. However, much of this debate focuses on what technology could do, and not around the choices we will have about how we will use it.
1http://www.pwc.com/futureworkforce (August 2017)
3
In my 30 years in the workforce many waves of change and technology have swept through. Each has been different and has impacted in ways that we couldn’t and didn’t foresee at the outset. The only constant in each subsequent generation of change has been the way workers have reacted to, embraced or interpreted the final outcome. Low confidence, nervousness about the future and uncertainty all kill the creativity and innovation that individuals and organisations need to succeed.
To help us better understand this, as we developed our new study Workforce of the future: The competing forces shaping 2030 we asked people how they were feeling about the future of work. 10,000 working, unemployed, retired and studying people split evenly between five countries (China, Germany, India, the UK and the US) shared their feelings, predictions and hopes for the future of work. In particular we were interested in how confident they are about the future and in their own skills.
We also asked about the kinds of organisations they would work for, some of the trade-offs they thought they might need to make and where they would draw the line around their personal data and taking extreme measures to enhance their work prospects. Whilst the future is unknown there is much that can be done now to prepare for it. Leaders of teams, organisations and nations have a responsibility to create the right environment for success. Knowing how your people are feeling and putting in place the right communications and actions to give them the confidence to actively embrace the future is the first step on this journey.
Jon WilliamsJoint Global Leader, People and Organisation

4 Workforce of the future: The views of 10,000 workers
Key findingsExcited about the future
Despite all the talk about robots taking over jobs, when people think about the future world of work, 73% feel positive, with 37% excited to see a world of possibilities, up from 29% in our 2014 survey.
Sixty-five percent of people believe that technology developments will improve their job prospects rising to 88% in India. And three-quarters of people across the globe agree that ‘Technology will never replace the human mind’. Eight in ten agree that ‘Human skills will always be in demand’.
We need an inclusive conversation about jobs
Three years ago 33% of people globally were concerned about automation of jobs, this year that figure has risen to 37%. And those with fewer years of formal education are the most worried. Thirty-two percent of those educated to school leaver level worry about their future versus 13% of university graduates.
A clear majority say that governments should take any action needed to protect jobs from automation. India in particular has strong support for an interventionist approach with 69% agreeing to government action.
There is a real need to open up a genuine and fully-inclusive discussion about the future of work.
Societal impact is important to people
Seventy percent of people globally say they want to work for an organisation with a ‘powerful social conscience’ – up from 65% in 2014 – with a very strong level of agreement in the growth economies of China (84%) and India (82%). This is well above the responses from the UK (51%) and Germany (60% – down from 64% in 2014).
Globally, job security and long term service are the most important to people, with 30% valuing these over anything else. But flexibility and being in control of the work they do is also high on people’s priorities.
73%see a positive future – up from 66% in 2014
32%educated to school leaver level are worried about their future
70%want to work for an organisation with a powerful social conscience

5
Trading liberties for good jobs
When it comes to personal data more than a third of people (37%) are willing to give their employer access including social media profiles. This is up from 31% in 2014. Perhaps surprisingly, Gen Z workers are less comfortable giving access to their data than Millennials.
PwC asked people in our survey if they would consider ‘treatments to enhance their brain and body if this could improve employment prospects’ – for instance, drugs that improve concentration or combat fatigue. Seventy percent globally said they would – up from 62% in 2014. Millennials (79%) and respondents from China (87%) and India (72%) were most willing.
Wildly different levels of confidence in skills
Fifty-four percent of individuals feel they have ‘all the skills they need for the rest of their career’, though this is much lower in the UK with only 35% believing this.
Just over half of people globally believe they have STEM skills (science, technology, engineering and maths) but this is significantly lower in the UK (33%). The UK also ranks bottom for digital skills, risk management skills and creativity and innovation. Across the board people from India and China, and Millennials, have a high level of confidence in their skills.
Giving CEOs the soft skills they want
Three-quarters of people said they were ‘ready to learn new skills or completely re-train in order to remain employable in the future’. Not surprisingly older workers were not quite so ready to think about a whole new set of skills. And people are generally happy to take learning into their own hands with seventy-four percent of people globally agreeing it is their own responsibility to update their skills rather than relying on an employer.
The good news for CEOs is that the soft skills they’re looking for – including problem-solving, creativity and innovation, leadership, and adaptability – are the most frequently claimed skills.
70%would use performance enhancers to improve employment prospects
74%in India say they have STEM skills – only 33% in UK say the same
85%say they have problem‑solving skills

6 Workforce of the future: The views of 10,000 workers
Confidence in the future
8%
18%
36%
37%
13%
20%
37%
29%
Excited – I see a world of possibility
Confident – I know that I will be successful
Worried – I am nervous about what the future holds
Uninterested - I tend not to think too far ahead
2017 2014
Figure 1: People are more excited about the future than 3 years ago Q – When you think about the future world of work as it is likely to affect you, how do you feel?
Sample: All those who are not retired (2017: 8,459, 2014: 8,095)
More talk of robots, but we’re more positive
When people think about the future world of work as it affects them, 73% feel positive, with men (79%) more upbeat than women (67%).
Could it be that all the talk of robots and automation is actually making people more enthusiastic about the future? In our 2014 survey, just 66% of people had a positive outlook, with only 29% being ‘excited’ about the future. This has gone up to 37% this year.
It’s certain that increasing numbers of people are considering the future world of work and how it will affect them: only one in twelve now says they ‘tend not to think too far ahead’, compared with one in eight, three years ago.

7
86%
93%
58%
80%
78%
88%
58%
62%
45%
42%
US
UK
Germany
India
China
2017 2014
Figure 2: Positivity about the future varies by economy Q – When you think about the future world of work as it is likely to affect you, how do you feel?
Sample: All those who are not retired (2017: 8,459, 2014: 8,095)
32%of those educated to school leaver level are worried about their future work prospects.
13%of university graduates are worried about their future work prospects.
Those with fewer years of formal education are more worried
One in three of those educated to school leaver level are worried about their future – considerably more than those who are university graduates (13%) or post-graduate educated (11%).
What does this mean for employers, governments and society? We think it means a real need to open up a genuine and fully-inclusive conversation about the future of work.

8 Workforce of the future: The views of 10,000 workers
Figure 3: Gen Z is less excited about the future than Millennials Q – When you think about the future world of work as it is likely to affect you, how do you feel? Those who responded ‘Excited’ or ‘Confident’.
Sample: All those who are not retired (Baby boomers: 1883, Gen X: 2331, Millennials: 3750, Gen Z: 443)
43%
48%
32%
22%
33%
34%
38%
38%Baby boomers (age 53 – 71)
Gen X (age 38 – 52)
Millennials (age 22 – 37)
Gen Z (Age 18-21)
Excited Confident
Is Gen Z more cautious?
Their longer experience of life is giving Baby boomers and Gen X more confidence but less excitement about the future than younger generations. More surprisingly, Millennials are more excited about the future and more confident than the younger Gen Z cohort. What’s making Gen Z more cautious about the world ahead?

9
65%12% 64%12%Global
40%21% 48%16%UK
42%24%48%18%Germany
89%4%88%7%India
76%6%72%8%China
2017 – Improve2017 – Impede 2014 – Improve2014 – Impede
59%13%73%11%US
Figure 4: Positivity about technology varies by economy Q – Do you think that technological developments will improve or impede your job prospects in the future?
73%believe that ‘Technology will never replace the human mind’.
82%agree that ‘Human skills will always be in demand’.
Sample: All those who are not retired (2017: 8,459, 2014: 8,095)
Differing narratives about the impact of technology around the world
Sixty-five percent of people believe that technology developments will improve their job prospects, with men bigger believers (70%). But there is a significant difference in confidence around the world.
People in the UK are far less sure that new technologies will improve their work prospects with 40% agreeing, 21% saying it will impede their prospects and a further 40% thinking it won’t impact at all.
Three-quarters of people – with a strong consensus around the world and across demographics – believe that ‘Technology will never replace the human mind’ in a work context. And eight in ten agree that ‘Human skills will always be in demand’.

Workforce of the future: The views of 10,000 workers10
Figure 5: UK relatively relaxed about the threat of jobs being automated Q – To what extent do you agree that ‘Automation is putting jobs at risk’?
Sample: All respondents (2017: 10,029)
25% 12%Global
UK 20% 8%
26% 16%US
Germany 23% 10%
25% 18%India
China 10%
Agree Strongly Agree
28%
Automated out of a job?
Back in 2014 just 33% of people were concerned about automation of jobs. Fast forward to 2017 and we see the global figure rise to 37% off the back of a sharp rise in concern in US (up from 31%), China (up from 28%) and India (up from 33%). In the UK people remain relatively relaxed with just 28% recognising the risk.

11
2 India says no to driverless cars to protect jobs, BBC News, July 2017 – http://www.bbc.co.uk/news/technology-40716296
Sample: Those who are not retired (2017: 8,459)
Figure 6: Support for intervention on jobs is stronger in India Q – To what extent do you agree that ‘governments should take any action needed to protect jobs from automation’?
4% 11% 35% 20%Global
UK5% 13% 33% 13%
5% 13% 30% 24%US
Germany6% 12% 34% 17%
3% 8% 38% 31%India
China10% 40% 16%
Strongly disagree
Disagree Agree StronglyAgree
3%
Should governments intervene?
Fifty-six percent believe that governments should take any action needed to protect jobs from automation. India in particular has strong support for an interventionist approach with 69% agreeing to government action. This is played out in recent statements by the Indian Transport minister who has indicated that the country will resist driverless vehicles in order to save jobs in the country². In the UK there is far weaker support with 46% supporting interventions.

Work: What do you value?Figure 7: Germany seeks job security, India wants to maximise incomes Q – Thinking about your career to date and your future career, which of the following are most important to you?
Sample: Those who are not retired (2017: 8,459)
32%
26%
42%
25%
23%
23%
22%
23%
28% 30%
20%
18%
29%
25%
34%
15%
24%
24% 18%
US
UK
30% 24%22% 23%Global
Germany
India
China
Job security and long term service with an organisation
Doing a job that makes a difference
To be in control of my work, what I do and when I do it
Taking every opportunity to maximise my income
20%
Job security is important – but so is everything else
Globally, job security and long term service are the most important to people, with 30% valuing that over anything else. But nearly a quarter also valued flexibility and being in control of the work they do and when.
Job security ranks top in Germany with 42% picking that as most important and just 15% saying it’s all about the money. Thirty-four percent of people in India do believe it’s about taking every opportunity to maximise their income with just 18% saying it’s about doing a job that makes a difference (the bottom choice).
32%
26%
42%
25%
23%
23%
22%
23%
28% 30%
20%
18%
29%
25%
34%
15%
24%
24% 18%
US
UK
30% 24%22% 23%Global
Germany
India
China
Job security and long term service with an organisation
Doing a job that makes a difference
To be in control of my work, what I do and when I do it
Taking every opportunity to maximise my income
20%
Workforce of the future: The views of 10,000 workers12

84%
82%
60%
68%
82%
75%
64%
53%
51%45%
US
UK
Germany
India
China
68%
76%
70%
59%
67%
67%
60%
70%65%
Baby boomers (age 53 – 71)
Global
Gen X (age 38 – 52)
Millennials (age 22 – 37)
Gen Z (Age 18-21)
2017 2014
84%
82%
60%
68%
82%
75%
64%
53%
51%45%
US
UK
Germany
India
China
68%
76%
70%
59%
67%
67%
60%
70%65%
Baby boomers (age 53 – 71)
Global
Gen X (age 38 – 52)
Millennials (age 22 – 37)
Gen Z (Age 18-21)
2017 2014
Figure 8: Societal impact of employers increasingly important across the board Q – To what extent do you agree that ‘I want to work for an organisation with a powerful social conscience’? Those who said ‘agree’ or ‘strongly agree’.
Sample: All those who are not retired (2017: 8,459, 2014: 8,095)
Employers need to think about their societal impact
Seventy percent of people globally say they want to work for an organisation with a ‘powerful social conscience’ – up from 65% in 2014. With a very strong level of agreement in the growth economies of China (84%) and India (82%). And 68% of people from the US also agreeing that employers should demonstrate their societal credentials – well above the responses from the UK (51%) and Germany (60% – down from 64% in 2014). Interestingly more men (72%) than women (68%) agreed.
13

60%think ‘Few people will have stable, long‑term employment in the future’
Imagining different structures of employment
When it comes to relationships between workers and employers, 60% of people globally agree that ‘Few people will have stable, long-term employment in the future’. In India, 69% agreed with the statement but only 49% in the UK believe in that future.
Will traditional employment be around in the future or will it be gone and we all have our own personal ‘brands’ and sell our skills to those who need them? Forty-seven percent of people agreed that we’ll be free agents in the future – up from 39% in 2014. A majority of men (51%) agreed with this but just 44% of women. There were also distinct differences between the countries we surveyed with India the most comfortable (66%) and the UK distinctly uncomfortable with the idea (28%).
Figure 9: India believes we’ll be free agents – the UK doesn’t agree Q – To what extent do you agree that ‘Traditional employment won’t be around in the future – we will all have our own personal ‘brands’ and sell our skills to those who need them’. Those who ‘agree’ or ‘strongly agree’
Sample: All those who are not retired (2017: 8,459, 2014: 8,095)
66%
32%
46%
28%
56%
24%
32%
25%
47%39%
59%
53%
US
UK
Global
Germany
India
China
2017 2014
Workforce of the future: The views of 10,000 workers14

Sample: All those who are not retired (2017: 8,459, 2014: 8,095)
Figure 10: The US and Millennials much happier to share their data Q – To what extent do you agree that ‘I am happy for my employer to have access to my personal data (eg my social media profiles, etc)’? Those who ‘agree’ or ‘strongly agree’.
37%
23%
46%
18%
52%
42%
24%
Gen X (age 38 – 52)
32%
47%Millennials (age 22 – 37)
Gen Z (Age 18-21)
32%
40%
34%
Global
UK
US
Germany
India
China
Baby boomers (age 53 – 71)
Male
Female
2017 2014
31%
22%
29%
14%
46%
39%
22%
32%
36%
34%
27%
Trading-off liberties for employment
When it comes to personal data more than a third of people (37%) are willing to give their employer access to their personal data including social media profiles. This is up from 31% in 2014 and we see that men (40%) are more willing to give up their privacy than women – 40% of women would be unhappy to share their data. However both sexes are now more willing to do so than three years ago.
Societally, India (52%) and US (46%) are more willing to give up their data – contrasted with Germany where 56% say they would not be happy. Perhaps surprisingly, Gen Z workers are less comfortable giving access to their personal data than Millennials.
15

Figure 11: Nine out of ten Chinese workers are happy to enhance their performance Q – Would you consider treatments to enhance your brain and body (eg drugs that improve concentration/combat fatigue) if this could improve employment prospects in the future? Those that would consider it.
70%62%
Global
UK51%55%
73%64%
US
Germany
63%48%
72%68%
India
China
87%73%
54%50%
Baby boomers (age 53 – 71)
Gen X (age 38 – 52)
68%67%
79%68%
Millennials (age 22 – 37)
Gen Z (Age 18-21)
Male
Female
69%
73%68%
66%57%
2017 2014 Sample: All those who are not retired (2017: 8,459, 2014: 8,095)
Willing to enhance body and mind to find better employment
We asked people in our survey if they would consider ‘Treatments to enhance their brain and body if this could improve employment prospects’ – for instance, drugs that improve concentration or combat fatigue. Seventy percent globally said they would – up from 62% in 2014. Millennials (79%) and respondents from China (87%) and India (72%) were most willing.
16 Workforce of the future: The views of 10,000 workers
70%62%
Global
UK51%55%
73%64%
US
Germany
63%48%
72%68%
India
China
87%73%
54%50%
Baby boomers (age 53 – 71)
Gen X (age 38 – 52)
68%67%
79%68%
Millennials (age 22 – 37)
Gen Z (Age 18-21)
Male
Female
69%
73%68%
66%57%
2017 2014

Sample: All those who are not retired (2017: 8,459)
Figure 12: India very confident about longevity of skills Q – To what extent do you agree that ‘I have all the skills I need for the rest of my career’? Those who ‘agree’ or ‘strongly agree’
0 10 20 30 40 50 60 70 80
Global
UK
US
Germany
54%
35%
60%
45%
India
67%
China
59%
Optimistic, or over-optimistic, about the skills they have?
Fifty-four percent of people feel they have all the skills they need for the rest of their career although men are significantly more confident in their skills (58%) compared to women (49%). Fewer people in the UK (35%) think they have the skills they need for their career. Interestingly Gen X respondents (49%) ranked their skills less complete than Millennials (56%).
So what do people mean by this assessment? Surely no worker with more than a few years left in the workforce could truly believe there’s nothing more to learn? Optimistically we hope workers mean they have a broad range of skills and the ability to learn and adapt.
17
Confidence in skills?

Workforce of the future: The views of 10,000 workers18
Figure 13: UK out of step with other nations’ expectations that workers should build their own skills Q – To what extent do you agree that ‘It’s my own responsibility to update my skills rather than relying on an employer’? Those who ‘agree’ or ‘strongly agree’
Sample: All those who are not retired (2017: 8,459)
0 20 40 60 80 100
Global
UK
US
Germany
74%
56%
79%
69%
India88%
China75%
Whose responsibility is it to build employee skills?
Seventy-four percent of people globally agreed it is their own responsibility to update their skills rather than relying on an employer. But only 56% of UK workers agree it’s up to them. Are UK workers too expectant that paternalistic employer-based learning will be provided if they need it?
19
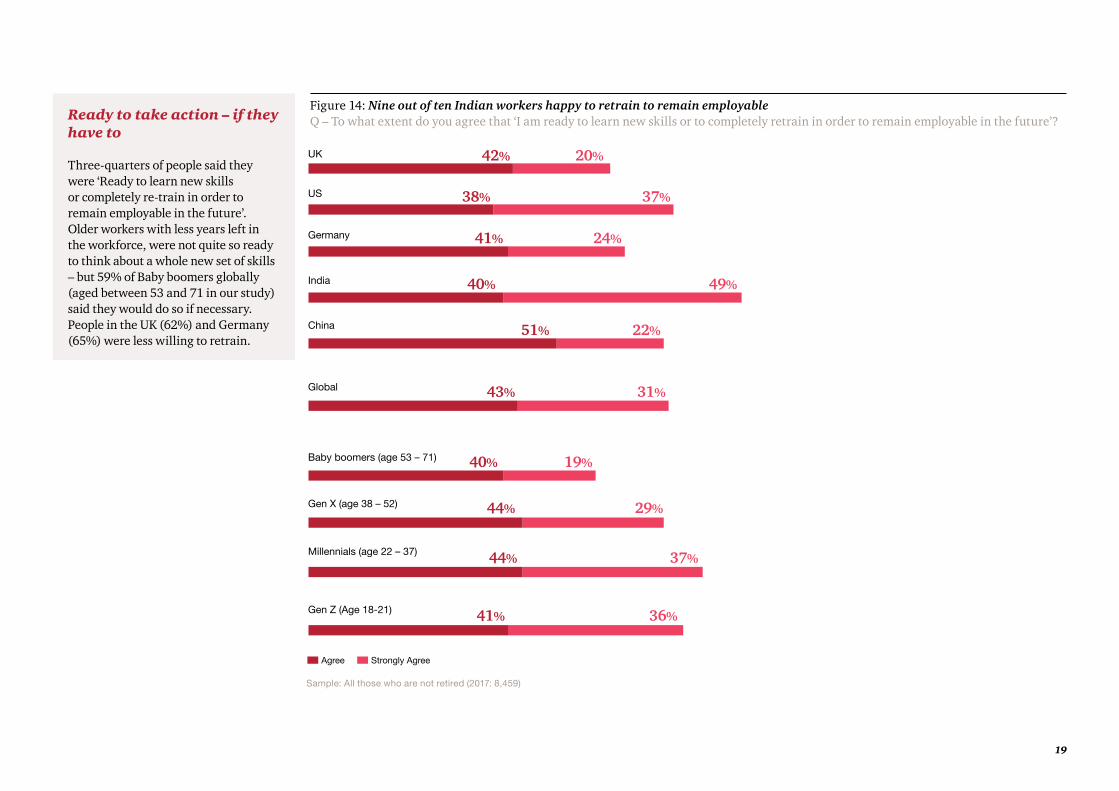
Figure 14: Nine out of ten Indian workers happy to retrain to remain employable Q – To what extent do you agree that ‘I am ready to learn new skills or to completely retrain in order to remain employable in the future’?
Sample: All those who are not retired (2017: 8,459)
42% 20%UK
US 38% 37%
41% 24%
40% 49%
51% 22%
43% 31%
40% 19%
44% 29%
44% 37%
41% 36%
Germany
India
China
Global
Baby boomers (age 53 – 71)
Gen X (age 38 – 52)
Millennials (age 22 – 37)
Gen Z (Age 18-21)
Agree Strongly Agree
Ready to take action – if they have to
Three-quarters of people said they were ‘Ready to learn new skills or completely re-train in order to remain employable in the future’. Older workers with less years left in the workforce, were not quite so ready to think about a whole new set of skills – but 59% of Baby boomers globally (aged between 53 and 71 in our study) said they would do so if necessary. People in the UK (62%) and Germany (65%) were less willing to retrain.

Workforce of the future: The views of 10,000 workers20
Figure 15: Adaptability, Problem-solving and Collaboration are most frequently held skills Q – To what extent do you agree you have the following skills and attributes?
Sample: All respondents (2017: 10,029)
52% 34%Adaptability
Problem solving 53% 32%
46% 28%Creativity and innovation
STEM skills 19%34%
Risk management skills
Leadership skills
41%
43%
19%
Digital skills
Emotional intelligence
26%
47% 22%
48% 28%
50% 31%
Agree Strongly Agree
Collaboration skills
Soft skills rule
Three-quarters or more of people around the world are happy to say they have soft skills with adaptability, problem-solving, creativity and innovation, and collaboration skills scoring highest.
This seems to be good news as these skills will be in high demand as humans work alongside technology, including automation and AI, in the future. But are people really as readily adaptable as they claim?

21
Figure 16: UK has a lower level of confidence in skills – India is very confident Q – To what extent do you agree you have the following skills and attributes? Those who ‘agree’ or ‘strongly agree’
Global UK US Germany India China
Adaptability
86% 81% 87% 84% 88% 88%
Problem solving 85% 83% 88% 78%
91%86%
Creativity and innovation 74% 59% 77% 73% 88%
72%
STEM skills53% 33% 55% 44%
74%59%
Risk management skills
60% 46% 65% 47%77%
62%
Leadership skills 69% 60%
79%57%
84%66%
Digital skills69% 61% 68% 63%
83%68%
Emotional intelligence 76% 74% 84%
75% 78% 70%
Collaboration skills 81% 69% 81% 87%
82% 87%
>5% above global average >5% below global average
Sample: All respondents (2017: 10,029)
UK: Lacking confidence in skills?
Just 33% of people in the UK believe they have STEM skills (Science, Technology, Engineering and Maths) – far lower than the global average of 53%. The UK also ranks bottom for digital skills, risk management skills and, perhaps surprisingly, creativity and innovation. Across the board people from India and China have a high level of confidence in their own skills.

Workforce of the future: The views of 10,000 workers22
Figure 17: Soft skills are in demand – and CEOs say they’re hard to find Q – In addition to technical business expertise, how important are the following skills to your organisation? Q – How difficult, if at all, is it for your organisation to recruit people with these skills or characteristics?
80
60
40
2030 60
% a
gre
eing
ski
ll is
ver
y im
po
rtan
t
Problem-solving
Adaptability
CollaborationLeadership
Risk Management
Digital skills
STEM skills
90
Creativity and innovation
Emotional intelligence
Today’s skills battleground
Source: PwC’s 20th CEO survey, January 2017 (1,379 CEOs)
CEOs are looking for soft skills
In our 20th CEO survey we also asked about skills – which skills were important and which were hard to find3. Soft skills were in high demand: problem-solving, creativity and innovation, leadership and adaptability were identified as today’s skills battleground. CEOs should be heartened to find that these high demand skills are the very skills that rank top in our poll. The only wrinkle might just be if CEOs and workers are not talking about the same level of competence.
% agreeing skill is difficult to find
3 http://www.pwc.com/talenchallenge (2017)

23
46%of women think they have entrepreneurial ability.
54%of men think they have entrepreneurial ability.
Are we entrepreneurs?
Half of people surveyed agreed they have entrepreneurial ability – but we see a real difference in confidence across the world. Seventy-five percent of people in India believe they have the ability to create and build businesses. In the UK there is much lower confidence with just 29% agreeing, although 36% say they would be willing to take a chance and set up their own business. Fifty-two percent globally say this.
Figure 18: Hope over experience? More people in UK and US would set up a business than say they have the skills to run one. Q – To what extent do you agree you have the following skills and attributes? Entrepreneurial abilities. Q – To what extent do you agree that ‘I would take a chance and set up my own businesses? Those who ‘agree’ or ‘strongly agree’
Sample: All respondents (2017: 10,029)
50%
52%
UK
Global
US
29%
36%
58%
62%
34%
34%
75%
73%
54%
52%
Germany
India
China
I have entrepreneurial skills I would take a chance and set up my own business
Workforce of the future: The views of 10,000 workers24
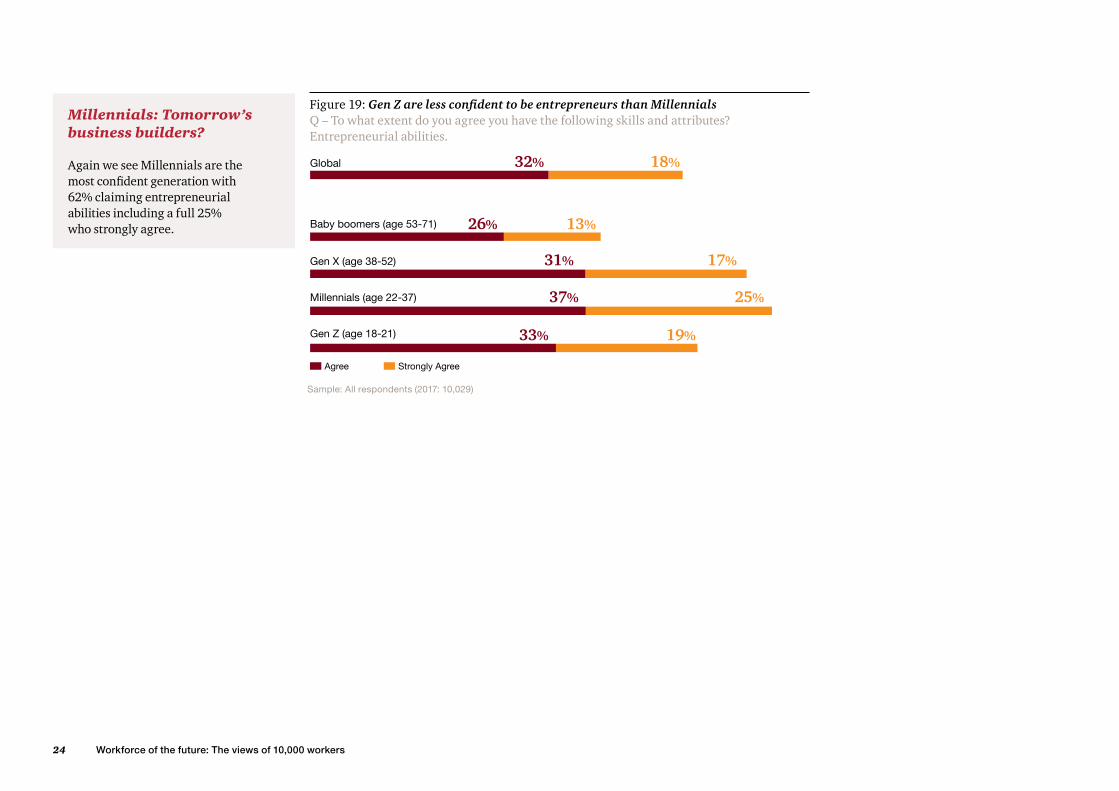
Millennials: Tomorrow’s business builders?
Again we see Millennials are the most confident generation with 62% claiming entrepreneurial abilities including a full 25% who strongly agree.
Sample: All respondents (2017: 10,029)
Figure 19: Gen Z are less confident to be entrepreneurs than Millennials Q – To what extent do you agree you have the following skills and attributes? Entrepreneurial abilities.
32% 18%Global
Baby boomers (age 53-71) 26% 13%
31% 17%Gen X (age 38-52)
Millennials (age 22-37) 37% 25%
33% 19%Gen Z (age 18-21)
Agree Strongly Agree

25
66%
55%
83%
75%
63%
52%
85%
84%
66%
66%
Men Women
UK
US
Germany
India
China
Sample: All respondents (2017: 10,029)
Figure 20: Fast growth economies show more equality in leadership skills. Q – To what extent do you agree that you have the following skills? Leadership skills. Those who ‘agree’ or ‘strongly agree’
72%of men think they have ‘emotional intelligence’.
80%of women think they have ‘emotional intelligence’.
Leaders for today and tomorrow
Sixty-nine percent of people surveyed think they have leadership skills. In line with gender stereotypes, more men (73%) say they would make good leaders than women (66%) – but there is a bigger difference in the numbers between genders in the UK, US and Germany. In India and China the sexes rank their leadership skills equally – but the population in India is again much more confident of their skills.
But what makes good leaders? The sexes reverse when it comes to a question of emotional intelligence with 80% of women saying they have this attribute against 72% of men.

Workforce of the future: The views of 10,000 workers26
Sample: All respondents (2017: 10,029)
Figure 21: Millennials and India most confident in digital and STEM. Q – To what extent do you agree that you have the following skills? Digital and STEM skills. Those who ‘agree’ or ‘strongly agree’
UK 61%33%
US
53%68%
Germany
44%63%
India
74%83%
59%
China68%
53%
Global69%
41%
Baby boomers (age 53 – 71) 59%
51%
Gen X (age 38 – 52) 69%
65%
Millennials (age 22 – 37) 78%
60%
Gen Z (Age 18-21) 73%
Digital Skills STEM skills
62%of men say they have STEM skills.
44%of women say they have STEM skills.
Digital and STEM skills?
Seven in ten respondents agree they have digital skills – though Millennial respondents (aged 22 to 37) are more likely to agree than our youngest age band, Gen Z (aged 18-21). In India 83% of people agree with the UK lagging the pack on 61%.
When we look at STEM skills we see a similar pattern with Millennials (65%) and India (74%) most confident, with the UK (33%) and women (44%) lacking confidence.

2727

Workforce of the future: The views of 10,000 workers28
ConclusionA deeper dive into the survey findings identifies some interesting trends and differences between countries and demographic groups in people’s attitudes to the future of work and how it will impact them.
PwC highlight some issues which will be of concern to governments. Notably a lack of confidence in skills in some countries and a clear need for an inclusive conversation about jobs to include all educational levels. But also some reasons to be cheerful. Three-quarters of people surveyed are positive about the future and have confidence in their soft skills. These are the skills that businesses will need in the future as human work becomes more collaborative with artificial intelligence.
PwC expands more on what work might look like in 2030 in our report ‘Workforce of the future: The competing forces shaping 2030’ and makes some recommendations for action around jobs and employment relevant to individuals, societies and employers.
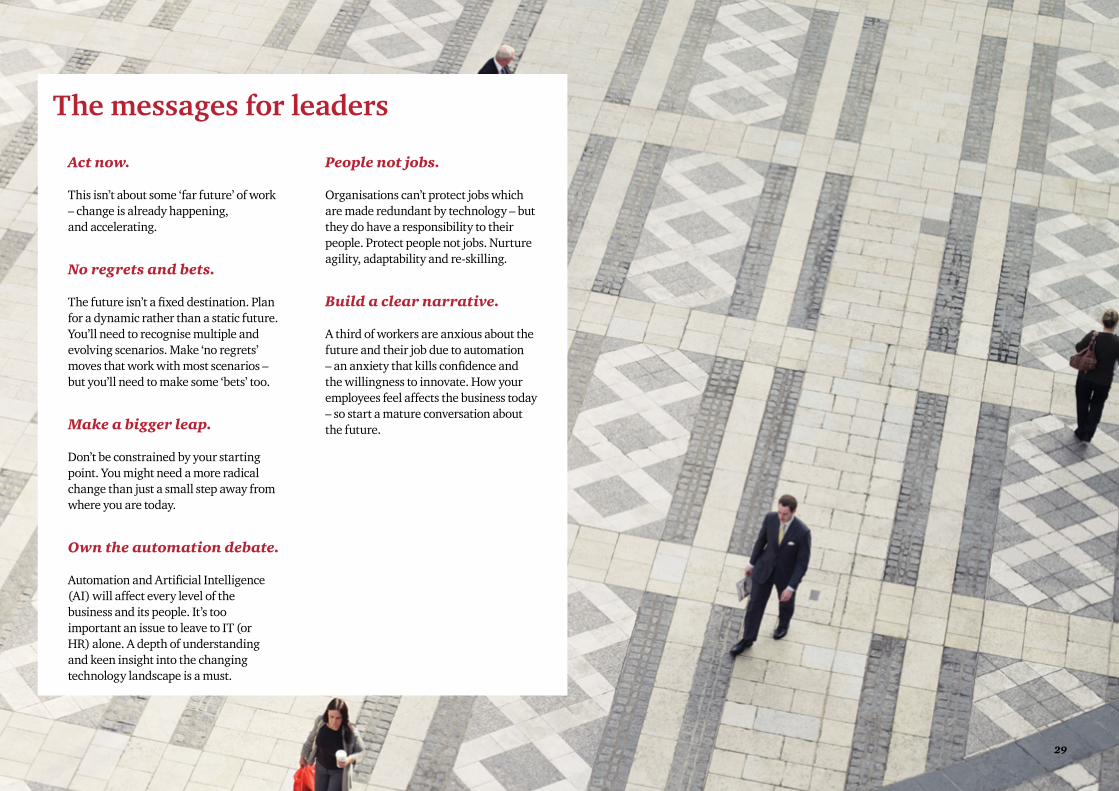
2429
Act now.
This isn’t about some ‘far future’ of work – change is already happening, and accelerating.
People not jobs.
Organisations can’t protect jobs which are made redundant by technology – but they do have a responsibility to their people. Protect people not jobs. Nurture agility, adaptability and re-skilling.
No regrets and bets.
The future isn’t a fixed destination. Plan for a dynamic rather than a static future. You’ll need to recognise multiple and evolving scenarios. Make ‘no regrets’ moves that work with most scenarios – but you’ll need to make some ‘bets’ too.
Build a clear narrative.
A third of workers are anxious about the future and their job due to automation – an anxiety that kills confidence and the willingness to innovate. How your employees feel affects the business today – so start a mature conversation about the future.Make a bigger leap.
Don’t be constrained by your starting point. You might need a more radical change than just a small step away from where you are today.
Own the automation debate.
Automation and Artificial Intelligence (AI) will affect every level of the business and its people. It’s too important an issue to leave to IT (or HR) alone. A depth of understanding and keen insight into the changing technology landscape is a must.
The messages for leaders

Workforce of the future: The views of 10,000 workers30
Education levelJob status
100
50%Female
50%Male
Gender Generation*
100
4%
24%
38%
4%
31%Traditionalists
Baby Boomers
Gen X
Millennials
Gen Z
100
19%
15%
20%
7% 2%
37%
Educatedto schoolleaver level
Universitygraduate
Post graduatequalifications
Professionalqualifications
Technicalqualifications
None of these
100
49%9%4%
16%
1%4% 4%
14%
In permanentemployment
Self-employed/businessowner
Student
Employed on a contract ortemporarybasis
Retired
Voluntary worker, unpaid
Unemployed
Other* Generations for this study are identified as:
Gen Z: born in 1996 and after (age 18 – 21) Millennials: born 1980–1995 (age 22 – 37) Gen X: born 1965 – 1979 (age 38 – 52) Baby boomers: born 1946 – 1964 (age 53 – 71) Traditionalists: born 1945 and before (age 72 and over)
About the surveyIn May 2017, PwC commissioned a survey of 10,029 members of the general public (with just over 2,000 surveyed in each of China, India, Germany, the UK and the US). Respondents included workers, retired people, unemployed and students in each country.

Carol StubbingsJoint Global Leader, People and Organisation+44 20 7804 [email protected]
Jon WilliamsJoint Global Leader,People and Organisation+61 (2) 8266 [email protected]
Justine BrownDirector,Future of Workresearch programmeGlobal People and Organisation+44 113 289 [email protected]
US
Jeff Hesse+1 312 298 [email protected]
Scott Olsen+1 646 471 [email protected]
Bhushan Sethi+1 646 471 [email protected]
UK
Alex Wilson+44 20 7213 [email protected]
Peter Brown+44 20 7804 [email protected]
Germany
Henk van Cappelle+31 88 794 65 [email protected]
Till Lohmann+49 40 [email protected]
China
Johnny Yu+86 (10) 6533 [email protected]
India
Padmaja Alaganandan+91 80 4079 [email protected]
Contacts
31

www.pwc.com/peopleAt PwC, our purpose is to build trust in society and solve important problems. We’re a network of firms in 157 countries with more than 223,000 people who are committed to delivering quality in assurance, advisory and tax services. Find out more and tell us what matters to you by visiting us at www.pwc.com.
This publication has been prepared for general guidance on matters of interest only, and does not constitute professional advice. You should not act upon the information contained in this publication without obtaining specific professional advice. No representation or warranty (express or implied) is given as to the accuracy or completeness of the information contained in this publication, and, to the extent permitted by law, PwC does not accept or assume any liability, responsibility or duty of care for any consequences of you or anyone else acting, or refraining to act, in reliance on the information contained in this publication or for any decision based on it.
© 2017 PwC. All rights reserved. “PwC” refers to the PwC network and/or one or more of its member firms, each of which is a separate legal entity. Please see www.pwc.com/structure for further details.
Design Services 30900 (09/17).