working paper: providing information, avoiding...
TRANSCRIPT

Working Paper:
Providing Information, Avoiding Distortions: Challenges for the Postsecondary Information
Rating SystemSarah Turner1
1University of Virginia
Updated January 2014
EdPolicyWorks University of Virginia
PO Box 400879 Charlottesville, VA 22904
EdPolicyWorks working papers are available for comment and discussion only. They have not been peer-reviewed. Do not cite or quote without author permission. Working paper retrieved from:
http://curry.virginia.edu/uploads/resourceLibrary/21_Turner_Chall_Info_Rating_System.pdf Acknowledgements: : Zach Sullivan and Rafeh Qureshi have provided excellent research assistance. In addition, I have benefitted from constructive exchanges with Paul Courant, Michael McPherson, Sandy Baum, William Bowen, and Rick Hess.
EdPolicyWorks Working Paper Series No. 21. January 2014.Available at http://curry.virginia.edu/edpolicyworks/wp
Curry School of Education | Frank Batten School of Leadership and Public Policy | University of Virginia
EdPolicyWorks
Working Paper © 2014 Rector and Visitors of the University of Virginia. For more information please visit www.curry.virginia.edu/edpolicyworks or contact [email protected]

Turner – Challenges for Info Rating Systems
EdPolicyWorks Working Paper Series No. 21. January 2014. Available at http://curry.virginia.edu/edpolicyworks/wp
Curry School of Education | Frank Batten School of Leadership and Public Policy | University of Virginia
1
PROVIDING INFORMATION, AVOIDING DISTORTIONS: CHALLENGES FOR THE
POSTSECONDARY INFORMATION RATING SYSTEM
Sarah Turner
Choosing a college is a substantial investment for individual students and their families,
while federal and state governments also pay a substantial share of the direct costs. In 2012-13,
the federal government spent about $32.2 billion on direct student aid through the Pell Grant
Program along with about $1.2 billion on TRIO programs and other initiatives designed to
improve college access. States spent an additional $9.7 billion on student aid, in addition to
appropriations of over $72 billion.1 Still, the payoff to collegiate attainment is very large: on an
annual basis, college graduates earn 98% more than those with a high school degree and 56%
more than those with some college, with yet larger premiums for advanced degree recipients
(Julian and Kominski, 2011). But, attending college does not provide a guaranteed return and
there is increasing concern that poorly informed decisions at the point of college entry may
contribute to quite negative collegiate outcomes, with students buried in debt with poor
employment prospects while taxpayers foot the bill for student aid.
There is ample evidence that many students --– particularly those from low-income
families – are often not well-informed about the costs and benefits of different collegiate options,
as well as the tradeoffs among different sources of college financing including loans and
employment.2 In turn, it follows from elementary economics that the higher education market
will be more efficient, with students selecting those institutions that provide the highest returns,
when consumers (students) use high quality information to inform their choices.
Unfortunately, the framework and timing of the Postsecondary Information Rating
System (PIRS)3 is such that it is likely to do more harm than good. In the near term, the PIRS
lacks the methodological and empirical bases to provide high quality information. Thus, rapid
implementation on the proposed time frame will likely generate serious distortions in the market
1 See Trends in Student Aid and Trends in College Pricing. Total state appropriations reflect a five-year
decline from of 19% from $88.7 billion in 2007-08. 2 Avery and Turner (2010) and Hoxby and Turner (2013) find that students from low-income families may
be unaware of the full availability of financial aid and note that such information deficits may impede efficient college choice.
3 See Federal Register announcement http://www.gpo.gov/fdsys/pkg/FR-2013-12-17/pdf/2013-30011.pdf

Turner – Challenges for Info Rating Systems
EdPolicyWorks Working Paper Series No. 21. January 2014. Available at http://curry.virginia.edu/edpolicyworks/wp
Curry School of Education | Frank Batten School of Leadership and Public Policy | University of Virginia
2
for higher education. While the federal government, particularly in combination with states and
institutions, does have the capacity to provide data to help students make better-informed
choices, some of these resources are not presently available to either researchers or the architects
of the PIRS. For example, administrative data maintained in the Federal Student Aid office
could be used to chart the distribution of students by family income and the level of student loans
these students incur. Most seriously, there will be powerful incentives for institutions to
manipulate the data that drive the rating system, leading to outcomes that will harm the intended
beneficiaries.
In these remarks, I want to begin with a general discussion of the design challenges
associated with “ratings systems” for higher education. There are clear “lessons” to be learned
from existing metrics in K-12, other arenas such as health care, and third party metrics in higher
education that should not be lost in the planning of the PIRS. Then, I want to turn to the
discussion of two particular features of the proposed ratings: 1) measurement of access and
affordability and 2) measurement of “value added” and post-collegiate outcomes.
The overriding theme of my comments is the need to avoid sacrificing validity for
expediency. Given the stated goal of the development of a ratings system by 2015-16 and
utilization for resource allocation by 2018, such a tradeoff is inevitable. The costs are twofold.
First, a poorly designed system will lead to distortions as institutions are able to manipulate
indicators while potentially causing harm to those “misled” by poor measures. Secondly, the
immediate introduction of a flawed performance ratings system will likely “poison the water” for
efforts that could conceivably follow with more careful study and the availability of better data.
Therefore, it is imperative to take more time and to bring the best social science methods and the
full power of administrative data to the measurement of costs and quality in higher education.
Ratings and Accountability: Objectives and General Problems
More than a decade of experience with accountability systems in K-12,4 other sectors like
health care, and existing rating in higher education should inform the proposed design of the
4 Indeed, as one education policy expert noted, the challenge of designing a rating system for higher
education is far more complicated than in K-12 because there much more mission heterogeneity in higher education than K-12, the prospects for judging value-added using assessment tools are limited, and – at many universities – it is very difficult to distinguish resources that affect research from those that affect instruction.

Turner – Challenges for Info Rating Systems
EdPolicyWorks Working Paper Series No. 21. January 2014. Available at http://curry.virginia.edu/edpolicyworks/wp
Curry School of Education | Frank Batten School of Leadership and Public Policy | University of Virginia
3
Postsecondary Information Rating System (PIRS). Not only does the extraordinary diversity of
post-secondary programs inform design, but so too does the need to recognize the distinct
objectives which range from providing information to informing individual decision making to
the regulatory dimension of preventing the expenditure of public resources on institutions with
unambiguously poor performance.
1. Multi-dimensional experience: One substantial challenge for the approach of the proposed
PIRS is the desire to oversimplify the multi-dimensional information about the performance of
colleges and universities by producing a single measure.5 Collegiate experiences are
differentiated along a number of dimensions and the quality of the experience depends critically
on an individual’s characteristics, tastes and objectives. A student who might be successful in an
advanced language program might well struggle in an accounting program; a student thriving at a
liberal arts college might well dislike a research university (or the reverse) even as the academic
programs are equally “rigorous” by observed standards. As an example, note that even when
Consumer Reports provides ratings for less complicated goods like headphones, televisions or
vacuum cleaners they distinguish different aspects of the product so that consumers who care
about attribute X rather than Y can easily form their own ratings.6
Self-selection is a powerful tool that improves efficiency in the market for higher
education. Index-based ratings systems inherently assign arbitrary weights to different collegiate
characteristics, when individuals may differ markedly in the importance they place on any
attribute. Thus, the fundamental challenge in information provision is to provide salient, high
quality information but to avoid dictating values and preferences, which people should determine
for themselves.
2. Manipulation and Gaming: There is already substantial evidence on the books that ratings
of educational institutions are subject to manipulation, often generating strong adverse
consequences. A widely-referenced concern associated with ratings and accountability systems
5 See, for example, Query 2.1 “What empirical methods for weighting, scoring, or otherwise reducing a large and complex amount of information into a single dimension or set of dimensions should be used?”
6 I thank Sandy Baum for suggesting this example.

Turner – Challenges for Info Rating Systems
EdPolicyWorks Working Paper Series No. 21. January 2014. Available at http://curry.virginia.edu/edpolicyworks/wp
Curry School of Education | Frank Batten School of Leadership and Public Policy | University of Virginia
4
is the Holmstrom and Milgrom (1981) result that institutions (or individuals) may be able to
improve measured performance while sacrificing other outcomes that are unobserved though part
of “true productivity.” In effect, unless the measures of a ratings system are well-measured and
perfectly aligned with the underlying outcome of interest it is likely that manipulation and
gaming will result.
Examples both from K-12 and in response to third-party ranking systems such as U.S.
News and World Report make this problem eminently clear. For example, there is evidence that
one response to accountability pressures in K-12 was to reclassify students likely to be low-
performing and those with learning disabilities (Cullen and Reback, 2006; Figlio and Getzler,
2007).7 In addition, researchers have identified a wide array of other strategic behaviors in
response to accountability pressure including changing discipline and suspension patterns (Figlio
2006), manipulation of student caloric intake (Figlio and Winicki, 2005), and so forth.
In the context of higher education, there has been widespread documentation of
behavioral responses (and outright fraud in reporting)8 to manipulate the “inputs” to the U.S.
News rankings. Avery, Fairbanks and Zeckauser (2003) show that the high yield among
students admitted early decision provides one incentive for institutions to shift to these students.
In addition, institutions may strategically reject students who are unlikely to come while
encouraging applications among those unlikely to be admitted to boost measured selectivity.
3. High-Quality Information is Necessary but Not Sufficient: Providing volumes and volumes
of undigested information (even if it is searchable!) in the public domain is insufficient to
guarantee that individuals will use it. For example, in the arena of K-12 school choice, Hastings,
Kane and Staiger (2006) and Hastings and Weinstein (2008) demonstrate that lower income
families face higher costs of gathering and interpreting data that distinguishes the performance of
7 For post-secondary education, the analogous concern is that institutions might choose not to admit
students who were “college ready” but did not enhance the institution’s rating in terms of characteristics such as entering scores. Note that a ratings system that penalized institutions for enrolling students who were unlikely to complete their intended course of study might be efficient if the affected students did not have an expected positive rate of return to attending college.
8 There is an increasingly long list of institutions that have misreported information to U.S. News. A 2012 article in Inside Higher Education noted that George Washington University, Claremont McKenna and Emory had reported incorrect information on high school rank for a number of years. In addition, it was acknowledged in the fall of 2013 that George Washington University reported that it was “need blind” when, in fact, it was need-aware.

Turner – Challenges for Info Rating Systems
EdPolicyWorks Working Paper Series No. 21. January 2014. Available at http://curry.virginia.edu/edpolicyworks/wp
Curry School of Education | Frank Batten School of Leadership and Public Policy | University of Virginia
5
local schools. Carefully synthesized information presentations can improve choices and,
ultimately, student achievement. In the realm of healthcare coverage, Kling et al (2012) show
how comparison friction, effectively the gap between the availability of comparative information
and consumers’ use of it, may reduce choice in the market for Medicare Part D. Kling et al
(2012) found that presenting personalized information that framed costs and benefits generated
greater adjustments in plan selection and, in turn, substantial individual cost savings than the
alternative which simply directed individuals to a website. Finally, in the context of higher
education, Hoxby and Turner (2013) show that the provision of semi-customized information on
net cost and application strategies for high-achieving low-income students generated changes in
collegiate opportunities through a greater number of admission offers and increases in resources
at these schools. While these research results provide clear evidence of the potential impact of
presenting information about choices that is customized and salient, the actual mechanism and
delivery best suited to different collegiate audiences has not been developed or tested.
While this evidence, drawn in part from innovations in behavioral economics, does point
to a positive role for policy interventions in helping students to interpret data on colleges and
universities and to evaluate the costs and benefits of different college options, it does not imply a
single “rating” will be useful in helping students with different skills and aspirations to evaluate
post-secondary options.
“Access and Affordability”: Weak data, distortionary outcomes
Using currently available data,9 any rating system that the Department of Education were
to put into place would accomplish neither the objective of providing sound consumer
information nor the objective of providing well-aligned institutional incentives in an
accountability system. It is useful to illustrate these flaws in the context of the “examples” the
Department chose to put forward in its request for information. Identifying metrics related to
access, affordability and outcomes, the Request for Information (RFI) notes:
“The ratings will be based upon such measures as:
• Access, such as percentage of students receiving Pell grants;
9 Question 1.1 addresses the availability of data for either consumer information or accountability.

Turner – Challenges for Info Rating Systems
EdPolicyWorks Working Paper Series No. 21. January 2014. Available at http://curry.virginia.edu/edpolicyworks/wp
Curry School of Education | Frank Batten School of Leadership and Public Policy | University of Virginia
6
• Affordability, such as average cost of attendance, scholarships, and student loan
debt.”
While terms like “access” and “affordability” receive considerable usage in political
discussions, they are ill-defined as empirical concepts. A working definition of “access” would
consider whether low- and moderate-income students, as well as other underrepresented groups,
are represented in proportion to their supply at an institution. To define this measure for each
institution, it is important to know something about the relevant market of students – does the
institution attract students in a national market or a regional market? Similarly, does a college
have curricular offerings that are open to students from a wide range of achievement levels or
does the college provide a course of study best suited to students with high levels of achievement
in high school? Given that income levels differ dramatically across states and among regions
within states, it is not surprising that colleges may differ markedly in the representation of low-
income students. Institutions located near urban areas are likely to be feasible choices for low-
income adults balancing work (or family) and college, while academically similar institutions in
more remote locations are simply unlikely to be in the choice sets for many of these students.
Similarly, it is likely that some very selective institutions are very successful in attracting low-
income students in relation to the pool of well-matched students, even as the proportion of low-
income students in their entering classes is below the overall national norm.
“Affordability” provides a daunting set of empirical challenges because it can not be
quantified in a “single number” for each institution.10 It would be a much more direct statement
to simply ask: how does net price, defined as total cost of attendance less financial aid, change as
family resources increase? For this reason, measures like “Average Net Cost” defined over an
aggregate not only fail to provide net cost information to students who are different from the
“average” but confound very different policies. An institution successful in implementing a
“high aid, high tuition” strategy in which net college costs are very modest for low-income
students, might look very similar on “Average Net Cost” to an institution with a very flat tuition-
aid structure in which the net price was effectively cost-prohibitive for students from low-income
10 Affordability might be considered broadly aligned with a concept of “vertical equity”, considering
whether individuals face similar “burdens” as resources increase.

Turner – Challenges for Info Rating Systems
EdPolicyWorks Working Paper Series No. 21. January 2014. Available at http://curry.virginia.edu/edpolicyworks/wp
Curry School of Education | Frank Batten School of Leadership and Public Policy | University of Virginia
7
families.11 What is more, “Average Net Cost” metrics confound composition (how many low and
moderate income students are at an institution) and the net price at each income level. To
illustrate, if two schools have the same net price at each income level, but one school has fewer
affluent students, it will have a lower average net price and will look like a better deal. Perhaps
equally problematic is the issue that changes in “Average Net Cost” over time confound changes
in institutional pricing (both the sticker price and the level of aid) and changes in the composition
of students.12
Unfortunately, the currently available data provided to researchers and the public are
insufficient to measure “access” or “affordability”. Indeed, the measures suggested in the
Department’s RFI would not only fail to provide needed information, but would mislead
consumers and introduce distortions in the context of an accountability system.
While likely well-intentioned, the use of the “Percentage of students receiving Pell
measure” is dangerous and irresponsible. This measure is deeply flawed as an indicator for
students and seriously distortionary when included in “accountability” measures.13 Tebbs and
Turner (2005) outline the problems with this measure as an indicator of the representation of low
income students. This type of measure of federal aid receipt does not address the question of
how effectively colleges facing similar market conditions enroll low-income students. Instead,
such measures often capture differences in program offerings (such as the presence of programs
targeted to older, independent students) or the demographic characteristics of the pool of
potential students (such as the relative number of well-qualified students from poor families in
11 While the IPEDS surveys do include measures of “net price” for income bins (0-$30k, $30-48k, $48k-85k, $75-100k, $110), these data are tabulated only for federal aid recipients. The result is that “taking away” aid from a student getting only a little aid will lead to a drop in reported net price within bins even as the aid received by individuals remains unchanged.
12 Perhaps the best illustration of this problem is found in the inspection of data on total tuition and average net price, which is easily accessed in the Trends in College Pricing reports. For public two year schools, we see the marked drop in average net tuition from $0 to - $1680 between 2007-08 and 2011-12 (with the measure for net tuition, room and board dropping similarly from $7700 to $5910) despite tuition increases of about 20% from $2570 to $3070. Two factors likely explain this shift: first, Pell grant generosity increased and, secondly, enrollment during the Great Recession increased disproportionately among low-income students, including the return of many Pell-eligible independent students to collegiate programs. Thus, the “average” does not provide the information needed to distinguish the compositional change from the price changes experienced by particular income groups. As a matter of full-disclosure, I have failed to make this point in some of my writings on trends in college costs.
13 It is common to appeal to the ready availability of this measure as a rationale for its widespread citation. Yet, it would be unfortunate to magnify the impact of this metric by giving recognition in federal ratings when the resources of institutions and the federal government should permit vastly improved metrics with fewer distortionary characteristics.

Turner – Challenges for Info Rating Systems
EdPolicyWorks Working Paper Series No. 21. January 2014. Available at http://curry.virginia.edu/edpolicyworks/wp
Curry School of Education | Frank Batten School of Leadership and Public Policy | University of Virginia
8
the state) rather than college-level policies positively affecting the enrollment of low-income
students. Put simply, “percentage Pell recipients” is a weak measure of institutional policies
designed to increase financial accessibility for low-income students given the vast institutional
differences in demographics, academic requirements, program types, international/adults
enrollments, and so forth. What is more, the use of this measure opens the door to gaming –
institutions face incentives to increase “Pell numbers” while reducing aid for students just above
the Pell eligibility threshold.
As attention to this measure has grown over the last decade, it is apparent that an
increasing number of institutions design policies that are sensitive to Pell grant eligibility.
Certainly, institutions would prefer not to “look bad” in ratings such as those produced by
Washington Monthly.14 Moreover, many institutions lack the institutional financial aid resources
to “smooth” aid above and below the Pell grant eligibility threshold. The result, then, is a sharp
discontinuity near the “Pell grant eligibility” threshold. 15 To illustrate, one set of estimates
from the University of Virginia’s net cost calculator show the net price rising from $5140 to
$10,335 as a student’s family income increased from $45,000 to $50,000, effectively leaving a
family with $50,000 in family income less to spend on other goods and services than a family
with $45,000! Similarly, at Virginia Commonwealth University, net price increases from $5235
to $11,835 as a representative student moves from $35,000 in family income to $40,000 (See
Figure 1). Neither efficiency nor equity are well-served when families in fairly similar
circumstances -- $45,000 versus $50,000 in family income – paying very different net prices.
From a policy perspective this “discontinuity” likely discourages enrollment and
attainment among a large mass of college-ready students from “near poor” or “working poor”
14 The Washington Monthly (http://www.washingtonmonthly.com/college_guide/toc_2013.php) rankings
prominently feature the percentage of students receiving Pell grants, with notes indicating “We have data from the federal Integrated Postsecondary Education Data System survey that tell us the percentage of a school’s students receiving Pell Grants, which is a good measure of a school’s commitment to educating lower-income students.” If institutions simply increased the number of Pell eligible student without reducing the number of students from other underrepresented groups, such dissemination operating effectively through moral suasion would be in the public interest.
15 Since a student’s Expected Family Contribution and Pell grant eligibility vary with family size, assets and so forth, there is no firm income cutoff for Pell grant eligibility in 2011-12 nearly 76% of dependent Pell grant recipients had family income less than $40,000 while 88% had family income less than $50,000 (see Trends in Student Aid, 2013). http://trends.collegeboard.org/student-aid/figures-tables/distribution-pell-grant-recipients-family-income-dependency-status-2011-12

Turner – Challenges for Info Rating Systems
EdPolicyWorks Working Paper Series No. 21. January 2014. Available at http://curry.virginia.edu/edpolicyworks/wp
Curry School of Education | Frank Batten School of Leadership and Public Policy | University of Virginia
9
families. From a purely self-interested perspective, one might think that politicians would be
particularly sensitive to this type of effect because the pool adversely affected includes many
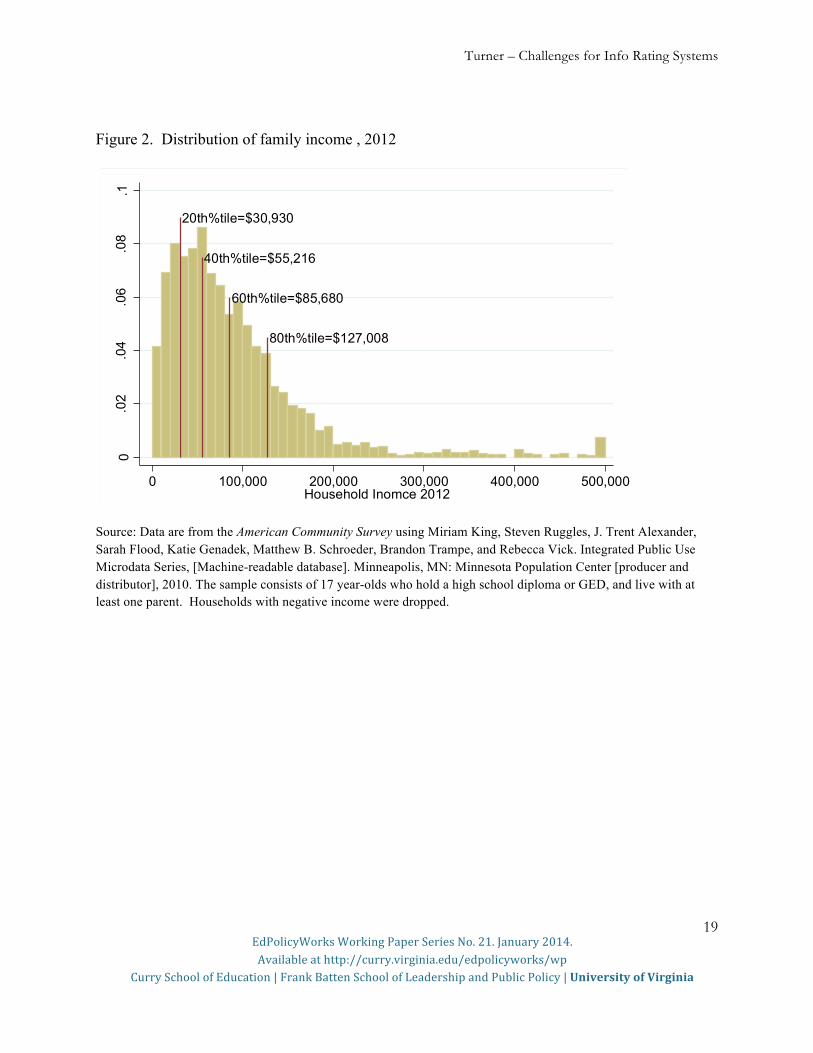
likely voters. Figure 2 shows the distribution of family income for college age students and it is
readily apparent that there are likely to be a large number of college-ready students between the
approximate end of Pell grant eligibility and the median of the family income distribution at
about $70,000. Given the correlation of college readiness and family income, it is likely that
there are a substantial number of college-ready students in the income range just above the range
where students are likely to receive the maximum Pell award16
While our analysis is not yet complete and available data from the Department of
Education are limited, there is some indication that this type of “discontinuity” has grown
markedly since the financial crisis as increased tuition at public universities has not been offset
by increased aid for those students who are far from affluent but outside the range of Pell grant
eligibility. The recent changes in the tuition structure at public universities suggest that the
capacity to finance college may pose an increasing challenge to students from “near poor” and
middle- income families, as these students may have been particularly impacted by increases in
public university tuition, which averaged 27% between 2008-09 and 2013-14 (Trends in College
Pricing, 2013). Students in states hit the hardest by the financial crisis such as Georgia and
Arizona likely saw yet larger increases in tuition (Barr and Turner, 2013). At many public
institutions with limited institutional financial aid budgets, increases in sticker price translate into
increases in net price dollar for dollar for students outside the Pell eligibility range. The result,
then, is that these students must either make extraordinary sacrifices including taking on
substantial loan burdens to attend four-year institutions full-time or they attend part-time, often at
community colleges, resulting in an extension of time to degree and reduction in the likelihood
of graduation. Back in 1980, higher education analyst Larry Gladieux defined the prospect of
the “middle income squeeze in higher education” as a circumstance in which “the rich can pay to
16 To provide one indicator, data from ACT indicate that only 20% of students from families with income
less than $36,000 are “college ready” relative to 36% for students in the $36,000-60,000 income range. As a back of the envelope calculation, even as the number of 17-year olds from families with less than $30,000 in family income is 20% greater than the number in the $36-60,000 family income bin, the number of students predicted to be “college ready” is 48% greater in the $36-$60,000 bin relative to the lowest income bin.http://www.act.org/newsroom/data/2012/states/pdf/LowIncomeStudents.pdf

Turner – Challenges for Info Rating Systems
EdPolicyWorks Working Paper Series No. 21. January 2014. Available at http://curry.virginia.edu/edpolicyworks/wp
Curry School of Education | Frank Batten School of Leadership and Public Policy | University of Virginia
10
go anywhere they want, the poor get a “free ride” and the middle-class is being squeezed out
(Gladieux, 1980).” This may be an increasingly apt description of the circumstance in 2014.
Beyond obfuscating the challenges faced by the near poor in financing college education,
inclusion of the “Percentage of students receiving Pell measure” in an accountability measure
may well lead to severe distortions in how institutions distribute financial aid and attract students
from different financial circumstances. One state (Tennessee)17 now provides explicit rewards
for degree recipients who are also Pell grant recipients, with such students multiplied by a factor
of 1.4 in the determination of institutional funding. While it is too early to evaluate this change,
enrollment data suggest that as the proportion of Pell eligible students has increased, enrollment
of “near poor” students just outside of this eligibility threshold may have actually decreased.
Indeed, it would be irresponsible to pursue this type of “accountability” metric in the federal
context without an evaluation of the Tennessee policy, as economic theory and common sense
would strongly suggest that a policy that provided sharply different resource allocations (40%!)
above and below the Pell grant eligibility threshold would likely disadvantage those students
who are “near poor”.
It is tempting to hope that other measures already collected in the IPEDS registry might
“solve” the need to measure both enrollment and net cost for different levels of family income.
Indeed, the IPEDS Student Financial Aid institutional surveys have several years of data on “net
price” and number of students among aid recipients for binned ranges like family income 0-
$30,000, $30,000-$48,000 among dependent students. Because these measures are averages over
fairly wide ranges it is quite likely that year-to-year variation within an institution in the net price
measure will reflect not only changes in the relative balance between financial aid and tuition,
but also a range of other factors including changes in student composition within these ranges
and changes in determinants of need beyond income (such as investments). Holding true net
prices the same, adding students who are near the top of the income ranges will move up net
price while adding students near the bottom of the income range will reduce net price. Figure 3,
which uses data from state flagship institutions, shows changes in net price for those in the less
17 The Complete College Tennessee Act (CCTA) of 2010 introduced outcomes-based funding and was
passed in January 2010 though the full provisions did not go into effect until 2012-13. See, for more detail http://thec.ppr.tn.gov/THECSIS/CompleteCollegeTN/PDF/Detailed%20Outcomes%20Formula%20Definitions%2010-23-12.pdf and http://www.csgwest.org/documents/AM2013HigherEdRichardRhodaPPP.pdf

Turner – Challenges for Info Rating Systems
EdPolicyWorks Working Paper Series No. 21. January 2014. Available at http://curry.virginia.edu/edpolicyworks/wp
Curry School of Education | Frank Batten School of Leadership and Public Policy | University of Virginia
11
than $30,000 income bracket for the 2009-2011 period in relation to the observed change in
sticker price. The presence of changes -- both positive and negative -- in net price that are far
greater than the change in sticker price suggests that these compositional changes may be
significant, leading to net price changes that do not accurately answer the question of how
college costs have changed for a student with a fixed need profile. A more formal opportunity to
demonstrate the limited reliability of these IPEDS measures would be to compare the IPEDS
measures with composition adjusted measures from administrative data collected from the
National Student Loan Data System (NSLDS).
“Outcomes and Value Added”: Are bad data worse than no data?
In labor economics, earnings measures associated with different courses of study and
levels of attainment (including failure to receive a degree) are the conceptual starting point for
measuring return on investment.18 It is also clear that, as with the “value added” discussion in
teacher labor markets, it is desirable to distinguish the contribution of a collegiate program from
differences in individual pre-collegiate achievement. Yet, there are two fundamental challenges
to measurement attempts: selecting an outcome measure and properly controlling for individual
and institutional inputs.
It would be unfortunate to attribute high individual earnings that result from “selecting”
students on high test scores in the admission process to an individual college. Moreover,
measurement problems are particularly challenging for available measures of collegiate earnings,
including those from UI records:
• Timing of measures: Immediate post-college earnings may be particularly poor indicators
of long-term earnings. To the extent that students may engage in exploratory programs
(such as Teach for America or the Peace Corps) or graduate school, immediate post-
collegiate earnings are likely to be particularly “noisy” measures of a college’s effect on
18 To be sure, there are a number of non-pecuniary private and public benefits to collegiate attainment that
one might wish to consider including health, civic participation, outcomes of children and so forth that an analyst might wish to consider in a complete calculus (see Oreopoulos, P. and K. Salvanes (2011)). At the same time, I will stipulate that “earnings” are sufficiently challenging that we can limit our discussion to this point for the purpose of this note.

Turner – Challenges for Info Rating Systems
EdPolicyWorks Working Paper Series No. 21. January 2014. Available at http://curry.virginia.edu/edpolicyworks/wp
Curry School of Education | Frank Batten School of Leadership and Public Policy | University of Virginia
12
earnings capacity. When participation in this type of post-collegiate activities differs
among different types of institutions, these measures will be biased.19
• Geography of measures: College graduates are notably geographically mobile and the
likelihood of moving out of state may well differ systematically among collegiate
institutions. For this reason, metrics that rely on state measures of income are likely to be
seriously distorted.20
Over a longer horizon than put forward by the timeline of the PIRS system, it may be
possible for researchers to connect national data on long term earnings from sources like the IRS
and the Social Security Administration with different collegiate experiences and student
characteristics. While conceptually possible, such an effort is likely to be extraordinarily time-
intensive: the task of years, not months.
The investment in the challenge of providing better information to students and state and
federal policy makers on the long-term value added of different colleges and universities is an
unambiguously important challenge. Yet, it is too important to “cut corners” and settle for
flawed measures that may ultimately turn out to have little validity when compared with long-
term indicators.
Timing and Next Steps
While it is unambiguously clear that better informed student-consumers would improve
the functioning of the higher education market, there is no feasible version of the Postsecondary
Information Rating System that could be adopted before the 2015-16 school year or used as a
19 Focusing on the college entry class of 1976, Bowen and Bok (1998) show that about 50% of graduates of
“SEL-1” institutions attend graduate school relative to about 30% of those from “SEL-3”. More recently, evidence from Abel, Deitz and Su (2014) demonstrates that immediate post-college earnings are poor predictors of the long-term economic outcomes associated with collegiate attainment.
20 SCHEV in Virginia reports recent (18-month) earnings data and, while this agency is careful to report identification rates a student consumer or analysis would need to know a considerable amount about selection to interpret the data presented. To illustrate, for 2009-10 graduates, observed earnings at the median for BA degree recipients in economics were $42,121 from the University of Virginia and $38,351 from Longwood University. Yet, the challenge in interpreting these numbers is that there is “no information”, potentially reflecting moves out of state, for 55% of University of Virginia graduates relative to 22% of Longwood graduates.

Turner – Challenges for Info Rating Systems
EdPolicyWorks Working Paper Series No. 21. January 2014. Available at http://curry.virginia.edu/edpolicyworks/wp
Curry School of Education | Frank Batten School of Leadership and Public Policy | University of Virginia
13
resource allocation mechanism by 2018 that would not have serious unintended consequences.21
Public policy makers need to focus on these dangers which include: distorting the allocation of
financial aid and collegiate opportunities away from “near poor” and modest income students
and potentially leading students to make sub-optimal choices by providing flawed data on costs
or outcomes. It is disappointing that the Department of Education and the Administration would
adopt a timeline that is fundamentally at odds with established scientific principles of
development, pilot testing, and efficacy testing mandated by the Institute of Education Sciences.
A more patient approach, combined with a determined effort to open data resources
maintained by the federal government to researchers, would likely yield much stronger long-term
results. For example, data maintained by the Federal Student Aid (FSA) group at the
Department of Education could be used to provide a clear profile of realized net cost and student
outcomes across the income distribution.22
The most salient question which is ignored entirely by the RFI is whether there is a
positive federal role in “rating” collegiate institutions. Given the extraordinary heterogeneity of
opportunities and individual tastes and aspirations, is a “rating system” really the missing link
that is keeping students from fully availing themselves of their collegiate options? It is
ultimately students and their families who must weigh benefits and costs of different collegiate
options in the context of their aspirations and achievement. A rating system per se will not
“answer” this question even as it should be possible – using better data and clear analytics – to
generate evidence-based innovations to empower students to make better informed choices.
Indeed, there is substantial promise in potential innovations that would provide students with
information specific to individual circumstances. In effect, students are missing answers to
questions like: What would a student in my economic circumstances expect to pay at different
colleges? What is the likelihood that a student with my characteristics will complete a degree at
21 The RFI notes: “The President has charged us to issue the ratings in time for students and others to use it
for the 2015-16 school year.” And “In the upcoming reauthorization of the Higher Education Act, the President will propose allocating financial aid based upon these college ratings by 2018.”
22 Such data would be far superior to the fairly wide income bins of “net cost” data currently available in IPEDS which are also limited to federal aid recipients. That said, such data would continue to be suffer from flaws if some aid-eligible students are not completing the FAFSA.

Turner – Challenges for Info Rating Systems
EdPolicyWorks Working Paper Series No. 21. January 2014. Available at http://curry.virginia.edu/edpolicyworks/wp
Curry School of Education | Frank Batten School of Leadership and Public Policy | University of Virginia
14
different colleges? And, what earnings can a student like me expect on choosing a particular
academic program?
There is no question that individual students and government funders could receive a
greater “return on investment” if students and their families were better informed in the college
choice process. Yet, the concept of the Postsecondary Institution Ratings System fundamentally
misses the mark in addressing a range of challenges affecting higher education.
Still, the questions that motivate the PIRS and the overall need to use information more
effectively in policy design and individual decision making do merit further investment. Some
ideas:
(1) Explore ways to make use of federal administrative data, including the resources of
the NSLDS / FSA and the IRS, in order to provide researchers and ultimately students with
better information about net price, as well as measures of college completion and earnings that
account for differences in students’ initial achievement.23
(2) Support and evaluate pilot projects that could be implemented at a large scale that
improve how students access available information.
Finally, there is much to be said for patience. A poorly designed system may harm
intended beneficiaries, waste valuable energy, and introduce new inefficiencies in the market. At
the same time, a deliberative and iterative design and evaluation process holds the possibility of
developing data and instruments that will improve the functioning of the market and empower
students to be better investors in their futures.
23 Hoxby and Turner (2013b) elaborate on this point. Two facets of federal administrative data merit
emphasis. First, because the data are derived from administrative sources used to determine aid eligibility, they are extraordinarily accurate. Secondly, because these data are extraordinarily detailed, it is possible to make comparisons at fine level of geography and for a wide range of “student profiles”, distinguished by pre-collegiate achievement and family income.

Turner – Challenges for Info Rating Systems
EdPolicyWorks Working Paper Series No. 21. January 2014. Available at http://curry.virginia.edu/edpolicyworks/wp
Curry School of Education | Frank Batten School of Leadership and Public Policy | University of Virginia
15
Reference List
Abel, J; R. Deitz & Y. Su. 2014. “Are Recent College Graduates Finding Good Jobs?” Federal
Reserve Bank of New York Current Issues in Economics and Finance, 20(1).
ACT. 2012. “The Condition of College and Career Readiness: Low Income Students” Iowa
City.
Avery, C. and S. Turner. 2011. “Playing the College Application Game: Critical Moves and the
Link to Socio-Economic Circumstances” [Revise and resubmit, AEJ-Policy.]
Barr, A. and S. Turner. 2013 “Expanding Enrollments and Contracting Budgets: The Effect of
the Great Recession Higher Education,” The Annals: American Academy of Political and Social
Science.
Figlio, D. and S. Loeb. 2011. “School Accountability” in E. Hanushek, S. Machin, and L.
Woessmann, eds., Handbook of Economics of Education, volume 3, Elsevier, 2011.
Gladieux, L. 1980. “What has Congress Wrought?” Change, Vol. 12 (pp. 25-31) October.
Hastings, J.; T. Kane and D. Staiger . 2005. “Parental Preferences and School Competition:
Evidence from a Public School Choice Program.” NBER Working Paper 11805
Hastings, J. and J. Weinstein, 2008. “Information, School Choice, and Academic Achievement:
Evidence from Two Experiments,” The Quarterly Journal of Economics, MIT Press, vol. 123(4),
pages 1373-1414, November.
Hoekstra, M. 2009. “The Effect of Attending the Flagship State University on Earnings: A
Discontinuity-Based Approach.” The Review of Economics and Statistics, 91(4): 717–24.

Turner – Challenges for Info Rating Systems
EdPolicyWorks Working Paper Series No. 21. January 2014. Available at http://curry.virginia.edu/edpolicyworks/wp
Curry School of Education | Frank Batten School of Leadership and Public Policy | University of Virginia
16
Holmstrom, B., and P. Milgrom. 1991. “Multitask principal-agent analyses: Incentive contracts,
asset ownership, and job design.” Journal of Law, Economics, & Organization no. 7:24-52.
Hoxby, C. 2001. “The Return to Attending a More Selective College: 1960 to Present.” In
Forum Futures Exploring the Future of Higher Education, 2000 Papers, ed. Maureen Devlin and
Joel Meyerson, editors. San Francisco: Jossey-Bass.
Hoxby, C. and S. Turner. 2013. “Expanding College Opportunities for
High-Achieving, Low Income Students” SIEPR Discussion Paper 12-014.
http://siepr.stanford.edu/?q=/system/files/shared/pubs/papers/12-014paper.pdf
Hoxby, C. and S. Turner. 2013. “Informing Students about Their College Options: A Proposal
for Broadening the Expanding College Opportunities Project” Hamilton Project Discussion
Paper 2013-03
http://www.hamiltonproject.org/files/downloads_and_links/THP_HoxbyTurner_FINAL.pdf
Julian, T., & Kominski, R. 2011. “Education and synthetic work-life earnings
estimates.” American Community Survey Reports. ACS-14. U.S. Census Bureau,
Washington, DC.
Kling; J.; S. Mullainathan, E. Shafir, L. Vermeulen, M. Wrobel. 2012. “Comparison friction:
Experimental evidence from Medicare drug plans” The Quarterly Journal of Economics 127 (1),
199-235
Monks, J. and R. Enhrenberg. 1999. “U.S. News and World Report's College Rankings: Why Do
They Matter,” Change, Vol. 31, no. 6 (November/December): 42-51.
National Research Council. 2012. Improving Measurement of Productivity in Higher Education.
Washington, DC: The National Academies Press, 2012 .

Turner – Challenges for Info Rating Systems
EdPolicyWorks Working Paper Series No. 21. January 2014. Available at http://curry.virginia.edu/edpolicyworks/wp
Curry School of Education | Frank Batten School of Leadership and Public Policy | University of Virginia
17
Oreopoulos, P. and K. Salvanes (2011) “Priceless: The Nonpecuniary Benefits of Schooling,”
Journal of Economic Perspectives 25(1), 159-84.
Tebbs, J. and S. Turner. 2005. “College Education for Low income Students: A Caution on the
Use of Data on Pell Grant Recipients.” Change (June).

Turner – Challenges for Info Rating Systems
EdPolicyWorks Working Paper Series No. 21. January 2014. Available at http://curry.virginia.edu/edpolicyworks/wp
Curry School of Education | Frank Batten School of Leadership and Public Policy | University of Virginia
18
Figure 1. Evidence of discontinuities around Pell cutoff in aid
Source: Data are collected from institution-specific “net cost calculators”. Data were accessed the week of January 12 and collect data on the net cost for a dependent student with the indicator family income and the following default settings: student born in 1995, U.S. citizen, oldest parent born in 1970, 2 parents + 1 sibling not college age, parents married / student single, in-state residency, 0 student income, and 0 parental assets.
Turner – Challenges for Info Rating Systems
EdPolicyWorks Working Paper Series No. 21. January 2014. Available at http://curry.virginia.edu/edpolicyworks/wp
Curry School of Education | Frank Batten School of Leadership and Public Policy | University of Virginia
19
Figure 2. Distribution of family income , 2012
Source: Data are from the American Community Survey using Miriam King, Steven Ruggles, J. Trent Alexander, Sarah Flood, Katie Genadek, Matthew B. Schroeder, Brandon Trampe, and Rebecca Vick. Integrated Public Use Microdata Series, [Machine-readable database]. Minneapolis, MN: Minnesota Population Center [producer and distributor], 2010. The sample consists of 17 year-olds who hold a high school diploma or GED, and live with at least one parent. Households with negative income were dropped.
20th%tile=$30,930
40th%tile=$55,216
60th%tile=$85,680
80th%tile=$127,008
0.0
2.0
4.0
6.0
8.1
0 100,000 200,000 300,000 400,000 500,000Household Inomce 2012
Fraction y/yb

Turner – Challenges for Info Rating Systems
EdPolicyWorks Working Paper Series No. 21. January 2014. Available at http://curry.virginia.edu/edpolicyworks/wp
Curry School of Education | Frank Batten School of Leadership and Public Policy | University of Virginia
20
Figure 3. Comparison of Changes in “Net Price” and Sticker Price
Source: Flagship tuition data are from Trends in College Pricing (2012, table 6). Net Price by family income data are from the IPEDS Student Financial Aid survey.
Note: Both changes are measured from 2009 (i.e., 2009-2010 school year) to 2011 and are put in 2012 dollars.