working paper - welcome to iiasa purepure.iiasa.ac.at/3399/1/wp-90-056.pdf · global security - the...
TRANSCRIPT

Working Paper Global Security - The Threats are 1
Changing
Roderick W. Shaw
IYP-90-56 October 1990
El! I l ASA International Institute for Applied Systems Analysis 0 A-2361 Laxenburg Austria
Telephone: (0 22 36) 715 2 1 * 0 0 Telex: 079 137 iiasa a Telefax: (0 22 36) 71313

Global Security - The Threats are Changing
Roderick W. Shaw
IVP-90-56 October 1990
Presented at "Survival 2000", B.hI. Birla Science Centre, Hyderabad, India, 16-18 hlarch 1990 and at Calcutta, India 21 hlarch 1990
Ilrorking Papers are interim reports on work of the International Institute for .A]1111ictl Systems Analysis and have received only limited review. Views or opinio~is csl)~~essccl herein do not necessarily represent those of the Institute or of its National 31~11111cr Organizations.
CaIIASA International Institute for Applied Systems Analysis A-2361 Laxenburg Austria
3i.m Telephone: (0 22 36) 715 21 * 0 Telex: 079 137 iiasa a Telefax: (0 22 36) 71313
FOREWORD
The 1992 World Conference on Environment and Development, to take place in Brazil, is intended to address forces which appear to be on a collision course: first, the ever-increasing degradation of the environment and our life support system by human- kind and, second, the need and desire of the heavily populated, less developed regions of the world to increase their standard of living and in all likelihood add to the enormous stress to the environment already imposed by the industrialized countries. Obviously, agreement on a global scale will be needed to solve this apparent dilemma in two ways: first, the industrialized regions must reduce the burden that they have already placed upon the environment and, second, the less developed regions must be helped to develop in as environmentally friendly a way as possible. This paper represents a new phase in the work of IIASA's Environment Program: the examination of how global environmental change brought about by human activities may pose a risk to the security of the world, and some of the measures that humankind might consider in managing this risk.
Bo R. Doos Leader Environment Program
ABSTRACT
Humanity's influence upon the environment is growing to encompass the globe and to extend in time to decades and even centuries. One particular global environmental problem, i.e., climatic change, could eventually lead to shifts in agricultural and forestry growing zones, changes in freshwater supply and a rise in sea level, and eventually to mi- gration and "environmental refugees". This could further result in civil unrest, political instability, militarism, and terrorism which could pose as large a threat to world security as the ideological struggle from which we appear to be emerging. The trace gases leading to climatic change, especially carbon dioxide and methane, are closely linked with the production of energy. A more efficient use of energy, both in the developed and develop ing world, should be the first and main strategy for attacking the impending global threat of climatic change. Incentives for increasing energy efficiency in the developed world should be through the imposition of resource taxes such as carbon taxes. In the develop ing world, energy efficiency and development could advance hand in hand, if the proper infrastructure were created. This could be financed at least partially by the resource taxes collected in the developed world.

CONTENTS
1. Introduction
2. The Increasing Scale of Humanity's Influence on the Environment
3. Causes, Nature and Extent of C l i i t i c Change
a) Physical basis for climatic change
b) Possible degree and extent of climatic change
c) Ecological effects of climatic change d) Effect upon sea level e) Effect upon global security
4. Addressing the Greenhouse Problem from the Point of View of Global Security
a) A classical dilemma
b) Selection and timing of greenhouse gas abatement
c) Choosing where to reduce greehouse gas emissions
5. Concluding Remarks
References
Tables and Figures
- vii -

GLOBAL SECURITY - THE THREATS ARE CHANGING
Roderick W. Shaw
1. Int roduct ion Since the end of the Second World War, the most eerious perceived threat to global
security has been a nuclear holocaust brought about by the superpowers, competing in the global arena with different ideologies and economic structures. Although this threat has not entirely disappeared, recently it appears to have diminished greatly because of the increased enlightenment of world leaders, and the political and economic changes that have been taking place in eastern Europe. Naturally, adjusting to these changes is not proving to be easy for those concerned, and associated threats to world security remain. Nevertheless, the threat of nuclear destruction or a 'nuclear wintern, a t least one stem- ming from ideological conflicts among the superpowers, seems to be less than it was ten years ago (Strong, 1989).
Despite these encouraging signs, one should recognize that other threats to world security (hitherto in the background) remain, and are probably growing. These threats stem from humanity's ever-increasing alteration of the physical, chemical and biological environment, which could bring hardship to many millions of people and lead to political and military conflict. Not only is our influence on the environment intensifying, but its spatial scale is growing to encompass the globe, and its temporal scale extending to decades and possibly even centuries.
This paper will briefly review man's increasing influence on the environment and then focus on global scale environmental problems, in particular the alteration of our climate through emissions into the atmosphere of radiatively influential trace gases (the -called 'greenhouse gasesn). The global effects will be discussed, including how they could decrease global security. Finally, some approaches to decreasing these threats will be discussed.
2. The Increasing Scale of Humanity 's Influence on the Envi ronment
The spatial and temporal scale on which human activities affect our environment has been expanding, especially during this century. Local pollution, notably in cities, has existed for many centuries and remains with us today. In many cities, especially in the developed world, concentrations of sulfur dioxide and suspended particulate matter decreased between 1973 and 1985. However, concentrations in other cities, including, for example, many in China and some in India, exceed World Health Organization guidelines for sulfur dioxide from 3 to 146 days per year, and those for suspended particulate matter from 100 to 273 days per year (GEMS, 1989). Although it may be argued that widespread urban pollution is not a local problem, local action (not necessarily locally financed) in individual cities can address it.
During the past several decades the distance between the polluter and the polluted has been steadily increasing; for example, atmospheric pollution no longer respects nation- al or even continental boundaries. About twenty years ago we became aware of the acidification of lakes and soils in Europe and in North America due to the transboundary

atmospheric transport of oxides of sulfur and nitrogen, primarily from burning fossil fuels for energy (Sweden, 1972). Oxides of sulfur and nitrogen have atmospheric lifetimes of several hours to several days, which means that, before they are deposited from the atmo- sphere by diffusion, impaction and precipitation, they are transported across national boundaries by the wind. This results in a complex exchange of sulfur and nitrogen com- pounds between Canada and the United States, and among the European countries.
It is possible that a similar problem is also occurring in Asia. China is presently emitting about 13 to 14 million tonnes of SO2 per year (GEMS, 1989), about one-third that of all Europe, and this rate will in all likelihood increase with the industrialization taking place there. It is likely that a t least some of these emissions are being transported across China's boundaries.
Because of these transboundary exchanges, addressing the problem of regional acidification, known popularly as "acid rain", requires a cooperative approach on a con- tinental scale among countries. This is already being done in Europe under the aegis of the United Nations Economic Commission for Europe Convention on Long-Range Transboundary Air Pollution, which was signed by 34 countries in 1979. Under this Convention, two Protocols have been signed; the first in 1979 to limit European SO2 emissions by about 25% (from 1980 values) by 1994; and the second, signed in 1988, to limit emissions of nitrogen oxides. It appears that, although these Protocols are good first steps towards reducing acidification, they will not protect sensitive ecosystems or halt the ongoing acidification of forest soil in Europe (Arnann, 1989; Shaw, 1989). Further steps are needed, and a systems analysis approach is being taken to develop new protocols using the Regional Acidification Information and Simulation (RAINS) model developed a t IIASA (Alcamo et al., 1987 and 1990). Use of the RAINS model indicates that interna- tional cooperation, possibly involving transfers of funds between east and west Europe, is needed. It is likely that, should the problem of regional acidification need to be addressed in Asia, assessment models similar to RAINS would be useful tools.
At present, the scale of humanity's effects upon the environment is spreading even beyond the regional to the global scale. The depletion of the protective ozone layer in the Antarctic and the Arctic, and climatic change are now recognized as potential global threats. Both of these problems are involved with the alteration of the atmosphere's radiative qualities by long-lived trace gases that are globally distributed within the atmo- sphere. Depletion of the ozone layer by chlorofluorocarbons (CFCs) will increase the earth's exposure to biologically harmful ultraviolet radiation. Climatic change may be brought about by increasing concentrations of "greenhouse gases", mainly carbon dioxide, methane, CFCs, and N20 and may manifest itself as altered patterns of temperature and precipitation, sea level rise and changes in vegetation patterns affecting both forests and agriculture. Climatic change could then lead to increased threats to global security through migration due to coastal flooding, and competition for scarce water and food s u p plies and for other resources such as wood. The threats could take the form of civil unrest, intercountry conflicts and terrorism.
This paper will focus on climatic change because of its widespread potential effects and, as will be seen, its strong links to the production of the energy that we use to carry out our lives.
3. Causes, Nature and Extent of Climatic Change
(a) Physical basis for climatic change Our atmosphere/ocean system is a giant heat engine, fueled by the sun, which
transfers energy from low latitude regions (which receive an excess of solar energy), to high latitudes (which have a deficit). The structure of the atmosphere, including wind,
temperature and precipitation patterns, is a result of a balance between the incoming short-wave solar energy (some of which is reflected by the earth and the atmosphere) and long-wave energy emitted according to Kirchoffs law by the earth and the atmosphere including clouds. It follows, then, that any change in the radiative properties of the atmosphere will ultimately change the climate. How and when and to what extent this might occur is still a matter of great scientific controversy.
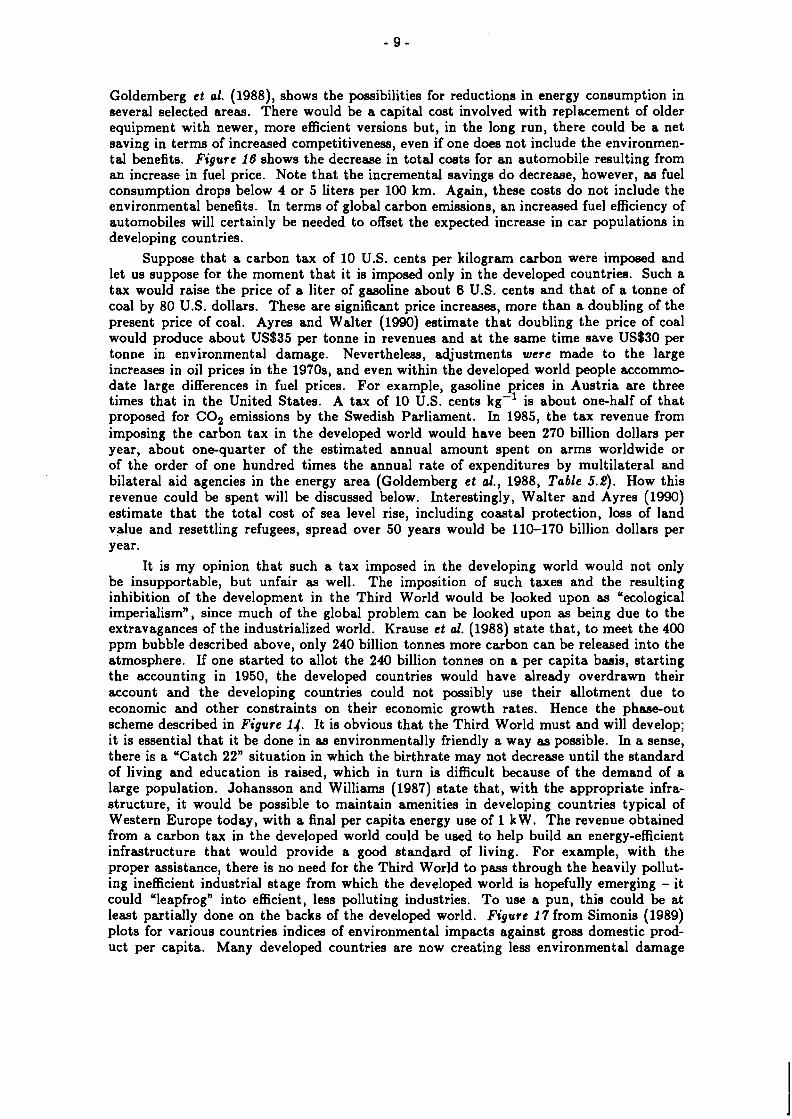
Certain trace gases act as important long-wave absorbers and re-emittors in the atmosphere. Some of them are long-lived and, because human activities are an important source of them, their concentrations have been steadily increasing. These 'greenhouse gasesn (somewhat a misnomer because a greenhouse is warm in winter because the glass also prevents convective dissipation of the heat) are carbon dioxide, methane, chlorofluorocarbons and N20. Table 1 summarizes the global sources of theee gases. Although there are large uncertainties, humanity is a significant source of methane and nitrous oxides and the only source for CFCs. Humanity d m not appear to be such a large source for carbon dioxide compared to natural sources, but it must be kept in mind that the carbon cycle is a delicate balance between sources and sinks and the increase in anthropogenic emissions has tipped the balance. As shown by Table 2, concentrations of carbon dioxide have increased from preindustrial values of about 275 ppm to present values of over 340 ppm. Table 2 shows that even larger increases have been estimated for the other greenhouse gases.
The reason for the increase in greenhouse gas concentrations is their long atmo- spheric lifetimes as shown in Table R This is in contrast to the acidifying pollutants described previously; these are mostly removed from the atmosphere in a matter of hours or days. In contrast, each annual emission of a greenhouse gas, because of its long life- time, can be assumed to become relatively uniformly mixed in the atmosphere. During subsequent decades, the mass of that particular annual emission remaining in the atmo- sphere is decreased, due to uptake by the oceans and by terrestrial biota. Before the Industrial Revolution, the atmosphere had reached an equilibrium of about 275 ppm C02. Since then, however, the ever increasing annual anthropogenic emissions have outstripped the sink mechanisms with the result that atmospheric concentrations have been steadily increasing and are expected to continue to do so. Figure 1, from Bolin et al. (1986), shows a steady increase in atmospheric concentrations of C 0 2 a t Mauna Loa Observatory, Hawaii. Despite the pronounced annual cycle due to biological activity, there appears to be an ever-increasing slope in the smoothed curve.
(b) Possible degree and exten t of climatic change
The effect of the increasing concentrations of greenhouse gases upon the radiation balance and the temperature, wind and precipitation patterns in the atmosphere is still a matter of conjecture. As in other matters, one has two possible routes: observation and model calculations. With respect to observations, regular temperature measurements have been made for over one hundred years. Figure 2 shows the global average surface temperature change during the past century. No correction has been made in the figure for urban warming, which is estimated to be 0.2.C. Is the apparent increase in mean tem- perature significant, and if so, can it be linked to greenhouse gas emissions? This question has not yet been answered. A report of the George C. Marshall Institute in the United States has concluded that the global temperature rise of 0.5.C during the past century cannot be linked with greenhouse gas emissions and warns against hasty action to reduce greenhouse gas emissions, saying that funds spent to improve forecasts would be money better spent. Needless to say, the report has generated much controversy in the United States and elsewhere. Even if one accepts the conclusions of the report, i t should be kept in mind that it deals with what has happened in the past and not with what could happen in the future from continued emissions of greenhouse gases. These can only be estimated, however imperfectly, by global climate models.
There are many models of global climate change of varying complexity, and space here does not permit a thorough review of them. Figure 3 shows one example of an output of one of the global change models, that of Washington and Meehl (1984), for a doubling of C 0 2 concentration. Note that the temperature increases are much greater during high latitude winters than at lower latitudes. Not only would temperature be affected, but precipitation as well. Figure 4 shows the predictions by the British Meteor* logical Office model (Mitchell, 1983 as reported by Stigliani et of., 1989) of changes in precipitation in Europe resulting from a doubling of C 0 2 concentration. (This model also predicts large wintertime temperature increases in mid to high latitudes.) In Figure 4, there are decreases in precipitation at mid latitudes in summertime, and slight increases at higher latitudes. In the wintertime, the increases are larger.
(c) Ecological effects of climatic change The above possible changes in climate could have significant biological effects,
influencing both agriculture and forestry. For example, the model of Washington and Weehl (1984) predicts for a doubling of C 0 2 an increase in mil moisture at mid latitudes in North America, and a decrease throughout Africa and in large parts of Southeast Asia (Figure 5). It would appear that the areas with more favorable growing conditions for both trees and certain food crops could shift northward. IIASA has developed a model of global vegetation change based upon the Holdridge Climatological Classification System (Crarner and Leemans, 1990). Figure 6 shows the predictions of this model with respect to the boreal forest; the northward shift of the favorable growing climate is evident. However, could the forests migrate quickly enough to keep pace with the shifting climate zone? The seeds of trees migrate via the wind and birds. Figure 7 shows that the advance of trees can be very slow indeed, depending upon the species, from a few meters to one or two kilometers per year (Huntley and Birks, 1983).
With respect to agriculture, greenhouse studies have indicated that increased C 0 2 could enhance photosynthesis. For example, a doubling of ambient C 0 2 concentration could cause an increase in growth of from 10 to 15% in wheat, soybean and rice (Warrick et al., 1986). I f one includes changes in climate however, the situation becomes much more complex. For example, grain production is likely to d e c r e e in the present core areas by 3 to 17% (Warrick et al., 1986). These same authors suggest, however, that increases in precipitation may partially offset the effects of a temperature increase. Few systematic studies of the impacts of possible climatic change have been conducted for the tropics and subtropics.
In the tropics, rainfall rather than temperature is the primary climate variable affecting agriculture (Warrick et al., 1986). In the semiarid tropics, planting depends upon the first rains. Small variations in the amount and timing of rainfall can cause large interannual variability in yields. In the humid tropics, food production depends not only upon the timely appearance of the monsoon, but also upon its strength and reliability throughout the growing season. Because of the possibility of damage to crops that have already been planted, late heavy rains are often just a . disruptive as the late arrival of rain.
A recently published study a t IIASA on the effects of climatic change on agriculture (Parry et al., 1988) indicates that, in cool temperate and cold regions, the changes in the length of the potential growing season and plant growth rates would lead to a shift in crop types and even the replacement of certain types of farming in some regions (e.g., of livestock by arable farming). There could also be changes in the incidence of agricultural pests and diseases. In semiarid regions, the IIASA study indicates that there could be substantial year-byear variability of yield levels and substantial within-season variabili- ty due to variations in the timing of rainfall. There could also be significant shifts of crop potential, leading to major movements of the boundaries of agroclimatic zones.

At all latitudes, the potential for the greatest effect from climatic change could be in marginal areas. Localities with steep gradients in temperature and precipitation are sen- sitive not only to changes in long-term mean valuea but in the occurrence of fluctuations about the mean.
Unfortunately, predictions of global climate models about the occurrence of extreme events such as droughts and floods are even more uncertain than their predictions about mean values.
(d) Effect upon sea level It is generally accepted that the effect of the predicted climatic change will be an
increase in sea level due to thermal expansion of the ocean, melting of the glaciers, abla- tion of the Greenland ice cap, and increase of the area of Antarctica. The expected rim in sea level varies according to the models that are used; by the year 2100, it could be 0.2 to 0.7 meters (Raper et al., 1990). This means that low-lying coastal communities would have to increase measures against high tidea and storm surges; the implications for coun- tries such as Bangladesh could be significant, especially with respect to storm surges which have caused catastrophes in the past. If the effect of climatic change, apart from a rise in mean sea level, were to increase the frequency of storminess in Southeast Asia, the effects could be serious indeed.
Walter and Ayres (1990) have estimated, using the work of Nordhaus (1989)) that it would cost 2.5 to 5 trillion dollars to protect the coastlines of the world from the expected rise in sea level; spread over 50 years it would amount to 0.2 to 0.4% of the gross world annual income.
(e) Effect u p o n global security From the above discussion, it is possible that flooding of coastal areas, apart from
the death and destruction that it would cause, could lead to forced migration and desta- bilization of the destinations of the migrants. Migration and/or civil unrest could also be the result of disruption of food and water supplies and scarcity of other raw materials such as wood.
Figure 8 (Source: B.R. Doos, personal communication, 1990) shows that, in some African countries, a combination of drought and civil war brought about mass migrations, refugees and famine. In most of these countries, the prime cause of the refugee movement and the famine was probably not the drought itself, but a combination of long, continu- ously unwise use of land and livestock populations, making people vulnerable to drought. In many of these countries in 1984, the value of arms imported exceeded the value of imported grain.
Although the regions which are severely affected by global environmental changes might actually be a small fraction of the area of the world, our recent experience with events in the Middle East has taught us that regional unrest can cause destabilization, such as terrorism, well beyond the boundaries of the directly affected region.
In addition to the threats to world security brought about by the global environmen- tal changes themselves, there could also be threats brought about by efforts to forestall or reverse the changes, as will be discussed in Section 4 to follow. Suggestions to slow the emissions of greenhouse gases in Third World countries by limiting their industrial growth will be seen by them to be uecological colonialismn. Although many regional problems such as desertification and destruction to the tropical rain forests may have been brought about by practices in developing countries, they have often been aa a result of commercial pressure from industrialized countries and indeed, many of the impending global problems are a legacy of the excesses of the developed world. As will be seen in Section 4, the implementation of measures to reduce global environmental change will require not only technological skill but a careful and equitable political approach.

Relatively little work has been done on the effects of environmental change upon global security. At the present time, IIASA is initiating a study that will explore the limits to human development (in terms of population and consumption of energy and materials) that will be imposed by life support systems (for example, food and water) not meeting the demands of the population, and by degradation of life support systems by environmental change. It is hoped that the study, which is intended to provide some of the input to the 1992 World Conference on Environment and Development, will indicate boundaries to human behavior that will promote sustainable development.
4. Addressing the Greenhouse Problem from the Point of View of Global Security
(a) A classical dilemma Global climatic change shares many of the classical attributes and dilemma of other
environmental problems. First of all, there is great scientific uncertainty. Second, the costs of preventative and remedial action are potentially enormous, not only in monetary but also in human terms. Should we wait and see what happens so that the scientific uncertainty may be decreased, or should we initiate expensive and difficult measures now that may turn out in the long term to be ineffectual or inefficient?
Policymakers have been faced with similar dilemma in other problems such as transboundary air pollution leading to regional acidification. In Europe at least, action has been taken before all of the scientific uncertainties have been resolved (they still haven't been!) and it is expected that these measures, and others to follow, will have beneficial effects upon the environment. To an even greater degree than regional acidification, climatic change has a long time horizon (probably one or two centuries) and long time lags for the processes operating within that time horizon. This makes the above dilemma even more agonizing.
Two possible approaches are open to us with respect to climatic change: adaption and prevention. Adaption would mean building defences such as dikes against sea level rise, or restructuring our agriculture and forest industries to account for shifts in climatic zones. Undoubtedly some adaptive measures will be needed, a t least in the short and medium run, because so much of the greenhouse gases from past and present emissions will remain in the atmosphere, making some climatic change inevitable. However, our ability to adapt may be limited by the material and social structures that are presently in place (people often live where they do because it is the best place for many reasons besides climate) and because the environmental changes may be so great. Uncertainty also plays a role; adaptive measures, like the preventative measures to be discussed below, require long lead times for planning. Like prevention, we run the risk of spending the money in the wrong place a t the wrong time.
As in the case of many threats, prevention or a t least forestalling is an attractive approach. The various factors affecting preventative measures will now be discussed. As in the case of other examples of atmospheric contamination, reductions of the greenhouse gas emissions underlying the problem are needed. As will be seen, the selection of which greenhouse gases to abate, and the timing of the emission reductions is determined by environmental considerations; the location of the emission reductions is determined by social, economic and political factors.
(b) Selection and timing of greenhouse gas abatement With respect to the selection of greenhouse gases to be abated, and the timing of the
emission reductions, several factors must be considered:

(i) Some greenhouse gases contribute more to the problem than others, due t o their relative abundance in the atmosphere and their relative effect on a unit mass basis. At the present time, carbon dioxide, CFCs and methane account for about 80% of the calculated temperature rise (Figure 9). Hopefully, emissions of CFCs will be reduced as a result of the Vienna Convention and the Montreal Protocol. Anthropo- genic emissions of carbon dioxide and methane are heavily linked with the genera- tion of energy, although deforestation is also an important source of C 0 2 (Bolin et al., 1986). It is obvious, therefore, that strategies t o forestall and reduce climatic change must involve our systems of energy generation.
~ i ) There are long time lags involved with reducing greenhouse gas emissions, as shown in Figure 10. These lags include the political time lags (At) needed for public opinion and political will to decide to implement measures; t E" e technologicd time delay (At)t, needed for changes in the energy-generating and other infrastructures, and the installation of control equipment; the atmospheric time delay (At)ry due to the long atmospheric residence times of greenhouse gases, and the ecologacd time delay (At),, needed for an ecosystem to respond to climatic changes. Integrated models that take into account (At)t, and (At),, already exist; an example is shown in Figure 11 of the Integrated Model for Assessing the Greenhouse Effect (IMAGE) developed by Rotmans et al. (1988). Note that, even for scenario D involving a halving of C 0 2 emissions between 1985 and the year 2100, and very large decreases in CFC production, the atmospheric concentration of C 0 2 continues to increase to the year 2100 and the global mean temperature decreases only slightly after the year 2060. Long-range thinking is indeed in order!
(c) Choosing where to reduce greenhouse gas emfssions The relatively short-lived atmospheric pollutants leading to regional acidification do
not have time to be uniformly mixed in the atmosphere before being deposited; therefore, different source regions affect sensitive receptors to varying degrees. This means that emission reductions for regional acidification must vary from country to country to be most effective. In contrast, greenhouse gases are relatively uniformly mixed in the atmo- sphere due t o their long lifetimes; reduction of their concentrations requires a reduction in global emissions. Any region-to-region variations in greenhouse gas emissions would depend not upon meteorological but upon social and economic factors. These factors will be discussed next; let us confine ourselves to energy-related greenhouse gas emissions and in particular carbon dioxide.
The energy-related C 0 2 emission Q for a region may be stated as
where P is the population of the region, D the per capita energy demand and E the C 0 2 emission per unit of energy supplied. Figure 18 (Diiijs, 1990) shows the per capita carbon dioxide emissions for various countries in the year 1985. Although there is a global aver- age per capita emission of 1 tonne carbon per year, there are large variations from a few tenths of a tonne C per year for developing countries to several tonnes C per year for developed countries such as the USA, Canada and eastern Germany (formerly the GDR).
The table a t the bottom of Figure 18 shows that, in 1985, the global population of five billion people resulted in a global C 0 2 emission of 5 billion tonnes C a-l. h u m i n g a modest increase in per capita emissions t o 1.5 tonnes C a-l by the year 2030 (largely from the development expected in the Third World), and an expected increase in the world population to 8 billion, the global emissions would be 12 billion tonnes C a-l. This would be an increase of 140% from 1985, not the 20% decrease so optimistically proposed at the World Conference on the Changing Atmosphere in Toronto in June 1988. Indeed,

to bring about a 20% decrease in global emissions with the same population pro'ections, per capita carbon dioxide emissions would have to be reduced to 0.3 tonnes C a-j, a 70% reduction from present values!
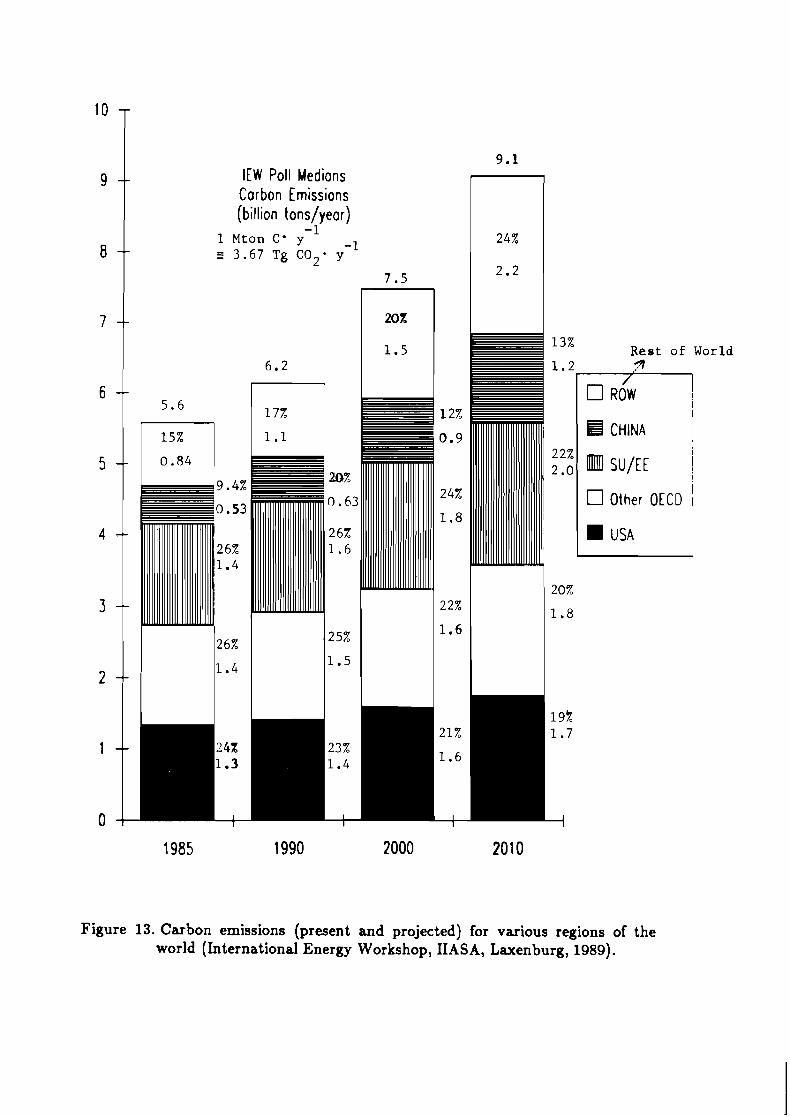
Figure 13 shows how the various regions of the world will contribute to global carbon emissions. In 1985, the OECD countries will be responsible for about half of the global C 0 2 emissions, the Soviet Union and eastern Europe together contribute about 25%; the other 25% comes from China and the rest of the world. By 2010, China and the rest of the world will contribute about 35%; by 2030, their share may be half of the global emission of 12 billion tonnes per year. In absolute terms, the emissions of China and the rest of the world may increase from 1.4 t o between 5 and 6 billion tonnes C per year. Is there a way out?
Krause et 41. (1988) have proposed an ultimate limit of 400 ppm C 0 2 for the atmo- sphere; this bubble would be allotted among the nations of the world. The authors state that the only practical way to meet the requirements of this bubble is for the developed countries to reduce their fossil fuel releaaes by 2% per year until the year 2020. In the meantime, developing countries would attempt t o keep their per capita emissions to 1985 levels; their total emissions would, of course, still increase by two-thirds due to population increases. After 2025, fossil fuel consumption would gradually drop to zero during the next 100 years. The decreases are shown in Figure 14.
This scenario is extremely optimistic and does not state precisely how it would be achieved, or how much it would cost. It does illustrate, however, the strict measures that would be required to keep the global mean C 0 2 concentration to a level that is 60 ppm above the present values.
Equation (1) shows clearly the factors involved in reducing C 0 2 emissions: by reducing population, or by reducing per capita energy demand, or by reducing emission per unit energy produced, or a combination thereof. In the developed world, population is relatively stable. In the developing world, large increases are expected (Figure 15). Sta- bilizing or reducing population in the Third World will be difficult; reductions in birthrates often come about with an increase in affluence and educational level. But this begs the question: How?
Per capita energy-related emissions are the product D x E in Equation (1). The very high per capita emissions in the developed world are a result of energy-intensive industry, an affluent lifestyle and little incentive for efficiency of use for energy and materials. Ayres (1989) has stated that material and energy is underpriced, a t least in the developed world. The price includes only the cost of extracting the materials or energy, its processing and its distribution. It does not include the environmental price, e.g., the damage to forests from acidifying emissions, health effects from polluted air and contaminated water supplies, the possible costs of raising dikes, or the cost of increased skin cancer from the depletion of the stratospheric ozone layer. Admittedly, i t is extremely difficult to estimate these environmental costs, but assuming a value of zero is certainly not correct! Chizhov and Styrikovich (1988) estimate that the environmental damages per ton of coal equivalent due to a thermal power station are as follows: coal US$107-117, residual oil US$92-106, gas US$30-36. Nordhaus (1989) estimated that the marginal damages of fossil fuel emissions due to global environmental change would be 3.3 to 26.9 U.S. dollars per ton equivalent, or 1.2 to 12.9 U.S. cents per kilogram carbon.
Adding an environmental tax to materials and energy could have two effects: i t could diminish the per capita demand, and ways might be sought to find ways of satisfy- ing the demand while emitting less. An example of this was the effect of the oil embargo in the early 19708, especially in North America. When prices rose (admittedly not for environmental reasons), the fuel efficiency of North American automobiles improved to hitherto unknown values. Unfortunately, the recent relaxation of prices has seen some return of powerful automobiles both in North America and in Europe. Table 3 from
Goldemberg et al. (1988), shows the possibilities for reductions in energy consumption in several selected areas. There would be a capital cost involved with replacement of older equipment with newer, more efficient versions but, in the long run, there could be a net saving in terms of increased competitiveness, even if one does not include the environmen- tal benefits. Figure 16 shows the decrease in total coats for an automobile resulting from an increase in fuel price. Note that the incremental savings do decrease, however, as fuel consumption drops below 4 or 5 liters per 100 km. Again, these costs do not include the environmental benefits. In terms of global carbon emissions, an increased fuel efficiency of automobiles will certainly be needed to offset the expected increase in car populations in developing countries.
Suppose that a carbon tax of 10 U.S. cents per kilogram carbon were imposed and let us suppose for the moment that it is imposed only in the developed countries. Such a tax would raise the price of a liter of gasoline about 6 U.S. cents and that of a tonne of coal by 80 U.S. dollars. These are significant price increases, more than a doubling of the present price of coal. Ayres and Walter (1990) estimate that doubling the price of coal would produce about US$35 per tonne in revenues and at the same time save U S 3 0 per tonne in environment a1 damage. Nevertheless, adjustments were made to the large increases in oil prices in the 19709, and even within the developed world people accornrno- date large differences in fuel prices. For example, gasoline prices in Austria are three times that in the United States. A tax of 10 U.S. cents kg-' is about one-half of that proposed for C02 emissions by the Swedish Parliament. In 1985, the tax revenue from imposing the carbon tax in the developed world would have been 270 billion dollars per year, about one-quarter of the estimated annual amount spent on arms worldwide or of the order of one hundred times the annual rate of expenditures by multilateral and bilateral aid agencies in the energy area (Goldemberg et al., 1988, Table 5.2). How this revenue could be spent will be discussed below. Interestingly, Walter and Ayres (1990) estimate that the total cost of sea level rise, including coastal protection, loss of land value and resettling refugees, spread over 50 years would be 110-170 billion dollars per year.
It is my opinion that such a tax imposed in the developing world would not only be insupportable, but unfair as well. The imposition of such taxes and the resulting inhibition of the development in the Third World would be looked upon as "ecological imperialismn, since much of the global problem can be looked upon as being due to the extravagances of the industrialized world. Krause et al. (1988) state that, to meet the 400 ppm bubble described above, only 240 billion tonnes more carbon can be released into the atmosphere. If one started to allot the 240 billion tonnes on a per capita basis, starting the accounting in 1950, the developed countries would have already overdrawn their account and the developing countries could not possibly use their allotment due t o economic and other constraints on their economic growth rates. Hence the phase-out scheme described in Figure 14. It is obvious that the Third World must and will develop; it is essential that it be done in as environmentally friendly a way as possible. In a sense, there is a "Catch 22" situation in which the birthrate may not decrease until the standard of living and education is raised, which in turn is difficult because of the demand of a large population. Johansson and Williams (1987) state that, with the appropriate infra- structure, it would be possible to maintain amenities in developing countries typical of Western Europe today, with a final per capita energy use of 1 k W. The revenue obtained from a carbon tax in the developed world could be used to help build an energy-efficient infrastructure that would provide a good standard of living. For example, with the proper assistance, there is no need for the Third World to pass through the heavily pollut- ing inefficient industrial stage from which the developed world is hopefully emerging - it could "leapfrogn into efficient, less polluting industries. T o use a pun, this could be at least partially done on the backs of the developed world. Figure 17 from Simonis (1989) plots for various countries indices of environmental impacts against gross domestic prod- uct per capita. Many developed countries are now creating less environmental damage

per unit GNP than the less developed eastern European countries and Turkey and Yugos- lavia. It is quite likely that developed countries in Asia and Africa are on the left-hand side of the figure; must they go over the crest of environmental damage or can they go directly to a more affluent and sustainable society?
In India, measures such as replacing inefficient cooking stoves using gathered fuel- wood with more efficient versions using less wood or biogas derived from waste products or even solar collectors, and providing a basic level of electrical lighting with energy- efficient lamps instead of kerosene lamps (which are 200 times less efficient) would not only improve the standard of living, but would require leea energy and result in less environmental pollution and degradation. In transportation, replacement of diesel trucks by railways for goods transport, especially for long distances, would also be a more efficient use of fuel (Goldemberg et d., 1988). All of these measures, however, require changes in infrastructure which in turn require investment.
Finally, it should be recognized that the increased use of nuclear energy has often been proposed as a solution both for regional acidification and for global climatic change. Nuclear plants do not emit sulfur dioxide, nitrogen dioxide or carbon dioxide. However, apart from the very high capital costs and complex requirements for safe operation, and the present unsolved problem of radioactive waste, nuclear plants have a severe drawback from the point of view of global security. The risk of proliferation of nuclear weapons through the reprocessing of nuclear waste may be relatively minor today, but would increase enormously if nuclear power were to be used on a much larger scale as it would be increasingly difficult to police the whereabouts of the nuclear material. The increased availability of fissionable materials, coupled with increased international tension if we are unable to solve the disparities in the world which are all too evident, is a dangerous com- bination indeed and should make nuclear power an "energy technology of last resortn (Johansson and Williams, 1987).
5. Concluding Remarks Humanity's influence upon the environment is growing to encompass the globe and
to extend in time to decades and even centuries. One particular global environmental problem, i.e., climatic change, could eventually lead to shifts in agricultural and forestry growing zones, changes in freshwater supply and a rise in sea level. The possible disrup tion of supplies of food, freshwater and materials such as wood could lead to migration and "environmental refugeesn. This could further result in civil unrest, political instabil- ity, militarism, and terrorism which could pose as large a threat to world security as the ideological struggle from which we appear to be emerging.
The trace gases leading to climatic change, especially carbon dioxide and methane, are closely linked with the production of energy. It is my opinion that a more efficient use of energy, both in the developed and developing world, should be the first and main strategy for attacking the impending global threat of climatic change. Incentives for increasing energy efficiency in the developed world should be through the imposition of resource taxes such as carbon taxes. It should be pointed out that such taxes could be applied to other substances such as sulfur or CFCs or even hydrogen, since the last when burned for energy, emits water vapor which itself could have climatic consequences.
In the developing world, energy efficiency and development could advance hand in hand, if the proper infrastructure were created. This could be financed a t least partially by the resource taxes collected in the developed world.
It is then a matter of those who are relatively well off helping those who are not, a form of insurance policy t o reduce threats to global security. Although those in the developed world may see a transfer of resources from North to South as a form of charity, in fact i t may be a matter of global survival and as such could be justified even for selfish reasons. We are happy to pay fire insurance premiums, and if our house does not burn down, we are still happy.

References
Alcamo, J., M. Amann, J.-P. Hettelingh, M. Holmberg, L. Hordijk, J. Kamari, L. Kauppi, P. Kauppi, G. Kornai, and A. Makela (1987). Acidification in Europe: A simulation model for evaluating control strategies. Ambio 16(5):232-245.
J. Alcamo, R.W. Shaw, and L. Hordijk (eds.) (1990). The RAINS Model of Acidification: Science and Strategies i n Europe. Kluwer Academic Publishers, Dordrecht, The Netherlands.
Amann, M. (1989). Using Critical Loads as the Basis for Abatement Strategies in Europe. Working paper submitted to the UN-ECE Task Force Meeting on Integrated Assessment Modelling, 27-29 November, Geneva, Switzerland.
Ayres, R. (1989). Energy Ineficiency i n the U.S. Economy: A New Case for Conserva- tion. Research Report RR-89-12. International Institute for Applied Systems Analysis, A-2361 Laxenburg, Austria.
Ayres, R. and J . Walter (1990). Global Warming: Abatement Policies and Costs. (Manuscript in preparation), International Institute for Applied Systems Analysis, A-2361 Laxenburg, Austria.
Bacastow, R. and C.D. Keeling (1981). Atmospheric carbon dioxide concentration and the observed airborne fraction. In B. Bolin (ed.), Carbon Cycle Modeling. SCOPE 16. John Wiley and Sons, Chichester, U.K.
Bolin, B., B.R. Doos, J . Jager, and R.A. Warrick (eds.) (1986). The Greenhouee Effect, Climatic Change, and Ecosystems. SCOPE 29. John Wiley and Sons, Chichester, U.K. 541 pp.
Chizhov, N. and M. Styrikovich (1988). Ecological advantages of national gas and other fuels. In T.H. Lee, H.R. Linden, D.A. Dreyfus, and T. Vasko (eds.), The Methane Age. Kluwer Academic Publishers, Dordrecht, The Netherlands.
Cramer, W. and R. Leemans (1990). Assessing impacts of climate change on vegetation using global vegetation models. In H.H. Shugart and A.M. Solomon, Vegetation Dynamics Modeling and Global Change. Chapman and Hall, New York, U.S.A. (in press).
Davis, M.B. (1981). Quaternary history and the stability of forest communities. In D.C. West, H.H. Shugart, and D.B. Botlein (eds.), Forest Succession: Concepts and Application. Springer-Verlag, New York, U.S.A.
Doos, B.R. (1990). (Personal communication, International Institute for Applied Systems Analysis, A-2361 Laxenburg, Austria.)
GEMS (1989). An assessment of urban air quality. Environment 31(8):&37.
Goldemberg, J., T.B. Johansson, A.K.N. Reddy, and R.H. Williams (1988). Energy for a Sustainable World. Wiley Eastern Limited, New Delhi, India. 517 pp.
Huntley, B. and H.J.B. Birks (1983). An Atlas of Past and Present Pollen Maps for Europe: 0-13000 Years Ago. Cambridge University Press, Cambridge, U.K.
Johansson, T.B. and R.H. Williams (1987). Energy conservation in the global concept. Energy 12(10):907-919.
Keyfitz, N. (1989). Population Growth Can Present the Development that Would Slow Population Growth. (Manuscript in preparation), International Institute for Applied Systems Analysis, A-2361 Laxenburg, Austria.
Krause, F., W. Bach, H. Becht, M. Cavelli, C. Helle, E. Mills, D. Olivier, G. Onufrio, P. Radanne, L. Reijnders, D. Hawk, and B. Nordman (1988). Energy and Climate Change: What Can Western Europe Do? Report Project No. 64.12.14.00, Ministry of Environment, The Netherlands.

Leemans, R. (1989). Possible changes in natural vegetation cycles due to a global warm- ing. Pages 105-122 in A. Hack1 (ed.), Der Treibhauseflekt. Das Problem - Mogliche Folgen - und erforderliche Mafinahmen. Akademie fiir Umwelt und Energie, A-2361 Laxenburg, Austria.
Mitchell, J.F.B. (1983). The seasonal response of a general circulation model to changes in COz and sea temperature. Quart. J. Roy. Meteorol. Soc. 109:113-152.
Nordhaus, W.D. (1989). The Economics of the Greenhouse Effect. Paper presented a t the International Energy Workshop, International Institute for Applied Systems Analysis, A-2361 Laxenburg, Austria.
Parry, M.L., T. Carter, and N. Konijn (eds.) (1988). The Impact of Climatic Variations on Agriculture (2 volumes). Kluwer Academic Publishers, Dordrecht, The Nether- lands.
Rarnanathan, U., R.J. Cicerone, H.B. Singh, and J.T. Kiehl (1985). Trace gas trends and their potential in climate change. J. Geophys. Res. 90(D3):5547-5566.
Raper, S.C.B., R.A. Warrick, and T.M.L. Wigley (1990). Global sea level rise: Past and future. In J.D. Williman (ed.), Proceedings of the S C O P E Workshop on aRi8ing Sea Level and Subriding Coastal Areas", Bangkok, 1988. John Wiley and Sons, Chichester, U.K. (in press).
Rotmans, J., R.J. de Boois, and R. Swart (1988). IMAGE: Integrated Model for Assess- ing the Greenhouse Eflect. Report of the Netherlands Institute of Public Health and Environmental Protection, 3720 BA Bilthoven, The Netherlands.
Shaw, R. W. (1989). Using an integrated assessment model for decision-making in transboundary air pollution in Europe. Pages 177-182 in L.J. Bresser and W.C. Mulder (eds.), Man and His Ecosystem, Vol. 2. Elsevier Science Publishers, Amsterdam, The Netherlands.
Simonis, U.E. (1989). Economic Structure and Environmental Impact. Science Center Berlin, Reichprietschufer 50,1000 Berlin, F.R.G. (unpublished manuscript).
Stigliani, W.M., F.M. Brouwer, R.E. Munn, R.W. Shaw, and M. Antonovsky (1989). Future developments for Europe: Some implications of alternative development paths. Science of the Total Environment 80:l-102.
Strong, M. (1989). Proposal for a Project on Global Security and Risk Management. World Federation of United Nations Association (WFUNA), Geneva, Switzerland.
Sweden (1972). Air Pollution Across National Boundaries. Position paper presented at 1972 Stockholm Conference on the Environment, Stockholm, Sweden.
U.S. Dept. of Energy, Washington, D.C., U.S.A. (1988). A Primer on Greenhouse Gases. Report DOE/NBB-O083,1R040. 100 pp.
Walter, J . and R. Ayres (1990). Global Warming: Damages and Costs. (Manuscript in preparation), International Institute for Applied Systems Analysis, A-2361 Laxen- burg, Austria.
Warrick, R.A., R.M. Gifford, and M.L. Parry (1986). C 0 2 , Climate Change and Agricul- ture. In B. Bolin, B.R. Doos, J. Jager, and R.A. Warrick (eds.), The Greenhouse Eflect, Climatic Change and Ecosystems. SCOPE 29. John Wiley and Sons, Chichester, U.K.
Washington, W.M. and G.A. Meehl (1984). Seasonal cycle experiment on the climatic sensitivity due to a doubling of COz with an atmospheric general circulation model coupled to a simple mixed layer ocean model. J. Geophys. Res. 32:2044-2059.
Wigley, T.M.L. (1987). Testimony submitted to the US Senate Hearing on the Green- house Effect and Climatic Change by the Subcommittee on Environmental Protec- tion, 28 January 1987, Washington, D.C., U.S.A.
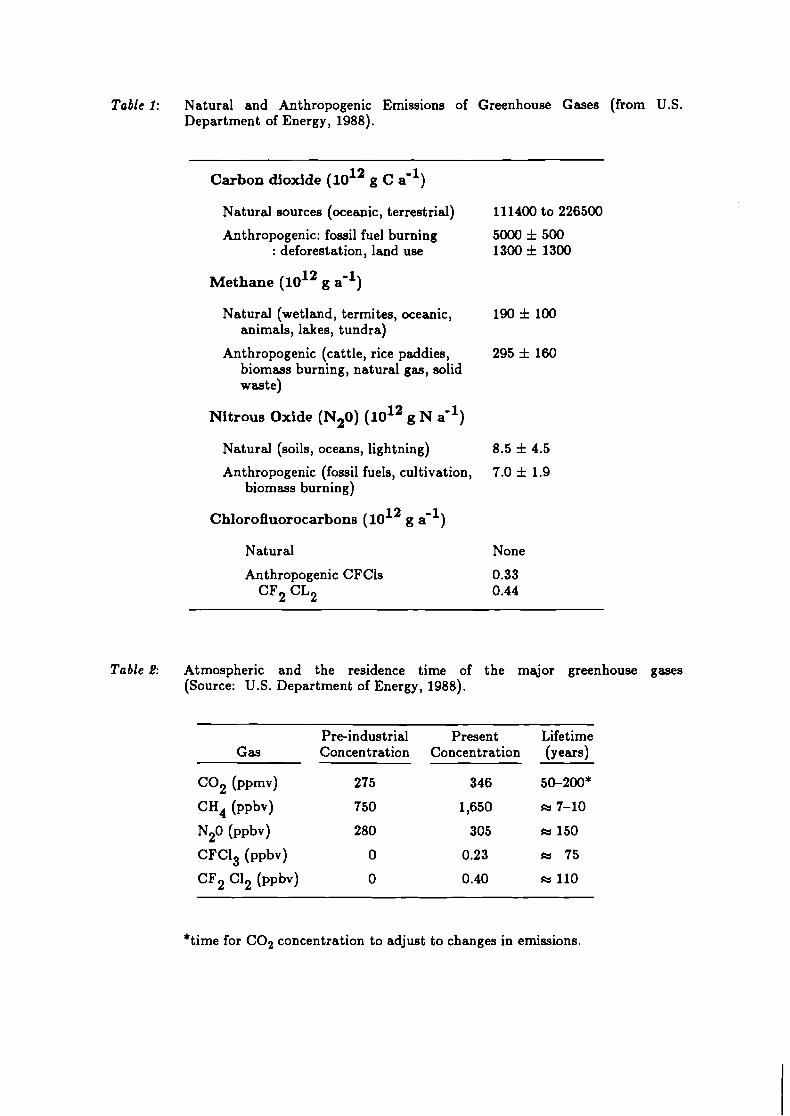
Table 1: Natural and Anthropogenic Emissions of Greenhouse Gases (from U.S. Department of Energy, 1988).
Ca rbon dioxide (1012 g C i l )
Natural sources (oceanic, terrestrial)
Anthropogenic: fossil fuel burning : deforestation, land use
Methane (1012 g i l )
Natural (wetland, termites, oceanic, animals, lakes, tundra)
Anthropogenic (cattle, rice paddies, biomass burning, natural gas, solid waste)
Ni t rous Oxide (N20) (1012 g N d l )
Natural (soils, oceans, lightning)
Anthropogenic (fossil fuels, cultivation, biomass burning)
Natural
Anthropogenic CFCls CF2 CL2
None
Table 2: Atmospheric and the residence time of the major greenhouse gases (Source: U.S. Department of Energy, 1988).
Pre-industrial Present Lifetime Gas Concentration Concentration (years)
C 0 2 ( P P ~ V ) 275 346 50-200*
CH4 (PPbv) 750 1,650 u 7-10
N20 (PPbv) 280 305 u 150
CFC13 (PPbv) 0 0.23 u 75
CF2 c12 ( P ~ b v ) 0 0.40 m 110
*time for C 0 2 concentration to adjust to changes in emissions.

Table 9: Examples of alternative energy intensities for various activities (from Goldemberg e t al. (1988)).
Activity Unit Present Alternative
Automobile 1 gasoline/100 km 10-15 2.3-5
Residential 2 kJ/m floor area 120-160 15-50 space heating
Refrigeratorlfreezer k Wh/l capacity/year 3.4 0.7-1.7
Steel production GJ/tonne steel 22-27 9-15

Figure 1. Concentration of atmospheric GO2 at Mauna Loa Observatory, Hawaii. Dots indicate monthly averages deter- mined from continuous measurements. Based on data reported by Bacastow and Keeling (1981), supplemented by data from recent years supplied by personal communication.
Figure 2. Calculated values of the increase of the mean annual surface temperature due to changes in greenhouse gas con- centrations from 1765 to present, together with projections forward to the year 2050 based on estimated future greenhouse gas concentration changes. The range of values between the upper and lower curve reflects the uncer- tainties in the climate system's equilibrium sensitivity to greenhouse gas concentration changes. The shorter record between the limiting curves represents the observed global mean surface temperature (Wigley, 1987).

( 0 ) SURFACE AIR TEMPERATURE DIFFERENCES, DJF
110
180 9 OW 0 90E !80
Figure 3. Surface temperature change ('C) for a steady-state doubling of C02 concentrations in (a) winter and, (b) summer (Washington and Meehl, 1984).

Legend :
Legend :
Figure 4. Precipitation changes expected in summer (upper) and winter (lower) as a result of the equivalent doubling in concentration of C02 (in mm/day) (Mitchell, 1983). Note the increased precipitation over North- ern Europe and decrease over much of Southern Europe.

(0) SOIL MOISTURE DIFFERENCES, DJF 9 0 N o ,73.v11.,....,,..,,1,,.,.,,,...,,,..,,
180 90W 0 90E 180 90N
( b ) - SOL MOISTURE DIFFERENCES, JJA
90N 0, , , , , , , ,-,it-- I80 90W 0 90E 180 90N
Figure 5. Geographical distribution of soil moisture differences in cm for December-February and June-August obtained by Washington and Meehl (1984) for 2 x C 0 2 - 1 x GO2.

Figure 6. Shifts in climatic zones for wintergreen needle trees for a doubling of CO, concentrations (Leemans, 1989).
Potential Increase
Decline
Boreal and Montane Wintergreen Needle Trees


Figure 8.
Drought + c i v i l war
Refugee movement 4
/ 8 .- 0 Severe popu la t ion pressure
DROUGHT FAMINE
C N I L WAR REFUGEE MOVEMENT
In 1984, the following eight Sudan civil countries were singled out Ethiopia civil by UN to be the ones most Chad civil severely affected by drought. Niger
Mali Five out of these countries Mosambique civil also suffered from civil war. Burkina Fasso
Angola civil
In several (most of all) of these countries the prime cause of the famine (and refugee movement) was probably not the drought itself, but a combination of long continuous bad land use and increased human and stock population making people vulnerable to drought.
In many of these countries the value of arms imported exceeded the value of imported grain (1984) (from B.R. DBBs, 1990).
war war war
war
war

Figure 9. Cumulative equilibrium global surface temperature warming due to increases in carbon dioxide and other trace gases from 1980 to 2030. After Ramanathan et al. 1985.
- -
- -
-
itrous oxide
7 -
Chlorofluorocarbons
7
.
-
Carbon dioxide

(A t ) decades
Economic developm. Technological developm. Population increase
Industry Transportation Buildings
r
Emissions:
Ah
Climatic Change: Temperature Precipitation
1 Impacts:
Agriculture Forenry Water resources
years (A 'Ires decades
A - -
(A t ) years
P O L " decades
Po Iicy -Strategies: Emission limit. Adaptation
Figure 10. Schematic of time lags involved in implementing a greenhouse gas con- trol strategythe technical time lag At,,,; the atmospheric time lag At,,; the ecological time lag (~t ) , , ; the political time lag (At)pol.

TlME IN YEARS
TlME IN YEARS
Figure 11. Upper panel: Four C02 emission scenarios. Lower panel: Corresponding global C02 concentrations as predicted by the Integrated Model for Assessing the Greenhouse Effect (Rotmans ct uf. 1988).

Ton C I
5
4
3
2
1
0
C 0 2 emissions per inhabitant
USA, GDR, CAN, CZ 4.9 4.9 4.4 4.1
AUS, USSR, POL, . . . 3.9 3.3 3.0
FRG, UK, NL, s 3 F, ... 2.9 2.5 2.5 2.2 2.0
Japan, Italy, Spain, ... 1.9 1.5 1.4
Average PRC, Brazil, India
0.5 0.3 0.1
I Popul. I Clinhab. I Emission ( 9 1 1985 1 5.10' 1 1 ton 1 5.10 ton I
1 2030 1 8.10' 1 1.5 ton 1 12.10' ton I Figure 12. Per capital C 0 2 - C emissions in various countries in 1985 (Doos, 1990).
- IEW Poll Medians Corbon Emissions (billion tons/yeor)
- 1 1 Mton C ' y - - 1 5 3 . 6 7 Tg C O 2 - y
Rest of Wo
CHINA I
SU/E E I ! I
1 Other OECD I
USA I
Figure 13. Carbon emissions (present and projected) for various regions of the world (International Energy Workshop, IIASA, Laxenburg, 1989).

W m z I 0 a - F W . .
Y) Z i i .y . p i I
a 0 waz b i a ,w a x - > a 5 oa ~ u o u
MILES PER GALLON (U.S.1 5 0 70
C BAS; VEHICLE PURCHASE PRICE l $ 7,000)
VEHICLE FEES AND TAXES\ INCREMENTAL PRICE FOR
IMPROVEMENTS *
INSURANCE -
GARAGING, PARKING AND TOLLS
REPAIRS, PARTS AND MAINTENANCE
I I I I I I I I 1
L ITERS PER 100 KILOMETERS
Figure 16. The cost of driving in 1981 U.S. cents per km and per mile, versus automative fuel economy. The energy perfor- mance indicated here is based on computer simulations of an automobile having various fuel-economy improv* ments added in the sequence indicated at the top of the graph (from Goldemberg et d. 1988) base case car is a 1981 Volkswagen Rabbit (gasoline version).
A9gregated per caplta Indices of cement productaon, energy consumptaon, crude steel consumptron and werght of frerght transport (Mean 1 9 7 0 / 1 5 - 0 )
C m s s DOrtFTIC PBamcT PtR CAPITA (US-( at 1980 pricea a d e.cL.qe rates)
Figure 17. Index of structural environmental impacts* per capita and economic performance level (1970 = */1985 = +) and Change (-------- > ) a