workload control: an assessment
TRANSCRIPT

Imagem
Matthias Thürer
Workload Control: An Assessment


University of Coimbra
Workload Control: An Assessment
Matthias Thürer
Submitted for the Degree of Doctor of Philosophy
University of Coimbra; April 2011


Science, why have you forsaken me?!
K.
�ak patakrak boumm
et puis c'est tout, et puis
c'est rien
Celine

Resumo
O objectivo deste trabalho é disponibilizar uma solução simples e e�caz para o controlo e planea-
mento de produção (PPC - Production Planning and Control), aplicável a pequenas e médias
empresas com produção por encomenda (MTO). O que distingue este tipo de empresas é o ele-
vado nível de personalização associado aos seus produtos, que se re�ecte em ambientes de produção
complexos, e recursos �nanceiros limitados. Além disso, de modo a se manterem competitivas no
mercado global, as pequenas e médias empresas devem procurar incorporar �loso�as de produção
tais como o "Lean" e a gestão de qualidade total (TQM - Total Quality Management). Porém,
para estas empresas, não existem ferramentas práticas que facilitem e suportem a incorporação
destes conceitos. O sistema de controlo de carga (WLC - Workload Control) providencia estas
ferramentas. Progressos recentes acerca do entendimento do conceito de "Lean", mostram que
uma das chaves para a implementação da produção "Lean" consiste em proteger a taxa de pro-
dução da variação existente no sistema. O WLC garante essa protecção, gerindo a capacidade, o
tempo de produção e os stocks intermédios em simultâneo. Além disso, reduz o stock de produtos
em vias de fabrico (WIP) e torna o �uxo de produção mais visível, possibilitando uma melhoria
da qualidade. Há uma necessidade de desenvolver abordagens de planeamento e controlo da pro-
dução alinhadas com as características chave das empresas, incluindo estratégias de produção e
tipos de processo. O WLC é uma das poucas abordagens existentes desenvolvida especi�camente
para empresas do tipo MTO. Por isso, o WLC é reconhecido como a solução chave para empresas
deste tipo. No entanto, a maioria dos gestores em actividade desconhecem-na, em parte porque
o conceito foi desenvolvido maioritariamente em teoria. Nas poucas tentativas de implementação
prática do WLC, os investigadores depararam-se com sistemas mais complexos que os utilizados
pelos investigadores, aos quais foi difícil aplicar a teoria existente. Este trabalho procura colmatar
essa falha, estabelecendo uma ponte entre a teoria e a prática. Para tal, investigam-se questões de
implementação como tempos de setup dependentes da sequência ou a acomodação de encomendas
com grandes tempos de trabalho. Além disso, este estudo, baseado em três décadas de investigação
em WLC, revê a teoria à luz de recentes desenvolvimentos empíricos, determina o método mais
e�caz de controlar a entrada do trabalho para a produção e determina o método mais e�caz de
determinar tempos de produção curtos e realizáveis. Como resultado, este estudo representa uma
base conceptual para implementações futuras.
i

Abstract
The objective of this study is to provide a simple and e�ective Production Planning and Control
(PPC) solution suitable for small and medium sized Make-To-Order (MTO) companies. What
distinguishes this kind of company is the high customization of products, which re�ects in complex
job shop like production environments, and limited �nancial resources. The global market requires
that also small and medium sized companies embrace production philosophies such as Lean and
Total Quality Management (TQM) to stay competitive. However, there are no practical tools to
help them to incorporate these concepts. Workload Control (WLC) provides this tool. Following
recent advances in our understanding of lean, is protecting throughput from variance under min-
imal costs the key to lean manufacturing. WLC achieves this by e�ectively managing capacity,
lead time and inventory bu�ers simultaneously. In addition it reduces the Work-In-Process (WIP)
and makes the production �ow more visible which allows quality to be improved. Moreover, there
is a need to develop approaches that are contingent on key company characteristics, including pro-
duction strategy and process type. WLC is one of the few approaches, primarily designed for the
MTO sector where job shop con�gurations are common. It is recognized as the leading solution
for MTOs however most practitioners are unaware of it. Part of the reason for this is that WLC
has been widely developed through theory; when attempts have been made to implement WLC
in practice, researchers have encountered more complex systems and found it di�cult to apply
existing theory. This work seeks to bridge the gap between theory and practice from a theoretical
point of view. Building on three decades of research on WLC this study: (1) reviews theory in the
light of recent empirical developments; (2) addresses implementation issues raised by practitioners
as e.g. sequence dependent set-up time and the accommodation of large orders; and, (3) deter-
mines the best performing methods to control release and determine short & feasible lead times.
Finally, the performance of WLC as comprehensive concept is assessed under a broad spectrum
of shop �oor characteristics which leads to the conceptual base for future implementation.
iii

Publications
The following parts of this research have been published or are in press, are currently under review
or will be submitted soon:
International Journal
Thürer, M., Stevenson, M., Silva, C., Land, M., and Fredendall, L.D., 2011g, Workload Control
(WLC) and Customer Enquiry Management: The Key to Lead Time Control and Customer
Service, (in preparation)
Thürer, M., Stevenson, M., Silva, C., and Huang, G., 2011f, The Application of Workload Control
in Assembly Job Shops: An Assessment by Simulation, International J. of Production Research,
(submitted)
Thürer, M., Silva, C., Stevenson, M., and Land, M., 2011e, Controlled Order Release: A Perfor-
mance Assessment in Job Shops with Sequence Dependent Set-up Times, International J. of
Production Economics, (submitted)
Thürer, M., Stevenson, M., Silva, C., Land, M., and Fredendall, L.D., 2011d, Workload Control
(WLC) and Order Release: A Lean Solution for Make-To-Order Companies, Production &
Operations Management, (submitted)
Thürer, M., Silva, C., Stevenson, M., and Land, M., 2011c, Improving the
Applicability of Workload Control (WLC): The In�uence of Sequence Dependent Set-Up Times
on Workload Controlled Job Shops, International J. of Production Research, (submitted)
Thürer, M., Stevenson, M., and Silva, C., 2011b, Three Decades of Workload Control Research:
A Systematic Review of the Literature, International J. of Production Research, DOI: 10.1080
00207543.2010.519000.
Thürer, M., Silva, C., and Stevenson, M., 2011a, Optimising Workload Norms: The in�uence of
shop �oor characteristics on setting workload norms for the workload control concept, Interna-
tional J. of Production Research, 49, 4, 1151 - 1171.
Thürer, M., Silva, C., and Stevenson, M., 2010, Workload control release mechanisms: From
practice back to theory building, International J. of Production Research, 48, 12, 3593 - 3617.
Conferences
Thürer, M., Stevenson, M., Silva, C., Land, M., and Fredendall, L.D., 2011, Workload Control
Due Date Setting Rules: The Key to Short and Reliable Lead Times, POMS Conference 2011.
Thürer, M., Silva, C., and Stevenson, M., 2010, Improving the Applicability of Workload Control
(WLC): The In�uence of Sequence Dependent Set-Up Times on the Performance of WLC in
Job Shops, EUROMA 2010.
v

Contents
Contents
I. Introduction 1
1. Introduction 3
1.1. Background . . . . . . . . . . . . . . . . . . . . . . . . . . . . . . . . . . . . . . . 3
1.2. Objectives . . . . . . . . . . . . . . . . . . . . . . . . . . . . . . . . . . . . . . . . 4
1.3. Research Methodology . . . . . . . . . . . . . . . . . . . . . . . . . . . . . . . . . 5
1.4. Thesis Outline . . . . . . . . . . . . . . . . . . . . . . . . . . . . . . . . . . . . . . 5
II. Literature Review 9
2. Three Decades of Workload Control Research: A Systematic Review of the Litera-
ture 11
2.1. Introduction . . . . . . . . . . . . . . . . . . . . . . . . . . . . . . . . . . . . . . . 11
2.2. Methodology . . . . . . . . . . . . . . . . . . . . . . . . . . . . . . . . . . . . . . 13
2.2.1. Categorisation of Literature . . . . . . . . . . . . . . . . . . . . . . . . . . 13
2.3. Workload Control (WLC): An Introduction . . . . . . . . . . . . . . . . . . . . . . 13
2.3.1. Customer Enquiry and Job Entry Stages . . . . . . . . . . . . . . . . . . . 14
2.3.2. Job Release Stage . . . . . . . . . . . . . . . . . . . . . . . . . . . . . . . . 15
2.3.3. Dispatching Stage . . . . . . . . . . . . . . . . . . . . . . . . . . . . . . . . 15
2.4. Literature Review and Future Research Directions . . . . . . . . . . . . . . . . . . 16
2.4.1. Conceptual Research . . . . . . . . . . . . . . . . . . . . . . . . . . . . . . 16
2.4.2. Analytical Research . . . . . . . . . . . . . . . . . . . . . . . . . . . . . . . 19
2.4.3. Empirical Research . . . . . . . . . . . . . . . . . . . . . . . . . . . . . . . 21
2.4.4. Simulation-Based Research . . . . . . . . . . . . . . . . . . . . . . . . . . . 23
2.5. Conclusion . . . . . . . . . . . . . . . . . . . . . . . . . . . . . . . . . . . . . . . . 29
III. Improving the Applicability of Workload Control: Addressing Re-
search Questions 33
3. Workload Control Release Mechanisms: From Practice Back to Theory Building 35
3.1. Introduction . . . . . . . . . . . . . . . . . . . . . . . . . . . . . . . . . . . . . . . 35
3.2. Literature Review . . . . . . . . . . . . . . . . . . . . . . . . . . . . . . . . . . . . 37
3.2.1. Modelling Job Size Variation . . . . . . . . . . . . . . . . . . . . . . . . . . 37
3.2.2. The Impact of Processing Times on Two Aspects of Order Release Mechanisms 39
3.2.3. Assessment of the Literature . . . . . . . . . . . . . . . . . . . . . . . . . . 40
vii
3.3. Methodology . . . . . . . . . . . . . . . . . . . . . . . . . . . . . . . . . . . . . . 41
3.3.1. Empirical Grounding for the Study . . . . . . . . . . . . . . . . . . . . . . 41
3.3.2. Research Questions . . . . . . . . . . . . . . . . . . . . . . . . . . . . . . . 41
3.3.3. Iterative Approach to Theory Building . . . . . . . . . . . . . . . . . . . . 42
3.4. Simulation Model . . . . . . . . . . . . . . . . . . . . . . . . . . . . . . . . . . . . 42
3.4.1. Shop Characteristics . . . . . . . . . . . . . . . . . . . . . . . . . . . . . . 42
3.4.2. Release Mechanisms . . . . . . . . . . . . . . . . . . . . . . . . . . . . . . 43
3.4.3. Job Characteristics and Due Date Setting Procedure . . . . . . . . . . . . 44
3.4.4. Job Size . . . . . . . . . . . . . . . . . . . . . . . . . . . . . . . . . . . . . 45
3.4.5. Experimental Design . . . . . . . . . . . . . . . . . . . . . . . . . . . . . . 45
3.5. Results . . . . . . . . . . . . . . . . . . . . . . . . . . . . . . . . . . . . . . . . . . 47
3.5.1. Results for the Standard Scenario . . . . . . . . . . . . . . . . . . . . . . . 47
3.5.2. Results Based on Di�erent Load Capacities for Small and Large Jobs . . . 48
3.5.3. Results Based on Prioritization Methods . . . . . . . . . . . . . . . . . . . 49
3.5.4. Results Based on Allowing the Workload Norm to be Exceeded . . . . . . 52
3.5.5. Results for the Load Correction Approach . . . . . . . . . . . . . . . . . . 53
3.5.6. Discussion of Results . . . . . . . . . . . . . . . . . . . . . . . . . . . . . . 53
3.6. Handling Rush Orders . . . . . . . . . . . . . . . . . . . . . . . . . . . . . . . . . 54
3.7. Conclusion . . . . . . . . . . . . . . . . . . . . . . . . . . . . . . . . . . . . . . . . 56
4. Optimising Workload Norms: The In�uence of Shop Floor Characteristics on Set-
ting Workload Norms for the Workload Control Concept 59
4.1. Introduction . . . . . . . . . . . . . . . . . . . . . . . . . . . . . . . . . . . . . . . 59
4.2. Literature Review . . . . . . . . . . . . . . . . . . . . . . . . . . . . . . . . . . . . 61
4.2.1. Workload Norm Setting . . . . . . . . . . . . . . . . . . . . . . . . . . . . 61
4.2.2. Flow Characteristics and Routing Length . . . . . . . . . . . . . . . . . . . 63
4.2.3. Assessment of the Literature . . . . . . . . . . . . . . . . . . . . . . . . . . 63
4.3. Simulation Model . . . . . . . . . . . . . . . . . . . . . . . . . . . . . . . . . . . . 64
4.3.1. Overview of Shop Characteristics . . . . . . . . . . . . . . . . . . . . . . . 64
4.3.2. Flow Characteristics . . . . . . . . . . . . . . . . . . . . . . . . . . . . . . 64
4.3.3. Release Mechanisms . . . . . . . . . . . . . . . . . . . . . . . . . . . . . . 65
4.3.4. Job Characteristics and Due Date Setting Procedure . . . . . . . . . . . . 67
4.3.5. Optimisation Software . . . . . . . . . . . . . . . . . . . . . . . . . . . . . 69
4.3.6. Experimental Design . . . . . . . . . . . . . . . . . . . . . . . . . . . . . . 70
4.4. Results . . . . . . . . . . . . . . . . . . . . . . . . . . . . . . . . . . . . . . . . . . 71
4.4.1. Norm Setting for the Classical Aggregate Load Method (B) . . . . . . . . . 71
4.4.2. Norm Setting for the Corrected Aggregate Load Method (B') . . . . . . . . 74
4.4.3. Determining the Workload Norms in Practice . . . . . . . . . . . . . . . . 75
4.4.4. The In�uence of Flow Characteristics and the Routing Length on Performance 76
4.4.5. Discussion of Results . . . . . . . . . . . . . . . . . . . . . . . . . . . . . . 77
4.5. Conclusion . . . . . . . . . . . . . . . . . . . . . . . . . . . . . . . . . . . . . . . . 77
Contents
5. Improving the Applicability of Workload Control: The In�uence of Sequence De-
pendent Set-Up Times on Workload Controlled Job Shops 81
5.1. Introduction . . . . . . . . . . . . . . . . . . . . . . . . . . . . . . . . . . . . . . . 81
5.2. Literature Review . . . . . . . . . . . . . . . . . . . . . . . . . . . . . . . . . . . . 83
5.2.1. Set-up Times in Job Shop Research . . . . . . . . . . . . . . . . . . . . . . 83
5.2.2. Set-up Times in WLC Controlled Job Shops . . . . . . . . . . . . . . . . . 84
5.2.3. Assessment of the Literature . . . . . . . . . . . . . . . . . . . . . . . . . . 84
5.3. Simulation Model . . . . . . . . . . . . . . . . . . . . . . . . . . . . . . . . . . . . 85
5.3.1. Shop Characteristics . . . . . . . . . . . . . . . . . . . . . . . . . . . . . . 85
5.3.2. Order Release . . . . . . . . . . . . . . . . . . . . . . . . . . . . . . . . . . 85
5.3.3. Dispatching . . . . . . . . . . . . . . . . . . . . . . . . . . . . . . . . . . . 86
5.3.4. Job Characteristics and Due Date Setting Procedure . . . . . . . . . . . . 87
5.3.5. Experimental Design . . . . . . . . . . . . . . . . . . . . . . . . . . . . . . 89
5.4. Results . . . . . . . . . . . . . . . . . . . . . . . . . . . . . . . . . . . . . . . . . . 90
5.4.1. The Performance of Dispatching Rules - An Assessment . . . . . . . . . . . 90
5.4.2. The In�uence of Controlled Order Release on the Dispatching Rule . . . . 91
5.4.3. Discussion of Results . . . . . . . . . . . . . . . . . . . . . . . . . . . . . . 93
5.5. Conclusion . . . . . . . . . . . . . . . . . . . . . . . . . . . . . . . . . . . . . . . . 94
IV. Re(de)�ning the Workload Control Concept 95
6. Workload Control and Order Release: A Lean Solution for Make-To-Order Compa-
nies 97
6.1. Introduction . . . . . . . . . . . . . . . . . . . . . . . . . . . . . . . . . . . . . . . 97
6.2. Literature Review . . . . . . . . . . . . . . . . . . . . . . . . . . . . . . . . . . . . 99
6.2.1. WLC Order Release Mechanisms . . . . . . . . . . . . . . . . . . . . . . . 99
6.2.2. Re�ning LUMS OR in Light of Advances in the WLC Literature . . . . . . 102
6.2.3. Assessment of the Literature . . . . . . . . . . . . . . . . . . . . . . . . . . 103
6.3. Simulation Model . . . . . . . . . . . . . . . . . . . . . . . . . . . . . . . . . . . . 104
6.3.1. Overview of Shop Characteristics . . . . . . . . . . . . . . . . . . . . . . . 104
6.3.2. Order Release Mechanisms . . . . . . . . . . . . . . . . . . . . . . . . . . . 104
6.3.3. Shop Floor Dispatching Rules . . . . . . . . . . . . . . . . . . . . . . . . . 104
6.3.4. Job Characteristics and Due Date Setting Procedure . . . . . . . . . . . . 105
6.3.5. Experimental Design . . . . . . . . . . . . . . . . . . . . . . . . . . . . . . 105
6.4. Results . . . . . . . . . . . . . . . . . . . . . . . . . . . . . . . . . . . . . . . . . . 106
6.4.1. Summary of Order Release Method Performance under Di�erent Flow Di-
rections . . . . . . . . . . . . . . . . . . . . . . . . . . . . . . . . . . . . . 107
6.4.2. Sensitivity Analysis: In�uence of Flow Direction on the Performance of
Release Methods . . . . . . . . . . . . . . . . . . . . . . . . . . . . . . . . 109
6.4.3. The Key to Performance Improvements - Controlling Work Centre Idleness 114
ix
6.4.4. Discussion: Overall Comparison of Results . . . . . . . . . . . . . . . . . . 115
6.5. Implications for Research and Practice . . . . . . . . . . . . . . . . . . . . . . . . 116
6.6. Conclusion . . . . . . . . . . . . . . . . . . . . . . . . . . . . . . . . . . . . . . . . 117
7. Controlled Order Release: A Performance Assessment in Job Shops with Sequence
Dependent Set-up Times 119
7.1. Introduction . . . . . . . . . . . . . . . . . . . . . . . . . . . . . . . . . . . . . . . 119
7.2. Literature Review . . . . . . . . . . . . . . . . . . . . . . . . . . . . . . . . . . . . 121
7.2.1. Order Release . . . . . . . . . . . . . . . . . . . . . . . . . . . . . . . . . . 121
7.2.2. Dispatching Literature Concerned with Sequence Dependent Set-up Times
in Job Shops . . . . . . . . . . . . . . . . . . . . . . . . . . . . . . . . . . 123
7.2.3. Workload Control Literature Concerned with Sequence Dependent Set-up
Times . . . . . . . . . . . . . . . . . . . . . . . . . . . . . . . . . . . . . . 124
7.2.4. Assessment of the Literature . . . . . . . . . . . . . . . . . . . . . . . . . . 125
7.3. Simulation Model . . . . . . . . . . . . . . . . . . . . . . . . . . . . . . . . . . . . 125
7.3.1. Overview of Shop Characteristics . . . . . . . . . . . . . . . . . . . . . . . 125
7.3.2. Order Release Mechanisms . . . . . . . . . . . . . . . . . . . . . . . . . . . 126
7.3.3. Shop Floor Dispatching Rules . . . . . . . . . . . . . . . . . . . . . . . . . 126
7.3.4. Job Characteristics and Due Date Setting Procedure . . . . . . . . . . . . 127
7.3.5. Experimental Design . . . . . . . . . . . . . . . . . . . . . . . . . . . . . . 128
7.4. Results . . . . . . . . . . . . . . . . . . . . . . . . . . . . . . . . . . . . . . . . . . 129
7.4.1. The Performance of Order Release in Job Shops with Sequence Dependent
Set-up Times . . . . . . . . . . . . . . . . . . . . . . . . . . . . . . . . . . 129
7.4.2. Re�ning the Release Methods and Analyzing the Impact on Performance . 131
7.4.3. Discussion of Results . . . . . . . . . . . . . . . . . . . . . . . . . . . . . . 135
7.5. Implications for WLC in Practice . . . . . . . . . . . . . . . . . . . . . . . . . . . 137
7.6. Conclusion . . . . . . . . . . . . . . . . . . . . . . . . . . . . . . . . . . . . . . . . 138
8. Workload Control and Customer Enquiry Management: The Key to Lead Time
Control and Customer Service 139
8.1. Introduction . . . . . . . . . . . . . . . . . . . . . . . . . . . . . . . . . . . . . . . 139
8.2. Literature Review . . . . . . . . . . . . . . . . . . . . . . . . . . . . . . . . . . . . 141
8.2.1. Strike Rate Analysis . . . . . . . . . . . . . . . . . . . . . . . . . . . . . . 142
8.2.2. Aggregate Production Planning - DD Setting & Capacity Control . . . . . 143
8.2.3. Assessment of the Literature . . . . . . . . . . . . . . . . . . . . . . . . . . 148
8.3. Simulation Model . . . . . . . . . . . . . . . . . . . . . . . . . . . . . . . . . . . . 148
8.3.1. Shop Characteristics . . . . . . . . . . . . . . . . . . . . . . . . . . . . . . 148
8.3.2. Workload Control . . . . . . . . . . . . . . . . . . . . . . . . . . . . . . . . 149
8.3.3. Job Characteristics . . . . . . . . . . . . . . . . . . . . . . . . . . . . . . . 152
8.3.4. Experimental Design and Performance Measures . . . . . . . . . . . . . . . 152
Contents
8.4. Results . . . . . . . . . . . . . . . . . . . . . . . . . . . . . . . . . . . . . . . . . . 154
8.4.1. Performance of DD Setting Rules under Di�erent Strike Rates . . . . . . . 155
8.4.2. Performance of DD setting Rules under Di�erent Percentages of Requested
DDs . . . . . . . . . . . . . . . . . . . . . . . . . . . . . . . . . . . . . . . 157
8.4.3. Performance of WLC as a Comprehensive Concept - CEM and OR . . . . 160
8.4.4. Discussion of Results . . . . . . . . . . . . . . . . . . . . . . . . . . . . . . 162
8.5. Conclusion . . . . . . . . . . . . . . . . . . . . . . . . . . . . . . . . . . . . . . . . 163
8.5.1. Practical Implications . . . . . . . . . . . . . . . . . . . . . . . . . . . . . 163
8.5.2. Future Research Implications . . . . . . . . . . . . . . . . . . . . . . . . . 164
9. The Application of Workload Control in Assembly Job Shops: An Assessment by
Simulation 165
9.1. Introduction . . . . . . . . . . . . . . . . . . . . . . . . . . . . . . . . . . . . . . . 165
9.2. Literature Review . . . . . . . . . . . . . . . . . . . . . . . . . . . . . . . . . . . . 167
9.2.1. DD Setting in Assembly Job Shops . . . . . . . . . . . . . . . . . . . . . . 167
9.2.2. Controlled Order Release in Assembly Job Shops . . . . . . . . . . . . . . 168
9.2.3. Dispatching in Assembly Job Shops . . . . . . . . . . . . . . . . . . . . . . 169
9.2.4. Assessment of the Literature . . . . . . . . . . . . . . . . . . . . . . . . . . 169
9.3. Simulation Model . . . . . . . . . . . . . . . . . . . . . . . . . . . . . . . . . . . . 170
9.3.1. Overview of Shop Characteristics . . . . . . . . . . . . . . . . . . . . . . . 170
9.3.2. Due Date Setting Policies . . . . . . . . . . . . . . . . . . . . . . . . . . . 170
9.3.3. Co-ordination Policies . . . . . . . . . . . . . . . . . . . . . . . . . . . . . 172
9.3.4. Order Release and Dispatching . . . . . . . . . . . . . . . . . . . . . . . . 173
9.3.5. Job Characteristics . . . . . . . . . . . . . . . . . . . . . . . . . . . . . . . 175
9.3.6. Experimental Design & Performance Measures . . . . . . . . . . . . . . . . 175
9.4. Results . . . . . . . . . . . . . . . . . . . . . . . . . . . . . . . . . . . . . . . . . . 178
9.4.1. Performance Assessment with 100% of DDs Determined by the Company . 178
9.4.2. Performance Assessment with Varying Percentages of DDs Set by the Cus-
tomer . . . . . . . . . . . . . . . . . . . . . . . . . . . . . . . . . . . . . . 180
9.4.3. Discussion of Results . . . . . . . . . . . . . . . . . . . . . . . . . . . . . . 183
9.5. Conclusion . . . . . . . . . . . . . . . . . . . . . . . . . . . . . . . . . . . . . . . . 184
10.Development and Design of Workload Control Based Decision Support Systems 185
10.1. Introduction . . . . . . . . . . . . . . . . . . . . . . . . . . . . . . . . . . . . . . . 185
10.2. Literature Review . . . . . . . . . . . . . . . . . . . . . . . . . . . . . . . . . . . . 186
10.2.1. Structure Speci�c Design: Goals, Means and Tasks within the WLC Concept186
10.2.2. Graphical Design: Guidelines for the Human-Machine Interface of the DSS 189
10.2.3. Assessment of the Literature . . . . . . . . . . . . . . . . . . . . . . . . . . 190
xi
V. Conclusion and Future Research 193
11.Conclusion 195
11.1. Summary of Results . . . . . . . . . . . . . . . . . . . . . . . . . . . . . . . . . . 195
11.2. Final Conclusions . . . . . . . . . . . . . . . . . . . . . . . . . . . . . . . . . . . . 198
11.3. Future Research and Acknowledgments . . . . . . . . . . . . . . . . . . . . . . . . 199
VI. Appendix 201
A. Literature Review 203
A.1. Citation/Co-Citation Analysis . . . . . . . . . . . . . . . . . . . . . . . . . . . . . 203
A.1.1. Citation/Co-Citation Analysis - Methodology . . . . . . . . . . . . . . . . 204
A.1.2. Citation Analysis . . . . . . . . . . . . . . . . . . . . . . . . . . . . . . . . 205
A.1.3. Co-Citation Analysis . . . . . . . . . . . . . . . . . . . . . . . . . . . . . . 207
A.1.4. Summary of Empirical Studies . . . . . . . . . . . . . . . . . . . . . . . . . 213
B. WLC Database 215
C. Simulation Model 231
C.1. Simulation Model . . . . . . . . . . . . . . . . . . . . . . . . . . . . . . . . . . . . 231
C.2. Evaluation of Results . . . . . . . . . . . . . . . . . . . . . . . . . . . . . . . . . . 242
D. References 245
List of Tables
1. Summary of Conceptual WLC Research (1980-2009) . . . . . . . . . . . . . . . . . 18
2. Summary of Analytical WLC Research (1980-2009) . . . . . . . . . . . . . . . . . 20
3. Summary of Empirical WLC Research (1980-2009) . . . . . . . . . . . . . . . . . 23
4. Summary of Simulation-Based WLC Research (1980-2009) . . . . . . . . . . . . . 27
5. Summary of Simulation Properties . . . . . . . . . . . . . . . . . . . . . . . . . . 28
6. Summary of Simulated Shop Floor Characteristics . . . . . . . . . . . . . . . . . . 30
7. Sample of Previous Approaches to Modelling Processing Times in WLC Simulation
Studies . . . . . . . . . . . . . . . . . . . . . . . . . . . . . . . . . . . . . . . . . . 38
8. Summary of Simulated Shop Characteristics . . . . . . . . . . . . . . . . . . . . . 44
9. Summary of Simulated Job Characteristics . . . . . . . . . . . . . . . . . . . . . . 45
10. Routing Matrix: (a) 50% Directed Routing; (b) General Flow Shop or 100% Di-
rected Routeing (Oosterman et al., 2000) . . . . . . . . . . . . . . . . . . . . . . . 66
11. Summary of Simulated Shop Characteristics . . . . . . . . . . . . . . . . . . . . . 68
12. Summary of Simulated Job Characteristics . . . . . . . . . . . . . . . . . . . . . . 68
13. Optimisation Results for the Classical Aggregate Load Approach (B) . . . . . . . 72
14. Optimisation Results for the Corrected Aggregate Load Approach (B') . . . . . . 75
15. Set-up Time Matrix (adapted from White & Wilson, 1977) . . . . . . . . . . . . . 88
16. Summary of Simulated Shop Characteristics . . . . . . . . . . . . . . . . . . . . . 89
17. Summary of Simulated Job Characteristics . . . . . . . . . . . . . . . . . . . . . . 89
18. Summary of Shop Floor Performance Measures under Di�erent Dispatching Policies 90
19. Summary of Simulated Shop Characteristics . . . . . . . . . . . . . . . . . . . . . 105
20. Summary of Simulated Job Characteristics . . . . . . . . . . . . . . . . . . . . . . 106
21. Summary of Experimental Factors . . . . . . . . . . . . . . . . . . . . . . . . . . . 106
22. Results for the Order Release Methods under Di�erent Flow Directions . . . . . . 108
23. Mean Tardiness Results according to Job Size . . . . . . . . . . . . . . . . . . . . 110
24. Matrix of Operation Throughput Times . . . . . . . . . . . . . . . . . . . . . . . 111
25. Matrix of Time-to-Release (Pool Time) . . . . . . . . . . . . . . . . . . . . . . . . 111
26. Set-up Time Matrix (Adapted from White & Wilson, 1977) . . . . . . . . . . . . . 127
27. Summary of Simulated Shop Characteristics . . . . . . . . . . . . . . . . . . . . . 128
28. Summary of Simulated Job Characteristics . . . . . . . . . . . . . . . . . . . . . . 128
29. Summary of Experimental Factors . . . . . . . . . . . . . . . . . . . . . . . . . . . 129
30. Performance of Release Methods . . . . . . . . . . . . . . . . . . . . . . . . . . . . 130
31. Performance of Re�ned Release Methods . . . . . . . . . . . . . . . . . . . . . . . 132
32. Operation Throughput Times, Average Set-Up Time, and Time-To-Release (Pool
Time) According to Routing Length (RL) . . . . . . . . . . . . . . . . . . . . . . 133
33. Summary of DD setting, Release and Dispatching Rules Applied in this Study . . 153
34. Summary of Simulated Shop Characteristics . . . . . . . . . . . . . . . . . . . . . 154
35. Summary of Simulated Job Characteristics . . . . . . . . . . . . . . . . . . . . . . 154
36. Summary of Experimental Factors . . . . . . . . . . . . . . . . . . . . . . . . . . . 155
37. Performance Comparison of DD Setting Rules . . . . . . . . . . . . . . . . . . . . 156
38. Results for BeA under Di�erent Percentages of DDs Given by the Customer . . . 158
39. Results for BdA under Di�erent Percentages of DDs Given by the Customer . . . 158
40. Results for WIQ under Di�erent Percentages of DDs Given by the Customer . . . 159
41. Results for WLC as a Comprehensive Concept . . . . . . . . . . . . . . . . . . . . 161
42. Summary of Due Date Setting Policies, Co-ordination Policies, Release Methods
and Dispatching Rule Applied in this Study . . . . . . . . . . . . . . . . . . . . . 176
43. Summary of Simulated Shop Characteristics . . . . . . . . . . . . . . . . . . . . . 177
44. Summary of Simulated Job Characteristics . . . . . . . . . . . . . . . . . . . . . . 177
45. Experimental Setting: Due Date Setting Policy, Co-ordination Policy and Release
Method . . . . . . . . . . . . . . . . . . . . . . . . . . . . . . . . . . . . . . . . . 177
46. Performance Results - 100% of Due Dates Determined by the Company . . . . . . 178
47. Performance Results for Due Date Setting Policy I (In�nite Loading) . . . . . . . 181
48. Performance Results for Due Date Setting Policy II (WLC) . . . . . . . . . . . . . 182
49. Summary of Research Objectives in Empirical Studies (1980-2009) . . . . . . . . . 188
50. Results of the Citation Analysis . . . . . . . . . . . . . . . . . . . . . . . . . . . . 206
51. Results of the Co-Citation Analysis . . . . . . . . . . . . . . . . . . . . . . . . . . 208
52. Summary of Empirical Studies . . . . . . . . . . . . . . . . . . . . . . . . . . . . . 214
53. Articles (2000-2009) . . . . . . . . . . . . . . . . . . . . . . . . . . . . . . . . . . . 215
54. Articles (1990-1999) . . . . . . . . . . . . . . . . . . . . . . . . . . . . . . . . . . . 219
55. Articles (1990-1999) . . . . . . . . . . . . . . . . . . . . . . . . . . . . . . . . . . . 227
List of Figures
1. WLC Control Stages and Hierarchical Workload Management . . . . . . . . . . . 4
2. (a) ORR and ORR WLC (Land & Gaalman, 1996a); (b) LUMS Approach to WLC 14
3. Theory-Practice Iterative Research Cycle . . . . . . . . . . . . . . . . . . . . . . . 43
4. Job Size Distribution: Exponential vs Erlang . . . . . . . . . . . . . . . . . . . . . 46
5. Performance of Approach B under Standard Scenario (2-Erlang) . . . . . . . . . . 47
6. Performance of Approach B under Standard Scenario (Exponential) . . . . . . . . 48
7. Conversion of Priority According to Routing Length . . . . . . . . . . . . . . . . . 50
8. Performance of Approach B with Prioritisation (2-Erlang) . . . . . . . . . . . . . 51
9. Performance of Approach B with Prioritisation (Exponential) . . . . . . . . . . . 51
10. Performance of Approach B' with Prioritisation (2-Erlang) . . . . . . . . . . . . . 52
11. Performance of Approach B' with Prioritisation (Exponential) . . . . . . . . . . . 52
12. Performance of Approach B for Rush Orders (2-Erlang) . . . . . . . . . . . . . . . 55
13. Performance of Approach B for Rush Orders (Exponential) . . . . . . . . . . . . . 56
14. OptQuest c⃝ - Optimisation Process . . . . . . . . . . . . . . . . . . . . . . . . . . 69
15. Evolution of the Objective Function . . . . . . . . . . . . . . . . . . . . . . . . . . 71
16. Relationship Between the Maximum Routing Length and the Work Load Norm . 73
17. Results for the Corrected Aggregate Load Approach (B') and the Classical Aggre-
gate Load Approach (B) with six Work Centres . . . . . . . . . . . . . . . . . . . 74
18. Inter-Relationship between: (a) Throughput & Percentage Tardy Performance; (b)
Throughput & Mean Tardiness Performance; (c) Throughput & Throughput Time
Performance; and (d) Throughput & Utilisation Rate . . . . . . . . . . . . . . . . 91
19. Performance Measure for WLC Release with a Mean Set-up Time of 0.1 Time
Units: (a) Percentage Tardy vs. Throughput Time & (b) Set-up Time Reduction
vs. Throughput Time . . . . . . . . . . . . . . . . . . . . . . . . . . . . . . . . . . 92
20. Performance Measure for WLC Release with a Mean Set-up Time of 0.2 Time
Units: (a) Percentage Tardy vs. Throughput Time & (b) Set-up Time Reduction
vs. Throughput Time . . . . . . . . . . . . . . . . . . . . . . . . . . . . . . . . . . 92
21. Performance Measure for WLC Release with a Mean Set-up Time of 0.3 Time
Units: (a) Percentage Tardy vs. Throughput Time & (b) Set-up Time Reduction
vs. Throughput Time . . . . . . . . . . . . . . . . . . . . . . . . . . . . . . . . . . 93
22. Performance of Small and Large Jobs (WCPRD) . . . . . . . . . . . . . . . . . . . 110
23. Performance of Small and Large Jobs (LUMS OR) . . . . . . . . . . . . . . . . . . 112
24. Performance of Small and Large Jobs (SLAR) . . . . . . . . . . . . . . . . . . . . 113
25. Lateness Distribution: (a) SLAR; (b) LUMS OR . . . . . . . . . . . . . . . . . . . 114
26. Percentage of Triggered Jobs (LUMS OR) . . . . . . . . . . . . . . . . . . . . . . 114
27. Distribution of Operation Throughput Times (WCPRD vs. WCPRD*): (a) 1st
Routing Step; (b) 3rd Routing Step . . . . . . . . . . . . . . . . . . . . . . . . . . 134
28. Performance Comparison of Release Methods . . . . . . . . . . . . . . . . . . . . . 136
29. In�uence of Mean Set-up Time: (a) on Throughput Time Performance; (b) on
Percentage Tardy Performance . . . . . . . . . . . . . . . . . . . . . . . . . . . . . 137
30. Strike Rate Analysis: (a) Identi�cation of Market Segments (Kingsman et al., 1996);
(b) Strike Rate Matrix (Kingsman et al., 1993) . . . . . . . . . . . . . . . . . . . . 143
31. Operation Completion Date and Due Date Setting Methodologies: (a) Forward
Finite Loading; (b) Forward Finite Loading Considering Backlog; (c) Bertrand
Approach; and, (d) Bechte Approach . . . . . . . . . . . . . . . . . . . . . . . . . 146
32. Summary of WLC Control Stages and Hierarchical Workload Management . . . . 152
33. Distribution of Flow Time Allowance: (a) WIQ; (b) BdA . . . . . . . . . . . . . . 160
34. Distribution of Internal Lateness . . . . . . . . . . . . . . . . . . . . . . . . . . . . 162
35. Workload Control Due Date Setting Methodology (Bertrand Approach) . . . . . . 172
36. Summary of Co-ordination Policies . . . . . . . . . . . . . . . . . . . . . . . . . . 174
37. Distribution of Internal Lateness . . . . . . . . . . . . . . . . . . . . . . . . . . . . 183
38. Workload Control . . . . . . . . . . . . . . . . . . . . . . . . . . . . . . . . . . . . 198
39. Articles Published per Journal . . . . . . . . . . . . . . . . . . . . . . . . . . . . . 203
40. Articles Published per University (Country) . . . . . . . . . . . . . . . . . . . . . 204
41. Average Number of Citations and Co-Citations per Article per Year . . . . . . . . 207
42. Knowledge Structure in the 1990s . . . . . . . . . . . . . . . . . . . . . . . . . . . 210
43. Knowledge Structure in the 2000s . . . . . . . . . . . . . . . . . . . . . . . . . . . 211
44. Knowledge Structure from 1980 to 2009 . . . . . . . . . . . . . . . . . . . . . . . . 212
Part I.
Introduction
Table of Contents
1. Introduction 3
1.1. Background . . . . . . . . . . . . . . . . . . . . . . . . . . . . . . . . . . . . . . 3
1.2. Objectives . . . . . . . . . . . . . . . . . . . . . . . . . . . . . . . . . . . . . . . 4
1.3. Research Methodology . . . . . . . . . . . . . . . . . . . . . . . . . . . . . . . . 5
1.4. Thesis Outline . . . . . . . . . . . . . . . . . . . . . . . . . . . . . . . . . . . . 5

1. Introduction
1 Introduction
1.1 Background
Most small and medium sized Make-to-Order (MTO) companies are well aware that they have to
improve their way of production to eventually reduce lead times and the fraction of tardy jobs,
however, they simply do not know how. They are left alone with the almost impossible task to
stay competitive in the world of Time Based Competition (TBC; see e.g., Stalk & Hout, 1990) and
Quick Response Manufacturing (QRM; see e.g. Suri, 1999) as the majority of research focuses on
PPC solutions for large enterprises and repetitive production environments (such as Manufacturing
Resource Planning and Constant WIP). Moreover, recent research has called for a contingency-
based approach to operations management (Sousa & Voss, 2008), including to PPC (Tenhiälä,
2010). Tenhiälä (2010) suggested that the successful implementation of a Production Planning
and Control (PPC) concept is a�ected by its suitability to a given production environment, arguing
that there is a need to develop approaches that are contingent on key company characteristics,
including production strategy and process type. Workload Control (WLC) is one of the few
approaches, primarily designed for the MTO sector where job shop con�gurations are common.
Out of the literature, WLC can be divided into three control levels which integrate production &
sales into a hierarchical system of workloads (Tatsiopoulos & Kingsman, 1983; Kingsman et al.,
1989; Kingsman et al., 1993; Kingsman, 2000). The lowest level of workload control is dispatching,
where short-term decisions take place. The central (or middle) level of control is Order Release
(OR) which decouples the shop �oor from the upper planning level using a pre-shop pool of
orders from which orders are released to meet DDs and maintain WIP at a stable level. Here,
the inventory bu�er is created and controlled. Finally, the highest level of control is Customer
Enquiry Management (CEM), covering all activities from a Request For Quotation (RFQ) up to
order con�rmation. This includes determining prices and planning both lead times & capacities.
Figure 1 summarizes the classical structure of the WLC concept and its three levels of control:
CEM, OR and Dispatching. In addition the corresponding hierarchy of workloads is given on
the right. The hierarchy consists of: the shop �oor workload (or WIP); the planned workload
(all accepted orders); and, the total workload (the accepted load plus a percentage of customer
enquiries based on order winning history).
The control decisions managed by each control level can be summarized as follows:
∙ Customer Enquiry Management (CEM): Setting DD and prices for repetitive manufacturer
follows standard values which are easy to set. On the contrary the high customization of
MTOs requires a DD and price to be set for each order within a competitive market. The
CEM within the WLC concept supports managers in practice to set short, feasible and
competitive DDs. It incorporates strike rate analysis, i.e., analysis of the probability of
winning a tender at a given price and lead time based on order winning history (see e.g.,
Kingsman et al., 1996; Kingsman & Mercer, 1997), and capacity planning.
3
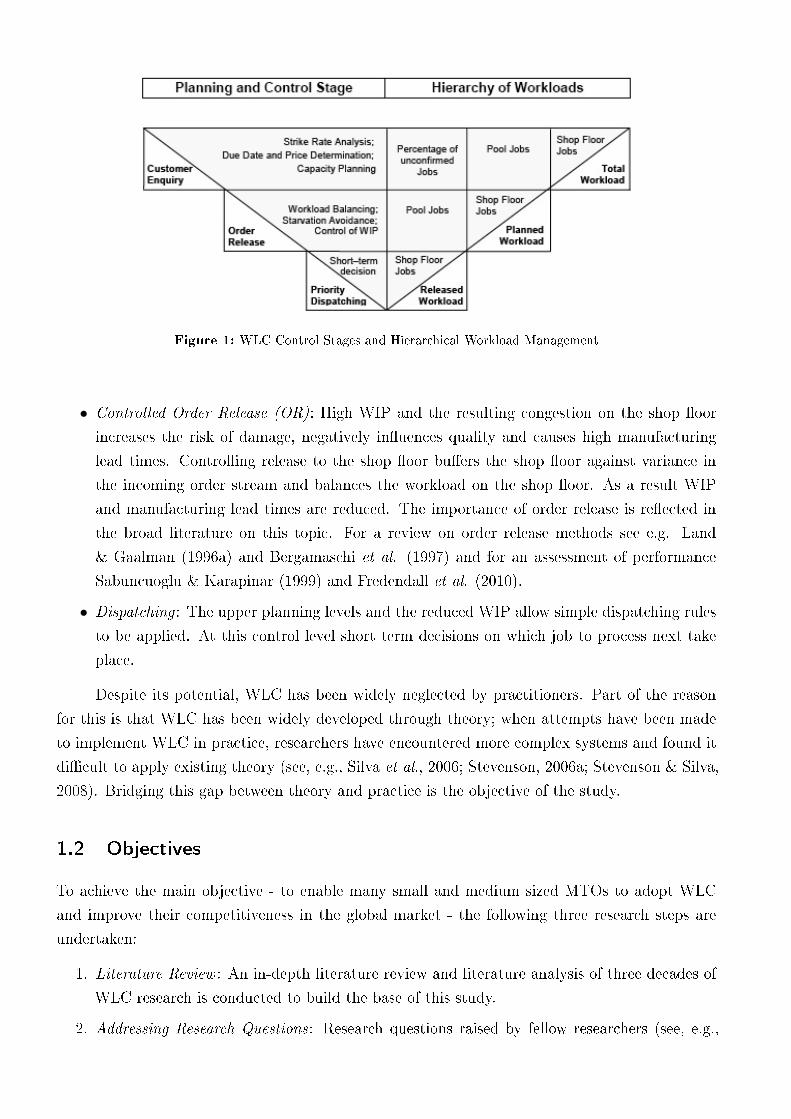
Figure 1: WLC Control Stages and Hierarchical Workload Management
∙ Controlled Order Release (OR): High WIP and the resulting congestion on the shop �oor
increases the risk of damage, negatively in�uences quality and causes high manufacturing
lead times. Controlling release to the shop �oor bu�ers the shop �oor against variance in
the incoming order stream and balances the workload on the shop �oor. As a result WIP
and manufacturing lead times are reduced. The importance of order release is re�ected in
the broad literature on this topic. For a review on order release methods see e.g. Land
& Gaalman (1996a) and Bergamaschi et al. (1997) and for an assessment of performance
Sabuncuoglu & Karapinar (1999) and Fredendall et al. (2010).
∙ Dispatching : The upper planning levels and the reduced WIP allow simple dispatching rules
to be applied. At this control level short term decisions on which job to process next take
place.
Despite its potential, WLC has been widely neglected by practitioners. Part of the reason
for this is that WLC has been widely developed through theory; when attempts have been made
to implement WLC in practice, researchers have encountered more complex systems and found it
di�cult to apply existing theory (see, e.g., Silva et al., 2006; Stevenson, 2006a; Stevenson & Silva,
2008). Bridging this gap between theory and practice is the objective of the study.
1.2 Objectives
To achieve the main objective - to enable many small and medium sized MTOs to adopt WLC
and improve their competitiveness in the global market - the following three research steps are
undertaken:
1. Literature Review : An in-depth literature review and literature analysis of three decades of
WLC research is conducted to build the base of this study.
2. Addressing Research Questions : Research questions raised by fellow researchers (see, e.g.,
1. Introduction
Silva et al., 2006; Hendry et al., 2008; Stevenson & Silva, 2008) during the implementation
process of WLC are addressed and the WLC concept is re�ned. The issues addressed include:
accommodating the requirements of large jobs, setting of adequate parameters for the release
method and sequence dependent set-up times.
3. Re(de)�ning the Concept : The performance of the di�erent parts of the concept presented
in the literature is assessed. The best performing DD setting rule and release method
to be incorporated into the design of the concept are determined and the concept re�ned
accordingly. Then the performance of the comprehensive concept in its entirety in job
shops and assembly job shops is assessed to build the con�dence for future implementations.
Finally, guidelines for the development and design of a WLC based Decision Support System
(DSS) are outlined.
The main structure of the thesis is in line with these research steps (Part II to IV respec-
tively). Each section addresses one speci�c issue amongst the main research steps and can be read
independently from the others.
1.3 Research Methodology
This study bridges the gap between theory and practice from a theoretical point of view. The main
research methodology applied in this study is simulation. Simulation based research is typically
applied if the model or problem is too complex to be solved by mathematical analysis (Bertrand
& Fransoo, 2002) e.g. if multiple or interacting processes are involved or non-linear e�ects such
as feedback loops and thresholds exist (Davis & Eisenhardt, 2007). It bridges the gap between
analytical research which is restricted by mathematical tractability and empirical research which is
often constrained by limited data. It is therefore one of the most important research approaches for
WLC research considering that non-linear e�ects, such as feedback from the shop �oor, represent
one of the core elements of the concept which makes analytical model building often unfeasible.
1.4 Thesis Outline
This thesis is structured around the research issues and the main research steps discussed in Sec-
tion 1.2 above as follows:
Part II: Literature Review
Literature Review (Section 2): The WLC concept has received much attention in the past
three decades; however, a comprehensive literature review has not been presented. In response, this
section provides a systematic review of the conceptual, analytical, empirical and simulation-based
WLC literature. It explores the evolution of WLC research, determines the current state-of-the-art
and identi�es key areas for further study.
5
Part III: Improving the Applicability of Workload Control: Addressing Re-
search Questions
Job Size Variation (Section 3): Much WLC research has focussed on the order release
stage but failed to address practical considerations that impact its application. Order release
mechanisms have been developed through simulations that neglect job size variation e�ects while
empirical evidence suggests groups of small/large jobs are often found in practice. When job sizes
vary, it is di�cult to release all jobs e�ectively - small jobs favour a short period between releases
and a tight workload bounding while large jobs require a longer period between releases and a
slacker workload bounding. Through simulation, the impact of job sizes on overall performance
is explored using all three aggregate load approaches. Options tested include: using distinct load
capacities for small/large jobs and prioritizing based on job size or routing length. These ideas
have also been applied to a second practical problem: how to handle rush orders.
Determination of Workload Norms (Section 4): WLC is a leading PPC solution for small
and medium sized MTO companies. But when WLC is implemented, practitioners �nd it di�cult
to determine suitable workload norms to obtain optimum performance. Theory has provided
some solutions (e.g. based on linear programming) but, to remain optimal, these require the
regular feedback of detailed information from the shop �oor about the status of WIP, and are
therefore often impractical. This section seeks to predict workload norms without such feedback
requirements, analysing the in�uence of shop �oor characteristics on the workload norm. The shop
parameters considered are �ow characteristics (from an undirected pure job shop to a directed
general �ow shop), and the number of possible work centres in the routing of a job (i.e., the
routing length). Using simulation and optimisation software, the workload norm resulting in
optimum performance is determined for each work centre for two aggregate load-oriented WLC
approaches: the classical and corrected load methods.
Sequence Dependent Set-up Times (Section 5): Many simulation studies have demonstrated
that the WLC concept can improve performance in job shops, but positive empirical results are
scarce. One reason is that �eld researchers encounter implementation challenges which the con-
cept has not been developed to handle. A key challenge that has thus far been overlooked is how
sequence dependent set-up times can best be accommodated within the design of the concept.
Through simulation, this section investigates the in�uence of sequence dependent set-up times on
the performance of a workload controlled job shop. It introduces new set-up oriented dispatching
rules and assesses the performance of the best-performing rule in conjunction with controlled order
release.
Part IV: Re(de)fining the Workload Control concept
Controlled Order Release (Section 6): Protecting throughput from variance is the key to
achieving lean. WLC accomplishes this in complex make-to-order job shops by controlling lead
1. Introduction
times, capacity and WIP simultaneously. However, the concept has been dismissed by many
authors who believe its order release mechanism reduces the e�ectiveness of shop �oor dispatching
and increases work centre idleness, thereby also increasing job tardiness results. This section shows
that these problems have been overcome. A WLC order release method known as "LUMS OR"
combines continuous with periodic release, allowing the release of work to be triggered between
periodic releases if a work centre is starving. But, until now, its performance has not been fully
assessed. In response, this section investigates the performance of LUMS OR and compares it
against the best-performing purely periodic and continuous release rules across a range of �ow
directions, from the pure job shop to the general �ow shop.
Controlled Order Release & Sequence Dependent Set-up Times (Section 7): Findings from
recent implementations of WLC have called for researchers to investigate how sequence dependent
set-up times can best be accommodated within the design of the concept. More fundamentally,
other researchers have questioned the practicality of the concept altogether arguing that WLC
order release methods negatively a�ect dispatching rules and thus overall performance, especially
if set-up times are sequence dependent. In response, four of the best-performing release methods
from the literature are compared through simulation in a job shop with sequence dependent set-up
times. Firstly, the four methods are compared without considering set-up requirements at release;
and then, secondly, the methods are re�ned to consider set-up requirements before being compared
against the original methods.
Customer Enquiry Management (Section 8): The ability to quote competitive and realistic
lead times or Due Dates (DDs) is a key priority for many companies, as re�ected in the literature
on Time Based Competition (TBC; see Stalk & Hout, 1990) and Quick Response Manufacturing
(QRM; see Suri, 1999). This is particularly important in the Make-To-Order (MTO) sector where
job speci�cations can vary greatly meaning lead times have to be determined individually for each
order; however, a practical solution for such companies has been missing. This section outlines
such a solution, building on three decades of research into the Workload Control (WLC) concept,
and assesses its performance through simulation. In doing so, existing theory on WLC for customer
enquiry management and order release is consolidated, integrating it into a Production Planning
& Control (PPC) concept which allows lead times to be both short and achievable. It thereby
considers the in�uence of strike rates and di�erent percentages of due dates given by the customer.
For the �rst time, the performance of di�erent WLC DD setting rules, i.e., which �t required and
available capacity over time, and WLC as a comprehensive concept is assessed.
Assembly Job Shops (Section 9): WLC is a unique production planning and control con-
cept developed to suit the needs of small and medium sized make-to-order companies. However,
whereas the e�ectiveness of the concept to improve performance in job shops has long since been
theoretically proven, reports on its successful implementation are limited. One reason is that
practitioners implementing the concept encountered assembly job shops with complex product
structures not addressed by theory which focussed on job shops and simple product structures. In
response, this research bridges the gap between theory and practice by extending the applicability
7
of WLC to assembly job shops. In doing so, the performance of WLC due date setting rules &
release methods in assembly job shops is assessed. Out of the results, the best set of due date
setting policy, policy to co-ordinate the progress of work orders of an assembly order and release
method is determined for accommodating the requirements of assembly orders.
Design Rules (Section 10): While many of the research issues identi�ed that relate to WLC
have now been addressed other broader human-related issues which must be addressed if WLC is
to be implemented successfully in practice have not yet been considered. These are: training and
decision making by users of WLC systems; and, the design of a Decision Support System (DSS)
to support the human user. Therefore, before implementing the re�ned procedure in practice, this
section focuses on these issues.
Part V: Conclusion and Future Research
Conclusion (Section 11): Results and main conclusions are summarized before future re-
search directions are indicated.

Part II.
Literature Review
Table of Contents
2. Three Decades of Workload Control Research: A Systematic Review of the
Literature 11
2.1. Introduction . . . . . . . . . . . . . . . . . . . . . . . . . . . . . . . . . . . . . . 11
2.2. Methodology . . . . . . . . . . . . . . . . . . . . . . . . . . . . . . . . . . . . . 13
2.3. Workload Control (WLC): An Introduction . . . . . . . . . . . . . . . . . . . . 13
2.4. Literature Review and Future Research Directions . . . . . . . . . . . . . . . . 16
2.5. Conclusion . . . . . . . . . . . . . . . . . . . . . . . . . . . . . . . . . . . . . . . 29

2. Three Decades of Workload Control Research: A Systematic Review of the Literature
2 Three Decades of Workload Control Research: A
Systematic Review of the Literature
Published in International Journal of Production Research, in press
Matthias Thürer, Mark Stevenson, and Cristovao Silva
Abstract
The Workload Control (WLC) concept has received much attention in the past three decades; how-
ever, a comprehensive literature review has not been presented. In response, this paper provides
a systematic review of the conceptual, analytical, empirical and simulation-based WLC literature.
It explores the evolution of WLC research, determines the current state-of-the-art and identi�es
key areas for further study. The research �nds that the �eld has evolved substantially. Early
research focused on theoretical development and experimental testing of order release strategies;
order release was then integrated with other planning stages, e.g., the customer enquiry stage,
making the concept more suitable for customised manufacturing and leading to a comprehensive
concept which combines input and output control e�ectively; recent attention has focused on im-
plementing the resulting concept in practice and re�ning theory. While WLC is well placed to
meet the needs of producers of customised products, future research should include: conducting
further action research into how WLC can be e�ectively implemented in practice; studying human
factors that a�ect WLC; and, feeding back empirical �ndings to simulation-based WLC research
to improve the applicability of WLC theory to real-life job shops.
2.1 Introduction
The Workload Control (WLC) concept was developed to overcome the 'lead time syndrome'
(Mather & Plossl, 1978). Job entry is decoupled from release; orders are held back in a pre-
shop pool and input to the shop �oor is regulated in accordance with workload limits or norms.
The objective is to maintain WIP at an optimal level and keep queue lengths in front of work
centres short. The output rate is manipulated by adjusting capacity and it has been shown that
the two control mechanisms complement each other, i.e., input should be regulated in accordance
with the output rate (Kingsman & Hendry, 2002). WLC stabilises WIP and lead times, enabling
production and inventory costs to be reduced and both competitive prices and reliable Due Dates
(DDs) to be quoted. It is considered a leading Production Planning and Control (PPC) solution
for Make-To-Order (MTO) companies, where pricing and DDs have to be determined for each job
and are crucial order winning factors (Kingsman & Hendry, 2002; Stevenson et al., 2005), and
particularly appropriate for Small and Medium sized Enterprises (SMEs) with limited �nancial
resources (Stevenson et al., 2005; Land & Gaalman, 2009).
WLC research has been conducted throughout the last three decades; however, it was not
11
until Zäpfel & Missbauer (1993b) that the term 'WLC' was �rst used to refer to a group of
PPC methods. The authors referred to �PPC system[s] including WLC�, grouping together three
streams of research which seek to control workloads: Order Review and Release (ORR) methods,
largely developed in North America (e.g., Melnyk & Ragatz, 1989; Melnyk et al., 1991; Ahmed
& Fisher, 1992); workload controlling methods building on input/output control (I/OC, from
Plossl & Wight, 1971), largely developed in the UK at Lancaster University (e.g., Tatsiopoulos
& Kingsman, 1983; Hendry & Kingsman 1991a; Hendry & Kingsman, 1993); and, Load Ori-
ented Manufacturing Control (LOMC), largely developed at Hanover University in Germany (e.g.,
Bechte, 1988; Wiendahl et al., 1992; Bechte, 1994). More recently, Land & Gaalman (1996a)
reviewed order release rules that seek to control workloads and integrated these into a comprehen-
sive PPC system, hereafter referred to as 'ORR WLC'. Finally, Hendry et al. (1998) consolidated
the four streams of research (i.e., ORR, I/OC, LOMC, and ORR WLC) under the 'umbrella term'
of 'WLC', designating it a new group of PPC concepts to control queues in job shops. Nowadays,
all four of the concepts referred to above are generally accepted as being part of WLC research.
Elements of WLC research have been referred to in several reviews of a range of PPC
concepts (e.g., Hendry & Kingsman, 1989; Zäpfel & Missbauer, 1993b; Stevenson et al., 2005);
however, these studies are too broad to go into su�cient depth on each concept. Other studies
have attempted to provide an overview of WLC research but have tended to focus on describing the
various ORR mechanisms (e.g., Melnyk & Ragatz, 1988; Wisner, 1995; Bergamaschi et al., 1997)
or comparing them through simulation (e.g., Philipoom et al., 1993; Sabuncuoglu & Karapinar,
1999) and hence do not incorporate all PPC stages within the scope of WLC. Moreover, few
recent reviews of the PPC literature have been presented - most of the aforementioned studies
were published in the 1980s and 1990s, thus recent developments (e.g., since 2000) have not been
considered. It follows that a comprehensive contemporary review is required which focuses only
on WLC and covers all of the PPC stages within its scope.
In response, this paper provides a systematic review of the conceptual, analytical, empirical
and simulation-based WLC literature published between 1980 and 2009, with a particular focus
on the last decade. It consolidates the WLC literature to date, explores the evolution of WLC
research, and identi�es outstanding gaps for future research. Research relating to all of the
concepts above (ORR, I/OC, etc) are included in the review providing that the objective is to
control the workload directly. On the other hand, Constant Work-In-Process (ConWIP) is not
included in the review as it only controls workload indirectly (based on the number of jobs in the
system).
The remainder of the paper is organised as follows. Section 2.2 outlines the systematic
method behind the review - including how the literature was categorised - before Section 2.3
brie�y de�nes WLC. The literature review is presented in Section 2.4 - this includes identifying
key research gaps - before �nal conclusions follow in Section 2.5.
2. Three Decades of Workload Control Research: A Systematic Review of the Literature
2.2 Methodology
This review began by considering the following research questions (RQ1 & RQ2):
∙ RQ1: What have been the main contributions to the �eld of WLC? And has the focus of
WLC research shifted over the past three decades? In other words, how is the �eld evolving?
∙ RQ2: What are the most important future research directions in the �eld of WLC? In other
words, how should the �eld of WLC evolve in the future?
A WLC database was built for the systematic review through a four-stage process. Firstly,
papers published in international Business & Management journals were analysed (www.b-on.pt)
and all appearing potentially relevant to WLC (including ORR, I/OC, etc) were shortlisted. Sec-
ondly, the shortlisted articles were carefully read to assess the true relevance; if relevant, the
papers passed into a preliminary database. Thirdly, papers cited in the articles identi�ed during
the second stage were also read carefully to determine relevance to WLC; this ensured that rele-
vant articles not identi�ed during the �rst step were not overlooked. Fourthly, all articles in the
database related with WLC and cited more than once were chosen for the �nal WLC database.
The �nal database contained 107 articles (27 from the 1980s, 42 from the 1990s and 38 since 2000).
All articles in the �nal database have been included in the systematic review which is presented
in what follows.
2.2.1 Categorisation of Literature
In his review of order release policies, Wisner (1995) divided research into: descriptive, analytical
and simulation-based research. Descriptive research contained general discussion papers, case
study research and survey research. Only two empirical studies were included (Igel, 1981; Bechte,
1982) but, in this review, there are a further nine. The above categorisation is therefore adapted to:
conceptual, analytical, empirical, and simulation-based (conceptual corresponds to the descriptive
category fromWisner (1995) excluding empirical research). Almost all articles could be categorised
as conceptual but only those which do not fall under one of the other categories are included.
2.3 Workload Control (WLC): An Introduction
Many WLC methods are described in the literature; the unifying theme is use of a pre-shop pool
and order release mechanism. All regulate release by considering the current load (e.g., at each
work centre), workload limits and job characteristics (e.g., DD and workload). WLC methods
emerging from the classical ORR concept and viewing WLC as the interface between the plan-
ning system and the shop �oor have three control levels: job entry; job release; and, priority
dispatching. Land & Gaalman (1996a) combined these into a comprehensive hierarchical concept
referred to here as the ORR WLC concept. The WLC methods based on I/OC, largely developed
at Lancaster University and hereafter referred to as the LUMS Approach, added the customer
13
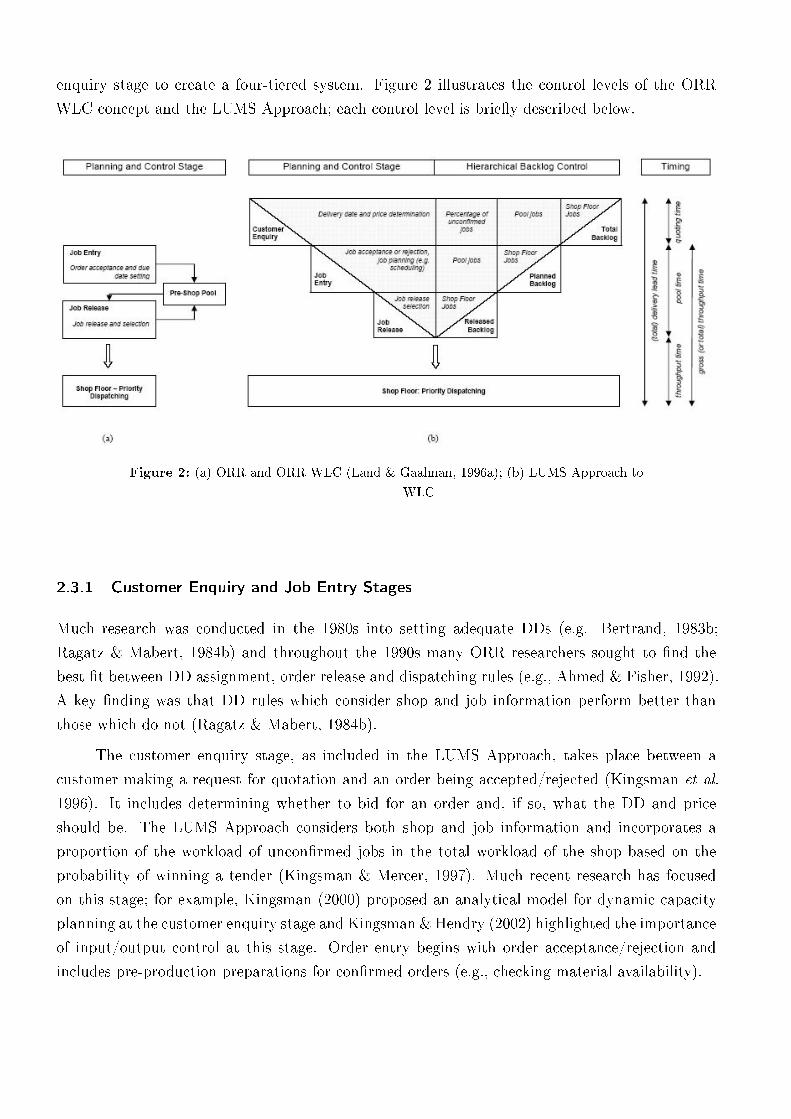
enquiry stage to create a four-tiered system. Figure 2 illustrates the control levels of the ORR
WLC concept and the LUMS Approach; each control level is brie�y described below.
Figure 2: (a) ORR and ORR WLC (Land & Gaalman, 1996a); (b) LUMS Approach to
WLC
2.3.1 Customer Enquiry and Job Entry Stages
Much research was conducted in the 1980s into setting adequate DDs (e.g. Bertrand, 1983b;
Ragatz & Mabert, 1984b) and throughout the 1990s many ORR researchers sought to �nd the
best �t between DD assignment, order release and dispatching rules (e.g., Ahmed & Fisher, 1992).
A key �nding was that DD rules which consider shop and job information perform better than
those which do not (Ragatz & Mabert, 1984b).
The customer enquiry stage, as included in the LUMS Approach, takes place between a
customer making a request for quotation and an order being accepted/rejected (Kingsman et al.
1996). It includes determining whether to bid for an order and, if so, what the DD and price
should be. The LUMS Approach considers both shop and job information and incorporates a
proportion of the workload of uncon�rmed jobs in the total workload of the shop based on the
probability of winning a tender (Kingsman & Mercer, 1997). Much recent research has focused
on this stage; for example, Kingsman (2000) proposed an analytical model for dynamic capacity
planning at the customer enquiry stage and Kingsman & Hendry (2002) highlighted the importance
of input/output control at this stage. Order entry begins with order acceptance/rejection and
includes pre-production preparations for con�rmed orders (e.g., checking material availability).
2. Three Decades of Workload Control Research: A Systematic Review of the Literature
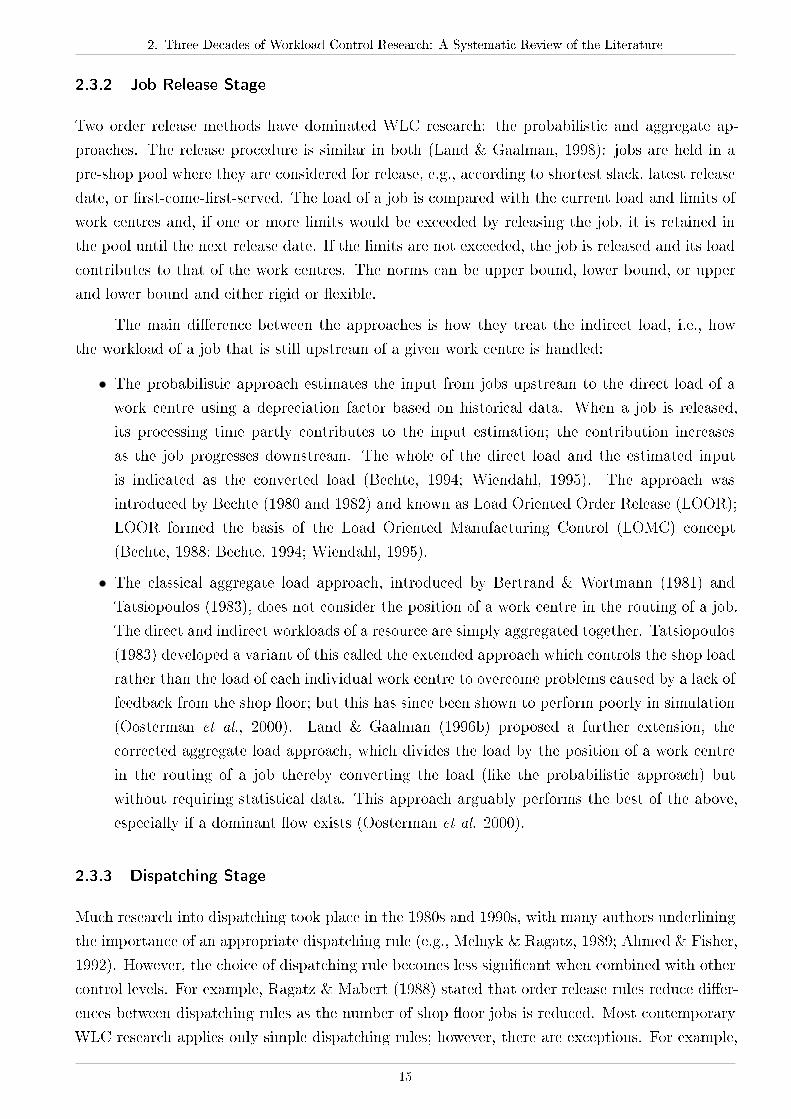
2.3.2 Job Release Stage
Two order release methods have dominated WLC research: the probabilistic and aggregate ap-
proaches. The release procedure is similar in both (Land & Gaalman, 1998): jobs are held in a
pre-shop pool where they are considered for release, e.g., according to shortest slack, latest release
date, or �rst-come-�rst-served. The load of a job is compared with the current load and limits of
work centres and, if one or more limits would be exceeded by releasing the job, it is retained in
the pool until the next release date. If the limits are not exceeded, the job is released and its load
contributes to that of the work centres. The norms can be upper bound, lower bound, or upper
and lower bound and either rigid or �exible.
The main di�erence between the approaches is how they treat the indirect load, i.e., how
the workload of a job that is still upstream of a given work centre is handled:
∙ The probabilistic approach estimates the input from jobs upstream to the direct load of a
work centre using a depreciation factor based on historical data. When a job is released,
its processing time partly contributes to the input estimation; the contribution increases
as the job progresses downstream. The whole of the direct load and the estimated input
is indicated as the converted load (Bechte, 1994; Wiendahl, 1995). The approach was
introduced by Bechte (1980 and 1982) and known as Load Oriented Order Release (LOOR);
LOOR formed the basis of the Load Oriented Manufacturing Control (LOMC) concept
(Bechte, 1988; Bechte, 1994; Wiendahl, 1995).
∙ The classical aggregate load approach, introduced by Bertrand & Wortmann (1981) and
Tatsiopoulos (1983), does not consider the position of a work centre in the routing of a job.
The direct and indirect workloads of a resource are simply aggregated together. Tatsiopoulos
(1983) developed a variant of this called the extended approach which controls the shop load
rather than the load of each individual work centre to overcome problems caused by a lack of
feedback from the shop �oor; but this has since been shown to perform poorly in simulation
(Oosterman et al., 2000). Land & Gaalman (1996b) proposed a further extension, the
corrected aggregate load approach, which divides the load by the position of a work centre
in the routing of a job thereby converting the load (like the probabilistic approach) but
without requiring statistical data. This approach arguably performs the best of the above,
especially if a dominant �ow exists (Oosterman et al. 2000).
2.3.3 Dispatching Stage
Much research into dispatching took place in the 1980s and 1990s, with many authors underlining
the importance of an appropriate dispatching rule (e.g., Melnyk & Ragatz, 1989; Ahmed & Fisher,
1992). However, the choice of dispatching rule becomes less signi�cant when combined with other
control levels. For example, Ragatz & Mabert (1988) stated that order release rules reduce di�er-
ences between dispatching rules as the number of shop �oor jobs is reduced. Most contemporary
WLC research applies only simple dispatching rules; however, there are exceptions. For example,
15
Stevenson (2006a) applied a special dispatching policy for priority jobs.
2.4 Literature Review and Future Research Directions
This section is structured as follows. Firstly, for each research category (conceptual, analytical em-
pirical and simulation-based research; see sections 2.4.1 to 2.4.4, respectively), key WLC research
from the 1980s and 1990s is reviewed in order to explore how the �eld has evolved and build the
backdrop for the analysis of the literature since 2000. Secondly, recent literature published since
2000 is reviewed in light of the research from the 1980s and 1990s in order to identify changes in
the focus of research and outstanding research gaps. Thirdly, future research directions for each
category are outlined.
2.4.1 Conceptual Research
2.4.1.1 Conceptual Research (1980-1999)
Four types of conceptual research were conducted in the 1980s and 1990s: (1) the categorisa-
tion of WLC; (2) reviewing di�erent PPC concepts and WLC; (3) developing the theory of the
LUMS Approach; and, (4) developing the theory of LOMC. The �rst group mainly consists of
Wisner (1995) and Bergamaschi et al. (1997) who categorised order release policies. The second
group consists of the reviews by Hendry & Kingsman (1989), Zäpfel & Missbauer (1993b) and
Land & Gaalman (1996a). For example, Hendry & Kingsman (1989) assessed the relevance of
PPC concepts to MTO companies, concluding that LOMC and what later became known as the
LUMS Approach were most appropriate. Researchers in the third group focused on developing
the LUMS Approach. Tatsiopoulos & Kingsman (1983) and Kingsman et al. (1989) outlined the
concept before it was further developed, for example, by Hendry & Kingsman (1991a) and Hendry
& Kingsman (1991b). Hendry & Kingsman (1993) presented theory for controlling the Total and
Planned Backlog Lengths (TBL and PBL) simultaneously; Kingsman et al. (1993) outlined the
importance of integrating production and sales, introducing the use of the strike rate; and, Kings-
man et al. (1996) presented an approach for determining prices and DDs. Researchers in the
fourth group developed the LOMC concept. These papers (e.g., Bechte, 1988 and 1994) made
important conceptual contributions but theory was typically developed through empirical insight
and hence the papers are also included in Section 2.4.3 (empirical research).
At the end of the 1990s, two decades of conceptual research had contributed to the devel-
opment of two mature WLC systems: the LUMS Approach, a comprehensive PPC system; and,
LOMC, a widely implemented solution for integrating a planning system with the shop �oor.
2.4.1.2 Conceptual Research (2000-2009)
Four conceptual research directions were identi�ed in the 1980s and 1990s. Research continued in
all four areas but with most attention on Group 3: developing the theory of the LUMS Approach.
2. Three Decades of Workload Control Research: A Systematic Review of the Literature
The only contribution to Group 1 was Henrich et al. (2004a) who introduced a framework for
analysing the characteristics of a company and assessing WLC applicability. This is an important
contribution but more research is needed to delimit WLC from other PPC concepts (e.g. ConWIP)
especially if it is to be compared with these concepts, as by researchers in Group 2. The main
contribution to Group 2 was Stevenson et al. (2005) who assessed the applicability of several
PPC concepts to di�erent shop characteristics. As in previous reviews, WLC was found to be
one of the best solutions for MTO companies. The other contribution was made by Fowler et
al. (2002) who assessed the applicability of di�erent PPC systems to the semi-conductor industry
considering Starvation Avoidance (SA), developed especially for wafer fabrication by Glassey &
Resende (1988). The remainder of this subsection focuses on groups 3 and 4 where the emphasis
has shifted from theory development to theory re�nement.
Since 2000, the LUMS Approach has been re�ned according to theoretical advances and
contextual changes (Stevenson & Hendry, 2006) and in response to issues encountered whilst im-
plementing WLC, including human factors (e.g., Silva et al., 2006; Stevenson & Silva, 2008; Hendry
et al., 2008; Huang et al., 2008). Re�nements in response to theoretical advances included remov-
ing the lower bounding of workloads introduced by Hendry & Kingsman (1991a) following the
simulation results of Cigolini & Portioli-Staudacher (2002); re�nements in response to contextual
changes included controlling daily rather than weekly total and planned workload lengths to cope
with shorter lead time demands. Implementation issues encountered included a lack of familiarity
in practice with WLC, hindering progress during the early stages of a project (Silva et al., 2006;
Stevenson & Silva, 2008; Hendry et al., 2008). In response, Stevenson et al. (2009) developed
an interactive end-user training tool which coupled a DSS based on the LUMS Approach with a
simulated shop �oor and demonstrated its positive impact in practice. In other cases, re�nements
were made without validation. For example, Stevenson (2006a) introduced the option of releasing
part of a job from the pool but did not evaluate the impact on overall release performance while
Stevenson & Silva (2008) compared re�nements made during two implementations of the LUMS
Approach conducted independently but in parallel and found that few re�nements were valid for
both cases.
A need for web-functionality within a WLC DSS was also identi�ed, either to improve
accessibility for multiple users or to integrate supply chain partners. Stevenson & Hendry (2007a
and 2007b) explored the implications of web-functionality for WLC while Silva & Magalhaes (2003)
and Silva et al. (2006) developed a system that incorporated this technology. Web-functionality
can be considered a step towards integration into the wider supply chain and integration with other
systems, e.g., Enterprise Resource Planning (ERP) systems but previous studies had not explicitly
considered this. A further conceptual extension is provided by Soepenberg et al. (2008) who
introduced a diagram which allows order progress to be tracked in a simple graphical way, helping
to diagnose the causes of, and control, lateness. The tool was applied by Land & Gaalman (2009)
to identify the causes of PPC implementation problems in seven cases. The main contribution to
Group 4 was by Breithaupt et al. (2002) who made several re�nements to LOOR and LOMC; for
example, a dialogue-oriented extension to overcome balancing problems described by Wiendahl
17
(1991) and a logistic operating curve to de�ne optimal parameters (Nyhuis & Wiendahl, 1999).
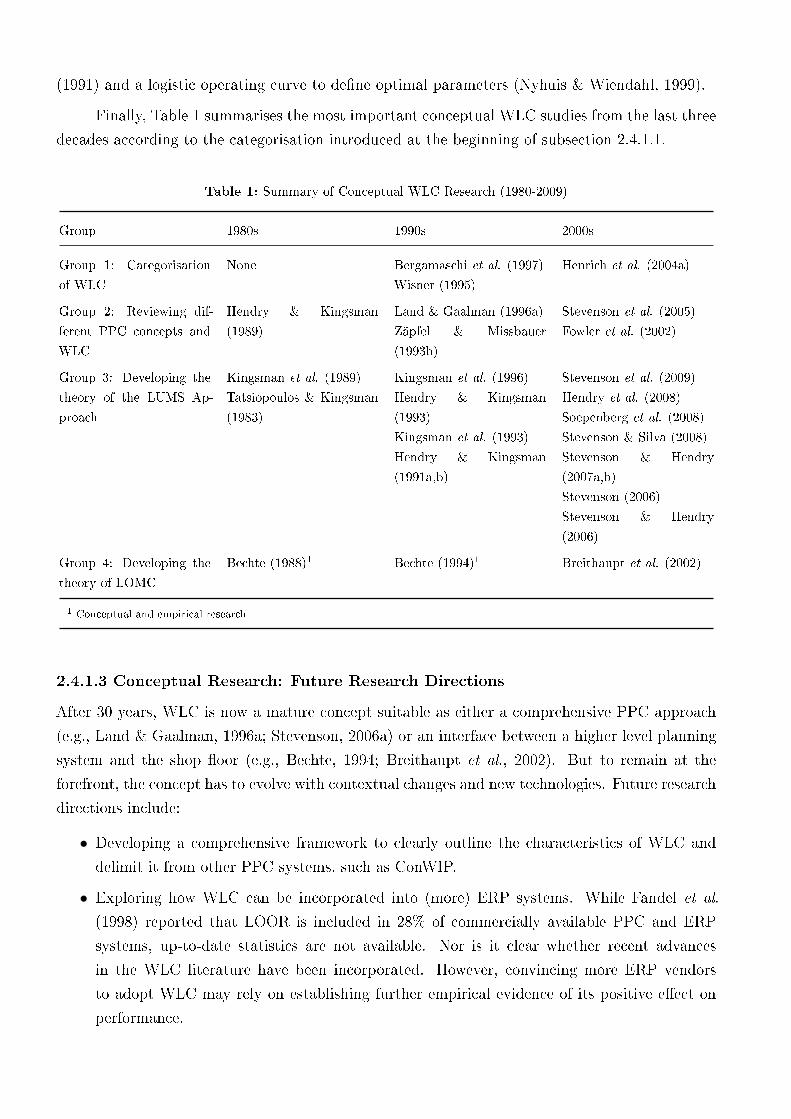
Finally, Table 1 summarises the most important conceptual WLC studies from the last three
decades according to the categorisation introduced at the beginning of subsection 2.4.1.1.
Table 1: Summary of Conceptual WLC Research (1980-2009)
Group 1980s 1990s 2000s
Group 1: Categorisation
of WLC
None Bergamaschi et al. (1997)
Wisner (1995)
Henrich et al. (2004a)
Group 2: Reviewing dif-
ferent PPC concepts and
WLC
Hendry & Kingsman
(1989)
Land & Gaalman (1996a)
Zäpfel & Missbauer
(1993b)
Stevenson et al. (2005)
Fowler et al. (2002)
Group 3: Developing the
theory of the LUMS Ap-
proach
Kingsman et al. (1989)
Tatsiopoulos & Kingsman
(1983)
Kingsman et al. (1996)
Hendry & Kingsman
(1993)
Kingsman et al. (1993)
Hendry & Kingsman
(1991a,b)
Stevenson et al. (2009)
Hendry et al. (2008)
Soepenberg et al. (2008)
Stevenson & Silva (2008)
Stevenson & Hendry
(2007a,b)
Stevenson (2006)
Stevenson & Hendry
(2006)
Group 4: Developing the
theory of LOMC
Bechte (1988)1 Bechte (1994)1 Breithaupt et al. (2002)
1 Conceptual and empirical research
2.4.1.3 Conceptual Research: Future Research Directions
After 30 years, WLC is now a mature concept suitable as either a comprehensive PPC approach
(e.g., Land & Gaalman, 1996a; Stevenson, 2006a) or an interface between a higher level planning
system and the shop �oor (e.g., Bechte, 1994; Breithaupt et al., 2002). But to remain at the
forefront, the concept has to evolve with contextual changes and new technologies. Future research
directions include:
∙ Developing a comprehensive framework to clearly outline the characteristics of WLC and
delimit it from other PPC systems, such as ConWIP.
∙ Exploring how WLC can be incorporated into (more) ERP systems. While Fandel et al.
(1998) reported that LOOR is included in 28% of commercially available PPC and ERP
systems, up-to-date statistics are not available. Nor is it clear whether recent advances
in the WLC literature have been incorporated. However, convincing more ERP vendors
to adopt WLC may rely on establishing further empirical evidence of its positive e�ect on
performance.
2. Three Decades of Workload Control Research: A Systematic Review of the Literature
∙ Developing WLC to integrate the concept further into the management of supply chains
(e.g., through more sophisticated web functionality).
2.4.2 Analytical Research
2.4.2.1 Analytical Research (1980-1990)
Few analytical research contributions were made in the 1980s and 1990s because an adequate
approach for modelling WLC was missing; all of the contributions that did emerge were based
on queuing theory. The �rst attempt was by Kanet (1988) who used a single-machine model to
analyse the in�uence of load limited order release on shop performance. The author found that
it may negatively in�uence performance but this could be due to the simplicity of the release
method applied. A second contribution was made as part of the conceptual study by Hendry &
Kingsman (1991b), who analysed the relationship between the Released Backlog Length (RBL)
and throughput time and the in�uence of the percentage of priority orders on the performance
of non-priority orders. The work is similar to a simulation study by Malhotra et al. (1994) - the
same results were obtained but much quicker and without building a complex simulation model;
this demonstrated the potential of analytical modelling. Finally, Missbauer (1997) studied the
in�uence of sequence-dependent set-up times on the relationship between WIP and throughput
showing that when sequence-dependent set-up times exist, throughput may be improved by in-
creasing WIP because the number of set-ups decreases if more jobs are waiting in front of a work
centre and can be grouped together.
2.4.2.2 Analytical Research (2000-2009)
Few analytical research contributions were made in the 1980s or 1990s but there have been several
recent attempts. Contributions are divided into three groups: (1) analytical models applying
queuing theory; (2) mathematical analysis of new release methods; and, (3) analytical tools to
facilitate management decisions. In Group 1, Haskose et al. (2002) developed a tandem queuing
network with bu�er constraints corresponding to a pure �ow shop. This was extended by Haskose
et al. (2004) to an arbitrary queuing network with bu�er constraints corresponding to a general
�ow shop and a pure job shop; however, only an approximate solution for the arbitrary queuing
network could be provided. While this work is important to analytical model building in WLC
research, it remains unclear whether applying bu�er constraints is appropriate as most WLC
policies do not restrict the bu�er (or queue length) in front of work centres; work centre bu�ers
are usually considered in�nite as the bu�ering happens in the pre-shop pool to avoid blocking on
the shop �oor. An alternative was provided by Missbauer (2002a and 2009) who used the theory
of transient queuing networks to build aggregate order release planning models, introducing a
clearing function model with more than one independent variable. This appears more appropriate,
but clearing function models are based on steady-state assumptions and hence still only provide
approximation solutions. An additional contribution was made by Missbauer (2002b), where a
19
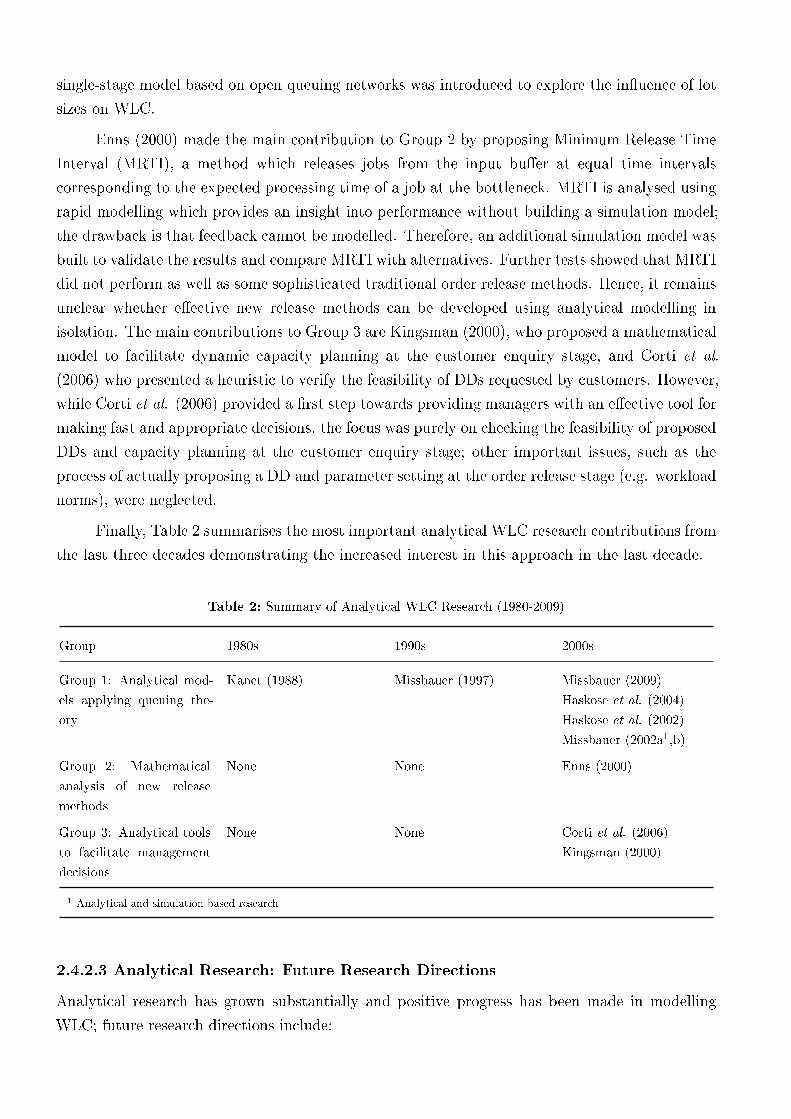
single-stage model based on open queuing networks was introduced to explore the in�uence of lot
sizes on WLC.
Enns (2000) made the main contribution to Group 2 by proposing Minimum Release Time
Interval (MRTI), a method which releases jobs from the input bu�er at equal time intervals
corresponding to the expected processing time of a job at the bottleneck. MRTI is analysed using
rapid modelling which provides an insight into performance without building a simulation model;
the drawback is that feedback cannot be modelled. Therefore, an additional simulation model was
built to validate the results and compare MRTI with alternatives. Further tests showed that MRTI
did not perform as well as some sophisticated traditional order release methods. Hence, it remains
unclear whether e�ective new release methods can be developed using analytical modelling in
isolation. The main contributions to Group 3 are Kingsman (2000), who proposed a mathematical
model to facilitate dynamic capacity planning at the customer enquiry stage, and Corti et al.
(2006) who presented a heuristic to verify the feasibility of DDs requested by customers. However,
while Corti et al. (2006) provided a �rst step towards providing managers with an e�ective tool for
making fast and appropriate decisions, the focus was purely on checking the feasibility of proposed
DDs and capacity planning at the customer enquiry stage; other important issues, such as the
process of actually proposing a DD and parameter setting at the order release stage (e.g. workload
norms), were neglected.
Finally, Table 2 summarises the most important analytical WLC research contributions from
the last three decades demonstrating the increased interest in this approach in the last decade.
Table 2: Summary of Analytical WLC Research (1980-2009)
Group 1980s 1990s 2000s
Group 1: Analytical mod-
els applying queuing the-
ory
Kanet (1988) Missbauer (1997) Missbauer (2009)
Haskose et al. (2004)
Haskose et al. (2002)
Missbauer (2002a1,b)
Group 2: Mathematical
analysis of new release
methods
None None Enns (2000)
Group 3: Analytical tools
to facilitate management
decisions
None None Corti et al. (2006)
Kingsman (2000)
1 Analytical and simulation based research
2.4.2.3 Analytical Research: Future Research Directions
Analytical research has grown substantially and positive progress has been made in modelling
WLC; future research directions include:
2. Three Decades of Workload Control Research: A Systematic Review of the Literature
∙ Going beyond the approximate analytical modelling solutions presented to date.
∙ Developing simpler, yet e�ective, heuristics and models to support managers in making
faster decisions in practice, including tools to support the process of setting appropriate
WLC parameters.
2.4.3 Empirical Research
2.4.3.1 Empirical Research (1980-1990)
Three types of empirical research were conducted in the 1980s and 1990s: (1) research based on
single cases; (2) research based on multiple cases; and, (3) single case study accounts of hybrid
PPC systems. Successful implementations of LOMC and LOOR were reported in Group 1 by
Bechte (1988) and Bechte (1994) and in Group 2 by Wiendahl et al. (1992). All three report on
implementations in small and medium sized MTO companies (from plastic and textile processing
(Bechte 1988) to mechanical engineering (Wiendahl, 1992; Bechte, 1994)), reporting reductions
in lead times and WIP. Further empirical studies categorised in Group 1, where implementation
success was less conclusive, were presented by Bertrand & Wortman (1981), Tatsiopoulos (1983),
Fry & Smith (1987), Hendry (1989), and Hendry et al. (1993). Finally, research in Group 3
emerged at the end of the 1990s when Park et al. (1999) implemented customer enquiry man-
agement theory from the LUMS Approach but without the order release rule. A hybrid system
was built that retained the company's existing releasing policy. The authors developed a Decision
Support System (DSS) incorporating a Heuristic Delivery Date Decision Algorithm (HDDDA)
that revised the capacity planning model within the LUMS Approach. The system helped man-
agers set feasible DDs but only considered the current load of the bottleneck machine and hence
may be susceptible over time to the 'wandering bottleneck' problem (see Lawrence & Buss, 1994).
The work demonstrated the �exibility of the LUMS Approach (elements of the theory could be
combined with existing business processes) and the hybrid system improved the performance of
the company.
By the end of the 1990s, the body of empirical research was limited and papers tended to
focus on reporting the before and after situation in the cases without describing the process of
implementation itself. The exception to this was Fry & Smith (1987) who provided a framework
for the implementation of a simple I/OC system and Wiendahl (1995) who included a 6-stage
implementation framework.
2.4.3.2 Empirical Research (2000-2009)
While empirical research in the 1980s and 1990s focused on comparing performance before and
after implementation with the researcher as an external observer, recent contributions have focused
more on the process of implementation with the researcher participating in organisational change.
Hence, the scope of empirical WLC research has extended to action research; like in the 1980s
and 1990s, research is divided into three groups: (1) research based on single cases; (2) research
21
based on multiple cases; and, (3) single case study accounts of hybrid PPC systems.
Group 1 consists of Stevenson (2006a) and Silva et al. (2006); both include a WLC DSS
based on the LUMS Approach. The former was implemented in a small MTO company in the
UK and the latter in a medium sized mould-producing MTO company in Portugal. Stevenson &
Silva (2008) then collaborated to compare the two cases while research questions raised by the
implementation in the UK (and an additional case in the Netherlands) were summarised in Hendry
et al. (2008). One of these concerned how assembly and rush orders could be accommodated; this
has since been partially addressed by Thürer et al. (2010a) who used simulation to �nd that
prioritizing rush orders at the release stage is the best solution. This group of research has
outlined implementation problems (not just results) and outstanding research questions. In time,
additional responses to that provided by Thürer et al. (2010a) are expected. Finally, none of the
authors in Group 1 and 2 who presented positive empirical results in the 1980s and 1990s have
presented follow-up results since 2000 which demonstrate whether or not success was sustained
over a long period of time.
In Group 2, Land & Gaalman (2009) explored why PPC concepts regularly fail by analysing
data from seven companies so future research can use the insight to implement WLC principles in
practice. Key problems were uncontrolled delays in engineering and inadequate capacity planning
overviews to support sales decisions. The former could be accounted for within the order entry/pre-
production stage of WLC while the latter can be overcome by applying WLC principles as shown
in the work of Park et al. (1999) and Riezebos et al. (2003) below.
In Group 3, Riezebos et al. (2003) demonstrated that WLC can be successfully implemented
when part of a hybrid system. Like Park et al. (1999), Riezebos et al. (2003) maintained the order
release rule already used in the company (Drum-Bu�er-Rope) and restructured order acceptance
from a procedure where the sales department was allowed to accept orders freely up to a maximum
�nancial daily turnover limit to a capacity-based approach considering two semi-interchangeable
bottleneck machines. The authors also introduced LOMC principles, rather than the LUMS
Approach favoured by Park et al. (1999), with a positive impact on performance.
Finally, Table 3 summarises the most important empirical WLC research contributions of
the last three decades.
2.4.3.3 Empirical Research: Future Research Directions
Recent empirical research has provided an insight into the implementation problems encountered
in practice and raised questions regarding how they can be overcome, potentially leading to new
conceptual advances. The future of WLC appears to lie in a comprehensive PPC system based on
the LUMS and LOMC approaches but in which independent order release rules may be embedded.
Future research directions include:
∙ Continuing to focus on implementation challenges and the process of implementation itself so
future research can identify solutions to problems identi�ed. This may also lead to developing
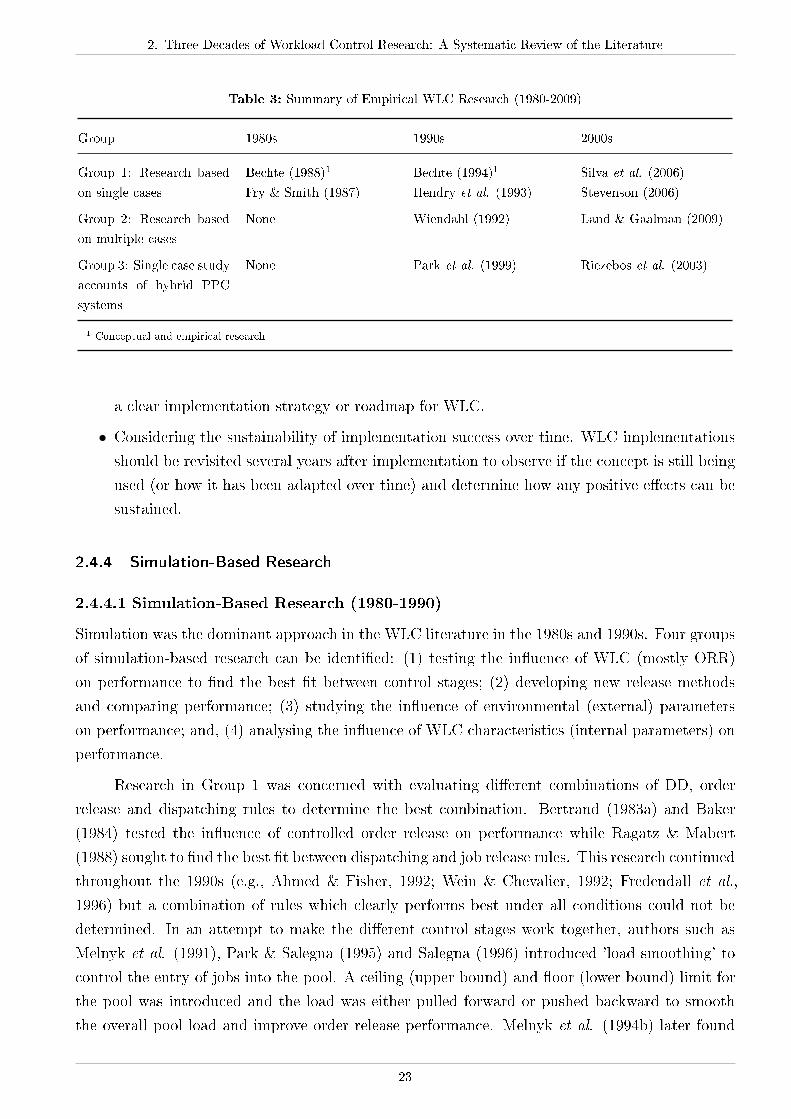
2. Three Decades of Workload Control Research: A Systematic Review of the Literature
Table 3: Summary of Empirical WLC Research (1980-2009)
Group 1980s 1990s 2000s
Group 1: Research based
on single cases
Bechte (1988)1
Fry & Smith (1987)
Bechte (1994)1
Hendry et al. (1993)
Silva et al. (2006)
Stevenson (2006)
Group 2: Research based
on multiple cases
None Wiendahl (1992) Land & Gaalman (2009)
Group 3: Single case study
accounts of hybrid PPC
systems
None Park et al. (1999) Riezebos et al. (2003)
1 Conceptual and empirical research
a clear implementation strategy or roadmap for WLC.
∙ Considering the sustainability of implementation success over time. WLC implementations
should be revisited several years after implementation to observe if the concept is still being
used (or how it has been adapted over time) and determine how any positive e�ects can be
sustained.
2.4.4 Simulation-Based Research
2.4.4.1 Simulation-Based Research (1980-1990)
Simulation was the dominant approach in the WLC literature in the 1980s and 1990s. Four groups
of simulation-based research can be identi�ed: (1) testing the in�uence of WLC (mostly ORR)
on performance to �nd the best �t between control stages; (2) developing new release methods
and comparing performance; (3) studying the in�uence of environmental (external) parameters
on performance; and, (4) analysing the in�uence of WLC characteristics (internal parameters) on
performance.
Research in Group 1 was concerned with evaluating di�erent combinations of DD, order
release and dispatching rules to determine the best combination. Bertrand (1983a) and Baker
(1984) tested the in�uence of controlled order release on performance while Ragatz & Mabert
(1988) sought to �nd the best �t between dispatching and job release rules. This research continued
throughout the 1990s (e.g., Ahmed & Fisher, 1992; Wein & Chevalier, 1992; Fredendall et al.,
1996) but a combination of rules which clearly performs best under all conditions could not be
determined. In an attempt to make the di�erent control stages work together, authors such as
Melnyk et al. (1991), Park & Salegna (1995) and Salegna (1996) introduced 'load smoothing' to
control the entry of jobs into the pool. A ceiling (upper bound) and �oor (lower bound) limit for
the pool was introduced and the load was either pulled forward or pushed backward to smooth
the overall pool load and improve order release performance. Melnyk et al. (1994b) later found
23
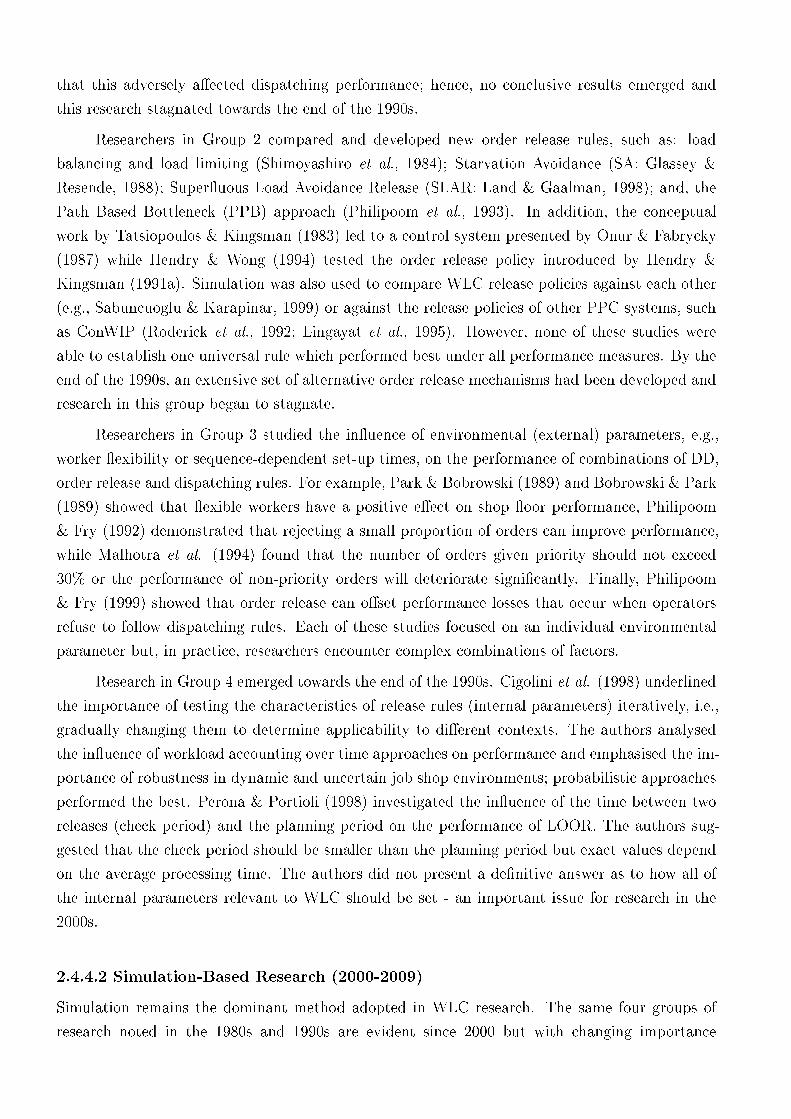
that this adversely a�ected dispatching performance; hence, no conclusive results emerged and
this research stagnated towards the end of the 1990s.
Researchers in Group 2 compared and developed new order release rules, such as: load
balancing and load limiting (Shimoyashiro et al., 1984); Starvation Avoidance (SA: Glassey &
Resende, 1988); Super�uous Load Avoidance Release (SLAR: Land & Gaalman, 1998); and, the
Path Based Bottleneck (PPB) approach (Philipoom et al., 1993). In addition, the conceptual
work by Tatsiopoulos & Kingsman (1983) led to a control system presented by Onur & Fabrycky
(1987) while Hendry & Wong (1994) tested the order release policy introduced by Hendry &
Kingsman (1991a). Simulation was also used to compare WLC release policies against each other
(e.g., Sabuncuoglu & Karapinar, 1999) or against the release policies of other PPC systems, such
as ConWIP (Roderick et al., 1992; Lingayat et al., 1995). However, none of these studies were
able to establish one universal rule which performed best under all performance measures. By the
end of the 1990s, an extensive set of alternative order release mechanisms had been developed and
research in this group began to stagnate.
Researchers in Group 3 studied the in�uence of environmental (external) parameters, e.g.,
worker �exibility or sequence-dependent set-up times, on the performance of combinations of DD,
order release and dispatching rules. For example, Park & Bobrowski (1989) and Bobrowski & Park
(1989) showed that �exible workers have a positive e�ect on shop �oor performance, Philipoom
& Fry (1992) demonstrated that rejecting a small proportion of orders can improve performance,
while Malhotra et al. (1994) found that the number of orders given priority should not exceed
30% or the performance of non-priority orders will deteriorate signi�cantly. Finally, Philipoom
& Fry (1999) showed that order release can o�set performance losses that occur when operators
refuse to follow dispatching rules. Each of these studies focused on an individual environmental
parameter but, in practice, researchers encounter complex combinations of factors.
Research in Group 4 emerged towards the end of the 1990s. Cigolini et al. (1998) underlined
the importance of testing the characteristics of release rules (internal parameters) iteratively, i.e.,
gradually changing them to determine applicability to di�erent contexts. The authors analysed
the in�uence of workload accounting over time approaches on performance and emphasised the im-
portance of robustness in dynamic and uncertain job shop environments; probabilistic approaches
performed the best. Perona & Portioli (1998) investigated the in�uence of the time between two
releases (check period) and the planning period on the performance of LOOR. The authors sug-
gested that the check period should be smaller than the planning period but exact values depend
on the average processing time. The authors did not present a de�nitive answer as to how all of
the internal parameters relevant to WLC should be set - an important issue for research in the
2000s.
2.4.4.2 Simulation-Based Research (2000-2009)
Simulation remains the dominant method adopted in WLC research. The same four groups of
research noted in the 1980s and 1990s are evident since 2000 but with changing importance
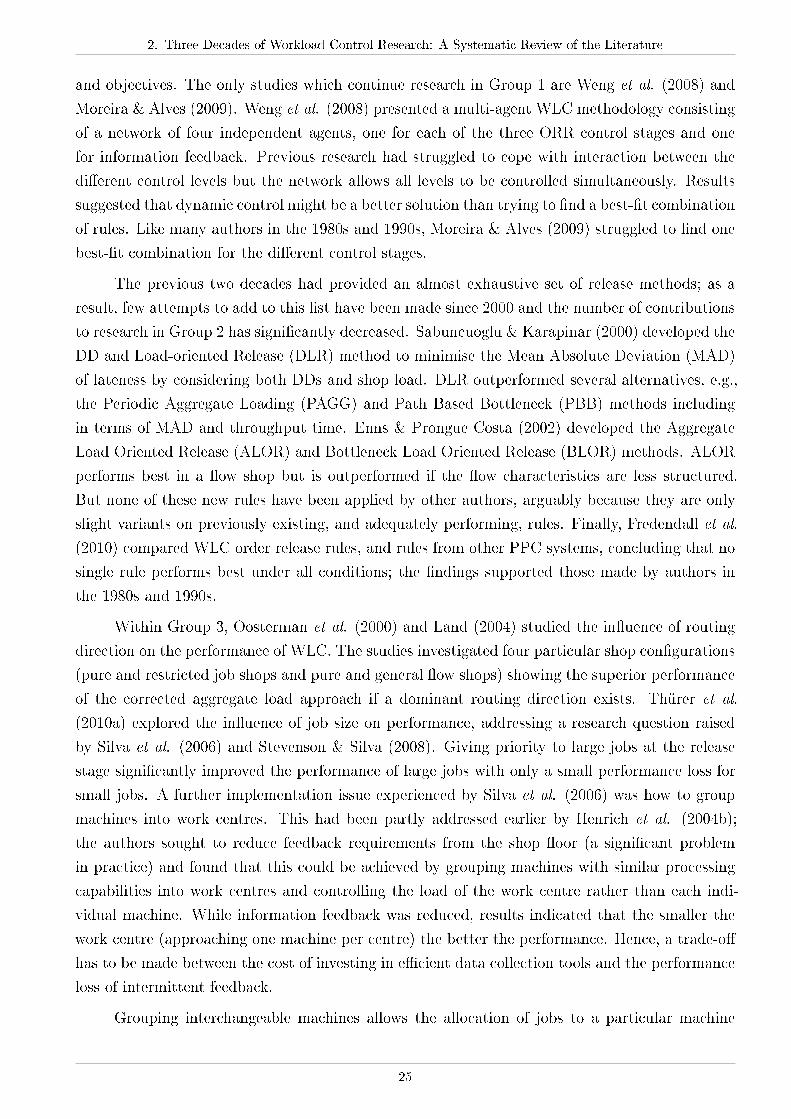
2. Three Decades of Workload Control Research: A Systematic Review of the Literature
and objectives. The only studies which continue research in Group 1 are Weng et al. (2008) and
Moreira & Alves (2009). Weng et al. (2008) presented a multi-agent WLC methodology consisting
of a network of four independent agents, one for each of the three ORR control stages and one
for information feedback. Previous research had struggled to cope with interaction between the
di�erent control levels but the network allows all levels to be controlled simultaneously. Results
suggested that dynamic control might be a better solution than trying to �nd a best-�t combination
of rules. Like many authors in the 1980s and 1990s, Moreira & Alves (2009) struggled to �nd one
best-�t combination for the di�erent control stages.
The previous two decades had provided an almost exhaustive set of release methods; as a
result, few attempts to add to this list have been made since 2000 and the number of contributions
to research in Group 2 has signi�cantly decreased. Sabuncuoglu & Karapinar (2000) developed the
DD and Load-oriented Release (DLR) method to minimise the Mean Absolute Deviation (MAD)
of lateness by considering both DDs and shop load. DLR outperformed several alternatives, e.g.,
the Periodic Aggregate Loading (PAGG) and Path Based Bottleneck (PBB) methods including
in terms of MAD and throughput time. Enns & Prongue Costa (2002) developed the Aggregate
Load Oriented Release (ALOR) and Bottleneck Load Oriented Release (BLOR) methods. ALOR
performs best in a �ow shop but is outperformed if the �ow characteristics are less structured.
But none of these new rules have been applied by other authors, arguably because they are only
slight variants on previously existing, and adequately performing, rules. Finally, Fredendall et al.
(2010) compared WLC order release rules, and rules from other PPC systems, concluding that no
single rule performs best under all conditions; the �ndings supported those made by authors in
the 1980s and 1990s.
Within Group 3, Oosterman et al. (2000) and Land (2004) studied the in�uence of routing
direction on the performance of WLC. The studies investigated four particular shop con�gurations
(pure and restricted job shops and pure and general �ow shops) showing the superior performance
of the corrected aggregate load approach if a dominant routing direction exists. Thürer et al.
(2010a) explored the in�uence of job size on performance, addressing a research question raised
by Silva et al. (2006) and Stevenson & Silva (2008). Giving priority to large jobs at the release
stage signi�cantly improved the performance of large jobs with only a small performance loss for
small jobs. A further implementation issue experienced by Silva et al. (2006) was how to group
machines into work centres. This had been partly addressed earlier by Henrich et al. (2004b);
the authors sought to reduce feedback requirements from the shop �oor (a signi�cant problem
in practice) and found that this could be achieved by grouping machines with similar processing
capabilities into work centres and controlling the load of the work centre rather than each indi-
vidual machine. While information feedback was reduced, results indicated that the smaller the
work centre (approaching one machine per centre) the better the performance. Hence, a trade-o�
has to be made between the cost of investing in e�cient data collection tools and the performance
loss of intermittent feedback.
Grouping interchangeable machines allows the allocation of jobs to a particular machine
25
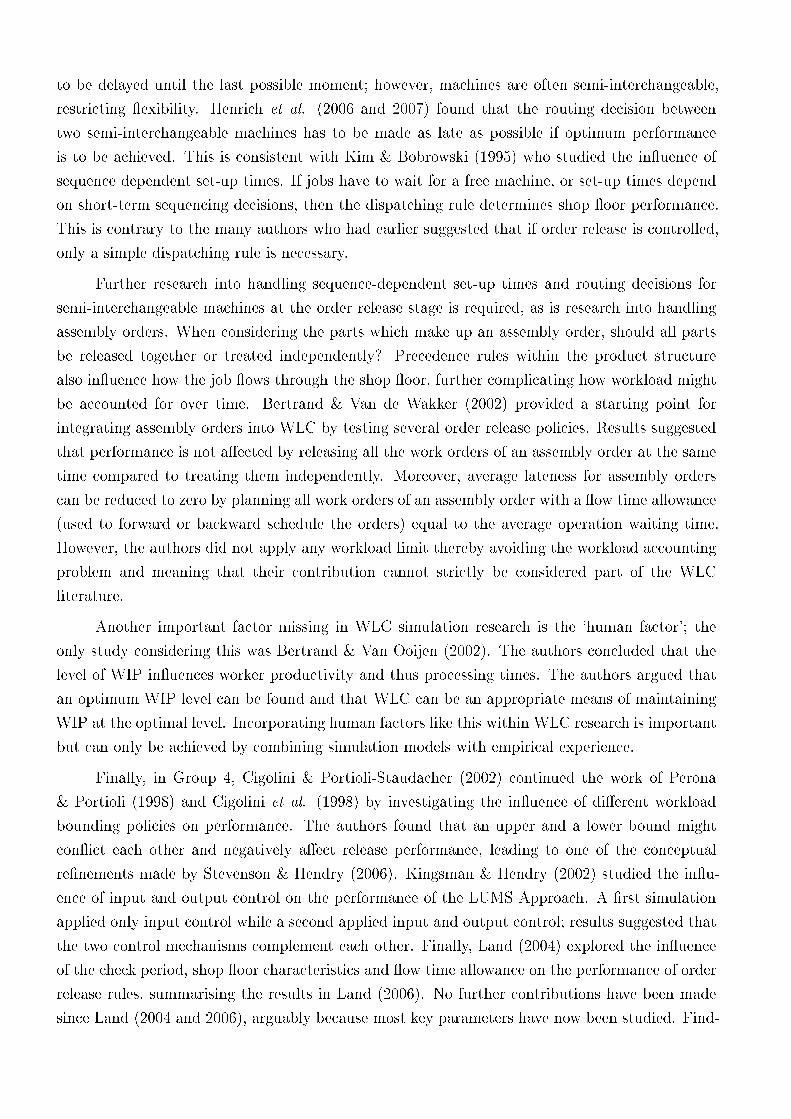
to be delayed until the last possible moment; however, machines are often semi-interchangeable,
restricting �exibility. Henrich et al. (2006 and 2007) found that the routing decision between
two semi-interchangeable machines has to be made as late as possible if optimum performance
is to be achieved. This is consistent with Kim & Bobrowski (1995) who studied the in�uence of
sequence dependent set-up times. If jobs have to wait for a free machine, or set-up times depend
on short-term sequencing decisions, then the dispatching rule determines shop �oor performance.
This is contrary to the many authors who had earlier suggested that if order release is controlled,
only a simple dispatching rule is necessary.
Further research into handling sequence-dependent set-up times and routing decisions for
semi-interchangeable machines at the order release stage is required, as is research into handling
assembly orders. When considering the parts which make up an assembly order, should all parts
be released together or treated independently? Precedence rules within the product structure
also in�uence how the job �ows through the shop �oor, further complicating how workload might
be accounted for over time. Bertrand & Van de Wakker (2002) provided a starting point for
integrating assembly orders into WLC by testing several order release policies. Results suggested
that performance is not a�ected by releasing all the work orders of an assembly order at the same
time compared to treating them independently. Moreover, average lateness for assembly orders
can be reduced to zero by planning all work orders of an assembly order with a �ow time allowance
(used to forward or backward schedule the orders) equal to the average operation waiting time.
However, the authors did not apply any workload limit thereby avoiding the workload accounting
problem and meaning that their contribution cannot strictly be considered part of the WLC
literature.
Another important factor missing in WLC simulation research is the 'human factor'; the
only study considering this was Bertrand & Van Ooijen (2002). The authors concluded that the
level of WIP in�uences worker productivity and thus processing times. The authors argued that
an optimum WIP level can be found and that WLC can be an appropriate means of maintaining
WIP at the optimal level. Incorporating human factors like this within WLC research is important
but can only be achieved by combining simulation models with empirical experience.
Finally, in Group 4, Cigolini & Portioli-Staudacher (2002) continued the work of Perona
& Portioli (1998) and Cigolini et al. (1998) by investigating the in�uence of di�erent workload
bounding policies on performance. The authors found that an upper and a lower bound might
con�ict each other and negatively a�ect release performance, leading to one of the conceptual
re�nements made by Stevenson & Hendry (2006). Kingsman & Hendry (2002) studied the in�u-
ence of input and output control on the performance of the LUMS Approach. A �rst simulation
applied only input control while a second applied input and output control; results suggested that
the two control mechanisms complement each other. Finally, Land (2004) explored the in�uence
of the check period, shop �oor characteristics and �ow time allowance on the performance of order
release rules, summarising the results in Land (2006). No further contributions have been made
since Land (2004 and 2006), arguably because most key parameters have now been studied. Find-
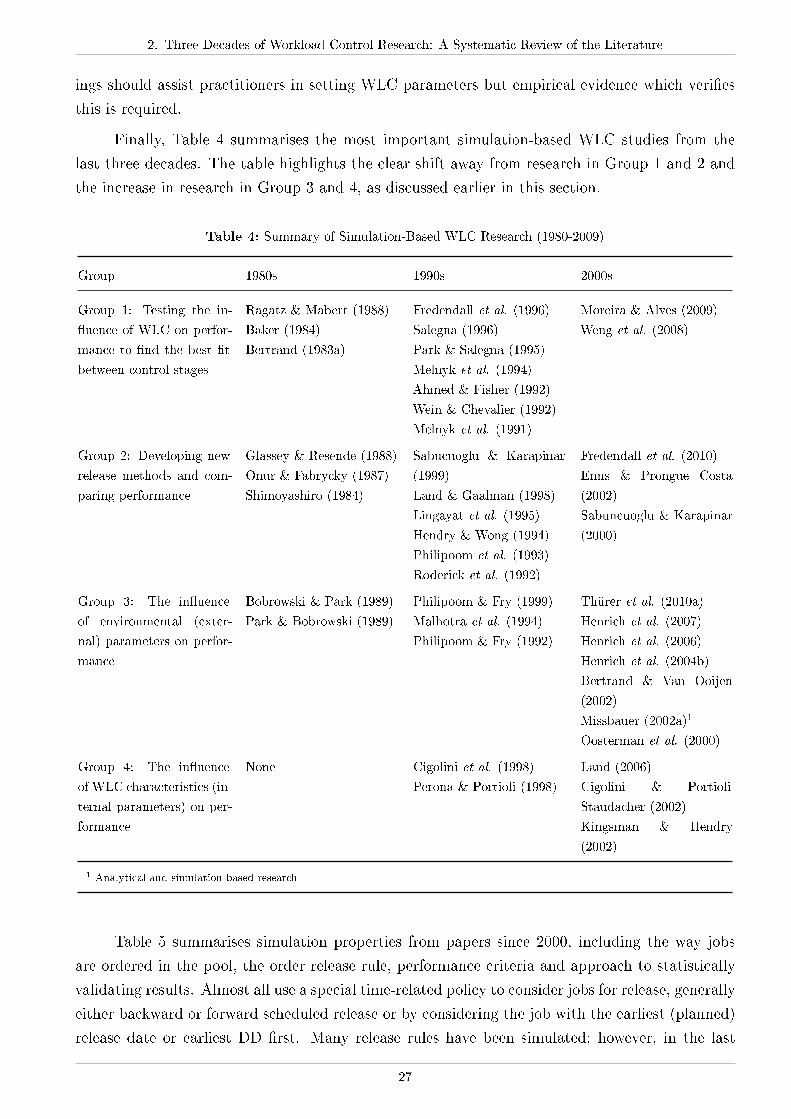
2. Three Decades of Workload Control Research: A Systematic Review of the Literature
ings should assist practitioners in setting WLC parameters but empirical evidence which veri�es
this is required.
Finally, Table 4 summarises the most important simulation-based WLC studies from the
last three decades. The table highlights the clear shift away from research in Group 1 and 2 and
the increase in research in Group 3 and 4, as discussed earlier in this section.
Table 4: Summary of Simulation-Based WLC Research (1980-2009)
Group 1980s 1990s 2000s
Group 1: Testing the in-
�uence of WLC on perfor-
mance to �nd the best �t
between control stages
Ragatz & Mabert (1988)
Baker (1984)
Bertrand (1983a)
Fredendall et al. (1996)
Salegna (1996)
Park & Salegna (1995)
Melnyk et al. (1994)
Ahmed & Fisher (1992)
Wein & Chevalier (1992)
Melnyk et al. (1991)
Moreira & Alves (2009)
Weng et al. (2008)
Group 2: Developing new
release methods and com-
paring performance
Glassey & Resende (1988)
Onur & Fabrycky (1987)
Shimoyashiro (1984)
Sabucuoglu & Karapinar
(1999)
Land & Gaalman (1998)
Lingayat et al. (1995)
Hendry & Wong (1994)
Philipoom et al. (1993)
Roderick et al. (1992)
Fredendall et al. (2010)
Enns & Prongue Costa
(2002)
Sabuncuoglu & Karapinar
(2000)
Group 3: The in�uence
of environmental (exter-
nal) parameters on perfor-
mance
Bobrowski & Park (1989)
Park & Bobrowski (1989)
Philipoom & Fry (1999)
Malhotra et al. (1994)
Philipoom & Fry (1992)
Thürer et al. (2010a)
Henrich et al. (2007)
Henrich et al. (2006)
Henrich et al. (2004b)
Bertrand & Van Ooijen
(2002)
Missbauer (2002a)1
Oosterman et al. (2000)
Group 4: The in�uence
of WLC characteristics (in-
ternal parameters) on per-
formance
None Cigolini et al. (1998)
Perona & Portioli (1998)
Land (2006)
Cigolini & Portioli-
Staudacher (2002)
Kingsman & Hendry
(2002)
1 Analytical and simulation based research
Table 5 summarises simulation properties from papers since 2000, including the way jobs
are ordered in the pool, the order release rule, performance criteria and approach to statistically
validating results. Almost all use a special time-related policy to consider jobs for release, generally
either backward or forward scheduled release or by considering the job with the earliest (planned)
release date or earliest DD �rst. Many release rules have been simulated; however, in the last
27
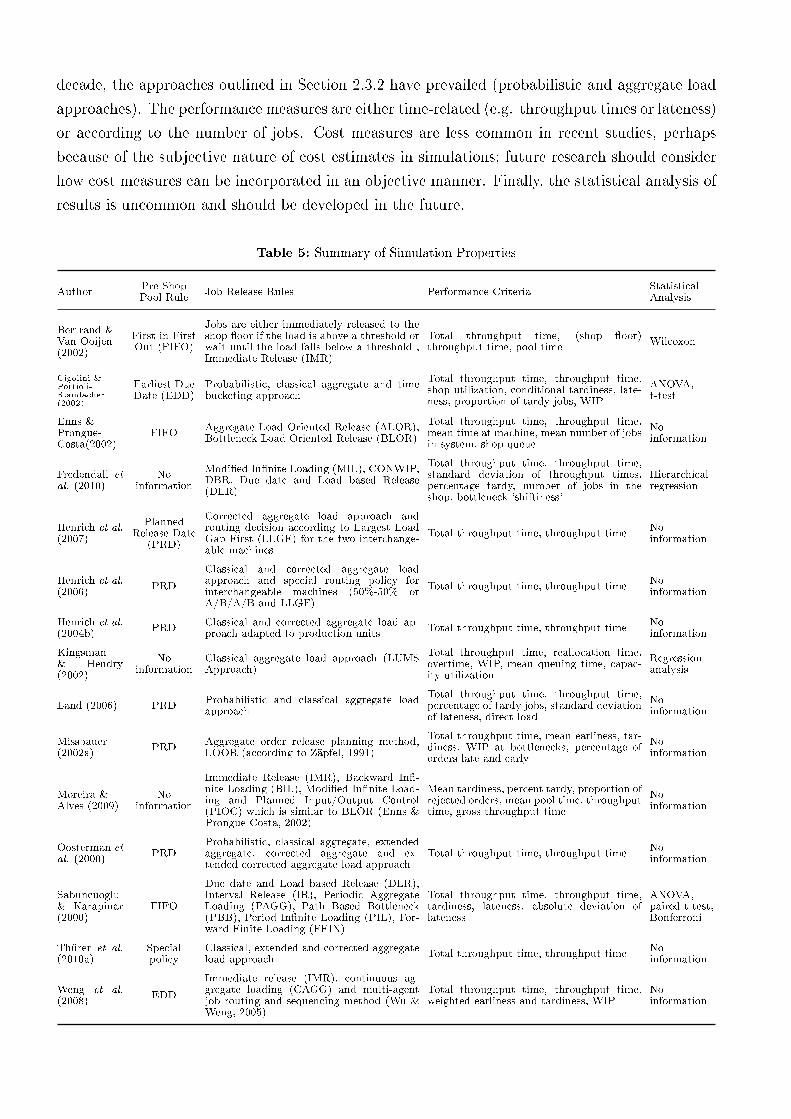
decade, the approaches outlined in Section 2.3.2 have prevailed (probabilistic and aggregate load
approaches). The performance measures are either time-related (e.g. throughput times or lateness)
or according to the number of jobs. Cost measures are less common in recent studies, perhaps
because of the subjective nature of cost estimates in simulations; future research should consider
how cost measures can be incorporated in an objective manner. Finally, the statistical analysis of
results is uncommon and should be developed in the future.
Table 5: Summary of Simulation Properties
AuthorPre-ShopPool Rule
Job Release Rules Performance CriteriaStatisticalAnalysis
Bertrand &Van Ooijen(2002)
First in FirstOut (FIFO)
Jobs are either immediately released to theshop �oor if the load is above a threshold orwait until the load falls below a threshold ,Immediate Release (IMR)
Total throughput time, (shop �oor)throughput time, pool time
Wilcoxon
Cigolini &Portioli-Staudacher(2002)
Earliest DueDate (EDD)
Probabilistic, classical aggregate and timebucketing approach
Total throughput time, throughput time,shop utilization, conditional tardiness, late-ness, proportion of tardy jobs, WIP
ANOVA,t-test
Enns &Prongue-Costa(2002)
FIFOAggregate Load Oriented Release (ALOR),Bottleneck Load Oriented Release (BLOR)
Total throughput time, throughput time,mean time at machine, mean number of jobsin system, shop queue
Noinformation
Fredendall et
al. (2010)No
information
Modi�ed In�nite Loading (MIL), CONWIP,DBR, Due date and Load based Release(DLR)
Total throughput time, throughput time,standard deviation of throughput times,percentage tardy, number of jobs in theshop, bottleneck 'shiftiness'
Hierarchicalregression
Henrich et al.(2007)
PlannedRelease Date
(PRD)
Corrected aggregate load approach androuting decision according to Largest LoadGap First (LLGF) for the two interchange-able machines
Total throughput time, throughput timeNoinformation
Henrich et al.(2006)
PRD
Classical and corrected aggregate loadapproach and special routing policy forinterchangeable machines (50%-50% orA/B/A/B and LLGF)
Total throughput time, throughput timeNoinformation
Henrich et al.(2004b)
PRDClassical and corrected aggregate load ap-proach adapted to production units
Total throughput time, throughput timeNoinformation
Kingsman& Hendry(2002)
Noinformation
Classical aggregate load approach (LUMSApproach)
Total throughput time, reallocation time,overtime, WIP, mean queuing time, capac-ity utilization
Regressionanalysis
Land (2006) PRDProbabilistic and classical aggregate loadapproach
Total throughput time, throughput time,percentage of tardy jobs, standard deviationof lateness, direct load
Noinformation
Missbauer(2002a)
PRDAggregate order release planning method,LOOR (according to Zäpfel, 1991)
Total throughput time, mean earliness, tar-diness, WIP at bottlenecks, percentage oforders late and early
Noinformation
Moreira &Alves (2009)
Noinformation
Immediate Release (IMR), Backward In�-nite Loading (BIL), Modi�ed In�nite Load-ing and Planned Input/Output Control(PIOC) which is similar to BLOR (Enns &Prongue Costa, 2002)
Mean tardiness, percent tardy, proportion ofrejected orders, mean pool time, throughputtime, gross throughput time
Noinformation
Oosterman et
al. (2000)PRD
Probabilistic, classical aggregate, extendedaggregate, corrected aggregate and ex-tended corrected aggregate load approach
Total throughput time, throughput timeNoinformation
Sabuncuoglu& Karapinar(2000)
FIFO
Due date and Load based Release (DLR),Interval Release (IR), Periodic AggregateLoading (PAGG), Path Based Bottleneck(PBB), Period In�nite Loading (PIL), For-ward Finite Loading (FFIN)
Total throughput time, throughput time,tardiness, lateness, absolute deviation oflateness
ANOVA,paired t-test,Bonferroni
Thürer et al.(2010a)
Specialpolicy
Classical, extended and corrected aggregateload approach
Total throughput time, throughput timeNoinformation
Weng et al.(2008)
EDD
Immediate release (IMR), continuous ag-gregate loading (CAGG) and multi-agentjob routing and sequencing method (Wu &Weng, 2005)
Total throughput time, throughput time,weighted earliness and tardiness, WIP
Noinformation
2. Three Decades of Workload Control Research: A Systematic Review of the Literature
Table 6 summarises the shop �oor characteristics from papers since 2000, including routing
sequence and length, processing times, arrival time of jobs, number of work centres, whether the
shop �oor is hypothetical or a real-life shop, and the simulation software used. Most studies are
based on similar shop �oor con�gurations to those presented by Melnyk & Ragatz (1989), simu-
lating a pure job shop with uniformly distributed routing lengths, a �xed mean processing time
which follows a certain distribution, and an arrival time adapted to achieve a certain utilisation
level. Few studies base shop �oor con�guration on a real-life shop �oor; although these would
arguably provide the more realistic insight, a hypothetical con�guration allows individual param-
eters to be studied while other parameters are controlled. Several simulation software packages
have been used; authors do not routinely provide information about the logic underpinning the
models developed, making it hard to compare results across researchers reliably.
2.4.4.3 Simulation-Based Research: Future Research Directions
Recent research has shifted the focus from testing release mechanisms to addressing practical
questions emerging from implementation experience; only 5 of the 15 simulation studies published
since 2000 focused on release method development and comparison. Future research directions
should include the following:
∙ Determining how to best handle assembly orders; while Bertrand & Van de Wakker (2002)
provided a starting point, more research is required.
∙ Developing more realistic simulation models; most are hypothetical and, in many ways, do
not re�ect reality (Perona &Miragliotta, 2000) leading to problems when researchers attempt
to implement the results in practice. This should include incorporating more human factors
within the design of simulation experiments.
∙ Validating re�nements to the WLC concept (see Section 2.4.1.2). This would combine em-
pirical and simulation-based research to improve the conceptual basis of WLC.
∙ Providing an open-source WLC model. If all researchers used the same simulation model,
results could be compared across research groups more reliably and the time spent on model
building would be reduced. This could apply to code for order release or dispatching rules
and for shop and job characteristics.
2.5 Conclusion
This review began by considering how the �eld of WLC has evolved towards identifying how it
should evolve in the future. A comprehensive systematic review of the conceptual, analytical,
empirical and simulation-based WLC literature published since 1980 has been conducted. In
response to Research Question 1, regarding the evolution of the �eld of WLC, the following
conclusions could be drawn:
∙ By the end of the 1990s, the conceptual development of the LUMS Approach and LOMC
29
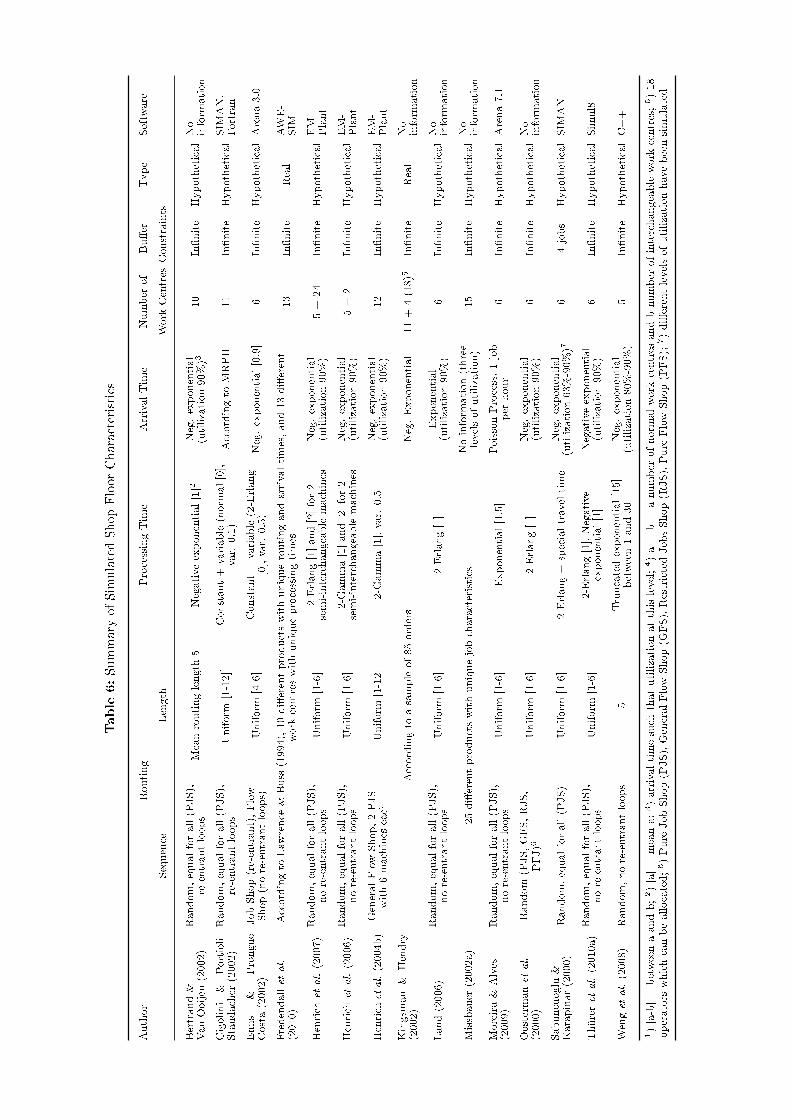
Table
6:Summary
ofSimulatedShopFloorCharacteristics
Author
Routing
ProcessingTim
eArrivalTim
eNumber
of
Bu�er
Type
Software
Sequence
Length
Work
Centres
Constraints
Bertrand&
VanOoijen
(2002)
Random,equalforall(PJS),
re-entrantloops
Meanroutinglength
5Negativeexponential[1]2
Neg.exponential
(utilization90%)3
10
In�nite
HypotheticalNo
inform
ation
Cigolini
&Portioli-
Staudacher
(2002)
Random,equalforall(PJS),
re-entrantloops
Uniform
[1-12]1
Constant+
variable(norm
al[0],
var.
0.1)
Accordingto
MRPII
11
In�nite
HypotheticalSIM
AN,
Fortran
Enns
&Prongue
Costa(2002)
JobShop(re-entrant),Flow
Shop(nore-entrantloops)
Uniform
[4-6]
Constant+
variable(2-Erlang
[0],var.
0.5)
Neg.exponential[0.9]
6In�nite
HypotheticalArena3.0
Fredendall
etal.
(2010)
Accordingto
Law
rence
&Buss
(1994),10di�erentproductswithuniqueroutingandarrivaltimes,and13di�erent
work
centres
withuniqueprocessingtimes
13
In�nite
Real
AWE-
SIM
Henrich
etal.(2007)
Random,equalforall(PJS),
nore-entrantloops
Uniform
[1-6]
2-Erlang[1]and[2]for2
semi-interchangeablemachines
Neg.exponential
(utilization90%)
5+
24
In�nite
HypotheticalEM-
Plant
Henrich
etal.(2006)
Random,equalforall(PJS),
nore-entrantloops
Uniform
[1-6]
2-G
amma[1]and[2]for2
semi-interchangeablemachines
Neg.exponential
(utilization90%)
5+
2In�nite
HypotheticalEM-
Plant
Henrich
etal.(2004b)
GeneralFlowShop,2PJS
with6machines
each
Uniform
[1-12]
2-G
amma[1],var.
0.5
Neg.exponential
(utilization90%)
12
In�nite
HypotheticalEM-
Plant
Kingsm
an&
Hendry
(2002)
Accordingto
asampleof85orders
Neg.Exponential
11+
4(18)5
In�nite
Real
No
inform
ation
Land(2006)
Random,equalforall(PJS),
nore-entrantloops
Uniform
[1-6]
2-Erlang[1]
Exponential
(utilization90%)
6In�nite
HypotheticalNo
inform
ation
Missbauer
(2002a)
25di�erentproductswithuniquejobcharacteristics
Noinform
ation(three
levelsofutilization)
15
In�nite
HypotheticalNo
inform
ation
Moreira&
Alves
(2009)
Random,equalforall(PJS),
nore-entrantloops
Uniform
[1-6]
Exponential[1.5]
PoissonProcess,1job
per
hour
6In�nite
HypotheticalArena7.1
Oosterman
etal.
(2000)
Random
(PJS,GFS,RJS,
PFJ)6
Uniform
[1-6]
2-Erlang[1]
Neg.exponential
(utilization90%)
6In�nite
HypotheticalNo
inform
ation
Sabuncuoglu
&Karapinar(2000)
Random,equalforall(PJS)
Uniform
[1-6]
2-Erlang+
specialtraveltime
Neg.exponential
(utilization63%-90%)7
64jobs
HypotheticalSIM
AN
Thüreretal.(2010a)
Random,equalforall(PJS),
nore-entrantloops
Uniform
[1-6]
2-Erlang[1],Negative
exponential[1]
Negativeexponential
(utilization90%)
6In�nite
HypotheticalSimul8
Weng
etal.(2008)
Random,nore-entrantloops
5Truncatedexponential[15]
between1and30
Neg.exponential
(utilization80%-90%)
5In�nite
HypotheticalC++
1)[a-b]=
betweenaandb;2)[a]=
meana;3)arrivaltimesuch
thatutilizationatthislevel;4)a+
b=
anumber
ofnorm
alwork
centres
andbnumber
ofinterchangeablework
centres;5)18
operators
whichcanbeallocated;6)Pure
JobShop(PJS),GeneralFlowShop(G
FS),RestrictedJobsShop(R
JS),Pure
FlowShop(PFS);
7)di�erentlevelsofutilizationhavebeensimulated
2. Three Decades of Workload Control Research: A Systematic Review of the Literature
had reached maturity; the focus since 2000 has shifted towards conceptual re�nement, e.g.,
in light of empirical evidence.
∙ There has been a substantial increase in analytical modelling since 2000 while the focus of
�eld research has shifted from observation, and reporting before/after implementation, to
focusing on how WLC can be implemented through participation.
∙ While it remains the most commonly adopted method, simulation has somewhat declined
in use and its focus has shifted from �nding the best �t between DD setting, release and
dispatching rules to internal parameter setting and the in�uence of external parameters on
the performance of order release rules, in many cases addressing issues encountered during
empirical research.
Many valuable contributions to the development of WLC have been presented in the past
three decades; however, there are many opportunities for further research. To conclude this paper,
and in response to Research Question 2, outstanding WLC research gaps identi�ed include:
∙ Conceptual Research: the need to give far greater consideration to human factors in the
design of PPC systems based on WLC; and, the need to integrate WLC with ERP systems
and the wider supply chain.
∙ Analytical Research: the need to develop tools that support managers in making fast and
appropriate decisions, e.g., during the process of setting appropriate (internal) WLC param-
eters.
∙ Empirical Research: the need to conduct further action research into how WLC can be e�ec-
tively implemented in practice; and, to investigate whether improvements can be sustained
over time.
∙ Simulation Based Research: the need to further improve simulation models, including study-
ing human factors that a�ect WLC; and, feeding back empirical �ndings to simulation-based
WLC research to improve the applicability of WLC theory to real-life job shops.
Additional material which has not been considered for the submitted article is provided
in the Appendix. This material includes: a citation & co-citation analysis and a summary of
empirical studies (Section A); and, the WLC database (Section B).
31


Part III.
Improving the Applicability of Workload
Control: Addressing Research Questions
Table of Contents
3. Workload Control Release Mechanisms: From Practice Back to Theory Building 35
3.1. Introduction . . . . . . . . . . . . . . . . . . . . . . . . . . . . . . . . . . . . . . 35
3.2. Literature Review . . . . . . . . . . . . . . . . . . . . . . . . . . . . . . . . . . . 37
3.3. Methodology . . . . . . . . . . . . . . . . . . . . . . . . . . . . . . . . . . . . . 41
3.4. Simulation Model . . . . . . . . . . . . . . . . . . . . . . . . . . . . . . . . . . . 42
3.5. Results . . . . . . . . . . . . . . . . . . . . . . . . . . . . . . . . . . . . . . . . . 47
3.6. Handling Rush Orders . . . . . . . . . . . . . . . . . . . . . . . . . . . . . . . . 54
3.7. Conclusion . . . . . . . . . . . . . . . . . . . . . . . . . . . . . . . . . . . . . . . 56
4. Optimising Workload Norms: The In�uence of Shop Floor Characteristics on
Setting Workload Norms for the Workload Control Concept 59
4.1. Introduction . . . . . . . . . . . . . . . . . . . . . . . . . . . . . . . . . . . . . . 59
4.2. Literature Review . . . . . . . . . . . . . . . . . . . . . . . . . . . . . . . . . . . 61
4.3. Simulation Model . . . . . . . . . . . . . . . . . . . . . . . . . . . . . . . . . . . 64
4.4. Results . . . . . . . . . . . . . . . . . . . . . . . . . . . . . . . . . . . . . . . . . 71
4.5. Conclusion . . . . . . . . . . . . . . . . . . . . . . . . . . . . . . . . . . . . . . . 77
5. Improving the Applicability of Workload Control: The In�uence of Sequence
Dependent Set-Up Times on Workload Controlled Job Shops 81
5.1. Introduction . . . . . . . . . . . . . . . . . . . . . . . . . . . . . . . . . . . . . . 81
5.2. Literature Review . . . . . . . . . . . . . . . . . . . . . . . . . . . . . . . . . . . 83
5.3. Simulation Model . . . . . . . . . . . . . . . . . . . . . . . . . . . . . . . . . . . 85
5.4. Results . . . . . . . . . . . . . . . . . . . . . . . . . . . . . . . . . . . . . . . . . 90
5.5. Conclusion . . . . . . . . . . . . . . . . . . . . . . . . . . . . . . . . . . . . . . . 94

3. Workload Control Release Mechanisms: From Practice Back to Theory Building
3 Workload Control Release Mechanisms: From Practice
Back to Theory Building
Published in International Journal of Production Research
Matthias Thürer, Cristovao Silva, and Mark Stevenson
Abstract
Much Workload Control research has focussed on the order release stage but failed to address
practical considerations that impact practical application. Order release mechanisms have been
developed through simulations that neglect job size variation e�ects while empirical evidence
suggests groups of small/large jobs are often found in practice. When job sizes vary, it is di�cult
to release all jobs e�ectively - small jobs favour a short period between releases and a tight workload
bounding while large jobs require a longer period between releases and a slacker workload bounding.
This paper represents a return from a case study setting to theory building. Through simulation,
the impact of job sizes on overall performance is explored using all three aggregate load approaches.
Options tested include: using distinct load capacities for small/large jobs and prioritizing based
on job size or routing length. Results suggest the best solution is assigning priority based on
routing length; this improved performance, especially for large jobs, and allowed a short release
period to be applied, as favoured by small jobs. These ideas have also been applied to a second
practical problem: how to handle rush orders. Again, prioritization, given to rush orders, leads
to the best overall shop performance.
3.1 Introduction
Workload Control (WLC) is a method of planning and controlling production which has received
much attention in recent years. While the customer enquiry and order acceptance stages are
important, a large proportion of the literature focuses on the order release stage through which
the level of Work-In-Process (WIP) on the shop �oor is regulated (e.g., Hendry & Wong, 1994;
Missbauer, 1997; Land & Gaalman, 1998; Bertrand & Van Ooijen, 2002; Breithaupt et al., 2002;
Cigolini & Portioli-Staudacher, 2002). The unifying theme in this research is the use of a pre-shop
pool in which all jobs 'compete' against each other for release. Land & Gaalman (1998) explain
that a pool can absorb �uctuations in the �ow of incoming orders, reduce WIP costs, increase
shop �oor transparency, reduce waste caused by order cancellations, allow later ordering of raw
materials and reduce the need to expedite jobs on the shop �oor.
A pre-shop pool can be particularly important where there is instability, such as in the
manufacture of bespoke or highly customised products where job sizes (e.g., unit processing times
or quantities) vary. However, when job sizes do vary, it can be di�cult to plan and control the
release of all jobs e�ectively - jobs with a small workload favour a short period between releases
35
and a tight bounding of the released workload while jobs with a large workload require more
time between releases and a slacker bounding of the released workload. This is supported by
Land (2006) who explains that a long release period delays certain jobs and can increase gross
throughput times while a short release period can hinder the progress of large jobs. Despite the
above, simulation studies have tended to ignore this problem at the release stage. Meanwhile,
recent case study research identi�ed accommodating job size variations within WLC theory as an
important problem for researchers to address in order to improve the e�ective implementation of
WLC in practice (see: Stevenson & Silva, 2008).
In response, this paper explores means of balancing the needs of small and large jobs by
attempting to improve the performance of large jobs whilst maintaining a short period between
releases (also known as the check or release period), as favoured by small jobs. Oosterman et
al. (2000) suggest that a 2-Erlang distribution may be a better approach (than the exponential
distribution) to modelling the processing times found in real-life job shops and most studies since
Oosterman et al. (2000) have adopted this distribution. The simulations described herein use
both exponentially distributed and 2-Erlang distributed processing times in order to analyze the
implications of the choice of distribution.
In an extension, this paper also seeks to build on recent research by Hendry et al. (2008)
who investigated issues arising from implementing WLC through comparative case study analysis.
The authors examined two implementation projects, one at a capital goods manufacturer in The
Netherlands and one at a subcontract engineering �rm in the UK. The authors investigated how
implementation issues that arise in the context of WLC should be addressed to enable improved
implementation in practice. The study identi�ed seventeen implementation issues and raised a
series of research questions. These include: "how can future, replacement part, rush orders be con-
sidered most e�ectively within the WLC concept?" One solution the authors suggest is reserving
a percentage of capacity for rush orders; however, while suggestions are made, the performance of
means of handling rush orders within a WLC system are not tested. After investigating the issue
of job size variation in this paper, the �ndings are used to explore this second important practical
problem. This paper represents a return from recent �eld research to a theory building and testing
environment and continues the recent trend in WLC research to more accurately re�ect practical
considerations in job shop simulations and in the development of theory in order to improve the
practical applicability of the methodology (e.g., Perona & Miragliotta, 2000; Bertrand & Van
Ooijen, 2002; Henrich et al., 2004b).
The remainder of this paper is organised as follows. Section 3.2 reviews literature on order
release mechanisms before the research method is outlined in Section 3.3. Section 3.4 describes the
simulation model and the di�erent approaches we investigate to address job size variation. Simu-
lation results are summarised and discussed in Section 3.5 before Section 3.6 extends the results
to the problem of how best to handle rush orders within the WLC concept. Final conclusions are
presented in Section 3.7.
3. Workload Control Release Mechanisms: From Practice Back to Theory Building
3.2 Literature Review
This review considers two core elements of this paper: (1) the in�uence of the size of a job on
performance; and, (2) order release mechanisms. Section 3.2.1 provides a short review of how job
size has been modelled in the literature before Section 3.2.2 explores order release mechanisms.
It is not our intention here to provide a comprehensive review of the literature on order release
mechanisms - many exhaustive reviews of the literature have previously been presented (e.g.,
Philipoom et al., 1993; Wisner, 1995; Bergamaschi et al., 1997; Sabuncuoglu & Karapinar, 1999).
However, two of the most important methodological aspects at the order release stage, included
in the classi�cation of order review/release mechanisms by Bergamaschi et al. (1997), are: the
way in which the methodology accounts for the workload of a job over time; and, the way in
which the workloads of shop �oor resources are bounded. The impact of processing times, a major
contributing factor to overall job size variation, on these two elements is considered before the
literature is assessed in Section 3.2.3.
For a broader review of production planning and control, see: Zäpfel & Missbauer (1993b)
and Stevenson et al., (2005). For a review of WLC, see Land & Gaalman (1996a).
3.2.1 Modelling Job Size Variation
A selection of previous WLC simulation studies is summarised in Table 7 based on the summary
of order review/release mechanisms by Wisner (1995). The table includes various approaches to
modelling processing times. Job size variation is evident in many of the models but the problem
which results from this variation is not addressed. It is also evident from Table 7 that recent
studies favour a 2-Erlang distribution, as previously described.
To the best of our knowledge, the contribution and in�uence of di�erent job sizes on overall
shop performance, and ways of accommodating job size variation, has not been explicitly consid-
ered. Papers typically seek to avoid the impact of job size variation, especially the presence of
large jobs, rather than to address the issue within the WLC methodology. Therefore, the pro-
cessing times generated are typically much smaller than the release intervals used in the studies,
avoiding problems in the relationship between the check period and the size of jobs, as noted by
Land (2006).
Other contributions disregard processing time variation even further. For example, alter-
native approaches to WLC, including card based methods like CONWIP, often do not consider
the size of jobs at all in the release decision. Instead, they control the number of cards (or jobs)
in circulation and treat each job in the same way. It is acknowledged that these simpli�cations
may re�ect the characteristics of the environment for which the methodologies are designed. For
example, Fowler et al. (2002) explain that in the semi-conductor industry, where CONWIP has
been implemented, it is not unreasonable to assume that processing times are constant. This is
not a reasonable assumption in many other contexts.
37
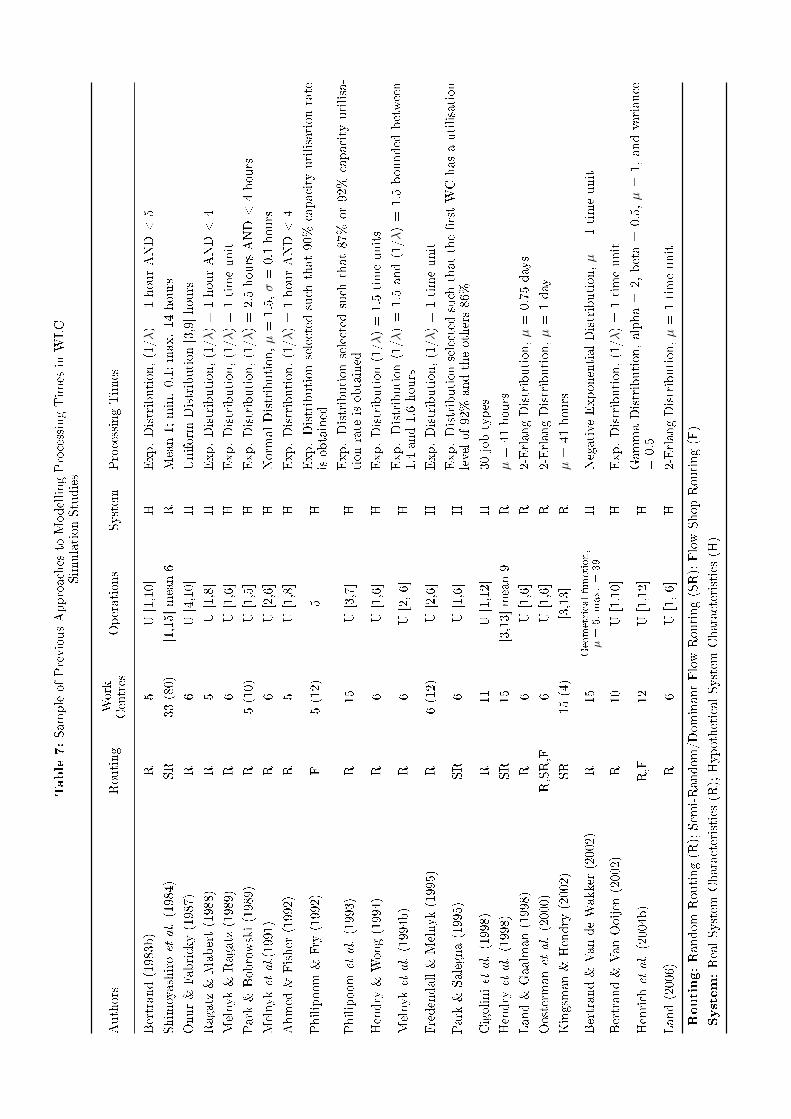
Table
7:SampleofPreviousApproaches
toModellingProcessingTimes
inWLC
SimulationStudies
Authors
Routing
Work
Centres
Operations
System
ProcessingTimes
Bertrand(1983b)
R5
U[1,10]
HExp.Distribution,(1/�)=1hourAND<5
Shimoyashiro
etal.(1984)
SR
33(80)
[1,15]mean6
RMean1;min.0.1;max.14hours
Onur&Fabricky(1987)
R6
U[4,10]
HUniform
Distribution[3,9]hours
Ragatz
&Mabert(1988)
R5
U[1,8]
HExp.Distribution,(1/�)=1hourAND<4
Melnyk&Ragatz
(1989)
R6
U[1,6]
HExp.Distribution,(1/�)=1timeunit
Park
&Bobrowski(1989)
R5(10)
U[1,5]
HExp.Distribution,(1/�)=2.5hoursAND<4hours
Melnyk
etal.(1991)
R6
U[2,6]
HNorm
alDistribution,�=1.5,�=0.1hours
Ahmed
&Fisher
(1992)
R5
U[1,8]
HExp.Distribution,(1/�)=1hourAND<4
Philipoom
&Fry
(1992)
F5(12)
5H
Exp.Distributionselected
such
that90%
capacity
utilisationrate
isobtained
Philipoom
etal.(1993)
R15
U[3,7]
HExp.Distributionselected
such
that87%
or92%
capacity
utilisa-
tionrate
isobtained
Hendry
&Wong(1994)
R6
U[1,6]
HExp.Distribution(1/�)=1.5timeunits
Melnyk
etal.(1994b)
R6
U[2,6]
HExp.Distribution(1/�)=
1.5
and(1/�)=
1.5
bounded
between
1.4and1.6hours
Fredendall&Melnyk(1995)
R6(12)
U[2,6]
HExp.Distribution,(1/�)=1timeunit
Park
&Salegna(1995)
SR
6U[1,6]
HExp.Distributionselected
such
thatthe�rstWChasautilisation
levelof92%
andtheothers86%
Cigolinietal.(1998)
R11
U[1,12]
H30jobtypes
Hendry
etal.(1998)
SR
15
[3,13]mean9
R�=41hours
Land&Gaalman(1998)
R6
U[1,6]
R2-ErlangDistribution,�=0.75days
Oosterman
etal.(2000)
R,SR,F
6U[1,6]
R2-ErlangDistribution,�=1day
Kingsm
an&Hendry
(2002)
SR
15(4)
[3,13]
R�=41hours
Bertrand&VandeWakker
(2002)
R15
Geometricalfunction,
�=
5,max.=
39
HNegative
ExponentialDistribution,�=1timeunit
Bertrand&VanOoijen
(2002)
R10
U[1,10]
HExp.Distribution,(1/�)=1timeunit
Henrich
etal.(2004b)
R,F
12
U[1,12]
HGammaDistribution,alpha=
2,beta=
0.5,�=
1,andvariance
=0.5
Land(2006)
R6
U[1,6]
H2-ErlangDistribution,�=1timeunit
Routing:Random
Routing(R
);Sem
i-Random/DominantFlowRouting(SR);FlowShopRouting(F)
System:RealSystem
Characteristics
(R);HypotheticalSystem
Characteristics
(H)
3. Workload Control Release Mechanisms: From Practice Back to Theory Building
3.2.2 The Impact of Processing Times on Two Aspects of Order Release Mechanisms
There are three notable approaches to accounting for the workload of a job over time when it is
being considered for release:
1. Aggregate load approaches attribute the workload of a job to relevant work centres at the
moment of release irrespective of the routing of a job prior to arrival at a work centre (e.g.,
Bertrand & Wortmann, 1981; Hendry & Kingsman, 1991a; Kingsman, 2000; Kingsman &
Hendry, 2002; Stevenson, 2006a; Stevenson & Hendry, 2006). The workload hence includes
direct and indirect load without distinguishing between the two. The traditional aggregate
load method pays particular attention to the set-up and processing times of jobs in the
determination of the workload but has been criticised for having di�culty in providing
su�cient control in job shop simulations (e.g., Perona & Portioli, 1998; Oosterman et al.,
2000). Adaptations of the traditional aggregate load approach include the corrected and
extended aggregate load approaches.
2. Probabilistic approaches (e.g., Bechte, 1988 and 1994; Wiendahl, 1995) assign a percentage
of the workload of a job to relevant work centres at release, based on the probability of
the job reaching the work centre in the planning period. Breithaupt et al. (2002) criticise
probabilistic approaches for neglecting the in�uence of processing times on order progress.
3. Time bucketing approaches (e.g., Bobrowski, 1989) divide the planning horizon into load
periods/time buckets; forward or backward scheduling is then used to assign a job to a load
period and it is only included in the period for which it will be the direct load. In recent
years, the time bucketing approach has received little attention in the literature.
Of the above approaches, job size variation has a particularly detrimental e�ect on the
aggregate load release method. For example, in relation to the traditional aggregate load approach
to WLC:
∙ When a large job is released, it will have a big impact on the current workloads of all work
centres in its routing, even when it is queuing or being processed elsewhere. This can distort
the 'true state' of the shop �oor and a�ect the release of other jobs from the pool. It could
result in some work centres being left idle and others overloaded.
∙ Grouping machines can improve the timeliness of feedback information from the shop �oor.
This can be particularly important for the aggregate load method; however, when process-
ing times are large, the workload requirements of a job can be misrepresented if machine
capacities are grouped (see: Stevenson & Silva, 2008).
Workload bounding refers to the use of parameters to restrict the workload (e.g., on the shop
�oor). The bounding of the workload is related to the period between releases. Perona & Portioli
(1998) demonstrate the need to adjust the interval between releases when considering small and
large orders. Large workload limits and long periods between releases would allow large jobs to
be released but would undermine overall control of workloads. Hence, a large release period may
39
solve one problem but deteriorate the speed of release for small jobs. If customers expect a short
delivery lead time for small orders, the increase in pool waiting time for these orders may a�ect
due date adherence.
Traditionally, the workload is controlled using maximum and/or minimum bounds (or norms).
A key research challenge is determining the level at which to set workload norms. This is a subject
of much debate. Enns & Prongue Costa (2002) advise that a control level set too high is ine�ective
but that too low a level provides inadequate throughput. Land (2004) shows that although tight-
ening workload norms hinders the timing of job release, queues on the shop �oor �uctuate less and
suggests that the di�culties experienced by jobs with long routings and/or large processing times
when norms are tight can be compensated for by increasing job priority. It is rare that research
in this area considers the impact of large jobs on the bounding of workloads; exceptions include:
Bechte (1988), Hendry (1989) and Cigolini & Portioli-Staudacher (2002). When the load limit
is reached in Bechte's (1988) probabilistic approach, release is continued for one additional job
that would visit the fully loaded work centre. Similarly, Hendry (1989) describes a 'Force Release'
mechanism which allows the user to release a job which would exceed the upper bound of one or
more shop �oor resources. Cigolini & Portioli-Staudacher (2002) describe a workload balancing
procedure based upon striking a balance between improving utilisation at an under-loaded work
centre at risk of starvation at the expense of overload elsewhere. Individual work centres can be
overloaded as long as the overall workload balance across all work centres is improved. These
solutions provide �exibility which goes some way to allowing large jobs to be released.
3.2.3 Assessment of the Literature
Job size variation is an important problem impacting the performance of existing WLC theory at
the order release stage but one which has received insu�cient attention to date. Existing theory
has a tendency to treat all jobs equally. In contrast, it is argued here that where there are distinct
di�erences in job size, disregarding the impact of this variation is inappropriate and such models
are unlikely to result in an e�ective solution for all jobs. In what follows, we acknowledge that
small jobs have di�erent requirements to large jobs and experiment with adapting the release
mechanism to re�ect this. This includes allowing the workload norm to be exceeded (from Bechte,
1988) and increasing job priority for large jobs (from Land, 2004).
Job size variation has a particularly detrimental e�ect on the aggregate load method and
hence it is the method in most need of development. Moreover, this is the simplest method and,
given that it is argued that managers prefer simplicity, is considered the one most likely to be
successfully implemented in practice. Therefore, the study will use aggregate load methods as the
basis for workload accounting over time (the traditional, corrected and extended aggregate load
methods). With regards to workload bounding: di�culties in setting e�ective workload norms
may be caused by attempting to �nd a single bound that will meet the needs of all jobs. Therefore,
we try to accommodate di�erences between groups of jobs more explicitly within the bounding of
the WLC concept.
3. Workload Control Release Mechanisms: From Practice Back to Theory Building
3.3 Methodology
3.3.1 Empirical Grounding for the Study
Recent case study research (see: Stevenson, 2006a/b; Silva et al., 2006; Hendry et al., 2008;
Stevenson & Silva, 2008) identi�ed practical considerations which a�ect how the WLC concept
is used in practice. Among these is the importance of accommodating processing time variation
within the WLC methodology, thus providing an empirical grounding for this study.
Company M (see: Silva et al., 2006 and Stevenson & Silva, 2008) produce one-o� aluminium
moulds for pre-series production and steel mould components for large series production (e.g.,
for the automotive and electronics industries). Each aluminium mould is engineered-to-order
and typically comprises of a large number of components, some are very simple, others are more
complex. Processing time variation across jobs is prominent, which results in high job size variation.
Under the WLC concept that Silva et al. (2006) attempted to implement, all components had to
'compete' against each other for the same set of resources; this led to implementation problems
and resulted in large jobs performing worse than small jobs. The poor performance of large jobs
was particularly striking if one considered that the relative gross throughput time of large jobs
should be smaller than the relative gross throughput of small jobs if delivery lead times are to be
competitive. Even if small and large jobs performed equally well, based on gross throughput time
as a percentage of a job's work content, the lateness of large jobs was not acceptable while, in
contrast, a degree of deterioration in the performance of small jobs would be 'acceptable'. Thus,
to di�erentiate according to job size, and to �nd an optimal balance between the requirements of
job sizes, appeared to be vital in order to implement the system successfully in this context. The
authors have observed a similar phenomenon in a very di�erent production setting - a plastic bag
manufacturer. The majority of production orders are processed in less than 24 hours but, like in
Company M, a signi�cant proportion take more than one working day. Unlike in Company M,
this is not due to di�ering product complexity but to di�ering order quantities. Again, job size
variation caused signi�cant problems for the application of existing WLC theory in this company.
3.3.2 Research Questions
To overcome the detrimental e�ect of job size variation on performance, as noted from the literature
and observed in practice, the research began with the following questions:
1. How can the existence of groups of 'small' and 'large' job sizes be best incorporated within
the order release mechanism of the Workload Control concept?
2. How can a balance between the requirements of 'small' and 'large' processing times be best
achieved in order to improve the release mechanism and overall shop performance?
The best way to explore this problem is considered to be through simulation; hence, this
study represents model-based research driven by empirical �ndings. Bertrand & Fransoo (2002)
explain that: �in this class of research, the primary concern of the researcher is to ensure that
41
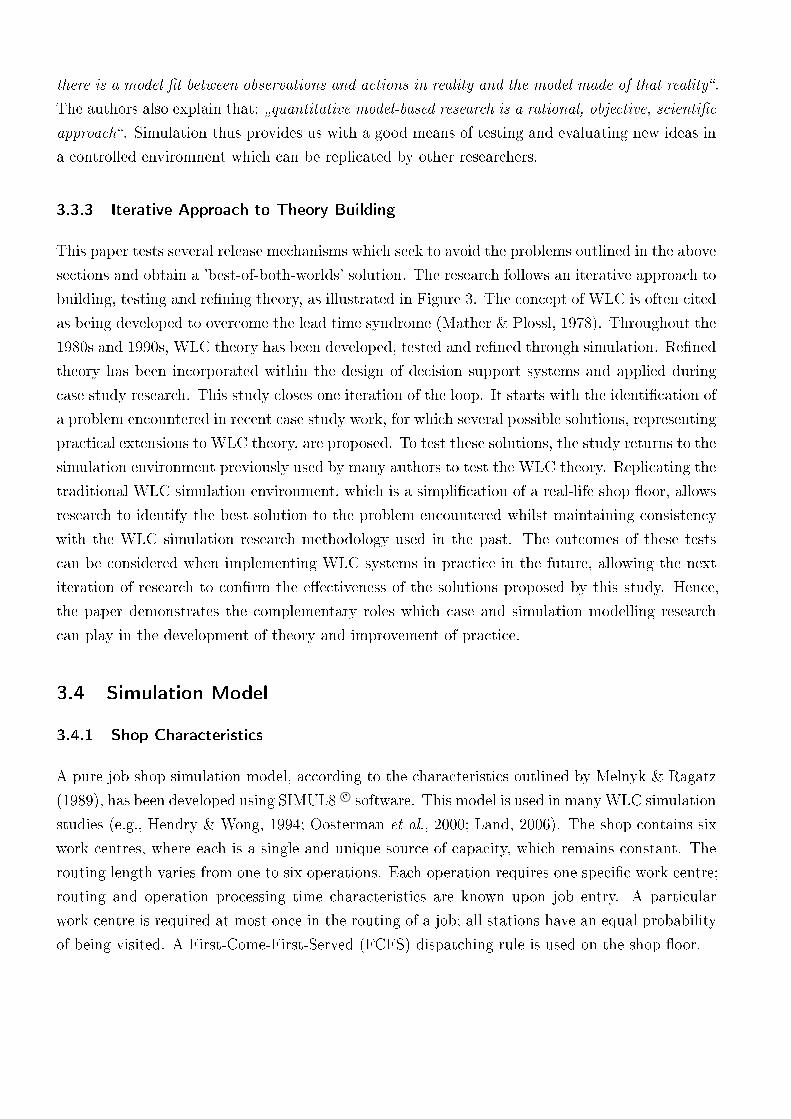
there is a model �t between observations and actions in reality and the model made of that reality�.
The authors also explain that: �quantitative model-based research is a rational, objective, scienti�c
approach�. Simulation thus provides us with a good means of testing and evaluating new ideas in
a controlled environment which can be replicated by other researchers.
3.3.3 Iterative Approach to Theory Building
This paper tests several release mechanisms which seek to avoid the problems outlined in the above
sections and obtain a 'best-of-both-worlds' solution. The research follows an iterative approach to
building, testing and re�ning theory, as illustrated in Figure 3. The concept of WLC is often cited
as being developed to overcome the lead time syndrome (Mather & Plossl, 1978). Throughout the
1980s and 1990s, WLC theory has been developed, tested and re�ned through simulation. Re�ned
theory has been incorporated within the design of decision support systems and applied during
case study research. This study closes one iteration of the loop. It starts with the identi�cation of
a problem encountered in recent case study work, for which several possible solutions, representing
practical extensions to WLC theory, are proposed. To test these solutions, the study returns to the
simulation environment previously used by many authors to test the WLC theory. Replicating the
traditional WLC simulation environment, which is a simpli�cation of a real-life shop �oor, allows
research to identify the best solution to the problem encountered whilst maintaining consistency
with the WLC simulation research methodology used in the past. The outcomes of these tests
can be considered when implementing WLC systems in practice in the future, allowing the next
iteration of research to con�rm the e�ectiveness of the solutions proposed by this study. Hence,
the paper demonstrates the complementary roles which case and simulation modelling research
can play in the development of theory and improvement of practice.
3.4 Simulation Model
3.4.1 Shop Characteristics
A pure job shop simulation model, according to the characteristics outlined by Melnyk & Ragatz
(1989), has been developed using SIMUL8 c⃝ software. This model is used in manyWLC simulation
studies (e.g., Hendry & Wong, 1994; Oosterman et al., 2000; Land, 2006). The shop contains six
work centres, where each is a single and unique source of capacity, which remains constant. The
routing length varies from one to six operations. Each operation requires one speci�c work centre;
routing and operation processing time characteristics are known upon job entry. A particular
work centre is required at most once in the routing of a job; all stations have an equal probability
of being visited. A First-Come-First-Served (FCFS) dispatching rule is used on the shop �oor.
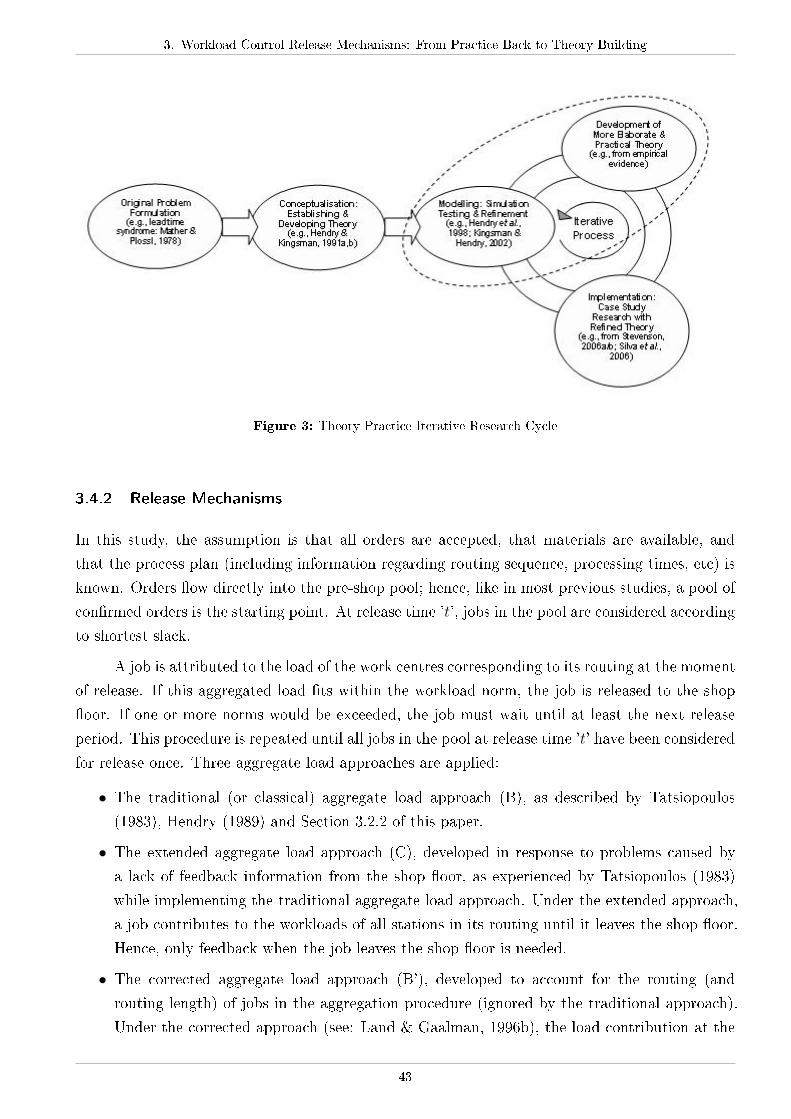
3. Workload Control Release Mechanisms: From Practice Back to Theory Building
Figure 3: Theory-Practice Iterative Research Cycle
3.4.2 Release Mechanisms
In this study, the assumption is that all orders are accepted, that materials are available, and
that the process plan (including information regarding routing sequence, processing times, etc) is
known. Orders �ow directly into the pre-shop pool; hence, like in most previous studies, a pool of
con�rmed orders is the starting point. At release time 't', jobs in the pool are considered according
to shortest slack.
A job is attributed to the load of the work centres corresponding to its routing at the moment
of release. If this aggregated load �ts within the workload norm, the job is released to the shop
�oor. If one or more norms would be exceeded, the job must wait until at least the next release
period. This procedure is repeated until all jobs in the pool at release time 't' have been considered
for release once. Three aggregate load approaches are applied:
∙ The traditional (or classical) aggregate load approach (B), as described by Tatsiopoulos
(1983), Hendry (1989) and Section 3.2.2 of this paper.
∙ The extended aggregate load approach (C), developed in response to problems caused by
a lack of feedback information from the shop �oor, as experienced by Tatsiopoulos (1983)
while implementing the traditional aggregate load approach. Under the extended approach,
a job contributes to the workloads of all stations in its routing until it leaves the shop �oor.
Hence, only feedback when the job leaves the shop �oor is needed.
∙ The corrected aggregate load approach (B'), developed to account for the routing (and
routing length) of jobs in the aggregation procedure (ignored by the traditional approach).
Under the corrected approach (see: Land & Gaalman, 1996b), the load contribution at the
43
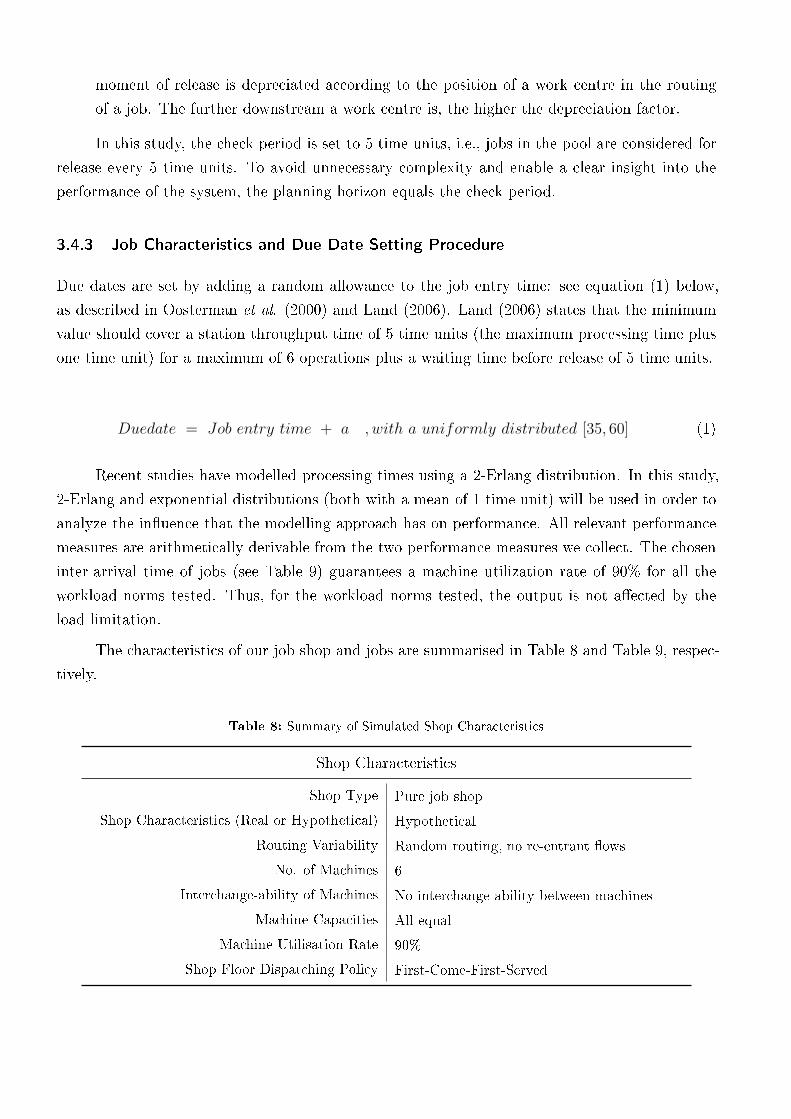
moment of release is depreciated according to the position of a work centre in the routing
of a job. The further downstream a work centre is, the higher the depreciation factor.
In this study, the check period is set to 5 time units, i.e., jobs in the pool are considered for
release every 5 time units. To avoid unnecessary complexity and enable a clear insight into the
performance of the system, the planning horizon equals the check period.
3.4.3 Job Characteristics and Due Date Setting Procedure
Due dates are set by adding a random allowance to the job entry time: see equation (1) below,
as described in Oosterman et al. (2000) and Land (2006). Land (2006) states that the minimum
value should cover a station throughput time of 5 time units (the maximum processing time plus
one time unit) for a maximum of 6 operations plus a waiting time before release of 5 time units.
Duedate = Job entry time + a , witℎ a uniformly distributed [35, 60] (1)
Recent studies have modelled processing times using a 2-Erlang distribution. In this study,
2-Erlang and exponential distributions (both with a mean of 1 time unit) will be used in order to
analyze the in�uence that the modelling approach has on performance. All relevant performance
measures are arithmetically derivable from the two performance measures we collect. The chosen
inter-arrival time of jobs (see Table 9) guarantees a machine utilization rate of 90% for all the
workload norms tested. Thus, for the workload norms tested, the output is not a�ected by the
load limitation.
The characteristics of our job shop and jobs are summarised in Table 8 and Table 9, respec-
tively.
Table 8: Summary of Simulated Shop Characteristics
Shop Characteristics
Shop Type Pure job shop
Shop Characteristics (Real or Hypothetical) Hypothetical
Routing Variability Random routing, no re-entrant �ows
No. of Machines 6
Interchange-ability of Machines No interchange-ability between machines
Machine Capacities All equal
Machine Utilisation Rate 90%
Shop Floor Dispatching Policy First-Come-First-Served
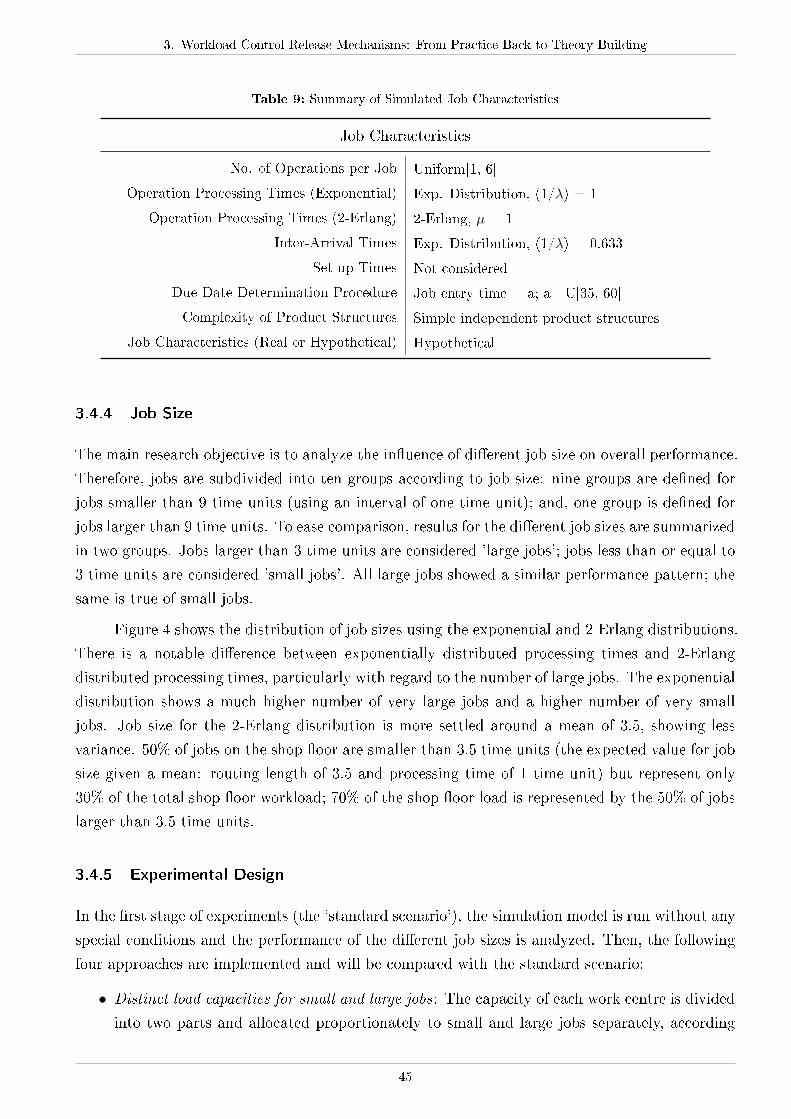
3. Workload Control Release Mechanisms: From Practice Back to Theory Building
Table 9: Summary of Simulated Job Characteristics
Job Characteristics
No. of Operations per Job Uniform[1, 6]
Operation Processing Times (Exponential) Exp. Distribution, (1/�) = 1
Operation Processing Times (2-Erlang) 2-Erlang, � = 1
Inter-Arrival Times Exp. Distribution, (1/�) = 0.633
Set-up Times Not considered
Due Date Determination Procedure Job entry time + a; a U[35, 60]
Complexity of Product Structures Simple independent product structures
Job Characteristics (Real or Hypothetical) Hypothetical
3.4.4 Job Size
The main research objective is to analyze the in�uence of di�erent job size on overall performance.
Therefore, jobs are subdivided into ten groups according to job size: nine groups are de�ned for
jobs smaller than 9 time units (using an interval of one time unit); and, one group is de�ned for
jobs larger than 9 time units. To ease comparison, results for the di�erent job sizes are summarized
in two groups. Jobs larger than 3 time units are considered 'large jobs'; jobs less than or equal to
3 time units are considered 'small jobs'. All large jobs showed a similar performance pattern; the
same is true of small jobs.
Figure 4 shows the distribution of job sizes using the exponential and 2-Erlang distributions.
There is a notable di�erence between exponentially distributed processing times and 2-Erlang
distributed processing times, particularly with regard to the number of large jobs. The exponential
distribution shows a much higher number of very large jobs and a higher number of very small
jobs. Job size for the 2-Erlang distribution is more settled around a mean of 3.5, showing less
variance. 50% of jobs on the shop �oor are smaller than 3.5 time units (the expected value for job
size given a mean: routing length of 3.5 and processing time of 1 time unit) but represent only
30% of the total shop �oor workload; 70% of the shop �oor load is represented by the 50% of jobs
larger than 3.5 time units.
3.4.5 Experimental Design
In the �rst stage of experiments (the 'standard scenario'), the simulation model is run without any
special conditions and the performance of the di�erent job sizes is analyzed. Then, the following
four approaches are implemented and will be compared with the standard scenario:
∙ Distinct load capacities for small and large jobs : The capacity of each work centre is divided
into two parts and allocated proportionately to small and large jobs separately, according
45
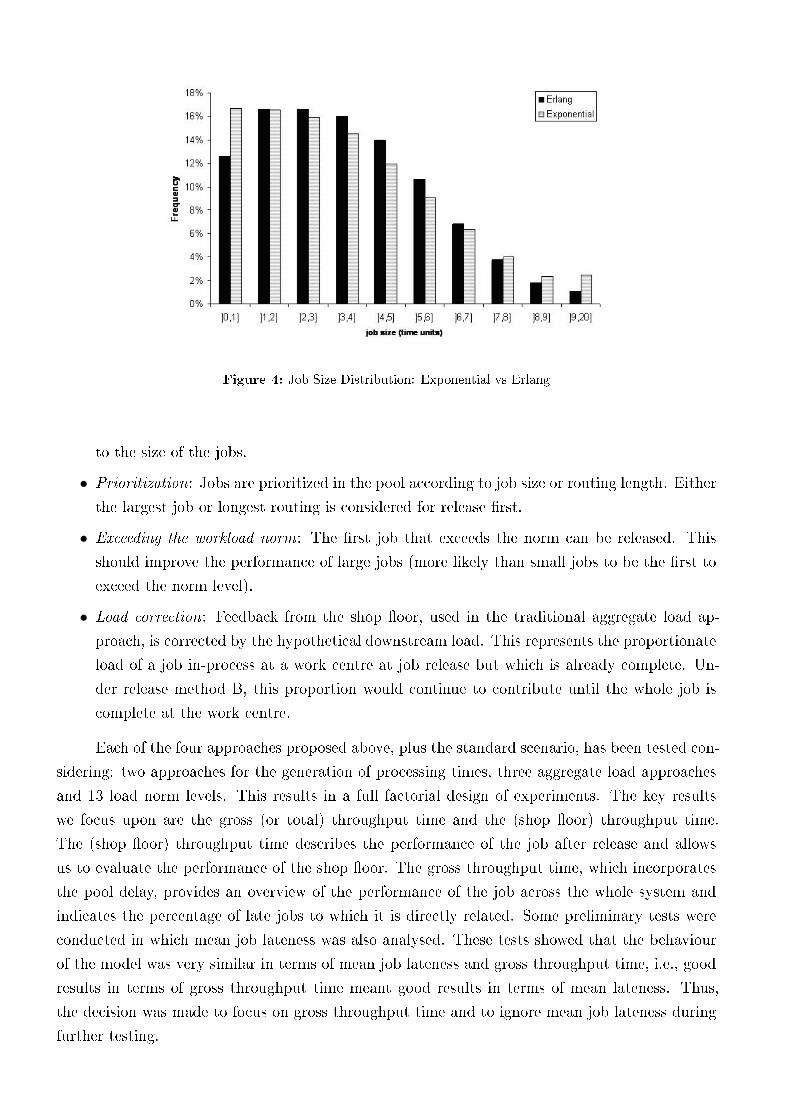
Figure 4: Job Size Distribution: Exponential vs Erlang
to the size of the jobs.
∙ Prioritization: Jobs are prioritized in the pool according to job size or routing length. Either
the largest job or longest routing is considered for release �rst.
∙ Exceeding the workload norm: The �rst job that exceeds the norm can be released. This
should improve the performance of large jobs (more likely than small jobs to be the �rst to
exceed the norm level).
∙ Load correction: Feedback from the shop �oor, used in the traditional aggregate load ap-
proach, is corrected by the hypothetical downstream load. This represents the proportionate
load of a job in-process at a work centre at job release but which is already complete. Un-
der release method B, this proportion would continue to contribute until the whole job is
complete at the work centre.
Each of the four approaches proposed above, plus the standard scenario, has been tested con-
sidering: two approaches for the generation of processing times, three aggregate load approaches
and 13 load norm levels. This results in a full factorial design of experiments. The key results
we focus upon are the gross (or total) throughput time and the (shop �oor) throughput time.
The (shop �oor) throughput time describes the performance of the job after release and allows
us to evaluate the performance of the shop �oor. The gross throughput time, which incorporates
the pool delay, provides an overview of the performance of the job across the whole system and
indicates the percentage of late jobs to which it is directly related. Some preliminary tests were
conducted in which mean job lateness was also analysed. These tests showed that the behaviour
of the model was very similar in terms of mean job lateness and gross throughput time, i.e., good
results in terms of gross throughput time meant good results in terms of mean lateness. Thus,
the decision was made to focus on gross throughput time and to ignore mean job lateness during
further testing.

3. Workload Control Release Mechanisms: From Practice Back to Theory Building
Results are obtained by tightening the norm level stepwise down from in�nity, represented
by the right-hand starting point of the curves which follow in Section 3.5 and Section 3.6 (see
Figures 5-13). A norm level of 100% is equivalent to the critical workload norm. The critical
workload norm represents the point where the throughput time ceases to decrease, while the gross
throughput time continues to rise; this will be determined empirically. Each experiment consists
of 100 runs; results are collected over 10000 time units; the warm-up period is set to 3000 time
units to avoid start-up e�ects.
3.5 Results
3.5.1 Results for the Standard Scenario
Figures 5 and 6 show the results for release method B, the traditional aggregate load approach,
under the standard scenario. As the norm is tightened, the shop �oor throughput time is reduced,
caused by a reduction in the average waiting time in front of work centres. This, however, does
not necessarily imply a reduction in the gross throughput time when the time in the pre-shop pool
is also considered.
Figure 5: Performance of Approach B under Standard Scenario (2-Erlang)
From the �gures, it can also be concluded that in the standard scenario, large jobs generally
perform worse than small jobs (particularly noticeable if processing times are exponentially dis-
tributed due to the greater job size variance). For both distributions, the gross throughput time
for large jobs is high relative to that for small jobs. To minimise the percentage of late jobs, the
delivery lead time has to be large but this reduces the competitiveness of due date quotations a
company can realistically make at the customer enquiry stage. Similar results, consistent with
those obtained by Oosterman et al. (2000), have been obtained for the corrected and extended
aggregate load approaches. The corrected approach performs the best out of the three and the
47

Figure 6: Performance of Approach B under Standard Scenario (Exponential)
extended approach performs the worst.
3.5.2 Results Based on Di�erent Load Capacities for Small and Large Jobs
One of the simplest potential solutions to our problem is to use di�erent norm levels for small
and large jobs and to distribute the load capacity of the shop �oor proportionately according
to the processing times of jobs. While this appears simple, using more than one norm increases
the check period because capacity must be provided for both norms, leading to a greater gross
throughput time. A longer period between releases implies a longer pool delay, which cannot be
fully compensated for by any resulting gain in performance. To compensate, two solutions have
been explored: (1) using di�erent workload norms and check periods for small and large jobs;
and, (2) using two di�erent check periods for small and large jobs but the same resources of load
capacity. Consider the following:
1. Using two di�erent workload norms and check periods for small and large jobs leads to
another challenge - how to set them, given that the load capacity and check period are inter-
dependent? At each release point for small jobs, a percentage of capacity is kept free for
large jobs. The minimum check period for large jobs is the period needed to provide enough
free capacity for the release of large jobs (based on the maximum processing time). The
more capacity reserved, the sooner large jobs can be released; this implies a shorter check
period for large jobs and a larger check period for small jobs. Each improvement for one job
size leads to a deterioration for the other. Moreover, if only large jobs, and thus only large
processing times are released, 'load gaps' begin to emerge which would otherwise be �lled
by jobs with a small workload contribution.
2. Typical applications of using two di�erent check periods, but where all jobs rely on the
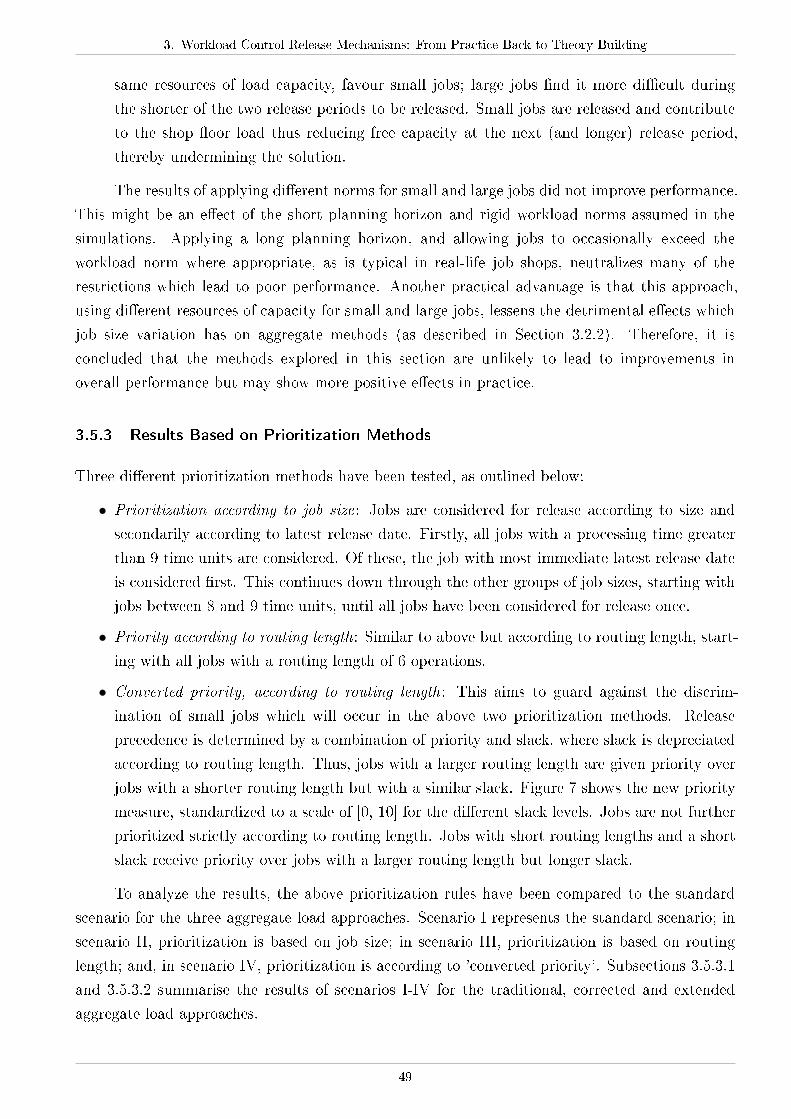
3. Workload Control Release Mechanisms: From Practice Back to Theory Building
same resources of load capacity, favour small jobs; large jobs �nd it more di�cult during
the shorter of the two release periods to be released. Small jobs are released and contribute
to the shop �oor load thus reducing free capacity at the next (and longer) release period,
thereby undermining the solution.
The results of applying di�erent norms for small and large jobs did not improve performance.
This might be an e�ect of the short planning horizon and rigid workload norms assumed in the
simulations. Applying a long planning horizon, and allowing jobs to occasionally exceed the
workload norm where appropriate, as is typical in real-life job shops, neutralizes many of the
restrictions which lead to poor performance. Another practical advantage is that this approach,
using di�erent resources of capacity for small and large jobs, lessens the detrimental e�ects which
job size variation has on aggregate methods (as described in Section 3.2.2). Therefore, it is
concluded that the methods explored in this section are unlikely to lead to improvements in
overall performance but may show more positive e�ects in practice.
3.5.3 Results Based on Prioritization Methods
Three di�erent prioritization methods have been tested, as outlined below:
∙ Prioritization according to job size: Jobs are considered for release according to size and
secondarily according to latest release date. Firstly, all jobs with a processing time greater
than 9 time units are considered. Of these, the job with most immediate latest release date
is considered �rst. This continues down through the other groups of job sizes, starting with
jobs between 8 and 9 time units, until all jobs have been considered for release once.
∙ Priority according to routing length: Similar to above but according to routing length, start-
ing with all jobs with a routing length of 6 operations.
∙ Converted priority, according to routing length: This aims to guard against the discrim-
ination of small jobs which will occur in the above two prioritization methods. Release
precedence is determined by a combination of priority and slack, where slack is depreciated
according to routing length. Thus, jobs with a larger routing length are given priority over
jobs with a shorter routing length but with a similar slack. Figure 7 shows the new priority
measure, standardized to a scale of [0, 10] for the di�erent slack levels. Jobs are not further
prioritized strictly according to routing length. Jobs with short routing lengths and a short
slack receive priority over jobs with a larger routing length but longer slack.
To analyze the results, the above prioritization rules have been compared to the standard
scenario for the three aggregate load approaches. Scenario I represents the standard scenario; in
scenario II, prioritization is based on job size; in scenario III, prioritization is based on routing
length; and, in scenario IV, prioritization is according to 'converted priority'. Subsections 3.5.3.1
and 3.5.3.2 summarise the results of scenarios I-IV for the traditional, corrected and extended
aggregate load approaches.
49
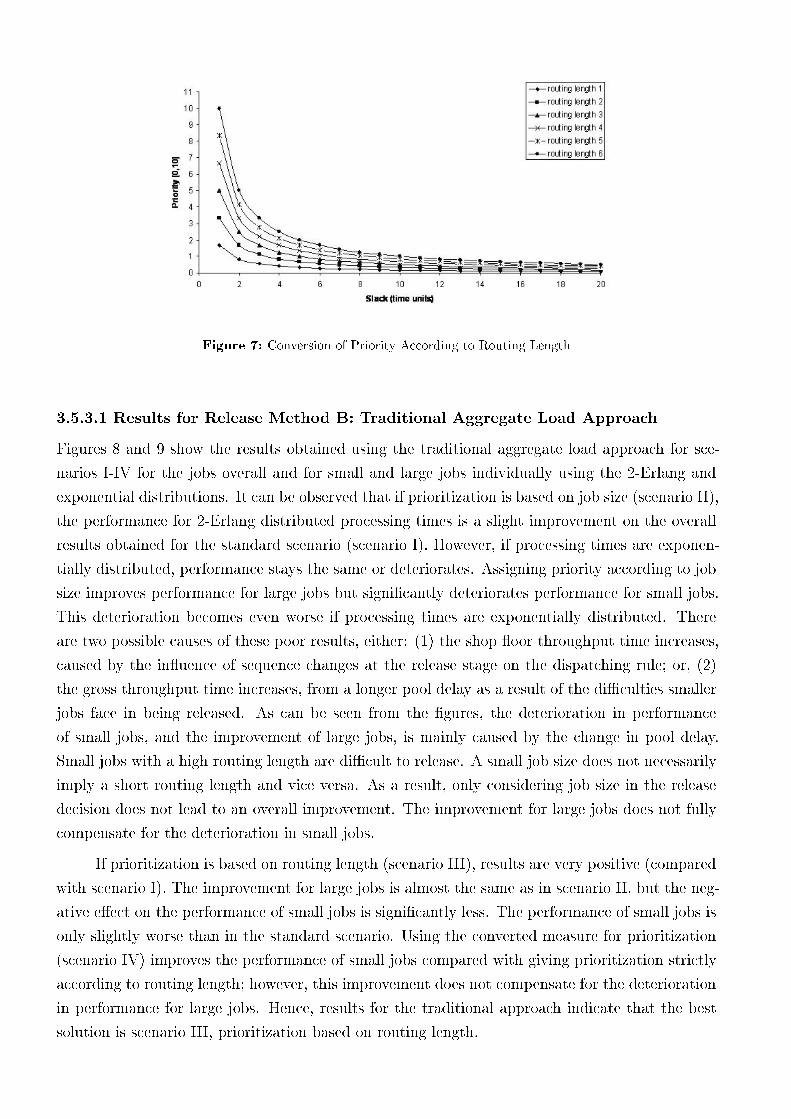
Figure 7: Conversion of Priority According to Routing Length
3.5.3.1 Results for Release Method B: Traditional Aggregate Load Approach
Figures 8 and 9 show the results obtained using the traditional aggregate load approach for sce-
narios I-IV for the jobs overall and for small and large jobs individually using the 2-Erlang and
exponential distributions. It can be observed that if prioritization is based on job size (scenario II),
the performance for 2-Erlang distributed processing times is a slight improvement on the overall
results obtained for the standard scenario (scenario I). However, if processing times are exponen-
tially distributed, performance stays the same or deteriorates. Assigning priority according to job
size improves performance for large jobs but signi�cantly deteriorates performance for small jobs.
This deterioration becomes even worse if processing times are exponentially distributed. There
are two possible causes of these poor results, either: (1) the shop �oor throughput time increases,
caused by the in�uence of sequence changes at the release stage on the dispatching rule; or, (2)
the gross throughput time increases, from a longer pool delay as a result of the di�culties smaller
jobs face in being released. As can be seen from the �gures, the deterioration in performance
of small jobs, and the improvement of large jobs, is mainly caused by the change in pool delay.
Small jobs with a high routing length are di�cult to release. A small job size does not necessarily
imply a short routing length and vice versa. As a result, only considering job size in the release
decision does not lead to an overall improvement. The improvement for large jobs does not fully
compensate for the deterioration in small jobs.
If prioritization is based on routing length (scenario III), results are very positive (compared
with scenario I). The improvement for large jobs is almost the same as in scenario II, but the neg-
ative e�ect on the performance of small jobs is signi�cantly less. The performance of small jobs is
only slightly worse than in the standard scenario. Using the converted measure for prioritization
(scenario IV) improves the performance of small jobs compared with giving prioritization strictly
according to routing length; however, this improvement does not compensate for the deterioration
in performance for large jobs. Hence, results for the traditional approach indicate that the best
solution is scenario III, prioritization based on routing length.

3. Workload Control Release Mechanisms: From Practice Back to Theory Building
Figure 8: Performance of Approach B with Prioritisation (2-Erlang)
Figure 9: Performance of Approach B with Prioritisation (Exponential)
3.5.3.2 Results for Release Methods B' & C: Corrected and Extended Aggregate
Loads
Figures 10 and 11 summarise the results for release method B' (the corrected load approach)
for scenarios I-IV for the jobs overall and for small and large jobs individually. Results are very
similar to those for the traditional approach. As previously, basing prioritization on routing length
(scenario III) yields the best results. Prioritization according to job size (scenario II) yields slightly
better results for large jobs than above but results in extremely poor performance for small jobs;
the converted priority approach (scenario IV) leads to a slight improvement in the performance
51
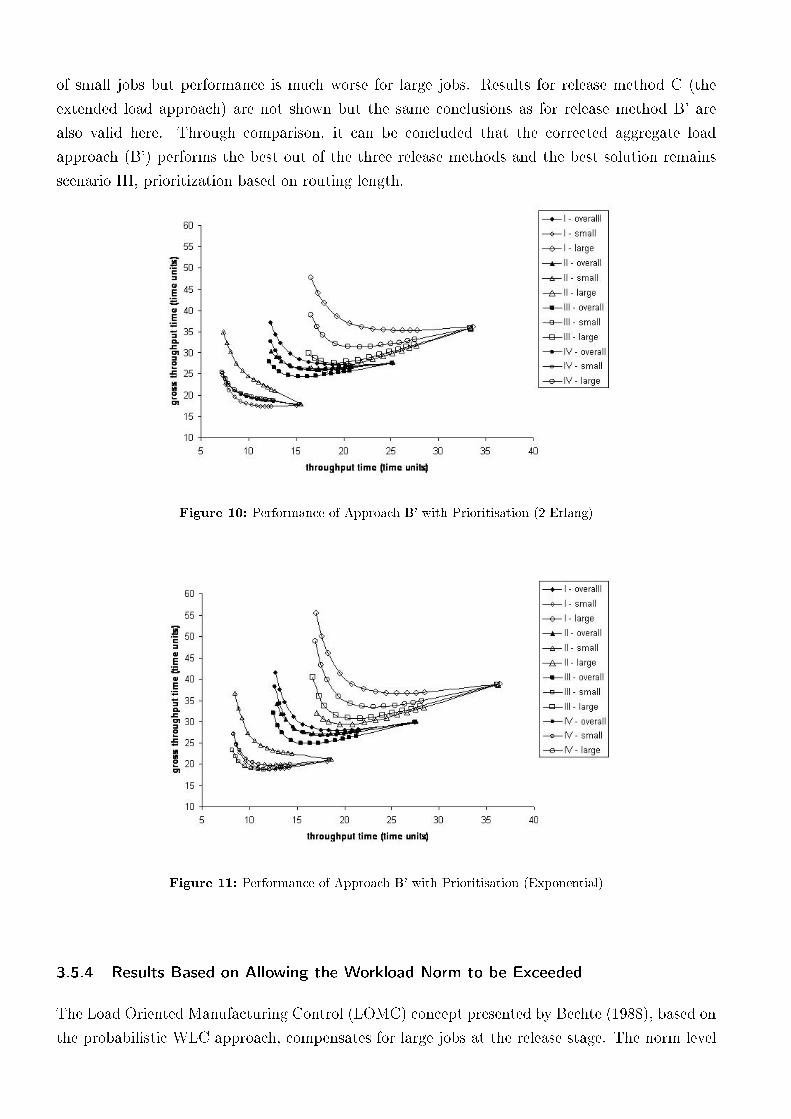
of small jobs but performance is much worse for large jobs. Results for release method C (the
extended load approach) are not shown but the same conclusions as for release method B' are
also valid here. Through comparison, it can be concluded that the corrected aggregate load
approach (B') performs the best out of the three release methods and the best solution remains
scenario III, prioritization based on routing length.
Figure 10: Performance of Approach B' with Prioritisation (2-Erlang)
Figure 11: Performance of Approach B' with Prioritisation (Exponential)
3.5.4 Results Based on Allowing the Workload Norm to be Exceeded
The Load Oriented Manufacturing Control (LOMC) concept presented by Bechte (1988), based on
the probabilistic WLC approach, compensates for large jobs at the release stage. The norm level
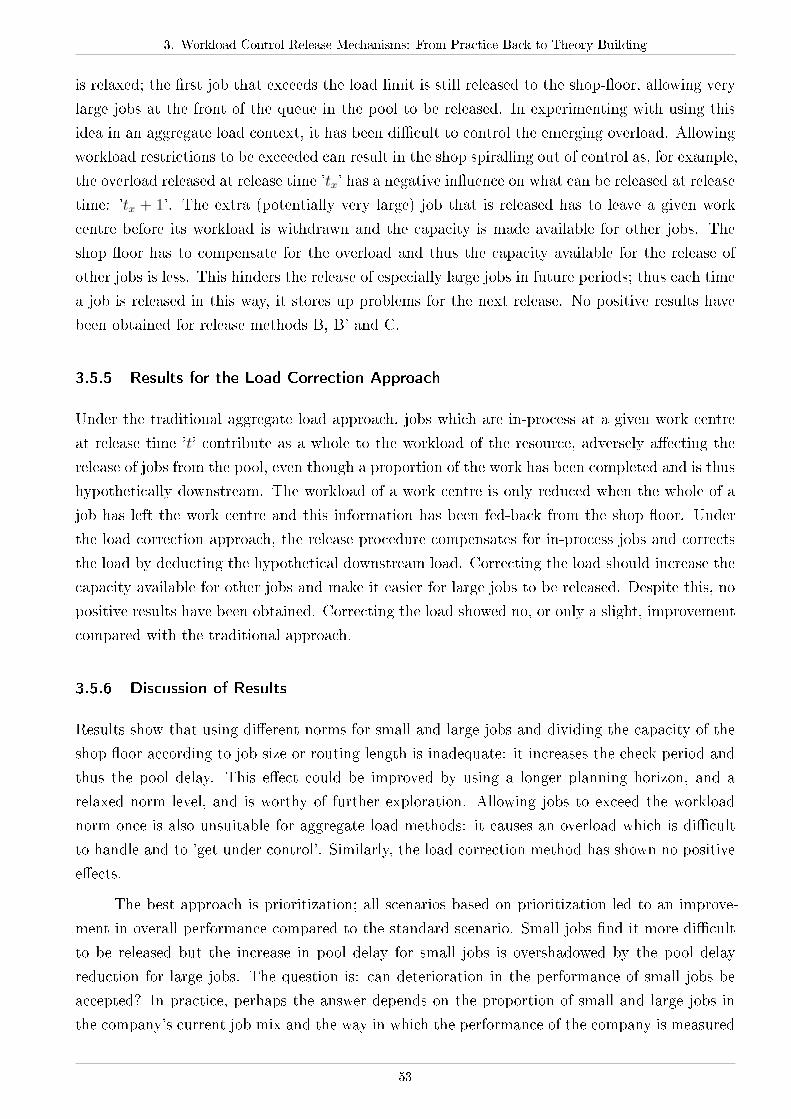
3. Workload Control Release Mechanisms: From Practice Back to Theory Building
is relaxed; the �rst job that exceeds the load limit is still released to the shop-�oor, allowing very
large jobs at the front of the queue in the pool to be released. In experimenting with using this
idea in an aggregate load context, it has been di�cult to control the emerging overload. Allowing
workload restrictions to be exceeded can result in the shop spiralling out of control as, for example,
the overload released at release time 'tx' has a negative in�uence on what can be released at release
time: 'tx + 1'. The extra (potentially very large) job that is released has to leave a given work
centre before its workload is withdrawn and the capacity is made available for other jobs. The
shop �oor has to compensate for the overload and thus the capacity available for the release of
other jobs is less. This hinders the release of especially large jobs in future periods; thus each time
a job is released in this way, it stores up problems for the next release. No positive results have
been obtained for release methods B, B' and C.
3.5.5 Results for the Load Correction Approach
Under the traditional aggregate load approach, jobs which are in-process at a given work centre
at release time 't' contribute as a whole to the workload of the resource, adversely a�ecting the
release of jobs from the pool, even though a proportion of the work has been completed and is thus
hypothetically downstream. The workload of a work centre is only reduced when the whole of a
job has left the work centre and this information has been fed-back from the shop �oor. Under
the load correction approach, the release procedure compensates for in-process jobs and corrects
the load by deducting the hypothetical downstream load. Correcting the load should increase the
capacity available for other jobs and make it easier for large jobs to be released. Despite this, no
positive results have been obtained. Correcting the load showed no, or only a slight, improvement
compared with the traditional approach.
3.5.6 Discussion of Results
Results show that using di�erent norms for small and large jobs and dividing the capacity of the
shop �oor according to job size or routing length is inadequate: it increases the check period and
thus the pool delay. This e�ect could be improved by using a longer planning horizon, and a
relaxed norm level, and is worthy of further exploration. Allowing jobs to exceed the workload
norm once is also unsuitable for aggregate load methods: it causes an overload which is di�cult
to handle and to 'get under control'. Similarly, the load correction method has shown no positive
e�ects.
The best approach is prioritization; all scenarios based on prioritization led to an improve-
ment in overall performance compared to the standard scenario. Small jobs �nd it more di�cult
to be released but the increase in pool delay for small jobs is overshadowed by the pool delay
reduction for large jobs. The question is: can deterioration in the performance of small jobs be
accepted? In practice, perhaps the answer depends on the proportion of small and large jobs in
the company's current job mix and the way in which the performance of the company is measured
53
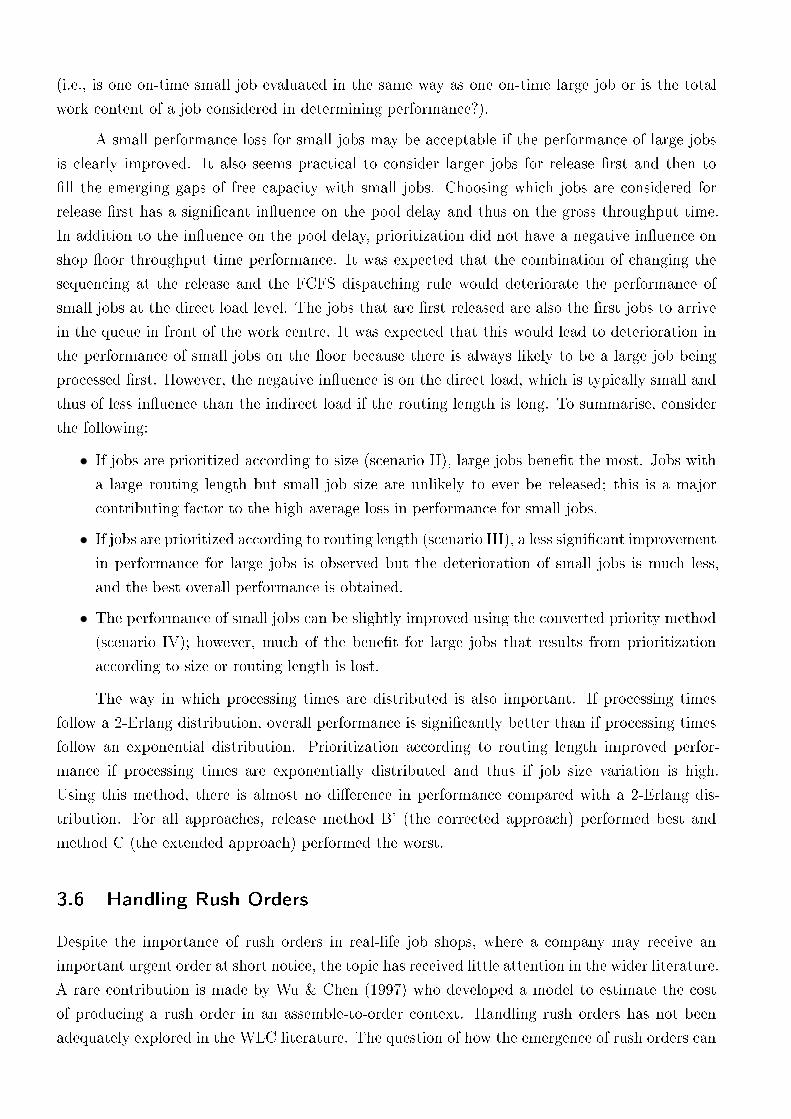
(i.e., is one on-time small job evaluated in the same way as one on-time large job or is the total
work content of a job considered in determining performance?).
A small performance loss for small jobs may be acceptable if the performance of large jobs
is clearly improved. It also seems practical to consider larger jobs for release �rst and then to
�ll the emerging gaps of free capacity with small jobs. Choosing which jobs are considered for
release �rst has a signi�cant in�uence on the pool delay and thus on the gross throughput time.
In addition to the in�uence on the pool delay, prioritization did not have a negative in�uence on
shop �oor throughput time performance. It was expected that the combination of changing the
sequencing at the release and the FCFS dispatching rule would deteriorate the performance of
small jobs at the direct load level. The jobs that are �rst released are also the �rst jobs to arrive
in the queue in front of the work centre. It was expected that this would lead to deterioration in
the performance of small jobs on the �oor because there is always likely to be a large job being
processed �rst. However, the negative in�uence is on the direct load, which is typically small and
thus of less in�uence than the indirect load if the routing length is long. To summarise, consider
the following:
∙ If jobs are prioritized according to size (scenario II), large jobs bene�t the most. Jobs with
a large routing length but small job size are unlikely to ever be released; this is a major
contributing factor to the high average loss in performance for small jobs.
∙ If jobs are prioritized according to routing length (scenario III), a less signi�cant improvement
in performance for large jobs is observed but the deterioration of small jobs is much less,
and the best overall performance is obtained.
∙ The performance of small jobs can be slightly improved using the converted priority method
(scenario IV); however, much of the bene�t for large jobs that results from prioritization
according to size or routing length is lost.
The way in which processing times are distributed is also important. If processing times
follow a 2-Erlang distribution, overall performance is signi�cantly better than if processing times
follow an exponential distribution. Prioritization according to routing length improved perfor-
mance if processing times are exponentially distributed and thus if job size variation is high.
Using this method, there is almost no di�erence in performance compared with a 2-Erlang dis-
tribution. For all approaches, release method B' (the corrected approach) performed best and
method C (the extended approach) performed the worst.
3.6 Handling Rush Orders
Despite the importance of rush orders in real-life job shops, where a company may receive an
important urgent order at short notice, the topic has received little attention in the wider literature.
A rare contribution is made by Wu & Chen (1997) who developed a model to estimate the cost
of producing a rush order in an assemble-to-order context. Handling rush orders has not been
adequately explored in the WLC literature. The question of how the emergence of rush orders can
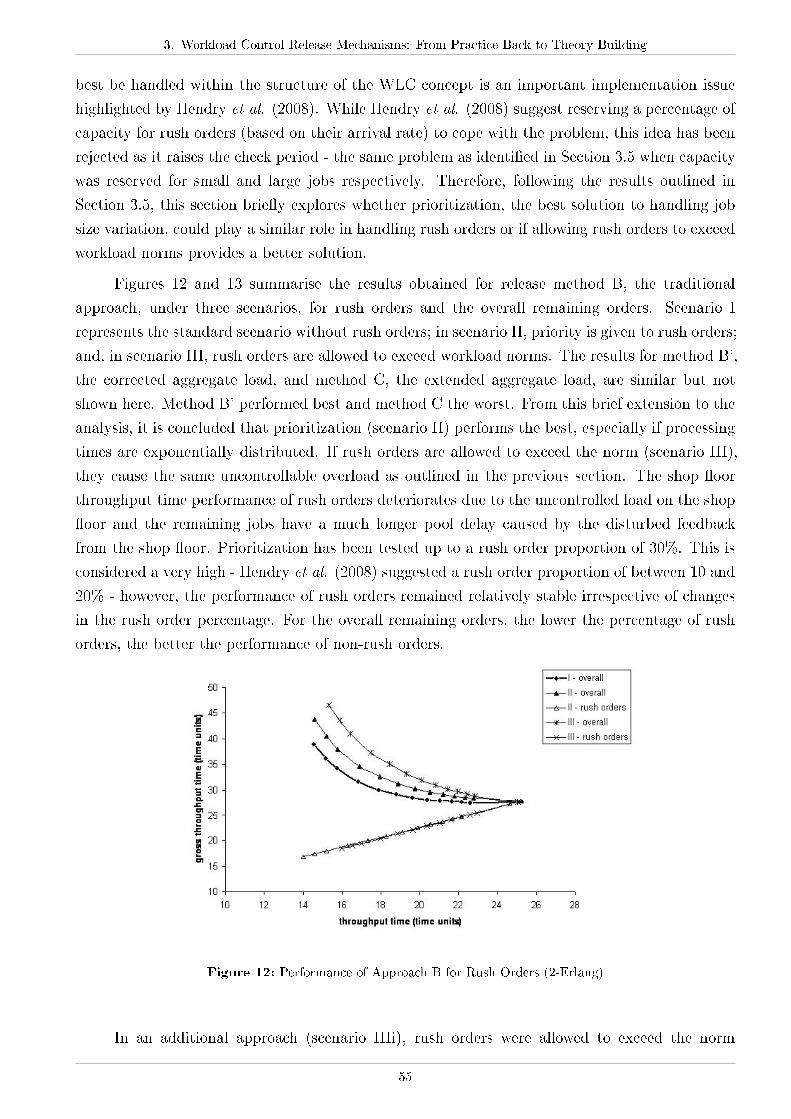
3. Workload Control Release Mechanisms: From Practice Back to Theory Building
best be handled within the structure of the WLC concept is an important implementation issue
highlighted by Hendry et al. (2008). While Hendry et al. (2008) suggest reserving a percentage of
capacity for rush orders (based on their arrival rate) to cope with the problem, this idea has been
rejected as it raises the check period - the same problem as identi�ed in Section 3.5 when capacity
was reserved for small and large jobs respectively. Therefore, following the results outlined in
Section 3.5, this section brie�y explores whether prioritization, the best solution to handling job
size variation, could play a similar role in handling rush orders or if allowing rush orders to exceed
workload norms provides a better solution.
Figures 12 and 13 summarise the results obtained for release method B, the traditional
approach, under three scenarios, for rush orders and the overall remaining orders. Scenario I
represents the standard scenario without rush orders; in scenario II, priority is given to rush orders;
and, in scenario III, rush orders are allowed to exceed workload norms. The results for method B',
the corrected aggregate load, and method C, the extended aggregate load, are similar but not
shown here. Method B' performed best and method C the worst. From this brief extension to the
analysis, it is concluded that prioritization (scenario II) performs the best, especially if processing
times are exponentially distributed. If rush orders are allowed to exceed the norm (scenario III),
they cause the same uncontrollable overload as outlined in the previous section. The shop �oor
throughput time performance of rush orders deteriorates due to the uncontrolled load on the shop
�oor and the remaining jobs have a much longer pool delay caused by the disturbed feedback
from the shop �oor. Prioritization has been tested up to a rush order proportion of 30%. This is
considered a very high - Hendry et al. (2008) suggested a rush order proportion of between 10 and
20% - however, the performance of rush orders remained relatively stable irrespective of changes
in the rush order percentage. For the overall remaining orders, the lower the percentage of rush
orders, the better the performance of non-rush orders.
Figure 12: Performance of Approach B for Rush Orders (2-Erlang)
In an additional approach (scenario IIIi), rush orders were allowed to exceed the norm
55
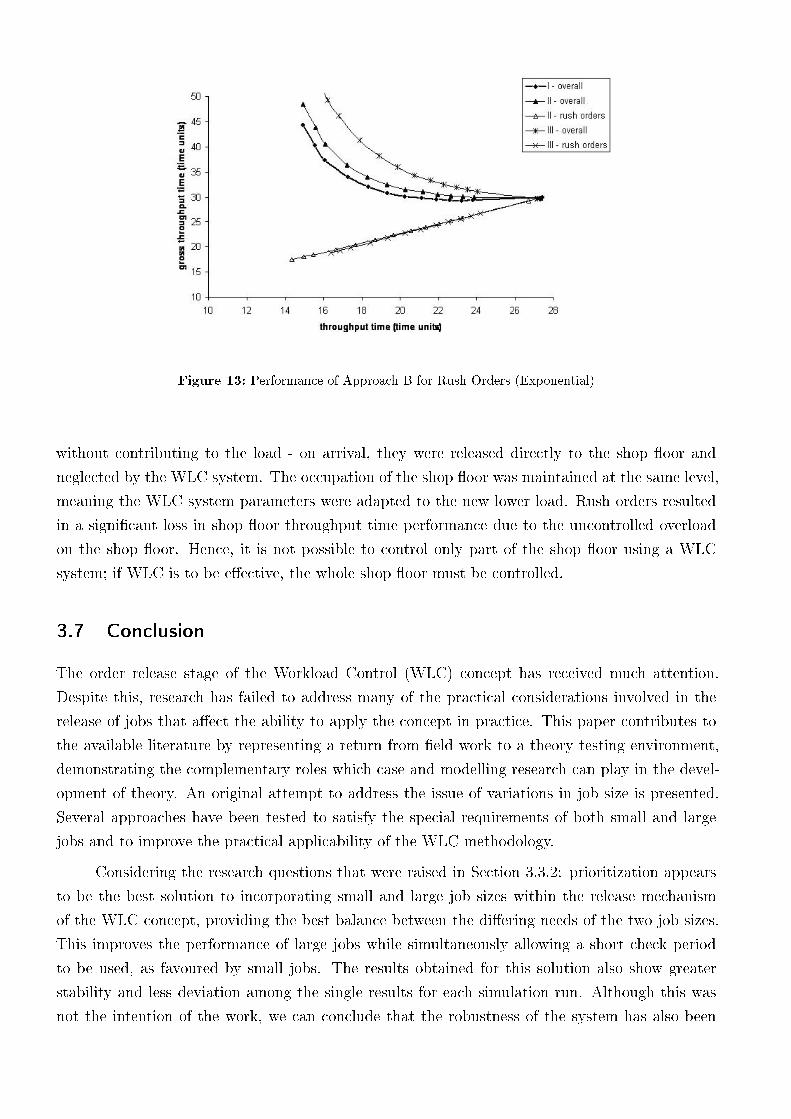
Figure 13: Performance of Approach B for Rush Orders (Exponential)
without contributing to the load - on arrival, they were released directly to the shop �oor and
neglected by the WLC system. The occupation of the shop �oor was maintained at the same level,
meaning the WLC system parameters were adapted to the new lower load. Rush orders resulted
in a signi�cant loss in shop �oor throughput time performance due to the uncontrolled overload
on the shop �oor. Hence, it is not possible to control only part of the shop �oor using a WLC
system; if WLC is to be e�ective, the whole shop �oor must be controlled.
3.7 Conclusion
The order release stage of the Workload Control (WLC) concept has received much attention.
Despite this, research has failed to address many of the practical considerations involved in the
release of jobs that a�ect the ability to apply the concept in practice. This paper contributes to
the available literature by representing a return from �eld work to a theory testing environment,
demonstrating the complementary roles which case and modelling research can play in the devel-
opment of theory. An original attempt to address the issue of variations in job size is presented.
Several approaches have been tested to satisfy the special requirements of both small and large
jobs and to improve the practical applicability of the WLC methodology.
Considering the research questions that were raised in Section 3.3.2: prioritization appears
to be the best solution to incorporating small and large job sizes within the release mechanism
of the WLC concept, providing the best balance between the di�ering needs of the two job sizes.
This improves the performance of large jobs while simultaneously allowing a short check period
to be used, as favoured by small jobs. The results obtained for this solution also show greater
stability and less deviation among the single results for each simulation run. Although this was
not the intention of the work, we can conclude that the robustness of the system has also been
3. Workload Control Release Mechanisms: From Practice Back to Theory Building
improved. In conclusion, giving priority to jobs with a large routing length is a more e�ective
solution to the problem than reserving capacity for each job size or allowing jobs to exceed the
norm. The same conclusion is also shown to be valid for rush orders, where prioritization proved
to be the best solution in order to handle the arrival of rush orders within the WLC concept.
While the proposed solution for job size variation is consistent with the suggestion made by Land
(2004), the solution for rush orders is in contrast to the suggestion made by Hendry et al. (2008).
The results have implications for practice by showing that relatively simple methods can improve
the performance of release mechanisms. Prioritization is likely to be the solution that can be most
realistically applied in practice - an important driver of theory. However, while prioritization is
considered a relatively simple method of improving the e�ectiveness of the release mechanism,
whether the advantages prioritization provides outweigh a slight increase in sophistication for the
production planner can only be determined by returning to a case study setting - and so the cycle
continues.
An earlier version of this paper has been previously presented as part of my Master Thesis.
57

4. Optimising Workload Norms: The In�uence of Shop Floor Characteristics on Setting Workload Norms for the
Workload Control Concept
4 Optimising Workload Norms: The In�uence of Shop
Floor Characteristics on Setting Workload Norms for
the Workload Control Concept
Published in International Journal of Production Research
Matthias Thürer, Cristovao Silva, and Mark Stevenson
Abstract
Workload Control (WLC) is a leading Production Planning and Control (PPC) solution for Small
and Medium sized Enterprises (SMEs) and Make-To-Order (MTO) companies. But when WLC
is implemented, practitioners �nd it di�cult to determine suitable workload norms to obtain op-
timum performance. Theory has provided some solutions (e.g. based on linear programming)
but, to remain optimal, these require the regular feedback of detailed information from the shop
�oor about the status of Work-In-Process (WIP), and are therefore often impractical. This paper
seeks to predict workload norms without such feedback requirements, analysing the in�uence of
shop �oor characteristics on the workload norm. The shop parameters considered are �ow charac-
teristics (from an undirected Pure Job Shop to a directed General Flow Shop), and the number
of possible work centres in the routing of a job (i.e., the routing length). Using simulation and
optimisation software, the workload norm resulting in optimum performance is determined for
each work centre for two aggregate load-oriented WLC approaches: the classical and corrected
load methods. Results suggest that the performance of the classical approach is heavily a�ected
by shop �oor characteristics but no direct relationship between the characteristics and norm to
apply could be established. In contrast, results suggest that the performance of the corrected load
approach is not in�uenced by shop �oor characteristics and the workload norm which results in
optimum performance is the same for all experiments. Given the changing nature of MTO pro-
duction and the di�culties encountered with the classical approach, the corrected load approach
is considered a better and more robust option for implementation in practice. Future simulations
should investigate the in�uence of di�ering capacities across work centres on the workload norm
while action research should be conducted to apply the �ndings in practice.
4.1 Introduction
Due to phenomena such as globalization, many companies face increased competition and, in the
context of the current economic recession, are competing for less available work. To improve
the ability to compete, companies need appropriate production management systems which can
improve logistics performance, e.g. by reducing lead times or improving due date adherence.
However, many approaches to improving performance are not practical for Small and Medium
sized Enterprises (SMEs) and/or Make-To-Order (MTO) companies which represent an important
59

sector of the economy. Workload Control (WLC), a Production Planning and Control (PPC)
concept based on input/output control (Plossl & Wight, 1973), is one potential means of improving
performance that is of relevance to MTOs and SMEs (Henrich et al., 2004a; Stevenson et al.,
2005). Many simulation studies have demonstrated the ability of WLC to improve performance
(e.g. Melnyk et al., 1994b; Perona & Portioli, 1998; Oosterman et al., 2000; Land, 2006) but
reports of its successful implementation in practice are limited. One of the key barriers to its
successful implementation is determining appropriate workload norms, as identi�ed in theory by
Land (2004) and in practice by Silva et al. (2006) and Stevenson & Silva (2008).
Overcoming this challenge is vital given the importance of determining appropriate workload
norms. For example, through simulation (e.g. Land, 2004) it has been shown that: if workload
norms are set too tight, shop �oor throughput times will be reduced but only at the expense of
an increase in the gross throughput time; and, if norms are set too loose, only a small reduction
in the shop �oor throughput time will be achieved. Hence, a norm set too high is ine�ective and
a norm set too low can adversely a�ect performance (Enns & Prongue Costa, 2002). Despite this,
only limited guidance has been provided in the literature on how to determine workload norms
in practice and solutions proposed require the regular feedback of detailed information from the
shop �oor about the status of Work-In-Process (WIP), and are therefore often impractical.
Therefore, this paper seeks to predict workload norms without such feedback requirements,
analysing the in�uence of shop �oor characteristics, which are known to have a signi�cant in�uence
of the performance of WLC (Stevenson et al., 2005), on the workload norm. The shop �oor
characteristics considered are �ow characteristics and the number of possible work centres in
the routing of a job (i.e., the routing length). Few studies have analysed the in�uence of �ow
characteristics on the performance of the WLC system (e.g. Oosterman et al., 2000; Land, 2004)
and, to the best of our knowledge, the in�uence on workload norms has not previously been
studied. The available literature has considered four di�erent �ows, the: Pure Job Shop (PJS),
Restricted Job Shop (RJS), General Flow Shop (GFS), and Pure Flow Shop (PFS). But instead
of concentrating on these four 'pure shop �oor con�gurations', this paper seeks to analyse the
in�uence of hybrid con�gurations along the spectrum from the Pure Job Shop to the General Flow
Shop. The rationale behind this is that in practice it is more likely that a hybrid con�guration
lying somewhere between, for example, a Restricted Job Shop and a General Flow Shop, will be
in operation than one of the four pure con�gurations. This is supported, for example, by Portioli
(2002) who stated that �ow characteristics are unlikely to lie at one of these extremes, while
several authors (e.g. Oosterman et al., 2000) have questioned whether the Pure Job Shop, which
is typically used to represent the appropriate con�guration for many MTO companies (Muda &
Hendry, 2003), actually exists in practice. The problem of workload norm setting is particularly
acute for the classical aggregate load method where a di�erent norm for each workstation is
necessary when routings become more directed (Oosterman et al., 2000; Land, 2004). This is
explained by the fact that when the routing has a dominant �ow direction, e.g., from upstream to
downstream, the indirect load begins to concentrate on the downstream work centres. Our focus
is on aggregate load methods; hence, the number of possible work centres in the routing of a job
4. Optimising Workload Norms: The In�uence of Shop Floor Characteristics on Setting Workload Norms for the
Workload Control Concept
(the routing length) is also an important shop �oor characteristic to consider.
The main objective of this study is to: analyse the in�uence of di�erent shop �oor character-
istics on how workload norms should be set in order to obtain optimal performance; and, to use
the results to provide guidance to support the determination of appropriate norms in practice. So
far, to predict norms for the classical aggregate load approach, the norm for each work centre has
been related to the recorded aggregate load of each work centre when the norm is not restricted
(e.g. Oosterman et al. (2000). However, the results of recent studies (e.g. Thürer et al., 2010a)
have suggested that it is possible to obtain an optimal solution for the workload norm. Therefore,
optimisation software (OptQuest c⃝) will be applied to �nd optimal norms for di�erent shop �oor
characteristics. Furthermore, in practice, it may be di�cult to maintain stable �ow characteristics
in a MTO context, thus a release mechanism which is robust and able to work well under di�erent
characteristics is required. Therefore, di�erent release mechanisms will be compared under dif-
ferent �ow characteristics and conclusions drawn regarding which release mechanism corresponds
best to which �ow characteristics.
The remainder of this paper is organised as follows. Section 4.2 reviews literature on norm
setting and the e�ects of �ow characteristics and routing length. Section 4.3 describes the simula-
tion model, the use of optimisation software, and the di�erent approaches we follow to address the
problem of norm setting. Results from the simulations are presented and analysed in Section 4.4
before conclusions are drawn in Section 4.5.
4.2 Literature Review
This review considers the two core elements of this paper: how to set workload norms; and, how
shop �oor characteristics, particularly �ow characteristics and the number of work centres on the
shop �oor, in�uence performance. Note that when work centres are not revisited, the number of
work centres on the shop �oor is also equal to the maximum routing length. Section 4.2.1 reviews
approaches to de�ning workload norms in theory and in practice before Section 4.2.2 explores how
�ow characteristics and routing length have been investigated to date. Finally, an assessment of
the literature is presented in Section 4.2.3.
4.2.1 Workload Norm Setting
Workload norms are determined by considering the current load level at a given work centre, the
planned output, and the degree of control desired over queues on the shop �oor. There are two
di�erent workload norms. A maximum norm, also known as an upper bound, is the maximum
workload restriction of the backlog and a minimum norm, also known as a lower bound, is the
minimum workload restriction of the backlog. The lower bound is mainly used to avoid starvation
and the upper bound to balance the shop �oor (e.g. Stevenson & Hendry, 2006). Although
many authors have highlighted the importance of setting norms appropriately (e.g., Hendry et al.,
1998; Land & Gaalman, 1998; Perona & Portioli, 1998), there is a lack of research which focuses
61
speci�cally on norm setting and no attempts to provide a framework to support workload norm
setting in practice have been presented.
One of the few attempts to relate workload norms to the parameters of a given production
system was presented by Hendry (1989) who derived an empirical equation based on the relation-
ship between the workload norms, percentage of urgent jobs, job operation completion time and
total lead time. Zäpfel & Missbauer (1993a) used linear programming techniques to determine the
workload norm to be adopted in the future depending on the incoming order stream, thus applying
a dynamic norm. However, the determination of a workload norm depends on �rstly determining
an appropriate load level for a work centre. Nyhuis & Wiendahl (1999) and Breithaupt et al.
(2002) propose an empirically derived mathematical function based on the relationship between
load norms, workload, output and throughput time, to estimate appropriate load levels. To the
best of our knowledge, these are the only studies which try to establish a relationship between
system parameters and load norms available in the literature to date.
The studies outlined above make a contribution towards predicting adequate norms as long
as the feedback of information on the progress of WIP from the shop �oor is constant and reliable.
Using this feedback information, workload norms can be adapted dynamically based on the current
load at each work centre; however, it is di�cult to supply in practice (e.g. Henrich et al., 2004b).
Therefore, if WLC is to be applied in practice, simpler solutions (e.g., with rigid norms), that
do not rely on dynamic adaptations or regular feedback information are needed. Furthermore,
simulations typically assume that the incoming �ow of orders has known stationary characteristics
(Land, 2004) but, in practice, known stationary characteristics are unlikely. As a result, researchers
have adopted a trial and error approach to norm setting when implementing WLC in practice (e.g.
Silva et al., 2006; Stevenson & Silva, 2008). However, an iterative trial and error approach can take
a long time to �nd a satisfactory solution and, in a highly competitive production environment,
is insu�cient given that errors are unacceptable and decrease the con�dence of the user in the
system. Hence, setting workload norms remains an outstanding problem and research should be
conducted to better understand the relationship between shop characteristics and workload norms.
Therefore, this study seeks to analyse how shop �oor characteristics in�uence the workload norm
and to develop a framework to support the determination of workload norms.
At the job release stage of the WLC concept, jobs are considered for release from the pre-
shop pool, e.g., according to shortest slack, by adding the contribution that the job will make to
the workload of all work centres in its routing to the current loading and then comparing this
against workload norms. In recent years, researchers and practitioners have mainly applied the
following two approaches to account for the workload contribution of a job over time when it is
considered for release:
∙ The probabilistic approach (or load conversion) estimates the input from jobs upstream to
the direct load of a work centre. As soon as a job is released, its processing time partly
contributes to the input estimation. The contribution increases as the job progresses on its
routing downstream. The whole of the direct load and the estimated input is indicated as
4. Optimising Workload Norms: The In�uence of Shop Floor Characteristics on Setting Workload Norms for the
Workload Control Concept
the converted load (Bechte, 1994; Wiendahl, 1995).
∙ Aggregate load approaches avoid estimating the input to the direct loads. The direct and
the indirect workload of a station are simply added together (Tatsiopoulos, 1983; Hendry,
1989; Hendry & Kingsman, 1991a; Land & Gaalman, 1996b; Kingsman, 2000; Stevenson &
Hendry, 2006).
Note that some alternative release mechanisms have been developed which avoid the need
to determine rigid workload norms. For example, Land & Gaalman (1998) presented the Su-
per�uous Load Avoidance Release (SLAR) procedure and Cigolini & Portioli-Staudacher (2002)
described Workload Balancing. Initial results suggest that the methods are competitive but these
approaches have been neglected in recent years and are not the approaches researchers have sought
to implement in practice. Therefore, these approaches are not considered further in this paper.
For a more comprehensive review of workload accounting over time and order review/release mech-
anisms, see: Philipoom et al. (1993), Wisner (1995), Bergamaschi et al. (1997), Sabuncuoglu &
Karapinar (1999) and Fredendall et al. (2010).
4.2.2 Flow Characteristics and Routing Length
Flow characteristics have proven to be important to the performance of WLC and a�ected the
choice of the most appropriate release mechanism to apply (Oosterman et al. 2000). Oosterman
et al. (2000) also showed that WLC improves the performance of the shop �oor if the �ow either
corresponds to a Pure Job Shop or a General Flow Shop, reducing the shop �oor throughput
time to more than compensate for any deterioration in gross throughput time performance. More
recently, research has also shown that the routing length is of great importance to the performance
of WLC (e.g., Thürer et al. 2010a).
If the classical aggregate load approach is applied, for certain �ow characteristics and routing
lengths, di�erent workload norms have to be determined for each work centre according to the
position of a work centre in the routing of a 'typical' job (e.g. Land, 2004) because the indirect
load is concentrated on the downstream work centres. This task adds to the challenge of norm
setting and becomes increasingly complex as the number of possible work centres in the routing of
a job (i.e., the routing length) increases. How �ow characteristics and/or routing length in�uence
the workload norms that have to be applied in order to obtain the optimum performance has not
previously been studied.
4.2.3 Assessment of the Literature
Determining workload norms is one of the most important outstanding problems in the �eld of
WLC if this PPC solution is to be successfully adopted in practice. Although this has been
acknowledged in the literature, a suitable solution is yet to be provided. Contributions provided
through simulation are di�cult to apply in practice, resulting in trial and error being adopted in
�eld research. This study seeks to contribute towards �lling this important gap in the literature by
63
analysing the in�uence of shop �oor characteristics on workload norms. We consider the following
research questions:
∙ How do shop �oor characteristics in�uence the workload norms which have to be set in order
to obtain the optimum performance of a WLC system?
∙ Can a simple framework be developed to support practitioners in the determination of ap-
propriate workload norms?
Model-based research and optimisation are considered the best method of exploring this
problem (as described in Bertrand & Fransoo, 2002). The �ow is varied stepwise down from a
completely undirected routing, the Pure Job Shop, to a directed routing, the General Flow Shop.
In a second step, the in�uence of the routing length (or the number of possible work centres in the
routing of a job) is analysed. In order to �nd an optimum solution for each shop �oor con�guration
and for di�erent release mechanisms, the norms are optimised using optimisation software. Such
an approach has not previously been presented in the WLC research literature.
4.3 Simulation Model
4.3.1 Overview of Shop Characteristics
Using SIMUL8 c⃝ software, a simulation model has been developed. The model represents a shop
with up to 12 work centres, where each is a single and unique capacity resource; capacity is equal
for all work centres and remains constant. The model represents di�erent �ow characteristics along
the spectrum between a Pure Job Shop, according to the characteristics outlined by Melnyk &
Ragatz (1989), and the General Flow Shop. As in most recent studies (e.g., Oosterman et al., 2000,
Bertrand & Van Ooijen, 2002; Land 2004), it will be assumed that a job does not visit the same
work centre twice and all stations have an equal probability of being visited. The routing length,
i.e., the number of operations per job, is variable and depends on the number of work centres
or capacity groups; e.g., eight work centres would imply a routing length uniformly distributed
between one and eight. Each operation requires one speci�c work centre and the routing and
operation processing time characteristics are known upon job entry. As in many other studies, e.g.
Land (2004), a First-Come-First-Served (FCFS) dispatching rule is used on the shop �oor.
4.3.2 Flow Characteristics
The routing for the Pure Job Shop is determined using a uniform distribution. Thus, all work
centres have the same probability of being, e.g., the �rst, the second or the last work centre in the
routing of a job. The routing sequence is summarised in a routing vector where the �rst position
represents the �rst work centre to visit, the second position represents the second work centre to
visit, and so on. To obtain a directed routing (e.g., the General Flow Shop), the elements of the
routing vector (which represent the work centres) are sorted in ascending order. The sorting does
4. Optimising Workload Norms: The In�uence of Shop Floor Characteristics on Setting Workload Norms for the
Workload Control Concept
not a�ect the mean routing length or the probability of a work centre being visited; these are
maintained equal for each work centre (as for the Pure Job Shop).
The routing vectors for the �ow characteristics between the undirected and the directed
routing are obtained by sorting the routing vector for the undirected routing only to 25%, 50%
and 75%. During the sorting procedure, a random number is generated to decide whether a work
centre moves to a new (sorted) position in the routing of a job or whether it maintains its old
uniformly distributed position. This is in contrast, for example, to Oosterman et al. (2000) who
sorted the vector only to 100% (the General Flow Shop) and to 0% (the Pure Job Shop). The
transition probability between work centres can be shown in a routing matrix (see Land, 2004).
In this routing matrix, the probability of a job moving to a certain work centre or exiting the shop
�oor (X) from a given work centre or upon entering the shop �oor (Y) is given by the element
(X,Y). Table 10 provides an example of a routing matrix, which has been obtained numerically
using MatLab c⃝, for a 50% directed routing and a 100% directed routing (the General Flow Shop)
of a shop �oor consisting of six work centres.
4.3.3 Release Mechanisms
As in previous studies (e.g. Perona & Portioli, 1998; Bertrand & Van Ooijen, 2002; Henrich et al.,
2006), it is assumed that all orders are accepted, that materials are available, and that the process
plan (which includes all necessary information regarding routing sequence, processing times, etc.)
is known. No special order review methodology is applied: orders �ow directly into the pre-shop
pool; hence, as in most previous studies, a pool of con�rmed orders is the starting point. At
release time 't', jobs waiting in the pre-shop pool are considered for release according to shortest
slack. Slack represents the time between the latest release date and the current date.
The operation workload of a job is attributed to the load of the work centres corresponding
to its routing at the moment of release. If this aggregated load �ts within the workload norm, the
job is added to the load of the work centres in its routing and is released to the shop �oor. If
one or more norms would be exceeded, the job remains in the pre-shop pool and must wait until
at least the next release period. This procedure is repeated until all jobs in the pre-shop pool at
release time 't' have been considered for release once. The check period is periodical and set to 5
time units, which means jobs in the pool are considered for release every 5 time units. To enable
a clear insight into the performance of the system, no special planning horizon is applied.
There are di�erent approaches to how the workload is accounted over time but, in this study,
the following two aggregate load approaches are applied:
∙ The (classical) aggregate load approach (B) (Tatsiopoulos, 1983; Hendry, 1989), which at-
tributes the workload of a job to the backlog of each work centre that processes it at the
moment of release by simply adding it. The backlog at a work centre hence includes indi-
rect load and load-on-hand (i.e., the direct load) without distinguishing between the two,
irrespective of the routing of a job prior to arrival at a work centre.
65
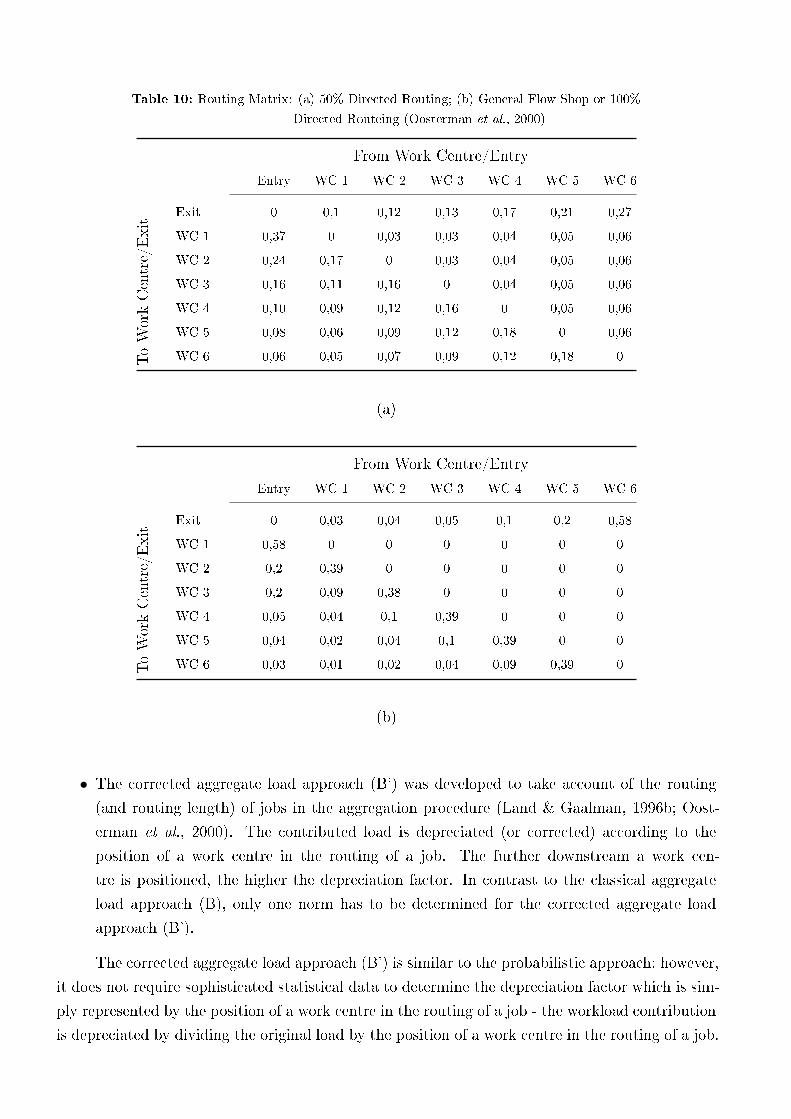
Table 10: Routing Matrix: (a) 50% Directed Routing; (b) General Flow Shop or 100%
Directed Routeing (Oosterman et al., 2000)
From Work Centre/Entry
Entry WC 1 WC 2 WC 3 WC 4 WC 5 WC 6
ToWorkCentre/Exit
Exit 0 0,1 0,12 0,13 0,17 0,21 0,27
WC 1 0,37 0 0,03 0,03 0,04 0,05 0,06
WC 2 0,24 0,17 0 0,03 0,04 0,05 0,06
WC 3 0,16 0,11 0,16 0 0,04 0,05 0,06
WC 4 0,10 0,09 0,12 0,16 0 0,05 0,06
WC 5 0,08 0,06 0,09 0,12 0,18 0 0,06
WC 6 0,06 0,05 0,07 0,09 0,12 0,18 0
(a)
From Work Centre/Entry
Entry WC 1 WC 2 WC 3 WC 4 WC 5 WC 6
ToWorkCentre/Exit
Exit 0 0,03 0,04 0,05 0,1 0,2 0,58
WC 1 0,58 0 0 0 0 0 0
WC 2 0,2 0,39 0 0 0 0 0
WC 3 0,2 0,09 0,38 0 0 0 0
WC 4 0,05 0,04 0,1 0,39 0 0 0
WC 5 0,04 0,02 0,04 0,1 0,39 0 0
WC 6 0,03 0,01 0,02 0,04 0,09 0,39 0
(b)
∙ The corrected aggregate load approach (B') was developed to take account of the routing
(and routing length) of jobs in the aggregation procedure (Land & Gaalman, 1996b; Oost-
erman et al., 2000). The contributed load is depreciated (or corrected) according to the
position of a work centre in the routing of a job. The further downstream a work cen-
tre is positioned, the higher the depreciation factor. In contrast to the classical aggregate
load approach (B), only one norm has to be determined for the corrected aggregate load
approach (B').
The corrected aggregate load approach (B') is similar to the probabilistic approach; however,
it does not require sophisticated statistical data to determine the depreciation factor which is sim-
ply represented by the position of a work centre in the routing of a job - the workload contribution
is depreciated by dividing the original load by the position of a work centre in the routing of a job.
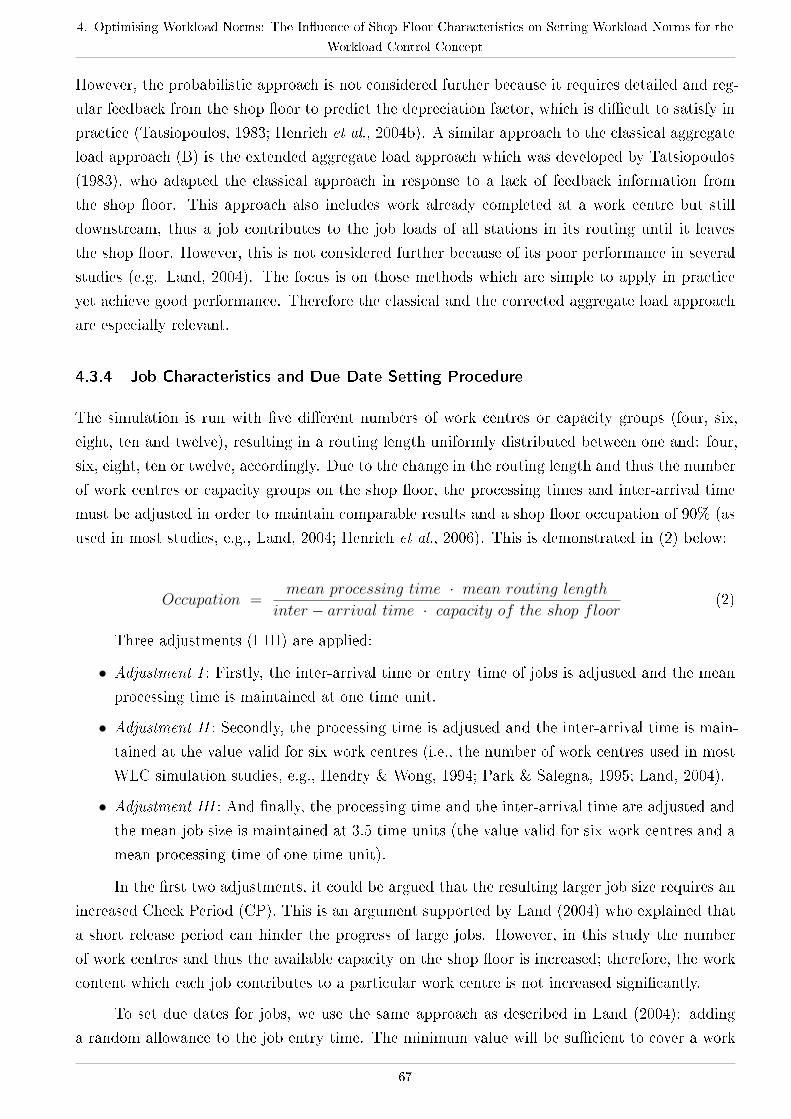
4. Optimising Workload Norms: The In�uence of Shop Floor Characteristics on Setting Workload Norms for the
Workload Control Concept
However, the probabilistic approach is not considered further because it requires detailed and reg-
ular feedback from the shop �oor to predict the depreciation factor, which is di�cult to satisfy in
practice (Tatsiopoulos, 1983; Henrich et al., 2004b). A similar approach to the classical aggregate
load approach (B) is the extended aggregate load approach which was developed by Tatsiopoulos
(1983), who adapted the classical approach in response to a lack of feedback information from
the shop �oor. This approach also includes work already completed at a work centre but still
downstream, thus a job contributes to the job loads of all stations in its routing until it leaves
the shop �oor. However, this is not considered further because of its poor performance in several
studies (e.g. Land, 2004). The focus is on those methods which are simple to apply in practice
yet achieve good performance. Therefore the classical and the corrected aggregate load approach
are especially relevant.
4.3.4 Job Characteristics and Due Date Setting Procedure
The simulation is run with �ve di�erent numbers of work centres or capacity groups (four, six,
eight, ten and twelve), resulting in a routing length uniformly distributed between one and: four,
six, eight, ten or twelve, accordingly. Due to the change in the routing length and thus the number
of work centres or capacity groups on the shop �oor, the processing times and inter-arrival time
must be adjusted in order to maintain comparable results and a shop �oor occupation of 90% (as
used in most studies, e.g., Land, 2004; Henrich et al., 2006). This is demonstrated in (2) below:
Occupation =mean processing time ⋅ mean routing lengtℎ
inter − arrival time ⋅ capacity of tℎe sℎop floor(2)
Three adjustments (I-III) are applied:
∙ Adjustment I : Firstly, the inter-arrival time or entry time of jobs is adjusted and the mean
processing time is maintained at one time unit.
∙ Adjustment II : Secondly, the processing time is adjusted and the inter-arrival time is main-
tained at the value valid for six work centres (i.e., the number of work centres used in most
WLC simulation studies, e.g., Hendry & Wong, 1994; Park & Salegna, 1995; Land, 2004).
∙ Adjustment III : And �nally, the processing time and the inter-arrival time are adjusted and
the mean job size is maintained at 3.5 time units (the value valid for six work centres and a
mean processing time of one time unit).
In the �rst two adjustments, it could be argued that the resulting larger job size requires an
increased Check Period (CP). This is an argument supported by Land (2004) who explained that
a short release period can hinder the progress of large jobs. However, in this study the number
of work centres and thus the available capacity on the shop �oor is increased; therefore, the work
content which each job contributes to a particular work centre is not increased signi�cantly.
To set due dates for jobs, we use the same approach as described in Land (2004): adding
a random allowance to the job entry time. The minimum value will be su�cient to cover a work
67

centre throughput time which corresponds to the maximum processing time plus one time unit
for the maximum number of possible operations. The maximum number of possible operations
depends on the number of work centres (of the current simulation), and thus on the maximum
routing length, plus a waiting time before release of 5 time units.
In many recent studies, processing times have been modelled using a two-dimensional Erlang
distribution (e.g., Oosterman et al., 2000); previously, a negative exponential distribution was
typical. It has been argued that the 2-Erlang distribution is a better approach to modelling the
processing times found in real-life job shops and this approach has been adopted in what follows.
The characteristics of our job shop model are summarized in Table 11; the characteristics of jobs
are summarized in Table 12.
Table 11: Summary of Simulated Shop Characteristics
Shop Characteristics
Shop Type Pure Job Shop → General Flow Shop
Shop Characteristics (Real or Hypothetical) Hypothetical
Routing Variability Random routing, no re-entrant �ows
No. of Machines 4, 6, 8, 10, 12
Interchange-ability of Machines No interchange-ability between machines
Machine Capacities All equal
Machine Utilisation Rate 90%
Shop Floor Dispatching Policy First-Come-First-Served
Table 12: Summary of Simulated Job Characteristics
Job Characteristics
No. of Operations per JobUniform [1, number of work centres on the shop
�oor]
Operation Processing Times 2-Erlang Distribution
Inter-Arrival Times Exp. Distribution
Set-up Times Not considered
Due Date Determination ProcedureJob entry time + a; a according to the routing
length
Complexity of Product Structures Simple independent product structures
Job Characteristics (Real or Hypothetical) Hypothetical
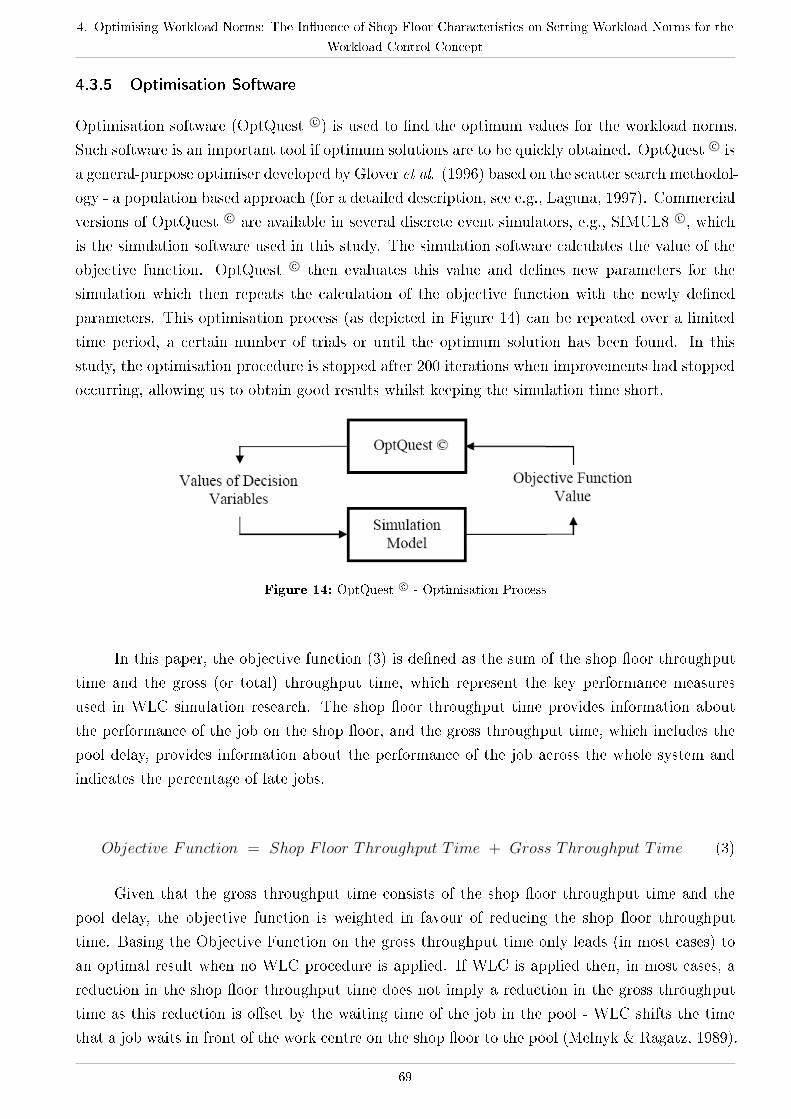
4. Optimising Workload Norms: The In�uence of Shop Floor Characteristics on Setting Workload Norms for the
Workload Control Concept
4.3.5 Optimisation Software
Optimisation software (OptQuest c⃝) is used to �nd the optimum values for the workload norms.
Such software is an important tool if optimum solutions are to be quickly obtained. OptQuest c⃝ is
a general-purpose optimiser developed by Glover et al. (1996) based on the scatter search methodol-
ogy - a population based approach (for a detailed description, see e.g., Laguna, 1997). Commercial
versions of OptQuest c⃝ are available in several discrete event simulators, e.g., SIMUL8 c⃝, which
is the simulation software used in this study. The simulation software calculates the value of the
objective function. OptQuest c⃝ then evaluates this value and de�nes new parameters for the
simulation which then repeats the calculation of the objective function with the newly de�ned
parameters. This optimisation process (as depicted in Figure 14) can be repeated over a limited
time period, a certain number of trials or until the optimum solution has been found. In this
study, the optimisation procedure is stopped after 200 iterations when improvements had stopped
occurring, allowing us to obtain good results whilst keeping the simulation time short.
Figure 14: OptQuest c⃝ - Optimisation Process
In this paper, the objective function (3) is de�ned as the sum of the shop �oor throughput
time and the gross (or total) throughput time, which represent the key performance measures
used in WLC simulation research. The shop �oor throughput time provides information about
the performance of the job on the shop �oor, and the gross throughput time, which includes the
pool delay, provides information about the performance of the job across the whole system and
indicates the percentage of late jobs.
Objective Function = Sℎop F loor Tℎrougℎput T ime + Gross Tℎrougℎput T ime (3)
Given that the gross throughput time consists of the shop �oor throughput time and the
pool delay, the objective function is weighted in favour of reducing the shop �oor throughput
time. Basing the Objective Function on the gross throughput time only leads (in most cases) to
an optimal result when no WLC procedure is applied. If WLC is applied then, in most cases, a
reduction in the shop �oor throughput time does not imply a reduction in the gross throughput
time as this reduction is o�set by the waiting time of the job in the pool - WLC shifts the time
that a job waits in front of the work centre on the shop �oor to the pool (Melnyk & Ragatz, 1989).
69
However, reducing the amount of time that a job waits on the shop �oor reduces the level of
WIP and makes lead times more predictable. Moreover, while jobs remain in the pool, changes to
design speci�cations can be accommodated at less inconvenience. Other objective functions could
arguably be used; however, this one is considered to be the most adequate and is simple, which
aids reliability and allows us to interpret the results with more con�dence.
The decision variables are the workload norms to be imposed at each work centre on the
shop �oor. For example, if the simulation model represents a shop �oor which consists of eight
work centres, OptQuest c⃝ will consider eight decision variables. To reduce the area of search, only
discrete variables are de�ned, i.e., the search for the load norms is restricted to integer values.
4.3.6 Experimental Design
Each simulation is run using di�ering �ow characteristics: undirected routing, 25% directed, 50%
directed, 75% directed and fully (100%) directed routing. For the corrected aggregate load ap-
proach (B'), results are obtained by tightening the norm level stepwise down from in�nity, rep-
resented by the right-hand starting point of the curves which will follow in Sections 4.4.1 and
4.4.2. A norm level of 100% is equivalent to the 'critical workload norm'. The critical workload
norm represents the point where the shop �oor throughput time ceases to decrease while the gross
throughput time continues to rise; this will be determined empirically. For the classical aggregate
load approach (B), results are obtained using OptQuest c⃝ because di�ering norms for each work
centre are necessary. We focus on the setting of the upper bound; a lower bound is not required
because of the high occupation rate we assume for the shop �oor.
Results are then analysed to determine the in�uence of shop �oor characteristics on the
workload norm and on performance. We expect to establish a link between: the position of a work
centre in the routing of a job and the workload norm (for the classical aggregate load method); and,
the routing length and the workload norm, in order to provide appropriate guidance to predict
the optimum norms.
As in Thürer et al. (2010a), each experiment consists of 100 runs and results are collected
over 10,000 time units. The warm-up period is set to 3,000 time units to avoid start-up e�ects.
These simulation parameters enable us to obtain stable results whilst keeping the simulation
run time short. After 100 runs, no signi�cant change in the values obtained was observed, thus
conducting further runs was unnecessary. In total, 150 experiments have been conducted. They
are full factorial and explore the in�uence of: the �ve di�erent �ow characteristics, the three
di�erent adjustment procedures for the processing and inter-arrival time (according to the routing
length), and the �ve di�erent routing lengths on the workload norms of the classical and the
corrected aggregate load approaches.
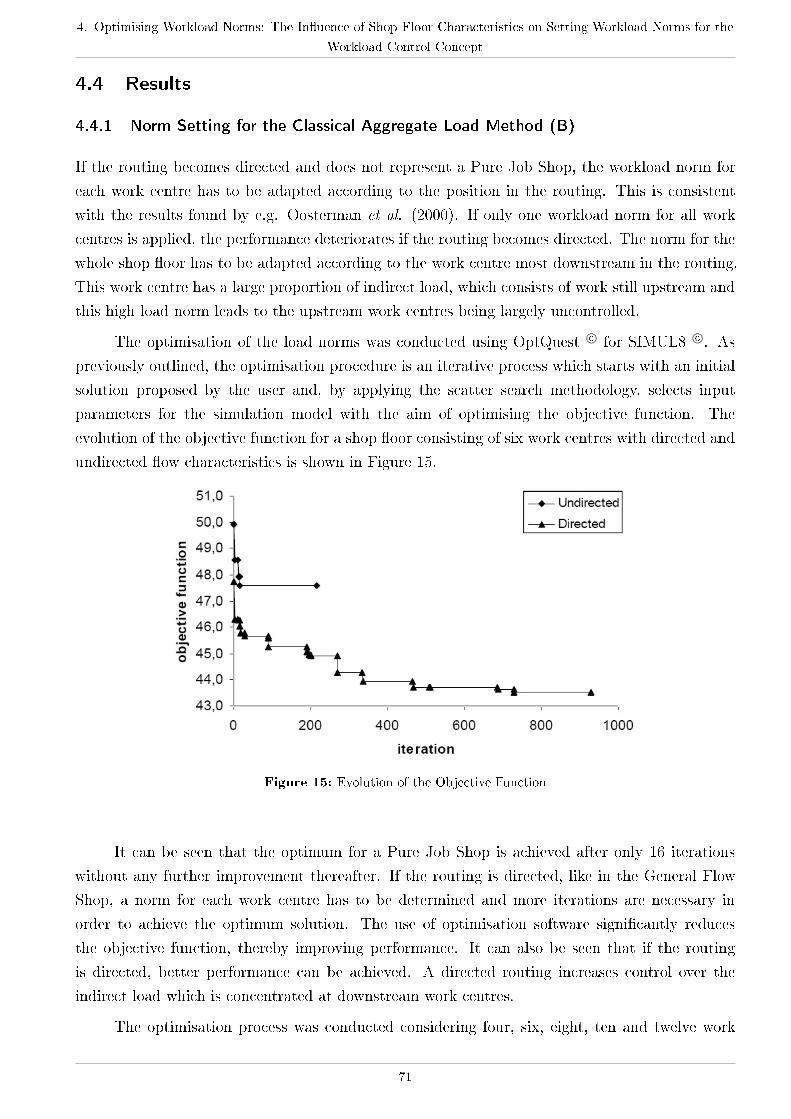
4. Optimising Workload Norms: The In�uence of Shop Floor Characteristics on Setting Workload Norms for the
Workload Control Concept
4.4 Results
4.4.1 Norm Setting for the Classical Aggregate Load Method (B)
If the routing becomes directed and does not represent a Pure Job Shop, the workload norm for
each work centre has to be adapted according to the position in the routing. This is consistent
with the results found by e.g. Oosterman et al. (2000). If only one workload norm for all work
centres is applied, the performance deteriorates if the routing becomes directed. The norm for the
whole shop �oor has to be adapted according to the work centre most downstream in the routing.
This work centre has a large proportion of indirect load, which consists of work still upstream and
this high load norm leads to the upstream work centres being largely uncontrolled.
The optimisation of the load norms was conducted using OptQuest c⃝ for SIMUL8 c⃝. As
previously outlined, the optimisation procedure is an iterative process which starts with an initial
solution proposed by the user and, by applying the scatter search methodology, selects input
parameters for the simulation model with the aim of optimising the objective function. The
evolution of the objective function for a shop �oor consisting of six work centres with directed and
undirected �ow characteristics is shown in Figure 15.
Figure 15: Evolution of the Objective Function
It can be seen that the optimum for a Pure Job Shop is achieved after only 16 iterations
without any further improvement thereafter. If the routing is directed, like in the General Flow
Shop, a norm for each work centre has to be determined and more iterations are necessary in
order to achieve the optimum solution. The use of optimisation software signi�cantly reduces
the objective function, thereby improving performance. It can also be seen that if the routing
is directed, better performance can be achieved. A directed routing increases control over the
indirect load which is concentrated at downstream work centres.
The optimisation process was conducted considering four, six, eight, ten and twelve work
71
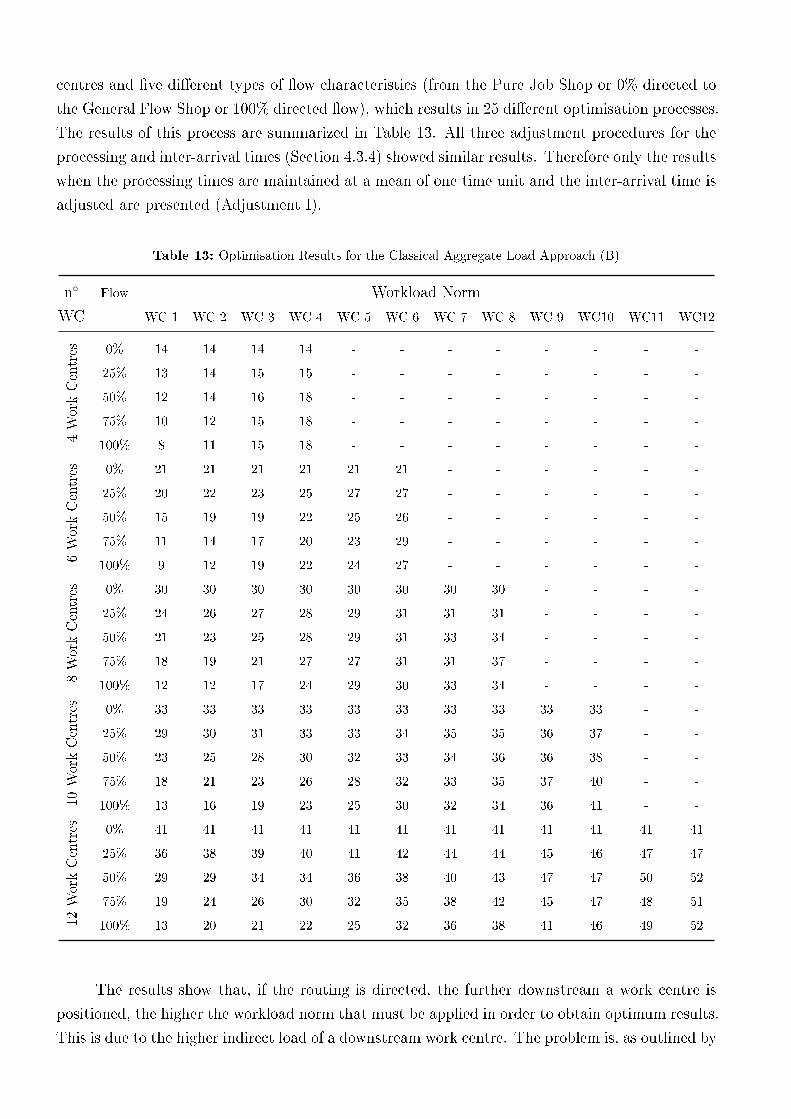
centres and �ve di�erent types of �ow characteristics (from the Pure Job Shop or 0% directed to
the General Flow Shop or 100% directed �ow), which results in 25 di�erent optimisation processes.
The results of this process are summarized in Table 13. All three adjustment procedures for the
processing and inter-arrival times (Section 4.3.4) showed similar results. Therefore only the results
when the processing times are maintained at a mean of one time unit and the inter-arrival time is
adjusted are presented (Adjustment I).
Table 13: Optimisation Results for the Classical Aggregate Load Approach (B)
n∘ Flow Workload Norm
WC WC 1 WC 2 WC 3 WC 4 WC 5 WC 6 WC 7 WC 8 WC 9 WC10 WC11 WC12
4WorkCentres 0% 14 14 14 14 - - - - - - - -
25% 13 14 15 15 - - - - - - - -
50% 12 14 16 18 - - - - - - - -
75% 10 12 15 18 - - - - - - - -
100% 8 11 15 18 - - - - - - - -
6WorkCentres 0% 21 21 21 21 21 21 - - - - - -
25% 20 22 23 25 27 27 - - - - - -
50% 15 19 19 22 25 26 - - - - - -
75% 11 14 17 20 23 29 - - - - - -
100% 9 12 19 22 24 27 - - - - - -
8WorkCentres 0% 30 30 30 30 30 30 30 30 - - - -
25% 24 26 27 28 29 31 31 31 - - - -
50% 21 23 25 28 29 31 33 34 - - - -
75% 18 19 21 27 27 31 31 37 - - - -
100% 12 12 17 24 29 30 33 34 - - - -
10WorkCentres 0% 33 33 33 33 33 33 33 33 33 33 - -
25% 29 30 31 33 33 34 35 35 36 37 - -
50% 23 25 28 30 32 33 34 36 36 38 - -
75% 18 21 23 26 28 32 33 35 37 40 - -
100% 13 16 19 23 25 30 32 34 36 41 - -
12WorkCentres 0% 41 41 41 41 41 41 41 41 41 41 41 41
25% 36 38 39 40 41 42 44 44 45 46 47 47
50% 29 29 34 34 36 38 40 43 47 47 50 52
75% 19 24 26 30 32 35 38 42 45 47 48 51
100% 13 20 21 22 25 32 36 38 41 46 49 52
The results show that, if the routing is directed, the further downstream a work centre is
positioned, the higher the workload norm that must be applied in order to obtain optimum results.
This is due to the higher indirect load of a downstream work centre. The problem is, as outlined by
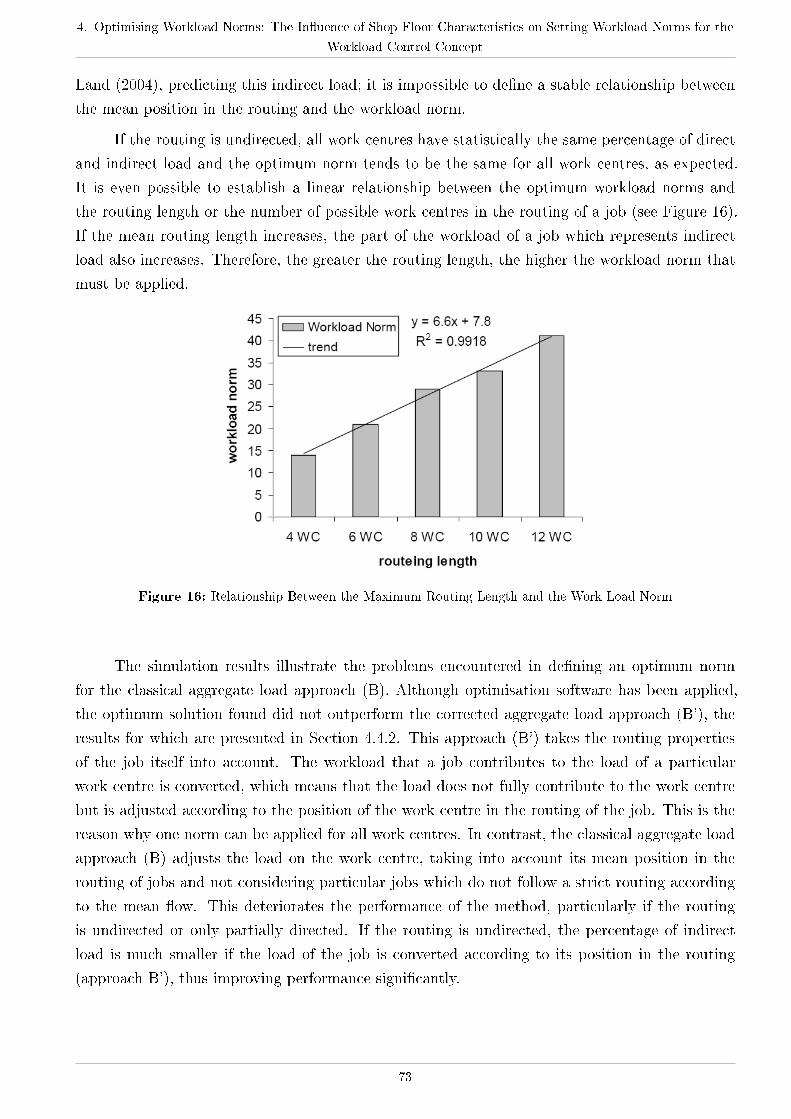
4. Optimising Workload Norms: The In�uence of Shop Floor Characteristics on Setting Workload Norms for the
Workload Control Concept
Land (2004), predicting this indirect load; it is impossible to de�ne a stable relationship between
the mean position in the routing and the workload norm.
If the routing is undirected, all work centres have statistically the same percentage of direct
and indirect load and the optimum norm tends to be the same for all work centres, as expected.
It is even possible to establish a linear relationship between the optimum workload norms and
the routing length or the number of possible work centres in the routing of a job (see Figure 16).
If the mean routing length increases, the part of the workload of a job which represents indirect
load also increases. Therefore, the greater the routing length, the higher the workload norm that
must be applied.
Figure 16: Relationship Between the Maximum Routing Length and the Work Load Norm
The simulation results illustrate the problems encountered in de�ning an optimum norm
for the classical aggregate load approach (B). Although optimisation software has been applied,
the optimum solution found did not outperform the corrected aggregate load approach (B'), the
results for which are presented in Section 4.4.2. This approach (B') takes the routing properties
of the job itself into account. The workload that a job contributes to the load of a particular
work centre is converted, which means that the load does not fully contribute to the work centre
but is adjusted according to the position of the work centre in the routing of the job. This is the
reason why one norm can be applied for all work centres. In contrast, the classical aggregate load
approach (B) adjusts the load on the work centre, taking into account its mean position in the
routing of jobs and not considering particular jobs which do not follow a strict routing according
to the mean �ow. This deteriorates the performance of the method, particularly if the routing
is undirected or only partially directed. If the routing is undirected, the percentage of indirect
load is much smaller if the load of the job is converted according to its position in the routing
(approach B'), thus improving performance signi�cantly.
73

4.4.2 Norm Setting for the Corrected Aggregate Load Method (B')
As outlined in the previous section, the corrected aggregate load approach (B') requires only one
workload norm to be determined; experiments were conducted to optimise the workload norm for
each single work centre but no improvement over applying only one workload norm for all work
centres could be obtained. This reduces the number of decision variables and makes workload
norm setting a simpler task when compared with the classical aggregate load approach (B). Again,
all three adjustment procedures for the processing and inter-arrival times showed similar results.
Therefore, only the results when the processing times are maintained at a mean of one time unit
and the inter-arrival time is adjusted are presented (Adjustment I.). Figure 17 shows the results
obtained for the di�erent �ow characteristics and six work centres (or capacity groups) on the
shop �oor for the corrected aggregate load approach (B') and for comparison with the classical
aggregate load approach (B). The utmost right starting point represents the in�nite workload norm
which is tightened stepwise down to the critical workload norm where the shop �oor throughput
time stops decreasing while the gross throughput time continues to increase (see Section 4.3.6 for
a reminder of the experimental design).
Figure 17: Results for the Corrected Aggregate Load Approach (B') and the Classical
Aggregate Load Approach (B) with six Work Centres
The most interesting conclusion that can be drawn from the �gure is that the performance
of the corrected aggregate load approach (B') is not in�uenced by the �ow characteristics. If the
routing length changes (from six), the curves which depict the performance follow a similar path as
for six work centres, thus they are not depicted here. Instead, Table 14 summarizes the reduction
based on the results obtained for the in�nite workload norm (the utmost right starting point in
Figure 17), in percent obtained for the shop �oor throughput time (Tt) and the gross throughput
time (Tgt) which corresponds to the optimum norm (also given in the table). This optimum norm
is determined by the objective function. In all cases, the shop �oor throughput time is signi�cantly
reduced whereas the gross throughput time is maintained. However, the reduction is greater when
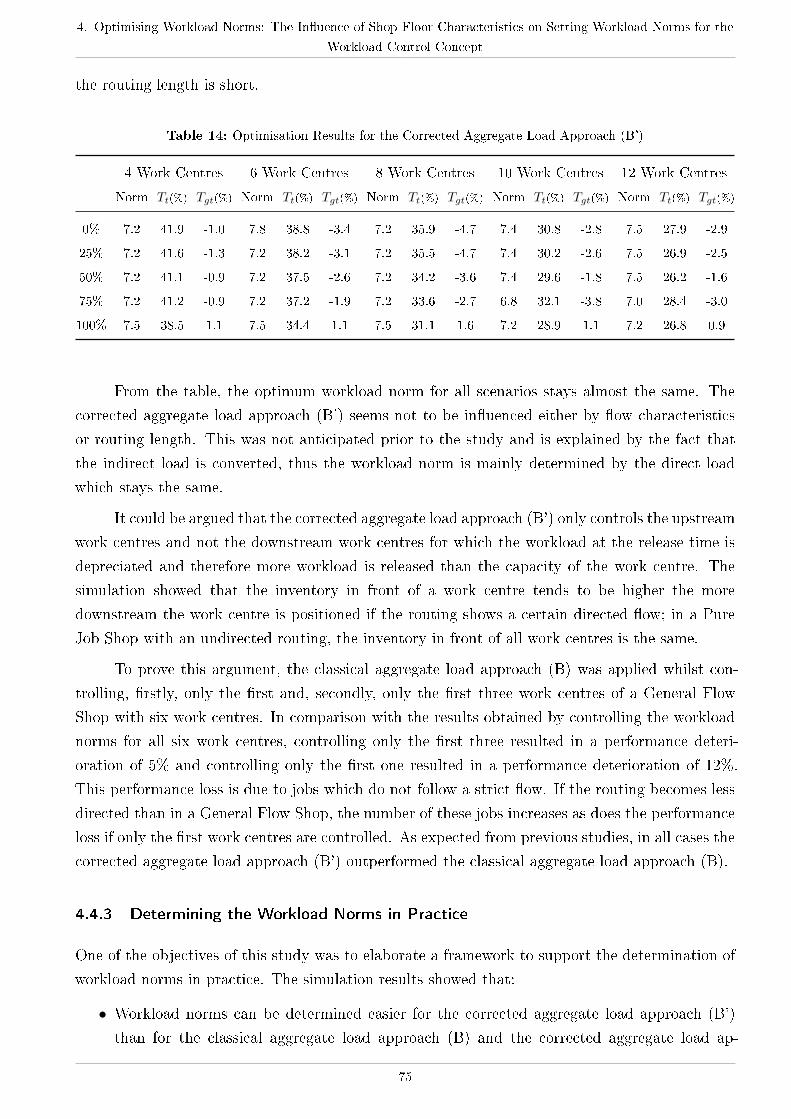
4. Optimising Workload Norms: The In�uence of Shop Floor Characteristics on Setting Workload Norms for the
Workload Control Concept
the routing length is short.
Table 14: Optimisation Results for the Corrected Aggregate Load Approach (B')
4 Work Centres 6 Work Centres 8 Work Centres 10 Work Centres 12 Work Centres
Norm Tt(%) Tgt(%) Norm Tt(%) Tgt(%) Norm Tt(%) Tgt(%) Norm Tt(%) Tgt(%) Norm Tt(%) Tgt(%)
0% 7.2 41.9 -1.0 7.8 38.8 -3.4 7.2 35.9 -4.7 7.4 30.8 -2.8 7.5 27.9 -2.9
25% 7.2 41.6 -1.3 7.2 38.2 -3.1 7.2 35.5 -4.7 7.4 30.2 -2.6 7.5 26.9 -2.5
50% 7.2 41.1 -0.9 7.2 37.5 -2.6 7.2 34.2 -3.6 7.4 29.6 -1.8 7.5 26.2 -1.6
75% 7.2 41.2 -0.9 7.2 37.2 -1.9 7.2 33.6 -2.7 6.8 32.1 -3.8 7.0 28.4 -3.0
100% 7.5 38.5 1.1 7.5 34.4 1.1 7.5 31.1 1.6 7.2 28.9 1.1 7.2 26.8 0.9
From the table, the optimum workload norm for all scenarios stays almost the same. The
corrected aggregate load approach (B') seems not to be in�uenced either by �ow characteristics
or routing length. This was not anticipated prior to the study and is explained by the fact that
the indirect load is converted, thus the workload norm is mainly determined by the direct load
which stays the same.
It could be argued that the corrected aggregate load approach (B') only controls the upstream
work centres and not the downstream work centres for which the workload at the release time is
depreciated and therefore more workload is released than the capacity of the work centre. The
simulation showed that the inventory in front of a work centre tends to be higher the more
downstream the work centre is positioned if the routing shows a certain directed �ow; in a Pure
Job Shop with an undirected routing, the inventory in front of all work centres is the same.
To prove this argument, the classical aggregate load approach (B) was applied whilst con-
trolling, �rstly, only the �rst and, secondly, only the �rst three work centres of a General Flow
Shop with six work centres. In comparison with the results obtained by controlling the workload
norms for all six work centres, controlling only the �rst three resulted in a performance deteri-
oration of 5% and controlling only the �rst one resulted in a performance deterioration of 12%.
This performance loss is due to jobs which do not follow a strict �ow. If the routing becomes less
directed than in a General Flow Shop, the number of these jobs increases as does the performance
loss if only the �rst work centres are controlled. As expected from previous studies, in all cases the
corrected aggregate load approach (B') outperformed the classical aggregate load approach (B).
4.4.3 Determining the Workload Norms in Practice
One of the objectives of this study was to elaborate a framework to support the determination of
workload norms in practice. The simulation results showed that:
∙ Workload norms can be determined easier for the corrected aggregate load approach (B')
than for the classical aggregate load approach (B) and the corrected aggregate load ap-
75
proach (B') consistently outperforms the classical aggregate load approach (B). Workload
norms for the corrected approach are not in�uenced by �ow characteristics or the maximum
routing length and workload norms can be set equal for all work centres. The one workload
norm is largely dependent on the directed load due to the converted indirect load. It is there-
fore concluded that this approach is particularly relevant to practice given its simplicity and
superior performance. Hence, there in fact is no need for a framework.
∙ If the classical aggregate load approach (B) is applied, it is necessary to adapt the workload
norm in all cases. If the number of work centres increases, the workload norm also has to
increase. If the routing becomes directed, di�erent norms for all work centres, according to
their position in the routing of a job, have to be applied. It was found to be almost impossible
to de�ne a stable relationship between workload norms and shop �oor characteristics, thus
making it di�cult to �nd an optimum solution in practice. The only rule that can be
proposed is that the further downstream the work centre is positioned, the higher the norm
that has to be applied.
In all cases, and for both the classical and the corrected aggregate load methods, it can
be concluded that if the routing becomes directed, the inventory or the queue in front of the
work centre increases the further downstream a work centre is positioned. Only the upstream
work centres are 'under control' due to the lower percentage of indirect load. Additionally, for
the classical aggregate load approach (B), it can be concluded that the norm can be set looser
if the work centre is a downstream work centre. This deteriorates the performance but does not
seriously a�ect the WLC system because the shop �oor stays controlled by the �rst (gateway)
work centre. However, if the workload norm for one work centre is set too tight, a bottleneck
is created which deteriorates performance; this is particularly detrimental if the work centre is
towards the upstream end.
4.4.4 The In�uence of Flow Characteristics and the Routing Length on Performance
The di�erent �ow characteristics have a signi�cant e�ect on performance when the classical ag-
gregate load approach (B) is applied. The corrected aggregate load approach (B') performed
equally well under all �ow characteristics and always outperformed the classical aggregate load
approach (B); this result is consistent with Oosterman et al. (2000) and Land (2004). The results
obtained for the �ow characteristics are also consistent for all routing lengths. If the number of
possible work centres in the routing of a job increases, the performance deteriorates slightly when
compared to the performance of the shop �oor with a shorter maximum routing length. However,
in all cases, a signi�cant reduction in shop �oor throughput time without a signi�cant deteriora-
tion in gross throughput time can be obtained, thereby demonstrating the potential of WLC to
improve shop �oor performance.
The di�erent adjustments made to the processing and inter-arrival times, in order to maintain
a 90% occupation level as the number of work centres on the shop �oor changes, was found to have
4. Optimising Workload Norms: The In�uence of Shop Floor Characteristics on Setting Workload Norms for the
Workload Control Concept
almost no in�uence on the results. The results were similar for all three adjustment procedures.
4.4.5 Discussion of Results
The results presented have shown that it is almost impossible to establish a stable relationship be-
tween workload norms and shop �oor characteristics for the classical aggregate load approach (B).
Thus, in order to obtain optimum performance measures, the workload norms have to be adapted
dynamically, e.g., by applying linear programming techniques such as those presented by Zäpfel
& Missbauer (1993a). However, considering that the workload norm for each work centre has to
be predicted, the high feedback requirements and the number of in�uencing parameters make it
di�cult to implement this approach in practice. If, for example, the �ow characteristics change,
all workload norms have to be recomputed. In addition to outperforming the classical aggregate
load approach (B) in all experiments, the corrected aggregated load approach (B') relies on deter-
mining only one norm - a signi�cant practical advantage especially if WLC is newly implemented
and the shop �oor is 'out of control' at the time of implementation. Moreover, results show that
the optimum value of the workload norm is not a�ected by �ow characteristics or routing length.
The workload norm to set in order to obtain optimum performance was the same for all work
centres in all experiments for the corrected aggregate load approach (B').
The main challenge in determining appropriate workload norms for the classical aggregate
load approach (B) in practice is predicting the indirect load of a work centre and receiving adequate
feedback from the shop �oor (Henrich et al., 2004b). This problem can be avoided if the corrected
aggregate load approach (B') is used; the method is argued to be simpler and easier to apply both
in practice and theory.
Considering the instability of MTO companies, where the �ow characteristics of the shop
�oor can change, e.g., in an extreme case from a Pure Job Shop with undirected routing to a
General Flow Shop with directed routing, the corrected aggregated load approach (B') represents
the best method to apply in practice. The method allows a company to adopt only one stable
rigid norm which is simple to predict. The di�ering characteristics of the incoming order stream
are handled at the release stage one-by-one by converting the load accordingly.
4.5 Conclusion
In theory and, signi�cantly, in practice, determining the workload norm to be applied for a WLC
system is one of the most important problems a�ecting the implementation of the method. Setting
inappropriate workload norms has a direct detrimental e�ect on performance. Theory has provided
methods to predict the workload norms; for example, the norms can be adapted dynamically
according to the up-to-date situation on the shop �oor but assume regular feedback from the shop
�oor. This is a condition which in practice is di�cult to satisfy. WLC has been shown to improve
shop �oor performance signi�cantly but more practical solutions are required to determine simple
rigid upper workload norms which are more manageable for practitioners and yet enable optimum
77
performance to be achieved.
The objective of this paper was to determine how shop �oor characteristics in�uence work-
load norms for the two aggregate load methods which are most suitable for practical implementa-
tion in order to help practitioners predict appropriate workload norms. The research has found
that:
∙ The workload norm for the classical aggregate load approach (B) is heavily in�uenced by
�ow characteristics. If the �ow characteristics change, all workload norms for all work
centres have to be adjusted if they are to remain optimal. Given that the workload norm for
this method is heavily in�uenced by the indirect load, which is di�cult to predict without
detailed feedback from the shop �oor, this often turns out to be an unsolvable problem in
practice and practitioners have to adopt a trial and error approach. However, adopting a
trial and error approach for each work centre on the shop �oor increases the risk of applying
an inadequate workload norm which in�uences the shop �oor performance negatively or
adopting norms that are good locally at the work centre level but do not lead to good
overall shop performance.
∙ The corrected aggregate load approach (B') allows one workload norm to be applied for all
work centres on the shop �oor, avoiding the problem caused by the indirect load. The striking
�nding of this study, however, is that this approach is not in�uenced by �ow characteristics
or by the routing length. The optimum value for the workload norm corresponding to
the optimum performance of the WLC system is similar for all experiments; this �nding
simpli�es the application of WLC in practice signi�cantly.
Considering that the characteristics of real-life shops, e.g., MTO companies, often change,
the corrected aggregate load approach (B') represents a better choice than the classical aggregate
load approach (B) if WLC is implemented in practice. The corrected aggregate load approach
results in superior performance in all experiments; this �nding is consistent with the results
achieved in Thürer et al. (2010a). We also considered whether it is possible to establish a
framework or a set of rules to help practitioners to predict appropriate norms. Results indicate
that this is only of relevance for the classical aggregate load approach (B) where a workload norm
must be determined for each work centre. No direct relationship between the di�erent workload
norms and �ow characteristics could be established. However, when there is a dominant �ow
direction from up to downstream, the further downstream a work centre is, the higher the norm
must be in order to compensate for the greater indirect load which concentrates at downstream
work centres.
The results of this study question whether it is possible to predict appropriate workload
norms for the classical aggregate load approach (B), thereby also questioning the applicability of
the approach in practice. Future research should therefore focus on the corrected aggregate load
approach (B'). In particular, action research should be conducted to implement the approach in
practice using the insights into workload norm setting presented in this paper. Further simulation
research is also required. For example, most studies assume that the capacity of each work centre
4. Optimising Workload Norms: The In�uence of Shop Floor Characteristics on Setting Workload Norms for the
Workload Control Concept
on the shop �oor is equal but this is unlikely to be the case in practice where, for example,
bottlenecks are commonplace. Research should analyse the e�ect that di�ering capacities at work
centres has on workload norms and whether the corrected aggregate load approach maintains its
superior performance.
79

5. Improving the Applicability of Workload Control: The In�uence of Sequence Dependent Set-Up Times on
Workload Controlled Job Shops
5 Improving the Applicability of Workload Control: The
In�uence of Sequence Dependent Set-Up Times on
Workload Controlled Job Shops
Submitted to International Journal of Production Research
Matthias Thürer, Cristovao Silva, Mark Stevenson, and Martin Land
Abstract
Many simulations have demonstrated that the Workload Control (WLC) concept can improve
performance in job shops, but positive empirical results are scarce. One of the reasons for this is
that �eld researchers have encountered implementation challenges which the concept has not been
developed to handle. One of the most important of these challenges is how sequence dependent set-
up times can be handled or accommodated within the design of the concept. Through simulation,
this paper investigates the in�uence of sequence dependent set-up times on the performance of a
workload controlled job shop. It introduces new set-up oriented dispatching rules and assesses the
performance of the best-performing rule in conjunction with controlled order release. The results
demonstrate that combining an e�ective WLC order release rule with an appropriate dispatching
rule improves performance over use of a dispatching rule in isolation when set-up times are sequence
dependent. The �ndings improve our understanding of how this key implementation challenge can
be overcome. Future research should investigate whether the results hold if set-up time parameters
are dynamic and set-up times are not evenly distributed across resources.
5.1 Introduction
Few Production Planning and Control (PPC) concepts accommodate the requirements of small and
medium sized Make-to-Order (MTO) companies which often operate as job shops - the Workload
Control (WLC) concept is an exception (Kingsman, 2000, Stevenson et al., 2005). Jobs are held
back in a pre-shop pool if releasing them onto the shop �oor would exceed workload restrictions.
The objective is to control the queue in front of work centres and reduce Work-In-Process (WIP)
(Land & Gaalman, 1996a). Many simulation studies have demonstrated that WLC can improve
job shop performance (e.g., Oosterman et al., 2000; Land, 2006) but reports of its successful
implementation in practice are limited. Part of the reason for this is that the theory underpinning
WLC has been largely developed through testing and re�ning the concept using simulation models
of simple systems. When attempts have been made to implement WLC in practice, researchers
have encountered more complex systems and found it di�cult to apply existing theory (see, e.g.,
Silva et al., 2006; Stevenson, 2006; Stevenson & Silva, 2008).
One of the issues that �eld researchers have encountered, but which has been neglected in
the conceptual development of WLC, is that of sequence dependent set-up times (Hendry et al.,
81
2008). When there is high-variety, as in a MTO context, the set-up requirements of jobs at a
given machine can vary, thus the number of necessary machine set-ups, or the total set-up time, is
dependent on the sequence in which jobs are processed. Set-ups reduce the throughput of a work
centre, in�uence WIP (and thus the total time needed to process a job), and reduce the available
productive capacity, which may fall below that required. Despite the above, most WLC studies
have ignored sequence dependent set-up times; instead, each job has been treated as independent
and the focus has been on the total work content of each job without distinguishing between the
processing time and both set-up time & requirements.
Only three WLC studies have considered sequence dependent set-up times in job shop-like
production environments: Kim & Bobrowski (1995), Missbauer (1997) and Missbauer (2002).
Firstly, Kim & Bobrowski (1995) used a job shop simulation model to investigate the in�uence of
controlled order release on dispatching rule performance within a job shop with sequence dependent
set-up times. Secondly, Missbauer (1997) used a single-machine analytical model to investigate
the relationship between sequence dependent set-up times and WIP under di�erent dispatching
rules and controlled order release. Finally, Missbauer (2002) sought to determine the in�uence
of lot (or batch) sizes, and thus set-up and holding costs, on performance. Despite signi�cant
research attention on WLC since the above studies (e.g., Henrich et al., 2006; Fredendall et al.,
2010; Thürer et al., 2010), no further progress on this issue has been made. Fernandes & Carmo-
Silva (2010) recently studied the in�uence of sequence dependent set-up times on WLC but only
in the context of a pure �ow shop. The authors considered two options: central control (i.e., at
release) and local control (i.e., at dispatching), concluding that release frequency and shop load
a�ect whether local control leads to better or worse results than central control. There is a need
to extend the study of sequence dependent set-up times to more complex job shop environments
typical of MTO companies in practice.
This study contributes to improving the applicability of WLC by investigating how WLC
can be developed to handle sequence dependent set-up times in job shops. We extend the studies
by Kim & Bobrowski (1995) and Fernandes & Carmo-Silva (2010) to assess whether order release
or dispatching are the key factor determining performance in job shops when sequence dependent
set-up times are present. To achieve this, the performance of �ve dispatching rules and the most
commonly presented release rule in recent literature - the corrected aggregate load approach (Land
& Gaalman, 1996b) - are investigated through simulation. The corrected aggregate load approach
has emerged since Kim & Bobrowski (1995) and hence was not included in their study.
The remainder of this paper is organised as follows. Section 5.2 reviews literature on planning
and control problems concerned with set-up times in the general literature before examining, in
more detail, the available sequence dependent set-up time literature speci�c to WLC. Section 5.3
then describes the design of this simulation study before the results are presented and analysed
in Section 5.4. Final conclusions are drawn in Section 5.5.
5. Improving the Applicability of Workload Control: The In�uence of Sequence Dependent Set-Up Times on
Workload Controlled Job Shops
5.2 Literature Review
This section reviews how set-up times have been considered in previous studies and explores the
in�uence of set-up times and sequence dependency on job shop performance. Section 5.2.1 provides
a brief review of how set-up times have generally been considered in shop �oor control systems for
job shops before Section 5.2.2 reviews the limited WLC research into sequence dependent set-up
times. Finally, an assessment of the literature is presented in Section 5.2.3. For a more complete
overview of literature concerned with set-up times, see Allahverdi et al. (1999 and 2008).
5.2.1 Set-up Times in Job Shop Research
While many planning and control papers investigate set-up times, few focus on job shops because
the characteristics of jobs (highly variable) and shop con�guration (highly �exible with high rout-
ing variation) in this context make many heuristics for optimising set-up time reduction infeasible.
Even in the contributions which have emerged, both the number of job types and routing varia-
tion are usually restricted. One of the �rst relevant studies was by Wilbrecht & Prescott (1969)
who presented and tested seven dispatching rules through simulation. The paper is notable for
introducing the Similar Set-up (SIMSET) dispatching rule which scans the jobs waiting in front of
a work centre and compares set-up requirements with the current machine set-up. It then selects
the job which results in the smallest set-up time; if there are several similar jobs, the one which
arrived at the work centre �rst is chosen. Wilbrecht & Prescott (1969) found that dispatching
rules which consider set-up time requirements perform better than dispatching rules which do not,
especially at a high utilisation rate.
Flynn (1987) and Kim & Bobrowski (1994) extended Wilbrecht & Prescott's (1969) research
by testing four dispatching rules (including SIMSET) in a dynamic job shop environment. Kim &
Bobrowski (1994) also introduced the Job of smallest Critical Ratio (JCR) dispatching rule which
scans the queue in front of a work centre for a job similar to the one currently being processed. If
a similar job cannot be found, the job with the smallest critical ratio - referring to the quotient of
slack and the remaining processing time of a job - is selected. Like SIMSET, JCR outperformed
dispatching rules which ignore set-up requirements. Kim & Bobrowski (1997) then extended this
by analysing the in�uence of set-up time variation, i.e., deviation from the average set-up time, on
the performance of dispatching. The authors showed that set-up time variation negatively a�ects
dispatching rule performance. As in previous research, it was shown that set-up oriented rules -
which accommodate set-up time variation - improve performance over rules which do not consider
set-up requirements.
In the last decade, sequence dependent set-up times have been researched using deterministic
models, such as by applying genetic algorithms (e.g., Cheung & Zhou, 2001), mixed integer linear
programming (e.g., Choi & Choi, 2002) and Petri-net approaches (e.g., Artigues & Roubellat,
2001). This work has sought to �nd an optimum solution to job shop scheduling problems whilst
considering set-up times; however, job shop environments close to the pure job shop have not
83
been considered and most of the proposed solutions are too sophisticated for implementation in
practice.
5.2.2 Set-up Times in WLC Controlled Job Shops
Only three WLC studies have investigated sequence dependent set-up times in job shops. The
objective of the �rst paper, by Kim & Bobrowski (1995), was to determine how controlled release
a�ects shop performance when set-up times are sequence dependent. The authors investigated sev-
eral release and dispatching rules and concluded that, when set-up times are sequence dependent,
performance depends primarily on the dispatching rule. The paper fundamentally questioned the
e�ectiveness of order release arguing that the negative in�uence of controlled order release on
the performance of the dispatching rule (due to the reduced number of jobs on the shop �oor)
cannot be o�set by the release rule. However, Kim & Bobrowski (1995) only considered simple
release rules. Hence, further research is required which makes use of recent contributions to the
development of order release rules.
The main focus of the second contribution, by Missbauer (1997), and indirectly the third,
also by Missbauer (2002), was the relationship between WIP and the total set-up time. Missbauer
(1997) used a single-machine analytical model to show that sequence dependent set-up times have
a signi�cant impact on the optimum level of WIP and argued that an increase in the number of
jobs in the system, and thus WIP, decreases set-up times if a dispatching rule is applied which
considers set-up requirements. While this was an important contribution, the relationship between
set-up times, the dispatching rule, controlled order release and WIP in more complex scenarios
than single-machine models is yet to be explored. This gap was acknowledged by Missbauer (1997)
who underlined the need for more research into set-up time estimations, especially for real-world
situations. Missbauer (2002) explored the relationship between lot sizes, which in�uence the total
set-up time, and WIP. The author presented simple rules for de�ning optimum lot sizes for a
single-machine model and highlighted the limitations of current WLC theory for more complex
job shop environments.
5.2.3 Assessment of the Literature
Sequence dependent set-up times must be considered if WLC is to be successfully implemented
in practice. This has been recognised by Hendry et al. (2008) who highlighted it as one of
the most important outstanding implementation issues and research questions for improving the
applicability of the WLC concept to real-life job shops and MTO companies. While a body of
literature concerned with set-up times has been established, only three WLC contributions have
considered set-up times in job shops. Moreover, two of these were presented in the 1990s and hence
do not re�ect recent advances in WLC theory which have emerged since and resulted in new, and
more e�cient, release rules. In response, this research begins by considering the following two
research questions (RQ1-2):
5. Improving the Applicability of Workload Control: The In�uence of Sequence Dependent Set-Up Times on
Workload Controlled Job Shops
∙ RQ1: Is controlled order release really detrimental to shop �oor performance, as argued by
Kim & Bobrowski (1995)?
∙ RQ2: How can sequence dependent set-up times be accommodated within the design of the
WLC concept?
To answer RQ1, �rstly, a set of simulation experiments is conducted to identify the best-
performing dispatching rules in job shop environments. Secondly, the release of orders is regulated
by WLC to assess the in�uence of controlled order release on performance. Based on the results
obtained, and in answer to the second research question (RQ2), the best way of accommodating
sequence dependent set-up times is identi�ed. Cigolini et al. (1998) recommended gradually
changing the features of a simulation in order to diagnose what in�uences its parameters and
performance. Therefore, the characteristics of sequence dependent set-up times, i.e., the number
of job types and mean set-up time, are gradually changed throughout the experiments.
5.3 Simulation Model
5.3.1 Shop Characteristics
A shop �oor simulation model of a pure job shop (Melnyk & Ragatz, 1989) has been developed
using SIMUL8 c⃝. It consists of 6 work centres, where each is a single and unique capacity resource;
capacity is equal for all work centres and remains constant. The routing length varies from 1 to 6
operations and all work centres have an equal probability of being visited. Each operation requires
one speci�c work centre; routings and operation processing times are known upon job entry.
Each job is of a certain 'job type', where each job type has certain set-up requirements.
The type of a job is known upon entry and independent of the routing and processing time
characteristics of the job. Job types are equally distributed across jobs as an uneven distribution
may lead to (shifting) bottlenecks and thus distract from the focus of the study. Each work centre
can process all of the di�erent job types.
The model is similar to that applied by Kim & Bobrowski (1995); however, re-entrant loops
are avoided (as in most recent studies, e.g., Oosterman et al., 2000; Land, 2006; Thürer et al.,
2010) to obtain a clearer insight into shop �oor performance.
5.3.2 Order Release
No special order review methodology is applied: in experiments without controlled order release,
orders are released immediately to the shop �oor; in all other experiments, orders �ow into the pre-
shop pool where they wait to be released. Jobs are considered for release periodically according to
least slack. Slack represents the time between the latest release date and the current date. A job
is attributed to the load of the work centres in its routing at release. If this new load �ts within
the workload norm, the job is released; but if one or more norms would be exceeded, the job must
85

wait until at least the next release period. This procedure is repeated until all jobs in the pool
have been considered for release once.
While the release procedure is similar for most periodic order release rules (Land & Gaalman,
1998), the way in which the workload is accounted for over time di�ers. The two most commonly
applied methods are: the probabilistic approach, which estimates the input to the direct load of
each work centre and converts the contributed load using a depreciation factor based on historical
(probabilistic) data (Bechte, 1988; Bechte, 1994); and the classical aggregate load approach, which
does not consider the position of a work centre in the routing of a job, simply aggregating the load
of the job and the load of the work centre (Bertrand &Wortmann, 1981; Tatsiopoulos, 1983). Land
& Gaalman (1996b) proposed an extension to the latter - the corrected aggregate load approach
- which divides the contributed load by the position of a work centre in the routing of a job,
thus also converting the load but in a far simpler way. Cigolini et al. (1998) compared di�erent
approaches to workload accounting over time, demonstrating the superior performance of the
probabilistic approach over aggregate load approaches; however, the authors did not consider the
corrected aggregate load approach. Oosterman et al. (2000) did include the corrected aggregate
load approach and found that its performance was similar to the probabilistic approach. The
probabilistic approach performed slightly better than the corrected aggregate load approach in
a pure job shop for a small range of workload levels; however, when the routing becomes more
directed, the corrected aggregate load approach outperforms the probabilistic method.
Based on the above, and given that most recent studies have concentrated on aggregate
load approaches because they are arguably simpler than probabilistic methods and therefore more
appropriate for practical implementation, this study focuses on the corrected aggregate load ap-
proach. The check period is set to 5 time units, i.e., jobs in the pool are considered for release
every 5 time units. For a more comprehensive review of order release mechanisms, see: Philipoom
et al. (1993), Wisner (1995), Land & Gaalman (1996a), Bergamaschi et al. (1997), Sabuncuoglu
& Karapinar (1999) and Fredendall et al. (2010).
5.3.3 Dispatching
Five dispatching rules are applied in this study:
∙ First-Come-First-Served (FCFS) - selects the job from the queue which arrived �rst.
∙ Similar Set-up (SIMSET) - introduced by Wilbrecht & Prescott (1969), scans the queue for
the job which results in the smallest set-up time if processed after the job currently being
processed. If this smallest set-up time is shared by several jobs, the one which arrived �rst
is selected.
∙ Job of smallest Critical Ratio (JCR) - introduced by Kim & Bobrowski (1994), scans the
queue in front of the work centre for a similar job to the one currently being processed. If
no such job is found, the job with the smallest critical ratio is selected. In this study, the
critical ratio is the quotient of the slack and remaining processing time of the job. We base
5. Improving the Applicability of Workload Control: The In�uence of Sequence Dependent Set-Up Times on
Workload Controlled Job Shops
the critical ratio on the processing time rather than the estimated lead time to keep it simple
and retain focus on the set-up time element of the rule. Moreover, preliminary simulations
comparing processing time oriented and estimated lead time oriented critical ratios indicated
no signi�cant performance di�erence.
∙ Set-up Oriented Planned operation Start Time (SOPST) - newly introduced in this study;
it scans the queue in front of the work centre for a similar job to the one currently being
processed. If no such job is found, the job with the earliest planned operation start time is
selected.
∙ Set-up Oriented Shortest Processing Time (SOSPT) - newly introduced in this study; it
scans the queue in front of the work centre for a similar job to the one currently being
processed. If no such job is found, the job with the shortest processing time is selected.
FCFS is a simple rule which does not consider any information on job or shop characteristics
and is used in most WLC simulation studies (e.g., Land & Gaalman, 1998; Henrich et al., 2006).
Meanwhile, SIMSET and JCR represent the two most widely used dispatching rules in literature
which consider set-up requirements - both rules were applied in Kim & Bobrowski (1995). For
SOPST and SOSPT, we took advantage of the hybrid nature of the JCR rule, maintaining the
'J' part (which considers set-up requirements) but substituting the 'CR' part for two dispatching
rules which have performed better in a WLC environment (see Land & Gaalman, 1998). Firstly,
the Shortest Processing Time (SPT) rule, which selects the job with the shortest processing time
from the queue - this rule should improve throughput time performance (see, e.g., Kanet & Hayya,
1982); and, secondly, the Planned operation Start Time (PST) rule, which selects the job with the
earliest operation start time, given by the due date minus the remaining processing time and the
number of remaining operations multiplied by a slack factor k. Preliminary simulation experiments
indicated an average throughput time across all experiments of 17 time units; therefore, k has been
kept constant at 4 time units.
Note that every dispatching rule which does not consider set-up requirements can be used
as a substitute for CR, thus turning the rule into a dispatching rule which does consider set-up
requirements without in�uencing the development of the set-up times.
5.3.4 Job Characteristics and Due Date Setting Procedure
Processing times follow a truncated 2-Erlang distribution with a non-truncated mean of 1 time
unit and a maximum of 4 time units. Set-up times (i.e., the time needed to change a machine over
from one job type to another) are fully sequence dependent and can be summarised in a set-up
time matrix. The matrix is the same for all work centres. According to the matrix, the time
needed to set up a machine from the currently processed job type "Y" to a job of type "X" to be
processed next is given by the element (X, Y). Note that the study by Kim & Bobrowski (1995)
based set-up times on a matrix derived from White & Wilson (1977). The matrix used in our
study is a normalised version of this in order to simulate di�erent set-up time values. Table 15
87
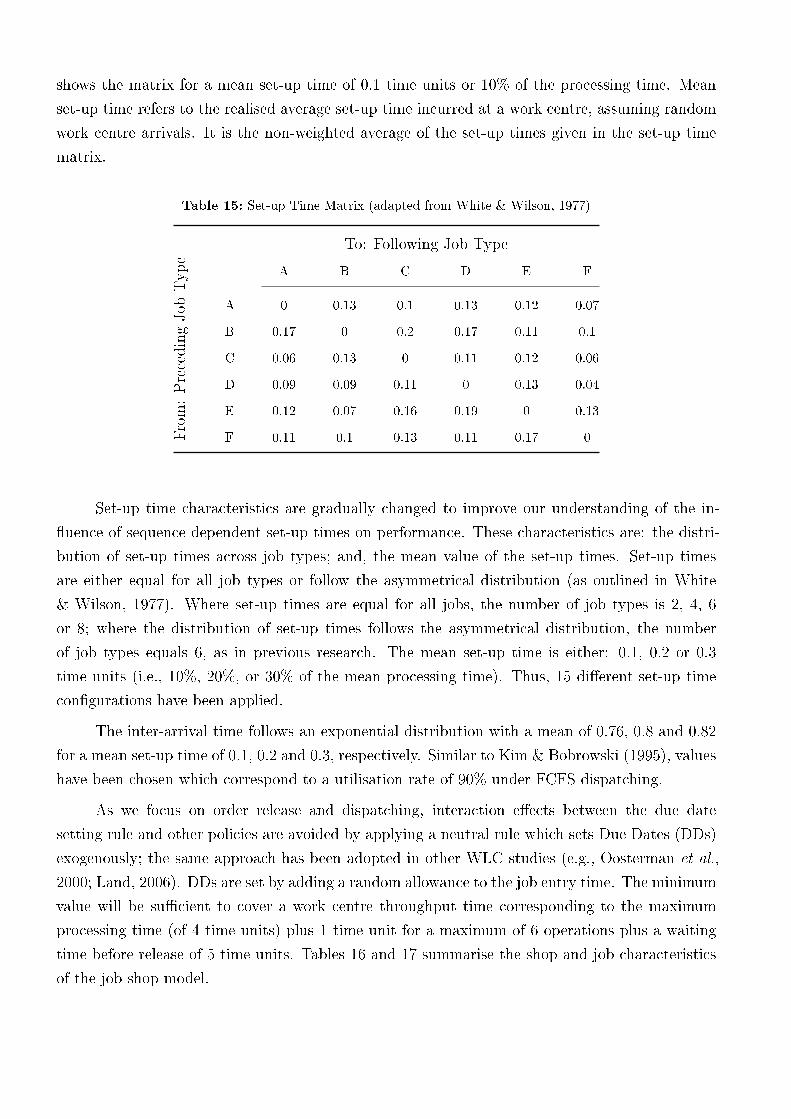
shows the matrix for a mean set-up time of 0.1 time units or 10% of the processing time. Mean
set-up time refers to the realised average set-up time incurred at a work centre, assuming random
work centre arrivals. It is the non-weighted average of the set-up times given in the set-up time
matrix.
Table 15: Set-up Time Matrix (adapted from White & Wilson, 1977)
To: Following Job Type
From:PrecedingJob
Type
A B C D E F
A 0 0.13 0.1 0.13 0.12 0.07
B 0.17 0 0.2 0.17 0.11 0.1
C 0.06 0.13 0 0.11 0.12 0.06
D 0.09 0.09 0.11 0 0.13 0.04
E 0.12 0.07 0.16 0.19 0 0.13
F 0.11 0.1 0.13 0.11 0.17 0
Set-up time characteristics are gradually changed to improve our understanding of the in-
�uence of sequence dependent set-up times on performance. These characteristics are: the distri-
bution of set-up times across job types; and, the mean value of the set-up times. Set-up times
are either equal for all job types or follow the asymmetrical distribution (as outlined in White
& Wilson, 1977). Where set-up times are equal for all jobs, the number of job types is 2, 4, 6
or 8; where the distribution of set-up times follows the asymmetrical distribution, the number
of job types equals 6, as in previous research. The mean set-up time is either: 0.1, 0.2 or 0.3
time units (i.e., 10%, 20%, or 30% of the mean processing time). Thus, 15 di�erent set-up time
con�gurations have been applied.
The inter-arrival time follows an exponential distribution with a mean of 0.76, 0.8 and 0.82
for a mean set-up time of 0.1, 0.2 and 0.3, respectively. Similar to Kim & Bobrowski (1995), values
have been chosen which correspond to a utilisation rate of 90% under FCFS dispatching.
As we focus on order release and dispatching, interaction e�ects between the due date
setting rule and other policies are avoided by applying a neutral rule which sets Due Dates (DDs)
exogenously; the same approach has been adopted in other WLC studies (e.g., Oosterman et al.,
2000; Land, 2006). DDs are set by adding a random allowance to the job entry time. The minimum
value will be su�cient to cover a work centre throughput time corresponding to the maximum
processing time (of 4 time units) plus 1 time unit for a maximum of 6 operations plus a waiting
time before release of 5 time units. Tables 16 and 17 summarise the shop and job characteristics
of the job shop model.
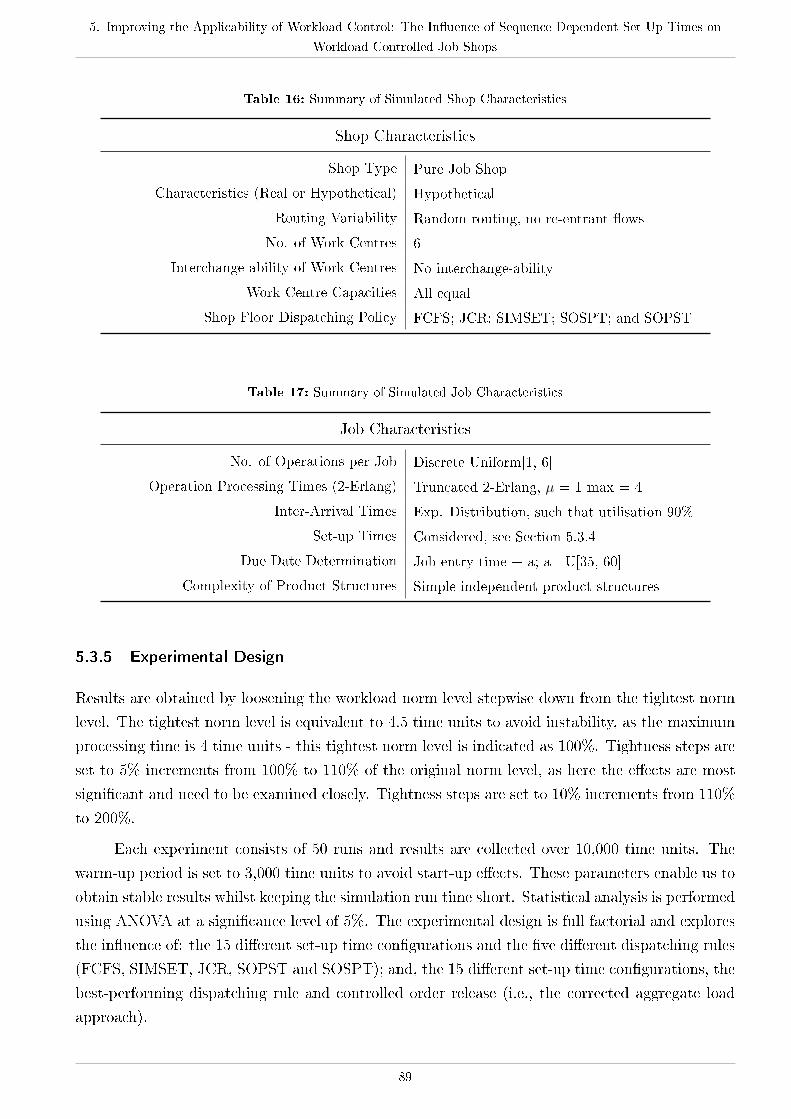
5. Improving the Applicability of Workload Control: The In�uence of Sequence Dependent Set-Up Times on
Workload Controlled Job Shops
Table 16: Summary of Simulated Shop Characteristics
Shop Characteristics
Shop Type Pure Job Shop
Characteristics (Real or Hypothetical) Hypothetical
Routing Variability Random routing, no re-entrant �ows
No. of Work Centres 6
Interchange-ability of Work Centres No interchange-ability
Work Centre Capacities All equal
Shop Floor Dispatching Policy FCFS; JCR; SIMSET; SOSPT; and SOPST
Table 17: Summary of Simulated Job Characteristics
Job Characteristics
No. of Operations per Job Discrete Uniform[1, 6]
Operation Processing Times (2-Erlang) Truncated 2-Erlang, � = 1 max = 4
Inter-Arrival Times Exp. Distribution, such that utilisation 90%
Set-up Times Considered, see Section 5.3.4
Due Date Determination Job entry time + a; a U[35, 60]
Complexity of Product Structures Simple independent product structures
5.3.5 Experimental Design
Results are obtained by loosening the workload norm level stepwise down from the tightest norm
level. The tightest norm level is equivalent to 4.5 time units to avoid instability, as the maximum
processing time is 4 time units - this tightest norm level is indicated as 100%. Tightness steps are
set to 5% increments from 100% to 110% of the original norm level, as here the e�ects are most
signi�cant and need to be examined closely. Tightness steps are set to 10% increments from 110%
to 200%.
Each experiment consists of 50 runs and results are collected over 10,000 time units. The
warm-up period is set to 3,000 time units to avoid start-up e�ects. These parameters enable us to
obtain stable results whilst keeping the simulation run time short. Statistical analysis is performed
using ANOVA at a signi�cance level of 5%. The experimental design is full factorial and explores
the in�uence of: the 15 di�erent set-up time con�gurations and the �ve di�erent dispatching rules
(FCFS, SIMSET, JCR, SOPST and SOSPT); and, the 15 di�erent set-up time con�gurations, the
best-performing dispatching rule and controlled order release (i.e., the corrected aggregate load
approach).
89
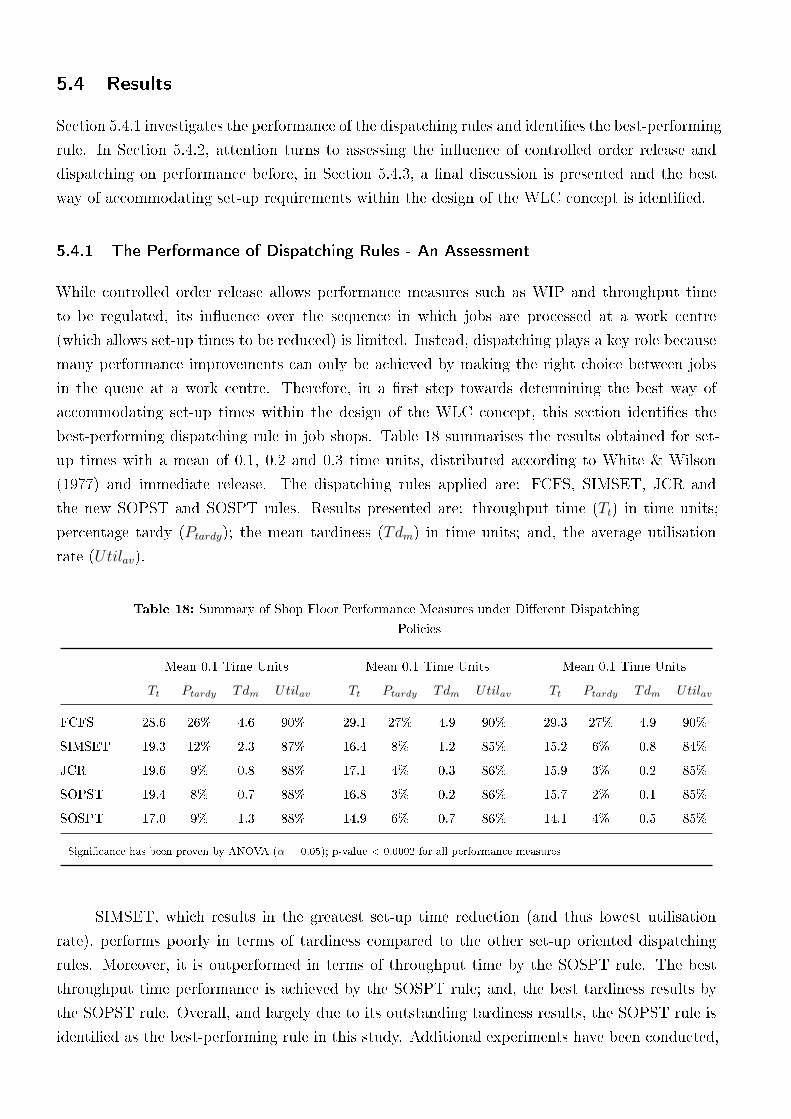
5.4 Results
Section 5.4.1 investigates the performance of the dispatching rules and identi�es the best-performing
rule. In Section 5.4.2, attention turns to assessing the in�uence of controlled order release and
dispatching on performance before, in Section 5.4.3, a �nal discussion is presented and the best
way of accommodating set-up requirements within the design of the WLC concept is identi�ed.
5.4.1 The Performance of Dispatching Rules - An Assessment
While controlled order release allows performance measures such as WIP and throughput time
to be regulated, its in�uence over the sequence in which jobs are processed at a work centre
(which allows set-up times to be reduced) is limited. Instead, dispatching plays a key role because
many performance improvements can only be achieved by making the right choice between jobs
in the queue at a work centre. Therefore, in a �rst step towards determining the best way of
accommodating set-up times within the design of the WLC concept, this section identi�es the
best-performing dispatching rule in job shops. Table 18 summarises the results obtained for set-
up times with a mean of 0.1, 0.2 and 0.3 time units, distributed according to White & Wilson
(1977) and immediate release. The dispatching rules applied are: FCFS, SIMSET, JCR and
the new SOPST and SOSPT rules. Results presented are: throughput time (Tt) in time units;
percentage tardy (Ptardy); the mean tardiness (Tdm) in time units; and, the average utilisation
rate (Utilav).
Table 18: Summary of Shop Floor Performance Measures under Di�erent Dispatching
Policies
Mean 0.1 Time Units Mean 0.1 Time Units Mean 0.1 Time Units
Tt Ptardy Tdm Utilav Tt Ptardy Tdm Utilav Tt Ptardy Tdm Utilav
FCFS 28.6 26% 4.6 90% 29.1 27% 4.9 90% 29.3 27% 4.9 90%
SIMSET 19.3 12% 2.3 87% 16.4 8% 1.2 85% 15.2 6% 0.8 84%
JCR 19.6 9% 0.8 88% 17.1 4% 0.3 86% 15.9 3% 0.2 85%
SOPST 19.4 8% 0.7 88% 16.8 3% 0.2 86% 15.7 2% 0.1 85%
SOSPT 17.0 9% 1.3 88% 14.9 6% 0.7 86% 14.1 4% 0.5 85%
Signi�cance has been proven by ANOVA (� = 0.05); p-value < 0.0002 for all performance measures
SIMSET, which results in the greatest set-up time reduction (and thus lowest utilisation
rate), performs poorly in terms of tardiness compared to the other set-up oriented dispatching
rules. Moreover, it is outperformed in terms of throughput time by the SOSPT rule. The best
throughput time performance is achieved by the SOSPT rule; and, the best tardiness results by
the SOPST rule. Overall, and largely due to its outstanding tardiness results, the SOPST rule is
identi�ed as the best-performing rule in this study. Additional experiments have been conducted,
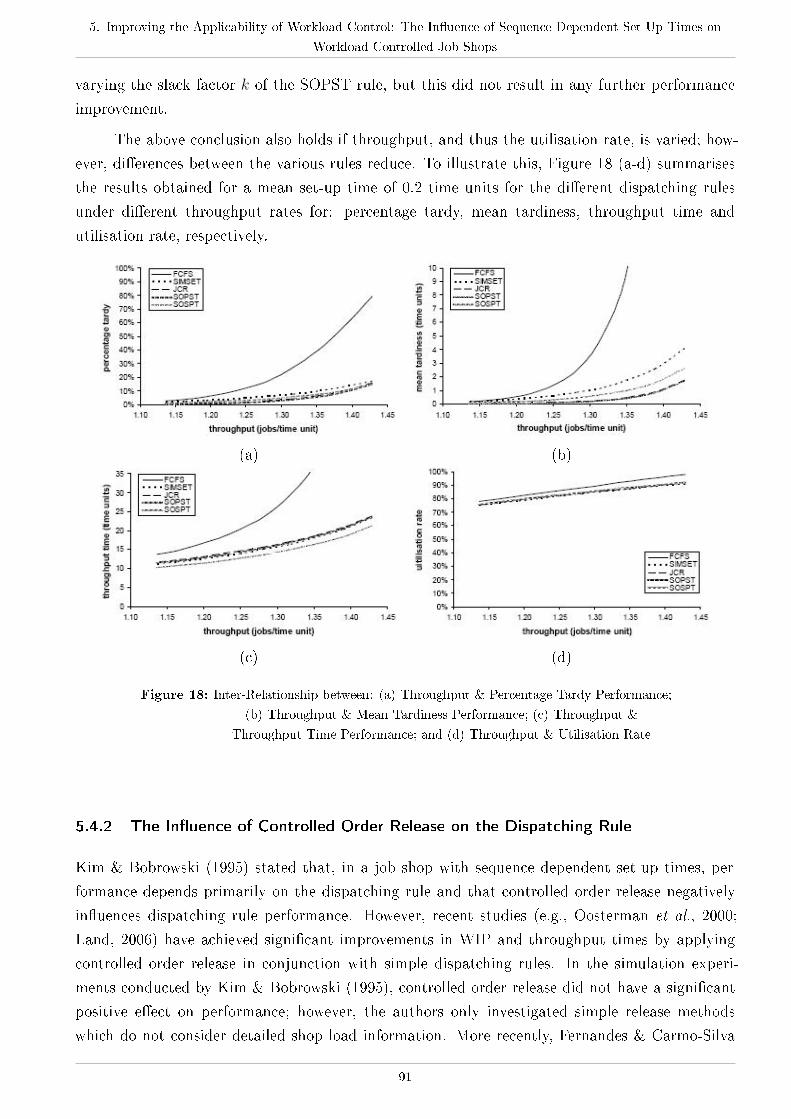
5. Improving the Applicability of Workload Control: The In�uence of Sequence Dependent Set-Up Times on
Workload Controlled Job Shops
varying the slack factor k of the SOPST rule, but this did not result in any further performance
improvement.
The above conclusion also holds if throughput, and thus the utilisation rate, is varied; how-
ever, di�erences between the various rules reduce. To illustrate this, Figure 18 (a-d) summarises
the results obtained for a mean set-up time of 0.2 time units for the di�erent dispatching rules
under di�erent throughput rates for: percentage tardy, mean tardiness, throughput time and
utilisation rate, respectively.
(a) (b)
(c) (d)
Figure 18: Inter-Relationship between: (a) Throughput & Percentage Tardy Performance;
(b) Throughput & Mean Tardiness Performance; (c) Throughput &
Throughput Time Performance; and (d) Throughput & Utilisation Rate
5.4.2 The In�uence of Controlled Order Release on the Dispatching Rule
Kim & Bobrowski (1995) stated that, in a job shop with sequence dependent set-up times, per-
formance depends primarily on the dispatching rule and that controlled order release negatively
in�uences dispatching rule performance. However, recent studies (e.g., Oosterman et al., 2000;
Land, 2006) have achieved signi�cant improvements in WIP and throughput times by applying
controlled order release in conjunction with simple dispatching rules. In the simulation experi-
ments conducted by Kim & Bobrowski (1995), controlled order release did not have a signi�cant
positive e�ect on performance; however, the authors only investigated simple release methods
which do not consider detailed shop load information. More recently, Fernandes & Carmo-Silva
91
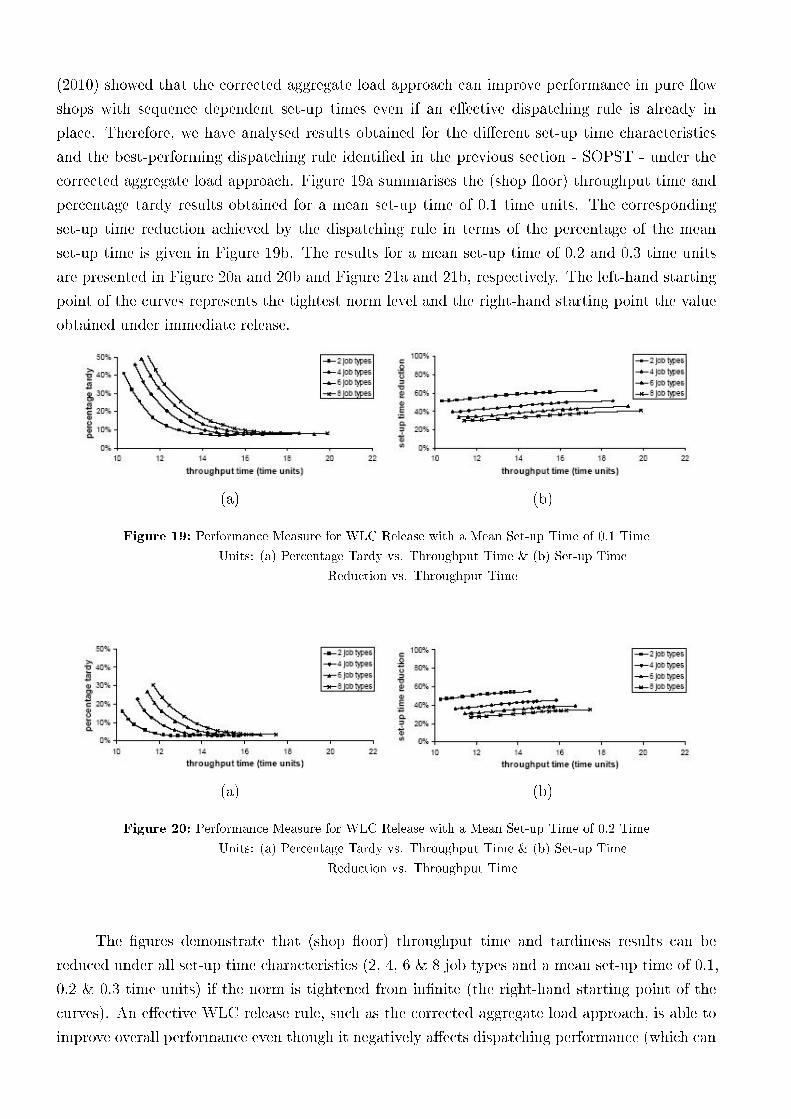
(2010) showed that the corrected aggregate load approach can improve performance in pure �ow
shops with sequence dependent set-up times even if an e�ective dispatching rule is already in
place. Therefore, we have analysed results obtained for the di�erent set-up time characteristics
and the best-performing dispatching rule identi�ed in the previous section - SOPST - under the
corrected aggregate load approach. Figure 19a summarises the (shop �oor) throughput time and
percentage tardy results obtained for a mean set-up time of 0.1 time units. The corresponding
set-up time reduction achieved by the dispatching rule in terms of the percentage of the mean
set-up time is given in Figure 19b. The results for a mean set-up time of 0.2 and 0.3 time units
are presented in Figure 20a and 20b and Figure 21a and 21b, respectively. The left-hand starting
point of the curves represents the tightest norm level and the right-hand starting point the value
obtained under immediate release.
(a) (b)
Figure 19: Performance Measure for WLC Release with a Mean Set-up Time of 0.1 Time
Units: (a) Percentage Tardy vs. Throughput Time & (b) Set-up Time
Reduction vs. Throughput Time
(a) (b)
Figure 20: Performance Measure for WLC Release with a Mean Set-up Time of 0.2 Time
Units: (a) Percentage Tardy vs. Throughput Time & (b) Set-up Time
Reduction vs. Throughput Time
The �gures demonstrate that (shop �oor) throughput time and tardiness results can be
reduced under all set-up time characteristics (2, 4, 6 & 8 job types and a mean set-up time of 0.1,
0.2 & 0.3 time units) if the norm is tightened from in�nite (the right-hand starting point of the
curves). An e�ective WLC release rule, such as the corrected aggregate load approach, is able to
improve overall performance even though it negatively a�ects dispatching performance (which can
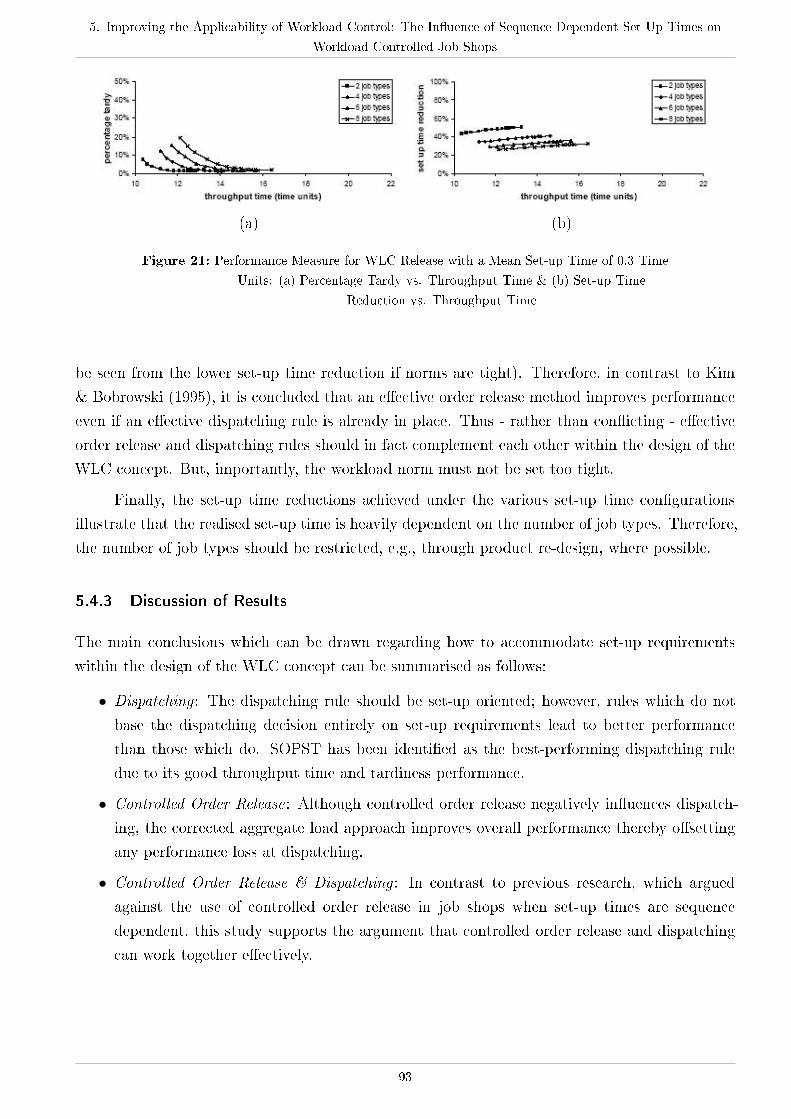
5. Improving the Applicability of Workload Control: The In�uence of Sequence Dependent Set-Up Times on
Workload Controlled Job Shops
(a) (b)
Figure 21: Performance Measure for WLC Release with a Mean Set-up Time of 0.3 Time
Units: (a) Percentage Tardy vs. Throughput Time & (b) Set-up Time
Reduction vs. Throughput Time
be seen from the lower set-up time reduction if norms are tight). Therefore, in contrast to Kim
& Bobrowski (1995), it is concluded that an e�ective order release method improves performance
even if an e�ective dispatching rule is already in place. Thus - rather than con�icting - e�ective
order release and dispatching rules should in fact complement each other within the design of the
WLC concept. But, importantly, the workload norm must not be set too tight.
Finally, the set-up time reductions achieved under the various set-up time con�gurations
illustrate that the realised set-up time is heavily dependent on the number of job types. Therefore,
the number of job types should be restricted, e.g., through product re-design, where possible.
5.4.3 Discussion of Results
The main conclusions which can be drawn regarding how to accommodate set-up requirements
within the design of the WLC concept can be summarised as follows:
∙ Dispatching : The dispatching rule should be set-up oriented; however, rules which do not
base the dispatching decision entirely on set-up requirements lead to better performance
than those which do. SOPST has been identi�ed as the best-performing dispatching rule
due to its good throughput time and tardiness performance.
∙ Controlled Order Release: Although controlled order release negatively in�uences dispatch-
ing, the corrected aggregate load approach improves overall performance thereby o�setting
any performance loss at dispatching.
∙ Controlled Order Release & Dispatching : In contrast to previous research, which argued
against the use of controlled order release in job shops when set-up times are sequence
dependent, this study supports the argument that controlled order release and dispatching
can work together e�ectively.
93
5.5 Conclusion
The successful implementation of WLC in practice is an enduring challenge. This paper contributes
by addressing one of the most important implementation issues raised by Hendry et al. (2008):
how to handle sequence dependent set-up times within the design of the WLC concept. The
best-performing dispatching rule was identi�ed; and, in answer to the �rst research question, it
was shown that although controlled order release reduces the number of jobs in the queue, and
thus the e�ectiveness of dispatching, these performance losses can be o�set by an e�ective order
release rule if workload norms are set appropriately. These �ndings contradict Kim & Bobrowski
(1995) who argued that controlled order release negatively a�ects overall performance when set-up
times are sequence dependent. In answer to the second research question, the results support the
argument that set-up requirements can best be accommodated within the design of the WLC
concept by combining an e�ective dispatching rule with controlled order release.
In this study, parameters were assumed constant over time and job types equally distributed,
thereby avoiding bottleneck e�ects. Future research should consider dynamic parameters and
unbalanced distributions of set-up time characteristics.
Part IV.
Re(de)�ning the Workload Control
Concept
Table of Contents
6. Workload Control and Order Release: A Lean Solution for Make-To-Order
Companies 97
6.1. Introduction . . . . . . . . . . . . . . . . . . . . . . . . . . . . . . . . . . . . . . 97
6.2. Literature Review . . . . . . . . . . . . . . . . . . . . . . . . . . . . . . . . . . . 99
6.3. Simulation Model . . . . . . . . . . . . . . . . . . . . . . . . . . . . . . . . . . . 104
6.4. Results . . . . . . . . . . . . . . . . . . . . . . . . . . . . . . . . . . . . . . . . . 106
6.5. Implications for Research and Practice . . . . . . . . . . . . . . . . . . . . . . . 116
6.6. Conclusion . . . . . . . . . . . . . . . . . . . . . . . . . . . . . . . . . . . . . . . 117
7. Controlled Order Release: A Performance Assessment in Job Shops with
Sequence Dependent Set-up Times 119
7.1. Introduction . . . . . . . . . . . . . . . . . . . . . . . . . . . . . . . . . . . . . . 119
7.2. Literature Review . . . . . . . . . . . . . . . . . . . . . . . . . . . . . . . . . . . 121
7.3. Simulation Model . . . . . . . . . . . . . . . . . . . . . . . . . . . . . . . . . . . 125
7.4. Results . . . . . . . . . . . . . . . . . . . . . . . . . . . . . . . . . . . . . . . . . 129
7.5. Implications for WLC in Practice . . . . . . . . . . . . . . . . . . . . . . . . . . 137
7.6. Conclusion . . . . . . . . . . . . . . . . . . . . . . . . . . . . . . . . . . . . . . . 138
8. Workload Control and Customer Enquiry Management: The Key to Lead Time
Control and Customer Service 139
8.1. Introduction . . . . . . . . . . . . . . . . . . . . . . . . . . . . . . . . . . . . . . 139
8.2. Literature Review . . . . . . . . . . . . . . . . . . . . . . . . . . . . . . . . . . . 141
8.3. Simulation Model . . . . . . . . . . . . . . . . . . . . . . . . . . . . . . . . . . . 148
8.4. Results . . . . . . . . . . . . . . . . . . . . . . . . . . . . . . . . . . . . . . . . . 154
8.5. Conclusion . . . . . . . . . . . . . . . . . . . . . . . . . . . . . . . . . . . . . . . 163
9. The Application of Workload Control in Assembly Job Shops: An Assessment by
Simulation 165
9.1. Introduction . . . . . . . . . . . . . . . . . . . . . . . . . . . . . . . . . . . . . . 165
9.2. Literature Review . . . . . . . . . . . . . . . . . . . . . . . . . . . . . . . . . . . 167
9.3. Simulation Model . . . . . . . . . . . . . . . . . . . . . . . . . . . . . . . . . . . 170
9.4. Results . . . . . . . . . . . . . . . . . . . . . . . . . . . . . . . . . . . . . . . . . 178
9.5. Conclusion . . . . . . . . . . . . . . . . . . . . . . . . . . . . . . . . . . . . . . . 184
10. Development and Design of Workload Control Based Decision Support Systems 185
10.1. Introduction . . . . . . . . . . . . . . . . . . . . . . . . . . . . . . . . . . . . . . 185
10.2. Literature Review . . . . . . . . . . . . . . . . . . . . . . . . . . . . . . . . . . . 186

6 Workload Control and Order Release: A Lean Solution
for Make-To-Order Companies
Submitted to Production & Operations Management
Matthias Thürer, Mark Stevenson, Cristovao Silva, Martin Land, and Lawrence Fredendall
Abstract
Protecting throughput from variance is the key to achieving lean. Workload Control (WLC)
accomplishes this in complex make-to-order job shops by controlling lead times, capacity andWork-
In-Process (WIP). However, the concept has been dismissed by many authors who believe its order
release mechanism reduces the e�ectiveness of shop �oor dispatching and increases work centre
idleness, thereby also increasing job tardiness results. We show that these problems have been
overcome. AWLC order release method known as "LUMS OR" combines continuous with periodic
release, allowing the release of work to be triggered between periodic releases if a work centre is
starving. But, until now, its performance has not been fully assessed. This paper investigates
the performance of LUMS OR and compares it against the best-performing purely periodic and
continuous release rules across a range of �ow directions, from the pure job shop to the general �ow
shop. Results demonstrate that LUMS OR and the continuous WLC release methods consistently
outperform purely periodic release and Constant WIP (ConWIP). LUMS OR is considered the best
solution in practice due to its excellent performance and ease of implementation. Findings have
signi�cant implications for research and practice: throughput times & job tardiness results can be
improved simultaneously and order release & dispatching rules can complement each other. Thus,
WLC represents an e�ective means of implementing lean principles in a make-to-order context.
6.1 Introduction
This paper re-examines the use of Workload Control (WLC) given recent developments not only
in WLC theory but also in our understanding of lean operations. Hopp & Spearman (2004)
argued that protecting throughput from variance is the key to achieving lean; and, that limiting
Work-in-Process (WIP) is essential for an e�ective pull production system. The WLC concept
is a Production Planning and Control (PPC) solution that achieves this in the complex world
of Make-To-Order (MTO) production. It simultaneously controls lead times, capacity and WIP
on the shop �oor, integrating production and sales into a hierarchical system of workloads which
bu�er against variance (Tatsiopoulos & Kingsman, 1983). The hierarchy consists of: the shop
�oor workload (or WIP); the planned workload (all accepted orders); and, the total workload (the
accepted load plus a percentage of customer enquiries based on order winning history). The �rst,
and lowest level, is controlled through an order release method which decouples the shop �oor
from a pre-shop pool of orders; jobs for which materials are available are held in the pool and
released onto the shop �oor in time to meet Due Dates (DDs) whilst keeping workload levels (i.e.,
WIP) on the shop �oor within limits or norms. While orders remain in the pre-shop pool, design,
quantity and DD changes can be accommodated (Land & Gaalman, 1996a). The latter two higher
levels are controlled through customer enquiry management, which matches required and available
capacity over time and controls delivery lead times by moulding the total workload into a shape
that can be produced pro�tably and on-time (Tatsiopoulos & Kingsman, 1983; Hendry et al., 1998;
Kingsman, 2000).
The majority of research into PPC systems focuses on solutions for large organizations and
shops with limited routing complexity, but there is a need to give more attention to concepts such
as WLC that are simple, suitable for Small and Medium sized Enterprises (SMEs) with limited
�nancial resources, and perform well in job shops (Stevenson et al., 2005; Land & Gaalman,
2009). Yet many authors have long-since dismissed the concept, arguing that WLC order release
mechanisms can only control WIP and reduce shop �oor throughput times (i.e., the manufacturing
lead time) by deteriorating tardiness results and restricting the e�ectiveness of the dispatching
rule (Baker, 1984; Kanet, 1988; Ragatz & Mabert, 1988; Kim & Bobrowski, 1995). Here, it is
argued that WLC theory has overcome these problems and that today WLC order release o�ers
a PPC solution which not only controls WIP and reduces both throughput times and the number
of tardy jobs but - in conjunction with customer enquiry management - allows variance to be
reduced and helps companies become lean.
As an example, Kanet (1988) criticized WLC order release for leading to premature work
centre idleness (i.e., idleness that could have been postponed). This refers to when a work centre
'starves' because it has a high indirect load (i.e., the load which is still upstream of the work
centre) which hinders the release of direct load to the work centre (Land & Gaalman, 1998).
However, premature idleness only occurs when periodic release methods are used, i.e., when an
upper bound is used to restrict the workload (direct and indirect) and only work which �ts within
this upper bound is released periodically. In contrast, most continuous release methods use a
workload trigger which releases a job onto the shop �oor at any moment in time if the direct load
in front of a work centre falls to a certain level; this overcomes premature idleness. In addition,
as early as 1991, Hendry & Kingsman (1991a) presented a release method, hereafter referred to
as "LUMS OR", which combined periodic release - through the use of an upper bound to restrict
the workload - with continuous release - in the form of a lower bound workload trigger - which
pulled a job onto the shop �oor at any moment in time if a work centre was starving unnecessarily.
However, the method has never been tested in its entirety; studies ignore the continuous part
thereby simplifying it to a periodic method (e.g., Hendry & Wong, 1994; Cigolini & Portioli-
Staudacher, 2002). As a result of this simpli�cation, LUMS OR has performed poorly relative to
alternative WLC approaches.
Periodic release methods, for which most of the above criticism remains valid to this day,
dominate contemporary WLC literature (e.g., Sabuncuoglu & Karapinar, 2000; Oosterman et al.
2000; Land, 2006; Stevenson, 2006) even though they are outperformed by continuous release
6. Workload Control and Order Release: A Lean Solution for Make-To-Order Companies
methods (e.g., Hendry & Wong, 1994; Sabuncuoglu & Karapinar, 1999). This may be because
periodic decision making is thought to be a better �t with the behaviour of planners in practice
who typically make release decisions once a shift, day or week; and, because the implementation
of periodic methods does not rely on the continuous �ow of information on order progress back
from the shop �oor. However, with shorter customer delivery lead time demands and advances
in technology which facilitate faster information �ow, this assumption needs revisiting. We argue
that continuous order release methods are a viable alternative that must not be ignored.
In light of the above, the objectives of this paper are threefold. Firstly, a literature review
is conducted to assess the current state-of-the-art and re�ne LUMS OR in light of advances in
the �eld since 1991. Secondly, the re�ned LUMS OR method and the leading purely periodic
and continuous release methods from the literature are tested through simulation in order to
determine the best-performing, and most robust, release method. Thirdly, the paper revisits the
original criticism of WLC in order to determine whether the widely held belief that WLC order
release limits the e�ectiveness of the dispatching rule and can only control WIP and reduce shop
�oor throughput time at the expense of deterioration in tardiness results is really true.
The remainder of the paper is organized as follows. Section 6.2 presents a review of the liter-
ature on WLC release mechanisms. Section 6.3 then describes the characteristics of the simulation
model before the results of the study are presented and analyzed in Section 6.4. Implications for
future research and practice are outlined in Section 6.5 before �nal conclusions are provided in
Section 6.6.
6.2 Literature Review
This study focuses on the order release stage of the WLC concept; it assesses the performance of
LUMS OR and compares it against the best-performing release methods from the literature. Sec-
tion 6.2.1 reviews the literature on WLC order release to determine the best-performing periodic
and continuous release methods before Section 6.2.2 identi�es how LUMS OR should be re�ned
in order to re�ect advances in WLC theory over the last 20 years (i.e., since Hendry & Kingsman,
1991a). An assessment of the literature then follows in Section 6.2.3.
6.2.1 WLC Order Release Mechanisms
The main objective of WLC release methods is to control the workload on the shop �oor. For the
purposes of this study, alternative methods are categorized according to when the release decision
takes place: periodically (i.e., at regular intervals) or continuously (i.e., at any moment in time,
usually triggered by an event on the shop �oor; e.g., when the load falls below a certain pre-
determined level). Several other approaches to classifying release methods relevant to other types
of studies have been proposed; for alternatives, the reader is referred to Philipoom et al. (1993),
Wisner (1995), Bergamaschi et al. (1997), Sabuncuoglu & Karapinar (1999) and Fredendall et al.
(2010).
99
6.2.1.1 Periodic WLC Order Release Mechanisms
Most recent studies on WLC have concentrated on periodic order release methods (e.g., Oosterman
et al., 2000; Sabuncuoglu & Karapinar, 2000; Land, 2006). For most periodic methods, the release
procedure is similar (Land & Gaalman, 1998). Accepted orders are retained in a pre-shop pool and
considered for release at periodic intervals according to a simple rule, e.g., shortest slack, Planned
Release Date (PRD), or First-Come-First-Served (FCFS). The workload of a job contributes to
the load of the work centres in its routing which are compared against workload norms or limits.
If one or more norm is violated, the job is retained in the pool until the next release date; if norms
are not violated, the job is released onto the shop �oor and its load assigned to the load of the
work centres in its routing.
Periodic release methods di�er from each other in the way a job contributes to the current
load of work centres over time; in other words, the treatment of the direct and indirect load.
Two key approaches are typically applied: the probabilistic approach, which estimates the input
to the direct load of each work centre over time and converts the indirect load contributed at
release using a depreciation factor based on historical (probabilistic) data (see, e.g., Bechte, 1988
and 1994); and, the classical aggregate load approach (also known as the atemporal approach)
which does not consider the position of a work centre in the routing of a job and thus does not
distinguish between direct and indirect load at all. Instead, the load of the job and the load of the
work centre are simply aggregated (see, e.g., Bertrand & Wortmann, 1981; Hendry, 1989). The
periodic element of LUMS OR is based on the classical aggregate load approach.
Building on their review of WLC concepts (Land & Gaalman, 1996a), Land & Gaalman
(1996b) proposed an extension to the classical aggregate load approach - the corrected aggregate
load approach - which divides the contributed load by the position of a work centre in the routing
of a job. Oosterman et al. (2000) compared its performance against several other approaches
under di�erent �ow characteristics and concluded that the probabilistic and corrected aggregate
load approaches perform the best. Like the probabilistic approach, the corrected aggregate load
approach distinguishes between direct and indirect load but it does so in a much simpler way.
Therefore, we consider it to be the solution most likely to be implemented in practice and include
it in our study to represent periodic release methods.
6.2.1.2 Continuous WLC Order Release Mechanisms
In contrast to periodic methods, most continuous order release methods do not apply a workload
norm (or limit); instead, a workload trigger is used. A critical load is determined which, if
violated, triggers the release procedure thereby pulling orders from the pool until the critical load
is no longer violated. In contrast to the maximum workload norm applied in periodic release
methods, a workload trigger should not be considered a maximum workload constraint as the
next job is selected regardless of its load contribution.

6. Workload Control and Order Release: A Lean Solution for Make-To-Order Companies
Continuous order release methods can best be classi�ed by the load used to trigger the
release (bottleneck, work centre or shop load), as explained below:
∙ Bottleneck : The bottleneck workload trigger activates the release procedure if the direct load
of the bottleneck falls below a pre-determined load limit (indirect load is not controlled).
Only jobs which have to pass through the bottleneck are controlled by the order release
method. As soon as the bottleneck load falls below the limit, a job is released according to a
selection rule such as Earliest Due Date (EDD) or Planned Release Date (PRD). Examples
are the Starvation Avoidance (SA) rule by Glassey & Resende (1988) and the Bottleneck
Load Oriented Release (BLOR) method applied by Enns & Prongue-Costa (2002). These
approaches are based on the principles of the Theory of Constraints (TOC), as outlined by
Goldratt & Cox (1984), and thus are similar to Drum-Bu�er-Rope (DBR); however, DBR is
not considered to be a WLC order release rule in the literature (see, e.g., Zäpfel & Missbauer,
1993; Stevenson et al. 2005).
∙ Work centre: The work centre workload trigger activates the release procedure if the direct
load of any work centre falls below a predetermined load limit (again, the indirect load is not
controlled). Jobs in the pool for which the work centre in danger of starving is the �rst work
centre to be visited are considered for release according to a selection rule such as EDD
or PRD. An example is the Work Centre workload trigger Earliest Due Date (WCEDD)
selection rule presented by Melnyk & Ragatz (1989).
∙ Shop load : The shop load workload trigger activates the release procedure if the load of the
whole shop �oor falls below a predetermined load limit (both the direct and indirect load is
controlled). Jobs are released to the shop �oor according to a selection rule such as EDD,
PRD or the Work-In-Next-Queue (WINQ) rule which selects a job that has the work centre
with the smallest queue as the �rst work centre in its routing. Examples are the Aggregate
workload trigger Work-in-Next-Queue (AGGWNQ) selection rule presented by Melnyk &
Ragatz (1989) and the WIPLoad control rule applied by Qi et al. (2009). Constant Work-
In-Process (ConWIP), as outlined by Spearman et al. (1989), can also be considered an
aggregate workload trigger; however, it is not categorized as a WLC order release rule in
the literature (see, e.g., Land & Gaalman, 1996a; Stevenson et al., 2005). ConWIP does not
control the workload directly; instead, it focuses on the number of jobs in the system.
Research into continuous WLC release methods is scarce; the most notable contributions
are by Melnyk & Ragatz (1989), Hendry & Wong (1994) and Sabuncuoglu & Karapinar (1999).
Melnyk & Ragatz (1989) compared the AGGWNQ rule against the WCEDD rule; the authors
concluded that WCEDD performs better than AGGWNQ - a �nding later con�rmed by Hendry
& Wong (1994) and Sabuncuoglu & Karapinar (1999). While valuable, only simple shop �oor
models were applied in this work. To improve the applicability of continuous release methods in
practice, performance analysis under a wide range of complex shop �oor characteristics - as recently
undertaken for periodic release methods by Thürer et al. (2011a) - is required. Hendry & Wong
(1994) and Sabuncuoglu & Karapinar (1999) also compared continuous methods against periodic
101
release methods. In both papers it was concluded that continuous rules outperform periodic rules
across a wide range of performance measures, including throughput time and percentage tardy
(i.e., the percentage of tardy jobs). This underlines the need to include continuous release methods
in our study. The WCEDD rule has obtained the best job shop results of all continuous order
release methods, and will therefore be included to represent this type of release method. We will
also consider ConWIP in our analysis; ConWIP represents a release method commonly applied in
practice.
In addition to the above, SLAR (Super�uous Load Avoidance Release) - developed and tested
by Land & Gaalman (1998) - has obtained outstanding results compared to other continuous order
release methods, including WCEDD, and will therefore also be included. It was not grouped with
the other workload triggers above given that it uses both a time and a load-oriented trigger. SLAR
distinguishes between urgent jobs (i.e., jobs for which the planned operation start time has passed)
and non-urgent jobs. The planned operation start time is given by the DD minus the sum of the
remaining processing times and the remaining number of operations multiplied by a time-related
slack factor k. As a result, the performance of SLAR depends only on k. SLAR releases work
under two conditions: (i) a starving work centre; and (ii) no urgent jobs are queuing in front of a
work centre (but urgent jobs are waiting in the pre-shop pool). In the �rst case, a job for which
the �rst work centre in its routing is the starving work centre is selected using the PRD selection
rule. In the second case, an urgent job for which the triggering work centre is the �rst work centre
in its routing is released. The rule for selecting orders from the pool for release in the latter case
is the Shortest Processing Time (SPT) rule.
6.2.2 Re�ning LUMS OR in Light of Advances in the WLC Literature
As stated in Section 6.2.1.1, the corrected aggregate load approach is considered the best periodic
release solution; it outperformed the classical aggregate load approach (included in the original
LUMS OR method) in several recent studies (e.g., Oosterman et al., 2000; Thürer et al., 2011a).
Given this new evidence, LUMS OR, as introduced by Hendry & Kingsman (1991a), is re�ned to
incorporate the corrected aggregate load approach. The resulting release procedure is summarized
as follows:
∙ Periodic release: Jobs are released at periodic time intervals according to the corrected
aggregate load approach (instead of the classical aggregate load approach).
∙ Continuous release: If the direct load of any work centre falls to zero (i.e., if the work centre
is starving), the workload trigger actively pulls a job forward from the pool. The job with
the earliest planned release date, and for which the work centre that triggered the release
is the �rst in its routing, is released and its load is attributed according to the corrected
aggregate load approach (Land & Gaalman, 1996b). The job is not subject to any workload
norm restrictions; this accommodates job size variance and improves the performance of
large jobs which are often di�cult to �t within a norm limit (see Thürer et al., 2010a).
6. Workload Control and Order Release: A Lean Solution for Make-To-Order Companies
Releasing the job with the earliest planned release date without subjecting it to norms
(in accordance with the continuous workload trigger) may reduce balancing possibilities during
periodic releases and prevent another job from being released; however, as the corrected aggregate
load approach is applied, the job only contributes fully to the direct load of the �rst work centre
in its routing. This workload is processed immediately after release while the downstream load is
converted, and thus should not hinder the release of other jobs to these work centres signi�cantly.
Note that in the remainder of this paper, "LUMS OR" refers to the re�ned release method.
6.2.3 Assessment of the Literature
Several studies have questioned the e�ectiveness of WLC order release, arguing that it reduces the
e�ectiveness of the dispatching rule (e.g., Baker, 1984; Ragatz & Mabert, 1988; Kim & Bobrowski,
1995) and leads to premature work centre idleness (e.g., Kanet, 1988; Land & Gaalman, 1998),
which deteriorates tardiness results. The literature review suggests that LUMS OR provides a
unique combination of continuous and periodic release which overcomes the problem of premature
work centre idleness. However, research to date has focussed on a simpli�ed (and purely periodic)
version of the method. Moreover, while there has been much research into periodic order release
methods in the last decade (e.g., Oosterman et al., 2000; Cigolini & Portioli-Staudacher, 2002;
Land, 2006), continuous order release has been neglected. This is considered a signi�cant research
gap. Firstly, because the true performance e�ects of LUMS OR are largely unknown; and, sec-
ondly, because the few studies that have investigated continuous and periodic release methods
have demonstrated the superior performance of continuous release (e.g., Hendry & Wong, 1994;
Sabuncuoglu & Karapinar, 1999). Therefore, and to meet the criticisms of WLC, this research
considers the following two research questions (RQ1-2):
∙ RQ1: How does the performance of LUMS OR compare with that of purely continuous and
purely periodic release methods?
∙ RQ2: Does WLC really deteriorate tardiness results, restricting the e�ectiveness of dispatch-
ing and introducing premature work centre idleness?
To answer the �rst research question, LUMS OR is compared with arguably the best-
performing periodic and continuous WLC release methods presented in the literature (the cor-
rected aggregate load approach; and, the WCEDD and SLAR methods, respectively) and with
ConWIP under di�erent �ow directions. This allows the robustness of the methods to be com-
pared and extends recent studies which focused only on the in�uence of �ow direction on the
performance of periodic release methods. ConWIP is included as it has well-established theory
(e.g., Spearman et al., 1989) and is one of the most commonly applied release methods in practice.
In light of the results, we then seek to answer the second research question and assess the true
impact of WLC on shop �oor performance.
103
6.3 Simulation Model
6.3.1 Overview of Shop Characteristics
A simulation model has been developed using SIMUL8 c⃝ software. The model represents a
shop with 6 work centres, where each is a single and unique capacity resource; capacity is equal
for all work centres and remains constant. The model represents di�erent �ow directions (or
characteristics) along the spectrum between a Pure Job Shop, according to the characteristics
outlined by Melnyk & Ragatz (1989), and a General Flow Shop (Oosterman et al., 2000). In order
to obtain the di�erent �ow characteristics, a routing vector (which determines the sequence in
which work centres are visited) is sorted to 0%, 25%, 50%, 75% and 100%, as in Thürer et al.
(2011a); the general �ow shop is represented by a 100% sorting (or fully directed routing) and
the pure job shop by a 0% sorting. As in most recent studies (e.g., Oosterman et al., 2000; Land,
2006), it is assumed that a job does not visit the same work centre twice and all work centres
have an equal probability of being visited. Each operation requires one speci�c work centre and
the routing and operation processing time characteristics are known upon job entry.
6.3.2 Order Release Mechanisms
As in previous studies (e.g., Sabuncuoglu & Karapinar, 1999; Land, 2006), it is assumed that
all orders are accepted, that materials are available, and that the process plan (which includes
all necessary information regarding routing sequence, processing times, etc) is known. Orders
�ow directly into the pre-shop pool without being reviewed. Five di�erent release methods are
considered: the corrected aggregate load approach (periodic), WCEDD (continuous), SLAR (con-
tinuous), LUMS OR (periodic and continuous) and ConWIP (continuous).
The WCEDD release method has been transformed into the Work Centre Planned Release
Date (WCPRD) method to incorporate the Planned Release Date (PRD) rule for selecting orders
for release from the pool - in other words, the job with the earliest PRD (equal to the planned
start time of the �rst operation) is selected. This allows the same rule for selecting orders for
release from the pool (the PRD rule) to be used for all release methods and makes results more
comparable. PRD is determined similarly to the Planned operation Start Time (PST) dispatching
rule, as discussed in Subsection 6.3.3 below.
6.3.3 Shop Floor Dispatching Rules
The dispatching rules applied are the First-Come-First-Served (FCFS) and PST rules; the latter
is given in equation (4) below. PST has been chosen because (like the PRD selection rule) it is
an integral part of the SLAR method and has interacted well with other WLC release methods in
previous studies (e.g., Land & Gaalman, 1998). The job with the earliest PST, given by the DD
minus the remaining total processing time and the number of remaining operations multiplied by
a slack parameter k, is selected.
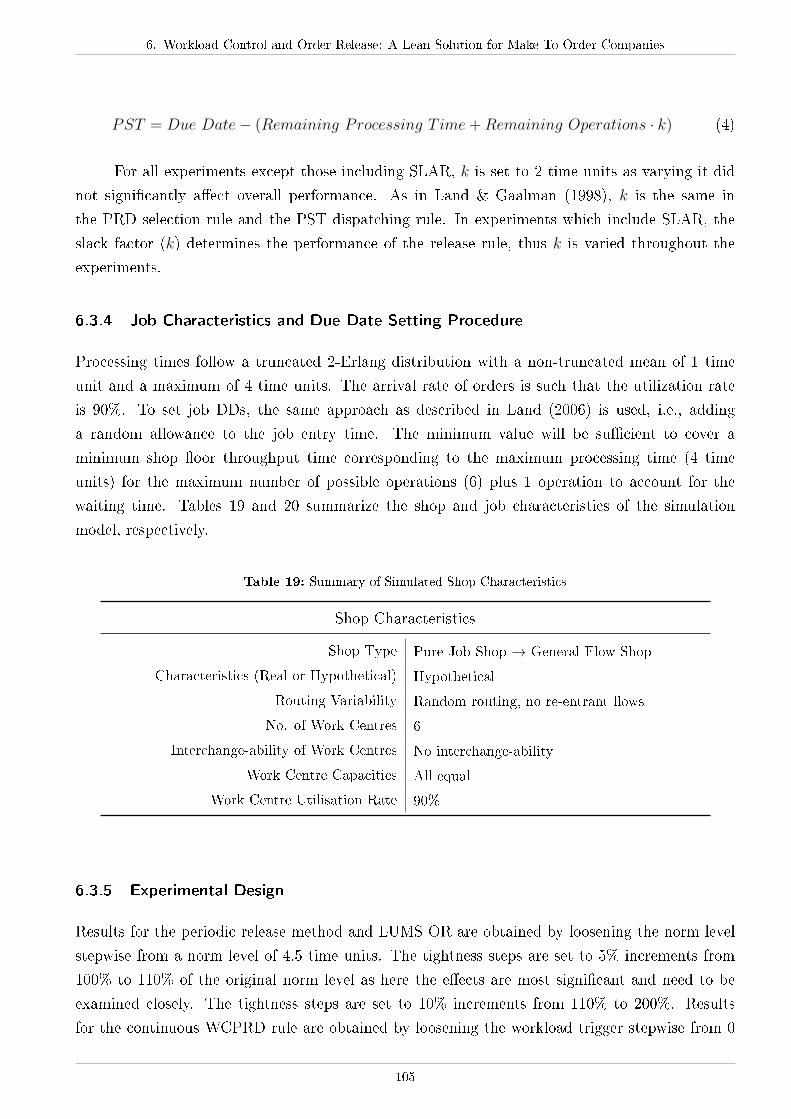
6. Workload Control and Order Release: A Lean Solution for Make-To-Order Companies
PST = Due Date− (Remaining Processing T ime+Remaining Operations ⋅ k) (4)
For all experiments except those including SLAR, k is set to 2 time units as varying it did
not signi�cantly a�ect overall performance. As in Land & Gaalman (1998), k is the same in
the PRD selection rule and the PST dispatching rule. In experiments which include SLAR, the
slack factor (k) determines the performance of the release rule, thus k is varied throughout the
experiments.
6.3.4 Job Characteristics and Due Date Setting Procedure
Processing times follow a truncated 2-Erlang distribution with a non-truncated mean of 1 time
unit and a maximum of 4 time units. The arrival rate of orders is such that the utilization rate
is 90%. To set job DDs, the same approach as described in Land (2006) is used, i.e., adding
a random allowance to the job entry time. The minimum value will be su�cient to cover a
minimum shop �oor throughput time corresponding to the maximum processing time (4 time
units) for the maximum number of possible operations (6) plus 1 operation to account for the
waiting time. Tables 19 and 20 summarize the shop and job characteristics of the simulation
model, respectively.
Table 19: Summary of Simulated Shop Characteristics
Shop Characteristics
Shop Type Pure Job Shop → General Flow Shop
Characteristics (Real or Hypothetical) Hypothetical
Routing Variability Random routing, no re-entrant �ows
No. of Work Centres 6
Interchange-ability of Work Centres No interchange-ability
Work Centre Capacities All equal
Work Centre Utilisation Rate 90%
6.3.5 Experimental Design
Results for the periodic release method and LUMS OR are obtained by loosening the norm level
stepwise from a norm level of 4.5 time units. The tightness steps are set to 5% increments from
100% to 110% of the original norm level as here the e�ects are most signi�cant and need to be
examined closely. The tightness steps are set to 10% increments from 110% to 200%. Results
for the continuous WCPRD rule are obtained by loosening the workload trigger stepwise from 0
105
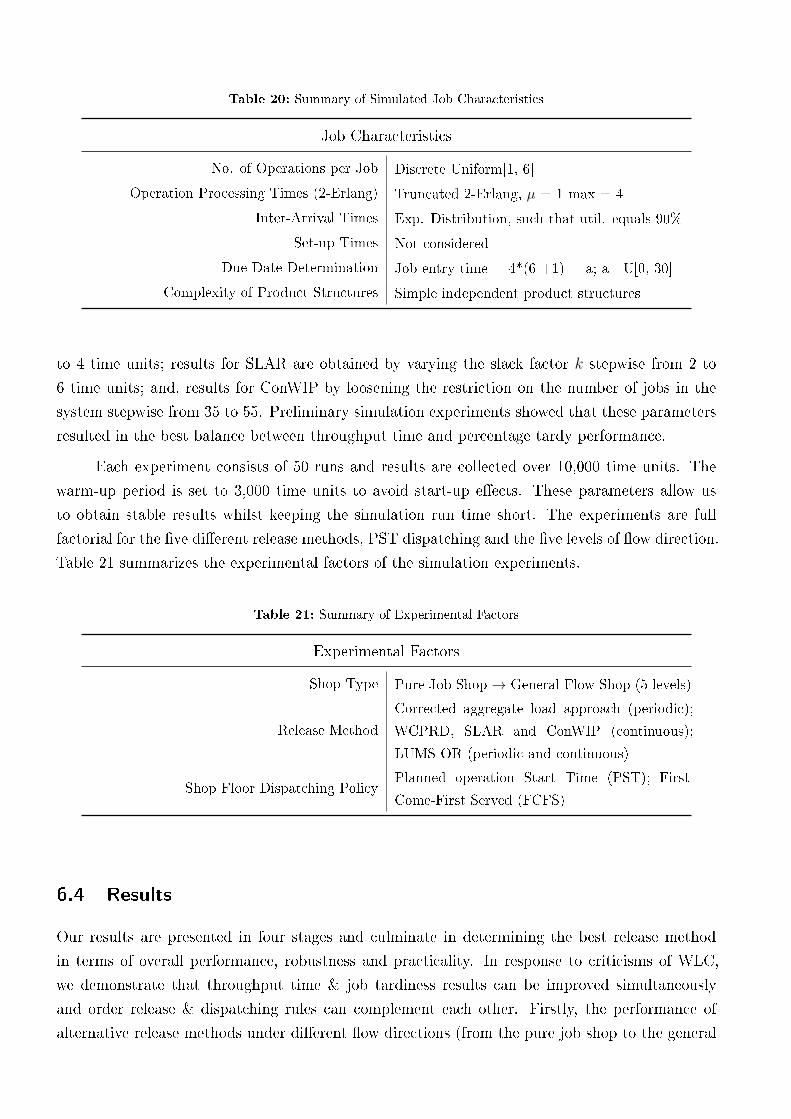
Table 20: Summary of Simulated Job Characteristics
Job Characteristics
No. of Operations per Job Discrete Uniform[1, 6]
Operation Processing Times (2-Erlang) Truncated 2-Erlang, � = 1 max = 4
Inter-Arrival Times Exp. Distribution, such that util. equals 90%
Set-up Times Not considered
Due Date Determination Job entry time + 4*(6 +1) + a; a U[0, 30]
Complexity of Product Structures Simple independent product structures
to 4 time units; results for SLAR are obtained by varying the slack factor k stepwise from 2 to
6 time units; and, results for ConWIP by loosening the restriction on the number of jobs in the
system stepwise from 35 to 55. Preliminary simulation experiments showed that these parameters
resulted in the best balance between throughput time and percentage tardy performance.
Each experiment consists of 50 runs and results are collected over 10,000 time units. The
warm-up period is set to 3,000 time units to avoid start-up e�ects. These parameters allow us
to obtain stable results whilst keeping the simulation run time short. The experiments are full
factorial for the �ve di�erent release methods, PST dispatching and the �ve levels of �ow direction.
Table 21 summarizes the experimental factors of the simulation experiments.
Table 21: Summary of Experimental Factors
Experimental Factors
Shop Type Pure Job Shop → General Flow Shop (5 levels)
Release Method
Corrected aggregate load approach (periodic);
WCPRD, SLAR and ConWIP (continuous);
LUMS OR (periodic and continuous)
Shop Floor Dispatching PolicyPlanned operation Start Time (PST); First-
Come-First Served (FCFS)
6.4 Results
Our results are presented in four stages and culminate in determining the best release method
in terms of overall performance, robustness and practicality. In response to criticisms of WLC,
we demonstrate that throughput time & job tardiness results can be improved simultaneously
and order release & dispatching rules can complement each other. Firstly, the performance of
alternative release methods under di�erent �ow directions (from the pure job shop to the general
6. Workload Control and Order Release: A Lean Solution for Make-To-Order Companies
�ow shop) is assessed and compared in Section 6.4.1. Secondly, the sensitivity of release method
performance to changes in �ow direction is assessed in Section 6.4.2. The objectives here are: (i)
to diagnose which elements of the release methods lead to changes in performance; and, (ii) to
evaluate the robustness of the methods. Thirdly, the di�ering performance of LUMS OR and the
corrected aggregate load approach (pure periodic release) is investigated in Section 6.4.3. Finally,
the best-performing release method is determined in Section 6.4.4.
6.4.1 Summary of Order Release Method Performance under Di�erent Flow Directions
Performance results for the �ve order release methods are summarized in Table 22. The results
presented are the: (shop �oor) throughput time (Tt), the percentage of tardy jobs (Ptardy) and
the mean tardiness (Tdm). These measures were chosen given that WLC has been criticized for
only controlling WIP and achieving throughput time reduction at the expense of deterioration in
tardiness results & DD performance. The workload norm (N) applied for the corrected aggregate
load approach (periodic release) and LUMS OR; the workload trigger (WLT ) for WCPRD; the
slack factor (k) for SLAR; and, the number of jobs in the system (NJ) for ConWIP, are all shown
in brackets in Table 22. Results are shown for the parameters of the order release rules which
achieved the best balance between throughput time and tardiness results.
In a pure job shop (0% directed routing), the best performance in terms of throughput
time (and WIP) reduction is achieved by WCPRD but this method is clearly outperformed by
SLAR and LUMS OR in terms of the percentage of tardy jobs and mean tardiness. Tardiness
results for WCPRD and SLAR improve marginally (compared to those in Table 22) if a 'looser'
workload trigger is used or if k is further increased, respectively (e.g., WLT = 6; k = 8); however,
throughput time performance deteriorates. If the workload norm for LUMS OR is too tight (e.g., N
= 2), the results approach those obtained for WCPRD with a workload trigger of zero. Compared
to immediate release and FCFS dispatching, LUMS OR and SLAR reduce the percentage of tardy
jobs by up to 75% - allowing shorter delivery lead times to be promised at the customer enquiry
stage - and achieve an average throughput time reduction of 50%, as WIP is cut in half. ConWIP,
and the corrected aggregate load approach (periodic release), performed the worst in terms of all
performance metrics.
If the �ow becomes more directed (i.e., moving from 0% to the general �ow shop - 100%
directed), the corrected aggregate load approach (periodic release) maintains similar results to
those achieved in the pure job shop while the performance of ConWIP deteriorates, but only
slightly; thus, although the two methods are not the best performers, they are reasonably robust
to changes in �ow direction. In contrast, release methods incorporating a continuous workload
trigger (WCPRD, SLAR and LUMS OR) are more a�ected by changes in �ow direction. WCPRD
and SLAR - the pure continuous methods - appear heavily in�uenced by changing �ow direction
while results for LUMS OR (continuous and periodic combined) are more stable; this is further
explored in Section 6.4.2. Nonetheless, all three - WCPRD, SLAR, and LUMS OR - outperform
ConWIP under all tested �ow characteristics. The simplicity of ConWIP relies heavily on the
107

Table
22:ResultsfortheOrder
Release
Methodsunder
Di�erentFlowDirections
Release
Rule&Dispatching
FlowDirection
0%
directed-PJS
25%
directed
50%
directed
75%
directed
100%
directed-GFS
Tt
Pta
rdy
Tdm
Tt
Pta
rdy
Tdm
Tt
Pta
rdy
Tdm
Tt
Pta
rdy
Tdm
Tt
Pta
rdy
Tdm
Immediate
Release
FCFS
28.6
26.6%
4.6
28.6
26.6%
4.6
28.7
26.6%
4.7
28.7
26,6%
4.6
28.7
26.7%
4.7
Periodic(N
=7.65)
PST
17.9
29.8%
3.8
18.0
30.0%
3.9
18.2
29.9%
3.9
18.4
28.7%
3.7
18.6
28.6%
3.7
Periodic(N
=8.1)
PST
18.6
27.8%
3.3
18.7
28.5%
3.6
18.8
28.1%
3.6
19.0
27.3%
3.3
19.4
27.5%
3.5
Periodic(N
=8.55)
PST
19.2
26.7%
3.1
19.3
26.7%
3.4
19.4
26.4%
3.3
19.7
25.8%
3.0
20.0
26.0%
3.1
Periodic(N
=9)
PST
19.7
25.3%
2.9
19.8
25.7%
3.1
20.0
25.4%
3.0
20.3
24.3%
2.8
20.7
25.1%
3.0
Periodic(N
=In�nite)
PST
26.5
15.0%
1.3
26.8
15.7%
1.4
27.1
16.9%
1.5
27.3
17.7%
1.7
28.4
20.2%
2.1
LUMSOR(N
=4.95)
PST
11.9
10.3%
1.9
12.1
10.2%
2.1
12.6
10.0%
2.2
13.1
9.2%
2.2
13.8
9.3%
2.5
LUMSOR(N
=5.4)
PST
12.8
9.5%
1.6
13.0
9.4%
1.8
13.4
9.6%
1.9
13.9
8.9%
1.9
14.5
9.1%
2.3
LUMSOR(N
=5.85)
PST
13.7
9.0%
1.4
13.8
8.9%
1.6
14.2
9.3%
1.7
14.7
8.9%
1.7
15.3
9.1%
2.0
LUMSOR(N
=6.3)
PST
14.5
8.7%
1.3
14.6
8.7%
1.4
14.9
9.2%
1.5
15.4
8.7%
1.5
16.0
9.3%
1.8
LUMSOR(N
=6.75)
PST
15.2
8.6%
1.1
15.3
8.5%
1.2
15.7
9.1%
1.3
16.1
8.9%
1.4
16.7
9.6%
1.7
WCPRD(W
LT=0)
PST
8.5
19.0%
5.0
8.9
17.7%
4.9
9.7
15.3%
4.6
10.5
13.3%
4.3
11.2
12.6%
4.6
WCPRD(W
LT=1)
PST
9.5
18.0%
4.7
9.9
16.9%
4.6
10.6
14.8%
4.3
11.4
12.9%
4.0
12.0
12.5%
4.4
WCPRD(W
LT=2)
PST
11.8
16.2%
4.1
12.0
15.1%
4.0
12.6
13.6%
3.8
13.1
12.1%
3.5
13.4
12.1%
3.9
WCPRD(W
LT=3)
PST
13.6
14.1%
3.4
13.8
13.3%
3.4
14.2
12.6%
3.3
14.7
11.5%
3.1
14.5
11.8%
3.5
WCPRD(W
LT=4)
PST
15.1
12.4%
2.9
15.3
12.0%
2.9
15.7
11.7%
2.9
16.0
11.1%
2.7
15.6
11.8%
3.2
SLAR(k=2)
PST
11.6
9.9%
0.9
12.1
10.1%
0.9
12.9
10.5%
1.0
14.0
11.8%
1.1
15.0
13.0%
1.3
SLAR(k=3)
PST
11.9
7.0%
0.9
12.3
7.3%
0.9
13.0
7.8%
1.0
14.0
9.5%
1.1
15.0
11.4%
1.3
SLAR(k=4)
PST
12.3
5.6%
0.9
12.6
5.8%
0.9
13.2
6.5%
1.0
14.0
8.1%
1.1
15.0
10.3%
1.3
SLAR(k=5)
PST
12.8
4.9%
1.0
13.0
5.1%
1.0
13.5
5.7%
1.0
14.1
7.1%
1.1
15.0
9.6%
1.4
SLAR(k=6)
PST
13.3
4.5%
1.0
13.5
4.7%
1.1
13.8
5.2%
1.1
14.2
6.4%
1.2
14.8
9.1%
1.5
ConW
IP(NJ=35)
PST
21.6
50.3%
13.4
21.6
50.9%
14.6
21.6
52.5%
15.4
21.6
51.9%
15.0
21.6
52.0%
16.2
ConW
IP(NJ=40)
PST
23.0
29.5%
4.6
23.0
31.2%
5.3
23.0
32.2%
5.2
23.0
32.6%
5.6
23.1
34.9%
6.5
ConW
IP(NJ=45)
PST
23.8
20.0%
2.5
23.9
21.9%
2.9
24.0
22.8%
2.9
24.0
22.3%
2.8
24.2
24.9%
3.6
ConW
IP(NJ=50)
PST
24.5
16.2%
1.7
24.7
17.8%
2.0
24.7
18.2%
2.0
24.7
17.5%
1.9
25.0
20.5%
2.6
ConW
IP(NJ=55)
PST
25.0
14.3%
1.3
25.2
15.0%
1.5
25.3
15.7%
1.5
25.3
15.2%
1.5
25.7
18.3%
2.1
6. Workload Control and Order Release: A Lean Solution for Make-To-Order Companies
ability to balance the load in the pool prior to release, e.g., by batching jobs together, without
considering detailed information on the current shop load; hence, ConWIP is only suitable under
the tested shop and job characteristics if an additional balancing mechanism is also in place. In
contrast, most WLC methods balance the load by matching the load in the pool with the load on
the shop �oor as part of the order release decision making process.
In conclusion, the results demonstrate that not only can WIP and throughput times be
reduced but tardiness results can also be improved through the use of WLC; this is true for all
tested �ow directions. In addition, the performance improvements reported highlight that an
e�ective order release rule (e.g., LUMS OR) can complement an e�ective dispatching rule.
6.4.2 Sensitivity Analysis: In�uence of Flow Direction on the Performance of Release
Methods
The results above indicate that pure continuous release methods are not robust - they are heavily
in�uenced by changing �ow direction. While WCPRD improves partially as �ow becomes more
directed, SLAR worsens. To better understand this phenomenon, the underlying mechanisms
which contribute to the sensitivity of performance as �ow direction changes are identi�ed. Sub-
section 6.4.2.1 focuses on WCPRD as it isolates the continuous workload trigger which also forms
part of SLAR and LUMS OR. Subsection 6.4.2.2 then seeks to assess the overall di�erences be-
tween WCPRD, SLAR and LUMS OR.
6.4.2.1 Analyzing the Workload Trigger - WCPRD
The performance sensitivity of WCPRD is explained by the impact of �ow direction on small and
large job types. Small and large jobs are de�ned as follows:
∙ Small jobs: jobs for which the routing length is less than 4 operations (i.e., 1, 2 or 3).
∙ Large jobs: jobs for which the routing length is more than 3 operations (i.e., 4, 5 or 6).
Figure 22 presents the throughput time and percentage tardy results obtained for WCPRD
with an undirected (0%) routing (Pure Job Shop - PJS) and fully (100%) directed routing (General
Flow Shop - GFS). A workload trigger of 4 time units is given by the right-hand starting point of
each curve; the workload trigger becomes lower moving from right to left in the �gure.
At low values of the workload trigger (i.e., towards a trigger value of zero), throughput
time performance for all job sizes deteriorates as �ow direction is changed from the pure job shop
(undirected routing) to the general �ow shop (fully directed routing). Meanwhile, the overall
percentage of tardy jobs reduces as �ow becomes more directed: this is comprised of a signi�cant
percentage tardy reduction for large jobs and a marginal percentage tardy increase for small jobs.
The percentage tardy reduction for large jobs is made possible by a mean tardiness increase for
small jobs; hence, although the percentage tardy for small jobs does not increase signi�cantly, the
release of small jobs is delayed contributing to an increase in mean tardiness for this category of
109
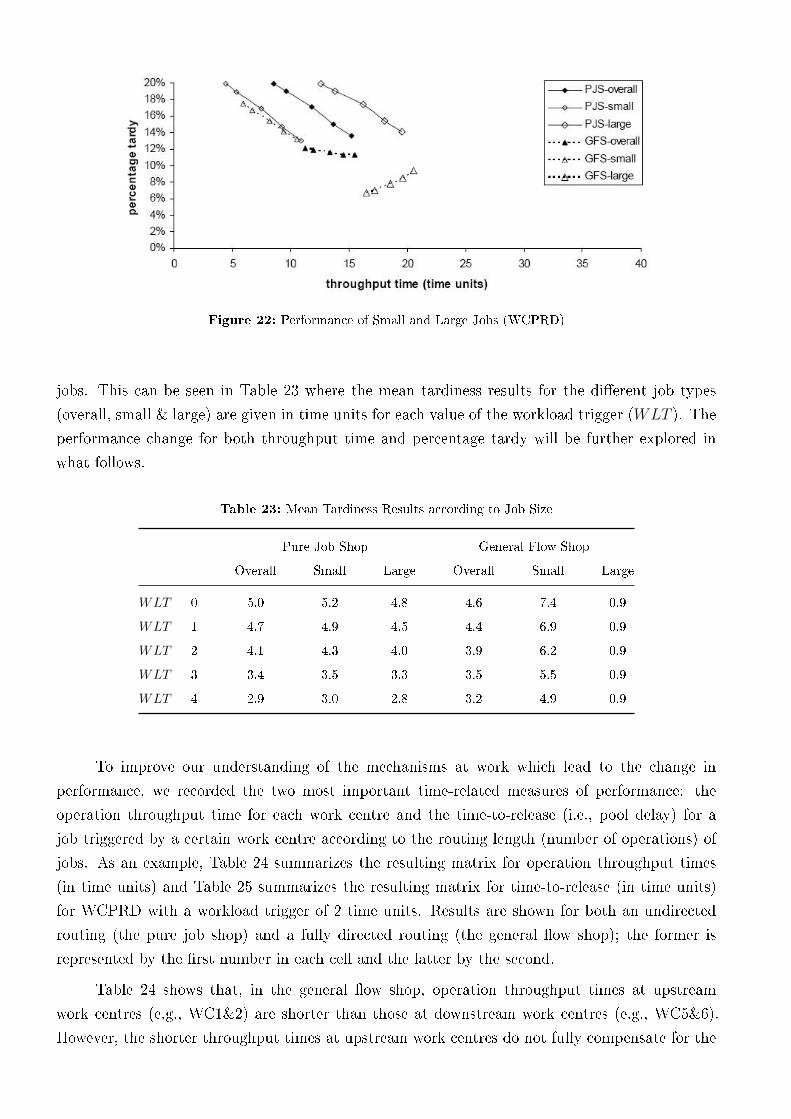
Figure 22: Performance of Small and Large Jobs (WCPRD)
jobs. This can be seen in Table 23 where the mean tardiness results for the di�erent job types
(overall, small & large) are given in time units for each value of the workload trigger (WLT ). The
performance change for both throughput time and percentage tardy will be further explored in
what follows.
Table 23: Mean Tardiness Results according to Job Size
Pure Job Shop General Flow Shop
Overall Small Large Overall Small Large
WLT = 0 5.0 5.2 4.8 4.6 7.4 0.9
WLT = 1 4.7 4.9 4.5 4.4 6.9 0.9
WLT = 2 4.1 4.3 4.0 3.9 6.2 0.9
WLT = 3 3.4 3.5 3.3 3.5 5.5 0.9
WLT = 4 2.9 3.0 2.8 3.2 4.9 0.9
To improve our understanding of the mechanisms at work which lead to the change in
performance, we recorded the two most important time-related measures of performance: the
operation throughput time for each work centre and the time-to-release (i.e., pool delay) for a
job triggered by a certain work centre according to the routing length (number of operations) of
jobs. As an example, Table 24 summarizes the resulting matrix for operation throughput times
(in time units) and Table 25 summarizes the resulting matrix for time-to-release (in time units)
for WCPRD with a workload trigger of 2 time units. Results are shown for both an undirected
routing (the pure job shop) and a fully directed routing (the general �ow shop); the former is
represented by the �rst number in each cell and the latter by the second.
Table 24 shows that, in the general �ow shop, operation throughput times at upstream
work centres (e.g., WC1&2) are shorter than those at downstream work centres (e.g., WC5&6).
However, the shorter throughput times at upstream work centres do not fully compensate for the
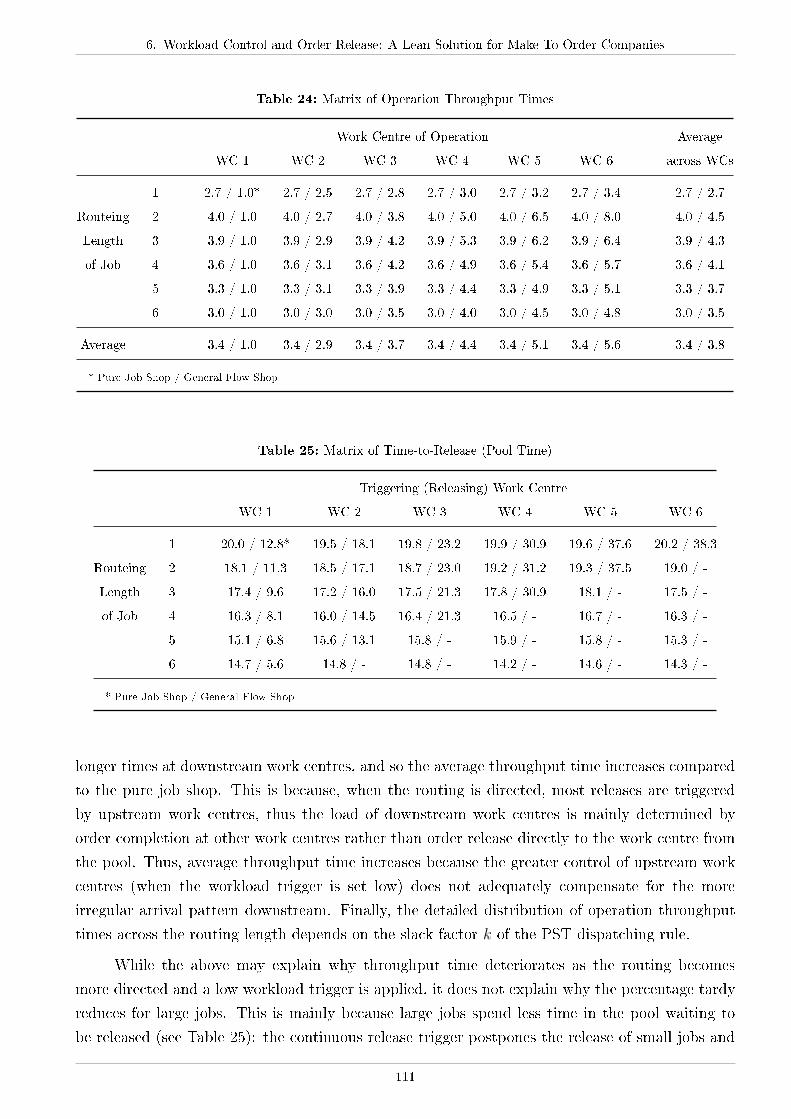
6. Workload Control and Order Release: A Lean Solution for Make-To-Order Companies
Table 24: Matrix of Operation Throughput Times
Work Centre of Operation Average
WC 1 WC 2 WC 3 WC 4 WC 5 WC 6 across WCs
1 2.7 / 1.0* 2.7 / 2.5 2.7 / 2.8 2.7 / 3.0 2.7 / 3.2 2.7 / 3.4 2.7 / 2.7
Routeing 2 4.0 / 1.0 4.0 / 2.7 4.0 / 3.8 4.0 / 5.0 4.0 / 6.5 4.0 / 8.0 4.0 / 4.5
Length 3 3.9 / 1.0 3.9 / 2.9 3.9 / 4.2 3.9 / 5.3 3.9 / 6.2 3.9 / 6.4 3.9 / 4.3
of Job 4 3.6 / 1.0 3.6 / 3.1 3.6 / 4.2 3.6 / 4.9 3.6 / 5.4 3.6 / 5.7 3.6 / 4.1
5 3.3 / 1.0 3.3 / 3.1 3.3 / 3.9 3.3 / 4.4 3.3 / 4.9 3.3 / 5.1 3.3 / 3.7
6 3.0 / 1.0 3.0 / 3.0 3.0 / 3.5 3.0 / 4.0 3.0 / 4.5 3.0 / 4.8 3.0 / 3.5
Average 3.4 / 1.0 3.4 / 2.9 3.4 / 3.7 3.4 / 4.4 3.4 / 5.1 3.4 / 5.6 3.4 / 3.8
* Pure Job Shop / General Flow Shop
Table 25: Matrix of Time-to-Release (Pool Time)
Triggering (Releasing) Work Centre
WC 1 WC 2 WC 3 WC 4 WC 5 WC 6
1 20.0 / 12.8* 19.5 / 18.1 19.8 / 23.2 19.9 / 30.9 19.6 / 37.6 20.2 / 38.3
Routeing 2 18.1 / 11.3 18.5 / 17.1 18.7 / 23.0 19.2 / 31.2 19.3 / 37.5 19.0 / -
Length 3 17.4 / 9.6 17.2 / 16.0 17.5 / 21.3 17.8 / 30.9 18.1 / - 17.5 / -
of Job 4 16.3 / 8.1 16.0 / 14.5 16.4 / 21.3 16.5 / - 16.7 / - 16.3 / -
5 15.1 / 6.8 15.6 / 13.1 15.8 / - 15.9 / - 15.8 / - 15.3 / -
6 14.7 / 5.6 14.8 / - 14.8 / - 14.2 / - 14.6 / - 14.3 / -
* Pure Job Shop / General Flow Shop
longer times at downstream work centres, and so the average throughput time increases compared
to the pure job shop. This is because, when the routing is directed, most releases are triggered
by upstream work centres, thus the load of downstream work centres is mainly determined by
order completion at other work centres rather than order release directly to the work centre from
the pool. Thus, average throughput time increases because the greater control of upstream work
centres (when the workload trigger is set low) does not adequately compensate for the more
irregular arrival pattern downstream. Finally, the detailed distribution of operation throughput
times across the routing length depends on the slack factor k of the PST dispatching rule.
While the above may explain why throughput time deteriorates as the routing becomes
more directed and a low workload trigger is applied, it does not explain why the percentage tardy
reduces for large jobs. This is mainly because large jobs spend less time in the pool waiting to
be released (see Table 25): the continuous release trigger postpones the release of small jobs and
111
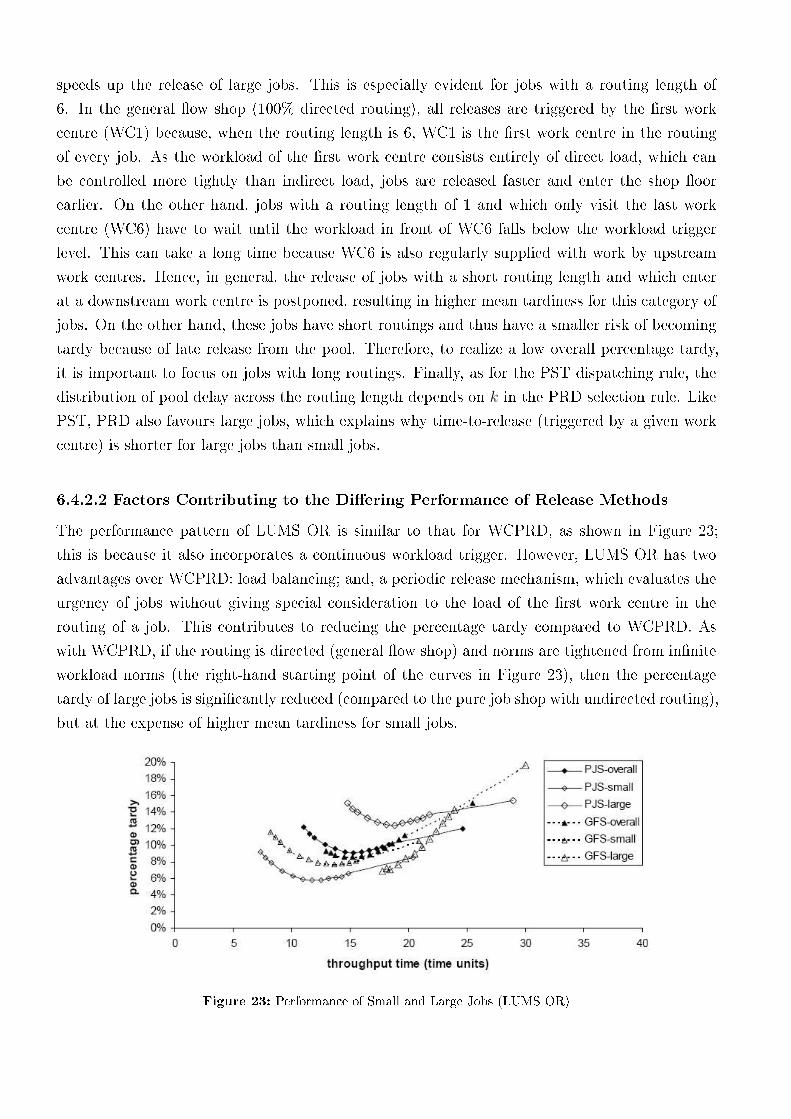
speeds up the release of large jobs. This is especially evident for jobs with a routing length of
6. In the general �ow shop (100% directed routing), all releases are triggered by the �rst work
centre (WC1) because, when the routing length is 6, WC1 is the �rst work centre in the routing
of every job. As the workload of the �rst work centre consists entirely of direct load, which can
be controlled more tightly than indirect load, jobs are released faster and enter the shop �oor
earlier. On the other hand, jobs with a routing length of 1 and which only visit the last work
centre (WC6) have to wait until the workload in front of WC6 falls below the workload trigger
level. This can take a long time because WC6 is also regularly supplied with work by upstream
work centres. Hence, in general, the release of jobs with a short routing length and which enter
at a downstream work centre is postponed, resulting in higher mean tardiness for this category of
jobs. On the other hand, these jobs have short routings and thus have a smaller risk of becoming
tardy because of late release from the pool. Therefore, to realize a low overall percentage tardy,
it is important to focus on jobs with long routings. Finally, as for the PST dispatching rule, the
distribution of pool delay across the routing length depends on k in the PRD selection rule. Like
PST, PRD also favours large jobs, which explains why time-to-release (triggered by a given work
centre) is shorter for large jobs than small jobs.
6.4.2.2 Factors Contributing to the Di�ering Performance of Release Methods
The performance pattern of LUMS OR is similar to that for WCPRD, as shown in Figure 23;
this is because it also incorporates a continuous workload trigger. However, LUMS OR has two
advantages over WCPRD: load balancing; and, a periodic release mechanism, which evaluates the
urgency of jobs without giving special consideration to the load of the �rst work centre in the
routing of a job. This contributes to reducing the percentage tardy compared to WCPRD. As
with WCPRD, if the routing is directed (general �ow shop) and norms are tightened from in�nite
workload norms (the right-hand starting point of the curves in Figure 23), then the percentage
tardy of large jobs is signi�cantly reduced (compared to the pure job shop with undirected routing),
but at the expense of higher mean tardiness for small jobs.
Figure 23: Performance of Small and Large Jobs (LUMS OR)
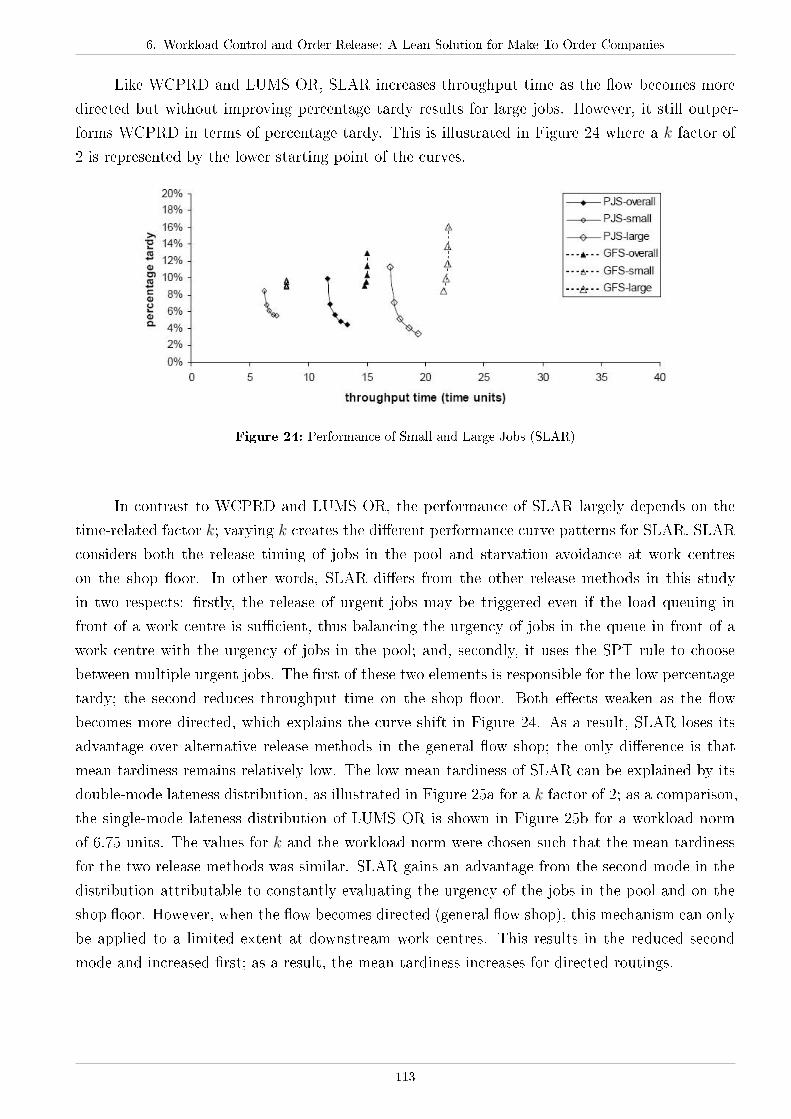
6. Workload Control and Order Release: A Lean Solution for Make-To-Order Companies
Like WCPRD and LUMS OR, SLAR increases throughput time as the �ow becomes more
directed but without improving percentage tardy results for large jobs. However, it still outper-
forms WCPRD in terms of percentage tardy. This is illustrated in Figure 24 where a k factor of
2 is represented by the lower starting point of the curves.
Figure 24: Performance of Small and Large Jobs (SLAR)
In contrast to WCPRD and LUMS OR, the performance of SLAR largely depends on the
time-related factor k; varying k creates the di�erent performance curve patterns for SLAR. SLAR
considers both the release timing of jobs in the pool and starvation avoidance at work centres
on the shop �oor. In other words, SLAR di�ers from the other release methods in this study
in two respects: �rstly, the release of urgent jobs may be triggered even if the load queuing in
front of a work centre is su�cient, thus balancing the urgency of jobs in the queue in front of a
work centre with the urgency of jobs in the pool; and, secondly, it uses the SPT rule to choose
between multiple urgent jobs. The �rst of these two elements is responsible for the low percentage
tardy; the second reduces throughput time on the shop �oor. Both e�ects weaken as the �ow
becomes more directed, which explains the curve shift in Figure 24. As a result, SLAR loses its
advantage over alternative release methods in the general �ow shop; the only di�erence is that
mean tardiness remains relatively low. The low mean tardiness of SLAR can be explained by its
double-mode lateness distribution, as illustrated in Figure 25a for a k factor of 2; as a comparison,
the single-mode lateness distribution of LUMS OR is shown in Figure 25b for a workload norm
of 6.75 units. The values for k and the workload norm were chosen such that the mean tardiness
for the two release methods was similar. SLAR gains an advantage from the second mode in the
distribution attributable to constantly evaluating the urgency of the jobs in the pool and on the
shop �oor. However, when the �ow becomes directed (general �ow shop), this mechanism can only
be applied to a limited extent at downstream work centres. This results in the reduced second
mode and increased �rst; as a result, the mean tardiness increases for directed routings.
113
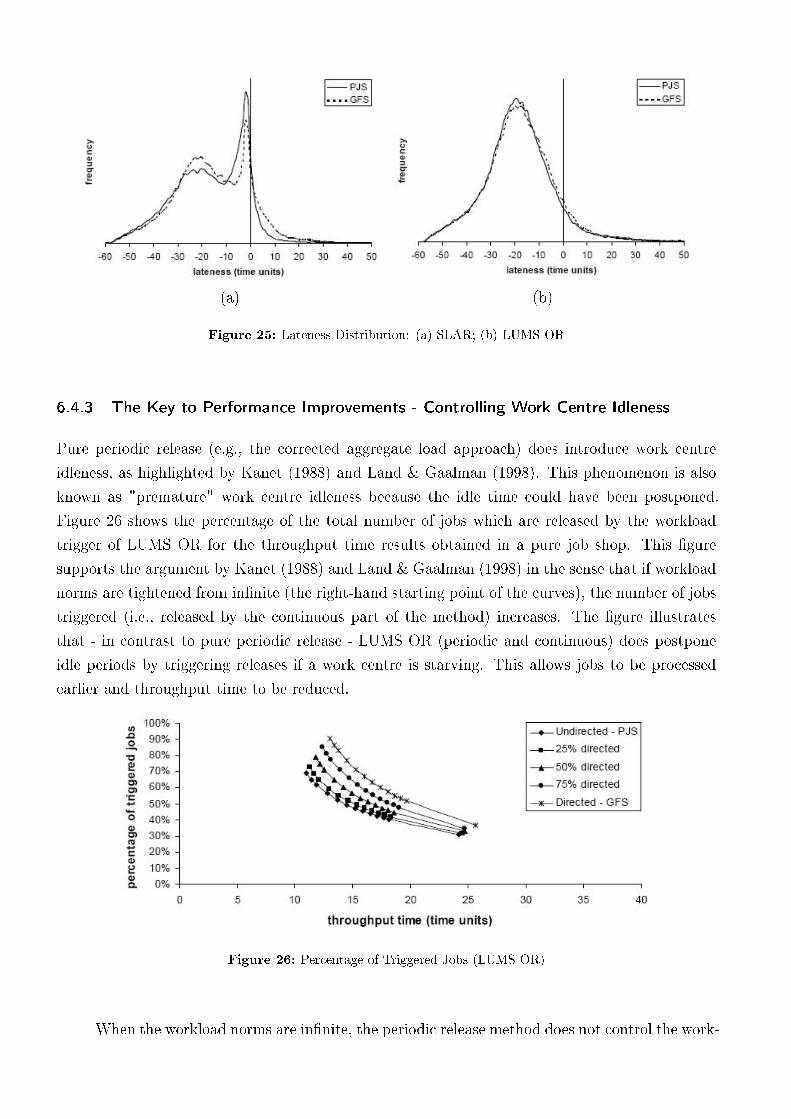
(a) (b)
Figure 25: Lateness Distribution: (a) SLAR; (b) LUMS OR
6.4.3 The Key to Performance Improvements - Controlling Work Centre Idleness
Pure periodic release (e.g., the corrected aggregate load approach) does introduce work centre
idleness, as highlighted by Kanet (1988) and Land & Gaalman (1998). This phenomenon is also
known as "premature" work centre idleness because the idle time could have been postponed.
Figure 26 shows the percentage of the total number of jobs which are released by the workload
trigger of LUMS OR for the throughput time results obtained in a pure job shop. This �gure
supports the argument by Kanet (1988) and Land & Gaalman (1998) in the sense that if workload
norms are tightened from in�nite (the right-hand starting point of the curves), the number of jobs
triggered (i.e., released by the continuous part of the method) increases. The �gure illustrates
that - in contrast to pure periodic release - LUMS OR (periodic and continuous) does postpone
idle periods by triggering releases if a work centre is starving. This allows jobs to be processed
earlier and throughput time to be reduced.
Figure 26: Percentage of Triggered Jobs (LUMS OR)
When the workload norms are in�nite, the periodic release method does not control the work-
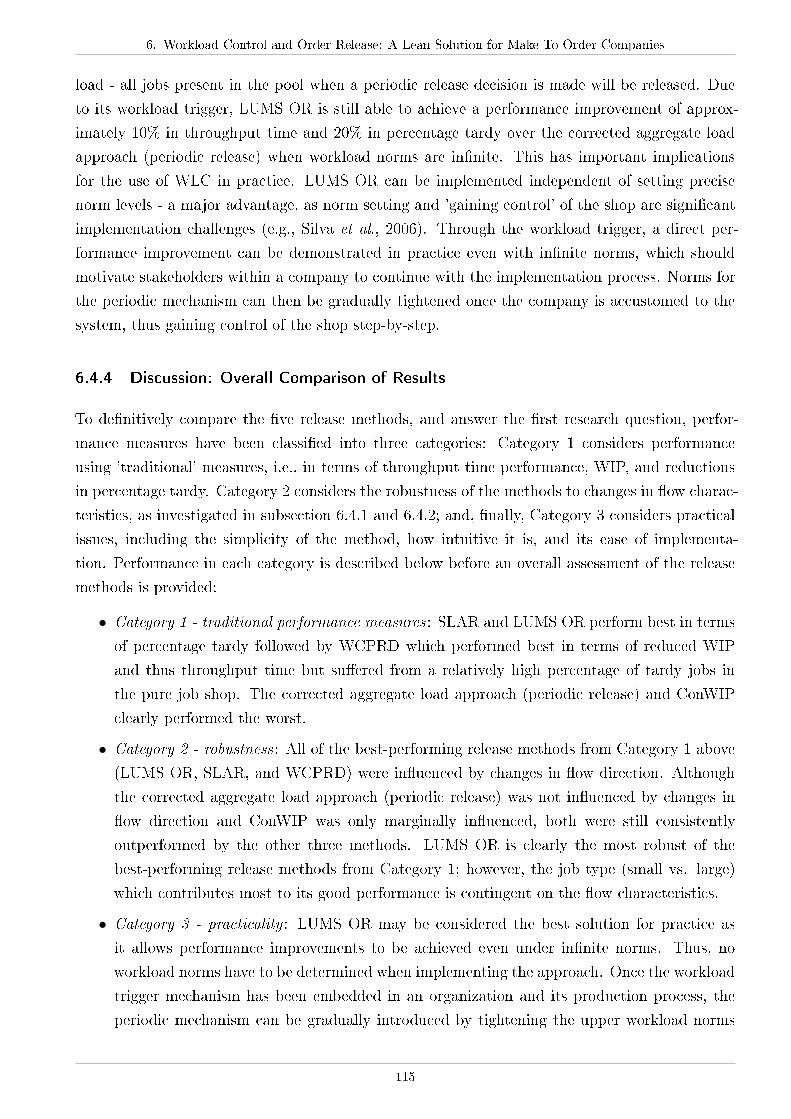
6. Workload Control and Order Release: A Lean Solution for Make-To-Order Companies
load - all jobs present in the pool when a periodic release decision is made will be released. Due
to its workload trigger, LUMS OR is still able to achieve a performance improvement of approx-
imately 10% in throughput time and 20% in percentage tardy over the corrected aggregate load
approach (periodic release) when workload norms are in�nite. This has important implications
for the use of WLC in practice. LUMS OR can be implemented independent of setting precise
norm levels - a major advantage, as norm setting and 'gaining control' of the shop are signi�cant
implementation challenges (e.g., Silva et al., 2006). Through the workload trigger, a direct per-
formance improvement can be demonstrated in practice even with in�nite norms, which should
motivate stakeholders within a company to continue with the implementation process. Norms for
the periodic mechanism can then be gradually tightened once the company is accustomed to the
system, thus gaining control of the shop step-by-step.
6.4.4 Discussion: Overall Comparison of Results
To de�nitively compare the �ve release methods, and answer the �rst research question, perfor-
mance measures have been classi�ed into three categories: Category 1 considers performance
using 'traditional' measures, i.e., in terms of throughput time performance, WIP, and reductions
in percentage tardy. Category 2 considers the robustness of the methods to changes in �ow charac-
teristics, as investigated in subsection 6.4.1 and 6.4.2; and, �nally, Category 3 considers practical
issues, including the simplicity of the method, how intuitive it is, and its ease of implementa-
tion. Performance in each category is described below before an overall assessment of the release
methods is provided:
∙ Category 1 - traditional performance measures : SLAR and LUMS OR perform best in terms
of percentage tardy followed by WCPRD which performed best in terms of reduced WIP
and thus throughput time but su�ered from a relatively high percentage of tardy jobs in
the pure job shop. The corrected aggregate load approach (periodic release) and ConWIP
clearly performed the worst.
∙ Category 2 - robustness : All of the best-performing release methods from Category 1 above
(LUMS OR, SLAR, and WCPRD) were in�uenced by changes in �ow direction. Although
the corrected aggregate load approach (periodic release) was not in�uenced by changes in
�ow direction and ConWIP was only marginally in�uenced, both were still consistently
outperformed by the other three methods. LUMS OR is clearly the most robust of the
best-performing release methods from Category 1; however, the job type (small vs. large)
which contributes most to its good performance is contingent on the �ow characteristics.
∙ Category 3 - practicality : LUMS OR may be considered the best solution for practice as
it allows performance improvements to be achieved even under in�nite norms. Thus, no
workload norms have to be determined when implementing the approach. Once the workload
trigger mechanism has been embedded in an organization and its production process, the
periodic mechanism can be gradually introduced by tightening the upper workload norms
115
to determine the best level, thereby achieving further improvement. ConWIP, WCPRD and
the corrected aggregate load approach (periodic release) are also relatively 'straightforward'
to implement; however, in all three cases, production is regulated entirely by one release
mechanism which does not allow control to be achieved gradually. Finally, SLAR may be
considered the most di�cult to implement as it is not as simple and intuitive as the other
methods and it too does not allow control to be gained gradually. Moreover, a distinct
workload level - which is not speci�ed for SLAR - can be useful for maintaining clear dialog
between di�erent tiers of command in a company, e.g., between the shop �oor supervisor &
operators and between the supervisor & planning o�cer.
In conclusion, LUMS OR is considered the best overall option in practice due to its excellent
performance under all �ow characteristics and ease of implementation. Hence, it should be the
order release method incorporated within the design of a comprehensive PPC concept intended
for a wide range of shop characteristics in practice. SLAR is a viable alternative for production
environments close to the pure job shop.
WLC release methods clearly have the potential to overcome prior criticisms (e.g., from
Kanet, 1988) as both throughput time and tardiness results improve if continuous release methods
are applied (WCPRD and SLAR) or if periodic release is coupled with continuous release (LUMS
OR). In addition, WLC methods can lead to signi�cant performance improvement even when an
e�cient dispatching rule (such as the PST rule) is already in place. WLC reduces the e�ectiveness
of the dispatching rule, as argued, e.g., by Baker (1984) and Ragatz & Mabert (1988), especially
if WIP is very restricted. However, e�cient release methods, as discussed in this study, have the
potential to o�set the performance loss due to the reduced e�ectiveness of the dispatching rule,
thus improving overall performance. Hence, instead of playing con�icting roles, controlled order
release and dispatching can in fact complement each other.
6.5 Implications for Research and Practice
The most important implications from this study for future conceptual, analytical, simulation-
based and �eld research are as follows:
∙ Conceptual Research: Hopp & Spearman (2004) argued that all shops use a combination
of three bu�ers (lead time, capacity, and inventory) to protect throughput from variance.
This research creates a basis for examining components of the inventory bu�er. The key
components appear to be the pre-shop pool of orders (the pre-inventory) and the actual
shop �oor inventory (WIP). It has been demonstrated that the shop �oor inventory bu�er
is most e�ective when it is a stable load in front of each work centre. To maintain the load
at a stable level, this bu�er should be protected against variance in the incoming load. This
can best be achieved with the aid of a higher level approach and the use of a pre-shop pool
of orders, as provided by controlled order release (e.g., WLC). Future WLC research should
integrate the �ndings of this study with the higher level Customer Enquiry Management
6. Workload Control and Order Release: A Lean Solution for Make-To-Order Companies
(CEM) stage, where the other two bu�er types - lead time and capacity - are controlled,
thereby creating a comprehensive system that protects throughput from variance.
∙ Analytical Research: One of the qualities of WLC release methods such as LUMS OR is
that they can change the distribution of busy periods at work centres. This research has
shown that actively in�uencing this distribution, e.g., by postponing periods of idleness
using a starvation avoidance mechanism (i.e., the continuous workload trigger), improves
performance. This provides a promising starting point for analytical research into how the
distribution of busy periods at work centres in�uences performance in job shops.
∙ Simulation Research: Several simulation studies have transformed continuous into periodic
release methods (e.g., Hendry & Wong, 1994; Cigolini & Portioli-Staudacher, 2002; Freden-
dall et al., 2010). The results of this paper suggest that transforming release methods in
this way will have deteriorated the results obtained signi�cantly - much better results are
obtained here than in previous studies. Therefore, future research should consider how the
results obtained in previous experiments would di�er without transformation.
∙ Field Research: A key issue which researchers have faced when attempting to implement
WLC in practice is how to set appropriate initial WLC norms. LUMS OR can avoid this
problem altogether; however, further �eld research is required to validate its e�ectiveness
in practice. Implementing LUMS OR would also contribute towards: (i) determining the
extent to which current WLC theory is aligned with the problems managers face in practice;
and, (ii) developing a strategy or roadmap for WLC implementation.
6.6 Conclusion
In answer to our �rst research question, concerning how performance compares across the re-
lease methods, the results of this study con�rm that continuous release mechanisms (SLAR and
WCPRD) and LUMS OR (a unique combination of continuous and periodic release) outperform
pure periodic release mechanisms (the corrected aggregate load approach). It has also been demon-
strated that these methods outperform ConWIP under all tested conditions. LUMS OR is consid-
ered the best solution in practice due to its excellent performance and ease of implementation.
It has been a widely held view in the literature that WLC negatively a�ects the performance
of dispatching and introduces premature idleness, thereby deteriorating tardiness results. In an-
swer to our second research question - concerning whether this criticism really is true - this study
has demonstrated that this is no longer the case. WLC order release can complement a dispatch-
ing rule - they do not have to play con�icting roles - and both throughput time and tardiness
results can in fact be improved simultaneously. This allows a company to promise shorter and
more reliable lead times to its prospective customers. Moreover, Hopp & Spearman (2004) argued
that controlling WIP is the key to a successful pull production system. Although the authors
did not refer to WLC, it has been shown here that the concept provides an e�ective means of
controlling WIP and is consistent with the lean principles Hopp & Spearman (2004) outlined.
117

Furthermore, to the best of our knowledge, WLC is the only PPC concept which allows the WIP
of each work centre to be controlled in high-variety production environments with complex �ow
characteristics, thus e�ectively protecting throughput from variance. Therefore, �nally, WLC is
of particular signi�cance for small and medium sized MTO companies in practice, as it:
∙ Allows lead times to be short, predictable and feasible;
∙ Allows capacity to be controlled and used e�ectively;
∙ Controls WIP and inventory, resulting in a lean shop �oor; and,
∙ Its core principles are simple in use and application.
7 Controlled Order Release: A Performance Assessment
in Job Shops with Sequence Dependent Set-up Times
Submitted to International Journal of Production Economics
Matthias Thürer, Cristovao Silva, Mark Stevenson, and Martin Land
Abstract
Findings from recent implementations of Workload Control (WLC) have called for researchers to
investigate how sequence dependent set-up times can best be handled within the design of the
concept. More fundamentally, other researchers have questioned the practicality of the concept
altogether arguing that WLC order release methods negatively a�ect dispatching rules and thus
overall performance, especially if set-up times are sequence dependent. This paper demonstrates
that: controlling order release can more than compensate for performance losses at dispatching,
improving overall performance; and, sequence dependent set-up times can best be handled through
set-up oriented dispatching rules. Four of the best-performing release methods from the literature
are compared through simulation in a job shop with sequence dependent set-up times. Firstly,
the four methods are compared without considering set-up requirements at release; and then,
secondly, the methods are re�ned to consider set-up requirements before being compared against
the original methods. Although the literature is dominated by purely periodic release methods,
"LUMS OR" - which combines continuous and periodic release - is identi�ed as the best-performing
order release method. Interestingly, the �ndings indicate that considering set-up requirements at
release may be counterproductive: con�icting goals between the selection rules employed at release
and dispatching may increase the total set-up time incurred. This reinforces the importance
of dispatching for supporting short-term decisions, such as accommodating set-up requirements.
Future research should consider whether the results hold if set-up times are not distributed equally
across job types and work centres.
7.1 Introduction
Recent case study work has called for researchers to investigate how sequence dependent set-up
times can best be handled within the design of the Workload Control (WLC) concept to improve
its applicability to the characteristics of Make-To-Order (MTO) job shops encountered in practice
(e.g., Hendry et al., 2008). In response, this paper uses simulation to assess the performance of
WLC order release methods in job shops with sequence dependent set-up times. In doing so, it
represents an important step towards providing a simple and e�ective Production Planning &
Control (PPC) concept that is suitable and a�ordable for small & medium sized MTO companies.
WLC is considered the best solution for MTO companies, which often operate as complex job
shops, as it meets more of the PPC requirements of MTO companies than alternative approaches
(Kingsman et al., 1989; Zäpfel & Missbauer, 1993; Stevenson et al., 2005; Stevenson, 2006; Land
& Gaalman, 2009). The concept controls the �ow of orders from customer enquiry through to the
delivery of the �nished product by integrating production & sales through a hierarchy of workloads
(Tatsiopoulos & Kingsman, 1983). One of its key decision levels is order release which controls
the input of work to the shop �oor, thereby determining the level of Work-In-Process (WIP). By
holding orders back from the shop �oor in a pre-shop pool and controlling release, WLC decouples
the shop �oor from the incoming order �ow and protects it from variance (Melnyk & Ragatz,
1989); this allows lead times to be reduced.
Despite its potential, the concept received substantial criticism in the 1980s and 1990s (e.g.,
Baker, 1984; Kanet, 1988; Ragatz & Mabert, 1988; Kim & Bobrowski, 1995). Most notably,
authors claimed its core order release mechanism negatively a�ects dispatching rule performance
and deteriorates tardiness results. This was argued to be particularly pertinent in the context of
sequence dependent set-up times. For example, Kim & Bobrowski (1995) showed that controlling
order release has a negative e�ect on overall performance in job shops with sequence dependent
set-up times; it was argued that the positive e�ects of limiting WIP cannot o�set the adverse
e�ects of restricting the number of selection possibilities on the performance of the dispatching
rule. Given that sequence dependent set-up times also a�ect the applicability of WLC in practice
(e.g., Hendry et al., 2008), it is argued here that WLC must perform well in jobs shops where
set-up times are sequence dependent. Therefore, addressing this issue - and the criticisms of
controlled order release - is a key research challenge for WLC.
Two recent contributions have begun to investigate how sequence dependent set-up times
can best be handled within the design of the WLC concept and, in doing so, started to respond
to the above. In the context of restricted �ow shops with sequence dependent set-up times,
Fernandes & Carmo-Silva (2010) showed that controlled order release can improve performance
even if an e�ective set-up oriented dispatching rule is in place, while Thürer et al. (2010b)
demonstrated that this result is also valid in more complex job shop environments. However,
neither paper reported results for the actual percentage of tardy jobs despite the concept being
criticised for negatively a�ecting this measure. Instead, Fernandes & Carmo-Silva (2010) focused
on the standard deviation of lateness and Thürer et al. (2010b) reported the mean lateness.
Therefore, the e�ect on overall shop �oor performance remains unknown. Moreover, both studies
neglected continuous release rules, focusing entirely on periodic release rules. This is a signi�cant
shortcoming as: studies comparing the two have shown that continuous methods outperform
periodic methods (e.g., Hendry &Wong, 1994; Sabuncuoglu & Karapinar, 1999); and, a continuous
�ow of information allows set-up requirements to be considered at release even in complex job
shops with high routing variability. It therefore follows that recent contributions by Fernandes &
Carmo-Silva (2010) and Thürer et al. (2010b) should be extended to consider important tardiness
results (e.g., percentage tardy) and to assess the performance of periodic and continuous order
release methods in job shops where set-up times are sequence dependent.
This study contributes to the WLC literature by demonstrating that an e�ective order
7. Controlled Order Release: A Performance Assessment in Job Shops with Sequence Dependent Set-up Times
release method can o�set performance losses at dispatching, improving tardiness results; hence,
it demonstrates that the prior criticism of WLC (e.g., from Kim & Bobrowski, 1995) can be
overcome. It assesses the in�uence of sequence dependent set-up times on the performance of
continuous release methods and compares the performance of periodic and continuous release
methods in a job shop environment with sequence dependent set-up times. It provides an insight
into how sequence dependent set-up times in�uence order release and identi�es the best-performing
order release method for this type of production environment. This has important implications for
bridging the gap between theory and practice where sequence dependent set-up times are common
(Stevenson & Silva, 2008; Hendry et al., 2008).
The remainder of this paper is organized as follows. Section 7.2 reviews literature concerned
with sequence dependent set-up times before Section 7.3 describes the design of this simulation
study. The simulation results are presented and analysed in Section 7.4 before key implications
for the use of WLC in practice are summarized in Section 7.5. Final conclusions are drawn in
Section 7.6.
7.2 Literature Review
This section begins by reviewing alternative order release methods in Section 7.2.1 before review-
ing literature concerned with sequence dependent set-up times in sections 7.2.2 and 7.2.3. General
dispatching literature concerned with sequence dependent set-up times is brie�y reviewed in Sec-
tion 7.2.2, where the focus is on simple dispatching rules suitable for small & medium sized MTO
companies and job shops rather than complex heuristics, before the limited available WLC liter-
ature concerned with sequence dependent set-up times is reviewed in Section 7.2.3. Finally, an
assessment of the literature is provided in Section 7.2.4. We do not claim to provide a complete
overview of all literature on sequence dependent set-up times; for this, the reader is referred to
Allahverdi et al. (1999 and 2008).
7.2.1 Order Release
WLC release methods control the amount of work on the shop �oor. The methods are divided
into those which release work from the pre-shop pool periodically and those which release work
continuously. The two approaches are discussed in sections 7.2.1.1 and 7.2.1.2 respectively before
a unique approach, which combines periodic with continuous release, is outlined in Section 7.2.1.3.
In reviewing the order release methods, four of the best-performing methods are identi�ed for
inclusion in this simulation study. For other approaches to classifying release methods, the reader
is referred to Philipoom et al. (1993), Wisner (1995), Bergamaschi et al. (1997), Sabuncuoglu &
Karapinar (1999) and Fredendall et al. (2010).
121
7.2.1.1 Periodic Release Methods
Periodic Release Methods Periodic release methods make the decision to release orders at periodic
time intervals. The release procedure is similar among alternative methods (Land & Gaalman,
1998): jobs in the pool are considered for release according to, e.g., Earliest Due Date (EDD),
shortest slack or Planned Release Date (PRD); and, the workload of a job is contributed to the
load of the work centres in its routing. If this new load �ts within the workload norm, the job is
released and its load assigned; if one or more norms would be exceeded, the job must wait until at
least the next release period and the workload is reset. This procedure is repeated until all jobs
have been considered for release once.
The main di�erence between alternative periodic release methods is how the load is con-
tributed. The main approaches are the probabilistic approach, which estimates the input to the
direct load (or queue) of a work centre over time and converts the indirect load (the load upstream
of a work centre) contributed at release using a depreciation factor based on historical (probabilis-
tic) data (see, e.g., Bechte, 1988 and 1994); and, the 'classical' aggregate load approach (also
known as the 'atemporal' approach), which does not consider the position of a work centre in the
routing of a job: the direct and indirect load is simply aggregated (e.g., Bertrand & Wortmann,
1981; Hendry, 1989). An extension to the classical aggregate load approach was presented by Land
& Gaalman (1996) and is known as the "corrected aggregate load approach". This estimates the
input to the direct load - like the probabilistic approach - but in a much simpler way. The work-
load which is contributed to a certain work centre is the workload divided by the position of a
work centre in the routing of a job.
Of all the available periodic release methods presented in the literature, the corrected aggre-
gate load approach and the probabilistic approach have performed the best (see, e.g., Oosterman
et al., 2000). Here, it is argued that the corrected aggregate load approach is the best alternative
for implementation in practice due to its simplicity. Therefore, this release method is selected to
represent periodic release in this study. It was also used in the studies by Fernandes & Carmo-
Silva (2010) and Thürer et al. (2010b).
7.2.1.2 Continuous Release Methods
Using a continuous release method means that the decision to release an order may be made at
any moment in time (rather than once a shift, day, week, etc), normally triggered by an event on
the shop �oor, e.g., the load of any work centre, the shop as a whole, or the bottleneck constraint
falling below a predetermined level (see, e.g., Glassey & Resende, 1988; Melnyk & Ragatz, 1989).
As soon as release is triggered, jobs are chosen from the pre-shop pool according to, e.g., EDD,
shortest slack or PRD until the workload exceeds the release trigger level. Melnyk & Ragatz (1989)
compared the performance of a continuous release method triggered by the work centre load with
the performance of a shop load method and identi�ed the former as the best; this result was later
con�rmed by Hendry & Wong (1994) and Sabuncuoglu & Karapinar (1999). As we focus on the
job shop, where no stable bottleneck or gateway work centre can be identi�ed, the bottleneck
7. Controlled Order Release: A Performance Assessment in Job Shops with Sequence Dependent Set-up Times
workload trigger is not applicable. Therefore, the work centre workload trigger has been selected
to represent continuous release methods in this study.
In addition, a second continuous release rule is included in this study: the Super�uous Load
Avoidance Release (SLAR) method for which outstanding performance results have been reported
(see Land & Gaalman, 1998). SLAR releases work under two conditions: (i) a starving work cen-
tre; and (ii) no urgent jobs are queuing in front of a work centre (but urgent jobs are waiting in the
pre-shop pool). In the �rst case, a job for which the �rst work centre in its routing is the starving
work centre is selected from the pre-shop pool according to PRD. In the second case, an urgent
job for which the triggering work centre is the �rst work centre in its routing is released according
to the Shortest Processing Time (SPT). In contrast to the other release methods discussed above,
SLAR bases its release decision on the urgency of jobs rather than on balancing the workload;
it di�erentiates between urgent jobs (i.e., jobs for which the planned operation start time has
passed) and non-urgent jobs. The planned operation start time is given by the Due Date (DD)
minus the sum of the remaining processing times and the remaining number of operations mul-
tiplied by a time-related slack factor k. As a result, the performance of SLAR depends largely on k.
7.2.1.3 LUMS OR - Combining Periodic with Continuous Release
To the best of our knowledge, only one release method has been presented in the literature
which combines periodic with continuous release; this approach, proposed by Hendry & Kings-
man (1991a), is known as "LUMS OR". Periodic release is combined with a continuous starvation
avoidance mechanism; thus, release is as for the other periodic release methods above but if, at
any time, the workload in front of a work centre falls to zero (i.e., the work centre is starving),
a job is actively pulled forward from the pool. This means a job with the work centre which
triggered the release as the �rst in its routing is released from the pool according to PRD and its
load contributed according to the approach applied by the periodic release method. LUMS OR
will be included in this study and will use the corrected aggregate load approach as its periodic
release method given that this has been identi�ed as the best-performing purely periodic release
method (see Section 7.2.1.1).
7.2.2 Dispatching Literature Concerned with Sequence Dependent Set-up Times in
Job Shops
One of the �rst studies on sequence dependent set-up times in job shops was presented byWilbrecht
& Prescott (1969) who presented and tested seven dispatching rules through simulation. The
authors introduced the SIMSET (Similar Set-up) dispatching rule which selects the job from the
queue which results in the shortest set-up time. This study was later extended, e.g., by Flynn
(1987) and Kim & Bobrowski (1994), who introduced the Job of smallest Critical Ratio (JCR) rule.
JCR scans the queue in front of a work centre for a job similar to the one currently being processed.
If a similar job cannot be found, the job with the smallest critical ratio - referring to the quotient of
123
slack and remaining processing time of a job - is selected. Kim & Bobrowski (1997) then extended
their previous study (Kim & Bobrowski, 1994) by analysing the in�uence of set-up time variation,
i.e., deviation from the average set-up time, on the performance of dispatching. The authors
showed that set-up time variation negatively a�ects dispatching rule performance but found that
rules which consider set-up requirements allow set-up time variation to be accommodated. Finally,
more recently, Thürer et al. (2010b) introduced a set-up oriented Planned operation Start Time
(SOPST) dispatching rule which outperformed both JCR and SIMSET. All of these studies show
that dispatching rules which consider set-up requirements outperform dispatching rules which do
not.
7.2.3 Workload Control Literature Concerned with Sequence Dependent Set-up Times
Literature on WLC concerned with sequence dependent set-up times is scarce. The main contri-
butions are the studies by Kim & Bobrowski (1995), Missbauer (1997), Fernandes & Carmo-Silva
(2010) and Thürer et al. (2010b). Kim & Bobrowski (1995) tested the in�uence of controlled order
release on performance in a job shop with sequence dependent set-up times. The authors found
that controlled order release cannot o�set the performance loss which occurs at dispatching. The
authors therefore concluded that in job shops with sequence dependent set-up times, performance
depends primarily on the dispatching rule and controlled order release has a direct detrimental
e�ect on performance. This �nding signi�cantly questions the importance of WLC and controlled
order release. In response, both Fernandes & Carmo-Silva (2010) - for the restricted �ow shop -
and Thürer et al. (2010b) - for the job shop - showed that performance can in fact be improved by
controlled order release even if an e�ective set-up oriented dispatching rule is in place. However,
neither study presented detailed tardiness results. Thus, despite the importance of this perfor-
mance measure, the impact on the percentage of tardy jobs is still unknown; both studies also
focused exclusively on periodic release rules. Thus, the studies do not completely overcome the
criticism of WLC by Kim & Bobrowski (1995).
Finally, Missbauer (1997) investigated the inter-relationship between the set-up time, dis-
patching rule and WIP based on a single-machine analytical model. The author showed that the
number of jobs on the �oor, and thus the level of WIP, in�uences the resulting set-up times if a
set-up oriented dispatching rule is in place; the higher the WIP, the lower the set-up times. Addi-
tional simulation experiments by Missbauer (1997) showed that stabilizing the number of jobs on
the shop �oor through controlled order release in�uences this relationship and may increase set-up
times by restricting the selection options available to the dispatching rule. Although the author
used a continuous release method - triggering release if the load of a work centre falls below a
certain level - the performance of the method was not assessed or discussed in detail as the author
focused on the inter-relationship between the set-up time and WIP.

7. Controlled Order Release: A Performance Assessment in Job Shops with Sequence Dependent Set-up Times
7.2.4 Assessment of the Literature
The presence of sequence dependent set-up times is an important contextual factor a�ecting
the suitability of a PPC concept such as WLC in practice. Yet WLC research concerned with
sequence dependent set-up times is scarce. Moreover, researchers have fundamentally questioned
the practicality of order release and thus WLC if set-up times are sequence dependent; and, recent
case study evidence has called for more research into how sequence dependent set-up times can
best be handled within the design of the WLC concept. Despite recent attention (e.g., Fernandes
& Carmo-Silva, 2010; Thürer et al., 2010b), this issue has not been completely addressed. It
is argued here that further research into the in�uence of sequence dependent set-up times on
the performance of WLC in job shops is required and that particular attention should be given
to continuous release methods which have been neglected in the literature. This is considered
an important research gap given the superior performance of continuous over periodic release
methods (see Hendry & Wong, 1994; Sabuncuoglu & Karapinar, 1999). Therefore, this research
investigates the performance of four of the best-performing order release methods in job shops
with sequence dependent set-up times, and how the methods a�ect dispatching rule and overall
performance. The investigation considers the following three research questions (RQ1-3):
∙ RQ1: How do continuous release methods perform in job shops with sequence dependent
set-up times (including when an e�ective set-up time oriented dispatching rule is in place)?
And how do they compare with periodic release methods?
∙ RQ2: How can release methods be re�ned to consider set-up requirements at release, and
what in�uence does this have on performance?
∙ RQ3: Overall, which release method performs the best in a job shop environment with
sequence dependent set-up times?
To answer the �rst research question, systematic simulation experiments are conducted in
order to compare the performance of di�erent sets of release methods and set-up oriented & non
set-up oriented dispatching rules. The release rules are then re�ned to consider set-up requirements
before the experiments are repeated to answer the second research question. Finally, to answer the
third research question, the performance results of both the original and re�ned release methods
are compared to identify the best performing release method overall.
7.3 Simulation Model
7.3.1 Overview of Shop Characteristics
A simulation model of a Pure Job Shop (according to Melnyk & Ragatz, 1989) has been developed
using SIMUL8 c⃝. It consists of 6 work centres, where each is a single and unique capacity resource.
Capacity is equal for all work centres and remains constant; each operation requires one speci�c
work centre. The routing length varies from 1 to 6 operations and all work centres have an equal
125
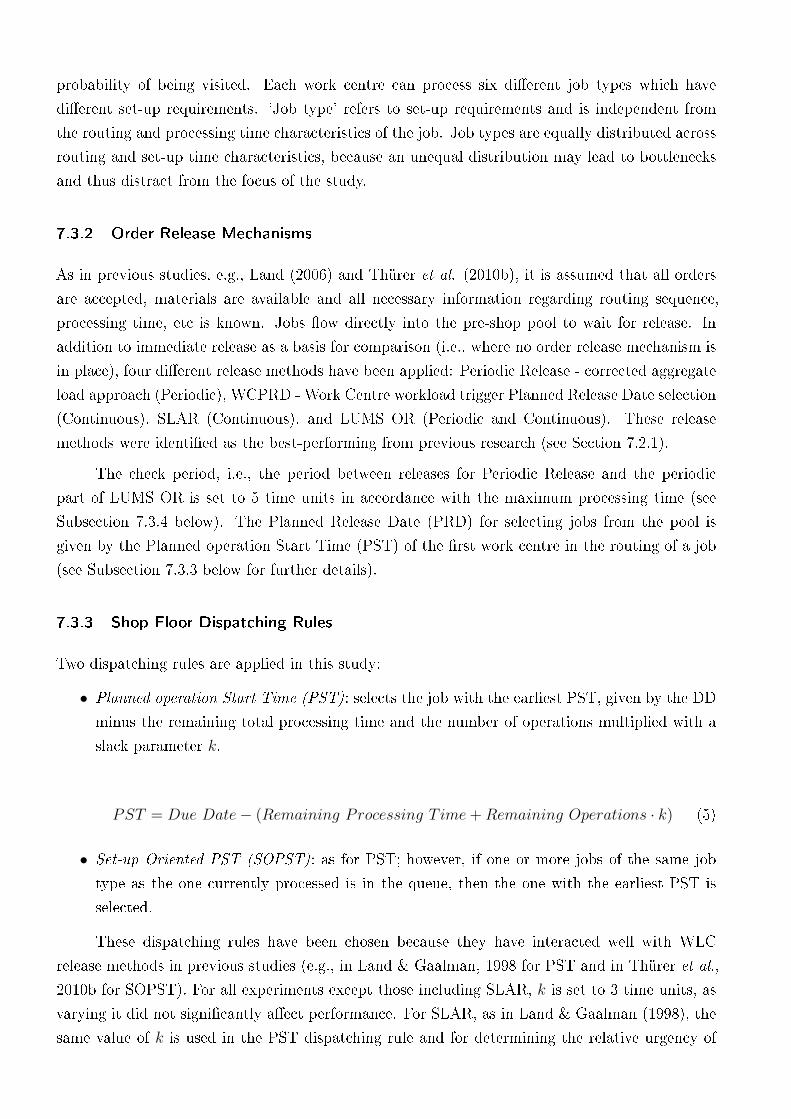
probability of being visited. Each work centre can process six di�erent job types which have
di�erent set-up requirements. 'Job type' refers to set-up requirements and is independent from
the routing and processing time characteristics of the job. Job types are equally distributed across
routing and set-up time characteristics, because an unequal distribution may lead to bottlenecks
and thus distract from the focus of the study.
7.3.2 Order Release Mechanisms
As in previous studies, e.g., Land (2006) and Thürer et al. (2010b), it is assumed that all orders
are accepted, materials are available and all necessary information regarding routing sequence,
processing time, etc is known. Jobs �ow directly into the pre-shop pool to wait for release. In
addition to immediate release as a basis for comparison (i.e., where no order release mechanism is
in place), four di�erent release methods have been applied: Periodic Release - corrected aggregate
load approach (Periodic), WCPRD - Work Centre workload trigger Planned Release Date selection
(Continuous), SLAR (Continuous), and LUMS OR (Periodic and Continuous). These release
methods were identi�ed as the best-performing from previous research (see Section 7.2.1).
The check period, i.e., the period between releases for Periodic Release and the periodic
part of LUMS OR is set to 5 time units in accordance with the maximum processing time (see
Subsection 7.3.4 below). The Planned Release Date (PRD) for selecting jobs from the pool is
given by the Planned operation Start Time (PST) of the �rst work centre in the routing of a job
(see Subsection 7.3.3 below for further details).
7.3.3 Shop Floor Dispatching Rules
Two dispatching rules are applied in this study:
∙ Planned operation Start Time (PST): selects the job with the earliest PST, given by the DD
minus the remaining total processing time and the number of operations multiplied with a
slack parameter k.
PST = Due Date− (Remaining Processing T ime+Remaining Operations ⋅ k) (5)
∙ Set-up Oriented PST (SOPST): as for PST; however, if one or more jobs of the same job
type as the one currently processed is in the queue, then the one with the earliest PST is
selected.
These dispatching rules have been chosen because they have interacted well with WLC
release methods in previous studies (e.g., in Land & Gaalman, 1998 for PST and in Thürer et al.,
2010b for SOPST). For all experiments except those including SLAR, k is set to 3 time units, as
varying it did not signi�cantly a�ect performance. For SLAR, as in Land & Gaalman (1998), the
same value of k is used in the PST dispatching rule and for determining the relative urgency of
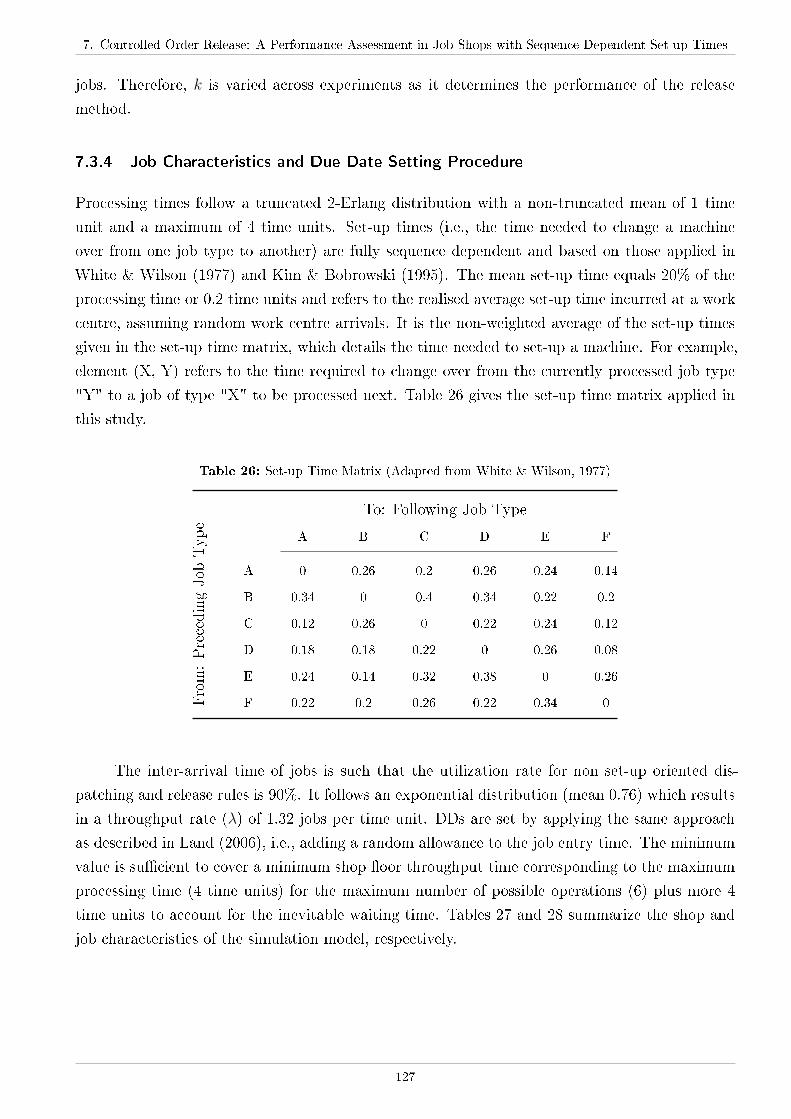
7. Controlled Order Release: A Performance Assessment in Job Shops with Sequence Dependent Set-up Times
jobs. Therefore, k is varied across experiments as it determines the performance of the release
method.
7.3.4 Job Characteristics and Due Date Setting Procedure
Processing times follow a truncated 2-Erlang distribution with a non-truncated mean of 1 time
unit and a maximum of 4 time units. Set-up times (i.e., the time needed to change a machine
over from one job type to another) are fully sequence dependent and based on those applied in
White & Wilson (1977) and Kim & Bobrowski (1995). The mean set-up time equals 20% of the
processing time or 0.2 time units and refers to the realised average set-up time incurred at a work
centre, assuming random work centre arrivals. It is the non-weighted average of the set-up times
given in the set-up time matrix, which details the time needed to set-up a machine. For example,
element (X, Y) refers to the time required to change over from the currently processed job type
"Y" to a job of type "X" to be processed next. Table 26 gives the set-up time matrix applied in
this study.
Table 26: Set-up Time Matrix (Adapted from White & Wilson, 1977)
To: Following Job Type
From:PrecedingJob
Type
A B C D E F
A 0 0.26 0.2 0.26 0.24 0.14
B 0.34 0 0.4 0.34 0.22 0.2
C 0.12 0.26 0 0.22 0.24 0.12
D 0.18 0.18 0.22 0 0.26 0.08
E 0.24 0.14 0.32 0.38 0 0.26
F 0.22 0.2 0.26 0.22 0.34 0
The inter-arrival time of jobs is such that the utilization rate for non set-up oriented dis-
patching and release rules is 90%. It follows an exponential distribution (mean 0.76) which results
in a throughput rate (�) of 1.32 jobs per time unit. DDs are set by applying the same approach
as described in Land (2006), i.e., adding a random allowance to the job entry time. The minimum
value is su�cient to cover a minimum shop �oor throughput time corresponding to the maximum
processing time (4 time units) for the maximum number of possible operations (6) plus more 4
time units to account for the inevitable waiting time. Tables 27 and 28 summarize the shop and
job characteristics of the simulation model, respectively.
127
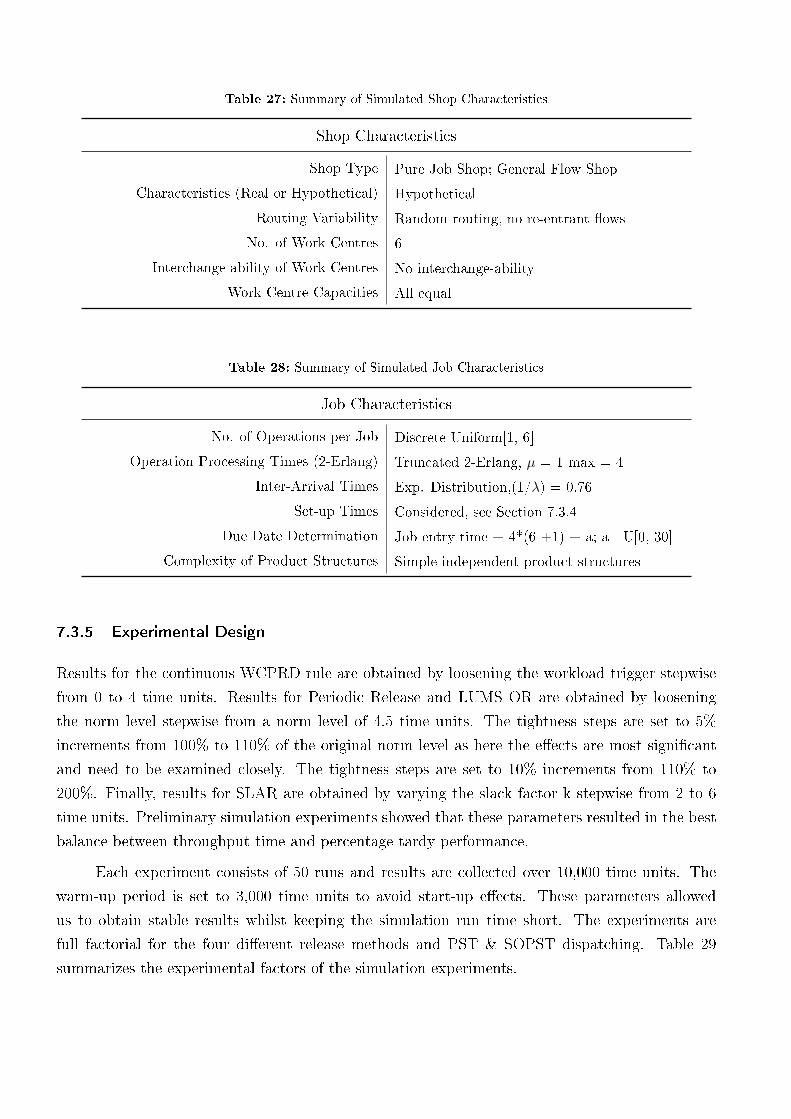
Table 27: Summary of Simulated Shop Characteristics
Shop Characteristics
Shop Type Pure Job Shop; General Flow Shop
Characteristics (Real or Hypothetical) Hypothetical
Routing Variability Random routing, no re-entrant �ows
No. of Work Centres 6
Interchange-ability of Work Centres No interchange-ability
Work Centre Capacities All equal
Table 28: Summary of Simulated Job Characteristics
Job Characteristics
No. of Operations per Job Discrete Uniform[1, 6]
Operation Processing Times (2-Erlang) Truncated 2-Erlang, � = 1 max = 4
Inter-Arrival Times Exp. Distribution,(1/�) = 0.76
Set-up Times Considered, see Section 7.3.4
Due Date Determination Job entry time + 4*(6 +1) + a; a U[0, 30]
Complexity of Product Structures Simple independent product structures
7.3.5 Experimental Design
Results for the continuous WCPRD rule are obtained by loosening the workload trigger stepwise
from 0 to 4 time units. Results for Periodic Release and LUMS OR are obtained by loosening
the norm level stepwise from a norm level of 4.5 time units. The tightness steps are set to 5%
increments from 100% to 110% of the original norm level as here the e�ects are most signi�cant
and need to be examined closely. The tightness steps are set to 10% increments from 110% to
200%. Finally, results for SLAR are obtained by varying the slack factor k stepwise from 2 to 6
time units. Preliminary simulation experiments showed that these parameters resulted in the best
balance between throughput time and percentage tardy performance.
Each experiment consists of 50 runs and results are collected over 10,000 time units. The
warm-up period is set to 3,000 time units to avoid start-up e�ects. These parameters allowed
us to obtain stable results whilst keeping the simulation run time short. The experiments are
full factorial for the four di�erent release methods and PST & SOPST dispatching. Table 29
summarizes the experimental factors of the simulation experiments.
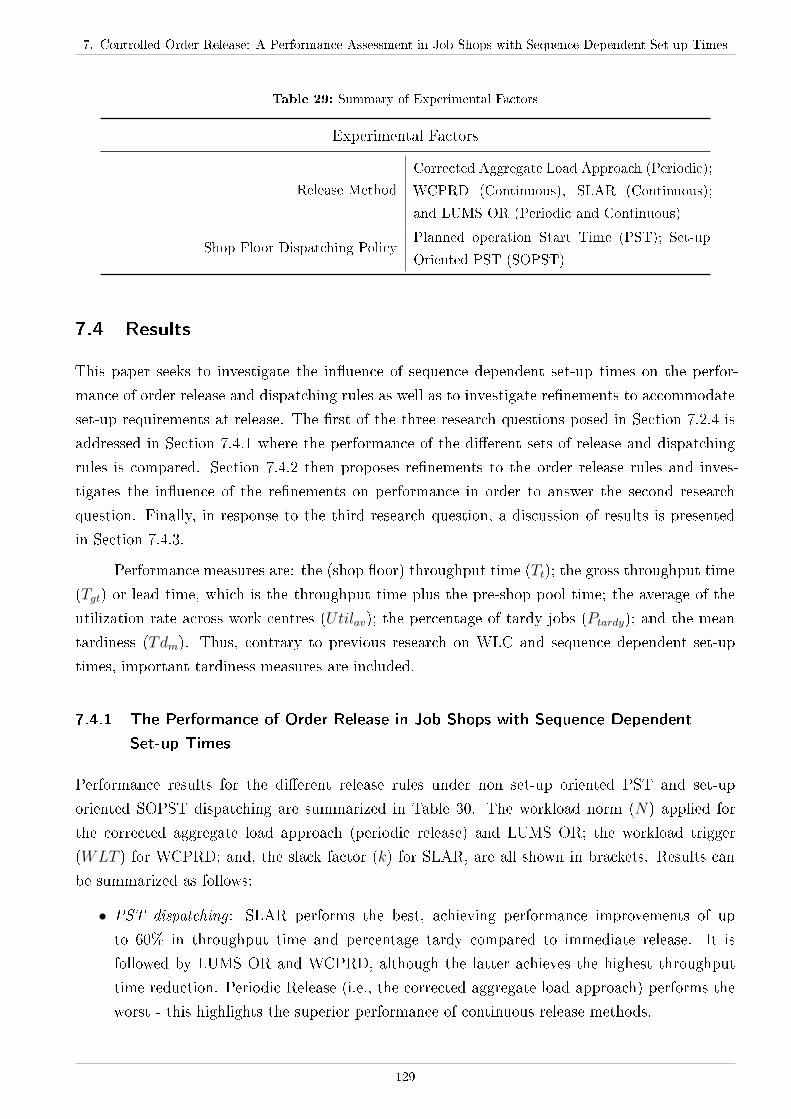
7. Controlled Order Release: A Performance Assessment in Job Shops with Sequence Dependent Set-up Times
Table 29: Summary of Experimental Factors
Experimental Factors
Release Method
Corrected Aggregate Load Approach (Periodic);
WCPRD (Continuous), SLAR (Continuous);
and LUMS OR (Periodic and Continuous)
Shop Floor Dispatching PolicyPlanned operation Start Time (PST); Set-up
Oriented PST (SOPST)
7.4 Results
This paper seeks to investigate the in�uence of sequence dependent set-up times on the perfor-
mance of order release and dispatching rules as well as to investigate re�nements to accommodate
set-up requirements at release. The �rst of the three research questions posed in Section 7.2.4 is
addressed in Section 7.4.1 where the performance of the di�erent sets of release and dispatching
rules is compared. Section 7.4.2 then proposes re�nements to the order release rules and inves-
tigates the in�uence of the re�nements on performance in order to answer the second research
question. Finally, in response to the third research question, a discussion of results is presented
in Section 7.4.3.
Performance measures are: the (shop �oor) throughput time (Tt); the gross throughput time
(Tgt) or lead time, which is the throughput time plus the pre-shop pool time; the average of the
utilization rate across work centres (Utilav); the percentage of tardy jobs (Ptardy); and the mean
tardiness (Tdm). Thus, contrary to previous research on WLC and sequence dependent set-up
times, important tardiness measures are included.
7.4.1 The Performance of Order Release in Job Shops with Sequence Dependent
Set-up Times
Performance results for the di�erent release rules under non set-up oriented PST and set-up
oriented SOPST dispatching are summarized in Table 30. The workload norm (N) applied for
the corrected aggregate load approach (periodic release) and LUMS OR; the workload trigger
(WLT ) for WCPRD; and, the slack factor (k) for SLAR, are all shown in brackets. Results can
be summarized as follows:
∙ PST dispatching : SLAR performs the best, achieving performance improvements of up
to 60% in throughput time and percentage tardy compared to immediate release. It is
followed by LUMS OR and WCPRD, although the latter achieves the highest throughput
time reduction. Periodic Release (i.e., the corrected aggregate load approach) performs the
worst - this highlights the superior performance of continuous release methods.
129
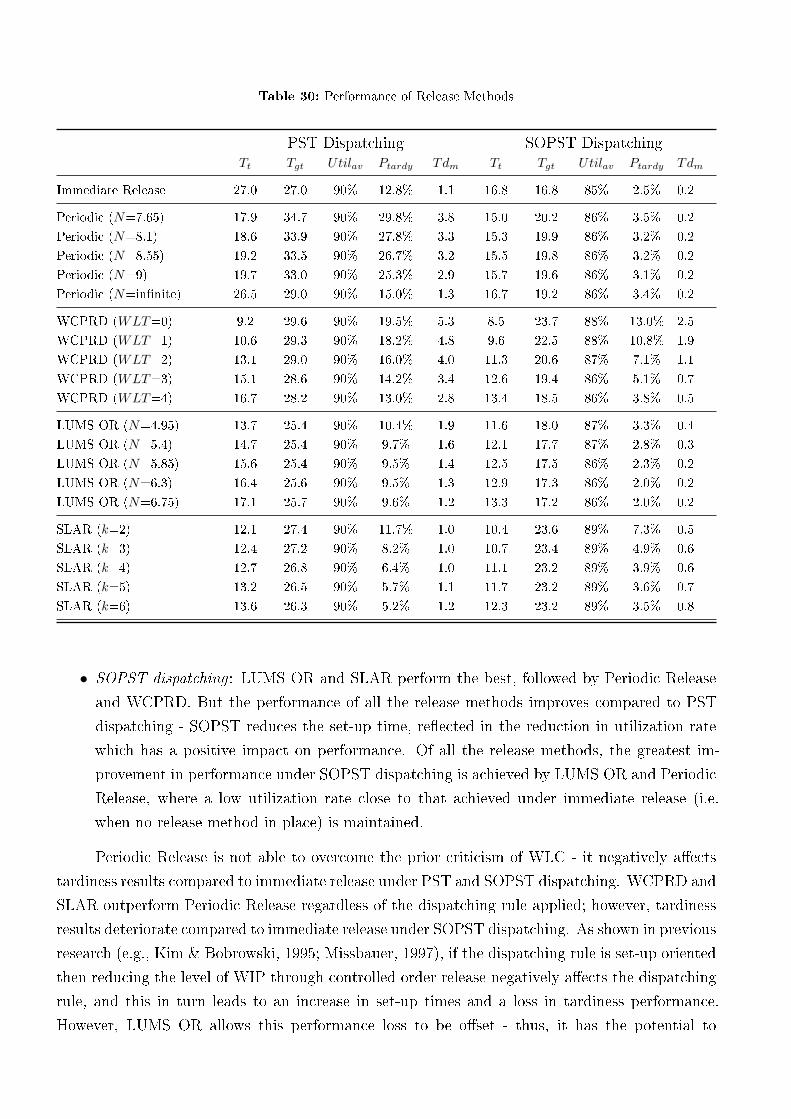
Table 30: Performance of Release Methods
PST Dispatching SOPST DispatchingTt Tgt Utilav Ptardy Tdm Tt Tgt Utilav Ptardy Tdm
Immediate Release 27.0 27.0 90% 12.8% 1.1 16.8 16.8 85% 2.5% 0.2
Periodic (N=7.65) 17.9 34.7 90% 29.8% 3.8 15.0 20.2 86% 3.5% 0.2
Periodic (N=8.1) 18.6 33.9 90% 27.8% 3.3 15.3 19.9 86% 3.2% 0.2
Periodic (N=8.55) 19.2 33.5 90% 26.7% 3.2 15.5 19.8 86% 3.2% 0.2
Periodic (N=9) 19.7 33.0 90% 25.3% 2.9 15.7 19.6 86% 3.1% 0.2
Periodic (N=in�nite) 26.5 29.0 90% 15.0% 1.3 16.7 19.2 86% 3.4% 0.2
WCPRD (WLT=0) 9.2 29.6 90% 19.5% 5.3 8.5 23.7 88% 13.0% 2.5
WCPRD (WLT=1) 10.6 29.3 90% 18.2% 4.8 9.6 22.5 88% 10.8% 1.9
WCPRD (WLT=2) 13.1 29.0 90% 16.0% 4.0 11.3 20.6 87% 7.1% 1.1
WCPRD (WLT=3) 15.1 28.6 90% 14.2% 3.4 12.6 19.4 86% 5.1% 0.7
WCPRD (WLT=4) 16.7 28.2 90% 13.0% 2.8 13.4 18.5 86% 3.8% 0.5
LUMS OR (N=4.95) 13.7 25.4 90% 10.4% 1.9 11.6 18.0 87% 3.3% 0.4
LUMS OR (N=5.4) 14.7 25.4 90% 9.7% 1.6 12.1 17.7 87% 2.8% 0.3
LUMS OR (N=5.85) 15.6 25.4 90% 9.5% 1.4 12.5 17.5 86% 2.3% 0.2
LUMS OR (N=6.3) 16.4 25.6 90% 9.5% 1.3 12.9 17.3 86% 2.0% 0.2
LUMS OR (N=6.75) 17.1 25.7 90% 9.6% 1.2 13.3 17.2 86% 2.0% 0.2
SLAR (k=2) 12.1 27.4 90% 11.7% 1.0 10.4 23.6 89% 7.3% 0.5
SLAR (k=3) 12.4 27.2 90% 8.2% 1.0 10.7 23.4 89% 4.9% 0.6
SLAR (k=4) 12.7 26.8 90% 6.4% 1.0 11.1 23.2 89% 3.9% 0.6
SLAR (k=5) 13.2 26.5 90% 5.7% 1.1 11.7 23.2 89% 3.6% 0.7
SLAR (k=6) 13.6 26.3 90% 5.2% 1.2 12.3 23.2 89% 3.5% 0.8
∙ SOPST dispatching : LUMS OR and SLAR perform the best, followed by Periodic Release
and WCPRD. But the performance of all the release methods improves compared to PST
dispatching - SOPST reduces the set-up time, re�ected in the reduction in utilization rate
which has a positive impact on performance. Of all the release methods, the greatest im-
provement in performance under SOPST dispatching is achieved by LUMS OR and Periodic
Release, where a low utilization rate close to that achieved under immediate release (i.e.
when no release method in place) is maintained.
Periodic Release is not able to overcome the prior criticism of WLC - it negatively a�ects
tardiness results compared to immediate release under PST and SOPST dispatching. WCPRD and
SLAR outperform Periodic Release regardless of the dispatching rule applied; however, tardiness
results deteriorate compared to immediate release under SOPST dispatching. As shown in previous
research (e.g., Kim & Bobrowski, 1995; Missbauer, 1997), if the dispatching rule is set-up oriented
then reducing the level of WIP through controlled order release negatively a�ects the dispatching
rule, and this in turn leads to an increase in set-up times and a loss in tardiness performance.
However, LUMS OR allows this performance loss to be o�set - thus, it has the potential to
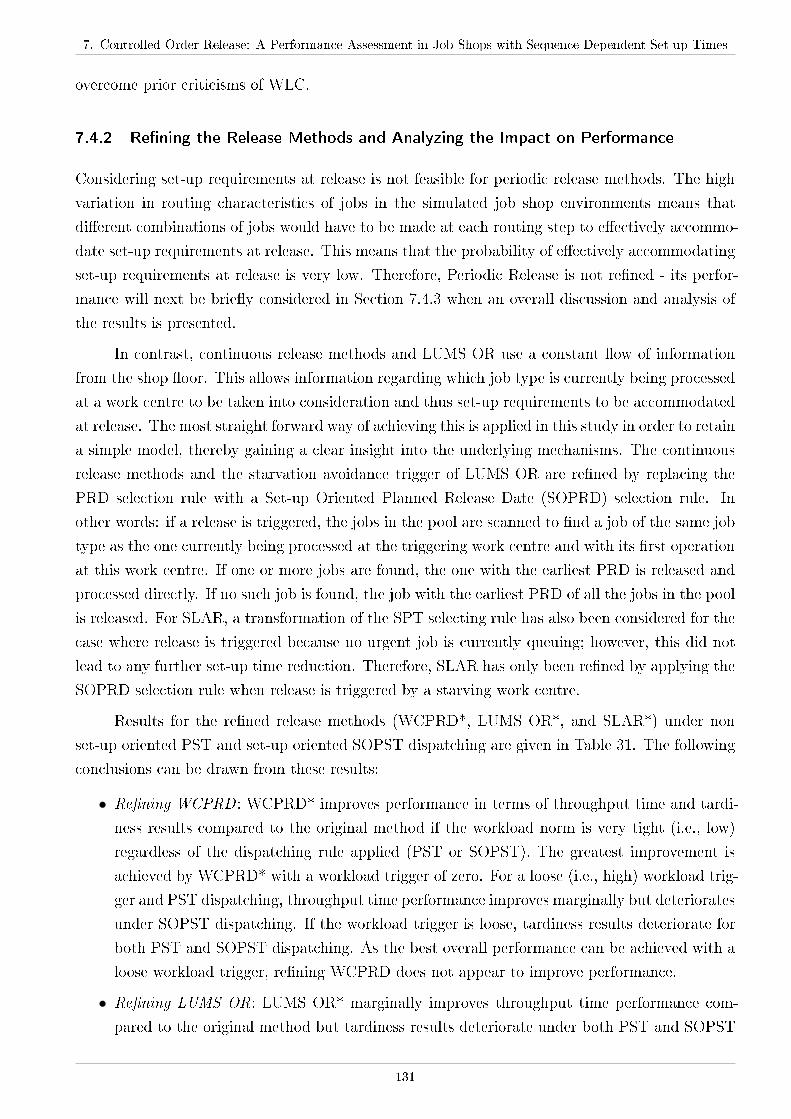
7. Controlled Order Release: A Performance Assessment in Job Shops with Sequence Dependent Set-up Times
overcome prior criticisms of WLC.
7.4.2 Re�ning the Release Methods and Analyzing the Impact on Performance
Considering set-up requirements at release is not feasible for periodic release methods. The high
variation in routing characteristics of jobs in the simulated job shop environments means that
di�erent combinations of jobs would have to be made at each routing step to e�ectively accommo-
date set-up requirements at release. This means that the probability of e�ectively accommodating
set-up requirements at release is very low. Therefore, Periodic Release is not re�ned - its perfor-
mance will next be brie�y considered in Section 7.4.3 when an overall discussion and analysis of
the results is presented.
In contrast, continuous release methods and LUMS OR use a constant �ow of information
from the shop �oor. This allows information regarding which job type is currently being processed
at a work centre to be taken into consideration and thus set-up requirements to be accommodated
at release. The most straight forward way of achieving this is applied in this study in order to retain
a simple model, thereby gaining a clear insight into the underlying mechanisms. The continuous
release methods and the starvation avoidance trigger of LUMS OR are re�ned by replacing the
PRD selection rule with a Set-up Oriented Planned Release Date (SOPRD) selection rule. In
other words: if a release is triggered, the jobs in the pool are scanned to �nd a job of the same job
type as the one currently being processed at the triggering work centre and with its �rst operation
at this work centre. If one or more jobs are found, the one with the earliest PRD is released and
processed directly. If no such job is found, the job with the earliest PRD of all the jobs in the pool
is released. For SLAR, a transformation of the SPT selecting rule has also been considered for the
case where release is triggered because no urgent job is currently queuing; however, this did not
lead to any further set-up time reduction. Therefore, SLAR has only been re�ned by applying the
SOPRD selection rule when release is triggered by a starving work centre.
Results for the re�ned release methods (WCPRD*, LUMS OR*, and SLAR*) under non
set-up oriented PST and set-up oriented SOPST dispatching are given in Table 31. The following
conclusions can be drawn from these results:
∙ Re�ning WCPRD : WCPRD* improves performance in terms of throughput time and tardi-
ness results compared to the original method if the workload norm is very tight (i.e., low)
regardless of the dispatching rule applied (PST or SOPST). The greatest improvement is
achieved by WCPRD* with a workload trigger of zero. For a loose (i.e., high) workload trig-
ger and PST dispatching, throughput time performance improves marginally but deteriorates
under SOPST dispatching. If the workload trigger is loose, tardiness results deteriorate for
both PST and SOPST dispatching. As the best overall performance can be achieved with a
loose workload trigger, re�ning WCPRD does not appear to improve performance.
∙ Re�ning LUMS OR: LUMS OR* marginally improves throughput time performance com-
pared to the original method but tardiness results deteriorate under both PST and SOPST
131
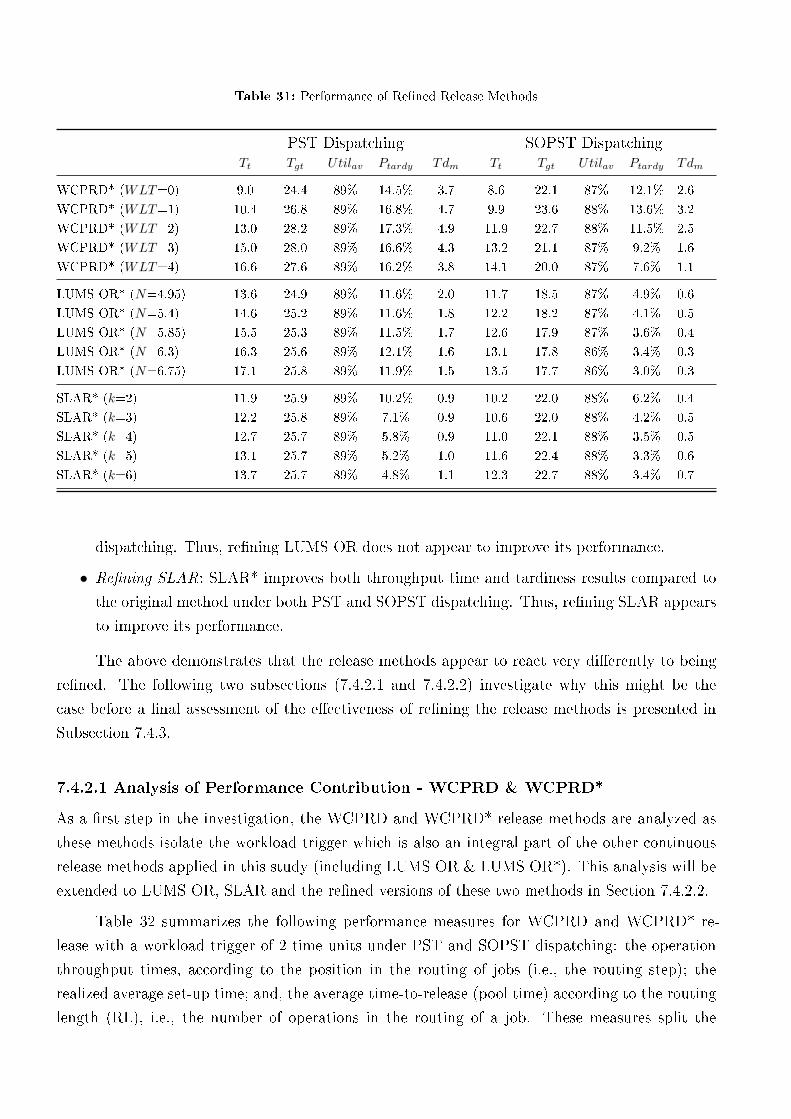
Table 31: Performance of Re�ned Release Methods
PST Dispatching SOPST DispatchingTt Tgt Utilav Ptardy Tdm Tt Tgt Utilav Ptardy Tdm
WCPRD* (WLT=0) 9.0 24.4 89% 14.5% 3.7 8.6 22.1 87% 12.1% 2.6
WCPRD* (WLT=1) 10.4 26.8 89% 16.8% 4.7 9.9 23.6 88% 13.6% 3.2
WCPRD* (WLT=2) 13.0 28.2 89% 17.3% 4.9 11.9 22.7 88% 11.5% 2.5
WCPRD* (WLT=3) 15.0 28.0 89% 16.6% 4.3 13.2 21.1 87% 9.2% 1.6
WCPRD* (WLT=4) 16.6 27.6 89% 16.2% 3.8 14.1 20.0 87% 7.6% 1.1
LUMS OR* (N=4.95) 13.6 24.9 89% 11.6% 2.0 11.7 18.5 87% 4.9% 0.6
LUMS OR* (N=5.4) 14.6 25.2 89% 11.6% 1.8 12.2 18.2 87% 4.1% 0.5
LUMS OR* (N=5.85) 15.5 25.3 89% 11.5% 1.7 12.6 17.9 87% 3.6% 0.4
LUMS OR* (N=6.3) 16.3 25.6 89% 12.1% 1.6 13.1 17.8 86% 3.4% 0.3
LUMS OR* (N=6.75) 17.1 25.8 89% 11.9% 1.5 13.5 17.7 86% 3.0% 0.3
SLAR* (k=2) 11.9 25.9 89% 10.2% 0.9 10.2 22.0 88% 6.2% 0.4
SLAR* (k=3) 12.2 25.8 89% 7.1% 0.9 10.6 22.0 88% 4.2% 0.5
SLAR* (k=4) 12.7 25.7 89% 5.8% 0.9 11.0 22.1 88% 3.5% 0.5
SLAR* (k=5) 13.1 25.7 89% 5.2% 1.0 11.6 22.4 88% 3.3% 0.6
SLAR* (k=6) 13.7 25.7 89% 4.8% 1.1 12.3 22.7 88% 3.4% 0.7
dispatching. Thus, re�ning LUMS OR does not appear to improve its performance.
∙ Re�ning SLAR: SLAR* improves both throughput time and tardiness results compared to
the original method under both PST and SOPST dispatching. Thus, re�ning SLAR appears
to improve its performance.
The above demonstrates that the release methods appear to react very di�erently to being
re�ned. The following two subsections (7.4.2.1 and 7.4.2.2) investigate why this might be the
case before a �nal assessment of the e�ectiveness of re�ning the release methods is presented in
Subsection 7.4.3.
7.4.2.1 Analysis of Performance Contribution - WCPRD & WCPRD*
As a �rst step in the investigation, the WCPRD and WCPRD* release methods are analyzed as
these methods isolate the workload trigger which is also an integral part of the other continuous
release methods applied in this study (including LUMS OR & LUMS OR*). This analysis will be
extended to LUMS OR, SLAR and the re�ned versions of these two methods in Section 7.4.2.2.
Table 32 summarizes the following performance measures for WCPRD and WCPRD* re-
lease with a workload trigger of 2 time units under PST and SOPST dispatching: the operation
throughput times, according to the position in the routing of jobs (i.e., the routing step); the
realized average set-up time; and, the average time-to-release (pool time) according to the routing
length (RL), i.e., the number of operations in the routing of a job. These measures split the
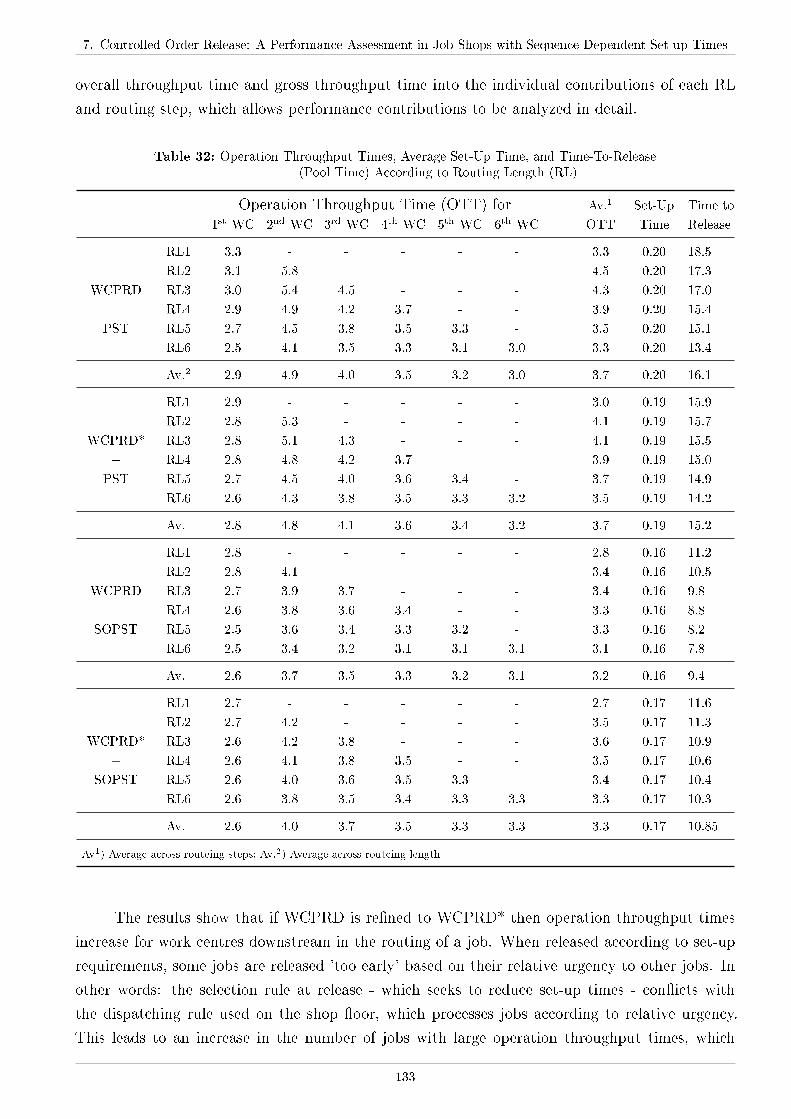
7. Controlled Order Release: A Performance Assessment in Job Shops with Sequence Dependent Set-up Times
overall throughput time and gross throughput time into the individual contributions of each RL
and routing step, which allows performance contributions to be analyzed in detail.
Table 32: Operation Throughput Times, Average Set-Up Time, and Time-To-Release(Pool Time) According to Routing Length (RL)
Operation Throughput Time (OTT) for Av.1 Set-Up Time to
1st WC 2nd WC 3rd WC 4th WC 5th WC 6th WC OTT Time Release
RL1 3.3 - - - - - 3.3 0.20 18.5
RL2 3.1 5.8 - - - - 4.5 0.20 17.3
WCPRD RL3 3.0 5.4 4.5 - - - 4.3 0.20 17.0
+ RL4 2.9 4.9 4.2 3.7 - - 3.9 0.20 15.4
PST RL5 2.7 4.5 3.8 3.5 3.3 - 3.5 0.20 15.1
RL6 2.5 4.1 3.5 3.3 3.1 3.0 3.3 0.20 13.4
Av.2 2.9 4.9 4.0 3.5 3.2 3.0 3.7 0.20 16.1
RL1 2.9 - - - - - 3.0 0.19 15.9
RL2 2.8 5.3 - - - - 4.1 0.19 15.7
WCPRD* RL3 2.8 5.1 4.3 - - - 4.1 0.19 15.5
+ RL4 2.8 4.8 4.2 3.7 - - 3.9 0.19 15.0
PST RL5 2.7 4.5 4.0 3.6 3.4 - 3.7 0.19 14.9
RL6 2.6 4.3 3.8 3.5 3.3 3.2 3.5 0.19 14.2
Av. 2.8 4.8 4.1 3.6 3.4 3.2 3.7 0.19 15.2
RL1 2.8 - - - - - 2.8 0.16 11.2
RL2 2.8 4.1 - - - - 3.4 0.16 10.5
WCPRD RL3 2.7 3.9 3.7 - - - 3.4 0.16 9.8
+ RL4 2.6 3.8 3.6 3.4 - - 3.3 0.16 8.8
SOPST RL5 2.5 3.6 3.4 3.3 3.2 - 3.3 0.16 8.2
RL6 2.5 3.4 3.2 3.1 3.1 3.1 3.1 0.16 7.8
Av. 2.6 3.7 3.5 3.3 3.2 3.1 3.2 0.16 9.4
RL1 2.7 - - - - - 2.7 0.17 11.6
RL2 2.7 4.2 - - - - 3.5 0.17 11.3
WCPRD* RL3 2.6 4.2 3.8 - - - 3.6 0.17 10.9
+ RL4 2.6 4.1 3.8 3.5 - - 3.5 0.17 10.6
SOPST RL5 2.6 4.0 3.6 3.5 3.3 - 3.4 0.17 10.4
RL6 2.6 3.8 3.5 3.4 3.3 3.3 3.3 0.17 10.3
Av. 2.6 4.0 3.7 3.5 3.3 3.3 3.3 0.17 10.85
Av1) Average across routeing steps; Av.2) Average across routeing length
The results show that if WCPRD is re�ned to WCPRD* then operation throughput times
increase for work centres downstream in the routing of a job. When released according to set-up
requirements, some jobs are released 'too early' based on their relative urgency to other jobs. In
other words: the selection rule at release - which seeks to reduce set-up times - con�icts with
the dispatching rule used on the shop �oor, which processes jobs according to relative urgency.
This leads to an increase in the number of jobs with large operation throughput times, which
133
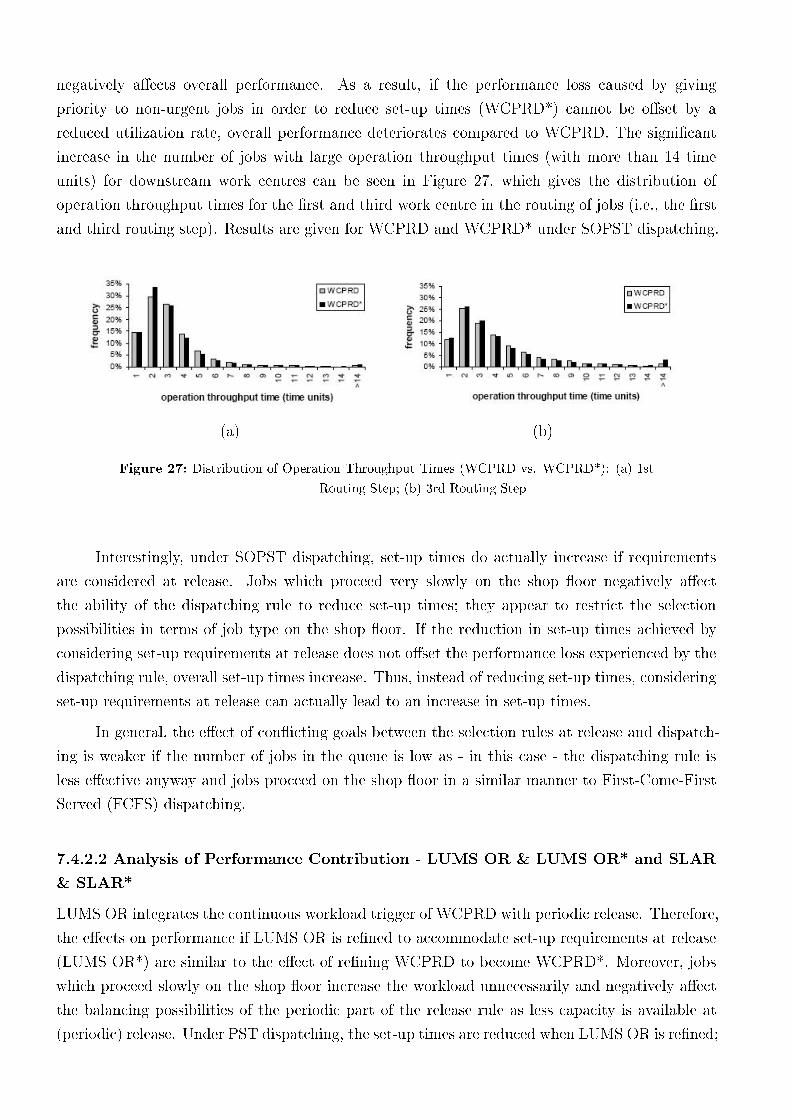
negatively a�ects overall performance. As a result, if the performance loss caused by giving
priority to non-urgent jobs in order to reduce set-up times (WCPRD*) cannot be o�set by a
reduced utilization rate, overall performance deteriorates compared to WCPRD. The signi�cant
increase in the number of jobs with large operation throughput times (with more than 14 time
units) for downstream work centres can be seen in Figure 27, which gives the distribution of
operation throughput times for the �rst and third work centre in the routing of jobs (i.e., the �rst
and third routing step). Results are given for WCPRD and WCPRD* under SOPST dispatching.
(a) (b)
Figure 27: Distribution of Operation Throughput Times (WCPRD vs. WCPRD*): (a) 1st
Routing Step; (b) 3rd Routing Step
Interestingly, under SOPST dispatching, set-up times do actually increase if requirements
are considered at release. Jobs which proceed very slowly on the shop �oor negatively a�ect
the ability of the dispatching rule to reduce set-up times; they appear to restrict the selection
possibilities in terms of job type on the shop �oor. If the reduction in set-up times achieved by
considering set-up requirements at release does not o�set the performance loss experienced by the
dispatching rule, overall set-up times increase. Thus, instead of reducing set-up times, considering
set-up requirements at release can actually lead to an increase in set-up times.
In general, the e�ect of con�icting goals between the selection rules at release and dispatch-
ing is weaker if the number of jobs in the queue is low as - in this case - the dispatching rule is
less e�ective anyway and jobs proceed on the shop �oor in a similar manner to First-Come-First
Served (FCFS) dispatching.
7.4.2.2 Analysis of Performance Contribution - LUMS OR & LUMS OR* and SLAR
& SLAR*
LUMS OR integrates the continuous workload trigger of WCPRD with periodic release. Therefore,
the e�ects on performance if LUMS OR is re�ned to accommodate set-up requirements at release
(LUMS OR*) are similar to the e�ect of re�ning WCPRD to become WCPRD*. Moreover, jobs
which proceed slowly on the shop �oor increase the workload unnecessarily and negatively a�ect
the balancing possibilities of the periodic part of the release rule as less capacity is available at
(periodic) release. Under PST dispatching, the set-up times are reduced when LUMS OR is re�ned;
7. Controlled Order Release: A Performance Assessment in Job Shops with Sequence Dependent Set-up Times
as a result, the utilization rate reduces, leading to better throughput time results. In contrast,
re�ning LUMS OR increases throughput times if SOPST dispatching is in place as the positive
e�ect on performance of a reduced utilization rate does not take place. Hence, considering set-up
requirements at release has a negative e�ect on tardiness results for LUMS OR under both PST
and SOPST dispatching.
SLAR showed the lowest set-up time reduction under SOPST dispatching as WIP is con-
trolled tightly; the limited e�ectiveness of the dispatching rule leaves more room for the re�ned
release method to reduce set-up times. Therefore, re�ning the method to SLAR* strengthens
the positive e�ects of reduced set-up times and utilization rate. It allows the negative e�ects of
releasing jobs too early to be counteracted; therefore, in contrast to WCPRD and LUMS OR, re-
�ning SLAR improves performance over the original method in job shops with sequence dependent
set-up times.
7.4.3 Discussion of Results
The performance of the WLC release methods is clearly a�ected by sequence dependent set-up
times. In addition, re�ning the release methods to accommodate set-up requirements at release
leads to an increase in the total set-up time incurred for some release methods. Based on the
results presented above, and in the light of detailed performance analysis, the following can be
concluded with regard to the performance of the original versus the re�ned method:
∙ WCPRD vs. WCPRD* : Re�ning the release method leads to a deterioration in performance
under most norm levels for PST and SOPST dispatching. This is because con�icting goals
between the selection rule at release (focused on set-up time reduction) and dispatching
(focused on producing according to relative urgency) lead to some jobs being released too
early and having to wait for long periods on the shop �oor. Therefore, it is concluded that
WCPRD does not improve in performance when it is re�ned.
∙ LUMS OR vs. LUMS OR* : Re�ning the release method deteriorates its performance (like
for WCPRD). In addition, jobs which proceed slowly on the shop �oor reduce the capacity
available at the next periodic release decision. This negatively a�ects the balancing possibil-
ities of the release method and results in a further performance loss. Therefore, LUMS OR
does not improve in performance when it is re�ned.
∙ SLAR vs. SLAR* : Re�ning the release method reduces set-up times and the resulting
reduction in utilization rate means that the performance loss caused by jobs being released
too early is o�set. Therefore, SLAR improves in performance when it is re�ned.
Overall, it can be concluded that re�ning SLAR to accommodate set-up requirements im-
proves its performance but making re�nements does not improve the performance of WCPRD or
LUMS OR. Given these conclusions, and to �nally determine the best-performing release method
in job shops with sequence dependent set-up times, Figure 28 summarizes the throughput time
and percentage tardy results for the best-performing version (re�ned or original) of each release
135
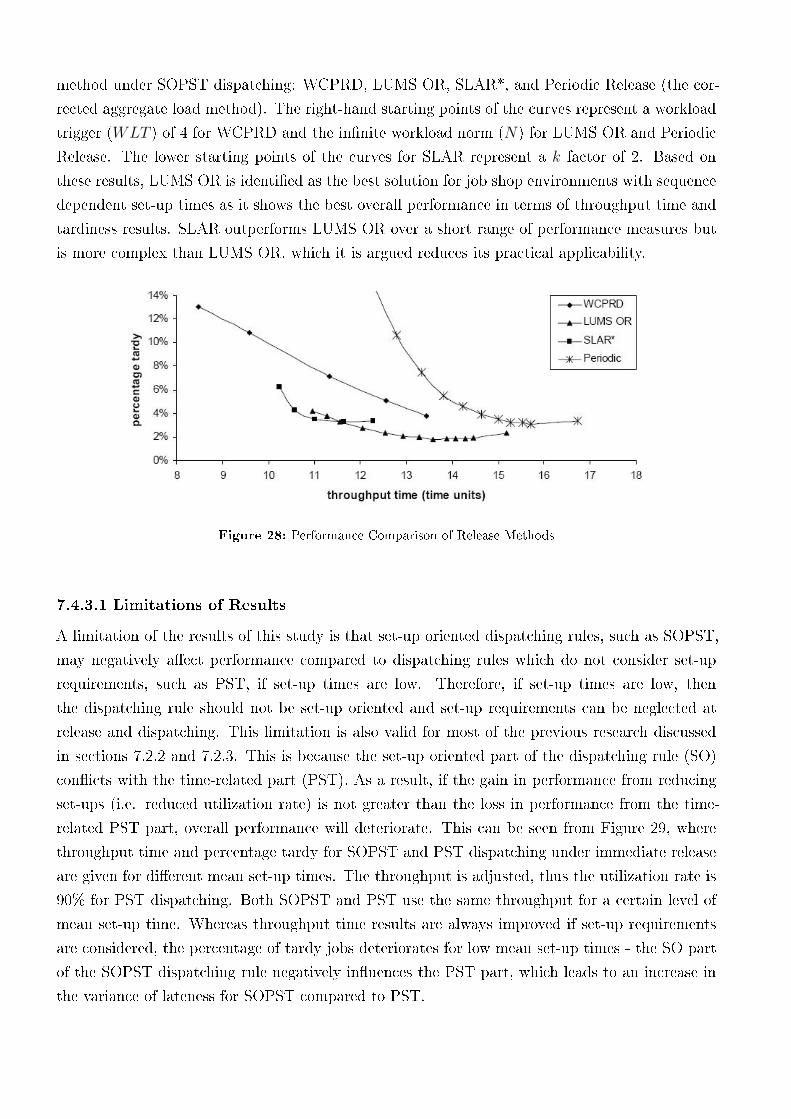
method under SOPST dispatching: WCPRD, LUMS OR, SLAR*, and Periodic Release (the cor-
rected aggregate load method). The right-hand starting points of the curves represent a workload
trigger (WLT ) of 4 for WCPRD and the in�nite workload norm (N) for LUMS OR and Periodic
Release. The lower starting points of the curves for SLAR represent a k factor of 2. Based on
these results, LUMS OR is identi�ed as the best solution for job shop environments with sequence
dependent set-up times as it shows the best overall performance in terms of throughput time and
tardiness results. SLAR outperforms LUMS OR over a short range of performance measures but
is more complex than LUMS OR, which it is argued reduces its practical applicability.
Figure 28: Performance Comparison of Release Methods
7.4.3.1 Limitations of Results
A limitation of the results of this study is that set-up oriented dispatching rules, such as SOPST,
may negatively a�ect performance compared to dispatching rules which do not consider set-up
requirements, such as PST, if set-up times are low. Therefore, if set-up times are low, then
the dispatching rule should not be set-up oriented and set-up requirements can be neglected at
release and dispatching. This limitation is also valid for most of the previous research discussed
in sections 7.2.2 and 7.2.3. This is because the set-up oriented part of the dispatching rule (SO)
con�icts with the time-related part (PST). As a result, if the gain in performance from reducing
set-ups (i.e. reduced utilization rate) is not greater than the loss in performance from the time-
related PST part, overall performance will deteriorate. This can be seen from Figure 29, where
throughput time and percentage tardy for SOPST and PST dispatching under immediate release
are given for di�erent mean set-up times. The throughput is adjusted, thus the utilization rate is
90% for PST dispatching. Both SOPST and PST use the same throughput for a certain level of
mean set-up time. Whereas throughput time results are always improved if set-up requirements
are considered, the percentage of tardy jobs deteriorates for low mean set-up times - the SO part
of the SOPST dispatching rule negatively in�uences the PST part, which leads to an increase in
the variance of lateness for SOPST compared to PST.
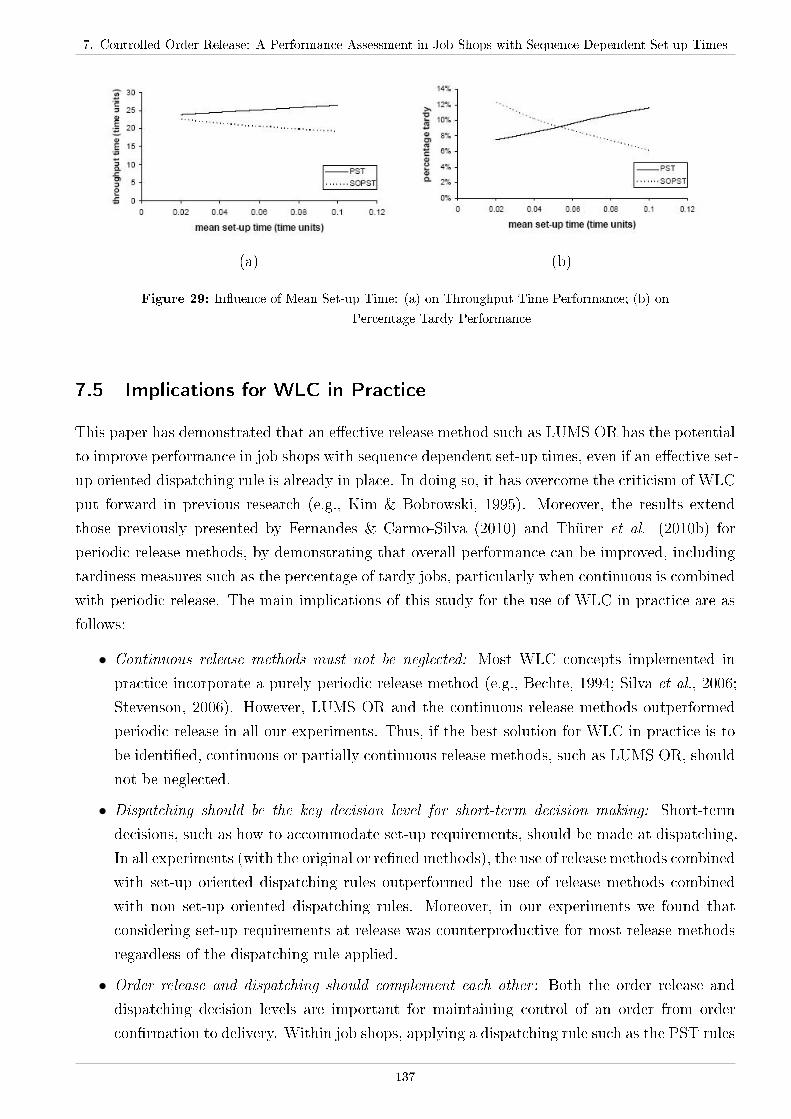
7. Controlled Order Release: A Performance Assessment in Job Shops with Sequence Dependent Set-up Times
(a) (b)
Figure 29: In�uence of Mean Set-up Time: (a) on Throughput Time Performance; (b) on
Percentage Tardy Performance
7.5 Implications for WLC in Practice
This paper has demonstrated that an e�ective release method such as LUMS OR has the potential
to improve performance in job shops with sequence dependent set-up times, even if an e�ective set-
up oriented dispatching rule is already in place. In doing so, it has overcome the criticism of WLC
put forward in previous research (e.g., Kim & Bobrowski, 1995). Moreover, the results extend
those previously presented by Fernandes & Carmo-Silva (2010) and Thürer et al. (2010b) for
periodic release methods, by demonstrating that overall performance can be improved, including
tardiness measures such as the percentage of tardy jobs, particularly when continuous is combined
with periodic release. The main implications of this study for the use of WLC in practice are as
follows:
∙ Continuous release methods must not be neglected: Most WLC concepts implemented in
practice incorporate a purely periodic release method (e.g., Bechte, 1994; Silva et al., 2006;
Stevenson, 2006). However, LUMS OR and the continuous release methods outperformed
periodic release in all our experiments. Thus, if the best solution for WLC in practice is to
be identi�ed, continuous or partially continuous release methods, such as LUMS OR, should
not be neglected.
∙ Dispatching should be the key decision level for short-term decision making: Short-term
decisions, such as how to accommodate set-up requirements, should be made at dispatching.
In all experiments (with the original or re�ned methods), the use of release methods combined
with set-up oriented dispatching rules outperformed the use of release methods combined
with non set-up oriented dispatching rules. Moreover, in our experiments we found that
considering set-up requirements at release was counterproductive for most release methods
regardless of the dispatching rule applied.
∙ Order release and dispatching should complement each other : Both the order release and
dispatching decision levels are important for maintaining control of an order from order
con�rmation to delivery. Within job shops, applying a dispatching rule such as the PST rules
137
always leads to an improvement in performance over simple FCFS dispatching. When the
selection rules employed at release and dispatching are in con�ict, performance deteriorates.
Therefore, it is important to have goal congruence at the di�erent decision levels.
In practice, it could be argued that companies should seek to reduce set-up times, e.g.,
through lean principles such as Single Minute Exchange of Die (SMED), rather than accommo-
dating them through PPC; however, if set-up cannot be avoided or the times reduced su�ciently
then the best way to accommodate them in job shops is at the level of the dispatching rule.
7.6 Conclusion
This study con�rms that WLC has overcome prior criticisms and represents an important PPC
solution for small & medium sized MTO companies where a job shop con�guration is commonplace.
It has considered how sequence dependent set-up times can best be handled within the design of
the WLC concept in job shops with sequence dependent set-up times, concluding that this can
best be achieved by e�ectively combining controlled order release and dispatching. In doing so, it
contributes to improving the applicability of the method towards implementation in practice.
In response to our �rst research question, it has been shown that an e�ective order release
method such as LUMS OR, which combines periodic and continuous release, can more than com-
pensate for any performance loss to the dispatching rule caused by restricting selection possibilities.
All important performance measures can be improved even in job shops with sequence dependent
set-up times; in general, it can be concluded that continuous release methods outperformed peri-
odic release. In answer to our second research question, it has been shown that re�ning release
methods to consider set-up times may be counterproductive - con�icting goals between the selec-
tion rules at release and dispatching can lead to jobs being released too early and having to wait
for long periods on the shop �oor. This may even lead to an increase in the total set-up time
incurred. Only in the case of SLAR did re�ning the method to accommodate set-up requirements
at release (SLAR*) lead to a performance improvement. Finally, in answer to our third research
question, LUMS OR was identi�ed as the best-performing release method in a job shop with
sequence dependent set-up times. It is therefore the method that should be implemented in this
context in practice.
Future research should investigate if the results presented in this paper hold if set-up times
are not distributed equally across job types and work centres.
8 Workload Control and Customer Enquiry Management:
The Key to Lead Time Control and Customer Service
in preparation
Matthias Thürer, Mark Stevenson, Cristovao Silva, Martin Land and Lawrence Fredendall
Abstract
Abstract Workload Control (WLC) is a unique and comprehensive Production Planning and Con-
trol (PPC) concept which allows lead times to be both short and reliable, thus improving customer
service. Its Customer Enquiry Management (CEM) methodology supports Due Date (DD) setting
while its order release mechanism determines when to start production so DDs can be met. In
high-variety Make-To-Order (MTO) contexts, the setting of short and reliable DDs is a complex
process of strategic importance but is unsupported by other PPC concepts. Although the poten-
tial of WLC as a comprehensive concept has been recognized since the beginning of the 1990s,
the majority of research has focused on order release (and subsequent shop �oor dispatching),
beginning with a pool of con�rmed orders and predetermined DDs. As a result, relatively little
is known about the contribution of CEM, in particular the DD setting rule, to the overall per-
formance of WLC; and, it remains unclear how WLC performs when control is exercised at both
CEM and order release. This paper assesses the performance of WLC DD setting rules and com-
bines DD setting with controlled order release to provide an overall evaluation of WLC. In doing
so, it considers two important factors so far neglected by research: (i) the strike rate; and, (i) the
mix of orders with DDs set internally (by the company) and externally (by customers). Results
demonstrate that e�ective PPC should start with CEM and the setting of feasible DDs. WLC DD
setting rules achieve an internal mean lateness close to zero and signi�cantly reduce the variance
of lateness compared to alternative rules presented in literature under all tested conditions. It
is also demonstrated that performance can be further improved by combining DD setting with
controlled order release. Therefore, for WLC to be most e�ective, it should be implemented as
a comprehensive concept which incorporates CEM and OR. Future research should focus on the
process of implementation in practice.
8.1 Introduction
This paper builds on three decades of research into the Workload Control (WLC) concept and
assesses its performance through simulation. In doing so, existing theory on WLC for Customer
Enquiry Management (CEM) and Order Release (OR) is consolidated into a Production Planning
and Control (PPC) concept which allows lead times to be both short and reliable, thus improving
customer service.
Calls have recently been made for a contingency-based approach to operations management
research (Sousa & Voss, 2008), including to PPC (Tenhiälä, 2010). For example, Tenhiälä (2010)
suggested that the successful implementation of a PPC concept is a�ected by its suitability to
a given production environment, arguing that there is a need to develop approaches that are
contingent on key company characteristics; these include production strategy and process type.
WLC is one such contingent approach, primarily designed for the Make-To-Order (MTO) sector
where job shop con�gurations are common and �rms are often small or medium sized enterprises
(Hendry & Kingsman, 1989; Zäpfel & Missbauer, 1993b; Stevenson et al., 2005). It supports the
simultaneous control of inventory, capacity and lead time bu�ers by integrating production and
sales into a hierarchical system of workloads (Tatsiopoulos & Kingsman, 1983; Kingsman et al.,
1989; Kingsman et al., 1993; Kingsman, 2000).
The hierarchy of workloads consists of: the shop �oor workload; the planned workload; and,
the total workload. The shop �oor workload, or Work-In-Process (WIP), is controlled through
order release, which decouples the shop �oor from any higher level planning using a pre-shop pool
of orders from which orders are released to meet DDs and maintain Work-In-Process (WIP) at a
stable level. The planned workload consists of all accepted orders, and therefore includes both the
shop �oor workload and the orders contained in the pre-shop pool. Finally, the total workload
consists of all accepted orders plus a percentage of customer enquiries based on order winning
history, referred to as the "strike rate". The planned and total workloads are controlled by CEM,
which supports the setting of Due Dates (DDs) and the analysis of strike rates.
In MTO companies, DD setting is a complex process of strategic importance (Kingsman et
al, 1989; Hopp & Sturgis, 2000; Stevenson et al., 2005) that must be undertaken for each order
individually as requirements can vary greatly from one job to the next. In such contexts, the
ability to quote competitive but realistic DDs is a key priority (see e.g. Bertrand, 1983b; Spearman
& Zhang, 1999). When a Request for Quotation (RFQ) is received from a prospective customer,
WLC determines the DD by matching required and available capacity over time, moulding the total
workload into a shape that can be produced pro�tably and on-time (Tatsiopoulos & Kingsman,
1983; Hendry et al., 1998; Kingsman, 2000). It is this explicit consideration of strike rates (i.e.,
the probability of winning the tender at a given price and lead time based on historical order-
winning data) which adds a strategic dimension to the process of quoting lead times (Duenyas
& Hopp, 1995; Kingsman & Mercer, 1997) and gives a company an edge over its competitors.
Melnyk et al. (1991) argued that the planned and total workloads play complementary roles in
protecting throughput against variance but they did not provide a practical tool which allows the
total workload to restrict and smooth the planned workload. Actively in�uencing the strike rate
by setting DDs in line with current capacity, as provided by the CEM stage of WLC allows this
to be achieved. Thus, WLC provides an e�ective means of protecting throughput from variance
and is consistent with our understanding of lean (which follows Hopp & Spearman, 2004).
Despite the potential of WLC as a comprehensive concept, research has failed to investigate
the performance of CEM and order release in combination. For example, most simulation research
begins with a pool of accepted orders, thereby restricting its focus to order release and subsequent
8. Workload Control and Customer Enquiry Management: The Key to Lead Time Control and Customer Service
shop �oor dispatching (e.g. Land & Gaalman, 1998; Fredendall et al., 2010; Thürer et al., 2010).
As a result, relatively little is known about the contribution of CEM and its DD setting rule to the
overall performance of WLC; and, it remains unclear how WLC performs when control is exercised
at both CEM and order release. More speci�cally, a performance comparison of alternative DD
setting methods presented in the WLC literature has not been undertaken and the in�uence of the
strike rate percentage on the performance of DD setting rules has not been assessed. Moreover,
PPC research in general has either assumed that all orders require a DD to be set by the company
as part of the tendering process or that all orders have a given DD speci�ed by the customer (e.g.
Cheng & Gupta, 1989; Ragatz & Mabert, 1984a; Kingsman, 2000). In contrast, we argue that a
mix of the two is more typical in practice: some customers will specify a DD or delivery lead time
while others will ask the prospective supplier to propose one.
This paper contributes towards the development of a comprehensive and e�ective PPC
solution for MTO companies by: (1) assessing the performance of WLC DD setting rules, to
identify the best-performing rule to be incorporated into the overall design of the concept; and
(2) evaluating the performance of WLC as a comprehensive concept, combining DD setting with
controlled order release. In doing so, two important factors are considered which, to best of our
knowledge, have not been addressed in the literature: (i) various combinations of the strike rate
percentage; and, (ii) the ratio between the number of orders requiring the quotation of a DD and
the number for which this is speci�ed by the customer.
The remainder of the paper is organized as follows. Section 8.2 reviews WLC research
into CEM, including work on strike rate analysis and DD setting, before the simulation model is
described in Section 8.3. Results are presented in Section 8.4 and �nal conclusions are drawn in
Section 8.5.
8.2 Literature Review
Despite the importance of CEM to MTO companies, research has mostly neglected this element
of the WLC concept. As a result, its true performance impact on the subsequent order release
and dispatching stages has not been assessed. Instead, most WLC research has focussed on
order release and dispatching, applying only simple DD setting rules (e.g., Ahmed & Fisher,
1992; Fredendall et al., 2010) or beginning with a given set of accepted jobs in the pool (e.g.,
Land & Gaalman, 1998; Thürer et al., 2010). The limited research which has been concerned
with the in�uence of CEM on the performance of order release has considered only simple load
smoothing procedures, setting DDs externally (e.g. Melnyk et al., 1991; Park & Salegna, 1995).
The only study which has considered all three control levels in tandem was conducted by Bertrand
(1983a). The author questioned controlled order release, arguing that it has no direct e�ect on
performance; however, Bertrand's conclusion needs revisiting in light of advances in WLC theory
which have since emerged. As the main focus of this study is on the CEM part of WLC, literature
on controlled order release is not reviewed - for this the reader is referred to Land & Gaalman
(1996a), Bergamaschi et al. (1997), and Fredendall et al. (2010).
141
According to Kingsman et al. (1989), CEM can be divided into the following two inter-
dependent parts which integrate production and sales, as reviewed in sections 8.2.1 and 8.2.2,
respectively before an overall assessment is made in Section 8.2.3:
∙ Strike rate analysis (see Section 8.2.1): using historical data, the probability of winning an
order at various prices and DDs is assessed.
∙ Aggregate production planning (see Section 8.2.2): DDs are determined; the feasibility of
alternative DDs is checked; and, capacity is planned and controlled over time.
8.2.1 Strike Rate Analysis
The limited WLC research into CEM has focused on one of three areas:
(i) Quoting lead times according to workload & capacity (e.g. Bertrand 1983a and 1983b);
(ii) Assessing whether orders should be accepted (Philipoom & Fry, 1992; Corti et al., 2006);
(iii) Adjusting capacity to aid order acceptance (e.g. Hendry & Kingsman, 1993; Hendry et al.,
1998).
While all three have been shown to positively impact overall performance individually, they
should be considered simultaneously - this can be achieved through strike rate analysis (Kingsman
et al., 1996; Kingsman & Mercer, 1997). In practice, most MTO companies do not reject the o�er
of an order from a prospective customer; instead, a longer DD or higher price may be quoted.
This, in turn, reduces the likelihood of winning the particular tender.
The WLC concept provides a simple tool for determining strike rates. To analyze a com-
pany's strike rate, the market in which it competes is �rst divided into segments or clusters with
similar order winning probabilities (Kingsman et al., 1996; Kingsman & Mercer, 1997). Segmen-
tation should consider, for example, the size of an order and the company's relationship with a
customer. Once the market segments have been de�ned, the strike rate for each segment can be
determined by applying a two-by-two matrix based on percentage mark-up vs. delivery lead time
(Kingsman et al., 1993). Percentage mark-up refers to the quotient of price and production costs
minus one; it is used instead of price to normalize all orders, thereby taking account of di�erent
market segments and job sizes. To illustrate this, a simple example of segmenting the market
(from Kingsman et al., 1996) and of the strike rate matrix (introduced by Kingsman et al., 1993)
is presented in Figure 30a & 30b, respectively.
Kingsman et al. (1996) identi�ed four market segments, each with a distinct strike rate
(SR): (1) orders with a quantity of one (no di�erence in the strike rate was found for orders with
a quantity of more than one); orders with a value of less than ¿2,000, which could be split into:
(2) orders with a low mark-up, and (3) orders with a high mark-up; and, �nally, (4) orders with
a value of more than �2,000, which showed no di�erence in the strike rate according to mark-up.
If a customer order in a given market segment with a certain mark-up (x) and delivery lead time
(y) is won, the cell (x,y) of the strike rate matrix is increased by one, so too are all cells with a
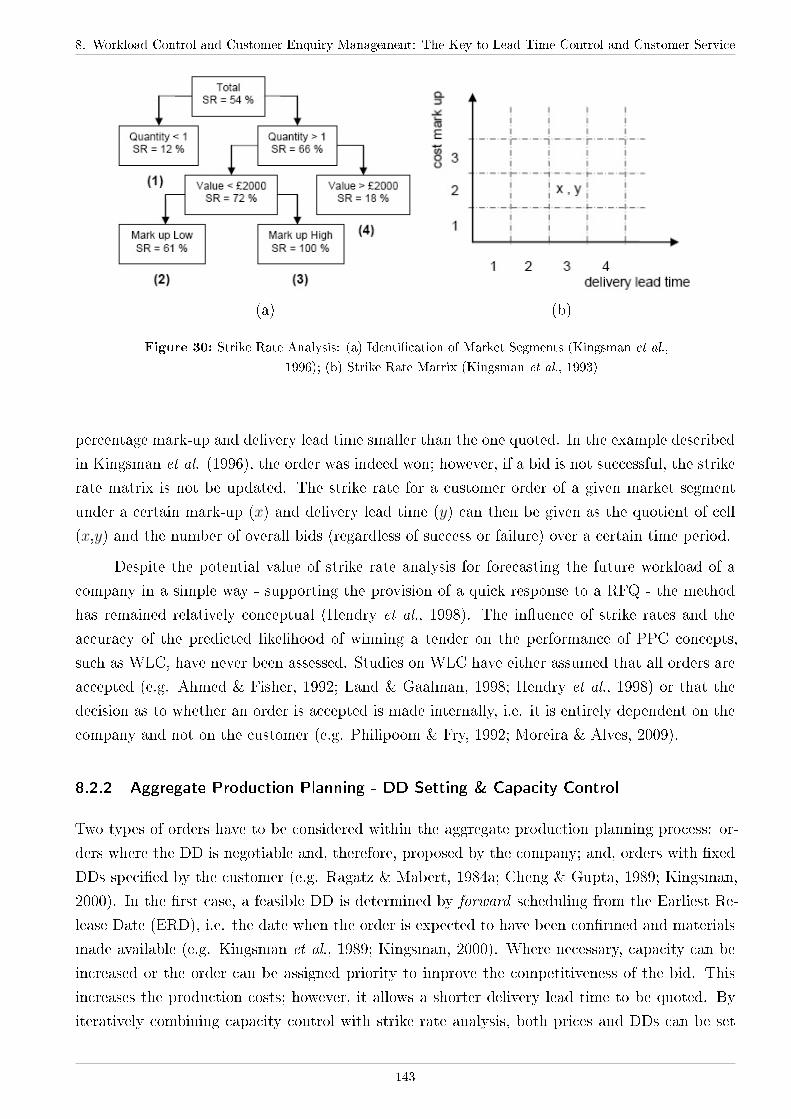
8. Workload Control and Customer Enquiry Management: The Key to Lead Time Control and Customer Service
(a) (b)
Figure 30: Strike Rate Analysis: (a) Identi�cation of Market Segments (Kingsman et al.,
1996); (b) Strike Rate Matrix (Kingsman et al., 1993)
percentage mark-up and delivery lead time smaller than the one quoted. In the example described
in Kingsman et al. (1996), the order was indeed won; however, if a bid is not successful, the strike
rate matrix is not be updated. The strike rate for a customer order of a given market segment
under a certain mark-up (x) and delivery lead time (y) can then be given as the quotient of cell
(x,y) and the number of overall bids (regardless of success or failure) over a certain time period.
Despite the potential value of strike rate analysis for forecasting the future workload of a
company in a simple way - supporting the provision of a quick response to a RFQ - the method
has remained relatively conceptual (Hendry et al., 1998). The in�uence of strike rates and the
accuracy of the predicted likelihood of winning a tender on the performance of PPC concepts,
such as WLC, have never been assessed. Studies on WLC have either assumed that all orders are
accepted (e.g. Ahmed & Fisher, 1992; Land & Gaalman, 1998; Hendry et al., 1998) or that the
decision as to whether an order is accepted is made internally, i.e. it is entirely dependent on the
company and not on the customer (e.g. Philipoom & Fry, 1992; Moreira & Alves, 2009).
8.2.2 Aggregate Production Planning - DD Setting & Capacity Control
Two types of orders have to be considered within the aggregate production planning process: or-
ders where the DD is negotiable and, therefore, proposed by the company; and, orders with �xed
DDs speci�ed by the customer (e.g. Ragatz & Mabert, 1984a; Cheng & Gupta, 1989; Kingsman,
2000). In the �rst case, a feasible DD is determined by forward scheduling from the Earliest Re-
lease Date (ERD), i.e. the date when the order is expected to have been con�rmed and materials
made available (e.g. Kingsman et al., 1989; Kingsman, 2000). Where necessary, capacity can be
increased or the order can be assigned priority to improve the competitiveness of the bid. This
increases the production costs; however, it allows a shorter delivery lead time to be quoted. By
iteratively combining capacity control with strike rate analysis, both prices and DDs can be set
143
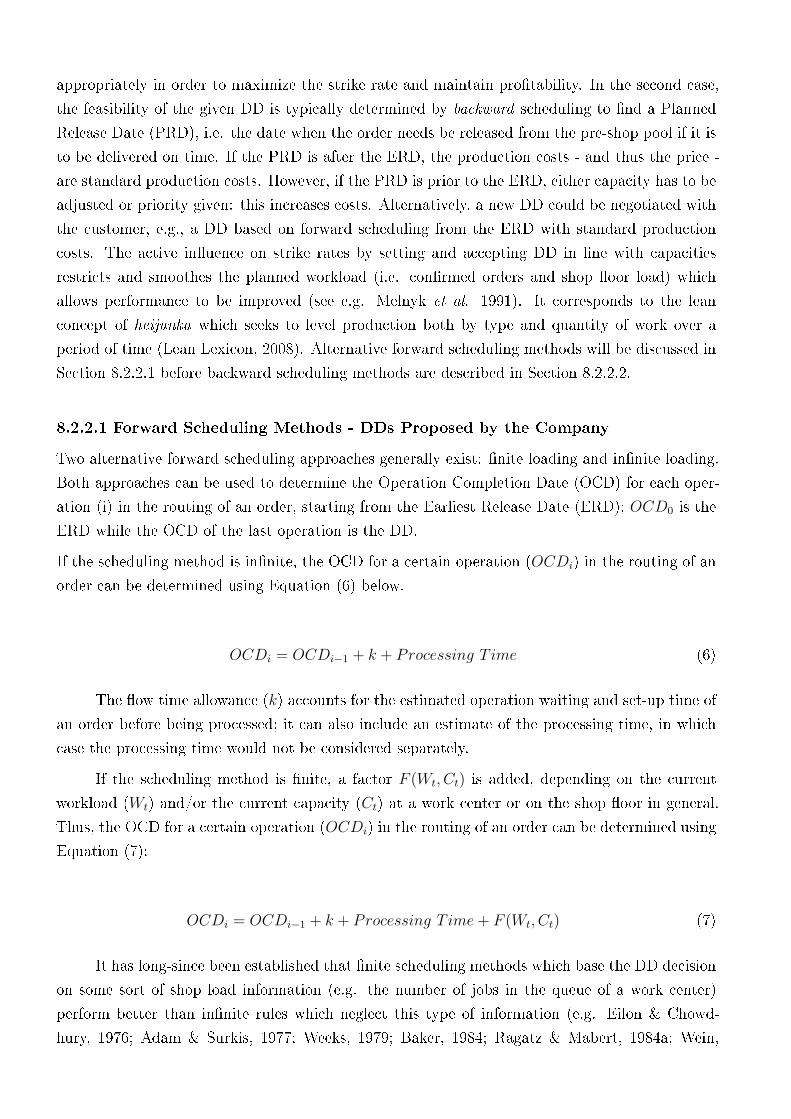
appropriately in order to maximize the strike rate and maintain pro�tability. In the second case,
the feasibility of the given DD is typically determined by backward scheduling to �nd a Planned
Release Date (PRD), i.e. the date when the order needs be released from the pre-shop pool if it is
to be delivered on time. If the PRD is after the ERD, the production costs - and thus the price -
are standard production costs. However, if the PRD is prior to the ERD, either capacity has to be
adjusted or priority given: this increases costs. Alternatively, a new DD could be negotiated with
the customer, e.g., a DD based on forward scheduling from the ERD with standard production
costs. The active in�uence on strike rates by setting and accepting DD in line with capacities
restricts and smoothes the planned workload (i.e. con�rmed orders and shop �oor load) which
allows performance to be improved (see e.g. Melnyk et al. 1991). It corresponds to the lean
concept of heijunka which seeks to level production both by type and quantity of work over a
period of time (Lean Lexicon, 2008). Alternative forward scheduling methods will be discussed in
Section 8.2.2.1 before backward scheduling methods are described in Section 8.2.2.2.
8.2.2.1 Forward Scheduling Methods - DDs Proposed by the Company
Two alternative forward scheduling approaches generally exist: �nite loading and in�nite loading.
Both approaches can be used to determine the Operation Completion Date (OCD) for each oper-
ation (i) in the routing of an order, starting from the Earliest Release Date (ERD); OCD0 is the
ERD while the OCD of the last operation is the DD.
If the scheduling method is in�nite, the OCD for a certain operation (OCDi) in the routing of an
order can be determined using Equation (6) below.
OCDi = OCDi−1 + k + Processing T ime (6)
The �ow time allowance (k) accounts for the estimated operation waiting and set-up time of
an order before being processed; it can also include an estimate of the processing time, in which
case the processing time would not be considered separately.
If the scheduling method is �nite, a factor F (Wt, Ct) is added, depending on the current
workload (Wt) and/or the current capacity (Ct) at a work center or on the shop �oor in general.
Thus, the OCD for a certain operation (OCDi) in the routing of an order can be determined using
Equation (7):
OCDi = OCDi−1 + k + Processing T ime+ F (Wt, Ct) (7)
It has long-since been established that �nite scheduling methods which base the DD decision
on some sort of shop load information (e.g. the number of jobs in the queue of a work center)
perform better than in�nite rules which neglect this type of information (e.g. Eilon & Chowd-
hury, 1976; Adam & Surkis, 1977; Weeks, 1979; Baker, 1984; Ragatz & Mabert, 1984a; Wein,
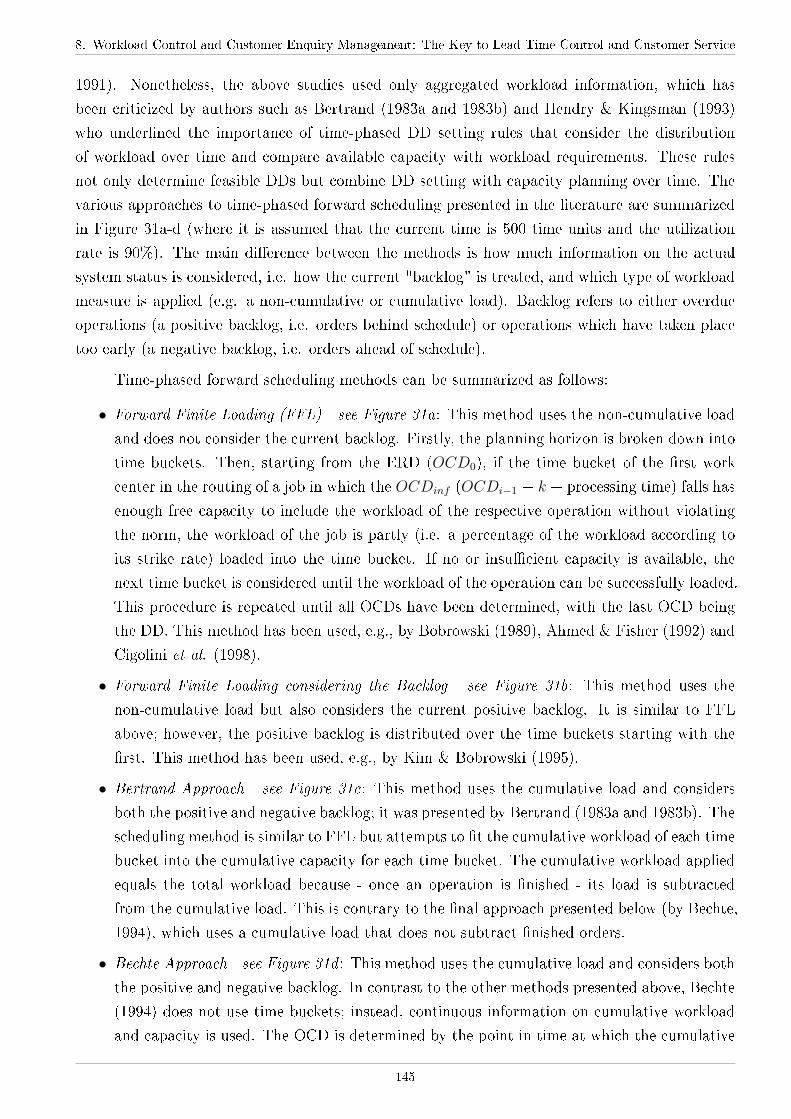
8. Workload Control and Customer Enquiry Management: The Key to Lead Time Control and Customer Service
1991). Nonetheless, the above studies used only aggregated workload information, which has
been criticized by authors such as Bertrand (1983a and 1983b) and Hendry & Kingsman (1993)
who underlined the importance of time-phased DD setting rules that consider the distribution
of workload over time and compare available capacity with workload requirements. These rules
not only determine feasible DDs but combine DD setting with capacity planning over time. The
various approaches to time-phased forward scheduling presented in the literature are summarized
in Figure 31a-d (where it is assumed that the current time is 500 time units and the utilization
rate is 90%). The main di�erence between the methods is how much information on the actual
system status is considered, i.e. how the current "backlog" is treated, and which type of workload
measure is applied (e.g. a non-cumulative or cumulative load). Backlog refers to either overdue
operations (a positive backlog, i.e. orders behind schedule) or operations which have taken place
too early (a negative backlog, i.e. orders ahead of schedule).
Time-phased forward scheduling methods can be summarized as follows:
∙ Forward Finite Loading (FFL) - see Figure 31a: This method uses the non-cumulative load
and does not consider the current backlog. Firstly, the planning horizon is broken down into
time buckets. Then, starting from the ERD (OCD0), if the time bucket of the �rst work
center in the routing of a job in which the OCDinf (OCDi−1 + k + processing time) falls has
enough free capacity to include the workload of the respective operation without violating
the norm, the workload of the job is partly (i.e. a percentage of the workload according to
its strike rate) loaded into the time bucket. If no or insu�cient capacity is available, the
next time bucket is considered until the workload of the operation can be successfully loaded.
This procedure is repeated until all OCDs have been determined, with the last OCD being
the DD. This method has been used, e.g., by Bobrowski (1989), Ahmed & Fisher (1992) and
Cigolini et al. (1998).
∙ Forward Finite Loading considering the Backlog - see Figure 31b: This method uses the
non-cumulative load but also considers the current positive backlog. It is similar to FFL
above; however, the positive backlog is distributed over the time buckets starting with the
�rst. This method has been used, e.g., by Kim & Bobrowski (1995).
∙ Bertrand Approach - see Figure 31c: This method uses the cumulative load and considers
both the positive and negative backlog; it was presented by Bertrand (1983a and 1983b). The
scheduling method is similar to FFL but attempts to �t the cumulative workload of each time
bucket into the cumulative capacity for each time bucket. The cumulative workload applied
equals the total workload because - once an operation is �nished - its load is subtracted
from the cumulative load. This is contrary to the �nal approach presented below (by Bechte,
1994), which uses a cumulative load that does not subtract �nished orders.
∙ Bechte Approach - see Figure 31d : This method uses the cumulative load and considers both
the positive and negative backlog. In contrast to the other methods presented above, Bechte
(1994) does not use time buckets; instead, continuous information on cumulative workload
and capacity is used. The OCD is determined by the point in time at which the cumulative
145
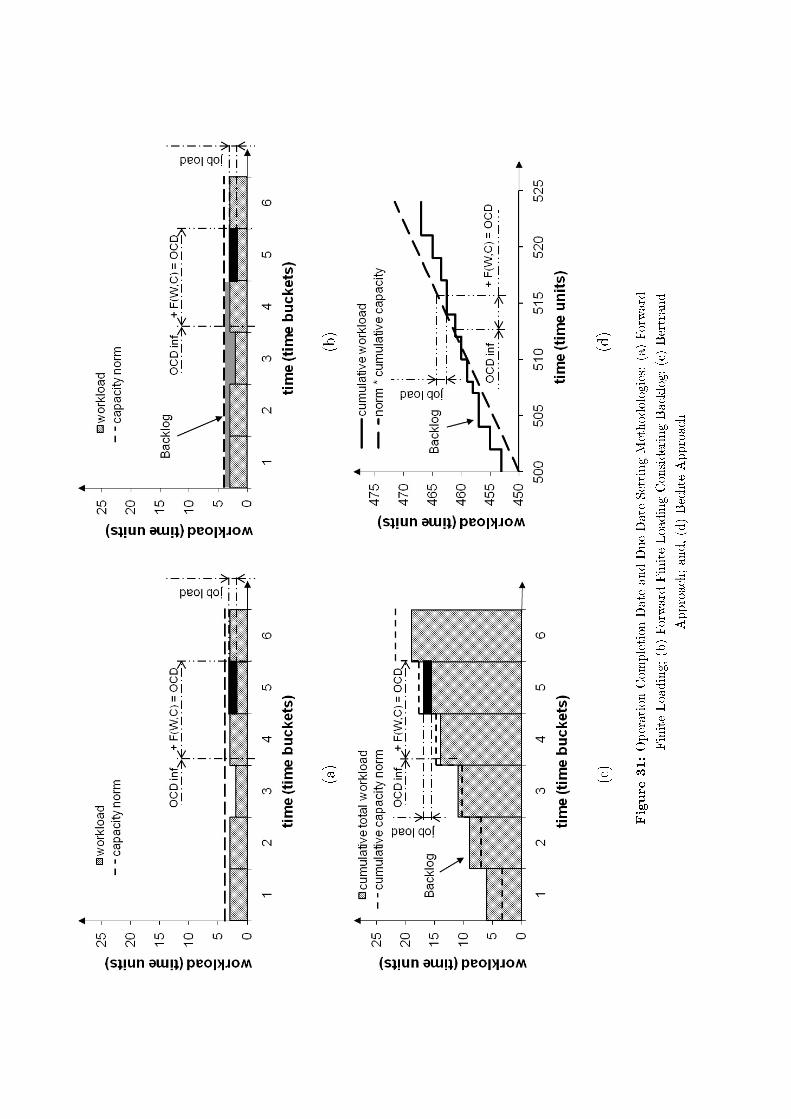
(a)
(b)
(c)
(d)
Figure31:OperationCompletionDate
andDueDate
SettingMethodologies:(a)Forward
FiniteLoading;(b)Forward
FiniteLoadingConsideringBacklog;(c)Bertrand
Approach;and,(d)Bechte
Approach
8. Workload Control and Customer Enquiry Management: The Key to Lead Time Control and Customer Service
workload plus the load of the new order �ts within the cumulative capacity. This cumulative
capacity is determined by the cumulative available capacity multiplied by a norm factor (to
account for the utilization rate) in order to estimate the capacity used. The intersection
point of the x and y axis is de�ned by the cumulative load that has been processed thus far.
This allows the backlog, given by the cumulative load minus the cumulative processed load,
to be considered.
Time-phased DD setting rules are an integral part of the WLC concept (Hendry & Kingsman,
1993; Bechte, 1994; Stevenson, 2006a) and are therefore de�ned in this study as "WLC DD setting
rules". As the standard deviation of lateness will never be zero, a lead time bu�er has to be added
to achieve a certain delivery performance (Bertrand 1983a and 1983b). Therefore, by de�nition,
WLC DD setting rules distinguish between an internal DD, which is determined by the DD setting
rule (the estimated lead time), and an external DD quoted to the customer (the delivery lead time),
which is given by the internal DD plus a lead time bu�er to account for the standard deviation
of lateness. For a discussion on the advantages of this approach to DD setting (distinguishing an
internal and external DD) compared to alternative approaches (e.g. assuming k to be a tightness
factor unrelated to actual lead times), see Enns (1995) and Hopp & Sturgis (2000).
Despite the availability of a broad set of WLC DD setting rules in the literature, the per-
formance of the rules under di�erent strike rate levels has not been assessed, nor have the rules
been compared to identify which performs the best. Therefore, it remains unclear which should
be incorporated within the design of a comprehensive WLC concept or implemented in practice.
Moreover, whereas Hendry & Kingsman (1993) and Bertrand (1983a,b) argue that time phased
DD setting rules outperform DD setting rules which consider only aggregate workload information,
this argument has never been proven and performance compared.
8.2.2.2 Backward Scheduling Methods - DDs Speci�ed by the Customer
Research on backward scheduling methods is scarce but two approaches can be identi�ed in the
literature: Backward In�nite Loading (BIL), which is similar to FIL; and, Backward Finite Loading
(BFL), which is similar to FFL (see Ragatz & Mabert, 1988).
For the case where applying backwards scheduling results in an overload (i.e. a PRD prior
to the ERD), three options have been presented in literature: adjust capacity (e.g. Hendry
& Kingsman 1993; Bechte, 1994; Wiendahl, 1995; Hendry et al., 1998); reject the order (e.g.
Kingsman et al., 1989; Hendry & Kingsman, 1993; Corti et al., 2006); and/or, change the DD by
reverting to forward rescheduling (e.g. Kingsman et al., 1989; Bechte, 1994; Park et al., 1999). All
of these approaches result in performance improvements; however, in practice, a DD often cannot
be renegotiated while it is also argued to be rare for a company to reject an order. Capacity
adjustment, despite being often costly, seems the only feasible solution in practice. Here, it is
argued that load balancing and the e�ective use of existing capacities, as supported by WLC DD
setting rules and controlled order release, is a better alternative.
147
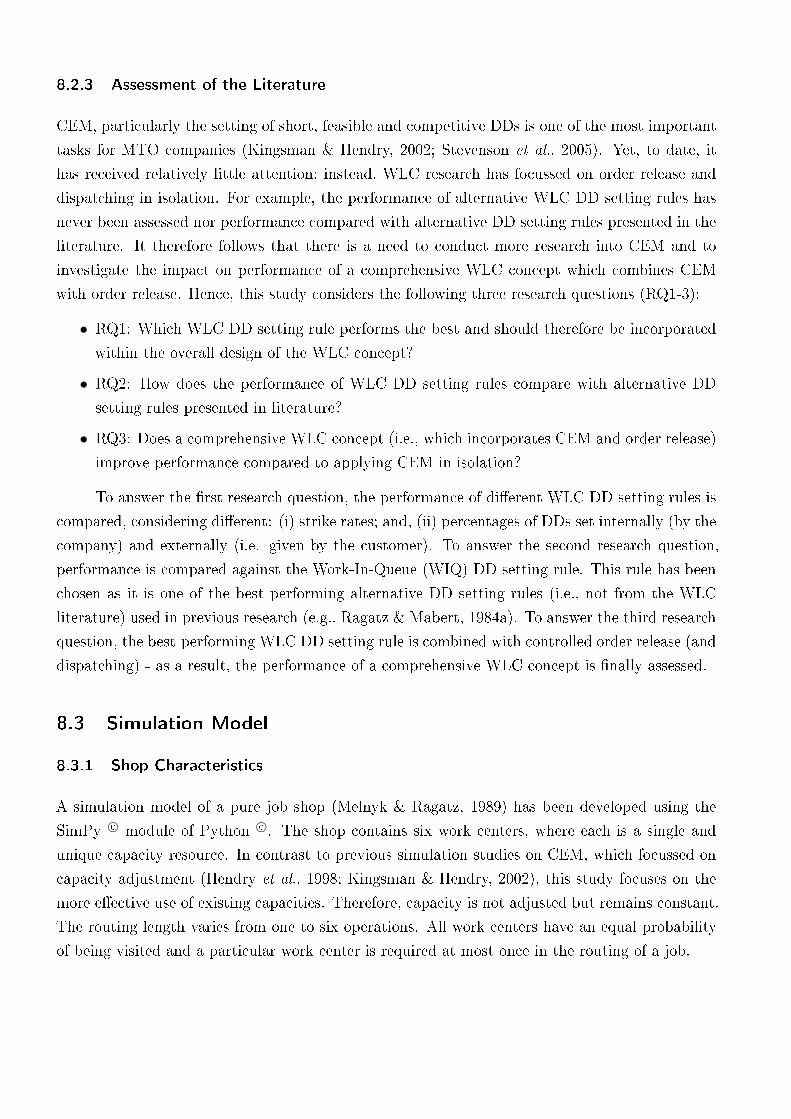
8.2.3 Assessment of the Literature
CEM, particularly the setting of short, feasible and competitive DDs is one of the most important
tasks for MTO companies (Kingsman & Hendry, 2002; Stevenson et al., 2005). Yet, to date, it
has received relatively little attention; instead, WLC research has focussed on order release and
dispatching in isolation. For example, the performance of alternative WLC DD setting rules has
never been assessed nor performance compared with alternative DD setting rules presented in the
literature. It therefore follows that there is a need to conduct more research into CEM and to
investigate the impact on performance of a comprehensive WLC concept which combines CEM
with order release. Hence, this study considers the following three research questions (RQ1-3):
∙ RQ1: Which WLC DD setting rule performs the best and should therefore be incorporated
within the overall design of the WLC concept?
∙ RQ2: How does the performance of WLC DD setting rules compare with alternative DD
setting rules presented in literature?
∙ RQ3: Does a comprehensive WLC concept (i.e., which incorporates CEM and order release)
improve performance compared to applying CEM in isolation?
To answer the �rst research question, the performance of di�erent WLC DD setting rules is
compared, considering di�erent: (i) strike rates; and, (ii) percentages of DDs set internally (by the
company) and externally (i.e. given by the customer). To answer the second research question,
performance is compared against the Work-In-Queue (WIQ) DD setting rule. This rule has been
chosen as it is one of the best performing alternative DD setting rules (i.e., not from the WLC
literature) used in previous research (e.g., Ragatz & Mabert, 1984a). To answer the third research
question, the best-performing WLC DD setting rule is combined with controlled order release (and
dispatching) - as a result, the performance of a comprehensive WLC concept is �nally assessed.
8.3 Simulation Model
8.3.1 Shop Characteristics
A simulation model of a pure job shop (Melnyk & Ragatz, 1989) has been developed using the
SimPy c⃝ module of Python c⃝. The shop contains six work centers, where each is a single and
unique capacity resource. In contrast to previous simulation studies on CEM, which focussed on
capacity adjustment (Hendry et al., 1998; Kingsman & Hendry, 2002), this study focuses on the
more e�ective use of existing capacities. Therefore, capacity is not adjusted but remains constant.
The routing length varies from one to six operations. All work centers have an equal probability
of being visited and a particular work center is required at most once in the routing of a job.
8. Workload Control and Customer Enquiry Management: The Key to Lead Time Control and Customer Service
8.3.2 Workload Control
8.3.2.1 Customer Enquiry Management
Strike Rate Analysis
This study does not simulate the strike rate analysis, it focuses on the in�uence that the strike
rate has on the performance of the WLC DD setting rule. Therefore, the estimated strike rate,
routing and operation processing time characteristics are known upon a customer RFQ. In a �rst
set of experiments, the strike rate is set to a value normally distributed (� = 0.1) with a mean
of 0.2, 0.4, 0.6, 0.8 and �nally constant 1 (i.e. where all orders are con�rmed by the customer).
While this set of experiments should provide a valuable insight into how the strike rate in�uences
the DD setting rule, it assumes that the estimated strike rate at CEM is equal to the realized
strike rate (i.e. the actual probability of acceptance). In practice, this is unlikely to be the case;
therefore, in a second set of experiments, the in�uence of inaccuracy in the strike rate estimates
on the performance of the DD setting rules is assessed. Two independent distributions for: (i) the
estimated strike rate; and, (ii) the realized strike rate, are applied, both normally distributed (�
= 0.2) with a mean of 0.5.
Due Date Setting
Four di�erent DD setting scenarios are simulated, where: (1) the DD is set for all orders (100%)
by the DD setting rule (i.e. all customers require the DD to be set); (2) 25% of the orders have
a DD given by the customer (set externally) and 75% of DDs are set by the DD setting rule; (3)
50% of orders have a DD given by the customer and 50% have a DD set by the rule; and (4) 75%
of orders have a DD given by the customer and 25% have a DD set by the rule. The following
outlines how DDs are determined in the case where they are proposed using the DD setting rule
and the case where they are speci�ed by the customer.
DDs Proposed by the DD Setting Rule
Where a DD is set by the DD setting rule, four WLC DD setting rules are applied (from
Section 8.2.2.1): Forward Finite Loading (FFL); Forward Finite Loading considering Backlog
(FFLBL); Bertrand's Approach (BdA); and, Bechte's Approach (BeA). In addition to the WLC
DD setting rules, FIL and the Work in Queue (WIQ) DD setting rule are applied (see Ragatz
& Mabert, 1984a). WIQ does not consider time phased workload information but estimates
F (Wt, Ct) according to the current workload in the queue of a work center.
The time buckets for FFL, FFLBL and BdA have been set to 4 time units (the maxi-
mum processing time). Preliminary simulation experiments indicated an average lead time across
scheduling methods of 28 time units. We assume an equal distribution of operation waiting times
across all work centers (pure job shop); resulting in an operation waiting time of 7 time units.
149
Therefore the �ow time allowance factor k is set as follows: for FIL to 7 time units, for WCL DD
setting rules to 4 and 5 time units, providing scope for the load and capacity-oriented parts of the
rules to take e�ect; and for WIQ do zero as F (Wt, Ct) estimates the operation waiting time.
We also distinguish between the internal and external DD (see Section 8.2.2.1); thus, the
quoted external DD (or delivery lead time) is given by the internal DD (or estimated lead time)
plus a lead time bu�er. The lead time bu�er is arbitrarily set to 10 time units, resulting in a
percentage tardy of approximately 20% under FIL and the immediate release of orders to the
shop �oor. It is kept constant in order to keep the model simple.
DDs Speci�ed by the Customer
Where a DD is speci�ed by the customer, the delivery lead time requested follows a normal
distribution (� = 10) with a mean of 40 time units (the expected delivery lead time for orders
with DDs set at 38 time units). Backward scheduling follows the Backward In�nite Loading (BIL)
method: only one backward scheduling methodology is applied to reduce the experimental factors;
BIL was chosen as it outperformed BFL in preliminary simulation experiments. The �ow time
allowance factor k for BIL is set to 4 time units, thus the resulting PRD for the majority of orders is
after the ERD. This value resulted in the best performance in preliminary simulation experiments.
If the PRD determined by BIL lies in the past, orders are prioritized at the subsequent control
levels: an automatic prioritization occurs by the OCD dispatching rule applied in this study (see
Section 8.3.2.3).
Finally, if controlled order release is applied, jobs are not released immediately; instead, they
are retained in a pre-shop pool. Thus, the pool time has to be considered (e.g. Bertrand 1983a).
We assume a pool waiting time of 8 time units (equivalent to two release periods; see Section 8.3.4
below), i.e. the WLC DD setting rule starts at the PRD which is given by the ERD plus 8 time
units if the DDs are determined by the DD setting rule. Therefore, in the experiments concerned
with assessing the performance of the WLC DD setting rule and controlled order release, the �ow
time allowance factor k is converted as follows: for FIL to 4 and 5; WLC DD setting rules to 2
and 3; and, for BIL to 3 time units.
8.3.2.2 Order Release
Once DDs and OCDs have been determined, orders wait an assumed customer con�rmation time
(quoting time) of 10 time units before order con�rmation/rejection is determined according to
the strike rate. The customer con�rmation time has been arbitrarily set and is kept constant
as it did not show to signi�cantly in�uence performance in simulation experiments conducted
preliminarily. If an order is con�rmed, its load is fully assigned to the planned workload. If an
order is rejected, its partial load contribution is subtracted from the total workload and the order
leaves the simulation. Like in all previous WLC simulations, it is assumed that materials are
available and orders proceed directly to be considered for release.

8. Workload Control and Customer Enquiry Management: The Key to Lead Time Control and Customer Service
Two sets of experiments are conducted. In the �rst, the performance of the DD setting
rule in isolation is assessed and orders are released immediately once con�rmed (IMM, Immediate
Release). In the second, the performance of the DD setting rule in conjunction with OR is assessed;
orders are not released immediately once con�rmed but proceed to the pre-shop pool from where
they are released according to LUMS COR - a corrected version of the LUMS Order Release (LUMS
OR) method (see e.g., Hendry & Kingsman, 1991a). This method has been chosen as it combines
the workload balancing of a periodic release method with the starvation avoidance of continuous
release. The original LUMS OR method incorporated the 'classical aggregate load approach' to
workload accounting over time. It has been replaced in this paper by the 'corrected aggregate
load approach', given its superior performance (e.g. Oosterman et al., 2000; Thürer et al., 2010a)
- the resulting corrected LUMS OR method is referred to as "LUMS COR". Con�rmed orders
enter the pre-shop pool from which they are released periodically every 4 time units according to
the following:
1. Jobs in the pool are sorted according to: routing length (number of operations in the routing
of an order); and, PRD (as determined by the DD setting rule). Jobs with long routings are
considered for release �rst.
2. Beginning with the job with the earliest PRD (in the set of jobs with the largest routing
length), the load of a job is contributed to the load of each work center in its routing.
The contributed load follows the corrected aggregate load approach introduced by Land &
Gaalman (1996b), i.e. the contributed load is divided by the position of a work center in
the routing of the job.
3. If one or more norms are violated, the job is retained in the pool until the next release date.
If norms are not violated, the job is released onto the shop �oor and its load assigned to the
load of the work centers in its routing.
4. Steps 2 and 3 are repeated until all jobs in the pool have been considered once.
In addition, if the load of any work center becomes zero, a job with that work center as the
�rst in its routing can be released at any moment in time. Thus, the job with the earliest PRD is
selected and its load assigned according to the corrected aggregate load approach.
8.3.2.3 Dispatching and Material Management
For WLC DD setting rules to be e�ective, the dispatching rule applied should be related to the
OCDs determined. This ensures that capacity control takes place, i.e. that capacity is used when
it was planned to be (see, e.g. Bertrand, 1983a). Therefore, dispatching is according to OCDs, i.e.
the job with the earliest planned operation completion date is chosen.
Figure 32 summarizes the structure of the WLC concept, which consists of the two levels of
control (CEM and OR) which integrate shop �oor dispatching and Material Management (MM).
Note that we do not consider MM or dispatching as control levels: they do not control (or re-
strict) the workload, they simply manage the existing workload. The corresponding hierarchy of
151
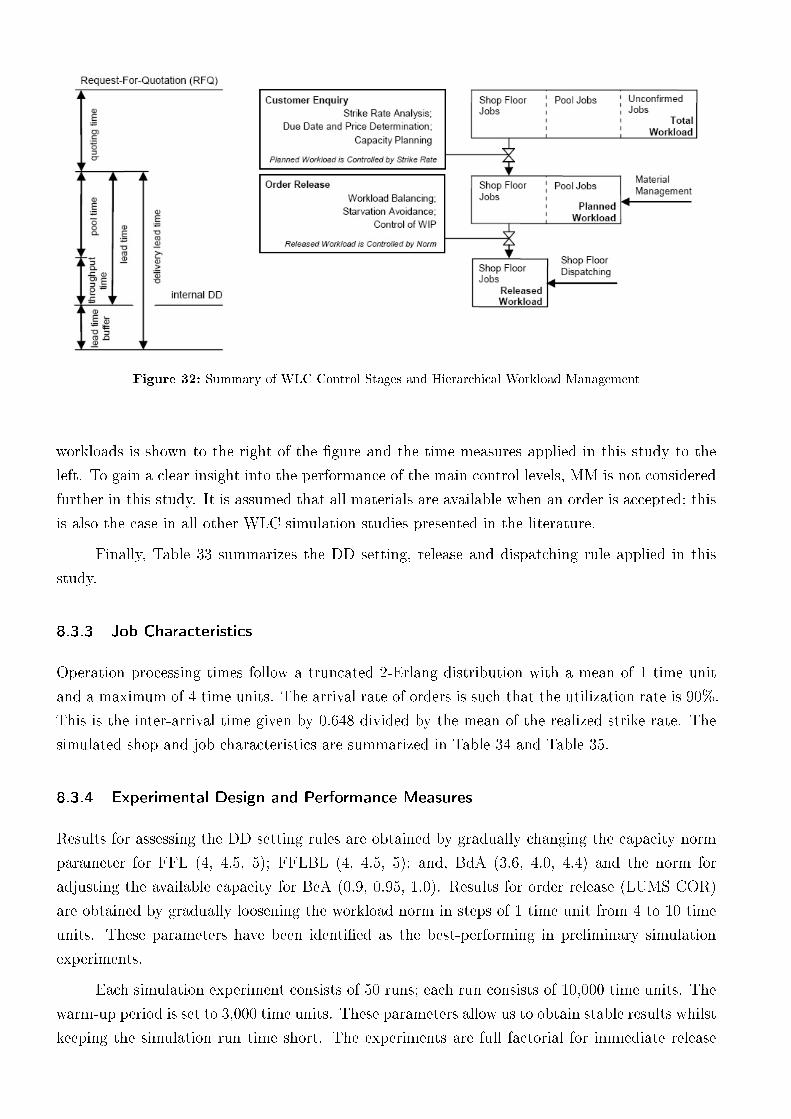
Figure 32: Summary of WLC Control Stages and Hierarchical Workload Management
workloads is shown to the right of the �gure and the time measures applied in this study to the
left. To gain a clear insight into the performance of the main control levels, MM is not considered
further in this study. It is assumed that all materials are available when an order is accepted; this
is also the case in all other WLC simulation studies presented in the literature.
Finally, Table 33 summarizes the DD setting, release and dispatching rule applied in this
study.
8.3.3 Job Characteristics
Operation processing times follow a truncated 2-Erlang distribution with a mean of 1 time unit
and a maximum of 4 time units. The arrival rate of orders is such that the utilization rate is 90%.
This is the inter-arrival time given by 0.648 divided by the mean of the realized strike rate. The
simulated shop and job characteristics are summarized in Table 34 and Table 35.
8.3.4 Experimental Design and Performance Measures
Results for assessing the DD setting rules are obtained by gradually changing the capacity norm
parameter for FFL (4, 4.5, 5); FFLBL (4, 4.5, 5); and, BdA (3.6, 4.0, 4.4) and the norm for
adjusting the available capacity for BeA (0.9, 0.95, 1.0). Results for order release (LUMS COR)
are obtained by gradually loosening the workload norm in steps of 1 time unit from 4 to 10 time
units. These parameters have been identi�ed as the best-performing in preliminary simulation
experiments.
Each simulation experiment consists of 50 runs; each run consists of 10,000 time units. The
warm-up period is set to 3,000 time units. These parameters allow us to obtain stable results whilst
keeping the simulation run time short. The experiments are full factorial for immediate release
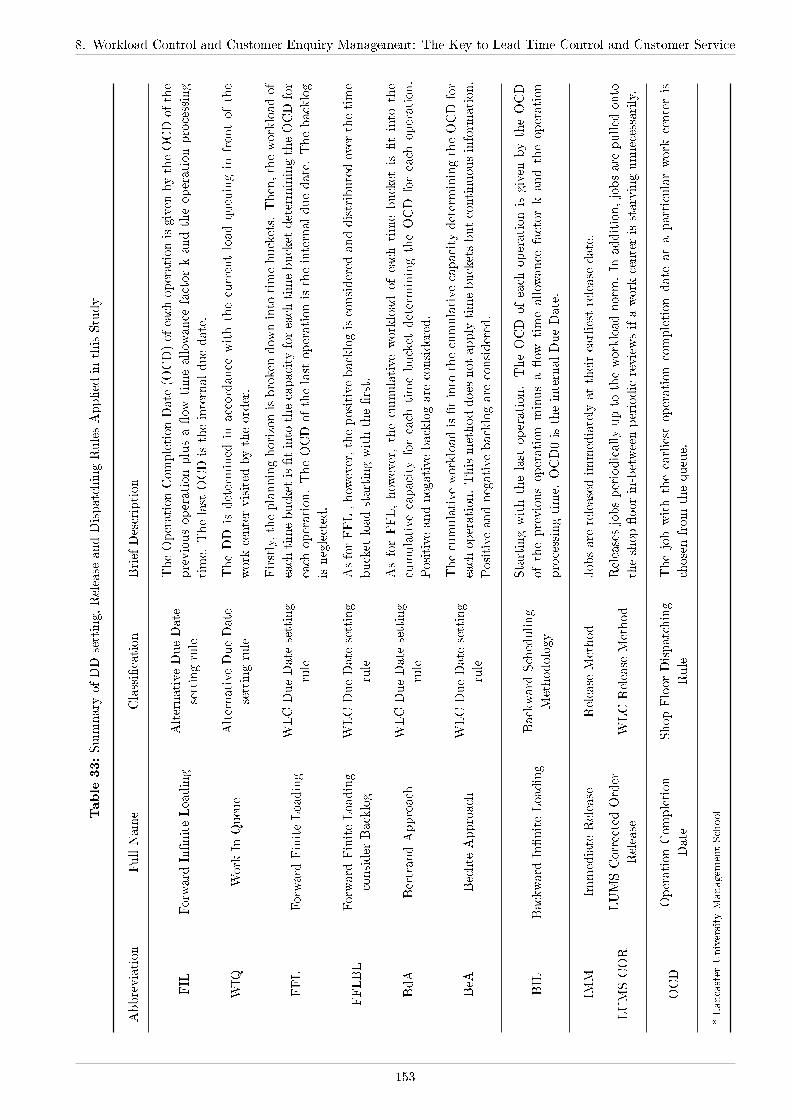
8. Workload Control and Customer Enquiry Management: The Key to Lead Time Control and Customer Service
Table
33:Summary
ofDDsetting,Release
andDispatchingRulesApplied
inthisStudy
Abbreviation
FullName
Classi�cation
BriefDescription
FIL
Forward
In�niteLoading
Alternative
DueDate
settingrule
TheOperationCompletionDate
(OCD)ofeach
operationisgiven
bytheOCDofthe
previousoperationplusa�ow
timeallow
ance
factorkandtheoperationprocessing
time.
ThelastOCDistheinternalduedate.
WIQ
Work
InQueue
Alternative
DueDate
settingrule
TheDD
isdetermined
inaccordance
withthecurrentloadqueuingin
frontofthe
work
centervisited
bytheorder.
FFL
ForwardFiniteLoading
WLCDueDate
setting
rule
Firstly,theplanninghorizonisbrokendow
ninto
timebuckets.Then,theworkloadof
each
timebucketis�tinto
thecapacity
foreach
timebucketdeterminingtheOCDfor
each
operation.TheOCDofthelastoperationistheinternalduedate.Thebacklog
isneglected.
FFLBL
Forward
FiniteLoading
consider
Backlog
WLCDueDate
setting
rule
AsforFFL,how
ever,thepositivebacklogisconsidered
anddistributedover
thetime
bucket
loadstartingwiththe�rst.
BdA
BertrandApproach
WLCDueDate
setting
rule
AsforFFL,how
ever,thecumulativeworkloadofeach
timebucket
is�tinto
the
cumulative
capacity
foreach
timebucket
determiningtheOCD
foreach
operation.
Positive
andnegative
backlogare
considered.
BeA
Bechte
Approach
WLCDueDate
setting
rule
Thecumulative
workloadis�tinto
thecumulative
capacitydeterminingtheOCDfor
each
operation.Thismethoddoes
notapplytimebucketsbutcontinuousinform
ation.
Positive
andnegative
backlogare
considered.
BIL
Backward
In�niteLoading
Backward
Scheduling
Methodology
Startingwiththelast
operation.TheOCD
ofeach
operationisgiven
bytheOCD
ofthepreviousoperationminusa�ow
timeallow
ance
factorkandtheoperation
processingtime.
OCD0istheinternalDueDate.
IMM
Immediate
Release
Release
Method
Jobsare
releasedimmediately
attheirearliestrelease
date.
LUMSCOR
LUMSCorrectedOrder
Release
WLCRelease
Method
Releasesjobsperiodicallyupto
theworkloadnorm
.In
addition,jobsare
pulled
onto
theshop�oorin-betweenperiodicreviewsifawork
centerisstarvingunnecessarily.
OCD
OperationCompletion
Date
ShopFloorDispatching
Rule
Thejobwiththeearliest
operationcompletiondate
ataparticularwork
centeris
chosenfrom
thequeue.
*Lancaster
University
Managem
entSchool
153
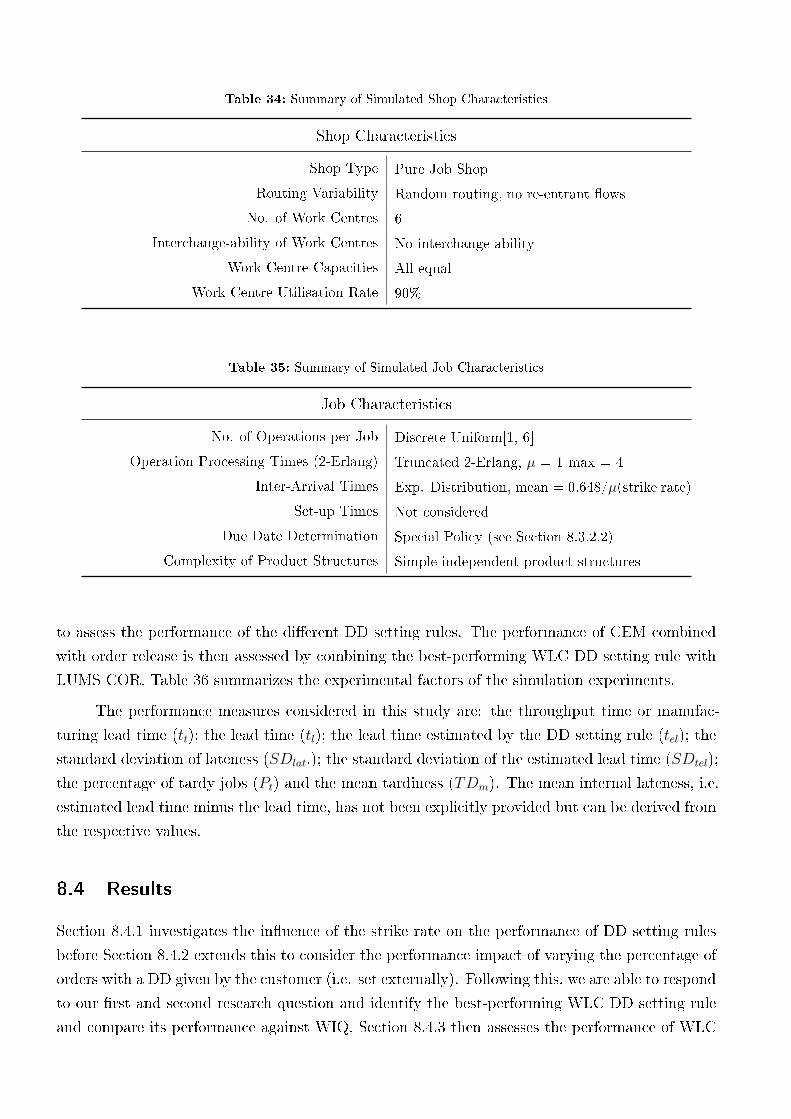
Table 34: Summary of Simulated Shop Characteristics
Shop Characteristics
Shop Type Pure Job Shop
Routing Variability Random routing, no re-entrant �ows
No. of Work Centres 6
Interchange-ability of Work Centres No interchange-ability
Work Centre Capacities All equal
Work Centre Utilisation Rate 90%
Table 35: Summary of Simulated Job Characteristics
Job Characteristics
No. of Operations per Job Discrete Uniform[1, 6]
Operation Processing Times (2-Erlang) Truncated 2-Erlang, � = 1 max = 4
Inter-Arrival Times Exp. Distribution, mean = 0.648/�(strike rate)
Set-up Times Not considered
Due Date Determination Special Policy (see Section 8.3.2.2)
Complexity of Product Structures Simple independent product structures
to assess the performance of the di�erent DD setting rules. The performance of CEM combined
with order release is then assessed by combining the best-performing WLC DD setting rule with
LUMS COR. Table 36 summarizes the experimental factors of the simulation experiments.
The performance measures considered in this study are: the throughput time or manufac-
turing lead time (tt); the lead time (tl); the lead time estimated by the DD setting rule (tel); the
standard deviation of lateness (SDlat.); the standard deviation of the estimated lead time (SDtel);
the percentage of tardy jobs (Pt) and the mean tardiness (TDm). The mean internal lateness, i.e.
estimated lead time minus the lead time, has not been explicitly provided but can be derived from
the respective values.
8.4 Results
Section 8.4.1 investigates the in�uence of the strike rate on the performance of DD setting rules
before Section 8.4.2 extends this to consider the performance impact of varying the percentage of
orders with a DD given by the customer (i.e. set externally). Following this, we are able to respond
to our �rst and second research question and identify the best-performing WLC DD setting rule
and compare its performance against WIQ. Section 8.4.3 then assesses the performance of WLC
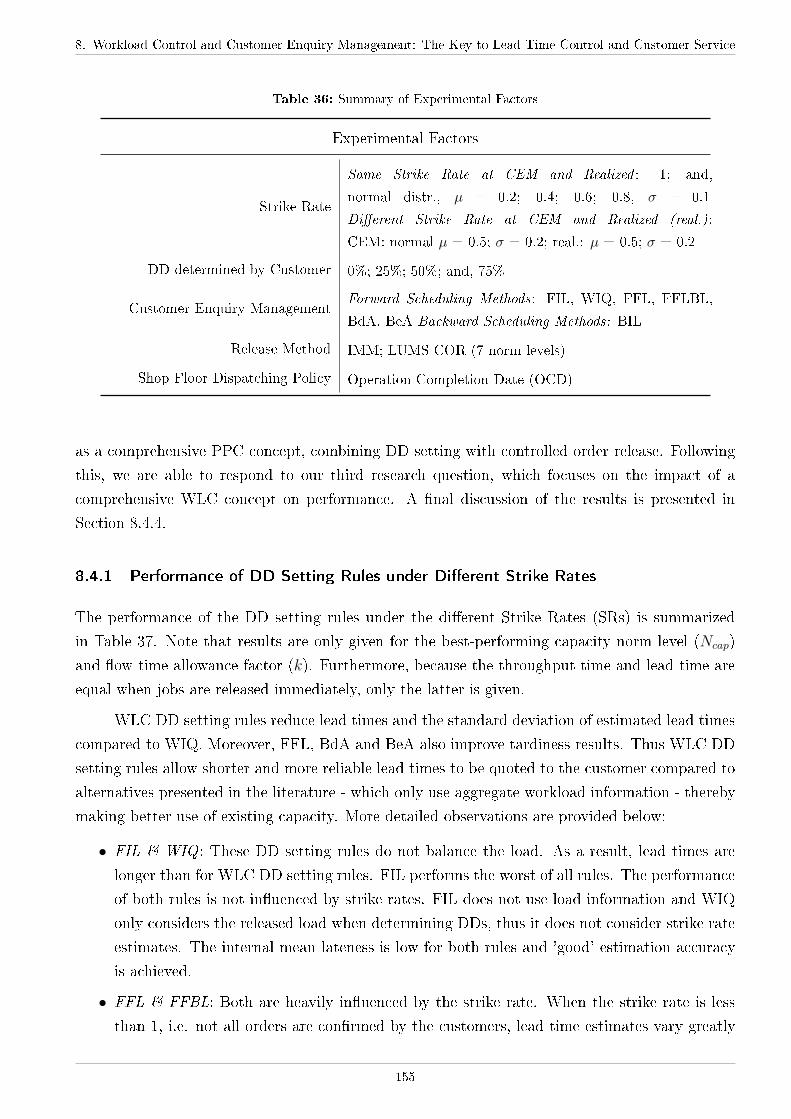
8. Workload Control and Customer Enquiry Management: The Key to Lead Time Control and Customer Service
Table 36: Summary of Experimental Factors
Experimental Factors
Strike Rate
Same Strike Rate at CEM and Realized : 1; and,
normal distr., � = 0.2; 0.4; 0.6; 0.8, � = 0.1
Di�erent Strike Rate at CEM and Realized (real.):
CEM: normal � = 0.5; � = 0.2; real.: � = 0.5; � = 0.2
DD determined by Customer 0%; 25%; 50%; and, 75%
Customer Enquiry ManagementForward Scheduling Methods: FIL, WIQ, FFL, FFLBL,
BdA, BeA Backward Scheduling Methods: BIL
Release Method IMM; LUMS COR (7 norm levels)
Shop Floor Dispatching Policy Operation Completion Date (OCD)
as a comprehensive PPC concept, combining DD setting with controlled order release. Following
this, we are able to respond to our third research question, which focuses on the impact of a
comprehensive WLC concept on performance. A �nal discussion of the results is presented in
Section 8.4.4.
8.4.1 Performance of DD Setting Rules under Di�erent Strike Rates
The performance of the DD setting rules under the di�erent Strike Rates (SRs) is summarized
in Table 37. Note that results are only given for the best-performing capacity norm level (Ncap)
and �ow time allowance factor (k). Furthermore, because the throughput time and lead time are
equal when jobs are released immediately, only the latter is given.
WLC DD setting rules reduce lead times and the standard deviation of estimated lead times
compared to WIQ. Moreover, FFL, BdA and BeA also improve tardiness results. Thus WLC DD
setting rules allow shorter and more reliable lead times to be quoted to the customer compared to
alternatives presented in the literature - which only use aggregate workload information - thereby
making better use of existing capacity. More detailed observations are provided below:
∙ FIL & WIQ : These DD setting rules do not balance the load. As a result, lead times are
longer than for WLC DD setting rules. FIL performs the worst of all rules. The performance
of both rules is not in�uenced by strike rates. FIL does not use load information and WIQ
only considers the released load when determining DDs, thus it does not consider strike rate
estimates. The internal mean lateness is low for both rules and 'good' estimation accuracy
is achieved.
∙ FFL & FFBL: Both are heavily in�uenced by the strike rate. When the strike rate is less
than 1, i.e. not all orders are con�rmed by the customers, lead time estimates vary greatly
155

Table 37: Performance Comparison of DD Setting Rules
DD Rule NCap k SR tl tel SDlat SDtel Pt Tdm
- 7 0.2 28.9 27.9 5.4 20.5 5% 0.1
- 7 0.4 28.3 27.3 5.3 20.5 5% 0.1
WIQ - 7 0.6 27.5 26.4 5.3 20.1 5% 0.1
- 7 0.8 27.3 26.3 5.3 19.8 4% 0.1
- 7 1 27.8 26.8 5.3 20.1 5% 0.1
- 7 0.5/0.5 28.0 26.9 5.3 20.5 5% 0.1
4 4 0.2 23.7 25.3 9.8 13.9 10% 1.0
4 4 0.4 23.2 27.0 8.6 14.6 6% 0.5
FFL 4.5 5 0.6 23.8 20.2 9.1 11.2 20% 1.6
4.5 5 0.8 23.3 21.7 8.4 12.0 14% 1.0
4.5 5 1 23.6 23.8 7.1 13.3 9% 0.6
4 4 0.5/0.5 22.9 26.9 8.6 14.3 6% 0.5
4 4 0.2 23.9 25.5 5.9 15.3 1% 0.0
4 4 0.4 23.3 26.0 5.6 15.4 1% 0.0
FFLBL 4.5 5 0.6 24.1 22.5 5.6 13.1 6% 0.1
4.5 5 0.8 23.7 23.2 5.5 13.4 4% 0.1
4.5 5 1 23.9 24.4 5.2 14.0 2% 0.0
4 4 0.5/0.5 23.3 26.1 5.5 15.4 1% 0.0
3.6 5 0.2 26.4 25.4 3.4 17.4 0% 0.0
3.6 5 0.4 25.9 25.1 3.2 17.4 0% 0.0
BdA 3.6 5 0.6 25.3 24.7 3.0 17.3 0% 0.0
3.6 5 0.8 25.1 24.6 2.8 17.1 0% 0.0
3.6 5 1 25.2 24.8 2.7 17.3 0% 0.0
3.6 5 0.5/0.5 25.7 24.9 3.2 17.5 0% 0.0
1.0 4 0.2 27.6 27.4 3.6 16.7 0% 0.0
1.0 4 0.4 27.1 27.1 3.4 16.5 0% 0.0
BeA 1.0 4 0.6 25.9 26.1 3.2 15.4 0% 0.0
1.0 4 0.8 25.6 26.0 3.1 15.6 0% 0.0
1.0 4 1 26.3 26.7 2.9 16.0 0% 0.0
1.0 4 0.5/0.5 26.5 26.6 3.4 16.2 0% 0.0
and the mean internal lateness is high. This is in line with the �ndings of Cigolini et al.
(1998) who criticized FFL for being very sensitive to variance. DD setting rules which
consider information on the current system status (i.e. the backlog) allow this variance to
be accommodated - this is demonstrated by the estimation accuracy of FFLBL for a strike
rate of 0.8. However, FFLBL only considers some information on the current system status
(the positive backlog), thus the estimation accuracy deteriorates when the strike rate is low
as the variance in the incoming order stream increases. In the case of inaccurate strike rate
estimates (SR = 0.5/0.5), both rules greatly overestimate lead times.
∙ BdA & BeA: These are the two best-performing rules in this study. The use of detailed
information on the status of the system when planning capacity over time (positive and
negative backlog) allows the incoming workload to be balanced and its variance to be accom-
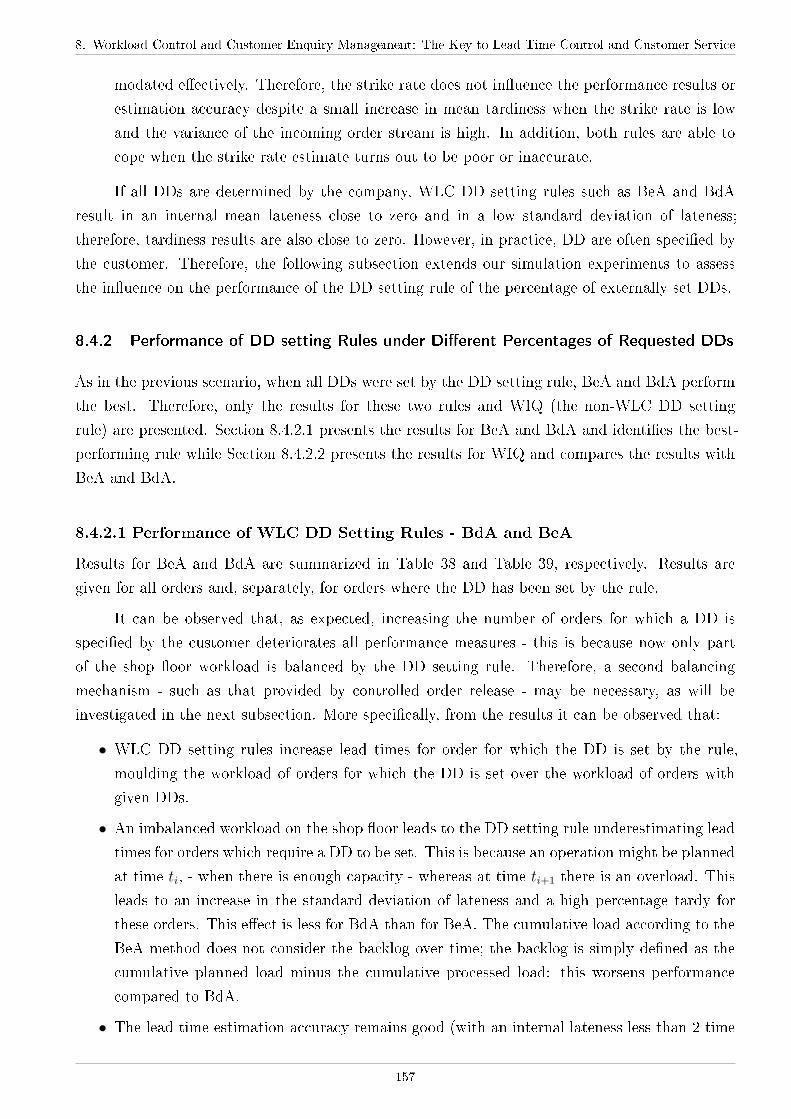
8. Workload Control and Customer Enquiry Management: The Key to Lead Time Control and Customer Service
modated e�ectively. Therefore, the strike rate does not in�uence the performance results or
estimation accuracy despite a small increase in mean tardiness when the strike rate is low
and the variance of the incoming order stream is high. In addition, both rules are able to
cope when the strike rate estimate turns out to be poor or inaccurate.
If all DDs are determined by the company, WLC DD setting rules such as BeA and BdA
result in an internal mean lateness close to zero and in a low standard deviation of lateness;
therefore, tardiness results are also close to zero. However, in practice, DD are often speci�ed by
the customer. Therefore, the following subsection extends our simulation experiments to assess
the in�uence on the performance of the DD setting rule of the percentage of externally set DDs.
8.4.2 Performance of DD setting Rules under Di�erent Percentages of Requested DDs
As in the previous scenario, when all DDs were set by the DD setting rule, BeA and BdA perform
the best. Therefore, only the results for these two rules and WIQ (the non-WLC DD setting
rule) are presented. Section 8.4.2.1 presents the results for BeA and BdA and identi�es the best-
performing rule while Section 8.4.2.2 presents the results for WIQ and compares the results with
BeA and BdA.
8.4.2.1 Performance of WLC DD Setting Rules - BdA and BeA
Results for BeA and BdA are summarized in Table 38 and Table 39, respectively. Results are
given for all orders and, separately, for orders where the DD has been set by the rule.
It can be observed that, as expected, increasing the number of orders for which a DD is
speci�ed by the customer deteriorates all performance measures - this is because now only part
of the shop �oor workload is balanced by the DD setting rule. Therefore, a second balancing
mechanism - such as that provided by controlled order release - may be necessary, as will be
investigated in the next subsection. More speci�cally, from the results it can be observed that:
∙ WLC DD setting rules increase lead times for order for which the DD is set by the rule,
moulding the workload of orders for which the DD is set over the workload of orders with
given DDs.
∙ An imbalanced workload on the shop �oor leads to the DD setting rule underestimating lead
times for orders which require a DD to be set. This is because an operation might be planned
at time ti, - when there is enough capacity - whereas at time ti+1 there is an overload. This
leads to an increase in the standard deviation of lateness and a high percentage tardy for
these orders. This e�ect is less for BdA than for BeA. The cumulative load according to the
BeA method does not consider the backlog over time; the backlog is simply de�ned as the
cumulative planned load minus the cumulative processed load: this worsens performance
compared to BdA.
∙ The lead time estimation accuracy remains good (with an internal lateness less than 2 time
157
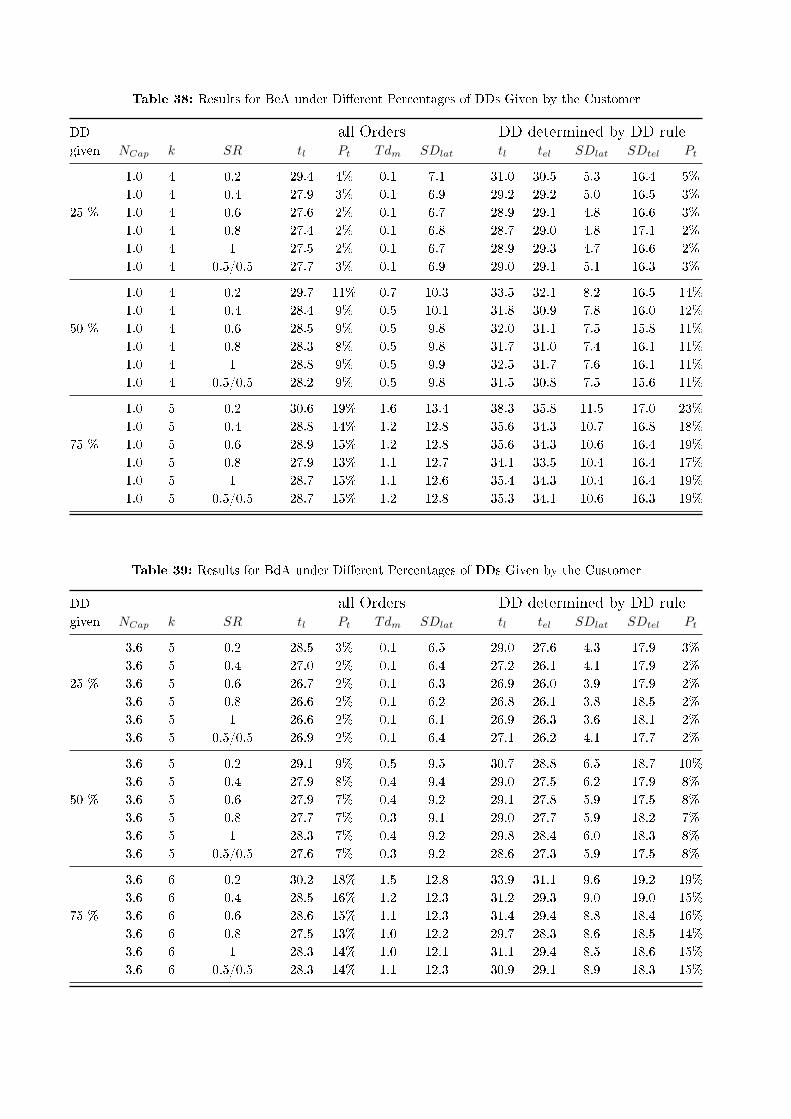
Table 38: Results for BeA under Di�erent Percentages of DDs Given by the Customer
DD all Orders DD determined by DD rulegiven NCap k SR tl Pt Tdm SDlat tl tel SDlat SDtel Pt
1.0 4 0.2 29.4 4% 0.1 7.1 31.0 30.5 5.3 16.4 5%
1.0 4 0.4 27.9 3% 0.1 6.9 29.2 29.2 5.0 16.5 3%
25 % 1.0 4 0.6 27.6 2% 0.1 6.7 28.9 29.1 4.8 16.6 3%
1.0 4 0.8 27.4 2% 0.1 6.8 28.7 29.0 4.8 17.1 2%
1.0 4 1 27.5 2% 0.1 6.7 28.9 29.3 4.7 16.6 2%
1.0 4 0.5/0.5 27.7 3% 0.1 6.9 29.0 29.1 5.1 16.3 3%
1.0 4 0.2 29.7 11% 0.7 10.3 33.5 32.1 8.2 16.5 14%
1.0 4 0.4 28.4 9% 0.5 10.1 31.8 30.9 7.8 16.0 12%
50 % 1.0 4 0.6 28.5 9% 0.5 9.8 32.0 31.1 7.5 15.8 11%
1.0 4 0.8 28.3 8% 0.5 9.8 31.7 31.0 7.4 16.1 11%
1.0 4 1 28.8 9% 0.5 9.9 32.5 31.7 7.6 16.1 11%
1.0 4 0.5/0.5 28.2 9% 0.5 9.8 31.5 30.8 7.5 15.6 11%
1.0 5 0.2 30.6 19% 1.6 13.4 38.3 35.8 11.5 17.0 23%
1.0 5 0.4 28.8 14% 1.2 12.8 35.6 34.3 10.7 16.8 18%
75 % 1.0 5 0.6 28.9 15% 1.2 12.8 35.6 34.3 10.6 16.4 19%
1.0 5 0.8 27.9 13% 1.1 12.7 34.1 33.5 10.4 16.4 17%
1.0 5 1 28.7 15% 1.1 12.6 35.4 34.3 10.4 16.4 19%
1.0 5 0.5/0.5 28.7 15% 1.2 12.8 35.3 34.1 10.6 16.3 19%
Table 39: Results for BdA under Di�erent Percentages of DDs Given by the Customer
DD all Orders DD determined by DD rulegiven NCap k SR tl Pt Tdm SDlat tl tel SDlat SDtel Pt
3.6 5 0.2 28.5 3% 0.1 6.5 29.0 27.6 4.3 17.9 3%
3.6 5 0.4 27.0 2% 0.1 6.4 27.2 26.1 4.1 17.9 2%
25 % 3.6 5 0.6 26.7 2% 0.1 6.3 26.9 26.0 3.9 17.9 2%
3.6 5 0.8 26.6 2% 0.1 6.2 26.8 26.1 3.8 18.5 2%
3.6 5 1 26.6 2% 0.1 6.1 26.9 26.3 3.6 18.1 2%
3.6 5 0.5/0.5 26.9 2% 0.1 6.4 27.1 26.2 4.1 17.7 2%
3.6 5 0.2 29.1 9% 0.5 9.5 30.7 28.8 6.5 18.7 10%
3.6 5 0.4 27.9 8% 0.4 9.4 29.0 27.5 6.2 17.9 8%
50 % 3.6 5 0.6 27.9 7% 0.4 9.2 29.1 27.8 5.9 17.5 8%
3.6 5 0.8 27.7 7% 0.3 9.1 29.0 27.7 5.9 18.2 7%
3.6 5 1 28.3 7% 0.4 9.2 29.8 28.4 6.0 18.3 8%
3.6 5 0.5/0.5 27.6 7% 0.3 9.2 28.6 27.3 5.9 17.5 8%
3.6 6 0.2 30.2 18% 1.5 12.8 33.9 31.1 9.6 19.2 19%
3.6 6 0.4 28.5 16% 1.2 12.3 31.2 29.3 9.0 19.0 15%
75 % 3.6 6 0.6 28.6 15% 1.1 12.3 31.4 29.4 8.8 18.4 16%
3.6 6 0.8 27.5 13% 1.0 12.2 29.7 28.3 8.6 18.5 14%
3.6 6 1 28.3 14% 1.0 12.1 31.1 29.4 8.5 18.6 15%
3.6 6 0.5/0.5 28.3 14% 1.1 12.3 30.9 29.1 8.9 18.3 15%

8. Workload Control and Customer Enquiry Management: The Key to Lead Time Control and Customer Service
units) for both rules, except when the strike rate percentage is very low.
In general, performance is improved for orders with DDs given by the customer at the ex-
pense of orders with DDs set by the rule. Overall, BdA is considered the best-performing WLC
DD setting rule as it achieves the best balance between the performance of orders with given DDs
and orders for which the DD is set. It presents a feasible alternative to adjusting capacity if the
requirements of orders with given DD have to be accommodated as argued above (Section 8.2.2.2).
8.4.2.2 The Performance of WLC DD Setting Rules vs. WIQ
Results obtained for WIQ are summarized in Table 40. Results are given for all orders and,
separately, for orders where the DD has been set by the rule.
Table 40: Results for WIQ under Di�erent Percentages of DDs Given by the Customer
DD all Orders DD determined by DD rulegiven SR tl Pt Tdm SDlat tl tel SDlat SDtel Pt
0.2 29.1 9% 0.4 7.9 30.3 27.5 6.0 20.1 11%
0.4 28.1 9% 0.3 7.9 29.0 26.5 6.0 19.9 11%
25 % 0.6 27.8 9% 0.3 7.9 28.7 26.2 6.0 19.8 10%
0.8 27.8 9% 0.4 8.0 28.6 26.1 6.1 20.2 10%
1 27.8 9% 0.3 7.9 28.7 26.2 5.9 19.8 10%
0.5/0.5 28.1 9% 0.3 7.9 29.0 26.5 6.0 19.6 10%
0.2 29.7 16% 1.0 10.7 32.0 27.5 7.8 20.4 21%
0.4 27.3 12% 0.8 10.6 28.7 25.2 7.4 19.1 17%
50 % 0.6 27.0 12% 0.6 10.2 28.2 24.8 6.9 18.3 16%
0.8 27.9 14% 0.8 10.5 29.6 25.8 7.4 19.3 18%
1 28.3 14% 0.8 10.4 30.0 26.1 7.4 19.4 18%
0.5/0.5 27.7 13% 0.7 10.3 29.1 25.5 7.2 18.9 17%
0.2 29.9 20% 1.8 13.5 33.3 27.3 9.8 20.3 27%
0.4 29.3 19% 1.7 13.4 32.4 26.7 9.6 20.0 26%
75 % 0.6 28.2 17% 1.4 13.1 30.5 25.4 9.2 19.1 24%
0.8 28.1 17% 1.4 13.0 30.5 25.5 9.1 19.1 24%
1 28.5 18% 1.4 12.9 31.1 25.9 9.1 19.1 25%
0.5/0.5 28.5 18% 1.4 13.0 31.0 25.9 9.1 19.2 25%
The lead time of orders for which the DD is set deteriorates compared to orders for which
the DD is speci�ed by the customer if the number of orders with given DD increases. On the
other hand, WIQ does not balance the load; instead, it estimates the load in accordance with
the shop �oor load. Thus the estimated lead time is not in�uenced if the number of orders with
given DD increases. As a result, this leads to a constant under estimation of lead times and poor
performance. The increase in lead time can be explained by the distribution of the estimated �ow
time allowance per operation (k + F (Wt, Ct)) of WIQ (see Figure 33a). More than 50% of orders
have a �ow time allowance of less than 4 time units, and more than 25% less than 1 time unit.
Orders for which the DD is speci�ed by the customer have a constant �ow time allowance of 4 time
159
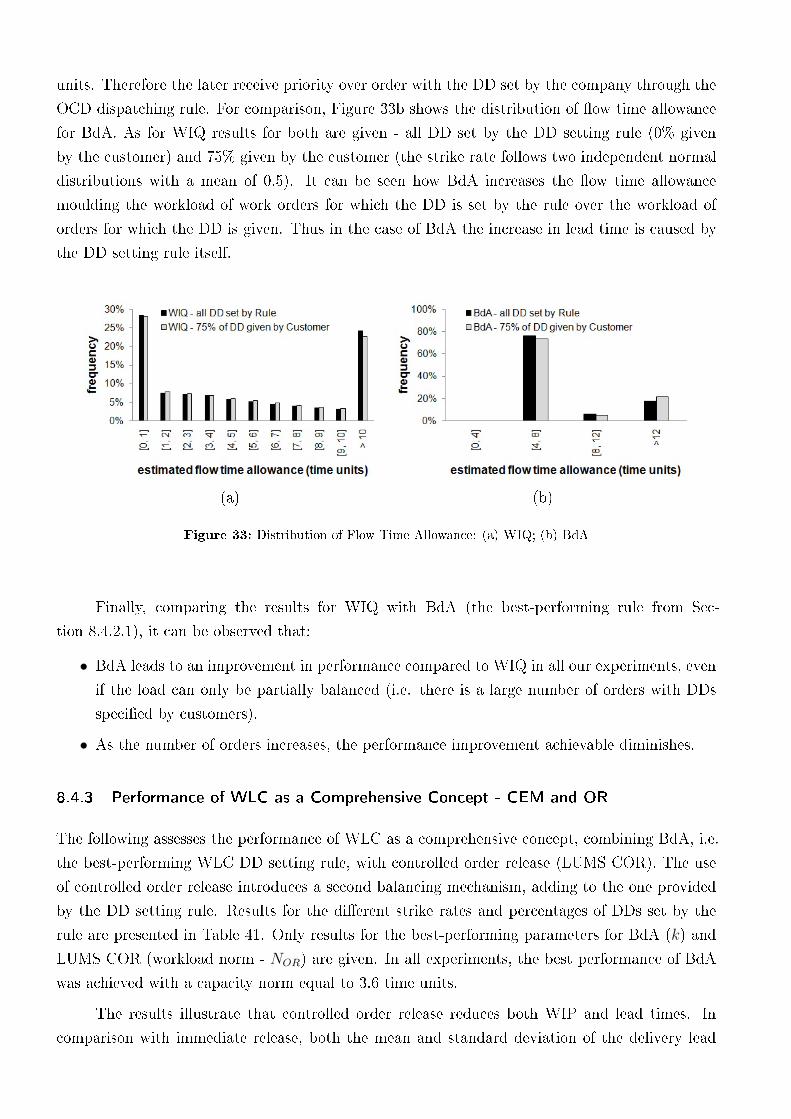
units. Therefore the later receive priority over order with the DD set by the company through the
OCD dispatching rule. For comparison, Figure 33b shows the distribution of �ow time allowance
for BdA. As for WIQ results for both are given - all DD set by the DD setting rule (0% given
by the customer) and 75% given by the customer (the strike rate follows two independent normal
distributions with a mean of 0.5). It can be seen how BdA increases the �ow time allowance
moulding the workload of work orders for which the DD is set by the rule over the workload of
orders for which the DD is given. Thus in the case of BdA the increase in lead time is caused by
the DD setting rule itself.
(a) (b)
Figure 33: Distribution of Flow Time Allowance: (a) WIQ; (b) BdA
Finally, comparing the results for WIQ with BdA (the best-performing rule from Sec-
tion 8.4.2.1), it can be observed that:
∙ BdA leads to an improvement in performance compared to WIQ in all our experiments, even
if the load can only be partially balanced (i.e. there is a large number of orders with DDs
speci�ed by customers).
∙ As the number of orders increases, the performance improvement achievable diminishes.
8.4.3 Performance of WLC as a Comprehensive Concept - CEM and OR
The following assesses the performance of WLC as a comprehensive concept, combining BdA, i.e.
the best-performing WLC DD setting rule, with controlled order release (LUMS COR). The use
of controlled order release introduces a second balancing mechanism, adding to the one provided
by the DD setting rule. Results for the di�erent strike rates and percentages of DDs set by the
rule are presented in Table 41. Only results for the best-performing parameters for BdA (k) and
LUMS COR (workload norm - NOR) are given. In all experiments, the best performance of BdA
was achieved with a capacity norm equal to 3.6 time units.
The results illustrate that controlled order release reduces both WIP and lead times. In
comparison with immediate release, both the mean and standard deviation of the delivery lead
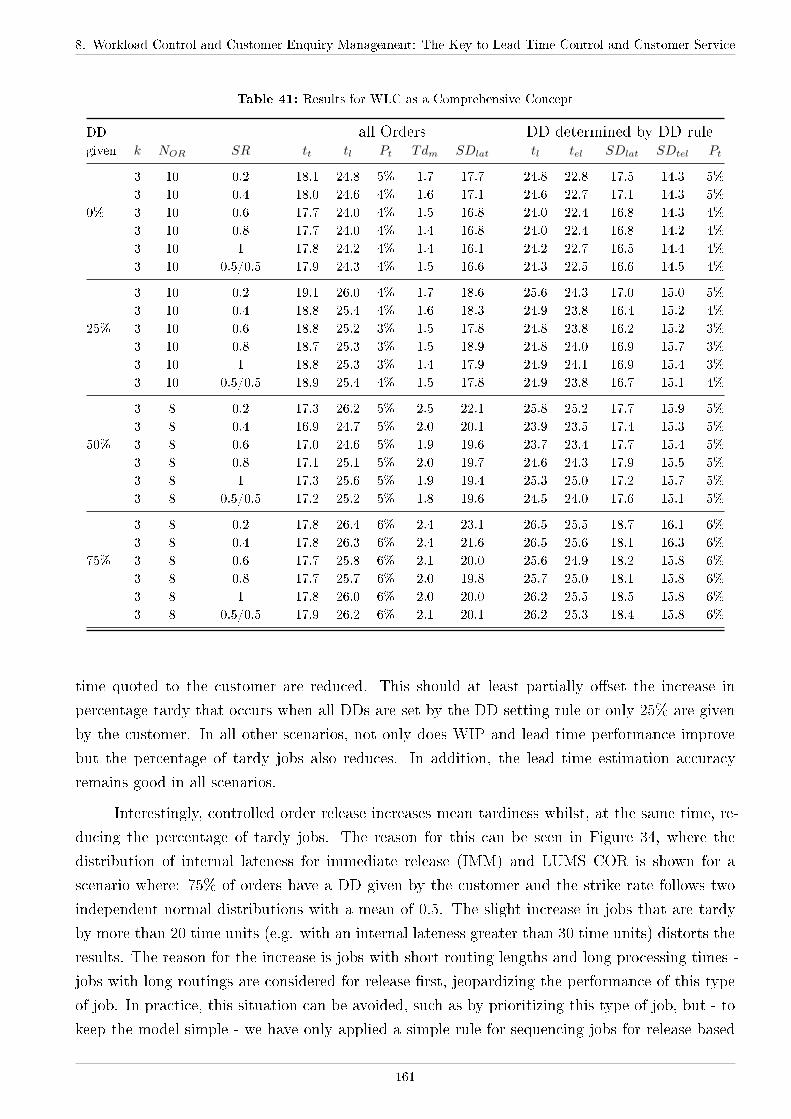
8. Workload Control and Customer Enquiry Management: The Key to Lead Time Control and Customer Service
Table 41: Results for WLC as a Comprehensive Concept
DD all Orders DD determined by DD rulegiven k NOR SR tt tl Pt Tdm SDlat tl tel SDlat SDtel Pt
3 10 0.2 18.1 24.8 5% 1.7 17.7 24.8 22.8 17.5 14.3 5%
3 10 0.4 18.0 24.6 4% 1.6 17.1 24.6 22.7 17.1 14.3 5%
0% 3 10 0.6 17.7 24.0 4% 1.5 16.8 24.0 22.4 16.8 14.3 4%
3 10 0.8 17.7 24.0 4% 1.4 16.8 24.0 22.4 16.8 14.2 4%
3 10 1 17.8 24.2 4% 1.4 16.1 24.2 22.7 16.5 14.4 4%
3 10 0.5/0.5 17.9 24.3 4% 1.5 16.6 24.3 22.5 16.6 14.5 4%
3 10 0.2 19.1 26.0 4% 1.7 18.6 25.6 24.3 17.0 15.0 5%
3 10 0.4 18.8 25.4 4% 1.6 18.3 24.9 23.8 16.4 15.2 4%
25% 3 10 0.6 18.8 25.2 3% 1.5 17.8 24.8 23.8 16.2 15.2 3%
3 10 0.8 18.7 25.3 3% 1.5 18.9 24.8 24.0 16.9 15.7 3%
3 10 1 18.8 25.3 3% 1.4 17.9 24.9 24.1 16.9 15.4 3%
3 10 0.5/0.5 18.9 25.4 4% 1.5 17.8 24.9 23.8 16.7 15.1 4%
3 8 0.2 17.3 26.2 5% 2.5 22.1 25.8 25.2 17.7 15.9 5%
3 8 0.4 16.9 24.7 5% 2.0 20.1 23.9 23.5 17.4 15.3 5%
50% 3 8 0.6 17.0 24.6 5% 1.9 19.6 23.7 23.4 17.7 15.4 5%
3 8 0.8 17.1 25.1 5% 2.0 19.7 24.6 24.3 17.9 15.5 5%
3 8 1 17.3 25.6 5% 1.9 19.4 25.3 25.0 17.2 15.7 5%
3 8 0.5/0.5 17.2 25.2 5% 1.8 19.6 24.5 24.0 17.6 15.1 5%
3 8 0.2 17.8 26.4 6% 2.4 23.1 26.5 25.5 18.7 16.1 6%
3 8 0.4 17.8 26.3 6% 2.4 21.6 26.5 25.6 18.1 16.3 6%
75% 3 8 0.6 17.7 25.8 6% 2.1 20.0 25.6 24.9 18.2 15.8 6%
3 8 0.8 17.7 25.7 6% 2.0 19.8 25.7 25.0 18.1 15.8 6%
3 8 1 17.8 26.0 6% 2.0 20.0 26.2 25.5 18.5 15.8 6%
3 8 0.5/0.5 17.9 26.2 6% 2.1 20.1 26.2 25.3 18.4 15.8 6%
time quoted to the customer are reduced. This should at least partially o�set the increase in
percentage tardy that occurs when all DDs are set by the DD setting rule or only 25% are given
by the customer. In all other scenarios, not only does WIP and lead time performance improve
but the percentage of tardy jobs also reduces. In addition, the lead time estimation accuracy
remains good in all scenarios.
Interestingly, controlled order release increases mean tardiness whilst, at the same time, re-
ducing the percentage of tardy jobs. The reason for this can be seen in Figure 34, where the
distribution of internal lateness for immediate release (IMM) and LUMS COR is shown for a
scenario where: 75% of orders have a DD given by the customer and the strike rate follows two
independent normal distributions with a mean of 0.5. The slight increase in jobs that are tardy
by more than 20 time units (e.g. with an internal lateness greater than 30 time units) distorts the
results. The reason for the increase is jobs with short routing lengths and long processing times -
jobs with long routings are considered for release �rst, jeopardizing the performance of this type
of job. In practice, this situation can be avoided, such as by prioritizing this type of job, but - to
keep the model simple - we have only applied a simple rule for sequencing jobs for release based
161

on two factors: routing length and PRD.
Figure 34: Distribution of Internal Lateness
Another important �nding which can be derived from Figure 34 is that lateness does not
follow a normal distribution when order release is controlled. This is due to a shift in distribution
for throughput time and lead time. The distribution of the set DDs remains normal distributed
(these distributions are not shown here due to space restrictions). The shift in lateness distribution
explains the high standard deviation of lateness observed and restricts the applicability of the
dynamic lead time bu�er proposed by Enns (1995) and Hopp & Sturgis (2000). In both papers it
was assumed that lateness follows a normal distribution. With regards to combining a WLC DD
setting rule with controlled order release, the following can be derived from the results:
∙ CEM should be the main control level if the majority of DDs are set by the DD setting
rule. Controlled order release can still be used to reduce WIP and lead times, but its
in�uence should be restricted by applying a high norm level - otherwise, tardiness results
will deteriorate.
∙ In all other cases, controlled order release not only reduces the level of WIP and lead times
but it also allows the percentage of tardy jobs to be reduced (when compared to a WLC
DD setting rule and priority dispatching in isolation). This is especially evident when the
percentage of orders with DDs given by the customer is high.
8.4.4 Discussion of Results
BdA has been identi�ed as the best-performing DD setting rule in this study. The tardiness results
for this rule approach zero when it determines all DDs. It also improves performance compared to
WIQ if the customer provides a part of the DDs, i.e. if only part of the workload is controlled by
the rule. However, the performance of the two rules (BdA and WIQ) converges as the percentage
of orders with a given DD increases. Performance can be further improved when order release
8. Workload Control and Customer Enquiry Management: The Key to Lead Time Control and Customer Service
is also controlled, and this is especially evident when the percentage of orders for which the DD
is speci�ed by the customer is high. Hence, the results extend those obtained by Melnyk et al.
(1991) and underline the potential of WLC as a comprehensive concept which integrates CEM
with OR to control the production process from a customer request through to delivery of the
�nished product.
The strike rate percentage was shown to have little in�uence on performance and on the
accuracy of lead time estimates if an e�ective WLC DD setting rule is in place. For example,
the internal lateness for BdA is less than two time units in all experiments. This �nding is also
valid when uncertainty is introduced to the strike rate estimates as BdA allows this variance to
be accommodated. Thus, complex forecasting algorithms for analysing the strike rate are not
necessary; simple tools - as provided by WLC - can be used instead. Moreover, untimely feedback,
e.g. by sales agents reluctant to do paperwork, can also be accommodated.
8.5 Conclusion
The �ndings of this paper demonstrate that e�ective production planning and control starts with
Customer Enquiry Management CEM and continues right through to delivery. Workload Control
(WLC) represents an appropriate solution for managing this entire process for the complex scenario
of Make-To-Order (MTO) production which allows lead times to be both short and reliable, thus
improving customer service. In response to our �rst research question, the Bertrand Approach
(BdA) has been identi�ed as the best-performing WLC due date setting rule under all experimental
settings. Thus, this rule can be robustly incorporated into the overall design of the WLC concept.
In response to our second research question, it has been shown that WLC DD setting rules
outperform alternative rules presented in the literature. More speci�cally, results support the
argument by Hendry & Kingsman (1993) and Bertrand (1983a and 1983b) that time-phased
scheduling rules outperform rules which only use some kind of aggregate workload information. In
answer to our third research question, it has been demonstrated that performance can be further
improved by combining due date setting with controlled order release. As may be expected,
the importance of order release control increases when the proportion of orders with due dates
proposed by the customer is high. Overall, the results support the argument that, for WLC to
be fully e�ective, it should be implemented as a comprehensive concept which incorporates CEM
and OR.
8.5.1 Practical Implications
By controlling workloads and improving reliability, Workload Control represents an e�ective means
of achieving lean and improving customer service in make-to-order companies. Authors such as
Hopp & Spearman (2004) have de�ned lean as an approach which bu�ers throughput against
variance at the minimum bu�ering cost. In this study, all performance improvements achieved
by WLC (when compared to WIQ) are achieved with a �xed capacity and without increasing
163
the delivery lead time quoted to the customer. Thus, improvements can be made through more
e�ective use of existing capacity, i.e. without introducing additional costs; moreover, WIP - and
thus in-process inventory - is reduced. Thus, WLC supports the improvement of production
e�ciency by:
∙ Reducing and stabilizing lead times;
∙ Reducing the level of WIP;
∙ Reducing the percentage of tardy jobs.
This study provides the basis for the use of WLC in practice. Managers seeking to adopt
WLC should incorporate a WLC DD setting rule - such as BdA - especially if they have control
over the DDs proposed to customers. In addition, they should complement this with an e�ective
order release mechanism - such as LUMS COR - especially when a signi�cant proportion of due
dates are speci�ed by customers.
8.5.2 Future Research Implications
The most important implications for future research from the �ndings of this paper can be sum-
marized as follows:
∙ Conceptual Research: This study applied an explicit lead time bu�er but researchers have
di�ering views on what is meant by a "lead time bu�er". The same is true for the other
two bu�er types - capacity and inventory. Research is necessary to lay the conceptual
foundations for understanding where the bu�ers are positioned, and how they interrelate to
create a common base for the use of terms and understanding. This base should be easily
understood by practitioners given the importance of these bu�ers to e�ective shop �oor
control (see, e.g., Hopp & Spearman, 2004)
∙ Simulation-based Research: Building on this study, further practical constraints should be in-
troduced into simulation work. For example, future work could address the main limitations
of this paper: that capacity is kept constant and it is assumed all materials are available.
This could include investigating the impact on performance of: variations in capacity (e.g.
caused by machine breakdowns and workers being unavailable); and, variations in supply
(e.g., caused by late purchasing ordering or vendor delivery).
∙ Analytical Research: The standard deviation of lateness is widely used in order to derive
the percentage tardy from lead times and DDs. However, most studies assume a normal
distribution whereas it was shown in this paper that this distribution is not always the case.
Thus, further research is required to understand what in�uences the distribution of lateness.
∙ Empirical Research: The most important challenge for future research, however, is achieving
a successful implementation of a comprehensive version of the WLC concept in practice.
9 The Application of Workload Control in Assembly Job
Shops: An Assessment by Simulation
Submitted to International Journal of Production Research
Matthias Thürer, Mark Stevenson, Cristovao Silva and George Huang
Abstract
Abstract Workload Control (WLC) is a production planning and control concept developed to meet
the needs of small-and-medium sized make-to-order companies, where a job shop con�guration is
common. Although simulation has shown it can improve job shop performance, �eld researchers
have encountered signi�cant implementation challenges. One of the most notable challenges is
the presence of "assembly job shops" where product structures are more complex than typically
modelled in simulation and where the �nal product consists of several subassemblies (or work
orders) which have to be co-ordinated. WLC theory has not been developed su�ciently to handle
such contexts, and the available literature on assembly job shops is limited. In response, this paper
extends the applicability of WLC to assembly job shops by determining the best combination of
WLC Due Date (DD) setting policy, release method, and policy for coordinating the progress of
work orders. Findings suggest that when DDs are predominantly set by the company: the DD
setting policy should play the leading role while the role of order release should be limited; and, the
progress of work orders should not be co-ordinated in accordance with the DD of the �nal product.
Alternatively, if DDs are predominantly speci�ed by customers: the importance of order release
as a second workload balancing mechanism increases; and, work orders should be coordinated by
backward scheduling from the DD of the �nal product. Results indicate that WLC can improve
performance in assembly job shops and outperform alternative control policies. Future research
should implement these �ndings in practice.
9.1 Introduction
This study uses simulation to assess the performance of the Workload Control (WLC) concept -
designed to meet the needs of small and medium sized Make-TO-Order (MTO) companies - in as-
sembly job shops. WLC integrates production and sales into a three-tiered hierarchy of workloads
(Tatsiopoulos & Kingsman, 1983), consisting of: the current shop �oor workload (Work-In-Process:
WIP); the planned workload (all accepted orders); and, the total workload (the accepted load plus
a percentage of customer enquiries based on order winning history). The lowest level is controlled
through an order release method which decouples the shop �oor from a pre-shop pool of orders. Or-
ders are released onto the shop �oor in time to meet Due Dates (DDs) whilst keeping the workload
on the shop �oor within limits or norms. The planned and total workloads are controlled through
Customer Enquiry Management (CEM), which matches required and available capacity over time
and controls delivery lead times by moulding the order book into a shape that can be produced
pro�tably and on-time (Tatsiopoulos & Kingsman, 1983; Kingsman et al., 1989; Kingsman, 2000).
Many simulation studies have demonstrated the e�ectiveness of WLC in job shops (e.g.
Land & Gaalman, 1998; Oosterman et al., 2000; Thürer et al., 2010); however, these studies have
assumed simple product structures. In other words, that jobs consist of only one work piece or
work order and leave the shop �oor once the last operation has been completed without the need
for �nal assembly. In contrast to the many simulation papers, few successful implementations
have been described in the literature and �eld researchers have encountered signi�cant challenges.
One of these challenges has been the presence of "assembly job shops", where product structures
are more complex than typically modelled in simulation and the �nal product (or assembly order)
is made up of several subassemblies (or work orders) which have to be co-ordinated (e.g. Silva
et al. 2006; Stevenson & Silva, 2008; Hendry et al., 2008). The theory of WLC has not been
developed su�ciently to handle such contexts and the available literature on assembly job shops
is limited. This raises questions about how short and reliable DDs can be set for the �nal product;
and, how the work orders that make up a �nal product should be released from the pre-shop pool
and co-ordinated on the shop �oor. Therefore, one of the most important contemporary WLC
research problems concerns how WLC theory can be extended to assembly job shops (Hendry et
al., 2008; Thürer et al., 2011b).
Despite the importance of this problem, few contributions have been provided; the most
notable being by Bertrand & van de Wakker (2002) and Lu et al. (2010). These two studies
illustrated that WLC has the potential to improve performance in assembly job shops but provided
con�icting advice for how improvements should be achieved. For example, Bertrand & van de
Wakker (2002) argued that all work orders that make up the �nal product should be released
together while Lu et al. (2010) argued that each work order should be considered for release
individually - it therefore follows that further research is required.
In response, this paper investigates how WLC should be re�ned to accommodate the re-
quirements of assembly orders. It assesses the impact on performance of a set of DD setting and
co-ordination policies in assembly job shops in conjunction with a leading order release method
from the literature. Previous WLC research on DD setting has either assumed that all DDs are
proposed by the company (and set according to a certain DD setting rule) or speci�ed by the
customer (i.e. set externally). Meanwhile, in practice, there is often a mix of the two: some orders
will require DDs to be proposed by the company while others will have DDs speci�ed by the
customer. Therefore, in order to align simulation with practice, we investigate performance with
di�erent percentages of orders with DDs proposed by the company and speci�ed by the customer.
The remainder of this paper is organised as follows. Section 9.2 brie�y reviews the litera-
ture concerned with assembly job shops and WLC before Section 9.3 describes the design of the
simulation study. Results are presented and analysed in Section 9.4 before �nal conclusions are
drawn in Section 9.5.
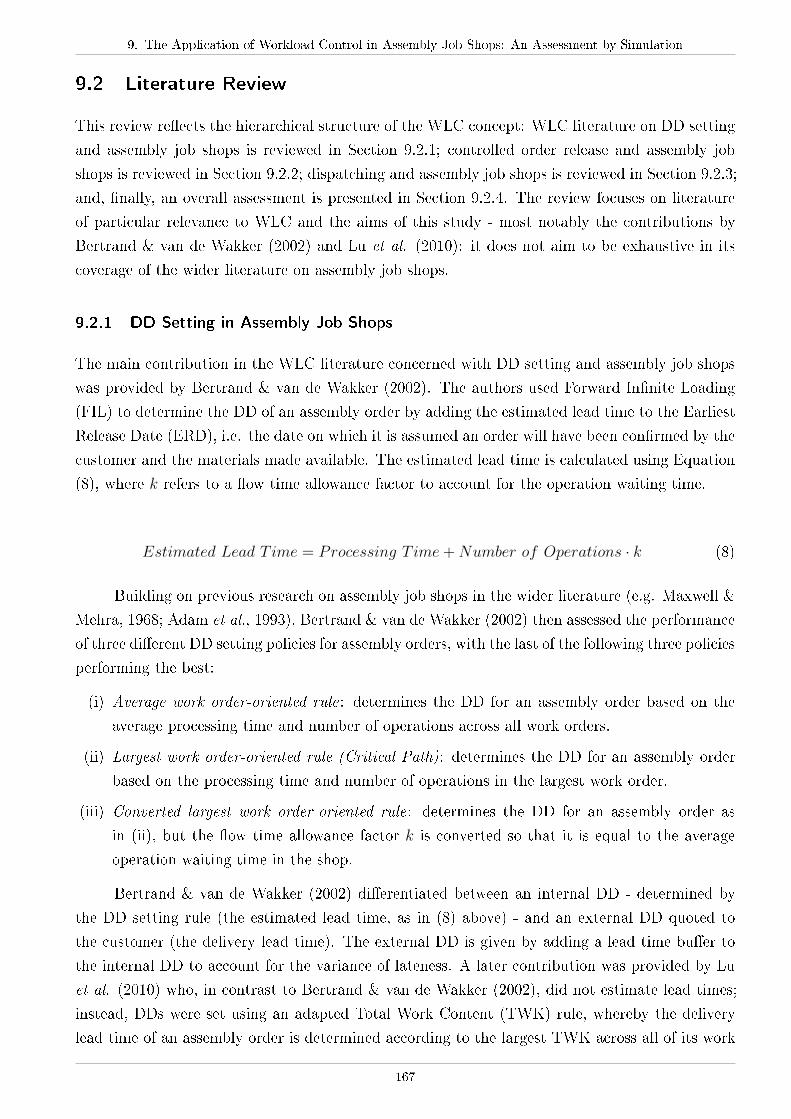
9. The Application of Workload Control in Assembly Job Shops: An Assessment by Simulation
9.2 Literature Review
This review re�ects the hierarchical structure of the WLC concept: WLC literature on DD setting
and assembly job shops is reviewed in Section 9.2.1; controlled order release and assembly job
shops is reviewed in Section 9.2.2; dispatching and assembly job shops is reviewed in Section 9.2.3;
and, �nally, an overall assessment is presented in Section 9.2.4. The review focuses on literature
of particular relevance to WLC and the aims of this study - most notably the contributions by
Bertrand & van de Wakker (2002) and Lu et al. (2010): it does not aim to be exhaustive in its
coverage of the wider literature on assembly job shops.
9.2.1 DD Setting in Assembly Job Shops
The main contribution in the WLC literature concerned with DD setting and assembly job shops
was provided by Bertrand & van de Wakker (2002). The authors used Forward In�nite Loading
(FIL) to determine the DD of an assembly order by adding the estimated lead time to the Earliest
Release Date (ERD), i.e. the date on which it is assumed an order will have been con�rmed by the
customer and the materials made available. The estimated lead time is calculated using Equation
(8), where k refers to a �ow time allowance factor to account for the operation waiting time.
Estimated Lead T ime = Processing T ime+Number of Operations ⋅ k (8)
Building on previous research on assembly job shops in the wider literature (e.g. Maxwell &
Mehra, 1968; Adam et al., 1993), Bertrand & van de Wakker (2002) then assessed the performance
of three di�erent DD setting policies for assembly orders, with the last of the following three policies
performing the best:
(i) Average work order-oriented rule: determines the DD for an assembly order based on the
average processing time and number of operations across all work orders.
(ii) Largest work order-oriented rule (Critical Path): determines the DD for an assembly order
based on the processing time and number of operations in the largest work order.
(iii) Converted largest work order-oriented rule: determines the DD for an assembly order as
in (ii), but the �ow time allowance factor k is converted so that it is equal to the average
operation waiting time in the shop.
Bertrand & van de Wakker (2002) di�erentiated between an internal DD - determined by
the DD setting rule (the estimated lead time, as in (8) above) - and an external DD quoted to
the customer (the delivery lead time). The external DD is given by adding a lead time bu�er to
the internal DD to account for the variance of lateness. A later contribution was provided by Lu
et al. (2010) who, in contrast to Bertrand & van de Wakker (2002), did not estimate lead times;
instead, DDs were set using an adapted Total Work Content (TWK) rule, whereby the delivery
lead time of an assembly order is determined according to the largest TWK across all of its work
167
orders multiplied by a DD tightness factor. For a discussion on the advantages of distinguishing
between internal and external DDs - as adopted in Bertrand & van de Wakker (2002) - compared
to applying a tightness factor - as adopted in Lu et al. (2010) - see Enns (1995) and Hopp &
Sturgis (2000).
None of the rules referred to above consider detailed workload information from the shop
�oor, such as about the distribution of the workload over time, when quoting DDs. Such infor-
mation is typical for WLC DD setting rules in less complex contexts (Bertrand, 1983a and 1983b;
Hendry & Kingsman, 1993; Bechte, 1994) but has not been considered in assembly job shops. This
is an important research gap given the superior performance of DD setting rules which consider
some degree of information on loadings over those which do not (Adam et al., 1993; Smith et al.
1995).
9.2.2 Controlled Order Release in Assembly Job Shops
Both Bertrand & van de Wakker (2002) and Lu et al. (2010) have contributed to the available
literature on order release in assembly job shops. In Bertrand & van de Wakker (2002), only in�nite
order release rules are applied, i.e. rules which do not consider workload information; these include
Backward In�nite Loading (BIL) and Immediate Release (IMM). For BIL, the Planned Release
Date (PRD) of each work order is determined by backward scheduling from the assembly order
DD, resulting in di�erent release dates for each work order. For IMM, all work orders are released
immediately (and together) on the ERD of the assembly order. In addition to these release rules,
Bertrand & van de Wakker (2002) also used three co-ordination policies, so that the DD setting
rule and release method worked together. The �rst determined the PRD of each work order by
forward scheduling from the ERD; this means that the DD of an assembly order does not equal
the DD of its work orders. The second determined the PRDs of each work order by backward
scheduling from the assembly DD; this means that the DDs of an assembly order are equal to the
DDs of its work orders. The third determined the PRDs of each work order by distributing the
estimated lead time of the assembly order equally according to the operation �ow time allowance
factor k of each work order; this means that the DDs of an assembly order are equal to the DDs
of its work orders and all work orders have the same PRD. Bertrand & van de Wakker (2002)
argued that the third co-ordination policy in combination with IMM performs the best.
The �ndings made by Bertrand & van de Wakker (2002) need to be explored further. By
advising IMM, the importance of controlled order release in assembly job shops is severely ques-
tioned. Furthermore, it is argued here that the co-ordination policy recommended by Bertrand &
van de Wakker (2002) would increase WIP unnecessarily and deteriorate performance by ensuring
that the lead times of all work orders are equal, irrespective of size. More recent research by Lu
et al. (2010) supports our argument regarding the importance of controlled order release, showing
that BIL release outperforms IMM; and, that combining a WLC release method which considers
workload information with a co-ordination policy based on BIL can improve performance over
simple BIL and IMM release in assembly job shops. However, the mean absolute deviation of
9. The Application of Workload Control in Assembly Job Shops: An Assessment by Simulation
lateness increased slightly and the authors did not present tardiness results. It is argued here that
performance could be further improved by applying a more e�ective WLC release method than
that used by Lu et al. (2010) - the authors only applied the 'classical aggregate load approach'
which has been outperformed by the 'corrected aggregate load approach' in several recent studies
(e.g. Oosterman et al., 2000; Thürer et al., 2010).
From the above it follows that there is a need to conduct further research into the perfor-
mance of WLC order release methods in assembly job shops and to combine order release with
DD setting and co-ordination policies. In doing so, it may be possible to add to the debate in the
literature on how best to control the release of work orders to the shop �oor.
9.2.3 Dispatching in Assembly Job Shops
Beyond the scope of WLC, there exists a broad literature on dispatching in assembly job shops (e.g.
Sculli, 1980; Adam et al., 1987; Philipoom et al., 1991). Most of the rules described in this work
base dispatching decisions on the remaining work orders, such as the Number of Un�nished Parts
(NUP) rule (e.g. Maxwell & Mehra, 1968) or the un�nished work content of an assembly order
(e.g. Siegel, 1971). Lu et al. (2010) compared these rules with simple First-Come-First-Served
(FCFS) and Earliest Due Date (EDD) dispatching. NUP and the un�nished work content based
rule outperformed FCFS and EDD in terms of shop �oor throughput time while EDD performed
the best in terms of the mean absolute deviation of lateness. But Lu et al. (2010) did not consider
dispatching according to the Operation Completion Dates (OCDs) of work orders, which Bertrand
& van de Wakker (2002) had earlier demonstrated can synchronise order progress on the shop �oor
and lead to 'good' tardiness performance.
9.2.4 Assessment of the Literature
For the WLC concept to be more widely applicable, it must perform well in assembly job shops.
This is re�ected in the empirical WLC research literature (Silva et al., 2006; Stevenson & Silva,
2008; Hendry et al., 2008) and has been identi�ed as one of the most important outstanding
research challenges (Hendry et al., 2008; Thürer et al., 2011b). Only two studies have been
concerned with WLC and assembly job shops to date (Bertrand & van de Wakker, 2002; Lu et
al., 2010), and these studies did not give adequate consideration to e�ective WLC DD setting
rules and provided con�icting advice for order release. Thus, further research is required in order
to determine how WLC can best be re�ned to accommodate assembly orders. We begin by
considering the following research question (RQ1):
∙ RQ1: How can the WLC concept best be re�ned to accommodate the requirements of
assembly orders?
In response, the contributions made by Bertrand & van de Wakker (2002) and Lu et al.
(2010) are extended in order to determine the best-performing combination of DD setting pol-
169
icy, co-ordination policy and order release method. To align the simulations with practice, we
consider various DD setting scenarios, varying the proportion of DDs which are proposed by the
company and speci�ed by customers. Using the results obtained, the most appropriate means of
accommodating assembly orders within the design of the WLC concept is identi�ed.
9.3 Simulation Model
9.3.1 Overview of Shop Characteristics
A simulation model of an assembly job shop has been developed using the SimPy c⃝ module of
Python c⃝ by extending the pure job shop model used by Melnyk & Ragatz (1989). The job
shop contains six work centres, where each is a single and unique capacity resource. All work
centres have an equal probability of being visited and a particular work centre is required at most
once in the routing of a work order (sub-assembly). Work orders leaving the job shop go to an
assembly work centre where they await other work orders in the �nal assembly order. When all
work orders have arrived, the order is complete and the work orders leave the simulation together
as an assembled product. As in Lu et al. (2010), the assembly time is negligible in order to avoid
distracting the focus of the study away from assembly orders to bottlenecks. The number of work
orders per assembly order is uniformly distributed between one and six.
9.3.2 Due Date Setting Policies
Four di�erent DD setting scenarios are simulated: (1) where DDs are set by the company for
all orders; (2) where 75% of DDs are set by the company and 25% of DDs are speci�ed by the
customer; (3) where 50% of DDs are set by the company and 50% are speci�ed by the customer;
and, (4) where 25% of DDs are set by the company and 75% are speci�ed by the customer. Where
a DD is set by the company, two di�erent policies are applied:
∙ DD Setting Policy I (In�nite): A DD for each work order is set by Forward In�nite Loading
(FIL). The latest DD across all work orders is then taken as the DD for the assembly order.
∙ DD Setting Policy II (WLC): A DD for each work order is set using a procedure introduced
by Bertrand (1983a and 1983b), which matches available and required capacity over time.
The latest DD across all work orders is then taken as the DD for the assembly order.
Both of the above policies estimate the lead time; therefore, as in Bertrand & van de Wakker
(2002), there is a distinction between the internal and the external DD. The external DD quoted
to the customer is set by adding a lead time bu�er of 10 time units to the internal DD - this value
has been set arbitrarily.
Where a DD is speci�ed by the customer, the delivery lead time follows a normal distribution
(� = 10) with a mean of 65 time units. This value was set following preliminary simulation runs
which indicated an assembly lead time of 55 time units.
9. The Application of Workload Control in Assembly Job Shops: An Assessment by Simulation
9.3.2.1 Lead Times under DD Setting Policy I - In�nite
For in�nite DD setting rules, the OCD for each operation i in the routing of a work order can be
determined using Equation (9). The (internal) DD is given by the OCD of the last operation.
OCDi = OCDi−1 + k + Processing T ime; OCD0 = ERD (9)
Preliminary simulation runs showed that the average work order throughput time is 40 time
units with immediate release. Assuming an equal distribution of operation waiting times across
work centres (i.e. a pure job shop), the �ow time allowance factor k should be between 10 and
11 time units. Converting k, as recommended by Bertrand & van de Wakker (2002) as the best-
performing option, would result in a �ow time allowance factor of 6 and 6.6 time units, respectively.
The rather complex conversion heuristic is not discussed here; for this, the reader is referred to
Bertrand & van de Wakker (2002). Preliminary simulation runs, however, indicated that this
conversion leads to a constant under-estimation of assembly lead times. Therefore, k is in fact not
converted in our study but maintained at 10 and 11 time units. When a WLC release method
is used (see Section 9.3.4 below), k is set to 7 and 8 time units to account for an estimated pool
waiting time (or delay) of 8 time units.
9.3.2.2 Lead Times under DD Setting Policy II - WLC
As described in Section 9.2.1, WLC DD setting rules use detailed workload information when
quoting DDs. Thus, a factor F (Wt, Ct) is added to the in�nite rule, depending on the current
workload (Wt) and capacity (Ct). As a result, the OCD for a certain operation i in the routing of
an order can be determined using Equation (10) below.
OCDi = OCDi−1 + k + Processing T ime+ F (Wt, Ct); OCD0 = ERD (10)
The main di�erence between approaches to determining F (Wt, Ct) lies in which kind of
load information is used (non-cumulative or cumulative load); and, in how the backlog (i.e. the
workload ahead or behind schedule) is treated. Bertrand's approach (see Bertrand, 1983a and
1983b) has performed well in previous studies and is, therefore, used in this research. The approach
applies a cumulative load and considers the backlog (see Figure 35). The cumulative load is given
by the planned workload (the workload in the pool and the workload on the shop �oor); to account
for the backlog, the load of an operation is subtracted from the cumulative load once an operation
has been completed.
Firstly, the planning horizon is broken down into time buckets. The time buckets are set
to 4 time units, i.e. the maximum processing time. Then, starting at the ERD (OCD0), the
cumulative workload is �tted to the cumulative capacity in each time bucket as follows:
171
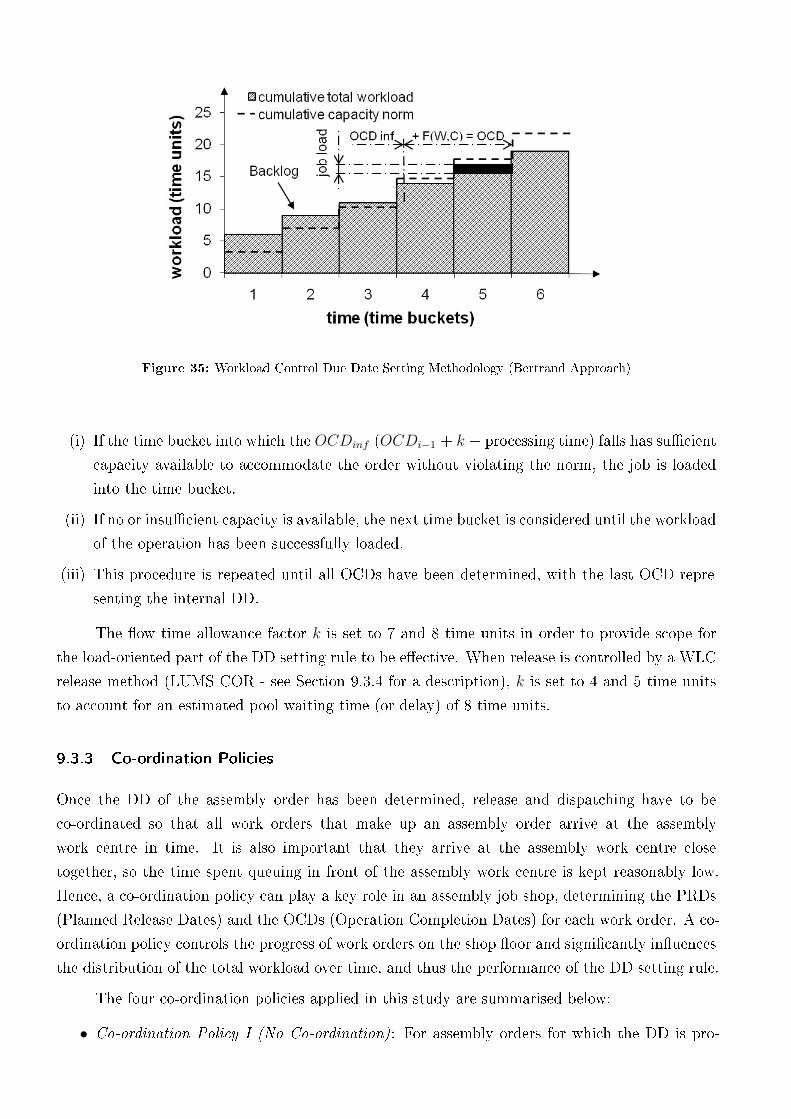
Figure 35: Workload Control Due Date Setting Methodology (Bertrand Approach)
(i) If the time bucket into which the OCDinf (OCDi−1 + k + processing time) falls has su�cient
capacity available to accommodate the order without violating the norm, the job is loaded
into the time bucket.
(ii) If no or insu�cient capacity is available, the next time bucket is considered until the workload
of the operation has been successfully loaded.
(iii) This procedure is repeated until all OCDs have been determined, with the last OCD repre-
senting the internal DD.
The �ow time allowance factor k is set to 7 and 8 time units in order to provide scope for
the load-oriented part of the DD setting rule to be e�ective. When release is controlled by a WLC
release method (LUMS COR - see Section 9.3.4 for a description), k is set to 4 and 5 time units
to account for an estimated pool waiting time (or delay) of 8 time units.
9.3.3 Co-ordination Policies
Once the DD of the assembly order has been determined, release and dispatching have to be
co-ordinated so that all work orders that make up an assembly order arrive at the assembly
work centre in time. It is also important that they arrive at the assembly work centre close
together, so the time spent queuing in front of the assembly work centre is kept reasonably low.
Hence, a co-ordination policy can play a key role in an assembly job shop, determining the PRDs
(Planned Release Dates) and the OCDs (Operation Completion Dates) for each work order. A co-
ordination policy controls the progress of work orders on the shop �oor and signi�cantly in�uences
the distribution of the total workload over time, and thus the performance of the DD setting rule.
The four co-ordination policies applied in this study are summarised below:
∙ Co-ordination Policy I (No Co-ordination): For assembly orders for which the DD is pro-
9. The Application of Workload Control in Assembly Job Shops: An Assessment by Simulation
posed by the company (i.e. set by the DD setting rule), the original OCDs determined by
the DD setting rule are maintained; and, each work order has its own PRD and DD. For
assembly orders with DDs speci�ed by the customer, the OCDs are determined by backward
in�nite loading from the internal DD (given by the DD minus the lead time bu�er). The
�ow time allowance factor k for backward in�nite loading is set to 9 and 10 time units in
experiments which do not consider WLC order release and 5 and 6 time units in experi-
ments where release is controlled by a WLC release rule (LUMS COR - see Section 9.3.4 for
a description) to account for the time spent waiting in the pool.
∙ Co-ordination Policy II (Equal Lead Time): The estimated assembly lead time is equally
distributed over the operations of each work order for all assembly orders (whether the DD
is proposed by the company or speci�ed by the customer). As a result, all of the work orders
of an assembly order have the same DD and the same PRD, where the PRD is equal to
the ERD. This is the best-performing co-ordination policy according to Bertrand & van de
Wakker (2002).
∙ Co-ordination Policy III (Backward Reloading): For assembly orders for which the DD is
proposed by the company, the OCDs of all work orders, except the one which determined
the assembly DD, are determined by backward in�nite loading from the DD of the assembly
order. For the one remaining work order, the OCDs determined by the DD setting rule are
maintained. As a result, all of the work orders of an assembly order have the same DD but
di�erent PRDs. For assembly orders with DDs speci�ed by the customer, the OCDs of all
work orders are determined by backward in�nite loading (as in Co-ordination Policy I).
∙ Co-ordination Policy IV (Forward Reloading): For assembly orders for which the DD is
proposed by the company, work orders are forward loaded by applying the Bertrand Ap-
proach (as described in Section 9.3.2.2) beginning with the �rst PRD (the ERD) of each
work order. This procedure is repeated stepwise by increasing the PRD until the obtained
DD exceeds the assembly DD. For this policy, the DD and PRD are di�erent for each work
order. For assembly orders with DDs speci�ed by the customer, the OCDs of all work orders
are determined by backward in�nite loading (as in Co-ordination Policy I and III).
Finally, the alternative co-ordination policies are summarised in Figure 36. This shows an
example where an assembly order with a DD proposed by the company consists of two work orders.
The performance measures applied in this study are also shown towards the top of the �gure.
9.3.4 Order Release and Dispatching
As in most previous WLC simulations, it is assumed that all orders are accepted and that materials
are available. Therefore, once a DD has been set for an assembly order, all corresponding work
orders are either released immediately (IMM) or enter the pre-shop pool to await release. In
addition to BIL release, which releases the work orders on the PRD without considering the current
workload on the shop �oor, a WLC release method is applied. A corrected version of the LUMS
173

Figure 36: Summary of Co-ordination Policies
Order Release (LUMS OR) method (see e.g., Hendry & Kingsman, 1991a) has been chosen. LUMS
OR combines the workload balancing of a periodic release method with the starvation avoidance
of continuous release. The original LUMS OR method incorporated the 'classical aggregate load
approach' to workload accounting over time. It has been replaced in this paper by the 'corrected
aggregate load approach', given its superior performance (e.g. Oosterman et al., 2000; Thürer
et al., 2010) - the resulting corrected LUMS OR method is referred to as "LUMS COR". Also
note that in the rest of this paper, BIL release is referred to as "PRDIR" (Planned Release Date
Immediate Release) to avoid confusion with the backward in�nite loading method used in the co-
ordination policies. For a more detailed discussion on order release methods, the reader is referred
to Land & Gaalman, (1996a), Bergamaschi et al. (1997), and Fredendall et al. (2010).
In the case of LUMS COR, work orders are considered for release periodically according to
9. The Application of Workload Control in Assembly Job Shops: An Assessment by Simulation
PRD, i.e. every 4 time units. Beginning with the job with the earliest PRD, the load of a job
is contributed to the load of each work centre in its routing. In accordance with the corrected
aggregate load method, the contributed load is divided by the position of a work centre in the
routing of a job. If one or more norms are violated, the job is retained in the pool until the next
release date. If norms are not violated, the job is released onto the shop �oor and its load assigned
to the load of the work centres in its routing. These steps are repeated until all work orders in the
pool have been considered for release once. In addition to this periodic release procedure, LUMS
COR incorporates a continuous workload trigger (starvation avoidance) whereby, if the load of
any work centre becomes zero, a work order with that work centre as the �rst in its routing is
released. The work order with the earliest PRD is selected and its load is then assigned according
to the corrected aggregate load approach.
As in Bertrand & van de Wakker (2002), the dispatching rule adopted in the study is OCD. In
other words, work orders are prioritised according to operation completion dates. Finally, Table 42
summarises the DD setting policies, co-ordination policies, release methods and the dispatching
rule applied in this study.
9.3.5 Job Characteristics
Operation processing times follow a truncated 2-Erlang distribution with a mean of 1 time unit
and a maximum of 4 time units. As in most previous WLC simulation studies (e.g. Land &
Gaalman, 1998; Oosterman et al., 2000; Bertrand & van de Wakker, 2002; Thürer et al., 2010),
the arrival rate of (assembly) orders is such that the utilisation rate is 90%. The arrival rate
follows an exponential distribution (mean of 2.27 time units) which results in a throughput rate
of 0.44 assembly orders per time unit. Tables 43 and 44 summarise the simulated shop and job
characteristics.
9.3.6 Experimental Design & Performance Measures
DD Setting Policy II and LUMS COR are classi�ed as WLC approaches and require certain norm
parameters to be used. Results for DD Setting Policy II are obtained by varying two capacity
norm parameters: 3.6 and 4.0 time units (i.e. 90% and 100% of the capacity of a time bucket).
Results for LUMS COR are obtained by gradually loosening the workload norm in steps of 1 time
unit from 4 to 10 time units. These have been identi�ed as the best-performing parameters in
preliminarily simulation experiments.
Each simulation experiment consists of 50 runs, consisting of 10,000 time units per run; the
warm-up period is set to 3,000 time units to avoid start-up e�ects. These simulation parameters
are consistent with previous studies which applied similar job shop models (e.g. Oosterman et al.,
2000; Land, 2006). The parameters allow us to obtain stable results whilst keeping the simulation
run time at a reasonable level. Table 45 summarises the di�erent combinations of DD setting
policy, co-ordination policy and release method applied in this study (the same dispatching rule is
175

Table 42: Summary of Due Date Setting Policies, Co-ordination Policies, Release Methods
and Dispatching Rule Applied in this Study
Name Classi�cation Brief Description
DD Setting Policy I
DD Setting Policy:
Forward In�nite
Loading Methodology
The OCD of each operation is given by the OCD of the
previous operation plus a �ow time allowance factor k and
the operation processing time. The last OCD is the internal
DD. The latest work order DD determines the assembly
order DD.
DD Setting Policy IIDD Setting Policy:
WLC DD Setting Rule
The planning horizon is broken down into time buckets;
and, the cumulative workload of each time bucket is �t
to the cumulative capacity for each time bucket to deter-
mine the OCD for each operation. The OCD of the last
operation is the internal DD. The latest work order DD
determines the assembly order DD.
Co-ordination Policy ICo-ordination Policy:
No Co-ordination
If the assembly DD is set by the DD setting rule, OCDs
set by the DD setting rule are maintained. If the assembly
DD is speci�ed by the customer, OCDs are determined by
backward in�nite loading.
Co-ordination Policy IICo-ordination Policy:
Equal Lead Time
The estimated assembly lead time is equally distributed
over the operations of each work order. The PRD and DD
of each work order of an assembly order are the same.
Co-ordination Policy IIICo-ordination Policy:
Backward Reloading
If the assembly DD is set by the DD setting rule, the OCDs
of all work orders except the one which determined the
assembly DD (for which the OCDs are maintained) are
determined by backward in�nite loading from the assembly
DD. If the assembly DD is speci�ed by the customer, PRDs
and OCDs are determined by backward in�nite loading.
Co-ordination Policy IVCo-ordination Policy:
Forward Reloading
If the assembly DD is set by the DD setting rule, the
OCDs of all work orders are determined by the Bertrand
Approach, stepwise increasing the PRD until the obtained
DD exceeds the assembly DD. If the assembly DD is spec-
i�ed by the customer, OCDs are determined by backward
in�nite loading.
IMM - Immediate
Release
Order Release Method:
In�nite Release MethodWork orders are released immediately, i.e. on the ERD.
PRDIR - Planned
Release Date Immediate
Release
Order Release Method:
In�nite Release Method
Work orders are released at the PRD without further con-
sideration.
LUMS COR - LUMS*
Corrected Order Release
Order Release Method:
WLC Release Method
Releases work orders periodically up to the workload norm.
In addition, work orders are pulled onto the shop �oor
in-between periodic releases if a work centre is starving
unnecessarily.
OCD - Operation
Completion Date
Shop Floor Dispatching
Rule
The work order with the earliest OCD at a particular work
centre is chosen from the queue.
* Lancaster University Management School

9. The Application of Workload Control in Assembly Job Shops: An Assessment by Simulation
Table 43: Summary of Simulated Shop Characteristics
Shop Characteristics
Shop Type Assembly Job Shop
Routing Variability Random routing, no re-entrant �ows
No. of Work Centres 6
Interchange-ability of Work Centres No interchange-ability
Work Centre Capacities All equal
Table 44: Summary of Simulated Job Characteristics
Job Characteristics
No. of Work Orders per Assembly Order Discrete Uniform[1, 6]
No. of Operations per Job Discrete Uniform[1, 6]
Operation Processing Times (2-Erlang) Truncated 2-Erlang, � = 1 max = 4
Inter-Arrival Times Exp. Distribution, mean = 2.72
Set-up Times Not considered
Due Date Determination Special Policy (see Section 9.3.2)
Complexity of Product Structures Simple dependent product structures
applied in all experiments). Experiments are full factorial for these combinations and the di�erent
percentages of DDs given by the customer.
Table 45: Experimental Setting: Due Date Setting Policy, Co-ordination Policy and
Release Method
Lead Time Policy I Lead Time Policy II
Co-ordination Policy I IMM, LUMS COR IMM, LUMS COR
Co-ordination Policy II IMM IMM
Co-ordination Policy III PRDIR, LUMS COR PRDIR, LUMS COR
Co-ordination Policy IV - PRDIR, LUMS COR
The performance measures considered in this study (as detailed in Figure 36) are: the
throughput time or manufacturing lead time (tt); the actual lead time (tl); the lead time estimated
by the DD setting rule (tel); the assembly waiting time, i.e. the time that work orders which have
left the shop �oor have to wait before �nal assembly (tw); the standard deviation of lateness
(SDlat); the standard deviation of the estimated lead time (SDtel); the standard deviation of
177
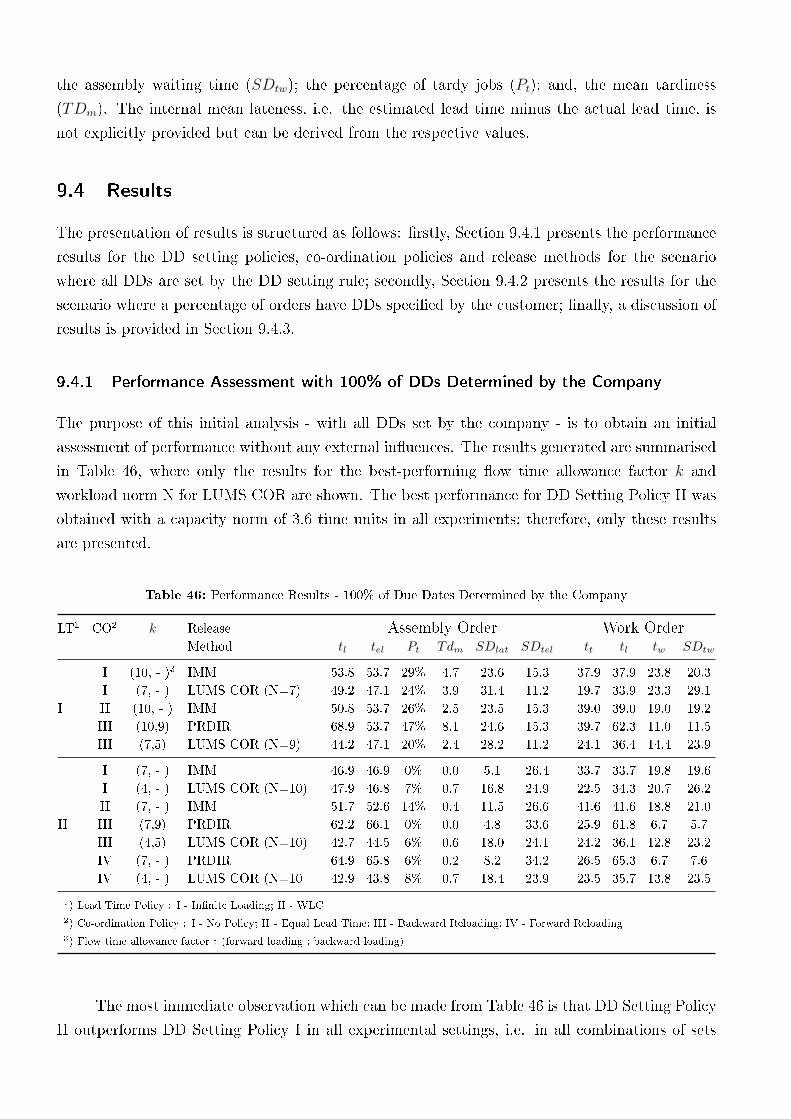
the assembly waiting time (SDtw); the percentage of tardy jobs (Pt); and, the mean tardiness
(TDm). The internal mean lateness, i.e. the estimated lead time minus the actual lead time, is
not explicitly provided but can be derived from the respective values.
9.4 Results
The presentation of results is structured as follows: �rstly, Section 9.4.1 presents the performance
results for the DD setting policies, co-ordination policies and release methods for the scenario
where all DDs are set by the DD setting rule; secondly, Section 9.4.2 presents the results for the
scenario where a percentage of orders have DDs speci�ed by the customer; �nally, a discussion of
results is provided in Section 9.4.3.
9.4.1 Performance Assessment with 100% of DDs Determined by the Company
The purpose of this initial analysis - with all DDs set by the company - is to obtain an initial
assessment of performance without any external in�uences. The results generated are summarised
in Table 46, where only the results for the best-performing �ow time allowance factor k and
workload norm N for LUMS COR are shown. The best performance for DD Setting Policy II was
obtained with a capacity norm of 3.6 time units in all experiments; therefore, only these results
are presented.
Table 46: Performance Results - 100% of Due Dates Determined by the Company
LT1 CO2 k Release Assembly Order Work OrderMethod tl tel Pt Tdm SDlat SDtel tt tl tw SDtw
I (10, - )3 IMM 53.8 53.7 29% 4.7 23.6 15.3 37.9 37.9 23.8 20.3
I (7, - ) LUMS COR (N=7) 49.2 47.1 24% 3.9 31.4 11.2 19.7 33.9 23.3 29.1
I II (10, - ) IMM 50.8 53.7 26% 2.5 23.5 15.3 39.0 39.0 19.0 19.2
III (10,9) PRDIR 68.9 53.7 47% 8.1 24.6 15.3 39.7 62.3 11.0 11.5
III (7,5) LUMS COR (N=9) 44.2 47.1 20% 2.4 28.2 11.2 24.1 36.4 14.4 23.9
I (7, - ) IMM 46.9 46.9 0% 0.0 5.1 26.4 33.7 33.7 19.8 19.6
I (4, - ) LUMS COR (N=10) 47.9 46.8 7% 0.7 16.8 24.9 22.5 34.3 20.7 26.2
II (7, - ) IMM 51.7 52.6 14% 0.4 11.5 26.6 41.6 41.6 18.8 21.0
II III (7,9) PRDIR 62.2 66.1 0% 0.0 4.8 33.6 25.9 61.8 6.7 5.7
III (4,5) LUMS COR (N=10) 42.7 44.5 6% 0.6 18.0 24.1 24.2 36.1 12.8 23.2
IV (7, - ) PRDIR 64.9 65.8 6% 0.2 8.2 34.2 26.5 65.3 6.7 7.6
IV (4, - ) LUMS COR (N=10 42.9 43.8 8% 0.7 18.4 23.9 23.5 35.7 13.8 23.5
1) Lead Time Policy : I - In�nite Loading; II - WLC
2) Co-ordination Policy : I - No Policy; II - Equal Lead Time; III - Backward Reloading; IV - Forward Reloading
3) Flow time allowance factor : (forward loading ; backward loading)
The most immediate observation which can be made from Table 46 is that DD Setting Policy
II outperforms DD Setting Policy I in all experimental settings, i.e. in all combinations of sets
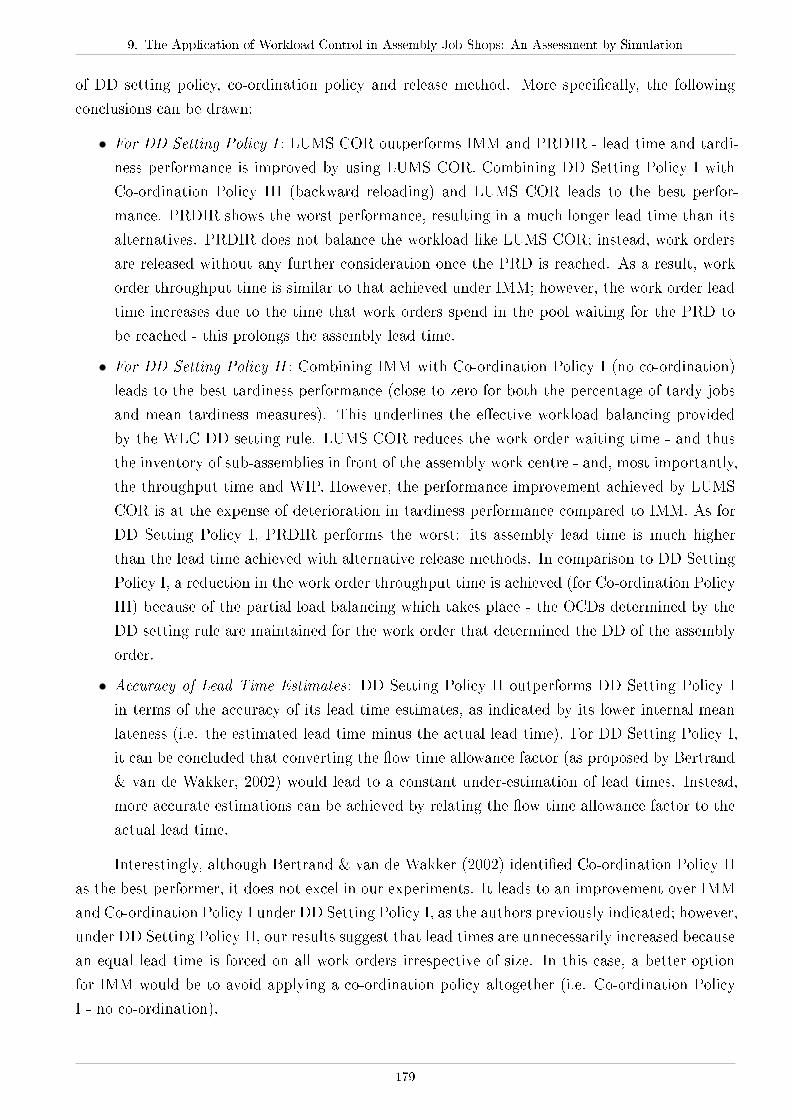
9. The Application of Workload Control in Assembly Job Shops: An Assessment by Simulation
of DD setting policy, co-ordination policy and release method. More speci�cally, the following
conclusions can be drawn:
∙ For DD Setting Policy I : LUMS COR outperforms IMM and PRDIR - lead time and tardi-
ness performance is improved by using LUMS COR. Combining DD Setting Policy I with
Co-ordination Policy III (backward reloading) and LUMS COR leads to the best perfor-
mance. PRDIR shows the worst performance, resulting in a much longer lead time than its
alternatives. PRDIR does not balance the workload like LUMS COR; instead, work orders
are released without any further consideration once the PRD is reached. As a result, work
order throughput time is similar to that achieved under IMM; however, the work order lead
time increases due to the time that work orders spend in the pool waiting for the PRD to
be reached - this prolongs the assembly lead time.
∙ For DD Setting Policy II : Combining IMM with Co-ordination Policy I (no co-ordination)
leads to the best tardiness performance (close to zero for both the percentage of tardy jobs
and mean tardiness measures). This underlines the e�ective workload balancing provided
by the WLC DD setting rule. LUMS COR reduces the work order waiting time - and thus
the inventory of sub-assemblies in front of the assembly work centre - and, most importantly,
the throughput time and WIP. However, the performance improvement achieved by LUMS
COR is at the expense of deterioration in tardiness performance compared to IMM. As for
DD Setting Policy I, PRDIR performs the worst: its assembly lead time is much higher
than the lead time achieved with alternative release methods. In comparison to DD Setting
Policy I, a reduction in the work order throughput time is achieved (for Co-ordination Policy
III) because of the partial load balancing which takes place - the OCDs determined by the
DD setting rule are maintained for the work order that determined the DD of the assembly
order.
∙ Accuracy of Lead Time Estimates : DD Setting Policy II outperforms DD Setting Policy I
in terms of the accuracy of its lead time estimates, as indicated by its lower internal mean
lateness (i.e. the estimated lead time minus the actual lead time). For DD Setting Policy I,
it can be concluded that converting the �ow time allowance factor (as proposed by Bertrand
& van de Wakker, 2002) would lead to a constant under-estimation of lead times. Instead,
more accurate estimations can be achieved by relating the �ow time allowance factor to the
actual lead time.
Interestingly, although Bertrand & van de Wakker (2002) identi�ed Co-ordination Policy II
as the best performer, it does not excel in our experiments. It leads to an improvement over IMM
and Co-ordination Policy I under DD Setting Policy I, as the authors previously indicated; however,
under DD Setting Policy II, our results suggest that lead times are unnecessarily increased because
an equal lead time is forced on all work orders irrespective of size. In this case, a better option
for IMM would be to avoid applying a co-ordination policy altogether (i.e. Co-ordination Policy
I - no co-ordination).
179
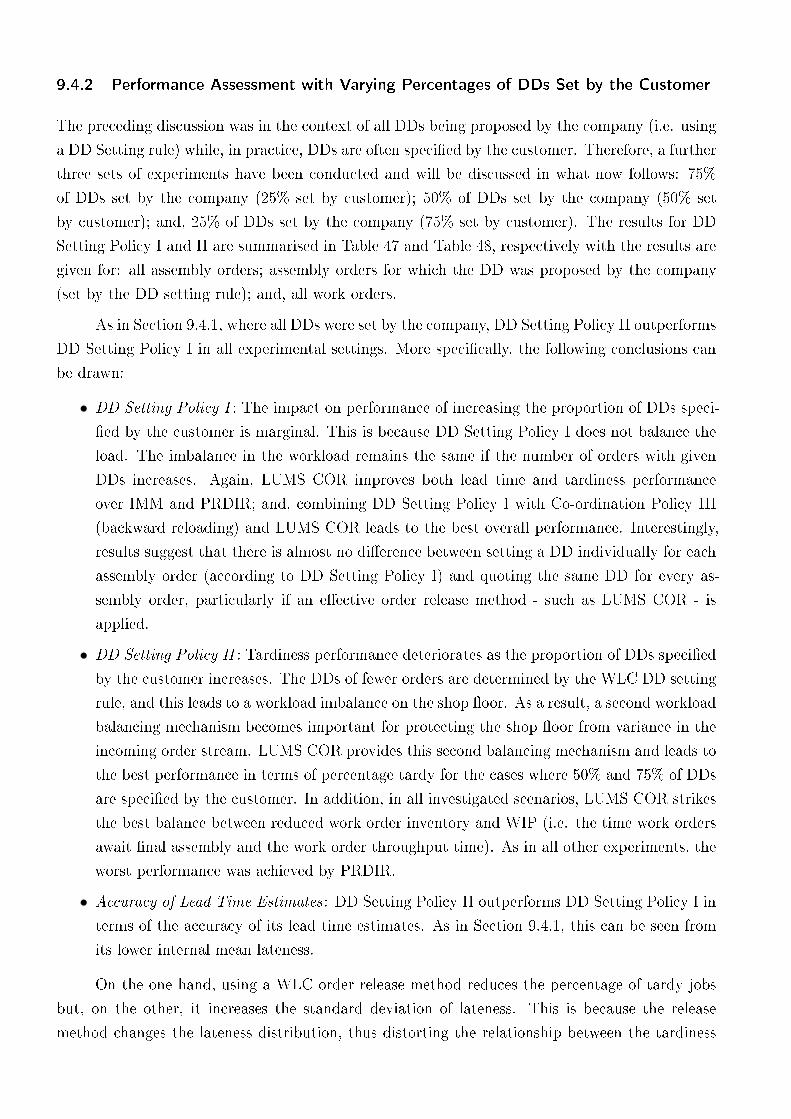
9.4.2 Performance Assessment with Varying Percentages of DDs Set by the Customer
The preceding discussion was in the context of all DDs being proposed by the company (i.e. using
a DD Setting rule) while, in practice, DDs are often speci�ed by the customer. Therefore, a further
three sets of experiments have been conducted and will be discussed in what now follows: 75%
of DDs set by the company (25% set by customer); 50% of DDs set by the company (50% set
by customer); and, 25% of DDs set by the company (75% set by customer). The results for DD
Setting Policy I and II are summarised in Table 47 and Table 48, respectively with the results are
given for: all assembly orders; assembly orders for which the DD was proposed by the company
(set by the DD setting rule); and, all work orders.
As in Section 9.4.1, where all DDs were set by the company, DD Setting Policy II outperforms
DD Setting Policy I in all experimental settings. More speci�cally, the following conclusions can
be drawn:
∙ DD Setting Policy I : The impact on performance of increasing the proportion of DDs speci-
�ed by the customer is marginal. This is because DD Setting Policy I does not balance the
load. The imbalance in the workload remains the same if the number of orders with given
DDs increases. Again, LUMS COR improves both lead time and tardiness performance
over IMM and PRDIR; and, combining DD Setting Policy I with Co-ordination Policy III
(backward reloading) and LUMS COR leads to the best overall performance. Interestingly,
results suggest that there is almost no di�erence between setting a DD individually for each
assembly order (according to DD Setting Policy I) and quoting the same DD for every as-
sembly order, particularly if an e�ective order release method - such as LUMS COR - is
applied.
∙ DD Setting Policy II : Tardiness performance deteriorates as the proportion of DDs speci�ed
by the customer increases. The DDs of fewer orders are determined by the WLC DD setting
rule, and this leads to a workload imbalance on the shop �oor. As a result, a second workload
balancing mechanism becomes important for protecting the shop �oor from variance in the
incoming order stream. LUMS COR provides this second balancing mechanism and leads to
the best performance in terms of percentage tardy for the cases where 50% and 75% of DDs
are speci�ed by the customer. In addition, in all investigated scenarios, LUMS COR strikes
the best balance between reduced work order inventory and WIP (i.e. the time work orders
await �nal assembly and the work order throughput time). As in all other experiments, the
worst performance was achieved by PRDIR.
∙ Accuracy of Lead Time Estimates : DD Setting Policy II outperforms DD Setting Policy I in
terms of the accuracy of its lead time estimates. As in Section 9.4.1, this can be seen from
its lower internal mean lateness.
On the one hand, using a WLC order release method reduces the percentage of tardy jobs
but, on the other, it increases the standard deviation of lateness. This is because the release
method changes the lateness distribution, thus distorting the relationship between the tardiness
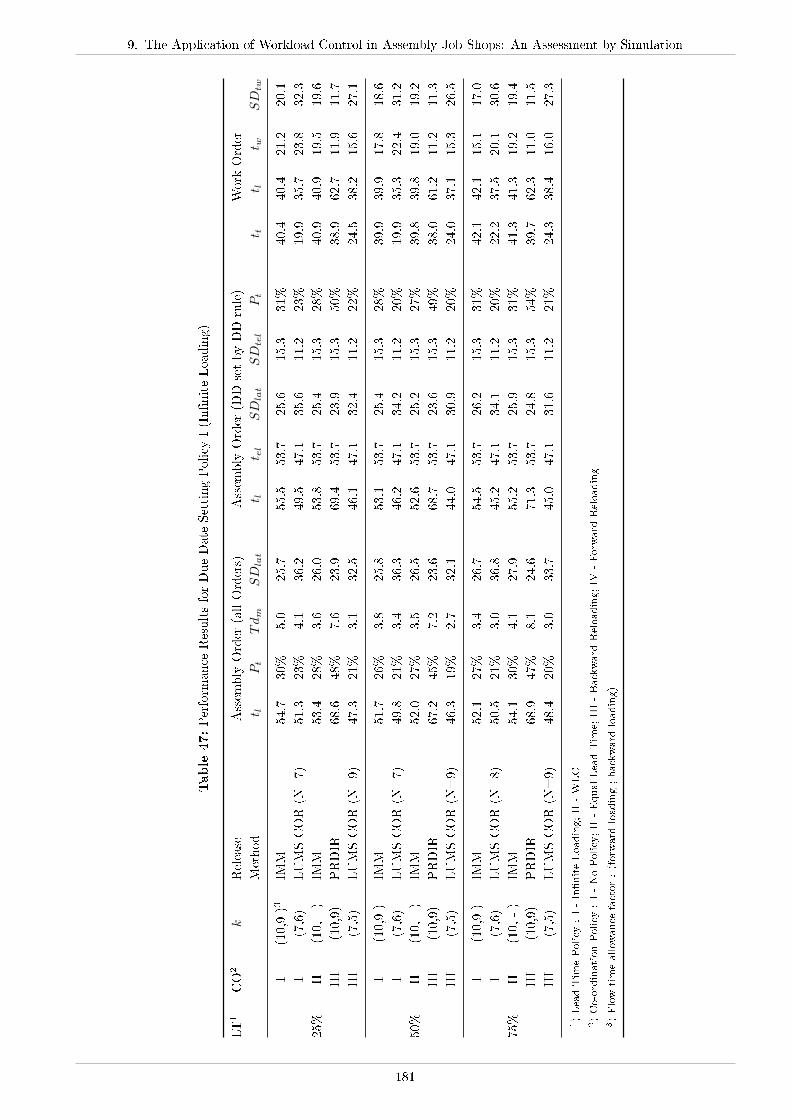
9. The Application of Workload Control in Assembly Job Shops: An Assessment by Simulation
Table
47:Perform
ance
ResultsforDueDate
SettingPolicy
I(In�niteLoading)
LT1
CO
2k
Release
Assem
bly
Order
(allOrders)
Assem
bly
Order
(DDsetbyDDrule)
Work
Order
Method
t lPt
Tdm
SD
lat
t lt e
lSD
lat
SD
tel
Pt
t tt l
t wSD
tw
I(10,9)3
IMM
54.7
30%
5.0
25.7
55.5
53.7
25.6
15.3
31%
40.4
40.4
21.2
20.1
I(7,6)
LUMSCOR(N
=7)
51.3
23%
4.1
36.2
49.5
47.1
35.6
11.2
23%
19.9
35.7
23.8
32.3
25%
II(10,-)
IMM
53.4
28%
3.6
26.0
53.8
53.7
25.4
15.3
28%
40.9
40.9
19.5
19.6
III
(10,9)
PRDIR
68.6
48%
7.6
23.9
69.4
53.7
23.9
15.3
50%
38.9
62.7
11.9
11.7
III
(7,5)
LUMSCOR(N
=9)
47.3
21%
3.1
32.5
46.1
47.1
32.4
11.2
22%
24.5
38.2
15.6
27.1
I(10,9)
IMM
51.7
26%
3.8
25.8
53.1
53.7
25.4
15.3
28%
39.9
39.9
17.8
18.6
I(7,6)
LUMSCOR(N
=7)
49.8
21%
3.4
36.3
46.2
47.1
34.2
11.2
20%
19.9
35.3
22.4
31.2
50%
II(10,-)
IMM
52.0
27%
3.5
26.5
52.6
53.7
25.2
15.3
27%
39.8
39.8
19.0
19.2
III
(10,9)
PRDIR
67.2
45%
7.2
23.6
68.7
53.7
23.6
15.3
49%
38.0
61.2
11.2
11.3
III
(7,5)
LUMSCOR(N
=9)
46.3
19%
2.7
32.1
44.0
47.1
30.9
11.2
20%
24.0
37.1
15.3
26.5
I(10,9)
IMM
52.1
27%
3.4
26.7
54.5
53.7
26.2
15.3
31%
42.1
42.1
15.1
17.0
I(7,6)
LUMSCOR(N
=8)
50.5
21%
3.0
36.8
45.2
47.1
34.1
11.2
20%
22.2
37.5
20.1
30.6
75%
II(10,-)
IMM
54.1
30%
4.1
27.9
55.2
53.7
25.9
15.3
31%
41.3
41.3
19.2
19.4
III
(10,9)
PRDIR
68.9
47%
8.1
24.6
71.3
53.7
24.8
15.3
54%
39.7
62.3
11.0
11.5
III
(7,5)
LUMSCOR(N
=9)
48.4
20%
3.0
33.7
45.0
47.1
31.6
11.2
21%
24.3
38.4
16.0
27.3
1)LeadTim
ePolicy
:I-In�niteLoading;II-WLC
2)Co-ordinationPolicy
:I-NoPolicy;II-EqualLeadTim
e;III-Backward
Reloading;IV
-Forward
Reloading
3)Flowtimeallow
ance
factor:(forward
loading;backward
loading)
181
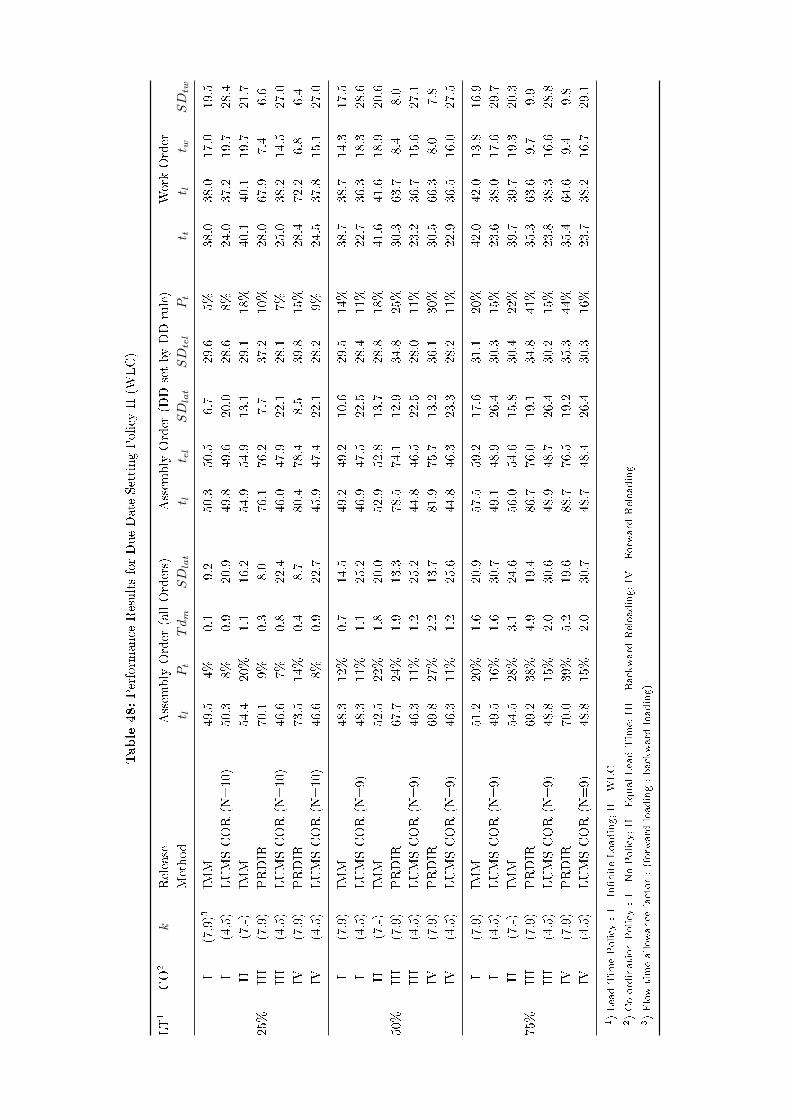
Table
48:Perform
ance
ResultsforDueDate
SettingPolicy
II(W
LC)
LT1
CO
2k
Release
Assem
bly
Order
(allOrders)
Assem
bly
Order
(DDsetbyDDrule)
Work
Order
Method
t lPt
Tdm
SD
lat
t lt e
lSD
lat
SD
tel
Pt
t tt l
t wSD
tw
I(7,9)3
IMM
49.5
4%
0.1
9.2
50.3
50.5
6.7
29.6
5%
38.0
38.0
17.0
19.5
I(4,5)
LUMSCOR(N
=10)
50.3
8%
0.9
20.9
49.8
49.6
20.0
28.6
8%
24.0
37.2
19.7
28.4
II(7,-)
IMM
54.4
20%
1.1
16.2
54.9
54.9
13.1
29.1
18%
40.1
40.1
19.7
21.7
25%
III
(7,9)
PRDIR
70.1
9%
0.3
8.0
76.1
76.2
7.7
37.2
10%
28.0
67.9
7.4
6.6
III
(4,5)
LUMSCOR(N
=10)
46.6
7%
0.8
22.4
46.0
47.9
22.1
28.1
7%
25.0
38.2
14.5
27.0
IV(7,9)
PRDIR
73.5
14%
0.4
8.7
80.4
78.4
8.5
39.8
15%
28.4
72.2
6.8
6.4
IV(4,5)
LUMSCOR(N
=10)
46.6
8%
0.9
22.7
45.9
47.4
22.1
28.2
9%
24.5
37.8
15.1
27.0
I(7,9)
IMM
48.3
12%
0.7
14.5
49.2
49.2
10.6
29.5
14%
38.7
38.7
14.3
17.5
I(4,5)
LUMSCOR(N
=9)
48.3
11%
1.1
25.2
46.9
47.5
22.5
28.4
11%
22.7
36.3
18.3
28.6
II(7,-)
IMM
52.5
22%
1.8
20.0
52.9
52.8
13.7
28.8
18%
41.6
41.6
18.9
20.6
50%
III
(7,9)
PRDIR
67.7
24%
1.9
13.3
78.5
74.1
12.9
34.8
25%
30.3
63.7
8.4
8.0
III
(4,5)
LUMSCOR(N
=9)
46.3
11%
1.2
25.2
44.8
46.5
22.5
28.0
11%
23.2
36.7
15.6
27.1
IV(7,9)
PRDIR
69.8
27%
2.2
13.7
81.9
75.7
13.2
36.1
30%
30.5
66.3
8.0
7.8
IV(4,5)
LUMSCOR(N
=9)
46.3
11%
1.2
25.6
44.8
46.3
23.3
28.2
11%
22.9
36.5
16.0
27.5
I(7,9)
IMM
51.2
20%
1.6
20.9
57.5
59.2
17.6
31.1
20%
42.0
42.0
13.8
16.9
I(4,5)
LUMSCOR(N
=9)
49.5
16%
1.6
30.7
49.1
48.9
26.4
30.3
15%
23.6
38.0
17.6
29.7
II(7,-)
IMM
54.5
28%
3.1
24.6
56.0
54.6
15.8
30.4
22%
39.7
39.7
19.3
20.3
75%
III
(7,9)
PRDIR
69.2
38%
4.9
19.4
86.7
76.0
19.1
34.8
41%
35.3
63.6
9.7
9.9
III
(4,5)
LUMSCOR(N
=9)
48.8
15%
2.0
30.6
48.9
48.7
26.4
30.2
15%
23.8
38.3
16.6
28.8
IV(7,9)
PRDIR
70.0
39%
5.2
19.6
88.7
76.5
19.2
35.3
44%
35.4
64.6
9.4
9.8
IV(4,5)
LUMSCOR(N
=9)
48.8
15%
2.0
30.7
48.7
48.4
26.4
30.3
16%
23.7
38.2
16.7
29.1
1)LeadTim
ePolicy
:I-In�niteLoading;II-WLC
2)Co-ordinationPolicy
:I-NoPolicy;II-EqualLeadTim
e;III-Backward
Reloading;IV
-Forward
Reloading
3)Flowtimeallow
ance
factor:(forward
loading;backward
loading)
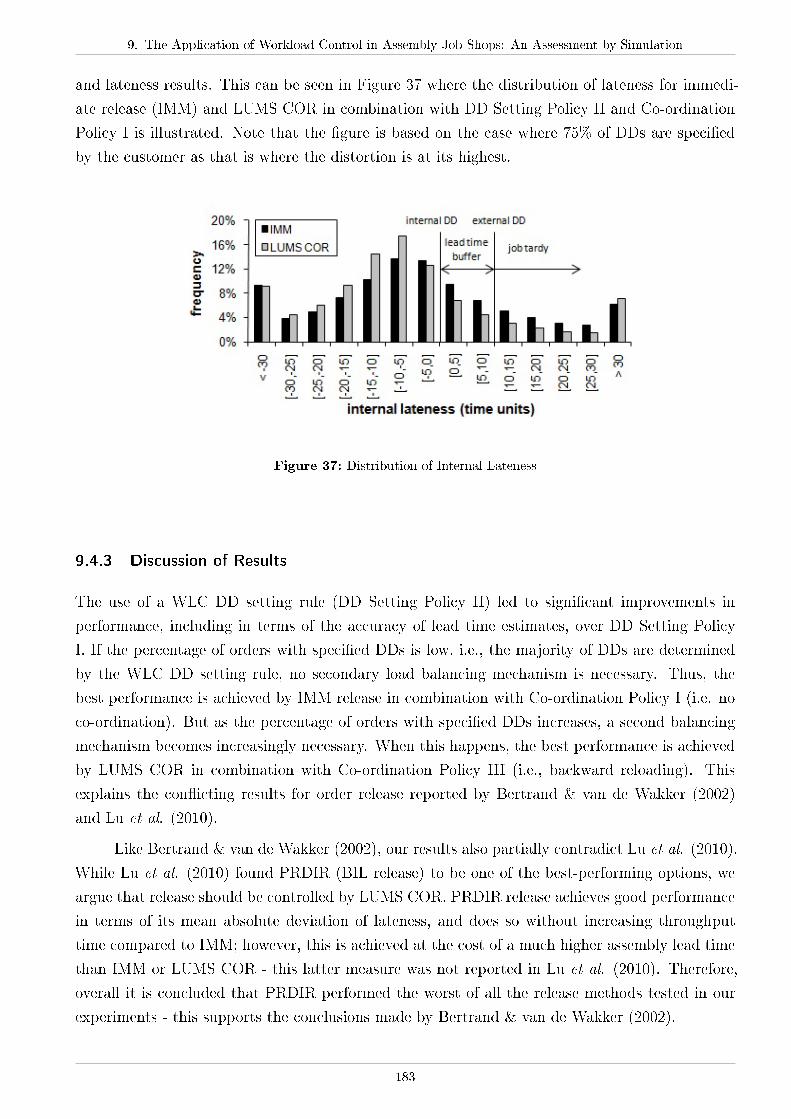
9. The Application of Workload Control in Assembly Job Shops: An Assessment by Simulation
and lateness results. This can be seen in Figure 37 where the distribution of lateness for immedi-
ate release (IMM) and LUMS COR in combination with DD Setting Policy II and Co-ordination
Policy I is illustrated. Note that the �gure is based on the case where 75% of DDs are speci�ed
by the customer as that is where the distortion is at its highest.
Figure 37: Distribution of Internal Lateness
9.4.3 Discussion of Results
The use of a WLC DD setting rule (DD Setting Policy II) led to signi�cant improvements in
performance, including in terms of the accuracy of lead time estimates, over DD Setting Policy
I. If the percentage of orders with speci�ed DDs is low, i.e., the majority of DDs are determined
by the WLC DD setting rule, no secondary load balancing mechanism is necessary. Thus, the
best performance is achieved by IMM release in combination with Co-ordination Policy I (i.e. no
co-ordination). But as the percentage of orders with speci�ed DDs increases, a second balancing
mechanism becomes increasingly necessary. When this happens, the best performance is achieved
by LUMS COR in combination with Co-ordination Policy III (i.e., backward reloading). This
explains the con�icting results for order release reported by Bertrand & van de Wakker (2002)
and Lu et al. (2010).
Like Bertrand & van de Wakker (2002), our results also partially contradict Lu et al. (2010).
While Lu et al. (2010) found PRDIR (BIL release) to be one of the best-performing options, we
argue that release should be controlled by LUMS COR. PRDIR release achieves good performance
in terms of its mean absolute deviation of lateness, and does so without increasing throughput
time compared to IMM; however, this is achieved at the cost of a much higher assembly lead time
than IMM or LUMS COR - this latter measure was not reported in Lu et al. (2010). Therefore,
overall it is concluded that PRDIR performed the worst of all the release methods tested in our
experiments - this supports the conclusions made by Bertrand & van de Wakker (2002).
183

Finally, it should be noted that all of the performance improvements achieved by the WLC
DD setting rule (DD Setting Policy II) and LUMS COR have been achieved without any increase
in capacity. Thus, WLC allows existing capacity to be used more e�ectively; as a result, lead times
and WIP are reduced and tardiness performance is improved. In general, the results highlight the
importance of higher-level control - through customer enquiry management and order release -
over the use of dispatching alone in complex environments, such as assembly job shops.
9.5 Conclusion
Most simulations on the performance of the Workload Control (WLC) concept in job shops have
assumed simple product structures. Meanwhile, empirical research has indicated that "assembly
job shops" may be encountered in practice. The limited work on assembly job shops in the general
production planning and control literature focuses on dispatching, ignoring, for example, the role
of Due Date (DD) setting policies and order release which can play important roles in Make-To-
Order (MTO) contexts. This raises questions for WLC regarding how DDs should be set; and,
how the sub-assemblies or work orders that make up the �nal product should be released from
the pre-shop pool and co-ordinated.
The �ndings of this work underline the potential of the WLC concept for improving perfor-
mance in assembly job shops. Both a WLC DD setting rule and order release method (LUMS
COR) have been shown to have a positive impact on performance when compared to alterna-
tive methods. In response to our research question concerning how WLC should be re�ned to
accommodate the requirements of assembly orders, the results suggest the following:
∙ If DDs are predominantly proposed by the company : the DD setting policy should play the
leading role while the role of order release (LUMS COR) should be limited; and, the progress
of work orders should not be co-ordinated in accordance with the DD of the �nal product.
∙ If DDs are predominantly speci�ed by customers : the importance of order release (LUMS
COR) as a second workload balancing mechanism increases; and, work orders should be
co-ordinated by backward scheduling from the DD of the �nal product.
Future research should build on the contribution of this study. For example, we have assumed
that the assembly time is zero, in order to avoid the e�ects of bottlenecks; and, that there is only
one assembly operation required per �nal product. These assumptions are in line with previous
research on assembly job shops but could be relaxed in the future. Research should investigate
how the assembly time a�ects performance and how to ensure that the work orders of a �nal
product reach the di�erent assembly points on time. Finally, the most important future research
challenge is the successful implementation of WLC in practice.
10 Development and Design of Workload Control Based
Decision Support Systems
10.1 Introduction
This thesis has re�ned the WLC concept to accommodate the challenges that �eld researchers have
encountered in practice. Future research will now seek to implement the re�ned concept. However,
while many of the issues identi�ed (e.g., in Hendry et al., 2008, Stevenson & Silva, 2008), that
relate to order release and CEM have now been addressed, other broader human-related issues
which must be addressed if WLC is to be implemented successfully in practice have not yet been
considered. These are: training and decision making by users of WLC systems; and, the design
of a Decision Support System (DSS) to support the human user. Therefore, before implementing
the re�ned procedure, this section focuses on these issues.
Many simulation studies have demonstrated that WLC can lead to signi�cant performance
improvements in job shops and �ow shops alike (e.g., Oosterman et al., 2000; Kingsman & Hendry,
2002; Land, 2006); however, reports of successful implementation in practice are limited. Part
of the reason for this is that practitioners are often unfamiliar with WLC, meaning resistance to
change is encountered and signi�cant training is required (Stevenson & Silva, 2008). Moreover,
WLC adoption is often coupled with that of a computer system to support WLC-related decision
making, which adds to the complexity of implementation; identifying an appropriate end-user for
the system is often challenging (Hendry et al., 1993). More generally, it has been acknowledged that
Information Systems (IS) often fail to meet pre-implementation expectations (Szajna & Scamell,
1993; McKay & Buzacott, 2000; Calisir & Calisir, 2004), perhaps because most systems are
designed and built without considering human factors (Johannsen, 1995); and, because most
systems are generic tools which are not customized to company-speci�c needs (McKay & Buzacott,
2000; McKay & Wiers, 2003). To overcome these problems which would hinder the successful
implementation of WLC, and in line with the research questions identi�ed by Hendry et al. (2008),
we ask: how can the role of the human decision maker be incorporated within a DSS thus improving
decision making and supporting the learning (training) process? And, how should a DSS based
on the WLC concept be designed to achieve this?
To answer these questions, a literature review is conducted to de�ne how a DSS, and its
human-machine interfaces, should be designed, including both structure speci�c design and graph-
ical design. Structure speci�c design refers to the appropriate de�nition of goals, means and
tasks and graphical design to aesthetical aspects. Several WLC DSS designs are then proposed,
following criterions derived from the literature review and international standards of ISO 9241
(see e.g. Bevan, 1995). The designs are then evaluated following a structural methodology, as
outlined by Park & Lim (1999), to determine the best. Using this methodology, the proposed DSS
are �rst qualitatively evaluated (according to the standards identi�ed from the literature) by the
authors of this study to reduce the number of eligible designs. Secondly, the best two designs are
chosen and investigated in a laboratory study of postgraduate students. A laboratory study is an
important method for evaluating the e�ectiveness of a DSS as companies are not willing to play
the 'guinea pig' - they demand proven solutions (McKay & Buzacott, 2000); furthermore, it has
been shown that postgraduate students are a suitable surrogate for practicing managers (Remus,
1986). For the laboratory study, the DSS designs are coupled with a simulation model and the
postgraduate students control the simulated shop �oor. The objective of the laboratory study is:
to assess which DSS design is most usable and what information is needed to make a decision.
This insight is then used to: guide the design of a WLC-based DSS for implementation in practice;
assess how much knowledge about WLC is necessary to make good decisions; and, assess whether
performance improvements achieved in simulation (see, e.g., Oosterman et al, 2000; Land, 2006;
Thürer et al., 2010a) also hold if the decisions are made by human schedulers with bounded ratio-
nality. As a by-product, the study promotes the concept of WLC among future managers - the
postgraduate students. While the study focuses on WLC, it is argued that there are implications
for any DSS being built for successful implementation in practice; to our knowledge, this is the
�rst time that such a structured approach is followed to design a DSS for production planning
and control.
Only the review is presented here (Section 10.2). The design of the DSS is currently in
process and the laboratory study prepared. Results for these parts of the study will be presented
in the near future.
10.2 Literature Review
This section reviews literature on human-machine interactions and the design of human-machine
interfaces from di�erent disciplines, including ergonomics and behavioural studies. Section 10.2.1
focuses on structure speci�c design in the context of WLC. Structure speci�c design consists of
three elements: goals, means and tasks (Bevan, 1995; Johannsen, 1995; Park & Lim, 1999). In
other words: the de�nition of the typical goals of a company implementing a DSS; the means of
meeting these goals (i.e., through the WLC concept); and, the tasks or roles of humans within the
domain of the DSS. The tasks then de�ne how the DSS should be designed; such a task-oriented
approach is considered by many to be the key to successful DSS design (see, e.g., Johannsen,
1995; Johannsen, 1997; McKay & Wiers, 2003). Section 10.2.2 then summarises principles for the
graphical design of the human-machine interface of the DSS before an assessment of the current
state-of-the-art is presented in Section 10.2.3.
10.2.1 Structure Speci�c Design: Goals, Means and Tasks within the WLC Concept
Goals, means and tasks in the light of the WLC concept are shortly explored in the following
subsections.
10. Development and Design of Workload Control Based Decision Support Systems
10.2.1.1 Goals Typical for Companies Implementing WLC
De�ning goals starts with the following questions: What are the strategic objectives of the com-
pany? And, why does the company need a DSS? Therefore, to de�ne typical goals of companies
which are likely to implement WLC, �eld-based WLC studies have been reviewed. Table 49 sum-
marises empirical WLC research from 1980 to 2009, including company characteristics, company-
oriented objectives or performance measures and outcomes from the studies. Table 49 illustrates
that WLC has been implemented in several industries but mostly in small and medium sized MTO
job shops. Lead time and WIP reduction, by improving due date adherence, are the major goals
de�ned in the cases. While some of the studies achieved these goals, many have failed while the
long term success and sustainability of any performance improvements has not been reported; this
is a common problem not only for WLC but all DSS implementations (McKay & Buzacott, 2000).
10.2.1.2 Means - The WLC Concept
De�ning the appropriate means to achieve the goals starts with the question: How are the objec-
tives (goals) to be achieved? This thesis sought to re�ne the WLC concept in response to problems
encountered by WLC researchers in practice (e.g., from Hendry et al., 2008) which the theory had
not been developed to handle. Moreover, the applicability of the best-performing order release
rules and DD setting rules presented in the literature was assessed under varying shop �oor char-
acteristics. WLC which integrates CEM, controlled order release and e�ective dispatching rule
into one comprehensive PPC solution, signi�cantly reduced WIP and lead times whilst improving
due date adherence. Therefore, it is considered to be the best means of achieving the above goals.
10.2.1.3 Tasks
De�ning the tasks to be accomplished to e�ectively use the means to achieve the goals starts with
the question: How is the means to be used to achieve the goals? The main WLC tasks are to
quote competitive but feasible delivery dates at CEM & to release the right job at the right time
without violating a pre-established level of workload at order release. While in simulation, e.g. at
order release, jobs are released strictly in accordance with the pool selection rule, in practice a user
may deviate from the selection rule; for example, a user may prioritise a particular customer, e.g.,
a repeat customer. Therefore, and in line with authors such as Higgins (1996), McKay & Buzacott
(2000) and Barthelemy et al. (2002) - who argued against a strict computer-based approach to
scheduling - it is argued that, in practice, the user should be the centre of the decision. Instead of
permitting a human user to alter or intervene in computer-generated schedules, the user should
actively participate in the generation of the schedules. Nonetheless, production planning tasks not
only consist of elements which need special attention but also routine elements (Fransoo & Wiers,
2006). Therefore, and in order to reduce the cognitive workload of the human user, the DSS should
o�er the option of making the decision for the human, e.g., by automatically releasing jobs for the
remaining load after the human user has released the jobs that he or she considers most important.
187
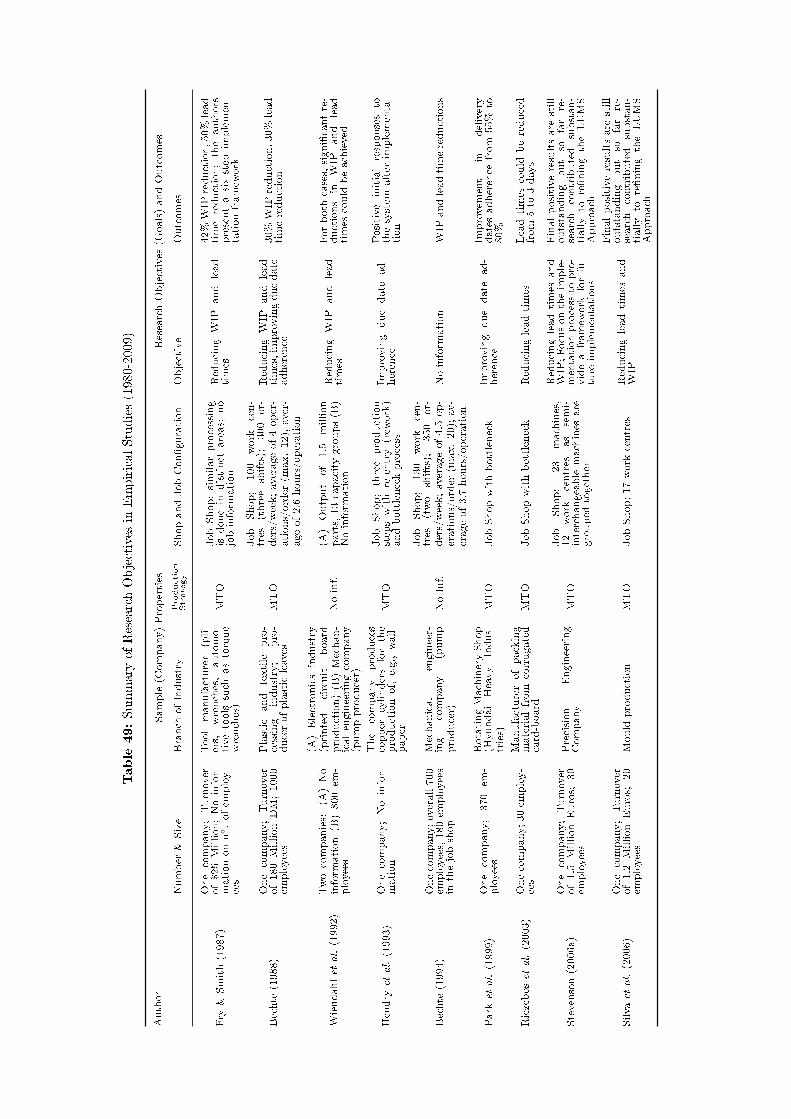
Table
49:Summary
ofResearchObjectives
inEmpiricalStudies(1980-2009)
Author
Sample(C
ompany)Properties
ResearchObjectives
(Goals)andOutcomes
Number
&Size
Branch
ofIndustry
Production
Strategy
ShopandJobCon�guration
Objective
Outcomes
Fry
&Smith(1987)
Onecompany;Turnover
of$25Million;Noinfor-
mationonn∘.ofem
ploy-
ees
Toolmanufacturer
(pli-
ers,
wrenches,
automo-
tivetools
such
astorque
wrenches)
MTO
JobShop;similarprocessing
isdonein
distinct
areas;
no
jobinform
ation
ReducingWIP
andlead
times
42%WIP
reduction,50%lead
timereduction;theauthors
presentasix-stepim
plemen-
tationframew
ork
Bechte
(1988)
Onecompany;Turnover
of180MillionDM;1000
employees
Plastic
and
textile
pro-
cessing
industry;
pro-
ducerofplasticleaves
MTO
Job
Shop;
100
work
cen-
tres
(three
shifts);
300
or-
ders/week;averageof4oper-
ations/order
(max.12),aver-
ageof2.6
hours/operation
ReducingWIP
andlead
times,im
provingduedate
adherence
30%WIP
reduction,30%lead
timereduction
Wiendahletal.(1992)
Twocompanies:
(A)No
inform
ation(B)800em
-ployees
(A)Electronicsindustry
(printed
circuit
board
production)(B)Mechan-
icalengineeringcompany
(pumpproducer)
Noinf.
(A)
Output
of1.5
million
parts,13capacity
groups(B)
Noinform
ation
ReducingWIP
andlead
times
Forboth
cases,signi�cantre-
ductions
inWIP
and
lead
times
could
beachieved
Hendry
etal.(1993)
Onecompany;Noinfor-
mation
The
company
produces
copper
cylindersforthe
productionof,e.g.,wall-
paper
MTO
Job
Shop;threeproduction
stepswithre-entry(rew
ork)
andbottleneckprocess
Improving
duedate
ad-
herence
Positiveinitialresponsesto
thesystem
after
implementa-
tion
Bechte
(1994)
Onecompany;overall700
employees,180em
ployees
inthejobshop
Mechanical
engineer-
ing
company
(pump
producer)
NoInf.
Job
Shop;
130
work
cen-
tres
(two
shifts);
350
or-
ders/week;averageof4.5
op-
erations/order
(max.20);av-
erageof3.7
hours/operation
Noinform
ation
WIP
andleadtimereductions
Park
etal.(1999)
Onecompany;370
em-
ployees
RotatingMachineryShop
(HyundaiHeavy
Indus-
tries)
MTO
JobShopwithbottleneck
Improving
duedate
ad-
herence
Improvem
ent
indelivery
datesadherence
from
55%
to80%
Riezebosetal.(2003)
Onecompany;30em
ploy-
ees
Manufacturerofpacking
materialfrom
corrugated
card-board
MTO
JobShopwithbottleneck
Reducingleadtimes
Leadtimes
could
bereduced
from
5to
3days
Stevenson(2006a)
Onecompany;Turnover
of1.5
MillionEuros;
30
employees
Precision
Engineering
Company
MTO
Job
Shop;
23
machines,
12
work
centres
as
semi-
interchangeable
machines
are
grouped
together
Reducingleadtimes
and
WIP;Focusontheim
ple-
mentationprocessto
pro-
videaframew
ork
forfu-
ture
implementations
Finalpositiveresultsare
still
outstanding
but
sofar
re-
search
contributed
substan-
tiallyto
re�ningtheLUMS
Approach
Silva
etal.(2006)
Onecompany;Turnover
of1.2
MillionEuros;
20
employees
Mould
production
MTO
JobShop;17work
centres
Reducingleadtimes
and
WIP
Finalpositiveresultsare
still
outstanding
but
sofar
re-
search
contributed
substan-
tiallyto
re�ningtheLUMS
Approach
10. Development and Design of Workload Control Based Decision Support Systems
10.2.1.4 Assessment of Goals, Means and Tasks
The goals, means and tasks of the WLC-based DSS can be summarized as follows:
∙ The primary goals of companies which have implemented WLC were the reduction of lead
times, the reduction of WIP and an improved due-date adherence.
∙ The primary mean to achieve these goals has been identi�ed in this study as WLC.
∙ The primary tasks of the user are to quote competitive but feasible delivery dates at CEM
& to select the right jobs to be released at the right time without violating a pre-established
level of workload or WIP at order release. To be able to accomplish these tasks, the DSS
should provide the user with the necessary job and shop information. Therefore, determining
what information is necessary is a key objective for this study. How this information should
be presented forms part of the discussion in the following subsection.
10.2.2 Graphical Design: Guidelines for the Human-Machine Interface of the DSS
The most important criterions that should be considered are summarized in three groups as follows:
1. Design and Functionality : The DSS design should support task perception and performance
(Johannsen, 1995; Higgins, 1995; Park & Lim, 1999). The design and functionality of the
system should be consistent throughout all layers of the human-machine interface (Marcus,
1992; Park & Lim, 1999). Short and diverse tasks should be avoided and the cognitive
workload of the user should be kept low (Bevan, 1995; Oborski, 2004).
2. Presentation: An appropriate level of aggregation for the information presented in the DSS
is required (Higgins, 1996; Oborski, 2004); for example, by using data charts or graphs.
This means that the user does not have to remember data from other screens which would
otherwise imply an unnecessary cognitive workload; at the same time, maintaining a clear
design and avoiding small graphical objects (that prove di�cult to read) is also important.
3. Human Factors : Support and guidance to help the user understand the system (Bevan, 1995;
Lin et al., 1997; Park & Lim, 1999) should be provided. Human errors should be prevented
and corrected (Park & Lim, 1999; Oborski, 2004), e.g., by warning if system parameters are
violated. Exits should be clearly marked and short cuts provided (Lin et al., 1997).
Arguably, the important factor is that the user feels that the DSS has a strong 'usability';
in other words, that it is user-friendly, supports the accomplishment of the tasks and is e�cient in
achieving the goals. Recent studies have underlined the strong link between the perceived aesthetic
appearance of a human-machine interface and the perceived and experienced usability (e.g., Szajna
& Scamell, 1993; Tractinsky, 2000). There is also a strong link between user satisfaction and
perceived and experienced aesthetics and usability (Tractinsky, 2000). Therefore, a DSS should
not only follow the criteria outlined in the bullet points above but also primary rules for the design
of aesthetically appealing human-machine interfaces. The main primary rules are: consistency,
clarity, simplicity and familiarity (Marcus, 1992). Considering the main criterions for the design
189
outlined above, each is described in more detail below:
∙ Consistency : Each unit of the layout grid (i.e., the grid which subdivides the computer
screen) should have visual, conceptual and functional integrity (Marcus, 1992). Data, func-
tions and tools should be organised and presented appropriately to meet the criterions out-
lined in groups one and two above (i.e., Design & Functionality and Presentation).
∙ Clarity : Where possible, lines of text should be kept short, legible and readable. Letters
of serif type, e.g., Times New Roman, should be used where long text is necessary while
short text should be presented in non-serif letter types, e.g., Arial. Colours should be used
with discretion and extreme colours should be avoided. Whereas colours might be more
'enjoyable', they do not improve learning or comprehension more so than the use of black
and white ( Marcus, 1992).
∙ Simplicity : E�cient and simple navigation possibilities should be provided (Marcus, 1992).
Data should be presented in a simple intuitive and easy-to-understand-format. In response
to the criterions outlined in group three (Human Factors) error messages should be clear
and simple (Lin et al., 1997).
∙ Familiarity : The user should feel familiar with the navigation possibilities and the design
of the DSS (Marcus, 1992). Therefore it should follow standards as, e.g., Windows c⃝ or
Linux c⃝.
10.2.3 Assessment of the Literature
WLC signi�cantly improves performance in simulation studies but reports of its successful im-
plementation in practice are limited. To improve the applicability of WLC in practice, several
re�nements of the concept have been proposed in this study; however, it is argued that a good
design of the DSS that facilitates WLC implementation is as important as the design of the con-
cept itself. This design should also respond to the research questions identi�ed by Hendry et al.
(2008), thus improving decision making and supporting the learning (training) process by, e.g., in-
tuitive design. Therefore, this future research project is motivated by the following three research
questions (RQ1, RQ2 and RQ3):
∙ RQ1: How should a DSS be designed so that the means of supporting the user (i.e., WLC)
in accomplishing the tasks of quoting competitive but feasible delivery dates & releasing the
right jobs at the right time is e�ective, thereby achieving a company's goals of reduced lead
times & WIP and improved due date adherence?
∙ RQ2: How much knowledge about WLC must a user have, and what information is necessary,
to make e�ective decisions?
∙ RQ3: Do the performance improvements achieved in simulations also hold when e.g., release
decisions are made by a human with bounded rationality?
10. Development and Design of Workload Control Based Decision Support Systems
To answer the �rst research question, several DSS designs based on WLC are presented by
the authors of this study following the principles outlined in Section 10.2.2. The designs are then
evaluated qualitatively, where each author evaluates the designs of the other, to reduce the number
to two for the laboratory study. In the laboratory study, the two chosen designs are evaluated
by postgraduate students. To answer the second research question, this evaluation is extended by
analysing which information has been perceived as useful when making decisions and how user
performance and knowledge of WLC inter-relate. In light of this analysis, further re�nements to
the DSS design may follow which improve decision making and better support the user during
the training process. Moreover, based on the results of the laboratory study, the third research
question will be answered.
This study will represent the �rst time that such a structural approach is followed to design
a WLC based DSS. It not only provides a response to outstanding research questions raised by
Hendry et al. (2008), thereby facilitating the implementation of WLC in practice, it also will
provide valuable insight about how the human user and the WLC concept interact.
191

Part V.
Conclusion and Future Research
Table of Contents
11. Conclusion 195
11.1. Summary of Results . . . . . . . . . . . . . . . . . . . . . . . . . . . . . . . . . 195
11.2. Final Conclusions . . . . . . . . . . . . . . . . . . . . . . . . . . . . . . . . . . . 198
11.3. Future Research and Acknowledgments . . . . . . . . . . . . . . . . . . . . . . . 199


11. Conclusion
11 Conclusion
11.1 Summary of Results
The main results and conclusions derived from this study can be summarized as follows:
Part II: Literature Review
Literature Review (Section 2): The review began by considering how the �eld of WLC has
evolved towards identifying how it should evolve in the future. In response, a comprehensive
systematic review of the conceptual, analytical, empirical and simulation-based WLC literature
published since 1980 has been conducted. The research �nds that the �eld has evolved substan-
tially. Early research focused on theoretical development and experimental testing of order release
strategies; order release was then integrated with other planning stages, e.g., the customer enquiry
stage, making the concept more suitable for customised manufacturing and leading to a compre-
hensive concept which combines input and output control e�ectively; recent attention has focused
on implementing the resulting concept in practice and re�ning theory. While WLC is well placed
to meet the needs of producers of customised products, future research should include: conducting
further action research into how WLC can be e�ectively implemented in practice; studying human
factors that a�ect WLC; and, feeding back empirical �ndings to simulation-based WLC research
to improve the applicability of WLC theory to real-life job shops.
Part III: Improving the Applicability of Workload Control: Addressing Re-
search Questions
Job Size Variation (Section 3): An original attempt to address the issue of variations in
job size was presented. Several approaches have been tested to satisfy the special requirements
of both small and large jobs and to improve the practical applicability of the WLC methodology.
Results show that giving priority to jobs with a large routing length is a more e�ective solution
to the problem than reserving capacity for each job size or allowing jobs to exceed the norm. The
same conclusion is also shown to be valid for rush orders, where prioritization proved to be the
best solution in order to handle the arrival of rush orders within the WLC concept.
Determination of Workload Norms (Section 4): The objective of this section was to deter-
mine how shop �oor characteristics in�uence workload norms for the two aggregate load methods
which are most suitable for practical implementation in order to help practitioners predict appro-
priate workload norms. Results suggest that the performance of the classical approach is heavily
a�ected by shop �oor characteristics but no direct relationship between the characteristics and
norm to apply could be established. In contrast, results suggest that the performance of the
corrected load approach is not in�uenced by shop �oor characteristics and the workload norm
195
which results in optimum performance is the same for all experiments. Given the changing nature
of MTO production and the di�culties encountered with the classical approach, the corrected
load approach is considered a better and more robust option for implementation in practice. Fu-
ture simulations should investigate the in�uence of di�ering capacities across work centres on the
workload norm while action research should be conducted to apply the �ndings in practice.
Sequence Dependent Set-up Times (Section 5): The successful implementation of WLC in
practice is an enduring challenge. This section contributes by determining how to handle se-
quence dependent set-up times within the design of the WLC concept. Results demonstrate that,
when set-up times are sequence dependent, combining an e�ective WLC order release rule with
an appropriate dispatching rule improves performance over use of a dispatching rule in isolation.
Findings improve understanding of how this key implementation issue can be handled. Future
research should investigate whether the results hold if set-up time parameters are dynamic and
set-up times are not evenly distributed across resources.
Part IV: Re(de)fining the Workload Control concept
Controlled Order Release (Section 6): It has been a widely held view in the literature that
WLC negatively a�ects the performance of dispatching and introduces premature idleness, thereby
deteriorating tardiness results. In response, this study has demonstrated that this is no longer the
case. WLC order release can complement a dispatching rule - they do not have to play con�icting
roles - and both throughput time and tardiness results can in fact be improved simultaneously.
This allows a company to promise shorter and more reliable lead times to its prospective customers.
Moreover, Hopp & Spearman (2004) argued that controlling WIP is the key to a successful pull
production system. Although the authors did not refer to WLC, it has been shown here that the
concept provides an e�ective means of controlling WIP and is consistent with the lean principles
Hopp & Spearman (2004) outlined. Results demonstrate that LUMS OR and the continuous WLC
release methods consistently outperform purely periodic release and Constant WIP (ConWIP).
LUMS OR is considered the best solution in practice due to its excellent performance and ease
of implementation. Findings have signi�cant implications for research and practice: throughput
times & job tardiness results can be improved simultaneously and order release & dispatching
rules can complement each other. Thus, WLC represents an e�ective means of implementing lean
principles in a make-to-order context.
Controlled Order Release & Sequence Dependent Set-up Times (Section 7): This section
has considered how sequence dependent set-up times can best be handled within the design of the
WLC concept in job shops with sequence dependent set-up times. In doing so, it contributes to im-
proving the applicability of the method towards implementation in practice. Results demonstrate
that: controlling order release can more than compensate for performance losses at dispatching,
improving overall performance; and, sequence dependent set-up times can best be handled through
set-up oriented dispatching rules. Although the literature is dominated by purely periodic release
11. Conclusion
methods, "LUMS OR" - which combines continuous and periodic release - is identi�ed as the
best-performing order release method. Interestingly, the �ndings indicate that considering set-up
requirements at release may be counterproductive: con�icting goals between the selection rules
employed at release and dispatching may increase the total set-up time incurred. This reinforces
the importance of dispatching for supporting short-term decisions, such as accommodating set-up
requirements. Future research should consider whether the results hold if set-up times are not
distributed equally across job types and work centres.
Customer Enquiry Management (Section 8): The �ndings of this section demonstrate that
e�ective production planning and control starts with Customer Enquiry Management (CEM) and
continues right through until delivery. WLC represents an appropriate solution for managing
this entire process for the complex scenario of Make-To-Order (MTO) production. The Bertrand
Approach (BdA) has been identi�ed as the best-performing WLC due date setting rule under
all experimental settings. Thus, this rule can be robustly incorporated into the overall design
of the WLC concept. It has also been demonstrated that performance can be further improved
by combining due date setting with controlled order release. The importance of order release
increases when the proportion of orders with due dates already proposed by the customer is high.
Overall, the results support the argument that for WLC to be e�ective, it should be implemented
as a comprehensive concept which incorporates CEM and OR.
Assembly Job Shops (Section 9): This section assessed the performance of WLC in assembly
job shops. The results underline the potential of WLC to improve performance also in production
environments where complex product structures are prevalent as assembly job shops. Both WLC
DD setting rule controlled order release showed a positive impact on performance compared to
the tested alternatives. If DDs are predominantly set by the company rather than the customer,
then the WLC due date setting rule plays the leading role. The in�uence of WLC release should
be restricted. If the customer sets due dates for more orders, a second balancing mechanism as
provided by WLC release gains importance. In this case the work orders of an assembly order
should be co-ordinated by backward in�nite loading.
Design Rules (Section 10): It is argued here that a good design of the DSS that facilitates
WLC implementation is as important as the design of the concept itself. This design should
improve decision making and support the learning (training) process by, e.g., intuitive design.
Arguably, the important factor is that the user feels that the DSS has a strong 'usability'; in
other words, that it is user-friendly, supports the accomplishment of the tasks and is e�cient in
achieving the goals. However, the DSS should not only follow this criteria but also primary rules
for the design of aesthetically appealing human-machine interfaces such as: consistency, clarity,
simplicity and familiarity.
197

11.2 Final Conclusions
This research aggregates three decades of research on Workload Control into a comprehensive
production planning and control concept especially suitable for small and medium sized MTO
companies. Figure 38 summarizes the structure of the resulting WLC concept, which consists
of the two levels of control (CEM and OR) which integrate shop �oor dispatching and Material
Management (MM). MM and dispatching are not considered WLC control levels: they do not
control (or restrict) the workload, they simply manage the existing workload. The corresponding
hierarchy of workloads is shown to the right of the �gure. The proposed structure re-orients on
the structure originally proposed by Kingsman et al. (1989).
Figure 38: Workload Control
The main conclusions for the design of WLC in practice can be summarized as follows:
∙ Customer Enquiry Management (DD setting & capacity planning): The WLC DD setting
rule presented by Bertrand (1983a,b) has been identi�ed as the best performing in this study
(see Section 8). Moreover, the rule also showed to perform well in assembly job shops (see
Section 9)
∙ Order Release: LUMS COR (the corrected version of LUMS OR) has been identi�ed as the
best solution for WLC in practice (see Section 6). Moreover it worked well in conjunction
with e�ective WLC DD setting rules (see Section 8) and in assembly job shops (see Section 9).
Therefore LUMS COR should be incorporated within the design of the concept to control
release and link the upper planning level (CEM) and the shop �oor.
∙ Assembly Job Shops : If DDs are predominantly proposed by the company, CEM should play
the leading role while the role of order release (LUMS COR) should be limited; and, the
progress of work orders should not be co-ordinated in accordance with the DD of the �nal
product. If DDs are predominantly speci�ed by customers, the importance of order release
(LUMS COR) as a second workload balancing mechanism increases; and, work orders should
11. Conclusion
be co-ordinated by backward scheduling from the DD of the �nal product.
∙ Dispatching : WLC and e�ective dispatching can and should play complementary roles.
WLC DD setting rules plan capacity over time. Therefore, for the DD setting rule to
be e�ective dispatching should follow the operation completion dates set by the CEM. The
WLC control levels and the dispatching rule applied should be in concordance.
11.3 Future Research and Acknowledgments
Future research should focus on implementation of the concept and dissemination amongst practi-
tioners. A �rst step in the right direction has been recently presented by researchers from Lancaster
University and Groningen whose empirical research contribution can be seen as complementary
to this study. This study is part of a research co-operation of Dr. Silva, Dr. Stevenson, Dr. Land,
Dr. Fredendall, Dr. Huang and me. I would like to take this chance to thank all of them for
their support; last but not least I would also like to thank Dr. Hendry, Dr. Melnyk, Dr. Godinho
Filho and Pedro Martins for their support. For me the most important future research issue is to
continue and extend current research co-operation.
199

Part VI.
Appendix
Table of Contents
A. Literature Review 203
A.1. Citation/Co-Citation Analysis . . . . . . . . . . . . . . . . . . . . . . . . . . . . 203
B. WLC Database 215
C. Simulation Model 231
C.1. Simulation Model . . . . . . . . . . . . . . . . . . . . . . . . . . . . . . . . . . . 231
C.2. Evaluation of Results . . . . . . . . . . . . . . . . . . . . . . . . . . . . . . . . . 242
D. References 245

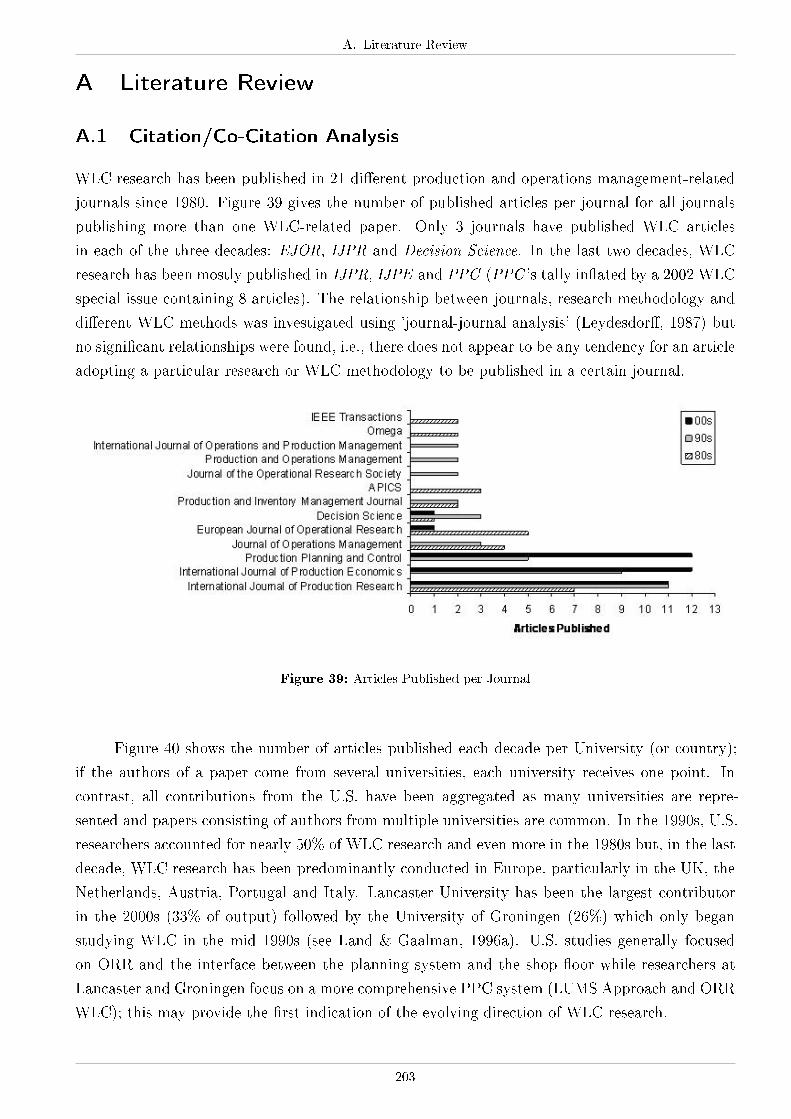
A. Literature Review
A Literature Review
A.1 Citation/Co-Citation Analysis
WLC research has been published in 21 di�erent production and operations management-related
journals since 1980. Figure 39 gives the number of published articles per journal for all journals
publishing more than one WLC-related paper. Only 3 journals have published WLC articles
in each of the three decades: EJOR, IJPR and Decision Science. In the last two decades, WLC
research has been mostly published in IJPR, IJPE and PPC (PPC 's tally in�ated by a 2002 WLC
special issue containing 8 articles). The relationship between journals, research methodology and
di�erent WLC methods was investigated using 'journal-journal analysis' (Leydesdor�, 1987) but
no signi�cant relationships were found, i.e., there does not appear to be any tendency for an article
adopting a particular research or WLC methodology to be published in a certain journal.
Figure 39: Articles Published per Journal
Figure 40 shows the number of articles published each decade per University (or country);
if the authors of a paper come from several universities, each university receives one point. In
contrast, all contributions from the U.S. have been aggregated as many universities are repre-
sented and papers consisting of authors from multiple universities are common. In the 1990s, U.S.
researchers accounted for nearly 50% of WLC research and even more in the 1980s but, in the last
decade, WLC research has been predominantly conducted in Europe, particularly in the UK, the
Netherlands, Austria, Portugal and Italy. Lancaster University has been the largest contributor
in the 2000s (33% of output) followed by the University of Groningen (26%) which only began
studying WLC in the mid 1990s (see Land & Gaalman, 1996a). U.S. studies generally focused
on ORR and the interface between the planning system and the shop �oor while researchers at
Lancaster and Groningen focus on a more comprehensive PPC system (LUMS Approach and ORR
WLC); this may provide the �rst indication of the evolving direction of WLC research.
203
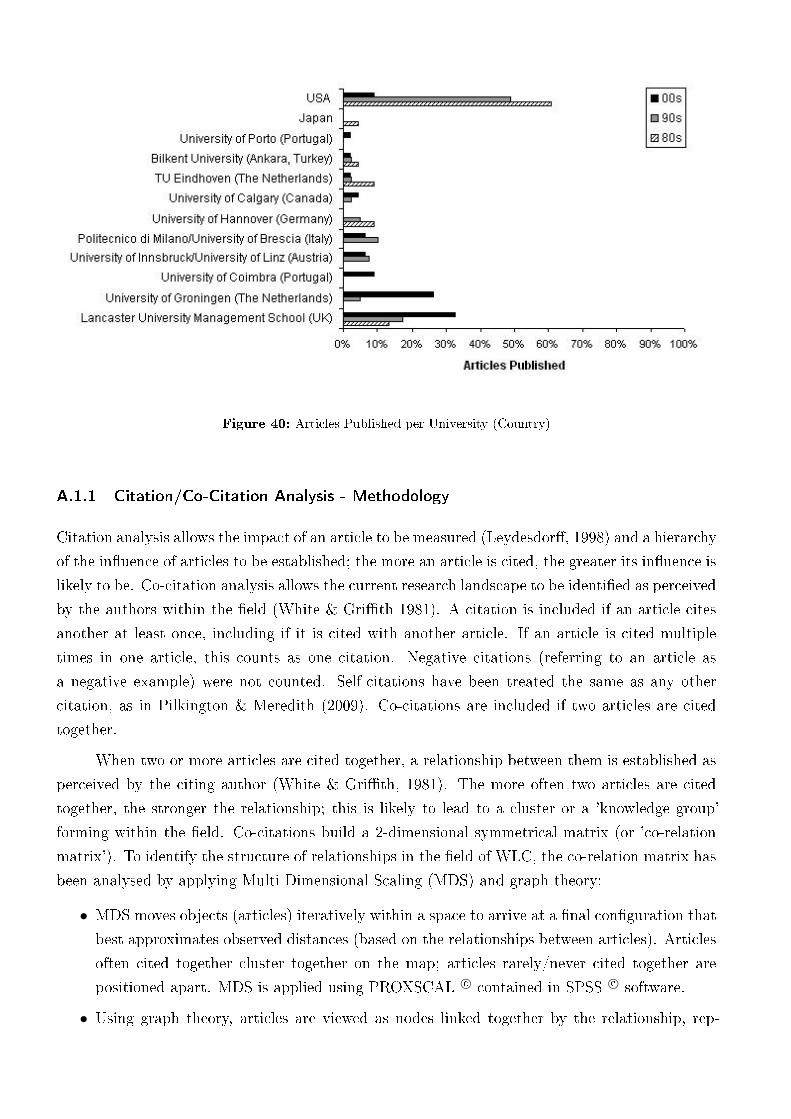
Figure 40: Articles Published per University (Country)
A.1.1 Citation/Co-Citation Analysis - Methodology
Citation analysis allows the impact of an article to be measured (Leydesdor�, 1998) and a hierarchy
of the in�uence of articles to be established; the more an article is cited, the greater its in�uence is
likely to be. Co-citation analysis allows the current research landscape to be identi�ed as perceived
by the authors within the �eld (White & Gri�th 1981). A citation is included if an article cites
another at least once, including if it is cited with another article. If an article is cited multiple
times in one article, this counts as one citation. Negative citations (referring to an article as
a negative example) were not counted. Self-citations have been treated the same as any other
citation, as in Pilkington & Meredith (2009). Co-citations are included if two articles are cited
together.
When two or more articles are cited together, a relationship between them is established as
perceived by the citing author (White & Gri�th, 1981). The more often two articles are cited
together, the stronger the relationship; this is likely to lead to a cluster or a 'knowledge group'
forming within the �eld. Co-citations build a 2-dimensional symmetrical matrix (or 'co-relation
matrix'). To identify the structure of relationships in the �eld of WLC, the co-relation matrix has
been analysed by applying Multi-Dimensional Scaling (MDS) and graph theory:
∙ MDS moves objects (articles) iteratively within a space to arrive at a �nal con�guration that
best approximates observed distances (based on the relationships between articles). Articles
often cited together cluster together on the map; articles rarely/never cited together are
positioned apart. MDS is applied using PROXSCAL c⃝ contained in SPSS c⃝ software.
∙ Using graph theory, articles are viewed as nodes linked together by the relationship, rep-

A. Literature Review
resented by lines which create a relationship network. The NETDRAW c⃝ analysis tool
(Borgatti et al., 2002) has been used to manipulate the data, applying a spring-based al-
gorithm to position the articles (see Eades, 1984). PROXSCAL c⃝ informed the analysis
of results more than NETDRAW c⃝ but does not provide the functionality to indicate the
strength of a relationship using the thickness of the line (a problem identi�ed by Leydesdor�
& Vaughan, 2006); therefore, the two software tools have been combined.
A.1.2 Citation Analysis
Papers have been ranked according to citation frequency by dividing the number of papers in the
database citing an article by the number of WLC papers published since a study appeared. This
may favour recent articles highly cited in a short space of time but yet to demonstrate longevity;
however, as recent research is most important for determining the future evolution of WLC, this
was considered appropriate. Articles have also been ranked according to impact in the 1990s and
since 2000 individually to compensate (rankings for the 1980s have been omitted due to the lack
of available studies at that time). Table 50 summarises the results, also indicating: which paper
made the �rst reference to a study (note: articles are typically cited for the �rst time two years
after publication), the number of citations (in brackets) and changes in citation frequency (from
the 1980s to 1990s and from the 1990s to 2000s).
The most in�uential articles are conceptual; the highest ranked being the comparison by
Stevenson et al. (2005). The highest ranking analytical article is arguably Kingsman (2000);
however, in most cases the paper is cited because of its conceptual content; the same argument
is valid of the highest ranking empirical studies (Bechte, 1988; Stevenson, 2006a). The highest
ranking simulation studies are by Oosterman et al. (2000) and Melnyk & Ragatz (1989), the latter
being used as the basis for most recent job shop simulation models.
The �rst six papers in the table have a citation frequency around 60% overall and since 2000.
Excluding Bergamaschi et al. (1997), which is important for its classi�cation of order release rules,
all of these articles view WLC as a comprehensive PPC concept. Authors focusing on the classical
ORR concept have been ranked lower in the last decade (also a�ecting overall ranking). The most
in�uential article on ORR is the simulation study by Baker (1984), ranked �rst in the 1980s and
1990s but with 40% negative growth from the 1990s to 2000s. The second largest negative growth
is for Bertrand (1983a) followed by Ragatz & Mabert (1988). All three articles are highly related,
as will become evident in the co-citation analysis. The articles with the most positive growth from
the 1990s to the 2000s relate to the LUMS Approach or the ORR WLC approach from Groningen.
This further suggests that research on the classical ORR concept has stagnated signi�cantly and
been replaced by research on WLC as a comprehensive PPC concept (LUMS Approach and ORR
WLC).
205
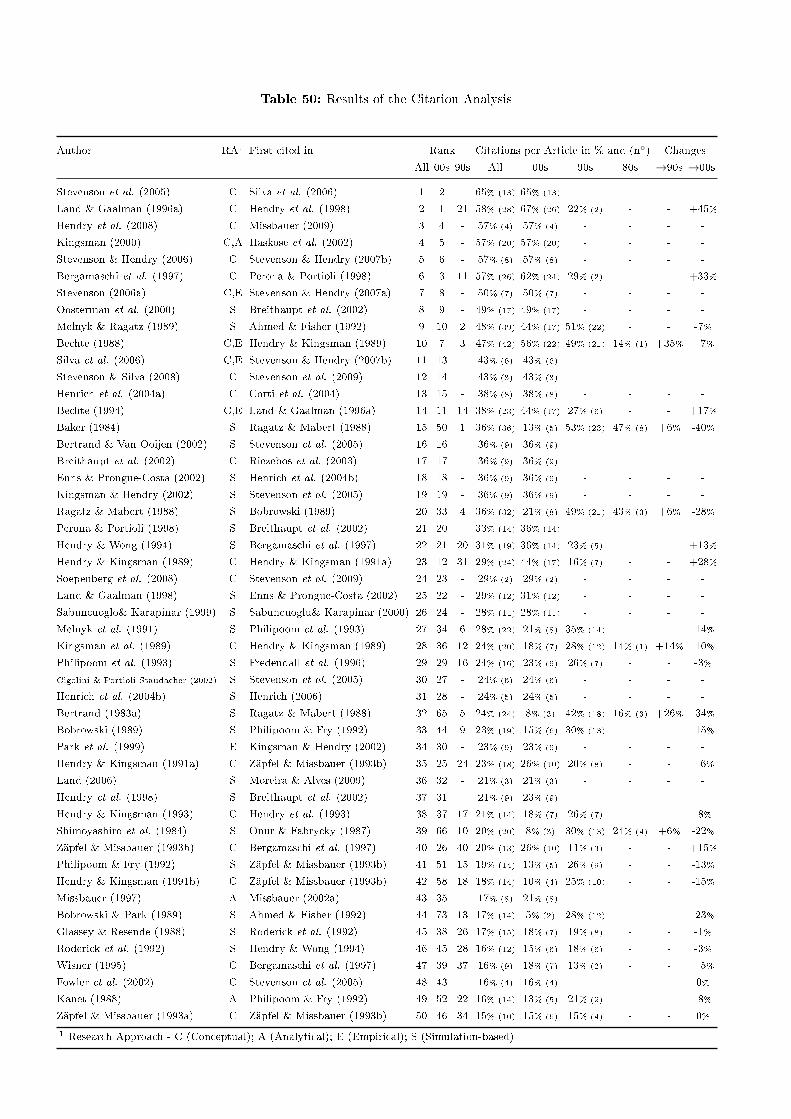
Table 50: Results of the Citation Analysis
Author RA1 First cited in Rank Citations per Article in % and (n∘) Changes
All 00s 90s All 00s 90s 80s →90s →00s
Stevenson et al. (2005) C Silva et al. (2006) 1 2 - 65% (13) 65% (13) - - - -
Land & Gaalman (1996a) C Hendry et al. (1998) 2 1 21 58% (28) 67% (26) 22% (2) - - +45%
Hendry et al. (2008) C Missbauer (2009) 3 4 - 57% (4) 57% (4) - - - -
Kingsman (2000) C,A Haskose et al. (2002) 4 5 - 57% (20) 57% (20) - - - -
Stevenson & Hendry (2006) C Stevenson & Hendry (2007b) 5 6 - 57% (8) 57% (8) - - - -
Bergamaschi et al. (1997) C Perona & Portioli (1998) 6 3 11 57% (26) 62% (24) 29% (2) - - +33%
Stevenson (2006a) C,E Stevenson & Hendry (2007a) 7 8 - 50% (7) 50% (7) - - - -
Oosterman et al. (2000) S Breithaupt et al. (2002) 8 9 - 49% (17) 49% (17) - - - -
Melnyk & Ragatz (1989) S Ahmed & Fisher (1992) 9 10 2 48% (39) 44% (17) 51% (22) - - -7%
Bechte (1988) C,E Hendry & Kingsman (1989) 10 7 3 47% (42) 56% (22) 49% (21) 14% (1) +35% +7%
Silva et al. (2006) C,E Stevenson & Hendry (2007b) 11 13 - 43% (6) 43% (6) - - - -
Stevenson & Silva (2008) C Stevenson et al. (2009) 12 14 - 43% (3) 43% (3) - - - -
Henrich et al. (2004a) C Corti et al. (2004) 13 15 - 38% (8) 38% (8) - - - -
Bechte (1994) C,E Land & Gaalman (1996a) 14 11 14 38% (23) 44% (17) 27% (6) - - +17%
Baker (1984) S Ragatz & Mabert (1988) 15 50 1 36% (36) 13% (5) 53% (23) 47% (8) +6% -40%
Bertrand & Van Ooijen (2002) S Stevenson et al. (2005) 16 16 - 36% (9) 36% (9) - - - -
Breithaupt et al. (2002) C Riezebos et al. (2003) 17 17 - 36% (9) 36% (9) - - - -
Enns & Prongue-Costa (2002) S Henrich et al. (2004b) 18 18 - 36% (9) 36% (9) - - - -
Kingsman & Hendry (2002) S Stevenson et al. (2005) 19 19 - 36% (9) 36% (9) - - - -
Ragatz & Mabert (1988) S Bobrowski (1989) 20 33 4 36% (32) 21% (8) 49% (21) 43% (3) +6% -28%
Perona & Portioli (1998) S Breithaupt et al. (2002) 21 20 - 33% (14) 36% (14) - - - -
Hendry & Wong (1994) S Bergamaschi et al. (1997) 22 21 20 31% (19) 36% (14) 23% (5) - - +13%
Hendry & Kingsman (1989) C Hendry & Kingsman (1991a) 23 12 31 29% (24) 44% (17) 16% (7) - - +28%
Soepenberg et al. (2008) C Stevenson et al. (2009) 24 23 - 29% (2) 29% (2) - - - -
Land & Gaalman (1998) S Enns & Prongue-Costa (2002) 25 22 - 29% (12) 31% (12) - - - -
Sabuncuoglo& Karapinar (1999) S Sabuncuoglu& Karapinar (2000) 26 24 - 28% (11) 28% (11) - - - -
Melnyk et al. (1991) S Philipoom et al. (1993) 27 34 6 28% (22) 21% (8) 35% (14) - - -14%
Kingsman et al. (1989) C Hendry & Kingsman (1989) 28 36 12 24% (20) 18% (7) 28% (12) 14% (1) +14% -10%
Philipoom et al. (1993) S Fredendall et al. (1996) 29 29 16 24% (16) 23% (9) 26% (7) - - -3%
Cigolini & Portioli-Staudacher (2002) S Stevenson et al. (2005) 30 27 - 24% (6) 24% (6) - - - -
Henrich et al. (2004b) S Henrich (2006) 31 28 - 24% (5) 24% (5) - - - -
Bertrand (1983a) S Ragatz & Mabert (1988) 32 65 5 24% (24) 8% (3) 42% (18) 16% (3) +26% -34%
Bobrowski (1989) S Philipoom & Fry (1992) 33 44 9 23% (19) 15% (6) 30% (13) - - -15%
Park et al. (1999) E Kingsman & Hendry (2002) 34 30 - 23% (9) 23% (9) - - - -
Hendry & Kingsman (1991a) C Zäpfel & Missbauer (1993b) 35 25 24 23% (18) 26% (10) 20% (8) - - +6%
Land (2006) S Moreira & Alves (2009) 36 32 - 21% (3) 21% (3) - - - -
Hendry et al. (1998) S Breithaupt et al. (2002) 37 31 - 21% (9) 23% (9) - - - -
Hendry & Kingsman (1993) C Hendry et al. (1993) 38 37 17 21% (14) 18% (7) 26% (7) - - -8%
Shimoyashiro et al. (1984) S Onur & Fabrycky (1987) 39 66 10 20% (20) 8% (3) 30% (13) 24% (4) +6% -22%
Zäpfel & Missbauer (1993b) C Bergamaschi et al. (1997) 40 26 40 20% (13) 26% (10) 11% (3) - - +15%
Philipoom & Fry (1992) S Zäpfel & Missbauer (1993b) 41 51 15 19% (14) 13% (5) 26% (9) - - -13%
Hendry & Kingsman (1991b) C Zäpfel & Missbauer (1993b) 42 58 18 18% (14) 10% (4) 25% (10) - - -15%
Missbauer (1997) A Missbauer (2002a) 43 35 - 17% (8) 21% (8) - - - -
Bobrowski & Park (1989) S Ahmed & Fisher (1992) 44 73 13 17% (14) 5% (2) 28% (12) - - -23%
Glassey & Resende (1988) S Roderick et al. (1992) 45 38 26 17% (15) 18% (7) 19% (8) - - -1%
Roderick et al. (1992) S Hendry & Wong (1994) 46 45 28 16% (12) 15% (6) 18% (6) - - -3%
Wisner (1995) C Bergamaschi et al. (1997) 47 39 37 16% (9) 18% (7) 13% (2) - - +5%
Fowler et al. (2002) C Stevenson et al. (2005) 48 43 - 16% (4) 16% (4) - - - 0%
Kanet (1988) A Philipoom & Fry (1992) 49 52 22 16% (14) 13% (5) 21% (9) - - -8%
Zäpfel & Missbauer (1993a) C Zäpfel & Missbauer (1993b) 50 46 34 15% (10) 15% (6) 15% (4) - - 0%
1 Research Approach - C (Conceptual); A (Analytical); E (Empirical); S (Simulation-based)
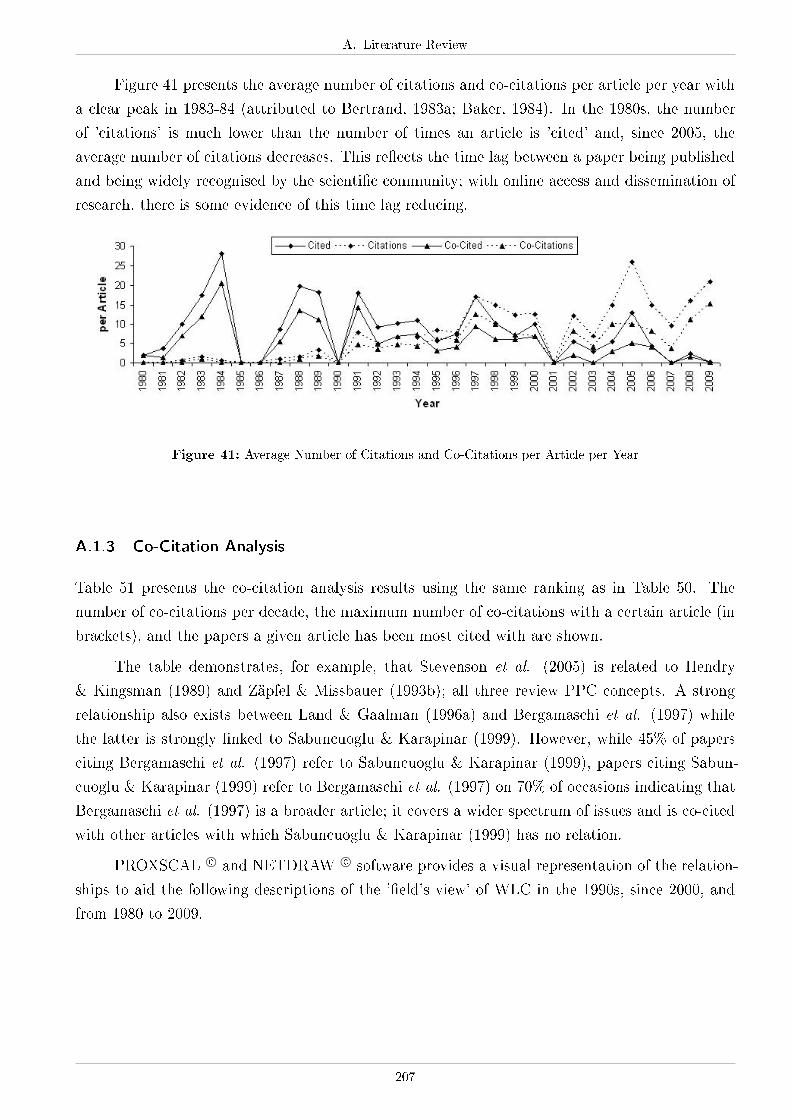
A. Literature Review
Figure 41 presents the average number of citations and co-citations per article per year with
a clear peak in 1983-84 (attributed to Bertrand, 1983a; Baker, 1984). In the 1980s, the number
of 'citations' is much lower than the number of times an article is 'cited' and, since 2005, the
average number of citations decreases. This re�ects the time lag between a paper being published
and being widely recognised by the scienti�c community; with online access and dissemination of
research, there is some evidence of this time lag reducing.
Figure 41: Average Number of Citations and Co-Citations per Article per Year
A.1.3 Co-Citation Analysis
Table 51 presents the co-citation analysis results using the same ranking as in Table 50. The
number of co-citations per decade, the maximum number of co-citations with a certain article (in
brackets), and the papers a given article has been most cited with are shown.
The table demonstrates, for example, that Stevenson et al. (2005) is related to Hendry
& Kingsman (1989) and Zäpfel & Missbauer (1993b); all three review PPC concepts. A strong
relationship also exists between Land & Gaalman (1996a) and Bergamaschi et al. (1997) while
the latter is strongly linked to Sabuncuoglu & Karapinar (1999). However, while 45% of papers
citing Bergamaschi et al. (1997) refer to Sabuncuoglu & Karapinar (1999), papers citing Sabun-
cuoglu & Karapinar (1999) refer to Bergamaschi et al. (1997) on 70% of occasions indicating that
Bergamaschi et al. (1997) is a broader article; it covers a wider spectrum of issues and is co-cited
with other articles with which Sabuncuoglu & Karapinar (1999) has no relation.
PROXSCAL c⃝ and NETDRAW c⃝ software provides a visual representation of the relation-
ships to aid the following descriptions of the '�eld's view' of WLC in the 1990s, since 2000, and
from 1980 to 2009.
207

Table
51:ResultsoftheCo-CitationAnalysis
Author
R1
n∘ofCo-Citations(m
ost
with)
Articlemost
co-cited
with
All
00s
90s
80s
All
00s
90s
Stevenson
etal.(2005)
15(2)
5(2)
00
Hendry
&Kingsm
an(1989),
Zäpfel&
Missbauer
(1993b)
Hendry
&Kingsm
an(1989),
Zäpfel&
Missbauer
(1993b)
-
Land&
Gaalm
an(1996a)
214(6)
14(6)
00
Bergamaschietal.(1997)
Bergamaschietal.(1997)
-
Hendry
etal.(2008)
33(2)
3(2)
00
Stevenson(2006a)
Stevenson(2006a)
-
Kingsm
an(2000)
416(6)
16(6)
00
Hendry
&Kingsm
an(1991a),
Stevenson&
Hendry
(2006)
Hendry
&Kingsm
an(1991a),
Stevenson&
Hendry
(2006)
-
Stevenson&
Hendry
(2006)
58(6)
8(6)
00
Kingsm
an(2000)
Kingsm
an(2000)
-
Bergamaschietal.(1997)
616(7)
15(7)
1(1)
0Sabuncuoglu
&Karapinar(1999)
Sabuncuoglu&
Karapinar(1999)
Perona&
Portioli(1996),
Bechte
(1988)
Stevenson(2006a)
76(3)
6(3)
00
Silva
etal.(2006)
Silva
etal.(2006)
-
Oosterman
etal.(2000)
89(4)
9(4)
00
Land&
Gaalm
an(1998)
Land&
Gaalm
an(1998)
-
Melnyk&
Ragatz
(1989)
920(7)
8(3)
12(4)
0Melnyk
etal(1991)
Melnyk
etal(1991)
Melnyk
etal(1991)
Bechte
(1988)
10
31(15)
19(10)
12(5)
0Bechte
(1994)
Bechte
(1994)
Bechte
(1994)
Silva
etal.(2006)
11
5(3)
5(3)
00
Stevenson(2006a)
Stevenson(2006a)
-
Stevenson&
Silva
(2008)
12
3(2)
3(2)
00
Silva
etal.(2006)
Silva
etal.(2006)
-
Henrich
etal.(2004a)
13
4(1)
4(1)
00
SeveralArticles
SeveralArticles
-
Bechte
(1994)
14
19(15)
13(10)
6(5)
0Bechte
(1988)
Bechte
(1988)
Bechte
(1988)
Baker
(1984)
15
26(15)
4(2)
16(10)
5(3)
Bertrand(1983a)
Bertrand(1983a),
Melnyk&
Ragatz
(1989)
Bertrand(1983a)
Bertrand&
VanOoijen
(2002)
16
5(2)
5(2)
00
Hendry
&Kingsm
an(2002)
Hendry
&Kingsm
an(2002)
-
Breithauptetal.(2002)
17
2(1)
2(1)
00
SeveralArticles
SeveralArticles
-
Enns&
Prongue-Costa(2002)
18
4(2)
4(2)
00
Park
&Salegna(1995),
Oosterman
etal.(2000)
Park
&Salegna(1995),
Oosterman
etal.(2000)
-
Kingsm
an&
Hendry
(2002)
19
5(3)
5(3)
00
Kingsm
an(2000),
Stevenson&
Hendry
(2006)
Kingsm
an(2000),
Stevenson&
Hendry
(2006)
-
Ragatz
&Mabert(1988)
20
22(8)
6(3)
14(6)
2(1)
Shim
oyashiro
etal.(1984)
Shim
oyashiro
etal.(1984)
Bertrand(1983a),
Bobrowski&
Park
(1989)
Perona&
Portioli(1998)
21
8(3)
8(3)
00
Oosterman
etal.(2000)
Oosterman
etal.(2000)
-
Hendry
&Wong(1994)
22
10(4)
8(2)
2(2)
0Melnyk
etal.(1991)
Melnyk
etal.(1991),
Hendry
&Kingsm
an(1991a)
Melnyk
etal.(1991)
Hendry
&Kingsm
an(1989)
23
11(4)
10(4)
1(1)
0Zäpfel&
Missbauer
(1993b),
Kingsm
an(2000)
Hendry
&Kingsm
an(1991a),
Kingsm
an(2000)
Zäpfel&
Missbauer
(1993b)
Soepenberg
etal.(2008)
24
00
00
--
-
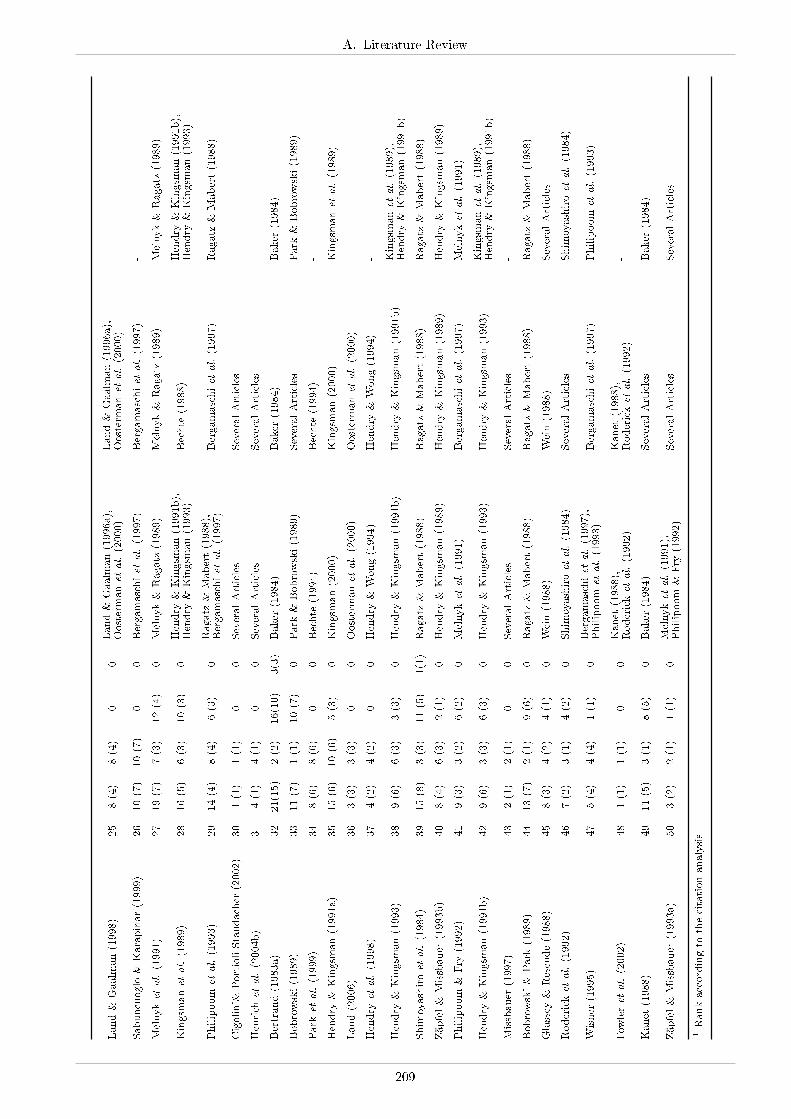
A. Literature Review
Land&
Gaalm
an(1998)
25
8(4)
8(4)
00
Land&
Gaalm
an(1996a),
Oosterman
etal.(2000)
Land&
Gaalm
an(1996a),
Oosterman
etal.(2000)
-
Sabuncuoglo
&Karapinar(1999)
26
10(7)
10(7)
00
Bergamaschietal.(1997)
Bergamaschietal.(1997)
-
Melnyk
etal.(1991)
27
19(7)
7(3)
12(4)
0Melnyk&
Ragatz
(1989)
Melnyk&
Ragatz
(1989)
Melnyk&
Ragatz
(1989)
Kingsm
an
etal.(1989)
28
16(5)
6(3)
10(3)
0Hendry
&Kingsm
an(1991b),
Hendry
&Kingsm
an(1993)
Bechte
(1988)
Hendry
&Kingsm
an(1991b),
Hendry
&Kingsm
an(1993)
Philipoom
etal.(1993)
29
14(4)
8(4)
6(3)
0Ragatz
&Mabert(1988),
Bergamaschietal.(1997)
Bergamaschietal.(1997)
Ragatz
&Mabert(1988)
Cigolini&
Portioli-Staudacher
(2002)
30
1(1)
1(1)
00
SeveralArticles
SeveralArticles
-
Henrich
etal.(2004b)
31
4(1)
4(1)
00
SeveralArticles
SeveralArticles
-
Bertrand(1983a)
32
21(15)
2(2)
16(10)
3(3)
Baker
(1984)
Baker
(1984)
Baker
(1984)
Bobrowski(1989)
33
11(7)
1(1)
10(7)
0Park
&Bobrowski(1989)
SeveralArticles
Park
&Bobrowski(1989)
Park
etal.(1999)
34
8(6)
8(6)
00
Bechte
(1994)
Bechte
(1994)
-
Hendry
&Kingsm
an(1991a)
35
15(6)
10(6)
5(3)
0Kingsm
an(2000)
Kingsm
an(2000)
Kingsm
an
etal.(1989)
Land(2006)
36
3(3)
3(3)
00
Oosterman
etal.(2000)
Oosterman
etal.(2000)
-
Hendry
etal.(1998)
37
4(2)
4(2)
00
Hendry
&Wong(1994)
Hendry
&Wong(1994)
-
Hendry
&Kingsm
an(1993)
38
9(6)
6(3)
3(3)
0Hendry
&Kingsm
an(1991b)
Hendry
&Kingsm
an(1991b)
Kingsm
an
etal.(1989),
Hendry
&Kingsm
an(1991b)
Shim
oyashiro
etal.(1984)
39
15(8)
3(3)
11(5)
1(1)
Ragatz
&Mabert(1988)
Ragatz
&Mabert(1988)
Ragatz
&Mabert(1988)
Zäpfel&
Missbauer
(1993b)
40
8(4)
6(3)
2(1)
0Hendry
&Kingsm
an(1989)
Hendry
&Kingsm
an(1989)
Hendry
&Kingsm
an(1989)
Philipoom
&Fry
(1992)
41
9(3)
3(2)
6(2)
0Melnyk
etal.(1991)
Bergamaschietal.(1997)
Melnyk
etal.(1991)
Hendry
&Kingsm
an(1991b)
42
9(6)
3(3)
6(3)
0Hendry
&Kingsm
an(1993)
Hendry
&Kingsm
an(1993)
Kingsm
an
etal.(1989),
Hendry
&Kingsm
an(1991b)
Missbauer
(1997)
43
2(1)
2(1)
00
SeveralArticles
SeveralArticles
-
Bobrowski&
Park
(1989)
44
13(7)
2(1)
9(6)
0Ragatz
&Mabert(1988)
Ragatz
&Mabert(1988)
Ragatz
&Mabert(1988)
Glassey
&Resende(1988)
45
8(3)
4(2)
4(1)
0Wein(1988)
Wein(1988)
SeveralArticles
Roderick
etal.(1992)
46
7(2)
3(1)
4(2)
0Shim
oyashiro
etal.(1984)
SeveralArticles
Shim
oyashiro
etal.(1984)
Wisner
(1995)
47
5(4)
4(4)
1(1)
0Bergamaschietal.(1997),
Philipoom
etal.(1993)
Bergamaschietal.(1997)
Philipoom
etal.(1993)
Fow
leretal.(2002)
48
1(1)
1(1)
00
Kanet
(1988),
Roderick
etal.(1992)
Kanet
(1988),
Roderick
etal.(1992)
-
Kanet
(1988)
49
11(5)
3(1)
8(5)
0Baker
(1984)
SeveralArticles
Baker
(1984)
Zäpfel&
Missbauer
(1993a)
50
3(2)
2(1)
1(1)
0Melnyk
etal.(1991),
Philipoom
&Fry
(1992)
SeveralArticles
SeveralArticles
1Rankaccordingto
thecitationanalysis
209
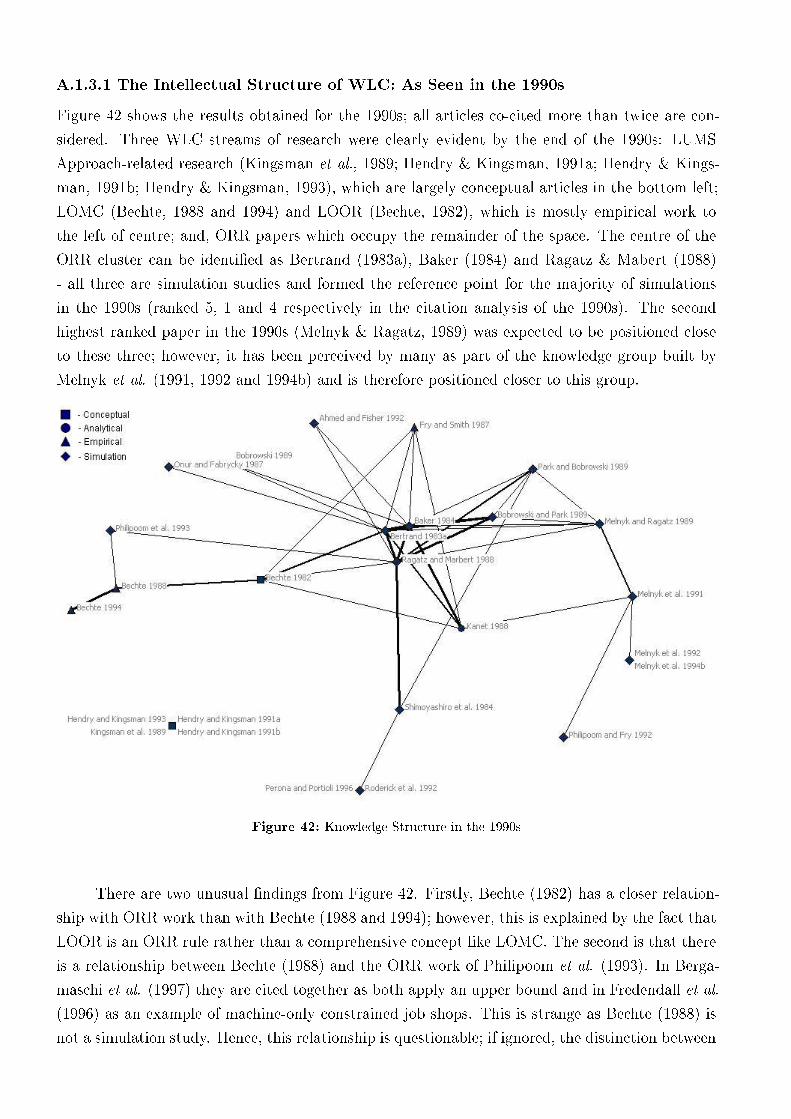
A.1.3.1 The Intellectual Structure of WLC: As Seen in the 1990s
Figure 42 shows the results obtained for the 1990s; all articles co-cited more than twice are con-
sidered. Three WLC streams of research were clearly evident by the end of the 1990s: LUMS
Approach-related research (Kingsman et al., 1989; Hendry & Kingsman, 1991a; Hendry & Kings-
man, 1991b; Hendry & Kingsman, 1993), which are largely conceptual articles in the bottom left;
LOMC (Bechte, 1988 and 1994) and LOOR (Bechte, 1982), which is mostly empirical work to
the left of centre; and, ORR papers which occupy the remainder of the space. The centre of the
ORR cluster can be identi�ed as Bertrand (1983a), Baker (1984) and Ragatz & Mabert (1988)
- all three are simulation studies and formed the reference point for the majority of simulations
in the 1990s (ranked 5, 1 and 4 respectively in the citation analysis of the 1990s). The second
highest ranked paper in the 1990s (Melnyk & Ragatz, 1989) was expected to be positioned close
to these three; however, it has been perceived by many as part of the knowledge group built by
Melnyk et al. (1991, 1992 and 1994b) and is therefore positioned closer to this group.
Figure 42: Knowledge Structure in the 1990s
There are two unusual �ndings from Figure 42. Firstly, Bechte (1982) has a closer relation-
ship with ORR work than with Bechte (1988 and 1994); however, this is explained by the fact that
LOOR is an ORR rule rather than a comprehensive concept like LOMC. The second is that there
is a relationship between Bechte (1988) and the ORR work of Philipoom et al. (1993). In Berga-
maschi et al. (1997) they are cited together as both apply an upper bound and in Fredendall et al.
(1996) as an example of machine-only constrained job shops. This is strange as Bechte (1988) is
not a simulation study. Hence, this relationship is questionable; if ignored, the distinction between
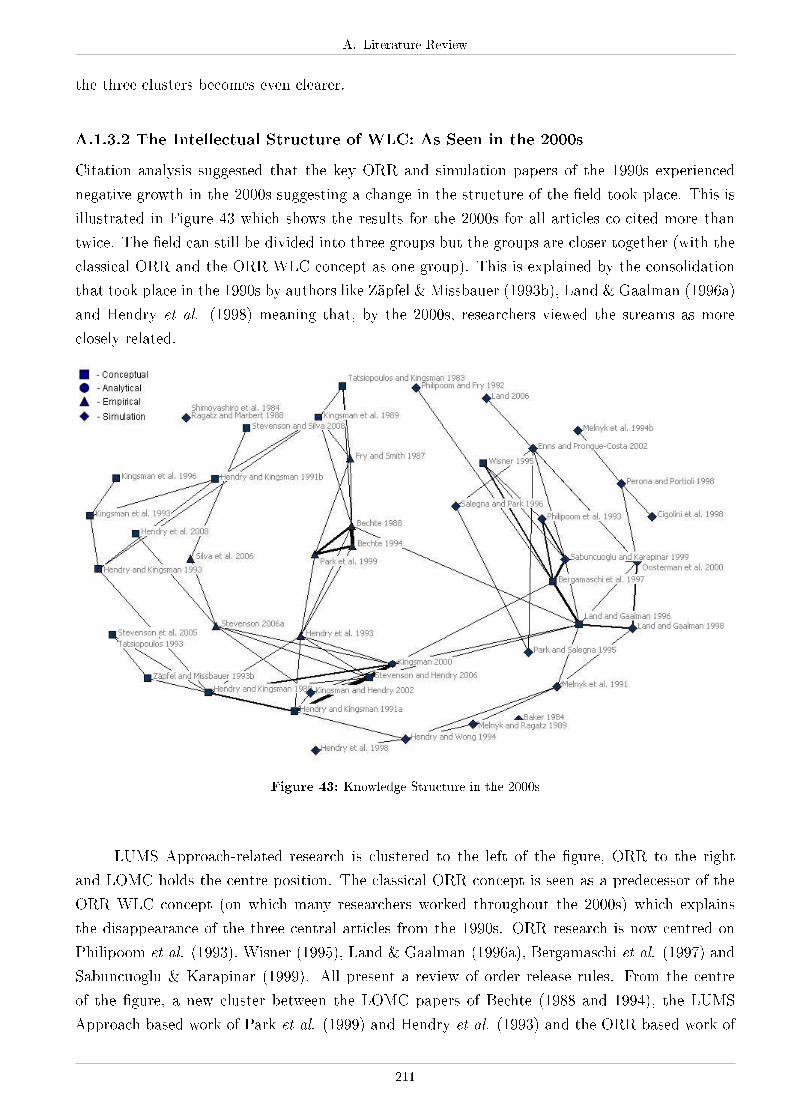
A. Literature Review
the three clusters becomes even clearer.
A.1.3.2 The Intellectual Structure of WLC: As Seen in the 2000s
Citation analysis suggested that the key ORR and simulation papers of the 1990s experienced
negative growth in the 2000s suggesting a change in the structure of the �eld took place. This is
illustrated in Figure 43 which shows the results for the 2000s for all articles co-cited more than
twice. The �eld can still be divided into three groups but the groups are closer together (with the
classical ORR and the ORR WLC concept as one group). This is explained by the consolidation
that took place in the 1990s by authors like Zäpfel & Missbauer (1993b), Land & Gaalman (1996a)
and Hendry et al. (1998) meaning that, by the 2000s, researchers viewed the streams as more
closely related.
Figure 43: Knowledge Structure in the 2000s
LUMS Approach-related research is clustered to the left of the �gure, ORR to the right
and LOMC holds the centre position. The classical ORR concept is seen as a predecessor of the
ORR WLC concept (on which many researchers worked throughout the 2000s) which explains
the disappearance of the three central articles from the 1990s. ORR research is now centred on
Philipoom et al. (1993), Wisner (1995), Land & Gaalman (1996a), Bergamaschi et al. (1997) and
Sabuncuoglu & Karapinar (1999). All present a review of order release rules. From the centre
of the �gure, a new cluster between the LOMC papers of Bechte (1988 and 1994), the LUMS
Approach-based work of Park et al. (1999) and Hendry et al. (1993) and the ORR-based work of
211
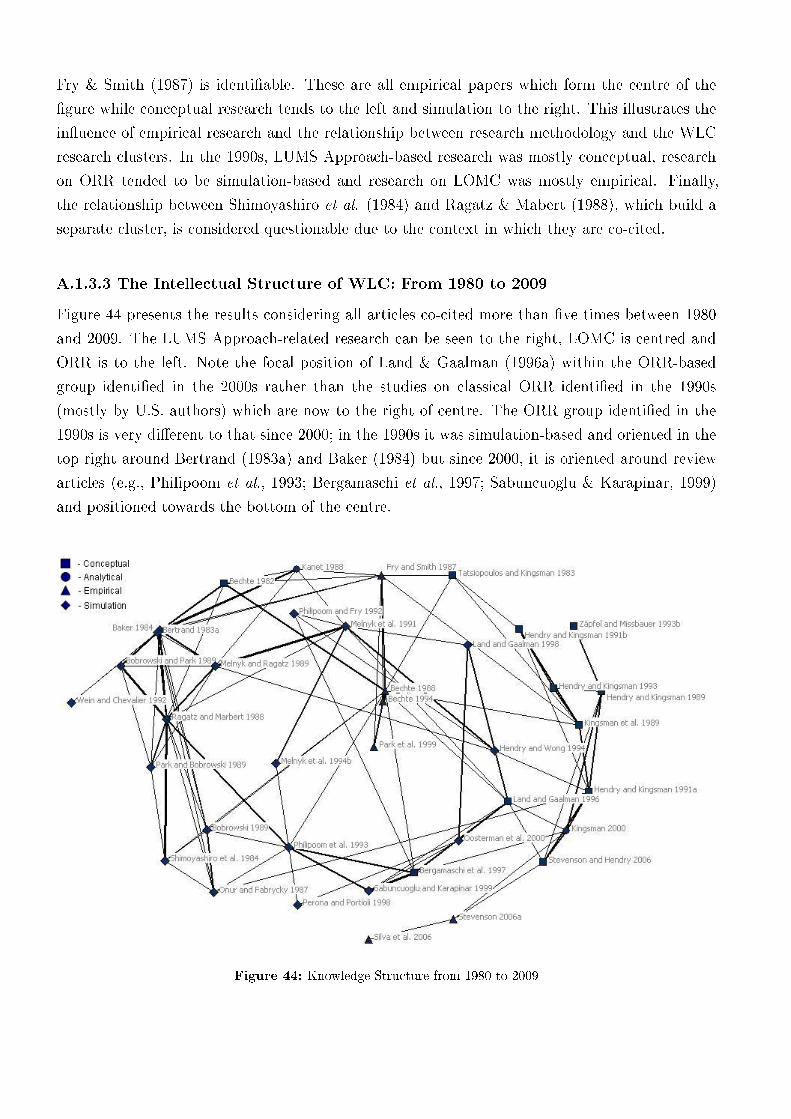
Fry & Smith (1987) is identi�able. These are all empirical papers which form the centre of the
�gure while conceptual research tends to the left and simulation to the right. This illustrates the
in�uence of empirical research and the relationship between research methodology and the WLC
research clusters. In the 1990s, LUMS Approach-based research was mostly conceptual, research
on ORR tended to be simulation-based and research on LOMC was mostly empirical. Finally,
the relationship between Shimoyashiro et al. (1984) and Ragatz & Mabert (1988), which build a
separate cluster, is considered questionable due to the context in which they are co-cited.
A.1.3.3 The Intellectual Structure of WLC: From 1980 to 2009
Figure 44 presents the results considering all articles co-cited more than �ve times between 1980
and 2009. The LUMS Approach-related research can be seen to the right, LOMC is centred and
ORR is to the left. Note the focal position of Land & Gaalman (1996a) within the ORR-based
group identi�ed in the 2000s rather than the studies on classical ORR identi�ed in the 1990s
(mostly by U.S. authors) which are now to the right of centre. The ORR group identi�ed in the
1990s is very di�erent to that since 2000; in the 1990s it was simulation-based and oriented in the
top right around Bertrand (1983a) and Baker (1984) but since 2000, it is oriented around review
articles (e.g., Philipoom et al., 1993; Bergamaschi et al., 1997; Sabuncuoglu & Karapinar, 1999)
and positioned towards the bottom of the centre.
Figure 44: Knowledge Structure from 1980 to 2009

A. Literature Review
The research community's view of ORR changed substantially with the emergence of ORR
WLC at the end of the 1990s. ORR research is now more focused on the comprehensive ORRWLC
approach than on the classical order release concept. How the research community has perceived
the LUMS Approach and the LOMC concept has remained relatively constant throughout the
three decades. Analysis also illustrates the uni�cation of WLC research at the end of the 1990s
and the in�uence of empirical research.
A.1.4 Summary of Empirical Studies
Table 52 summarises empirical WLC research from 1980 to 2009, including company characteris-
tics, the WLC method implemented, and the research method. WLC has been implemented in
several industries but mostly in small-medium sized MTO job shops. The methods implemented
are the LUMS Approach, LOMC/LOOR, and hybrid systems based on WLC; no ORR WLC
implementations are reported. All implementations aimed to reduce lead times and WIP; in some
cases this was achieved but more evidence for the LUMS Approach is needed. Finally, the table
demonstrates the shift towards action research in the last decade.
213
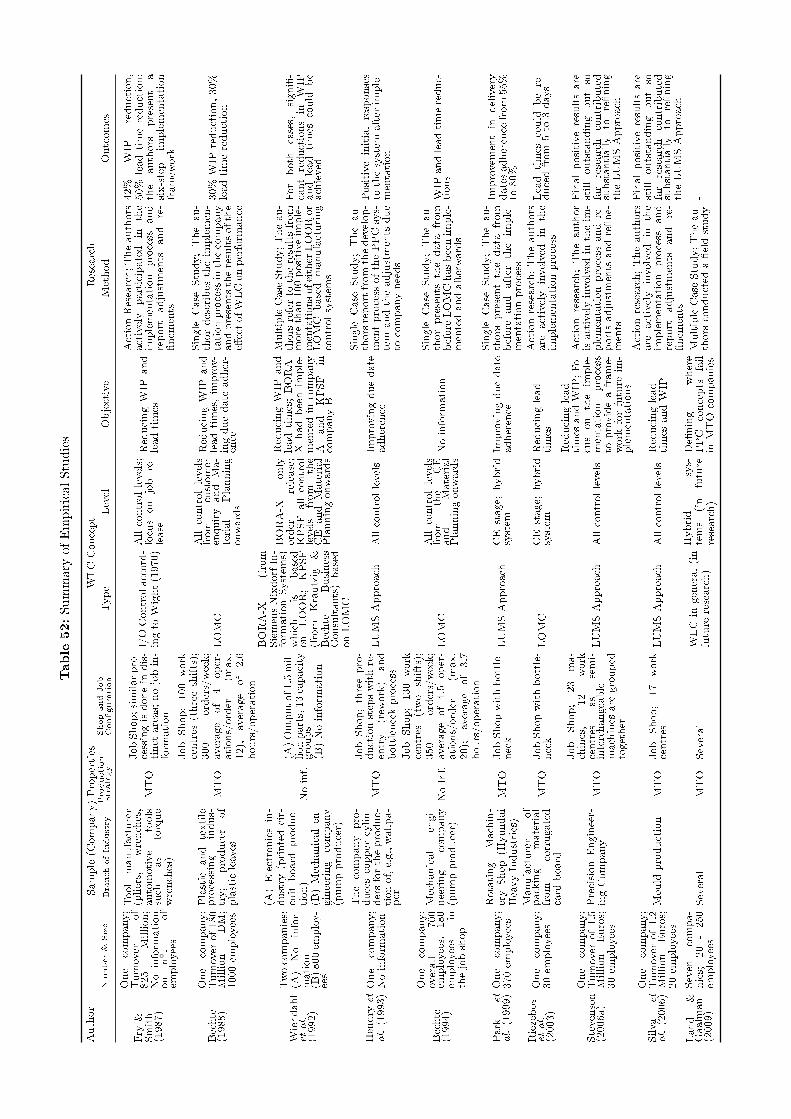
Table
52:Summary
ofEmpiricalStudies
Author
Sample(C
ompany)Properties
WLCConcept
Research
Number&
Size
BranchofIndustry
Production
Strategy
ShopandJob
Con�guration
Type
Level
Objective
Method
Outcomes
Fry
&Smith
(1987)
One
company;
Turnover
of
$25
Million;
Noinform
ation
on
n∘.
of
employees
Toolmanufacturer
(pliers,
wrenches,
automotive
tools
such
as
torque
wrenches)
MTO
JobShop;similarpro-
cessingisdonein
dis-
tinct
areas;nojobin-
form
ation
I/OControlaccord-
ingto
Wight(1970)
Allcontrollevels;
focuson
job
re-
lease
ReducingWIP
and
leadtimes
ActionResearch;Theauthors
actively
participated
inthe
implementation
process
and
report
adjustments
and
re-
�nem
ents
42%
WIP
reduction,
50%
leadtimereduction;
the
authors
present
asix-step
implementation
framew
ork
Bechte
(1988)
One
company;
Turnover
of180
Million
DM;
1000em
ployees
Plastic
and
textile
processing
indus-
try;
producer
of
plasticleaves
MTO
Job
Shop;100work
centres
(threeshifts);
300
orders/week;
average
of
4oper-
ations/order
(max.
12),
average
of2.6
hours/operation
LOMC
Allcontrollevels
from
customer
enquiryandMa-
terial
Planning
onwards
ReducingWIP
and
leadtimes,im
prov-
ingduedate
adher-
ence
Single
Case
Study;Theau-
thordescribes
theim
plemen-
tationprocessinthecompany
andpresentstheresultsofthe
e�ectofWLConperform
ance
30%
WIP
reduction,30%
leadtimereduction
Wiendahl
etal.
(1992)
Twocompanies:
(A)
No
infor-
mation
(B)800em
ploy-
ees
(A)Electronicsin-
dustry
(printedcir-
cuit
board
produc-
tion)
(B)Mechanicalen-
gineering
company
(pumpproducer)
Noinf.
(A)Outputof1.5mil-
lionparts,13capacity
groups
(B)Noinform
ation
BORA-X
(from
SiemensNixdorfIn-
form
ationSystem
s)which
isbased
on
LOOR;
KPSF
(from
Krautzig
&Bechte
Business
Consultants)based
onLOMC
BORA-X
only
order
release;
KPSF
allcontrol
levels
from
the
CE
andMaterial
Planningonwards
ReducingWIP
and
leadtimes;BORA-
Xhadbeenim
ple-
mentedin
company
Aand
KPSF
incompanyB
MultipleCase
Study;Theau-
thorsreferto
theresultsfrom
more
than100positiveim
ple-
mentationsofeitherLOORor
LOMC
basedmanufacturing
controlsystem
s
For
both
cases,
signi�-
cantreductionsin
WIP
andleadtimes
could
be
achieved
Hendry
et
al.(1993)One
company;
Noinform
ation
Thecompany
pro-
ducescopper
cylin-
dersfortheproduc-
tionof,e.g.,wallpa-
per
MTO
JobShop;threepro-
ductionstepswithre-
entry
(rew
ork)
and
bottleneckprocess
LUMSApproach
Allcontrollevels
Improvingduedate
adherence
Single
Case
Study;Theau-
thorsreportfromthedevelop-
mentprocess
ofthePPCsys-
tem
andtheadjustments
due
tocompanyneeds
Positiveinitialresponses
tothesystem
after
imple-
mentation
Bechte
(1994)
One
company;
overall
700
employees,
180
employees
inthejobshop
Mechanical
engi-
neering
company
(pumpproducer)
NoInf.
Job
Shop;130work
centres
(two
shifts);
350
orders/week;
averageof4.5
oper-
ations/order
(max.
20);
average
of3.7
hours/operation
LOMC
Allcontrollevels
from
the
CE
and
Material
PlanningonwardsNoinform
ation
Single
Case
Study;Theau-
thorpresents
thedata
from
beforeLOMChasbeenim
ple-
mentedandafterwards
WIP
andleadtimereduc-
tions
Park
et
al.(1999)One
company;
370em
ployees
Rotating
Machin-
eryShop(H
yundai
HeavyIndustries)
MTO
JobShopwithbottle-
neck
LUMSApproach
CE
stage;
hybrid
system
Improvingduedate
adherence
Single
Case
Study;Theau-
thors
presentthedata
from
before
and
after
theim
ple-
mentationprocess
Improvem
entin
delivery
datesadherence
from55%
to80%
Riezebos
etal.
(2003)
One
company;
30em
ployees
Manufacturer
of
packing
material
from
corrugated
card-board
MTO
JobShopwithbottle-
neck
LOMC
CE
stage;
hybrid
system
Reducinglead
times
Actionresearch;Theauthors
are
actively
involved
inthe
implementationprocess
Leadtimes
could
bere-
ducedfrom
5to
3days
Stevenson
(2006a)
One
company;
Turnover
of1.5
Million
Euros;
30em
ployees
PrecisionEngineer-
ingCompany
MTO
Job
Shop;
23
ma-
chines,
12
work
centres
as
semi-
interchangeable
machines
are
grouped
together
LUMSApproach
Allcontrollevels
Reducinglead
times
andWIP;Fo-
cuson
the
imple-
mentation
process
toprovideaframe-
work
forfuture
im-
plementations
Actionresearch;Theauthor
isactivelyinvolved
intheim
-plementationprocess
andre-
portsadjustments
andre�ne-
ments
Finalpositiveresultsare
stilloutstanding
butso
farresearch
contributed
substantially
tore�ning
theLUMSApproach
Silva
et
al.(2006)
One
company;
Turnover
of1.2
Million
Euros;
20em
ployees
Mould
production
MTO
Job
Shop;
17
work
centres
LUMSApproach
Allcontrollevels
Reducinglead
times
andWIP
Actionresearch;Theauthors
are
actively
involved
inthe
implementation
process
and
report
adjustments
and
re-
�nem
ents
Finalpositiveresultsare
stilloutstanding
butso
farresearch
contributed
substantially
tore�ning
theLUMSApproach
Land
&Gaalm
an
(2009)
Seven
compa-
nies;
20
-250
employees
Several
MTO
Several
WLCin
general(in
future
research)
Hybrid
sys-
tems
(in
future
research)
De�ning
where
PPC
concepts
fail
inMTO
companies
MultipleCase
Study;Theau-
thors
conducted
a�eldstudy
-
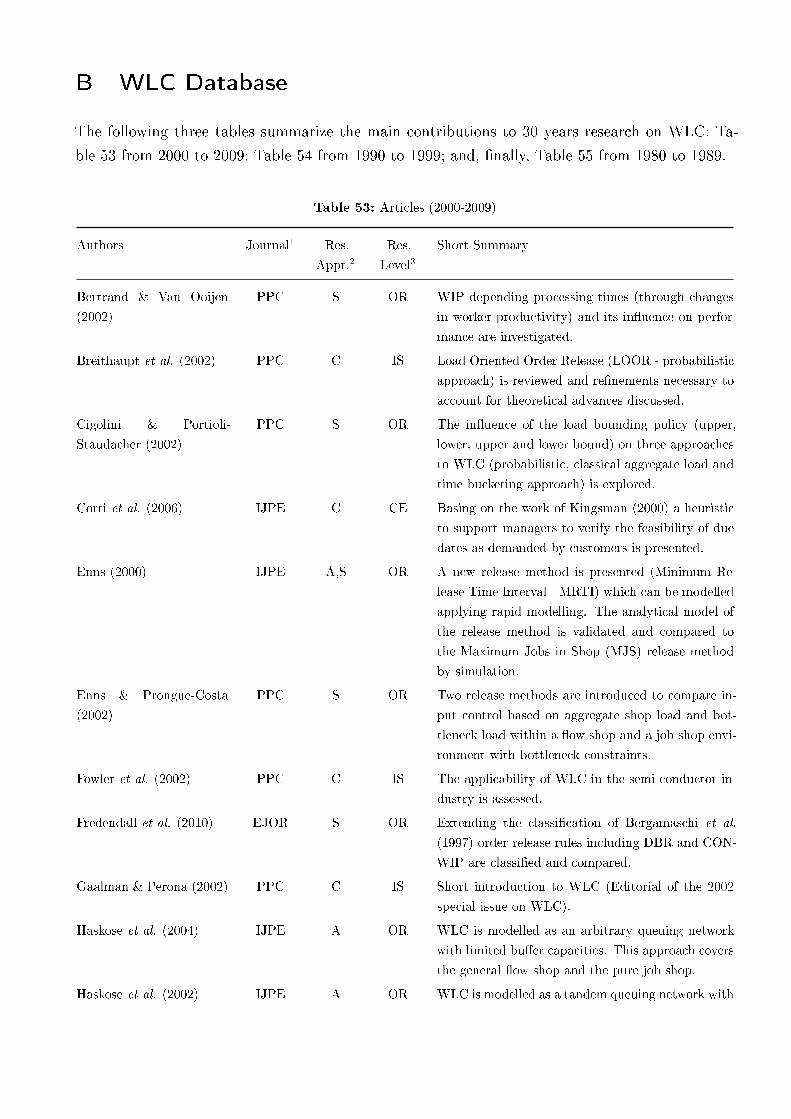
B WLC Database
The following three tables summarize the main contributions to 30 years research on WLC: Ta-
ble 53 from 2000 to 2009; Table 54 from 1990 to 1999; and, �nally, Table 55 from 1980 to 1989.
Table 53: Articles (2000-2009)
Authors Journal1 Res.
Appr.2Res.
Level3Short Summary
Bertrand & Van Ooijen
(2002)
PPC S OR WIP depending processing times (through changes
in worker-productivity) and its in�uence on perfor-
mance are investigated.
Breithaupt et al. (2002) PPC C IS Load Oriented Order Release (LOOR - probabilistic
approach) is reviewed and re�nements necessary to
account for theoretical advances discussed.
Cigolini & Portioli-
Staudacher (2002)
PPC S OR The in�uence of the load bounding policy (upper,
lower, upper and lower bound) on three approaches
to WLC (probabilistic, classical aggregate load and
time bucketing approach) is explored.
Corti et al. (2006) IJPE C CE Basing on the work of Kingsman (2000) a heuristic
to support managers to verify the feasibility of due
dates as demanded by customers is presented.
Enns (2000) IJPE A,S OR A new release method is presented (Minimum Re-
lease Time Interval - MRTI) which can be modelled
applying rapid modelling. The analytical model of
the release method is validated and compared to
the Maximum Jobs in Shop (MJS) release method
by simulation.
Enns & Prongue-Costa
(2002)
PPC S OR Two release methods are introduced to compare in-
put control based on aggregate shop load and bot-
tleneck load within a �ow shop and a job shop envi-
ronment with bottleneck constraints.
Fowler et al. (2002) PPC C IS The applicability of WLC in the semi-conductor in-
dustry is assessed.
Fredendall et al. (2010) EJOR S OR Extending the classi�cation of Bergamaschi et al.
(1997) order release rules including DBR and CON-
WIP are classi�ed and compared.
Gaalman & Perona (2002) PPC C IS Short introduction to WLC (Editorial of the 2002
special issue on WLC).
Haskose et al. (2004) IJPE A OR WLC is modelled as an arbitrary queuing network
with limited bu�er capacities. This approach covers
the general �ow shop and the pure job shop.
Haskose et al. (2002) IJPE A OR WLC is modelled as a tandem queuing network with
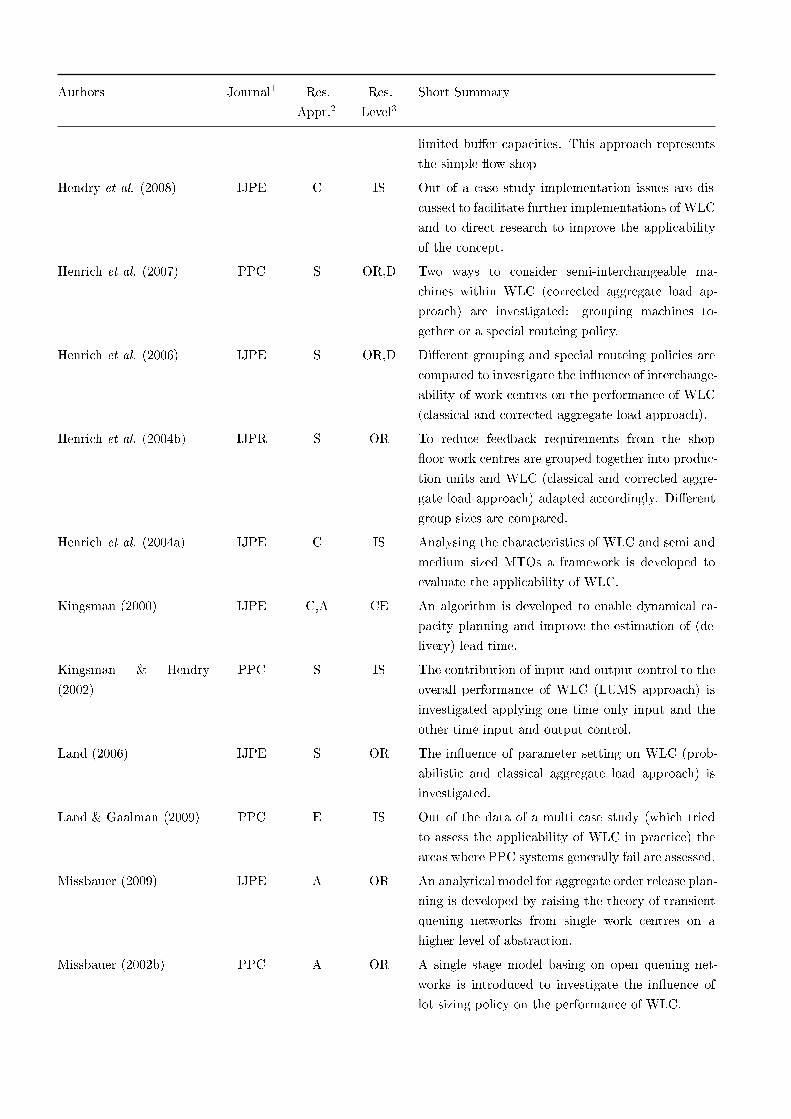
Authors Journal1 Res.
Appr.2Res.
Level3Short Summary
limited bu�er capacities. This approach represents
the simple �ow shop
Hendry et al. (2008) IJPE C IS Out of a case study implementation issues are dis-
cussed to facilitate further implementations of WLC
and to direct research to improve the applicability
of the concept.
Henrich et al. (2007) PPC S OR,D Two ways to consider semi-interchangeable ma-
chines within WLC (corrected aggregate load ap-
proach) are investigated: grouping machines to-
gether or a special routeing policy.
Henrich et al. (2006) IJPE S OR,D Di�erent grouping and special routeing policies are
compared to investigate the in�uence of interchange-
ability of work centres on the performance of WLC
(classical and corrected aggregate load approach).
Henrich et al. (2004b) IJPR S OR To reduce feedback requirements from the shop
�oor work centres are grouped together into produc-
tion units and WLC (classical and corrected aggre-
gate load approach) adapted accordingly. Di�erent
group sizes are compared.
Henrich et al. (2004a) IJPE C IS Analysing the characteristics of WLC and semi and
medium sized MTOs a framework is developed to
evaluate the applicability of WLC.
Kingsman (2000) IJPE C,A CE An algorithm is developed to enable dynamical ca-
pacity planning and improve the estimation of (de-
livery) lead time.
Kingsman & Hendry
(2002)
PPC S IS The contribution of input and output control to the
overall performance of WLC (LUMS approach) is
investigated applying one time only input and the
other time input and output control.
Land (2006) IJPE S OR The in�uence of parameter setting on WLC (prob-
abilistic and classical aggregate load approach) is
investigated.
Land & Gaalman (2009) PPC E IS Out of the data of a multi case study (which tried
to assess the applicability of WLC in practice) the
areas where PPC systems generally fail are assessed.
Missbauer (2009) IJPE A OR An analytical model for aggregate order release plan-
ning is developed by raising the theory of transient
queuing networks from single work centres on a
higher level of abstraction.
Missbauer (2002b) PPC A OR A single stage model basing on open queuing net-
works is introduced to investigate the in�uence of
lot sizing policy on the performance of WLC.
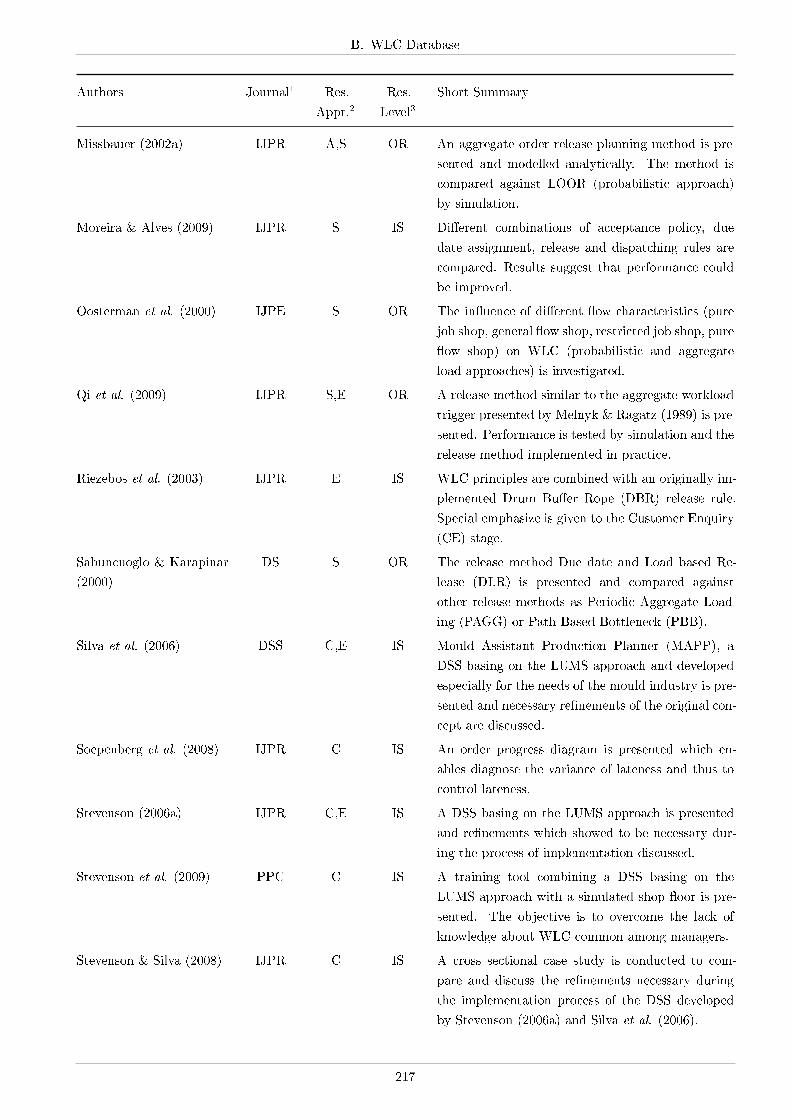
B. WLC Database
Authors Journal1 Res.
Appr.2Res.
Level3Short Summary
Missbauer (2002a) IJPR A,S OR An aggregate order release planning method is pre-
sented and modelled analytically. The method is
compared against LOOR (probabilistic approach)
by simulation.
Moreira & Alves (2009) IJPR S IS Di�erent combinations of acceptance policy, due
date assignment, release and dispatching rules are
compared. Results suggest that performance could
be improved.
Oosterman et al. (2000) IJPE S OR The in�uence of di�erent �ow characteristics (pure
job shop, general �ow shop, restricted job shop, pure
�ow shop) on WLC (probabilistic and aggregate
load approaches) is investigated.
Qi et al. (2009) IJPR S,E OR A release method similar to the aggregate workload
trigger presented by Melnyk & Ragatz (1989) is pre-
sented. Performance is tested by simulation and the
release method implemented in practice.
Riezebos et al. (2003) IJPR E IS WLC principles are combined with an originally im-
plemented Drum Bu�er Rope (DBR) release rule.
Special emphasize is given to the Customer Enquiry
(CE) stage.
Sabuncuoglo & Karapinar
(2000)
DS S OR The release method Due date and Load based Re-
lease (DLR) is presented and compared against
other release methods as Periodic Aggregate Load-
ing (PAGG) or Path Based Bottleneck (PBB).
Silva et al. (2006) DSS C,E IS Mould Assistant Production Planner (MAPP), a
DSS basing on the LUMS approach and developed
especially for the needs of the mould industry is pre-
sented and necessary re�nements of the original con-
cept are discussed.
Soepenberg et al. (2008) IJPR C IS An order progress diagram is presented which en-
ables diagnose the variance of lateness and thus to
control lateness.
Stevenson (2006a) IJPR C,E IS A DSS basing on the LUMS approach is presented
and re�nements which showed to be necessary dur-
ing the process of implementation discussed.
Stevenson et al. (2009) PPC C IS A training tool combining a DSS basing on the
LUMS approach with a simulated shop �oor is pre-
sented. The objective is to overcome the lack of
knowledge about WLC common among managers.
Stevenson & Silva (2008) IJPR C IS A cross sectional case study is conducted to com-
pare and discuss the re�nements necessary during
the implementation process of the DSS developed
by Stevenson (2006a) and Silva et al. (2006).
217
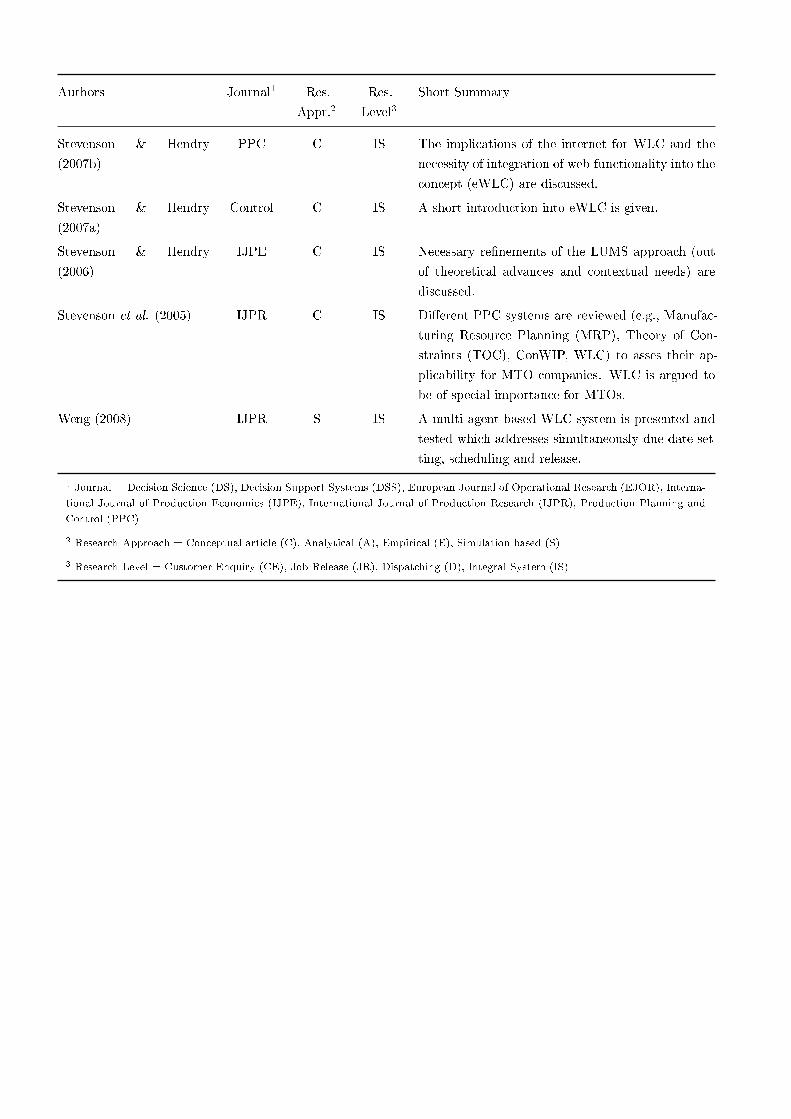
Authors Journal1 Res.
Appr.2Res.
Level3Short Summary
Stevenson & Hendry
(2007b)
PPC C IS The implications of the internet for WLC and the
necessity of integration of web-functionality into the
concept (eWLC) are discussed.
Stevenson & Hendry
(2007a)
Control C IS A short introduction into eWLC is given.
Stevenson & Hendry
(2006)
IJPE C IS Necessary re�nements of the LUMS approach (out
of theoretical advances and contextual needs) are
discussed.
Stevenson et al. (2005) IJPR C IS Di�erent PPC systems are reviewed (e.g., Manufac-
turing Resource Planning (MRP), Theory of Con-
straints (TOC), ConWIP, WLC) to asses their ap-
plicability for MTO companies. WLC is argued to
be of special importance for MTOs.
Weng (2008) IJPR S IS A multi agent based WLC system is presented and
tested which addresses simultaneously due date set-
ting, scheduling and release.
1 Journal = Decision Science (DS), Decision Support Systems (DSS), European Journal of Operational Research (EJOR), Interna-
tional Journal of Production Economics (IJPE), International Journal of Production Research (IJPR), Production Planning and
Control (PPC)
2 Research Approach = Conceptual article (C), Analytical (A), Empirical (E), Simulation based (S)
3 Research Level = Customer Enquiry (CE), Job Release (JR), Dispatching (D), Integral System (IS)
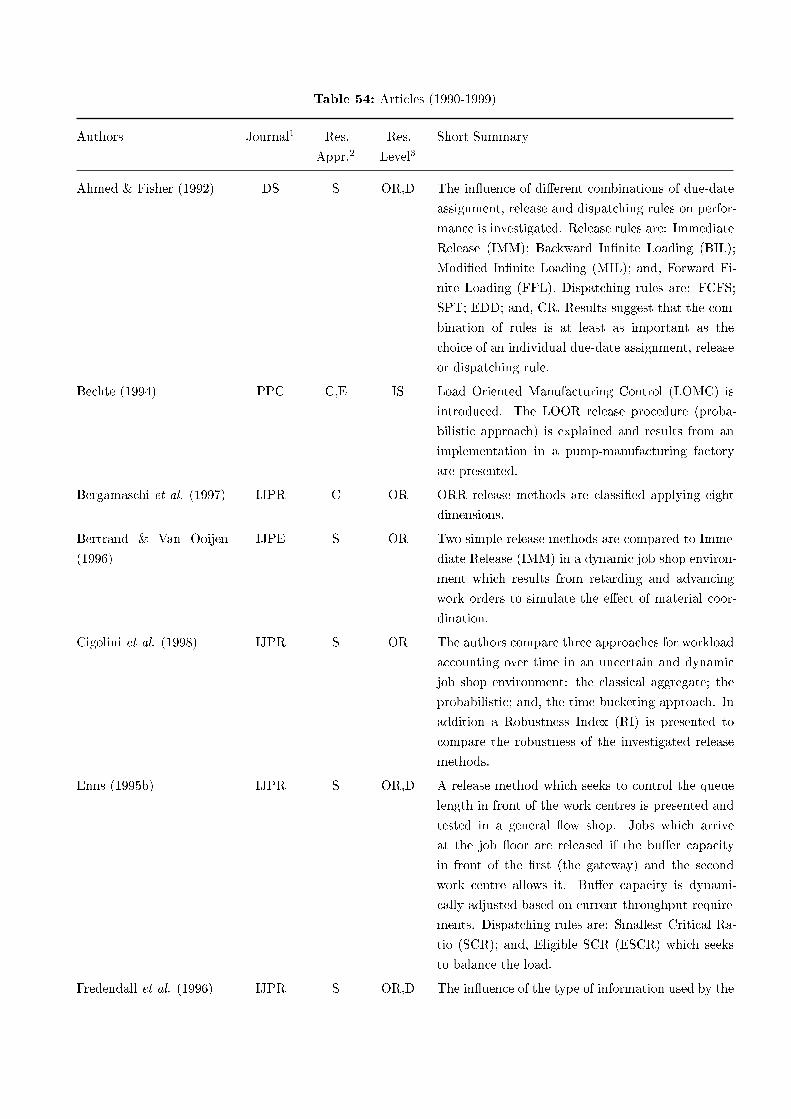
Table 54: Articles (1990-1999)
Authors Journal1 Res.
Appr.2Res.
Level3Short Summary
Ahmed & Fisher (1992) DS S OR,D The in�uence of di�erent combinations of due-date
assignment, release and dispatching rules on perfor-
mance is investigated. Release rules are: Immediate
Release (IMM); Backward In�nite Loading (BIL);
Modi�ed In�nite Loading (MIL); and, Forward Fi-
nite Loading (FFL). Dispatching rules are: FCFS;
SPT; EDD; and, CR. Results suggest that the com-
bination of rules is at least as important as the
choice of an individual due-date assignment, release
or dispatching rule.
Bechte (1994) PPC C,E IS Load Oriented Manufacturing Control (LOMC) is
introduced. The LOOR release procedure (proba-
bilistic approach) is explained and results from an
implementation in a pump-manufacturing factory
are presented.
Bergamaschi et al. (1997) IJPR C OR ORR release methods are classi�ed applying eight
dimensions.
Bertrand & Van Ooijen
(1996)
IJPE S OR Two simple release methods are compared to Imme-
diate Release (IMM) in a dynamic job shop environ-
ment which results from retarding and advancing
work orders to simulate the e�ect of material coor-
dination.
Cigolini et al. (1998) IJPR S OR The authors compare three approaches for workload
accounting over time in an uncertain and dynamic
job shop environment: the classical aggregate; the
probabilistic; and, the time bucketing approach. In
addition a Robustness Index (RI) is presented to
compare the robustness of the investigated release
methods.
Enns (1995b) IJPR S OR,D A release method which seeks to control the queue
length in front of the work centres is presented and
tested in a general �ow shop. Jobs which arrive
at the job �oor are released if the bu�er capacity
in front of the �rst (the gateway) and the second
work centre allows it. Bu�er capacity is dynami-
cally adjusted based on current throughput require-
ments. Dispatching rules are: Smallest Critical Ra-
tio (SCR); and, Eligible SCR (ESCR) which seeks
to balance the load.
Fredendall et al. (1996) IJPR S OR,D The in�uence of the type of information used by the
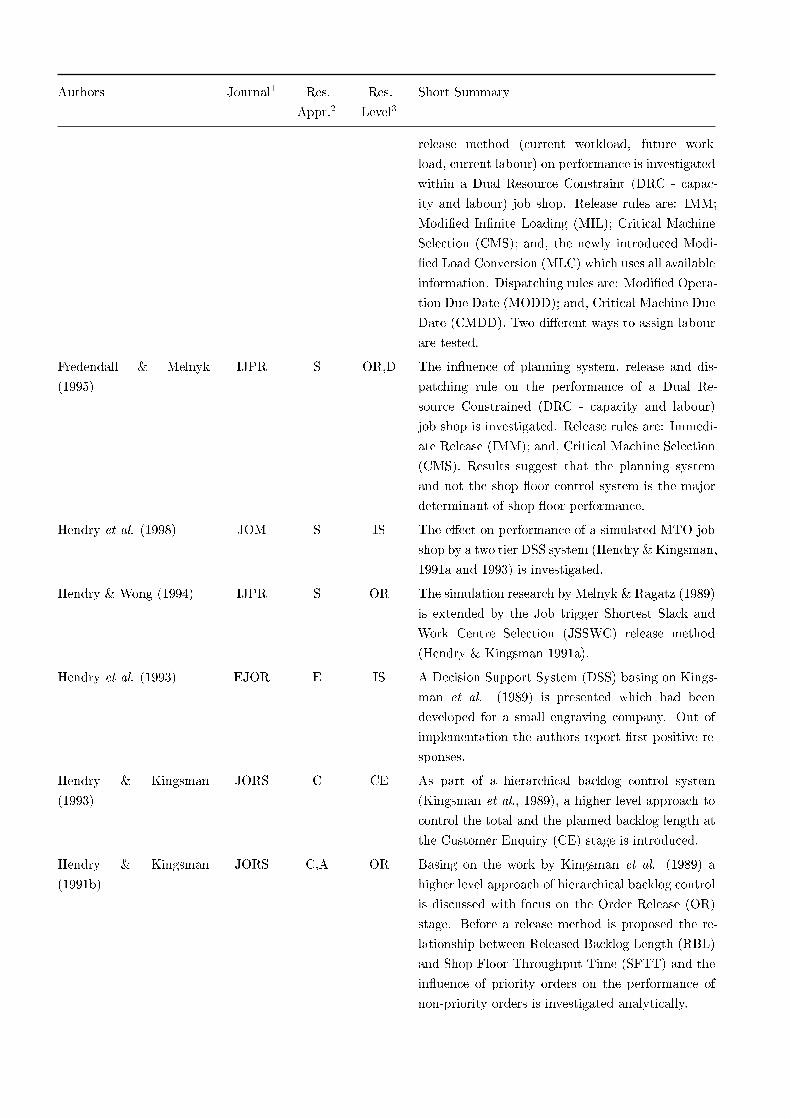
Authors Journal1 Res.
Appr.2Res.
Level3Short Summary
release method (current workload, future work-
load, current labour) on performance is investigated
within a Dual Resource Constraint (DRC - capac-
ity and labour) job shop. Release rules are: IMM;
Modi�ed In�nite Loading (MIL); Critical Machine
Selection (CMS); and, the newly introduced Modi-
�ed Load Conversion (MLC) which uses all available
information. Dispatching rules are: Modi�ed Opera-
tion Due Date (MODD); and, Critical Machine Due
Date (CMDD). Two di�erent ways to assign labour
are tested.
Fredendall & Melnyk
(1995)
IJPR S OR,D The in�uence of planning system, release and dis-
patching rule on the performance of a Dual Re-
source Constrained (DRC - capacity and labour)
job shop is investigated. Release rules are: Immedi-
ate Release (IMM); and, Critical Machine Selection
(CMS). Results suggest that the planning system
and not the shop �oor control system is the major
determinant of shop �oor performance.
Hendry et al. (1998) JOM S IS The e�ect on performance of a simulated MTO job
shop by a two tier DSS system (Hendry & Kingsman,
1991a and 1993) is investigated.
Hendry & Wong (1994) IJPR S OR The simulation research by Melnyk & Ragatz (1989)
is extended by the Job trigger Shortest Slack and
Work Centre Selection (JSSWC) release method
(Hendry & Kingsman 1991a).
Hendry et al. (1993) EJOR E IS A Decision Support System (DSS) basing on Kings-
man et al. (1989) is presented which had been
developed for a small engraving company. Out of
implementation the authors report �rst positive re-
sponses.
Hendry & Kingsman
(1993)
JORS C CE As part of a hierarchical backlog control system
(Kingsman et al., 1989), a higher level approach to
control the total and the planned backlog length at
the Customer Enquiry (CE) stage is introduced.
Hendry & Kingsman
(1991b)
JORS C,A OR Basing on the work by Kingsman et al. (1989) a
higher level approach of hierarchical backlog control
is discussed with focus on the Order Release (OR)
stage. Before a release method is proposed the re-
lationship between Released Backlog Length (RBL)
and Shop Floor Throughput Time (SFTT) and the
in�uence of priority orders on the performance of
non-priority orders is investigated analytically.

B. WLC Database
Authors Journal1 Res.
Appr.2Res.
Level3Short Summary
Hendry & Kingsman
(1991a)
IJOPM C OR The Order Release (OR) stage, as part of the higher
level approach of production control (Kingsman et
al., 1989), is introduced. Necessary re�nements out
of implementation are discussed but no further em-
pirical results presented.
Kim & Bobrowski (1995) POM S OR,D Di�erent combinations of release (IMM, Maximum
Shop Load (MSL), Backward In�nite Loading (BIL),
Forward Finite Loading (FFL)) and dispatching
rules (SPT, CR, Similar Set-up (SIMSET) and Job
of smallest Critical Ratio (JCR)) are compared in
a job shop with sequence dependent set-up times.
The authors suggest that the dispatching rule is the
decisive factor in production environments with se-
quence dependent setup times.
Kingsman et al. (1996) IJPE C CE As part of an input/output control system (Kings-
man et al., 1989) the authors present and discuss
solutions for setting the price and the delivery date
at the Customer Enquiry (CE) stage.
Kingsman et al. (1993) IJPE C CE The need for a link between sales and produc-
tion is outlined and Customer Enquiry Management
(CEM) and the strike rate matrix introduced. These
means were implemented in practice (one manufac-
turer with three companies) building a centralized
database on customer enquiries.
Land & Gaalman (1998) IJPE S OR The classical aggregate load and the probabilistic ap-
proach are compared. Out of the conclusions drawn
form the simulation result a new release method
is proposed - Super�uous Load Avoidance Release
(SLAR).
Land & Gaalman (1996) IJPE C IS Gives an overview over the di�erent WLC con-
cepts mainly centred on the concepts introduced by
Bechte (1982), Bertrand & Wortmann (1981) and
Tatsiopoulos (1983).
Lingayat et al. (1995) IJPR S OR,D A new Order Release Mechanism (ORM) is intro-
duced which bases on the Starvation Avoidance (SA)
method as introduced by Glassey & Resende (1988).
The objective is the control of inventory in front
of the bottleneck machine. The ORM is compared
to CONWIP using a simulation model. Dispatch-
ing rules are: FCFS; Smallest Imminent Operation
(SIO); and, priority given to orders which are go-
ing to the bottleneck machine. The authors con-
clude that the choice of an appropriate order release
method is more important than dispatching.
221
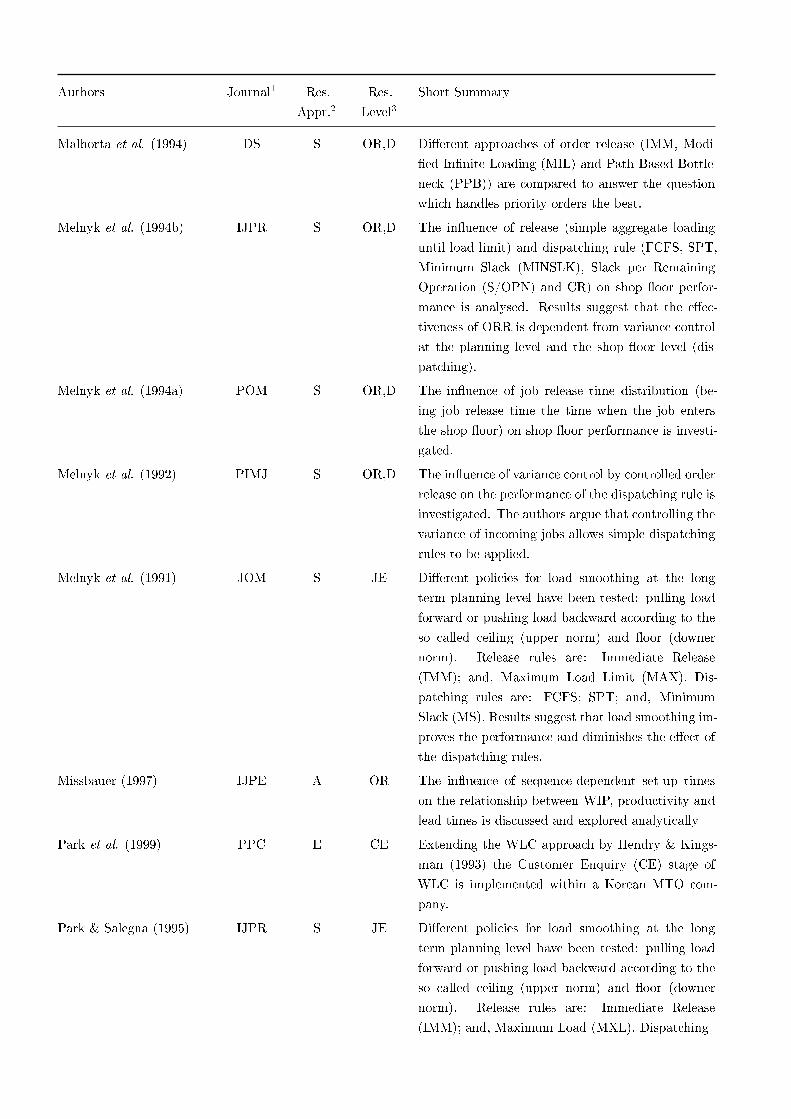
Authors Journal1 Res.
Appr.2Res.
Level3Short Summary
Malhorta et al. (1994) DS S OR,D Di�erent approaches of order release (IMM, Modi-
�ed In�nite Loading (MIL) and Path Based Bottle-
neck (PPB)) are compared to answer the question
which handles priority orders the best.
Melnyk et al. (1994b) IJPR S OR,D The in�uence of release (simple aggregate loading
until load limit) and dispatching rule (FCFS, SPT,
Minimum Slack (MINSLK), Slack per Remaining
Operation (S/OPN) and CR) on shop �oor perfor-
mance is analysed. Results suggest that the e�ec-
tiveness of ORR is dependent from variance control
at the planning level and the shop �oor level (dis-
patching).
Melnyk et al. (1994a) POM S OR,D The in�uence of job release time distribution (be-
ing job release time the time when the job enters
the shop �oor) on shop �oor performance is investi-
gated.
Melnyk et al. (1992) PIMJ S OR,D The in�uence of variance control by controlled order
release on the performance of the dispatching rule is
investigated. The authors argue that controlling the
variance of incoming jobs allows simple dispatching
rules to be applied.
Melnyk et al. (1991) JOM S JE Di�erent policies for load smoothing at the long
term planning level have been tested: pulling load
forward or pushing load backward according to the
so called ceiling (upper norm) and �oor (downer
norm). Release rules are: Immediate Release
(IMM); and, Maximum Load Limit (MAX). Dis-
patching rules are: FCFS; SPT; and, Minimum
Slack (MS). Results suggest that load smoothing im-
proves the performance and diminishes the e�ect of
the dispatching rules.
Missbauer (1997) IJPE A OR The in�uence of sequence-dependent set-up times
on the relationship between WIP, productivity and
lead times is discussed and explored analytically
Park et al. (1999) PPC E CE Extending the WLC approach by Hendry & Kings-
man (1993) the Customer Enquiry (CE) stage of
WLC is implemented within a Korean MTO com-
pany.
Park & Salegna (1995) IJPR S JE Di�erent policies for load smoothing at the long
term planning level have been tested: pulling load
forward or pushing load backward according to the
so called ceiling (upper norm) and �oor (downer
norm). Release rules are: Immediate Release
(IMM); and, Maximum Load (MXL). Dispatching
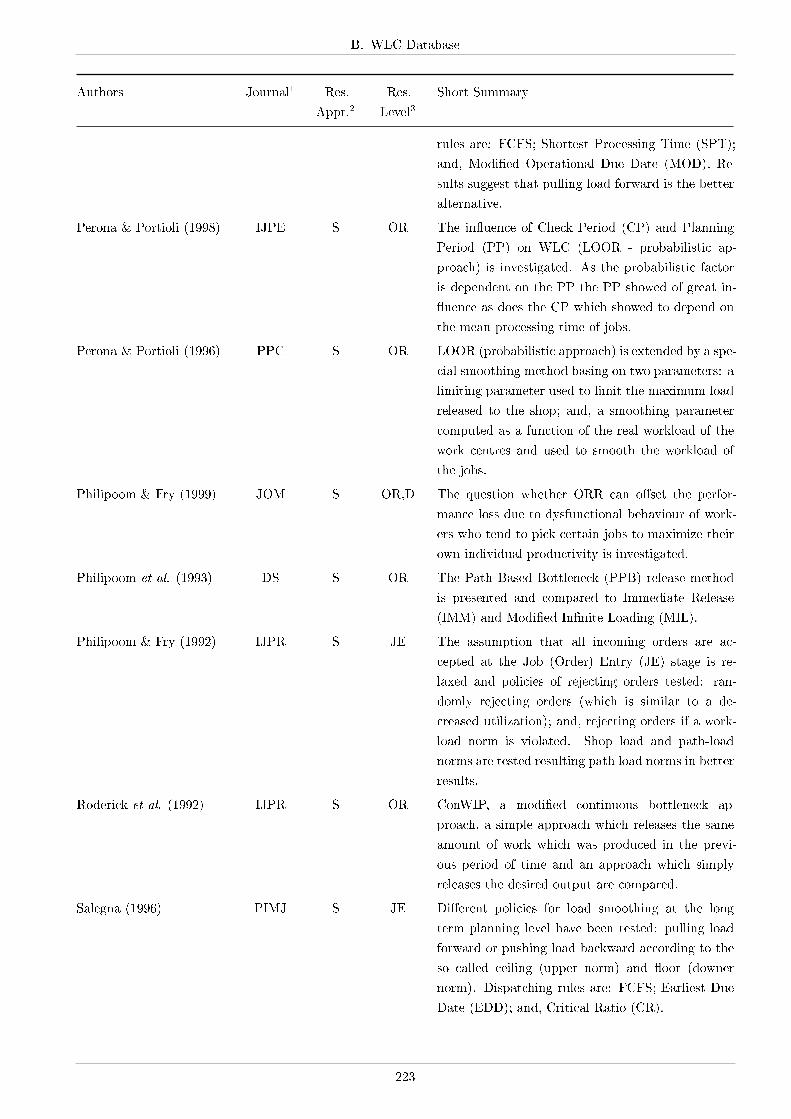
B. WLC Database
Authors Journal1 Res.
Appr.2Res.
Level3Short Summary
rules are: FCFS; Shortest Processing Time (SPT);
and, Modi�ed Operational Due Date (MOD). Re-
sults suggest that pulling load forward is the better
alternative.
Perona & Portioli (1998) IJPE S OR The in�uence of Check Period (CP) and Planning
Period (PP) on WLC (LOOR - probabilistic ap-
proach) is investigated. As the probabilistic factor
is dependent on the PP the PP showed of great in-
�uence as does the CP which showed to depend on
the mean processing time of jobs.
Perona & Portioli (1996) PPC S OR LOOR (probabilistic approach) is extended by a spe-
cial smoothing method basing on two parameters: a
limiting parameter used to limit the maximum load
released to the shop; and, a smoothing parameter
computed as a function of the real workload of the
work centres and used to smooth the workload of
the jobs.
Philipoom & Fry (1999) JOM S OR,D The question whether ORR can o�set the perfor-
mance loss due to dysfunctional behaviour of work-
ers who tend to pick certain jobs to maximize their
own individual productivity is investigated.
Philipoom et al. (1993) DS S OR The Path Based Bottleneck (PPB) release method
is presented and compared to Immediate Release
(IMM) and Modi�ed In�nite Loading (MIL).
Philipoom & Fry (1992) IJPR S JE The assumption that all incoming orders are ac-
cepted at the Job (Order) Entry (JE) stage is re-
laxed and policies of rejecting orders tested: ran-
domly rejecting orders (which is similar to a de-
creased utilization); and, rejecting orders if a work-
load norm is violated. Shop load and path-load
norms are tested resulting path load norms in better
results.
Roderick et al. (1992) IJPR S OR ConWIP, a modi�ed continuous bottleneck ap-
proach, a simple approach which releases the same
amount of work which was produced in the previ-
ous period of time and an approach which simply
releases the desired output are compared.
Salegna (1996) PIMJ S JE Di�erent policies for load smoothing at the long
term planning level have been tested: pulling load
forward or pushing load backward according to the
so called ceiling (upper norm) and �oor (downer
norm). Dispatching rules are: FCFS; Earliest Due
Date (EDD); and, Critical Ratio (CR).
223
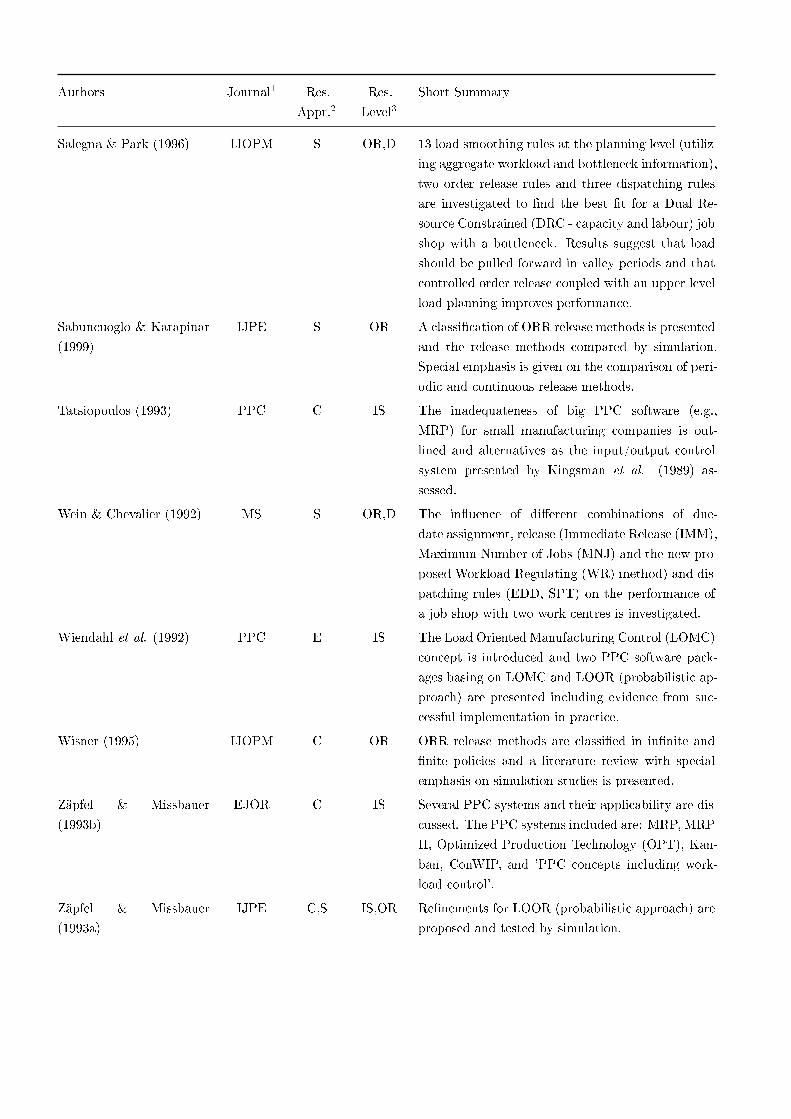
Authors Journal1 Res.
Appr.2Res.
Level3Short Summary
Salegna & Park (1996) IJOPM S OR,D 13 load smoothing rules at the planning level (utiliz-
ing aggregate workload and bottleneck information),
two order release rules and three dispatching rules
are investigated to �nd the best �t for a Dual Re-
source Constrained (DRC - capacity and labour) job
shop with a bottleneck. Results suggest that load
should be pulled forward in valley periods and that
controlled order release coupled with an upper level
load planning improves performance.
Sabuncuoglo & Karapinar
(1999)
IJPE S OR A classi�cation of ORR release methods is presented
and the release methods compared by simulation.
Special emphasis is given on the comparison of peri-
odic and continuous release methods.
Tatsiopoulos (1993) PPC C IS The inadequateness of big PPC software (e.g.,
MRP) for small manufacturing companies is out-
lined and alternatives as the input/output control
system presented by Kingsman et al. (1989) as-
sessed.
Wein & Chevalier (1992) MS S OR,D The in�uence of di�erent combinations of due-
date assignment, release (Immediate Release (IMM),
Maximum Number of Jobs (MNJ) and the new pro-
posed Workload Regulating (WR) method) and dis-
patching rules (EDD, SPT) on the performance of
a job shop with two work centres is investigated.
Wiendahl et al. (1992) PPC E IS The Load Oriented Manufacturing Control (LOMC)
concept is introduced and two PPC software pack-
ages basing on LOMC and LOOR (probabilistic ap-
proach) are presented including evidence from suc-
cessful implementation in practice.
Wisner (1995) IJOPM C OR ORR release methods are classi�ed in in�nite and
�nite policies and a literature review with special
emphasis on simulation studies is presented.
Zäpfel & Missbauer
(1993b)
EJOR C IS Several PPC systems and their applicability are dis-
cussed. The PPC systems included are: MRP, MRP
II, Optimized Production Technology (OPT), Kan-
ban, ConWIP, and 'PPC concepts including work-
load control'.
Zäpfel & Missbauer
(1993a)
IJPE C,S IS,OR Re�nements for LOOR (probabilistic approach) are
proposed and tested by simulation.

B. WLC Database
1 Journal = Decision Science (DS), European Journal of Operational Research (EJOR), International Journal of Operations and
Production Management (IJOPM), International Journal of Production Economics (IJPE), International Journal of Production
Research (IJPR), Journal of Operations Management (JOM), Journal of the Operational Research Society (JORS), Management
Science (MS), Production and Inventory Management Journal (PIMJ), Production and Operations Management (POM), Produc-
tion Planning and Control(PPC)
2 Research Approach = Conceptual article (C), Analytical (A), Empirical (E), Simulation based (S)
3 Research Level = Customer Enquiry (CE), Job Entry (JE), Job Release (JR), Dispatching (D), Integral System (IS)
225

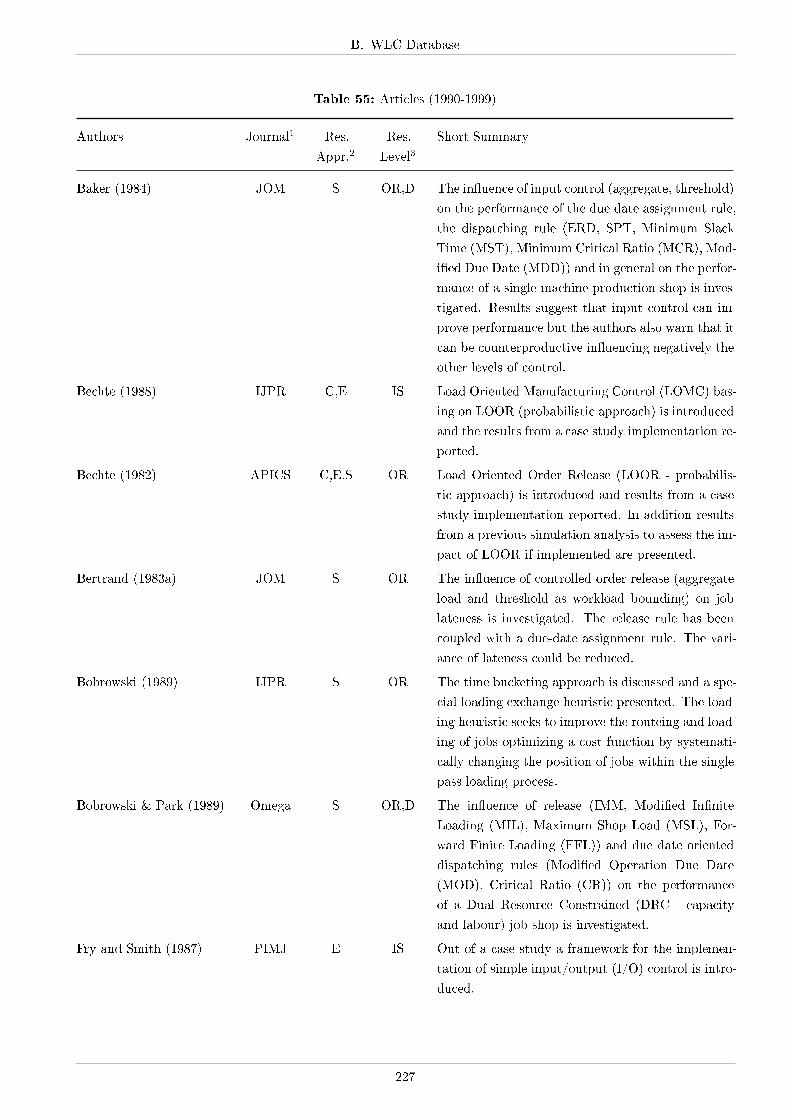
B. WLC Database
Table 55: Articles (1990-1999)
Authors Journal1 Res.
Appr.2Res.
Level3Short Summary
Baker (1984) JOM S OR,D The in�uence of input control (aggregate, threshold)
on the performance of the due date assignment rule,
the dispatching rule (ERD, SPT, Minimum Slack
Time (MST), Minimum Critical Ratio (MCR), Mod-
i�ed Due Date (MDD)) and in general on the perfor-
mance of a single machine production shop is inves-
tigated. Results suggest that input control can im-
prove performance but the authors also warn that it
can be counterproductive in�uencing negatively the
other levels of control.
Bechte (1988) IJPR C,E IS Load Oriented Manufacturing Control (LOMC) bas-
ing on LOOR (probabilistic approach) is introduced
and the results from a case study implementation re-
ported.
Bechte (1982) APICS C,E,S OR Load Oriented Order Release (LOOR - probabilis-
tic approach) is introduced and results from a case
study implementation reported. In addition results
from a previous simulation analysis to assess the im-
pact of LOOR if implemented are presented.
Bertrand (1983a) JOM S OR The in�uence of controlled order release (aggregate
load and threshold as workload bounding) on job
lateness is investigated. The release rule has been
coupled with a due-date assignment rule. The vari-
ance of lateness could be reduced.
Bobrowski (1989) IJPR S OR The time bucketing approach is discussed and a spe-
cial loading exchange heuristic presented. The load-
ing heuristic seeks to improve the routeing and load-
ing of jobs optimizing a cost function by systemati-
cally changing the position of jobs within the single
pass loading process.
Bobrowski & Park (1989) Omega S OR,D The in�uence of release (IMM, Modi�ed In�nite
Loading (MIL), Maximum Shop Load (MSL), For-
ward Finite Loading (FFL)) and due date oriented
dispatching rules (Modi�ed Operation Due Date
(MOD), Critical Ratio (CR)) on the performance
of a Dual Resource Constrained (DRC - capacity
and labour) job shop is investigated.
Fry and Smith (1987) PIMJ E IS Out of a case study a framework for the implemen-
tation of simple input/output (I/O) control is intro-
duced.
227
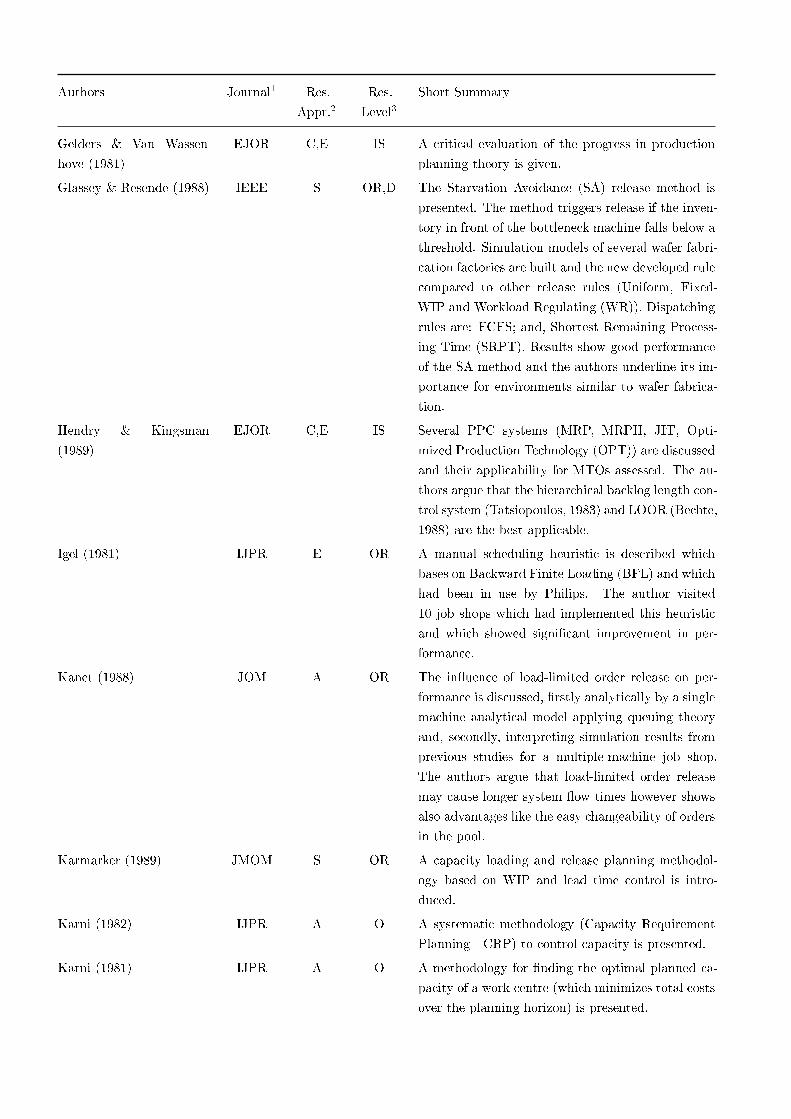
Authors Journal1 Res.
Appr.2Res.
Level3Short Summary
Gelders & Van Wassen-
hove (1981)
EJOR C,E IS A critical evaluation of the progress in production
planning theory is given.
Glassey & Resende (1988) IEEE S OR,D The Starvation Avoidance (SA) release method is
presented. The method triggers release if the inven-
tory in front of the bottleneck machine falls below a
threshold. Simulation models of several wafer fabri-
cation factories are built and the new developed rule
compared to other release rules (Uniform, Fixed-
WIP and Workload Regulating (WR)). Dispatching
rules are: FCFS; and, Shortest Remaining Process-
ing Time (SRPT). Results show good performance
of the SA method and the authors underline its im-
portance for environments similar to wafer fabrica-
tion.
Hendry & Kingsman
(1989)
EJOR C,E IS Several PPC systems (MRP, MRPII, JIT, Opti-
mized Production Technology (OPT)) are discussed
and their applicability for MTOs assessed. The au-
thors argue that the hierarchical backlog length con-
trol system (Tatsiopoulos, 1983) and LOOR (Bechte,
1988) are the best applicable.
Igel (1981) IJPR E OR A manual scheduling heuristic is described which
bases on Backward Finite Loading (BFL) and which
had been in use by Philips. The author visited
10 job shops which had implemented this heuristic
and which showed signi�cant improvement in per-
formance.
Kanet (1988) JOM A OR The in�uence of load-limited order release on per-
formance is discussed, �rstly analytically by a single
machine analytical model applying queuing theory
and, secondly, interpreting simulation results from
previous studies for a multiple-machine job shop.
The authors argue that load-limited order release
may cause longer system �ow times however shows
also advantages like the easy changeability of orders
in the pool.
Karmarker (1989) JMOM S OR A capacity loading and release planning methodol-
ogy based on WIP and lead time control is intro-
duced.
Karni (1982) IJPR A O A systematic methodology (Capacity Requirement
Planning - CRP) to control capacity is presented.
Karni (1981) IJPR A O A methodology for �nding the optimal planned ca-
pacity of a work centre (which minimizes total costs
over the planning horizon) is presented.
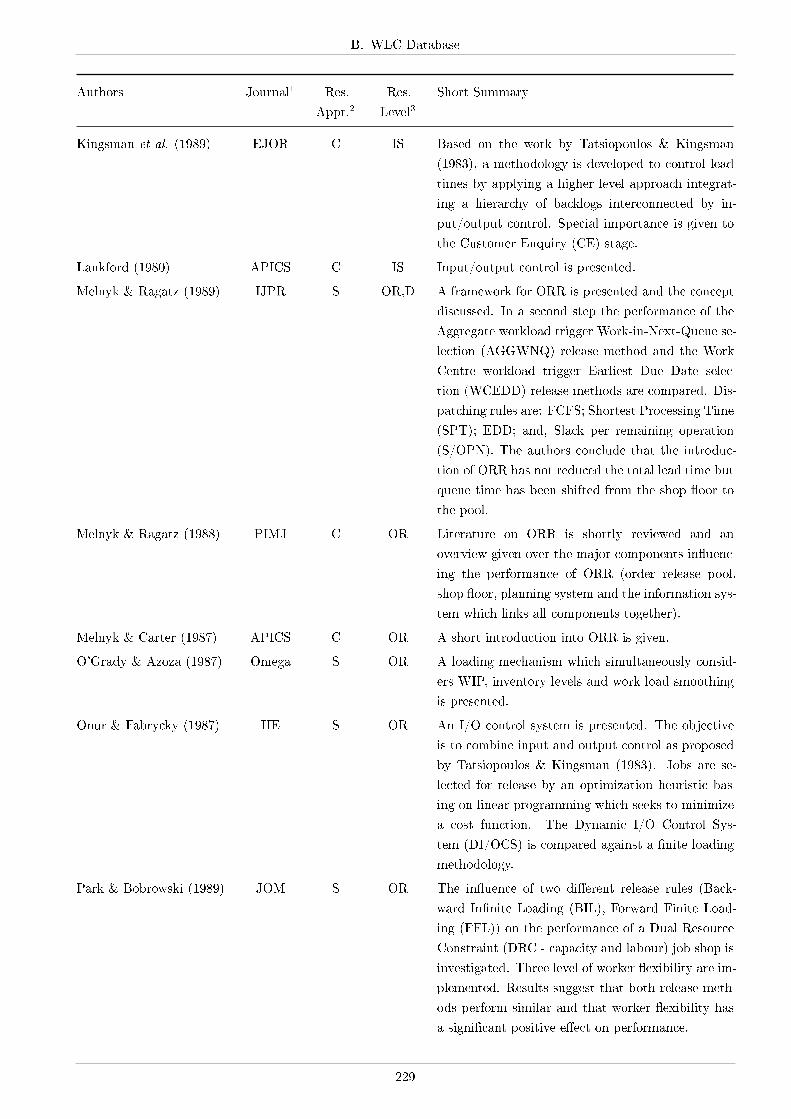
B. WLC Database
Authors Journal1 Res.
Appr.2Res.
Level3Short Summary
Kingsman et al. (1989) EJOR C IS Based on the work by Tatsiopoulos & Kingsman
(1983), a methodology is developed to control lead
times by applying a higher level approach integrat-
ing a hierarchy of backlogs interconnected by in-
put/output control. Special importance is given to
the Customer Enquiry (CE) stage.
Lankford (1980) APICS C IS Input/output control is presented.
Melnyk & Ragatz (1989) IJPR S OR,D A framework for ORR is presented and the concept
discussed. In a second step the performance of the
Aggregate workload trigger Work-in-Next-Queue se-
lection (AGGWNQ) release method and the Work
Centre workload trigger Earliest Due Date selec-
tion (WCEDD) release methods are compared. Dis-
patching rules are: FCFS; Shortest Processing Time
(SPT); EDD; and, Slack per remaining operation
(S/OPN). The authors conclude that the introduc-
tion of ORR has not reduced the total lead time but
queue time has been shifted from the shop �oor to
the pool.
Melnyk & Ragatz (1988) PIMJ C OR Literature on ORR is shortly reviewed and an
overview given over the major components in�uenc-
ing the performance of ORR (order release pool,
shop �oor, planning system and the information sys-
tem which links all components together).
Melnyk & Carter (1987) APICS C OR A short introduction into ORR is given.
O'Grady & Azoza (1987) Omega S OR A loading mechanism which simultaneously consid-
ers WIP, inventory levels and work load smoothing
is presented.
Onur & Fabrycky (1987) IIE S OR An I/O control system is presented. The objective
is to combine input and output control as proposed
by Tatsiopoulos & Kingsman (1983). Jobs are se-
lected for release by an optimization heuristic bas-
ing on linear programming which seeks to minimize
a cost function. The Dynamic I/O Control Sys-
tem (DI/OCS) is compared against a �nite loading
methodology.
Park & Bobrowski (1989) JOM S OR The in�uence of two di�erent release rules (Back-
ward In�nite Loading (BIL), Forward Finite Load-
ing (FFL)) on the performance of a Dual Resource
Constraint (DRC - capacity and labour) job shop is
investigated. Three level of worker �exibility are im-
plemented. Results suggest that both release meth-
ods perform similar and that worker �exibility has
a signi�cant positive e�ect on performance.
229
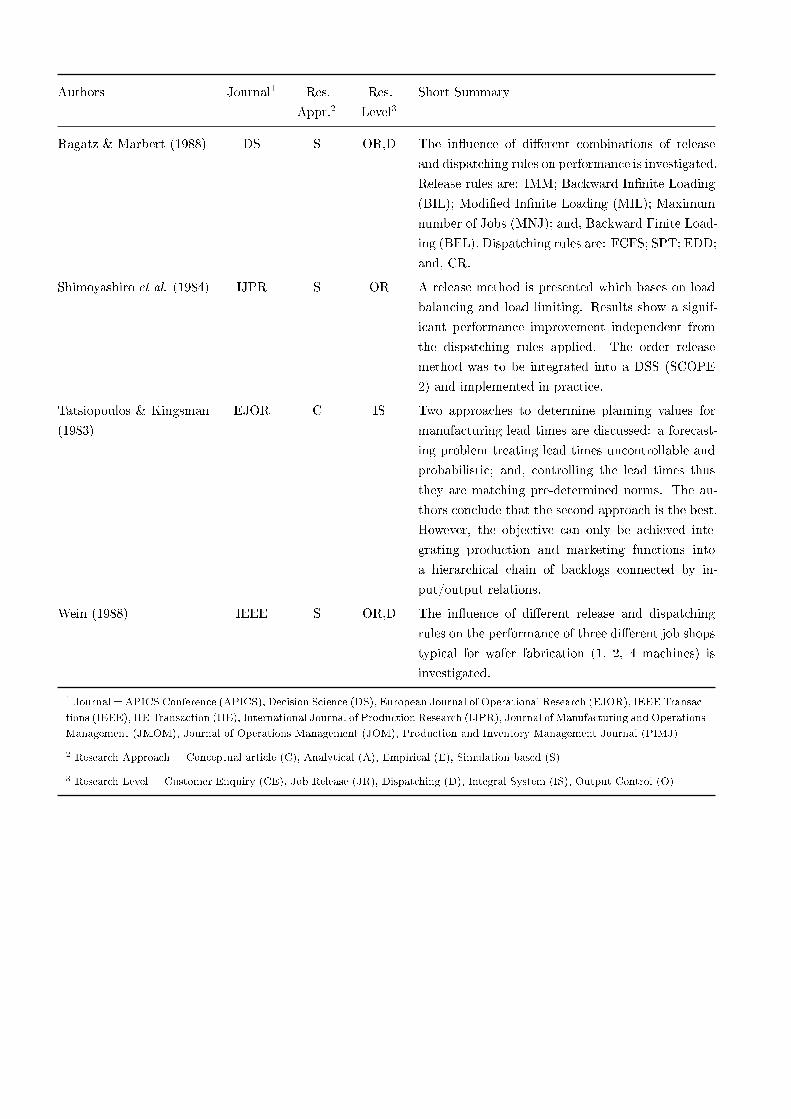
Authors Journal1 Res.
Appr.2Res.
Level3Short Summary
Ragatz & Marbert (1988) DS S OR,D The in�uence of di�erent combinations of release
and dispatching rules on performance is investigated.
Release rules are: IMM; Backward In�nite Loading
(BIL); Modi�ed In�nite Loading (MIL); Maximum
number of Jobs (MNJ); and, Backward Finite Load-
ing (BFL). Dispatching rules are: FCFS; SPT; EDD;
and, CR.
Shimoyashiro et al. (1984) IJPR S OR A release method is presented which bases on load
balancing and load limiting. Results show a signif-
icant performance improvement independent from
the dispatching rules applied. The order release
method was to be integrated into a DSS (SCOPE
2) and implemented in practice.
Tatsiopoulos & Kingsman
(1983)
EJOR C IS Two approaches to determine planning values for
manufacturing lead times are discussed: a forecast-
ing problem treating lead times uncontrollable and
probabilistic; and, controlling the lead times thus
they are matching pre-determined norms. The au-
thors conclude that the second approach is the best.
However, the objective can only be achieved inte-
grating production and marketing functions into
a hierarchical chain of backlogs connected by in-
put/output relations.
Wein (1988) IEEE S OR,D The in�uence of di�erent release and dispatching
rules on the performance of three di�erent job shops
typical for wafer fabrication (1, 2, 4 machines) is
investigated.
1 Journal = APICS Conference (APICS), Decision Science (DS), European Journal of Operational Research (EJOR), IEEE Transac-
tions (IEEE), IIE Transaction (IIE), International Journal of Production Research (IJPR), Journal of Manufacturing and Operations
Management (JMOM), Journal of Operations Management (JOM), Production and Inventory Management Journal (PIMJ)
2 Research Approach = Conceptual article (C), Analytical (A), Empirical (E), Simulation based (S)
3 Research Level = Customer Enquiry (CE), Job Release (JR), Dispatching (D), Integral System (IS), Output Control (O)
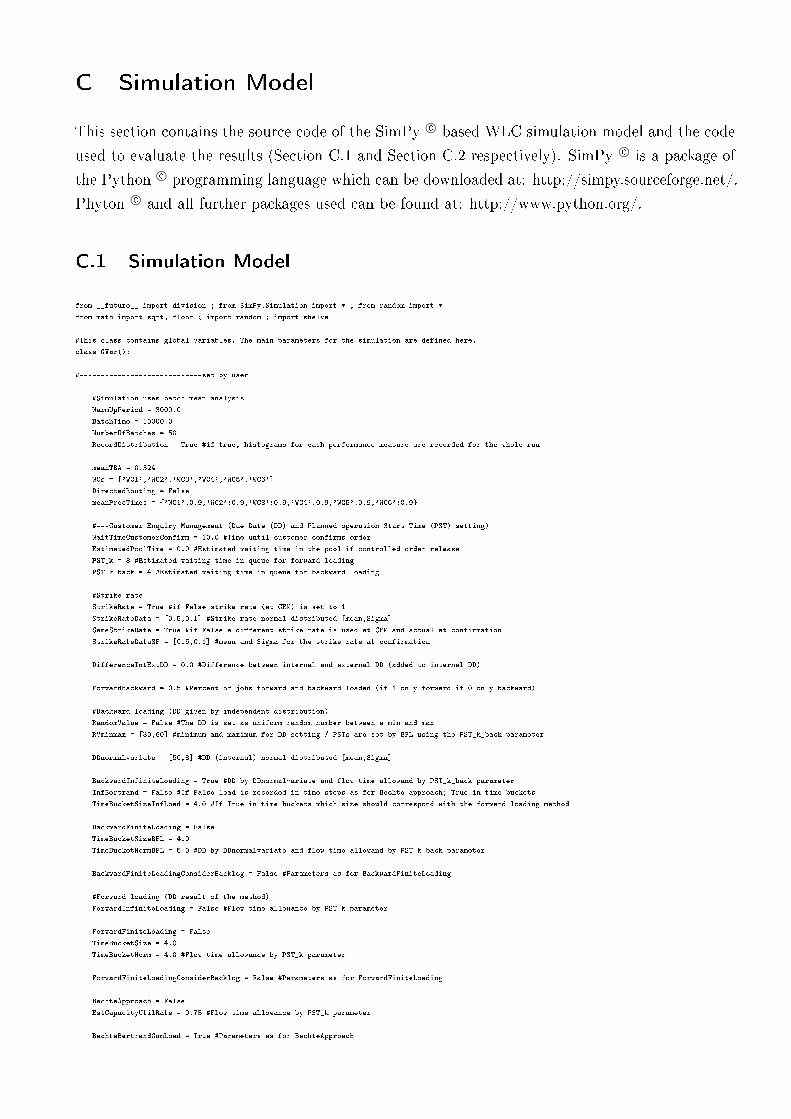
C Simulation Model
This section contains the source code of the SimPy c⃝ based WLC simulation model and the code
used to evaluate the results (Section C.1 and Section C.2 respectively). SimPy c⃝ is a package of
the Python c⃝ programming language which can be downloaded at: http://simpy.sourceforge.net/.
Phyton c⃝ and all further packages used can be found at: http://www.python.org/.
C.1 Simulation Model
from __future__ import division ; from SimPy.Simulation import * ; from random import *
from math import sqrt, floor ; import random ; import shelve
#This class contains global variables. The main parameters for the simulation are defined here.
class GVar():
#-----------------------------set by user
#Simulation uses batch mean analysis
WarmUpPeriod = 3000.0
BatchTime = 10000.0
NumberOfBatches = 50
RecordDistribution = True #if true, histograms for each performance measure are recorded for the whole run
meanTBA = 0.324
WCs = ['WC1','WC2','WC3','WC4','WC5','WC6']
DirectedRouting = False
meanProcTimes = {'WC1':0.9,'WC2':0.9,'WC3':0.9,'WC4':0.9,'WC5':0.9,'WC6':0.9}
#---Customer Enquiry Management (Due Date (DD) and Planned operation Start Time (PST) setting)
WaitTimeCustomerConfirm = 10.0 #Time until customer confirms order
EstimatedPoolTime = 0.0 #Estimated waiting time in the pool if controlled order release
PST_k = 8 #Estimated waiting time in queue for forward loading
PST_k_back = 4 #Estimated waiting time in queue for backward loading
#Strike rate
StrikeRate = True #if False strike rate (at CEM) is set to 1
StrikeRateData = [0.5,0.1] #Strike rate normal distributed [mean,Sigma]
SameStrikeRate = True #if False a different strike rate is used at CEM and actual at confirmation
StrikeRateDataSF = [0.5,0.1] #mean and Sigma for the strike rate at confirmation
DifferenceIntExtDD = 0.0 #Difference between internal and external DD (added to internal DD)
ForwardBackward = 0.5 #Percent of jobs forward and backward loaded (if 1 only forward if 0 only backward)
#Backward loading (DD given by independent distribution)
RandomValue = False #The DD is set as uniform random number between a min and max
RVminmax = [30,60] #minimum and maximum for DD setting / PSTs are set by BFL using the PST_k_back parameter
DDnormalvariate = [50,8] #DD (internal) normal distributed [mean,Sigma]
BackwardInfiniteLoading = True #DD by DDnormalvariate and flow time allowand by PST_k_back parameter
InfBertrand = False #If False load is recorded in time steps as for Bechte approach; True in time buckets
TimeBucketSizeInfLoad = 4.0 #If True in time buckets which size should correspond with the forward loading method
BackwardFiniteLoading = False
TimeBucketSizeBFL = 4.0
TimeBucketNormBFL = 5.0 #DD by DDnormalvariate and flow time allowand by PST_k_back parameter
BackwardFiniteLoadingConsiderBacklog = False #Parameters as for BackwardFiniteLoading
#Forward loading (DD result of the method)
ForwardInfiniteLoading = False #Flow time allowance by PST_k parameter
ForwardFiniteLoading = False
TimeBucketSize = 4.0
TimeBucketNorm = 4.0 #Flow time allowance by PST_k parameter
ForwardFiniteLoadingConsiderBacklog = False #Parameters as for ForwardFiniteLoading
BechteApproach = False
EstCapacityUtilRate = 0.75 #Flow time allowance by PST_k parameter
BechteBertrandCumLoad = True #Parameters as for BechteApproach

BertrandApproach = False
TimeBucketSizeB = 4.0
TimeBucketNormB = 3.5 #Flow time allowance by PST_k parameter
BertrandBechteCumLoad = False #Parameters as for BertrandApproach
#---Release Control
ImmediateRelease = False
CorrectedAggregateLoad = False
NormCAP = 5.5 #For periodic release
CheckPeriodCAP = 5.0
#The following values are used to assign for each WC a single workload norm.
#The Norm is multiplied with these values.
NormAdjustmentCAP = {'WC1':1,'WC2':1,'WC3':1,'WC4':1,'WC5':1,'WC6':1}
WCPRD = False
WLT = 0 #For continuous workload trigger
#The following values are used to assign for each WC a single workload trigger.
#The Trigger is multiplied with these values.
WLTAdjustment = {'WC1':1,'WC2':1,'WC3':1,'WC4':1,'WC5':1,'WC6':1}
LUMSOR = True
NormLUMSOR = 6
CheckPeriodLUMSOR = 4.0
#The following values are used to assign for each WC a single workload norm.
#The Norm is multiplied with these values.
NormAdjustmentLUMSOR = {'WC1':1,'WC2':1,'WC3':1,'WC4':1,'WC5':1,'WC6':1}
SLAR = False
Slar_k = 6
#---Dispatching (Default is FCFS)
PST = True #uses the PSTs set in the CEM - earliest PST first
#-----------------------------system intern
processedLoad = {} #keeps record of the processed load
processedLoadCorr = {} #converted processed load for e.g. the corrected aggregate load approach
releasedLoad = {} #load which has been released
plannedLoad = {} #the planned load at the CEM if a Time Bucket is used (e.g. FFL and Bertrand)
plannedLoad = {} #the planned load at the CEM if the Bechte approch is used
ShopFloor = []
NoJobInQueue = True #used to trigger release for e.g. SLAR and WCPRD if no jobs on the shop floor
RunOutTime = 200.0 #used to assure that all process are finished at the end
ReturnValue = [] #used to store the results
JobTardy = 0 #counts the tardy jobs
#---------------------------------------------------------------------------------------------------
#This class contains all methods used in general in the simulation
class GFunc():
def twoErlangTruncated(self,meanProcTime):
returnValue = 0
while returnValue < 0.000001 or returnValue > 4.0:
returnValue = 2*expovariate((meanProcTime*2))
return returnValue
def NoJobsQueueing(self):
GVar.NoJobsInTheQueue = False
for WC in GVar.ShopFloor:
if len(WC.activeQ) == 0 and len(released.waits) > 0:
GVar.NoJobsInTheQueue = True
return GVar.NoJobsInTheQueue == True
def loadInQueue(self,WorkCentre):
returnValue = 0
for job in WorkCentre.waitQ:
returnValue += job.procTime[WorkCentre.name]
return returnValue
def noUrgentJobs(self,WorkCentre):
returnValue = False
for job in WorkCentre.waitQ:
if job.SLARPST[WorkCentre.name] <= now():
returnValue = True
return returnValue
def determineSLARPST(self,job,SLAR_k):
returnValue = {}
SLARPSTauxiliar = [job.DueDate]
for WC in reversed(job.routeingSequence):
C. Simulation Model
SLARPST = SLARPSTauxiliar[0] - job.procTime[WC] - SLAR_k
SLARPSTauxiliar.insert(0, SLARPST)
returnValue[WC] = SLARPST
return returnValue
def evaluateResults(self, Results, Variance):
returnValue = []
for i in range(len(Results)):
summ = 0 ; mean = 0 ; s = 0 ; aux = []
#gets the mean
for Result in Results[i]:
summ +=Result
mean=summ/len(Results[i]) ; summ = 0
for Result in Results[i]:
summ +=(Result-mean)**2
s = sqrt(summ/len(Results[i]))
aux.append(mean)
aux.append((1.96*s)/sqrt(1/len(Results[i])))
returnValue.append(aux)
aux = []
for i in range (len(Variance)):
summ = 0 ; mean = 0
#gets the mean
for Result in Variance[i]:
summ +=Result
mean=summ/len(Variance[i]) #the mean
aux.append(mean)
returnValue.append(aux)
return returnValue
#This class contains the source which generates the orders
class Source(Process):
def generateRandomArrivalExp(self,meanTBA):
i = 1
while True:
order = Order(name='Job%07d'%(i,))
activate(order,order.process())
t = expovariate(1/meanTBA)
yield hold, self, t
i +=1
if now() >= GVar.WarmUpPeriod+GVar.BatchTime*GVar.NumberOfBatches:
break
#This class contains the methods for the Customer Enquiry Management (CEM)
class CEM():
#DD defined by a random value and PSTs simply backward scheduled
def randomValueDD(self,order):
order.DueDate = now()+ random.randint(GVar.RVminmax[0],GVar.RVminmax[1]) #The DD is set
#From the DD on the PSTs are determined by backward scheduling
PSTauxiliar = [order.DueDate]
for WC in reversed(order.routeingSequence):
PST = PSTauxiliar[0] - order.procTime[WC] - GVar.PST_k_back
PSTauxiliar.insert(0, PST)
order.PSTs[WC]=PST
order.DueDate += GVar.DifferenceIntExtDD
#Backward Infinite Loading
def backwardInfiniteLoading(self,order):
order.DueDate = now()+ normalvariate(GVar.DDnormalvariate[0],GVar.DDnormalvariate[1]) #The DD is set
PSTauxiliar = [order.DueDate]
for WC in reversed(order.routeingSequence): #The PST is set
PST = PSTauxiliar[0] - order.procTime[WC] - GVar.PST_k_back
PSTauxiliar.insert(0, PST) ; order.PSTs[WC]=PST
if GVar.InfBertrand: #The load is contributed
Bucket = int(floor(PST/GVar.TimeBucketSizeInfLoad))
if Bucket not in GVar.plannedLoad[WC]: GVar.plannedLoad[WC][Bucket] = 0
GVar.plannedLoad[WC][Bucket]+=order.procTime[WC]*order.StrikeRate ; order.TimeBucket[WC] = Bucket
else:
Bucket = int(floor(now()))
if Bucket not in GVar.plannedLoad[WC]: GVar.plannedLoad[WC][Bucket] = 0
GVar.plannedLoad[WC][Bucket]+=order.procTime[WC]*order.StrikeRate ; order.TimeBucket[WC] = Bucket
order.DueDate +=GVar.DifferenceIntExtDD
#Backward Finite Loading considering the backlog as for Bertrand approach
def backwardFiniteLoading(self,order):
order.DueDate = now()+ normalvariate(GVar.DDnormalvariate[0],GVar.DDnormalvariate[1]) #The DD is set
NowBucket = int(floor(now()/GVar.TimeBucketSizeBFL))
#Determines the time bucket previous to the one in which falls the DD
IDTimeBucket = int(floor(order.DueDate/GVar.TimeBucketSizeBFL))-1
for WC in reversed(order.routeingSequence):
while True:
if IDTimeBucket < NowBucket:
if IDTimeBucket not in GVar.plannedLoad[WC]: GVar.plannedLoad[WC][IDTimeBucket] = 0
233
GVar.plannedLoad[WC][IDTimeBucket] +=order.procTime[WC]*order.StrikeRate
order.PSTs[WC]=(IDTimeBucket)*GVar.TimeBucketSizeBFL ; order.TimeBucket[WC]=IDTimeBucket
break
if IDTimeBucket in GVar.plannedLoad[WC]: #Test whether time bucket already exists
#Determines in which time bucket the cumulative planned load fits the capacity
if GVar.plannedLoad[WC][IDTimeBucket]+ order.procTime[WC] <= GVar.TimeBucketNormBFL:
GVar.plannedLoad[WC][IDTimeBucket] +=order.procTime[WC]*order.StrikeRate
#If load can be contributed set PST at the beginning of the TB and break
order.PSTs[WC]=(IDTimeBucket-1)*GVar.TimeBucketSizeBFL ; order.TimeBucket[WC]=IDTimeBucket
break
else: IDTimeBucket -=1 #try next time step
else: GVar.plannedLoad[WC][IDTimeBucket] = 0 #If the planning horizon has to be extented
#The estimated wait time and proc time is subtracted to determine first completion date at next WC
IDTimeBucket -= (int(floor((GVar.PST_k_back+order.procTime[WC])/GVar.TimeBucketSizeBFL)))
order.DueDate +=GVar.DifferenceIntExtDD
#Backward Finite Loading considering the backlog as for Bertrand approach
def backwardFiniteLoadingConsiderBacklog(self,order):
order.DueDate = now()+ normalvariate(GVar.DDnormalvariate[0],GVar.DDnormalvariate[1]) #The DD is set
NowBucket = int(floor(now()/GVar.TimeBucketSizeBFL))
#Determines the time bucket previous to the one in which falls the DD
IDTimeBucket = int(floor(order.DueDate/GVar.TimeBucketSizeBFL))-1
for WC in reversed(order.routeingSequence):
Backlog = 0 ; keys = GVar.plannedLoad[WC].keys() ; keys.sort()
for key in keys: #gets the cumulative load
if key < NowBucket: Backlog += GVar.plannedLoad[WC][key]
else: break
#Distributes the backlog over time buckets (forward loading);gives the first possible bucket for new load
FirstBucket = NowBucket
while Backlog > 0:
if FirstBucket in GVar.plannedLoad[WC]: Backlog -= GVar.TimeBucketNormBFL-GVar.plannedLoad[WC][FirstBucket]
else: Backlog -= GVar.TimeBucketSizeBFL
FirstBucket +=1
while True:
if IDTimeBucket < FirstBucket-1: #Test whether there is still capacity
#No capacity anymore thus set PST by BIL and add load to backlog (NowBucket-1)
if NowBucket-1 not in GVar.plannedLoad[WC]: GVar.plannedLoad[WC][NowBucket-1] = 0
GVar.plannedLoad[WC][NowBucket-1] +=order.procTime[WC]*order.StrikeRate
order.PSTs[WC]=(IDTimeBucket-1)*GVar.TimeBucketSizeBFL ; order.TimeBucket[WC]=NowBucket-1
break
if IDTimeBucket in GVar.plannedLoad[WC]: #Test whether time bucket already exists
#Determines in which time bucket the cumulative planned load fits the capacity
if GVar.plannedLoad[WC][IDTimeBucket]+ order.procTime[WC] <= GVar.TimeBucketNormBFL:
GVar.plannedLoad[WC][IDTimeBucket] +=order.procTime[WC]*order.StrikeRate
#If load can be contributed set PST at the beginning of the TB and break
order.PSTs[WC]=(IDTimeBucket-1)*GVar.TimeBucketSizeBFL ; order.TimeBucket[WC]=IDTimeBucket
break
else: IDTimeBucket -=1 #try next time step
else: GVar.plannedLoad[WC][IDTimeBucket] = 0 #If the planning horizon has to be extented
#The estimated wait time and proc time is subtracted to determine first completion date at next WC
IDTimeBucket -= (int(floor((GVar.PST_k_back+order.procTime[WC])/GVar.TimeBucketSizeBFL)))
for key in keys: #deletes empty buckets from the past
if key < NowBucket:
if GVar.plannedLoad[WC][key] <= 0.000001: del GVar.plannedLoad[WC][key]
else: break
order.DueDate +=GVar.DifferenceIntExtDD
#Forward Infinite Loading
def forwardInfiniteLoading(self,order):
PST = now()+GVar.WaitTimeCustomerConfirm
for WC in order.routeingSequence:
PST += GVar.PST_k
order.PSTs[WC] = PST
PST += order.procTime[WC]
order.DueDate = PST + GVar.DifferenceIntExtDD
#Forward Finite Loading
def forwardFiniteLoading(self,order):
#Starting Bucket
IDTimeBucket = int(floor((now()+GVar.WaitTimeCustomerConfirm+GVar.EstimatedPoolTime)/GVar.TimeBucketSize))
#Checks the capacity and determines the subsequent time buckets
for WC in order.routeingSequence:
#The estimated wait time and proc time is added to determine the first possible bucket of job completion
IDTimeBucket += (int(floor((GVar.PST_k+order.procTime[WC])/GVar.TimeBucketSize)))
while True:
if IDTimeBucket in GVar.plannedLoad[WC]: #Test whether time bucket already exists
#Test whether load can be contributed without violating the capacity norm...
if GVar.plannedLoad[WC][IDTimeBucket]+ order.procTime[WC] <= GVar.TimeBucketNorm:
GVar.plannedLoad[WC][IDTimeBucket] +=order.procTime[WC]*order.StrikeRate
#If load can be contributed set PST at the beginning of the TB and break
order.PSTs[WC]=(IDTimeBucket-1)*GVar.TimeBucketSize ; order.TimeBucket[WC]=IDTimeBucket
break
else: IDTimeBucket +=1 #try next time bucket
C. Simulation Model
else: GVar.plannedLoad[WC][IDTimeBucket] = 0 #If a new time bucket has to be created
NowBucket = int(floor(now()/GVar.TimeBucketSize)) ; keys = GVar.plannedLoad[WC].keys() ; keys.sort()
for key in keys: #Time buckets which are not needed anymnore are deleted
if key < NowBucket - GVar.WaitTimeCustomerConfirm: del GVar.plannedLoad[WC][key]
else: break
order.DueDate = IDTimeBucket*GVar.TimeBucketSize+GVar.DifferenceIntExtDD
#Forward Finite Loading considering the backlog as for Bertrand approach
def forwardFiniteLoadingConsiderBacklog(self,order):
#Starting Bucket
IDTimeBucket = int(floor((now()+GVar.WaitTimeCustomerConfirm+GVar.EstimatedPoolTime)/GVar.TimeBucketSize))
NowBucket = int(floor(now()/GVar.TimeBucketSize))
for WC in order.routeingSequence:
#The estimated wait time and proc time is added to determine the first possible bucket of job completion
IDTimeBucket += (int(floor((GVar.PST_k+order.procTime[WC])/GVar.TimeBucketSize)))
Backlog = 0 ; keys = GVar.plannedLoad[WC].keys() ; keys.sort()
for key in keys: #Gets the cumulative load for this first time bucket
if key < NowBucket: Backlog += GVar.plannedLoad[WC][key]
else: break
#Distributes the backlog over the time buckets and gives the first possible bucket for the new load
FirstBucket = NowBucket
while Backlog > 0:
if FirstBucket in GVar.plannedLoad[WC]: Backlog -= GVar.TimeBucketNorm-GVar.plannedLoad[WC][FirstBucket]
else: Backlog -= GVar.TimeBucketSize
FirstBucket +=1
if IDTimeBucket < FirstBucket-1: IDTimeBucket = FirstBucket-1
while True:
if IDTimeBucket in GVar.plannedLoad[WC]: #Test whether time bucket already exists
#Determines in which time bucket the cumulative planned load fits the capacity
if GVar.plannedLoad[WC][IDTimeBucket]+ order.procTime[WC] <= GVar.TimeBucketNorm:
GVar.plannedLoad[WC][IDTimeBucket] +=order.procTime[WC]*order.StrikeRate
#If load can be contributed set PST at the beginning of the TB and break
order.PSTs[WC]=(IDTimeBucket-1)*GVar.TimeBucketSize ; order.TimeBucket[WC]=IDTimeBucket
break
else: IDTimeBucket +=1 #Try next time step
else: GVar.plannedLoad[WC][IDTimeBucket] = 0 #If the planning horizon has to be extented
for key in keys: #Deletes empty buckets from the past
if key < NowBucket - GVar.WaitTimeCustomerConfirm:
if GVar.plannedLoad[WC][key] <= 0.000001: del GVar.plannedLoad[WC][key]
else: break
order.DueDate = IDTimeBucket*GVar.TimeBucketSize+GVar.DifferenceIntExtDD
#Bechte approach
def bechteApproach(self,order):
IDPST = int(floor(now()+GVar.WaitTimeCustomerConfirm+GVar.EstimatedPoolTime)) #Determines the first possible PST
Now = int(floor(now()))
for WC in order.routeingSequence:
#The estimated waiting time and proc time is added to determine the first possible date of job completion
IDPST += int(floor(GVar.PST_k+order.procTime[WC]))
CumulativeLoad = GVar.plannedLoad[WC]['UntilNow']-GVar.processedLoad[WC]
keys = GVar.plannedLoad[WC].keys() ; keys.sort()
for key in keys: #Determines the current backlog
if key < IDPST: CumulativeLoad += GVar.plannedLoad[WC][key]
else: break
while True:
if IDPST in GVar.plannedLoad[WC]: #Test whether planning horizon is long enough
#Determines at which time step the cumulative planned load fits the capacity
CumulativeLoad += GVar.plannedLoad[WC][IDPST]
EstimatedCapacity = (IDPST-Now)*GVar.EstCapacityUtilRate
if CumulativeLoad + order.procTime[WC] <= EstimatedCapacity:
GVar.plannedLoad[WC][IDPST] +=order.procTime[WC]*order.StrikeRate
#If load can be contributed set PST (operation completion date - proc time) and break
order.PSTs[WC]=IDPST-order.procTime[WC] ; order.TimeBucket[WC]=IDPST
break
else: IDPST +=1 #Try next time step
else: GVar.plannedLoad[WC][IDPST] = 0 #If the planning horizon has to be extented
for key in keys: #Past entries are deleted and the planned load of these entries recorded
if key < Now - GVar.WaitTimeCustomerConfirm:
GVar.plannedLoad[WC]['UntilNow'] +=GVar.plannedLoad[WC][key]
del GVar.plannedLoad[WC][key]
else: break
order.DueDate = IDPST+GVar.DifferenceIntExtDD
#Bechte approach applying the cumulative load as for Bertrand
def bechteBertrandCumLoad(self,order):
Now = int(floor(now()))
IDPST = int(floor(now()+GVar.WaitTimeCustomerConfirm+GVar.EstimatedPoolTime)) #Determines the first possible PST
for WC in order.routeingSequence:
#The estimated waiting time and proc time is added to determine the first possible bucket of job completion
IDPST += int(floor(GVar.PST_k+order.procTime[WC]))
CumulativeLoad = 0 ; keys = GVar.plannedLoad[WC].keys() ; keys.sort()
for key in keys: #Determines the current backlog
if key < IDPST: CumulativeLoad += GVar.plannedLoad[WC][key]
235
else: break
while True:
#Test whether planning horizon is long enough
if IDPST in GVar.plannedLoad[WC]:
#Determines at which time step the cumulative planned load fits the capacity
CumulativeLoad += GVar.plannedLoad[WC][IDPST]
EstimatedCapacity = (IDPST-Now)*GVar.EstCapacityUtilRate
if CumulativeLoad + order.procTime[WC] <= EstimatedCapacity:
GVar.plannedLoad[WC][IDPST] +=order.procTime[WC]*order.StrikeRate
#If load can be contributed set PST (operation completion date - proc time) and break
order.PSTs[WC]=IDPST-order.procTime[WC] ; order.TimeBucket[WC]=IDPST
break
else: IDPST +=1 #Try next time step
else: GVar.plannedLoad[WC][IDPST] = 0 #If the planning horizon has to be extented
for key in keys: #Deletes empty buckets from the past
if key < Now - GVar.WaitTimeCustomerConfirm:
if GVar.plannedLoad[WC][key] <= 0.000001: del GVar.plannedLoad[WC][key]
else: break
order.DueDate = IDPST+GVar.DifferenceIntExtDD
#Bertrand approach
def bertrandApproach(self,order):
#Starting Bucket
IDTimeBucket = int(floor((now()+GVar.WaitTimeCustomerConfirm+GVar.EstimatedPoolTime)/GVar.TimeBucketSizeB))
NowBucket = int(floor(now()/GVar.TimeBucketSizeB))
for WC in order.routeingSequence:
#The estimated wait time and proc time is added to determine the first possible bucket of job completion
IDTimeBucket += (int(floor((GVar.PST_k+order.procTime[WC])/GVar.TimeBucketSizeB)))
CumulativeLoad = 0 ; keys = GVar.plannedLoad[WC].keys() ; keys.sort()
for key in keys: #Gets the cumulative load for the first time bucket
if key < IDTimeBucket: CumulativeLoad += GVar.plannedLoad[WC][key]
else: break
while True:
#Test whether time bucket already exists
if IDTimeBucket in GVar.plannedLoad[WC]:
#Determines in which time bucket the cumulative planned load fits the capacity
CumulativeLoad += GVar.plannedLoad[WC][IDTimeBucket]
EstimatedCapacity = (IDTimeBucket-NowBucket+1)*GVar.TimeBucketNormB
if CumulativeLoad + order.procTime[WC] <= EstimatedCapacity:
GVar.plannedLoad[WC][IDTimeBucket] +=order.procTime[WC]*order.StrikeRate
#If load can be contributed set PST (operation completion date - proc time) and break
order.PSTs[WC]=(IDTimeBucket-1)*GVar.TimeBucketSizeB ; order.TimeBucket[WC]=IDTimeBucket
break
else: IDTimeBucket +=1 #Try next time step
else: GVar.plannedLoad[WC][IDTimeBucket] = 0 #If the planning horizon has to be extented
for key in keys: #Deletes empty buckets from the past
if key < NowBucket - GVar.WaitTimeCustomerConfirm:
if GVar.plannedLoad[WC][key] <= 0.000001: del GVar.plannedLoad[WC][key]
else: break
order.DueDate = IDTimeBucket*GVar.TimeBucketSizeB+GVar.DifferenceIntExtDD
#Bertrand approach applying the cumulative load as for Bechte
def bertrandBechteCumLoad(self,order):
#Starting Bucket
IDTimeBucket = int(floor((now()+GVar.WaitTimeCustomerConfirm+GVar.EstimatedPoolTime)/GVar.TimeBucketSizeB))
NowBucket = int(floor(now()/GVar.TimeBucketSizeB))
for WC in order.routeingSequence:
#The estimated wait time and proc time is added to determine the first possible bucket of job completion
IDTimeBucket += (int(floor((GVar.PST_k+order.procTime[WC])/GVar.TimeBucketSizeB)))
CumulativeLoad = GVar.plannedLoad[WC]['UntilNow']-GVar.processedLoad[WC]
keys = GVar.plannedLoad[WC].keys() ; keys.sort()
for key in keys: #Gets the cumulative load for the first time bucket
if key < IDTimeBucket: CumulativeLoad += GVar.plannedLoad[WC][key]
else: break
while True:
#Test whether time bucket already exists
if IDTimeBucket in GVar.plannedLoad[WC]:
#Determines in which time bucket the cumulative planned load fits the capacity
CumulativeLoad += GVar.plannedLoad[WC][IDTimeBucket]
EstimatedCapacity = (IDTimeBucket-NowBucket+1)*GVar.TimeBucketNormB
if CumulativeLoad + order.procTime[WC] <= EstimatedCapacity:
GVar.plannedLoad[WC][IDTimeBucket] +=order.procTime[WC]*order.StrikeRate
#If load can be contributed set PST (operation completion date - proc time) and break
order.PSTs[WC]=(IDTimeBucket-1)*GVar.TimeBucketSizeB ; order.TimeBucket[WC]=IDTimeBucket
break
else: IDTimeBucket +=1 #Try next time step
else: GVar.plannedLoad[WC][IDTimeBucket] = 0 #If the planning horizon has to be extented
for key in keys: #Past buckets are deleted and the planned load of these entries recorded
if key < NowBucket - GVar.WaitTimeCustomerConfirm:
GVar.plannedLoad[WC]['UntilNow'] +=GVar.plannedLoad[WC][key] ; del GVar.plannedLoad[WC][key]
else: break
order.DueDate = IDTimeBucket*GVar.TimeBucketSizeB+GVar.DifferenceIntExtDD
C. Simulation Model
def jobConfirmed(self,order):
for WC in order.routeingSequence:
if not GVar.ForwardInfiniteLoading:
if not GVar.RandomValue:
GVar.plannedLoad[WC][order.TimeBucket[WC]] -=(order.procTime[WC]*order.StrikeRate)
GVar.plannedLoad[WC][order.TimeBucket[WC]] +=order.procTime[WC]
def jobNotConfirmed(self,order):
for WC in order.routeingSequence:
if not GVar.ForwardInfiniteLoading:
if not GVar.RandomValue:
GVar.plannedLoad[WC][order.TimeBucket[WC]] -=(order.procTime[WC]*order.StrikeRate)
#This class contains the different rules to control release.
class ReleaseControl(Process):
#The corrected aggregate load approach
def correctedAggregateLoadApproach(self,CheckPeriod):
while True:
yield hold, self, CheckPeriod
#The orders in the Pool (i.e. waiting for the 'released' event) are sorted
#The factor after which is sorted is the first PST i.e. the PRD
released.waits.sort(key=lambda job: job[0].PSTs[job[0].routeingSequence[0]])
for job in released.waits:
#The load is contributed
for WC in job[0].routeingSequence:
GVar.releasedLoad[WC] += job[0].procTime[WC]/(job[0].routeingSequence.index(WC)+1)
job[0].released=True
#The new load is compared to the norm.
#If the norm is violated the 'released' status is set back to False
for WC in job[0].routeingSequence:
if GVar.releasedLoad[WC]-GVar.processedLoadCorr[WC] > GVar.NormCAP*GVar.NormAdjustmentCAP[WC]:
job[0].released=False
#If a norm has been violated the job is not released and the contributed load set back
if job[0].released == False:
for WC in job[0].routeingSequence:
GVar.releasedLoad[WC] -= job[0].procTime[WC]/(job[0].routeingSequence.index(WC)+1)
#release is triggered
released.signal()
#Work Centre Planned Release Date (WCPRD) release method
def wCPRD_base(self):
while True:
#It is tested whether there is any job processed at the work centre
#If no jobs are at the work centres release may never be triggered
#Therefore in this case release is triggered by this process
yield waituntil, self , GFunc().NoJobsQueueing
for WC in GVar.ShopFloor:
if len(WC.activeQ) == 0:
WLTrigger.signal([WC.name,0])
yield hold, self, 0.1
def wCPRDTrigger(self):
while True:
yield waitevent, self, WLTrigger
WC = WLTrigger.signalparam[0]
CurrentLoadInQueue = WLTrigger.signalparam[1]
#The orders in the Pool (i.e. waiting for the 'released' event) are sorted
#The factor after which is sorted is the first PST i.e. the PRD
released.waits.sort(key=lambda job: job[0].PSTs[job[0].routeingSequence[0]])
for job in released.waits:
if job[0].routeingSequence[0] == WC:
job[0].released = True
CurrentLoadInQueue += job[0].procTime[WC]
if CurrentLoadInQueue > GVar.WLT*GVar.WLTAdjustment[WC]:
break
released.signal()
#LUMS OR, which consists of two parts: periodic and continuous
def lUMSOR_PeriodicPart(self, CheckPeriod):
while True:
yield hold, self, CheckPeriod
#The orders in the Pool (i.e. waiting for the 'released' event) are sorted
#The factor after which is sorted is the first PST i.e. the PRD
released.waits.sort(key=lambda job: job[0].PSTs[job[0].routeingSequence[0]])
for job in released.waits:
#The load is contributed
for WC in job[0].routeingSequence:
GVar.releasedLoad[WC] += job[0].procTime[WC]/(job[0].routeingSequence.index(WC)+1)
job[0].released=True
#The new load is compared to the norm
#If the norm is violated the 'released' status is set back to False
for WC in job[0].routeingSequence:
if GVar.releasedLoad[WC]-GVar.processedLoadCorr[WC] > GVar.NormLUMSOR*GVar.NormAdjustmentLUMSOR[WC]:
237

job[0].released=False
#If a norm has been violated the job is not released and the contributed load set back
if job[0].released == False:
for WC in job[0].routeingSequence:
GVar.releasedLoad[WC] -= job[0].procTime[WC]/(job[0].routeingSequence.index(WC)+1)
#release is triggered
released.signal()
#LUMS OR: continuous part. Both parts have to be activated
def lUMSOR_ContinuousTrigger(self):
while True:
yield waitevent, self, WLTrigger
released.waits.sort(key=lambda job: job[0].PSTs[job[0].routeingSequence[0]])
for job in released.waits:
if job[0].routeingSequence[0] == WLTrigger.signalparam:
job[0].released = True
for WC in job[0].routeingSequence:
GVar.releasedLoad[WC] += job[0].procTime[WC]/(job[0].routeingSequence.index(WC)+1)
break
released.signal()
#SLAR
def sLAR_base(self):
while True:
#It is tested whether there is any job processed at the work centre
#If no jobs are at the work centres release may never be triggered
#Therefore in this case release is triggered by this process
yield waituntil, self , GFunc().NoJobsQueueing
for WC in GVar.ShopFloor:
if len(WC.activeQ) == 0:
WLTrigger.signal(WC.name)
yield hold, self, 0.1
def sLARTrigger(self):
while True:
yield waitevent, self, WLTrigger
#The orders in the Pool (i.e. waiting for the 'released' event) are sorted
#The factor after which is sorted is the first PST i.e. the PRD
released.waits.sort(key=lambda job: job[0].PSTs[job[0].routeingSequence[0]])
for job in released.waits:
if job[0].routeingSequence[0] == WLTrigger.signalparam:
job[0].released = True
break
released.signal()
def sLARNoUrgentJob(self):
while True:
yield waitevent, self, NoUrgentJob
#The orders in the Pool (i.e. waiting for the 'released' event) are sorted
#The factor after which is sorted is the Shortest Processing Time (SPT)
released.waits.sort(key=lambda job: job[0].procTime[job[0].routeingSequence[0]])
for job in released.waits:
if job[0].routeingSequence[0] == NoUrgentJob.signalparam:
if job[0].SLARPST[NoUrgentJob.signalparam] <= now():
job[0].released = True
job[0].priority[NoUrgentJob.signalparam] = True
break
released.signal()
#This class contains the dispatching rules
class PriorityDispatching():
def PST(self, job, WorkCentre):
returnValue = -job.PSTs[WorkCentre]
return returnValue
#This class contains the lifecycle of the orders. It is the most important class of the simulation.
class Order(Process):
#This method is automatically called if a Order object is created.
#It initializes the basic information of each order.
def __init__(self,name):
Process.__init__(self,name)
self.released = GVar.ImmediateRelease #If set False release takes place
self.routeingSequence = sample(GVar.WCs,random.randint(1,len(GVar.WCs)))
if GVar.DirectedRouting:
self.routeingSequence.sort() # if directed routeing
self.procTime = {}
for WC in GVar.WCs:
if WC in self.routeingSequence:
self.procTime[WC] = GFunc().twoErlangTruncated(meanProcTime=GVar.meanProcTimes[WC])
self.DueDate = 0
if GVar.StrikeRate: self.StrikeRate = normalvariate(GVar.StrikeRateData[0],GVar.StrikeRateData[1])
else: self.StrikeRate = 1.0
self.PSTs = {}
C. Simulation Model
self.TimeBucket = {} #used at CEM
self.priority = {} #used for prioritization
for WC in self.routeingSequence:
self.priority[WC] = False
self.TimeBucket[WC] = 0
if GVar.SLAR:
self.SLARPST = {}
#This method contains the lifecycle of the order
def process(self):
#-----Data Collection Point
DataJobEntryTime=now()
#Order is processed at CEM
if uniform(0,1) <= GVar.ForwardBackward: #Forward loading
if GVar.ForwardInfiniteLoading: CEM().forwardInfiniteLoading(self)
if GVar.ForwardFiniteLoading: CEM().forwardFiniteLoading(self)
if GVar.ForwardFiniteLoadingConsiderBacklog: CEM().forwardFiniteLoadingConsiderBacklog(self)
if GVar.BechteApproach: CEM().bechteApproach(self)
if GVar.BertrandApproach: CEM().bertrandApproach(self)
if GVar.BechteBertrandCumLoad: CEM().bechteBertrandCumLoad(self)
if GVar.BertrandBechteCumLoad: CEM().bertrandBechteCumLoad(self)
else: #Backward loading
if GVar.RandomValue: CEM().randomValueDD(self)
if GVar.BackwardInfiniteLoading: CEM().backwardInfiniteLoading(self)
if GVar.BackwardFiniteLoading: CEM().backwardFiniteLoading(self)
if GVar.BackwardFiniteLoadingConsiderBacklog: CEM().backwardFiniteLoadingConsiderBacklog(self)
#Customer confirmation is waited for...
yield hold, self, GVar.WaitTimeCustomerConfirm
#If strike rates are known at CEM
if GVar.SameStrikeRate: StrkRate = self.StrikeRate
else : StrkRate = normalvariate(GVar.StrikeRateDataSF[0],GVar.StrikeRateDataSF[1])
#If the job is confirmed...
if uniform(0,1) <= StrkRate: CEM().jobConfirmed(self)
#Else passivate job
else:
CEM().jobNotConfirmed(self)
yield passivate, self
#Job is accepted and waits for release
#If SLAR: SLARPST for urgency are set
if GVar.SLAR: self.SLARPST = GFunc().determineSLARPST(self,GVar.Slar_k)
while self.released == False:
yield waitevent, self, released
#-----Data Collection Point
DataJobReleaseTime=now()
#Job enters the job floor and is processed
#For each work centre in the routein sequence...
for WorkCentre in self.routeingSequence:
#...look for this work centre on the shop floor...
for WorkCentreSF in GVar.ShopFloor:
if WorkCentreSF.name == WorkCentre:
#...request a work centre and assign a priority to the job according to the dispatching rule applied
if self.priority[WorkCentre]: Priority = 100000
elif GVar.PST: Priority = PriorityDispatching().PST(self,WorkCentre)
else: Priority = 1 # Default is FCFS
yield request, self, WorkCentreSF, Priority
#The job is processed
yield hold, self, self.procTime[WorkCentre]
#WCPRD continuos feedback on current load in queue
if GVar.WCPRD:
CurrentLoadInQueue = GFunc().loadInQueue(WorkCentreSF)
if CurrentLoadInQueue <= GVar.WLT*GVar.WLTAdjustment[WorkCentre]:
WLTrigger.signal([WorkCentre,CurrentLoadInQueue])
#LUMSOR continuous feedback on idle work centre
if GVar.LUMSOR:
if len(WorkCentreSF.waitQ) == 0:
WLTrigger.signal(WorkCentre)
#SLAR continuous feedback on idle work centre and urgency of jobs in the queue
if GVar.SLAR:
if len(WorkCentreSF.waitQ) == 0:
WLTrigger.signal(WorkCentre)
if GFunc().noUrgentJobs(WorkCentreSF):
NoUrgentJob.signal(WorkCentre)
#This Process is interupted to let the triggered job be the first in the queue
yield hold, self, 0
#Job leaves the work centre
yield release, self, WorkCentreSF
#-----Data Collection Point
GVar.processedLoad[WorkCentre] += self.procTime[WorkCentre]
#If converted load
if GVar.CorrectedAggregateLoad or GVar.LUMSOR:
GVar.processedLoadCorr[WorkCentre] += self.procTime[WorkCentre]/(self.routeingSequence.index(WorkCentre)+1)
#If cumulative load following Bertrand
if GVar.BackwardFiniteLoadingConsiderBacklog or GVar.BertrandApproach\
239
or GVar.ForwardFiniteLoadingConsiderBacklog or GVar.BechteBertrandCumLoad:
GVar.plannedLoad[WorkCentre][self.TimeBucket[WorkCentre]] -=self.procTime[WorkCentre]
#-----Data Collection Point
recordGrossThroughputTime.observe(now()-DataJobEntryTime)
recordThroughputTime.observe(now()-DataJobReleaseTime)
recordLateness.observe(now()-self.DueDate)
if now()-self.DueDate > 0:
MeanTardiness = now()-self.DueDate
GVar.JobTardy += 1
else: MeanTardiness = 0
recordMeanTardiness.observe(MeanTardiness)
recordDueDate.observe(self.DueDate-DataJobEntryTime)
#This class controls the simulation status
class SimulationStatusControl(Process):
def control(self):
while True:
yield hold, self, 1000
print now(), 'Time Units passed'
if now() >= GVar.WarmUpPeriod+GVar.BatchTime*GVar.NumberOfBatches:
break
#This class controls the results collection
class ResultsCollection(Process):
def collect(self):
GrossThroughputTime_mean = []
ThroughputTime_mean = []
Lateness_mean = []
DueDate_mean = []
PercentageTardy = []
MeanTardiness = []
GrossThroughputTime_var = []
ThroughputTime_var = []
Lateness_var = []
DueDate_var = []
ReturnValueAux1 = []
ReturnValueAux2 = []
ReturnValueAux3 = []
print 'Simulation starts'
yield hold, self, GVar.WarmUpPeriod
recordGrossThroughputTime.reset()
recordThroughputTime.reset()
recordLateness.reset()
recordMeanTardiness.reset()
recordDueDate.reset()
GVar.JobTardy = 0
if GVar.RecordDistribution:
recordGrossThroughputTime.setHistogram(name='GrossThroughputTime',low=0.0,high=100.0,nbins=100)
recordThroughputTime.setHistogram(name='ThroughputTime',low=0.0,high=100.0,nbins=100)
recordLateness.setHistogram(name='Lateness',low=-50.0,high=50.0,nbins=100)
recordDueDate.setHistogram(name='DueDate',low=0.0,high=100.0,nbins=100)
print 'Warm-up period finished'
while True:
yield hold, self, GVar.BatchTime
#Results are stored
GrossThroughputTime_mean.append(recordGrossThroughputTime.mean())
ThroughputTime_mean.append(recordThroughputTime.mean())
Lateness_mean.append(recordLateness.mean())
DueDate_mean.append(recordDueDate.mean())
PercentageTardy.append(GVar.JobTardy/recordLateness.count())
MeanTardiness.append(recordMeanTardiness.mean())
GrossThroughputTime_var.append(recordGrossThroughputTime.var())
ThroughputTime_var.append(recordThroughputTime.var())
Lateness_var.append(recordLateness.var())
DueDate_var.append(recordDueDate.var())
#Vital simulation results are given
print 'Results for this batch:'
print 'Gross throughput time -', recordGrossThroughputTime.mean()
print 'Throughput time - ', recordThroughputTime.mean()
AverageUtilizationRate = 0
for WC in GVar.WCs:
AverageUtilizationRate += GVar.processedLoad[WC]
print 'Utilization rate over whole run - %3.2f Percent' %(AverageUtilizationRate*100/(now()*len(GVar.WCs)))
#Monitors and Tallys are reset
recordGrossThroughputTime.reset()
recordThroughputTime.reset()
recordLateness.reset()
recordMeanTardiness.reset()
C. Simulation Model
recordDueDate.reset()
GVar.JobTardy = 0
#At the end of the run results are stored
if now() >= GVar.WarmUpPeriod+GVar.BatchTime*GVar.NumberOfBatches:
ReturnValueAux1.append(GrossThroughputTime_mean)
ReturnValueAux1.append(ThroughputTime_mean)
ReturnValueAux1.append(Lateness_mean)
ReturnValueAux1.append(DueDate_mean)
ReturnValueAux1.append(PercentageTardy)
ReturnValueAux1.append(MeanTardiness)
ReturnValueAux2.append(GrossThroughputTime_var)
ReturnValueAux2.append(ThroughputTime_var)
ReturnValueAux2.append(Lateness_var)
ReturnValueAux2.append(DueDate_var)
if GVar.RecordDistribution:
ReturnValueAux3.append(recordGrossThroughputTime.getHistogram())
ReturnValueAux3.append(recordThroughputTime.getHistogram())
ReturnValueAux3.append(recordLateness.getHistogram())
ReturnValueAux3.append(recordDueDate.getHistogram())
GVar.ReturnValue.append(ReturnValueAux1)
GVar.ReturnValue.append(ReturnValueAux2)
GVar.ReturnValue.append(ReturnValueAux3)
break
#---------------------------------------------------------------------------------------------------
#Creates the Events used to trigger action
released = SimEvent('Release')
WLTrigger = SimEvent('WLTrigger')
NoUrgentJob = SimEvent('NoUrgentJob')
#Creates the Monitor and Tally objects used to store the results
recordGrossThroughputTime = Tally('GrossThroughputTime')
recordThroughputTime = Tally('ThroughputTime')
recordLateness = Tally('Lateness')
recordMeanTardiness = Tally('Tardiness')
recordDueDate = Tally('DueDate')
if GVar.RecordDistribution:
recordGrossThroughputTime.setHistogram(name='GrossThroughputTime',low=0.0,high=100.0,nbins=100)
recordThroughputTime.setHistogram(name='ThroughputTime',low=0.0,high=100.0,nbins=100)
recordLateness.setHistogram(name='Lateness',low=-50.0,high=50.0,nbins=100)
recordDueDate.setHistogram(name='DueDate',low=0.0,high=100.0,nbins=100)
#The actual Model
def simulationModel():
GVar.ReturnValue = []
#The system intern variables are reset
for WC in GVar.WCs:
GVar.processedLoad[WC] = 0
GVar.processedLoadCorr[WC] = 0
GVar.releasedLoad[WC] = 0
GVar.plannedLoad[WC] = {'UntilNow' : 0}
initialize()
seed(999999)
#Creates the resources on the shop floor
GVar.ShopFloor = []
for i in range(len(GVar.WCs)):
resource = Resource(capacity=1,name=GVar.WCs[i],qType=PriorityQ)
GVar.ShopFloor.append(resource)
#Defines and activates the Source i.e. orders are created
c=Source(name='Source')
activate(c,c.generateRandomArrivalExp(GVar.meanTBA))
#Defines and activates the release control...
rc=ReleaseControl(name='ReleaseControl')
#...Corrected Aggregate Load Approach (CAP)
if GVar.CorrectedAggregateLoad:
activate(rc,rc.correctedAggregateLoadApproach(GVar.CheckPeriodCAP))
#...WCPRD
if GVar.WCPRD:
activate(rc,rc.wCPRD_base())
WCPRDTrigger = ReleaseControl('WCPRDTrigger')
activate(WCPRDTrigger,WCPRDTrigger.wCPRDTrigger())
#...LUMSOR
if GVar.LUMSOR:
activate(rc,rc.lUMSOR_PeriodicPart(GVar.CheckPeriodLUMSOR))
LUMSOR_ContinuousTrigger=ReleaseControl(name='LUMSORTrigger')
activate(LUMSOR_ContinuousTrigger,LUMSOR_ContinuousTrigger.lUMSOR_ContinuousTrigger())
241
#...SLAR
if GVar.SLAR:
activate(rc,rc.sLAR_base())
SLARTrigger=ReleaseControl('SLARTrigger')
SLARNoUrgentJob=ReleaseControl('SLARNoUrgentJob')
activate(SLARTrigger,SLARTrigger.sLARTrigger())
activate(SLARNoUrgentJob,SLARNoUrgentJob.sLARNoUrgentJob())
#Activates the status control of the simulation
SimStatusControl=SimulationStatusControl()
activate(SimStatusControl,SimStatusControl.control())
#Activates the collection of results
RCollection = ResultsCollection()
activate(RCollection,RCollection.collect())
#Starts the simulation
simulate(until=GVar.WarmUpPeriod+GVar.BatchTime*GVar.NumberOfBatches+GVar.RunOutTime)
return GVar.ReturnValue
#---------------------------------------------------------------------------------------------------
#Simulation Control
#gives the parameter or set of parameters changed each Trial
TrialParameter = [[4,4],[5,4],[6,4],[7,4],[8,4],[9,4],[10,4]]
#defines the storages for the results
SingleResults = []
Variance = []
Distribution = []
FinalResults = []
for i in range(len(TrialParameter)):
#changes the Trial parameter
GVar.NormLUMSOR = TrialParameter[i][0]
GVar.PST_k = TrialParameter[i][1]
#runs the simulation and gets the results
results = simulationModel()
SingleResults.append(results[0])
Variance.append(results[1])
Distribution.append(results[2])
FinalResults.append(GFunc().evaluateResults(results[0], results[1]))
#saves the results
File = shelve.open('MBeAandOR_k_4')
File['FinalResults'] = FinalResults
File['SingleResults'] = SingleResults
File['Variance'] = Variance
File['Distribution'] = Distribution
File.close()
print 'Finished'
C.2 Evaluation of Results
import shelve
import matplotlib.pyplot as plt
import xlwt
class GVar():
PrintResults = False
PrintFigure = False
ExportToExcel = True
#--------------------------------------------------------------------
#gets the results for print and figure
File = shelve.open('50FFL/GFS/MBeAandOR_k_4')
FinalResults = File['FinalResults']
File.close()
#prints the results
if GVar.PrintResults:
C. Simulation Model
for Trial in FinalResults:
print 'Gross ThroughputTime: ', Trial[0]
print 'ThroughputTime: ', Trial[1]
print 'Mean Lateness: ', Trial[2]
print 'Variance: of lateness', Trial[6][2]
print 'Mean DueDate: ', Trial[3]
print 'Percentage Tardy: ', Trial[4]
print 'Mean Tardiness: ', Trial[5]
#presents results in a figure
if GVar.PrintFigure:
x1 = []
y1 = []
y2 = []
for Trial in FinalResults:
x1.append(Trial[1][0])
y1.append(Trial[0][0])
y2.append(Trial[4][0])
plt.figure(1)
#gross throughput time over throughput time
plt.subplot(211)
plt.plot(x1,y1,'b-',x1,y1,'bo')
plt.axis([x1[len(x1)-1]-1,x1[0]+1,0,60])
plt.xlabel('throughput time')
plt.ylabel('gross throughput time')
#percentage tardy over throughput time
plt.subplot(212)
plt.plot(x1,y2,'b-',x1,y2,'bo')
plt.axis([x1[len(x1)-1]-1,x1[0]+1,0,1])
plt.xlabel('throughput time')
plt.ylabel('percentage tardy')
plt.show()
#exports the data to an Excel sheet
if GVar.ExportToExcel:
#gets the results
FilesToOpen = [] #determines from which files
FilesToOpen.append('50FFL/GFS/MBeAandOR_k_3')
FilesToOpen.append('50FFL/GFS/MBeAandOR_k_4')
FilesToOpen.append('50FFL/GFS/MBeAandOR_k_5')
FinalResults = [] #stores the final results
for FileName in FilesToOpen:
File = shelve.open(FileName)
FinalResults.append(File['FinalResults'])
File.close()
#creates a workbook
wb = xlwt.Workbook()
ws = wb.add_sheet('Bechte')
#exports the data
i = 0
for SimulationFile in FinalResults:
i +=1
for Trial in SimulationFile:
ws.write(i,0, Trial[1][0]) #throughput time
ws.write(i,1, Trial[0][0]) #gross throughput time
ws.write(i,2, Trial[3][0]) #set due date
ws.write(i,3, Trial[2][0]) #mean lateness
ws.write(i,4, Trial[6][2]) #variance of lateness
ws.write(i,5, Trial[4][0]) #percentage tardy
ws.write(i,6, Trial[5][0]) #mean tardiness
ws.write(i,7, Trial[6][1]) #variance of throughput time
ws.write(i,8, Trial[6][0]) #variance of gross throughput time
ws.write(i,9, Trial[6][3]) #variance of due date
i +=1
wb.save('Results.xls')
243

D. References
D References
Adam, N., and Surkis, J., 1977, A Comparison of Capacity Planning Techniques in a Job Shop
Control System, Management Science, 23, 9, 1011 - 1015.
Adam, N. R., Bertrand, J. W. M., and Surkis, J., 1987. Priority assignment procedures in multi-
level assembly job shops, IIE Transactions, 19, 3, 317 - 328.
Adam, N. R., Bertrand, J. W. M., Morehead, D. C., and Surkis, J., 1993, Due date assignment pro-
cedures with dynamically updated coe�cients for multi level assembly jobs, European Journal
of Operational Research, 68, 1, 212 - 227.
Ahmed, I., and Fisher, W.W., 1992, Due date assignment job order release and sequencing inter-
action in job-shop scheduling, Decision Science, 23, 633 - 647.
Allahverdi, A., Ng, C.T., Cheng, T.C.E., Kovalyov, M.Y., 2008, A survey of scheduling problems
with setup times or costs, European Journal of Operational Research, 187, 985 - 1032.
Allahverdi, A., Gupta, J.N.D., Aldowaisan, T., 1999, A review of scheduling research involving
setup considerations, OMEGA, 27, 219 - 239.
Artigues, C., and Roubellat, F., 2001, A Petri net model and a general method for on and o�-
line multi-resource shop �oor scheduling with setup times, International Journal of Production
Economics, 74, 63 - 75.
Baker, K.R., 1984, The e�ects of input control in a simple scheduling model, Journal of Operations
Management, 4, 2, 99 - 112.
Barthelemy, J.P., Bisdor�, R., and Coppin, G., 2002, Human centred processes and decision
support systems, European Journal of Operational Research, 136, 233 - 252.
Bechte, W., 1980, Steuerung der Durchlaufzeit durch belastungsorientierte Auftragsfreigabe bei
Werkstattfertigung, Dissertation, University of Hannover, Hannover, Germany.
Bechte, W., 1982, Controlling manufacturing lead time and work-in-process inventory by means
of load-oriented order release, American Production and Control Inventory Society, Conference
Proceedings, 67 - 71.
Bechte, W., 1988, Theory and practise of load-oriented manufacturing control, International Jour-
nal of Production Research, 26, 3, 375 - 395.
Bechte, W., 1994, Load-oriented manufacturing control just-in-time production for job shops,
Production Planning and Control, 5, 3, 292 - 307.
Bergamaschi, D., Cigolini, R., Perona, M., and Portioli, A., 1997, Order review and release strate-
gies in a job shop environment: A review and a classi�cation, International Journal of Produc-
tion Research, 35, 2, 399 - 420.
Bertrand, J.W.M, 1983a, The use of workload information to control job lateness in controlled
and uncontrolled release production systems, Journal of Operations Management, 3, 2, 79 - 92.
245
Bertrand, J.W.M, 1983b, The e�ect of workload dependent due-dates on job-shop performance,
Management Science, 29, 7, 799 - 816.
Bertrand, J.W.M., and Wortmann, J.C., 1981, Production control and information systems for
component - manufacturing shops, Elsevier Scienti�c Publishing Company, Amsterdam.
Bertrand, J.W.M., and Van Ooijen, H.P.G., 1996, Integrating material coordination and capac-
ity load smoothing in multi-product multi-phase production systems, International Journal of
Production Economics, 46- 47, 1 - 12.
Bertrand, J.W.M., and Fransoo, J.C., 2002, Operations management research methodologies using
quantitative modelling, International Journal of Operations and Production Management, 22,
2, 241 - 264.
Bertrand, J.W.M., and Van Ooijen, H.P.G., 2002, Workload based order release and productivity:
A missing link, Production Planning and Control, 13, 7, 665 - 678.
Bertrand, J.W.M., and Van de Wakker, A.M., 2002, An investigation of order release and �ow
time allowance policies for assembly shops, Production Planning and Control, 13, 7, 639 - 648.
Bevan, N., 1995, Human - computer interaction standards, Proceedings of the 6th International
Conference on Human-Computer Interaction, Yokohama, Japan, 885 - 890.
Bobrowski, P.M., 1989, Implementing a loading heuristic in a discrete release job shop, Interna-
tional Journal of Production Research, 27, 11, 1935 - 1948.
Bobrowski, P.M., and Park, P. S., 1989, Work release strategies in a dual resource constrained job
shop, Omega, 17, 2, 177 - 188.
Borgatti, S.P., Everett, M.G., and Freeman, L.C., 2002, Ucinet 6 for Windows, Harvard, Analytic
Technologies.
Breithaupt, J.W., Land, M. J., and Nyhuis, P., 2002, The workload control concept: Theory and
practical extensions of load oriented order release, Production Planning and Control, 13, 7, 625
- 638.
Calisir, F., and Calisir, F., 2004, The relation of interface usability characteristics, perceived
usefulness, and perceived ease of use to end-user satisfaction with enterprise resource planning
(ERP) systems, Computers in Human Behaviour, 20, 505 - 515.
Cheng, T.C.E., and Gupta, M.C., 1989, Survey of scheduling research involving due date determi-
nation decisions, European Journal of Operational Research, 38, 156 - 166.
Cheung, W., and Zhou, H., 2001, Using genetic algorithms and heuristics for job shop scheduling
with sequence-dependent setup times, Annals of Operations Research, 107, 65 - 81.
Choi, I.C., and Choi, D.S., 2002, A local search algorithm for job shop scheduling problems with
alternative operations and sequence-dependent setups, Computers and Industrial Engineering,
42, 43 - 58.
D. References
Cigolini, R., Perona, M., and Portioli, A., 1998, Comparison of Order Review and Release tech-
niques in a dynamic and uncertain job shop environment, International Journal of Production
Research, 36, 11, 2931 - 2951.
Cigolini, R., and Portioli-Staudacher, A., 2002, An experimental investigation on workload limiting
methods with ORR policies in a job shop environment, Production Planning and Control, 13,
7, 602- 613.
Corti, D., Pozzetti, A., and Zorzini, M., 2006, A capacity-driven approach to establish reliable
due dates in a MTO environment, International Journal of Production Economics, 104, 536 -
554.
Davis, J.P., and Eisenhardt, K.M., 2007, Developing theory through simulation methods, Academy
of Management Review, 32, 2, 480-499.
Duenyas, I., and Hopp, W.J., 1995, Quoting Customer Lead Times, Management Science, 41, 1,
43 - 57.
Eades, P., 1984, A heuristic for graph drawing, Congressus Numerantium, 42, 149-160.
Eilon, S., and Chowdhury, I.G., 1976, Due Dates in Job Shop Scheduling, International journal
of Production Research, 14, 223 - 237.
Enns, S.T., 1995a, A dynamic forecasting model for job shop �owtime prediction and tardiness
control, International Journal of Production Research, 33, 5, 1295 - 1312.
Enns, S.T., 1995b, An integrated system for controlling shop loading and work �ows, International
Journal of Production Research, 33, 10, 2801 - 2820.
Enns, S.T., 2000, Evaluating shop �oor input control using rapid modelling, International Journal
of Production Economics, 63, 229-241.
Enns, S.T., and Prongue Costa, M., 2002, The e�ectiveness of input control based on aggregate
versus bottleneck workloads, Production Planning and Control, 13, 7, 614 - 624.
Fandel, G., Francois, P., and Gubitz, J. M., 1998, PPS- und integrierte betriebliche Softwaresys-
teme Grundlagen, Methoden, Marktanalyse, Springer Verlag, Berlin, Heidelberg, New York.
Fernandes, N.O., and Carmo-Silva, S., 2010, Order release in a workload controlled �ow-shop with
sequence-dependent set-up times, International Journal of Production Research, in press.
Flynn, B.B., 1987, Repetitive lots: the use of a sequence-dependent set-up time scheduling proce-
dure in group technology and traditional shops, Journal of Operations Management, 7, 1-2, 203
- 216.
Fowler, J.W., Hogg, G.L., and Mason, S.J., 2002, Workload control in the semiconductor industry,
Production Planning and Control, 13, 7, 568 - 578.
Fransoo, J.C., and Wiers, V.C.S., 2006, Action variety of planners: Cognitive load and requisite
variety, Journal of Operations Management, 24, 813 - 821.
247

Fredendall, L., and Melnyk, S.A., 1995, Assessing the impact of reducing demand variance through
improved planning on the performance of a dual resource constrained job shop, International
Journal of Production Research, 33, 6, 1521 - 1534.
Fredendall, L.D., Melnyk, S.A., and Ragatz, G., 1996, Information and scheduling in a dual
resource constrained job shop, International Journal of Production Research, 34, 2783 - 2802.
Fredendall, L.D., Ojha, D., and Patterson, J.W., 2010, Concerning the theory of workload control,
European Journal of Operational Research, 201, 1, 99 - 111.
Fry, T.D., and Smith, A.E., 1987, A procedure for implementing input/output control: A case
study, Production and Inventory Management Journal, 28, 4, 50 - 52.
Gaalman, G., and Perona, M., 2002, Editorial Workload control in job shops: an introduction to
the special issue, Production Planning and Control, 13, 7, 565-567.
Gelders, L.F., and Van Wassenhove, L.N., 1981, Production planning: A review, European Journal
of Operational Research, 7, 2, 101 - 110.
Glassey, C.R., and Resende, M.G., 1988, Closed-loop job release control for VLSI circuit manufac-
turing, IEEE Transactions on Semiconductor Manufacturing, 1, 36 - 46.
Glover, F., Kelly, J.P., and Laguna, M., 1996, New advances and applications of combining simu-
lation and optimisation, Proceeding of the 1996 Winter Simulation Conference, 144-152.
Goldratt, E.M. and Cox, J., 1984, The Goal: Excellence in Manufacturing, North River Press:
New York.
Haskose, A., Kingsman, B.G., and Worthington, D., 2002, Modelling �ow and jobbing shops as a
queuing network for workload control, International Journal of Production Economics, 78, 271
- 285.
Haskose, A., Kingsman, B.G., and Worthington, D., 2004, Performance analysis of make-to-order
manufacturing systems under di�erent workload control regimes, International Journal of Pro-
duction Economics, 90, 169-186.
Hendry, L.C., 1989, A decision support system to manage delivery and manufacturing lead times
in make to order companies, PhD Thesis, Lancaster University, Lancaster, UK.
Hendry, L.C., and Kingsman B.G., 1989, Production planning systems and their applicability to
make-to-order companies, European Journal of Operational Research, 40, 1 - 15.
Hendry, L.C., and Kingsman, B.G., 1991a, A decision support system for job release in make to
order companies, International Journal of Operations and Production Management, 11, 6 - 16.
Hendry, L.C., and Kingsman, B.G., 1991b, Job Release: Part of a hierarchical system to manage
manufacturing lead times in make-to-order companies, Journal of the Operational Research
Society, 42, 10, 871 - 883.
D. References
Hendry, L.C., and Kingsman, B.G., 1993, Customer Enquiry Management: Part of a hierarchical
system to control lead times in make-to-order companies, Journal of the Operational Research
Society, 44, 1, 61 - 70.
Hendry, L.C., Elings, P., and Pegg, D., 1993, Production planning for an artists studio - A case
study, European Journal of Operational Research, 64, 12 - 20.
Hendry, L.C., and Wong, S.K., 1994, Alternative order release mechanisms: a comparison by
simulation, International Journal of Production Research, 32, 12, 2827 - 2842.
Hendry, L.C., Kingsman, B.G., and Cheung, P., 1998, The e�ect of workload control (WLC) on
performance in make-to-order companies, Journal of Operations Management, 16, 63 - 75.
Hendry, L.C., Land, M.J., Stevenson, M., and Gaalman, G., 2008, Investigating implementation
issues for workload control (WLC): A comparative case study analysis, International Journal
of Production Economics, 112, 452 - 469.
Henrich, P., Land, M.J., and Gaalman, G., 2004a, Exploring applicability of the workload control
concept, International Journal of Production Economics, 90, 187-198.
Henrich, P., Land, M.J., Gaalman, G., and Van der Zee, D-J., 2004b, Reducing feedback require-
ments of workload control, International Journal of Production Research, 42, 24, 5235 - 5252.
Henrich, P., Land, M.J., and Gaalman, G., 2006, Grouping machines for e�ective workload control,
International Journal of Production Economics, 104, 1, 125-142.
Henrich, P., Land, M.J., and Gaalman, G., 2007, Semi-interchangeable machines: implications for
workload control, Production Planning and Control, 18, 2, 91 - 104.
Higgins, P.G., 1996, Interaction in hybrid intelligent scheduling, International Journal of Human
Factors In Manufacturing, 6, 3, 185 - 203.
Hopp, W.J., and Spearman, M.L., 2004, To pull or not to pull: What is the question?, Manufac-
turing and Service Operations Management, 6, 2, 133 - 148.
Hopp, W.J., and Sturgis, M.L.R., 2000, Quoting manufacturing due dates subject to a service
level constraint, IIE Transactions, 32, 771 - 784.
Huang, Y., Stevenson, M., and Hendry, L.C., 2008, Organizational embedding of a workload
control concept: An action research project, 15th European Operations Management Association
(EurOMA) Conference, Conference Proceedings.
Igel, M., 1981, Experience with job shop planning, International Journal of Production Research,
19, 2, 153- 164.
Johannsen, G., 1997, Conceptual design of multi-human machine interfaces, Control Engineering
Practice, 5, 3, 349 - 361.
Johannsen, G., 1995, Knowledge-based design of human-machine interfaces, Control Engineering
Practice, 3, 2, 267 - 273.
249
Kanet, J.J., 1988, Load-limited order release in job shop scheduling systems, Journal of Operations
Management, 7, 3, 44 - 58.
Kanet, J.J., and Hayya, J.C., 1982, Priority dispatching with operation due dates in a job shop,
Journal of Operations Management, 2, 3, 167 - 175.
Karmarkar, U.S., 1989, Capacity loading and release planning with work- in-progress (WIP) and
lead times, Journal of Manufacturing and Operations Management, 2, 105 - 123.
Karni, R., 1981, Capacity requirements planning - optimal work station capacities, International
Journal of Production Research, 19, 5, 595-611.
Karni, R., 1982, Capacity requirements planning: a systematization, International Journal of
Production Research, 20, 6, 715-739.
Kim, S.C., and Bobrowski, P.M., 1997, Scheduling jobs with uncertain setup times and sequence
dependency, Omega, 25, 4, 437 - 447.
Kim, S.J., and Bobrowski, P.M., 1995, Evaluating order release mechanisms in a job shop with
sequence-dependent set-up times, Production and Operations Management, 4, 2, 163 - 180.
Kim, S.J., and Bobrowski, P.M., 1994, Impact of sequence dependent set-up times on job shop
scheduling performance, International Journal of Production Research, 32, 1503 - 1520.
Kingsman, B.G., 2000, Modelling input-output workload control for dynamic capacity planning
in production planning systems, International Journal of Production Economics, 68, 1, 73 - 93.
Kingsman, B.G., Tatsiopoulos, I.P., and Hendry, L.C., 1989, A structural methodology for man-
aging manufacturing lead times in make-to-order companies, European Journal of Operational
Research, 40, 196 - 209.
Kingsman, B.G., Worden, L., Hendry, L.C., Mercer, A., Wilson, E., 1993, Integrating market-
ing and production planning in make-to-order companies, International Journal of Production
Economics, 30 - 31, 53 - 66.
Kingsman, B.G., Hendry, L.C., Mercer, A., and De Souza, A., 1996, Responding to customer
enquiries in make-to-order companies: Problems and solutions, International Journal of Pro-
duction Economics, 46 - 47, 219 - 231.
Kingsman, B.G., and Mercer, A., 1997, Strike rat matrices for integrating marketing and produc-
tion during the tendering process in Make-to-Order subcontractors, International Transactions
in Operational Research, 4, 1, 251 - 257.
Kingsman, B.G., and Hendry, L.C., 2002, The relative contributions of input and output controls
on the performance of a workload control system in Make-To-Order companies, Production
Planning and Control, 13, 7, 579 - 590.
Laguna, M., 1997, Optimising complex systems with OptQuest, Research Report, University of
Colorado.
D. References
Land, M.J., 2004, Workload control in job shops: Grasping the tap, PhD Thesis, University of
Groningen, The Netherlands, Labyrint Publications, Ridderkerk, The Netherlands.
Land, M.J., 2006, Parameters and sensitivity in workload control, International Journal of Pro-
duction Economics, 104, 2, 625 - 638.
Land, M.J., and Gaalman, G.J.C, 1996a, Workload control concepts in job shops: A critical
assessment, International Journal of Production Economics, 46 - 47, 535 - 538.
Land, M.J., and Gaalman, G., 1996b, Towards simple and robust workload norms, Proceedings of
the workshop production planning and control, Mons, Belgium, 66 - 96.
Land, M.J., and Gaalman, G.J.C., 1998, The performance of workload control concepts in job
shops: Improving the release method, International Journal of Production Economics, 56 - 57,
347 - 364.
Land, M.J., and Gaalman, G.J.C., 2009, Production planning and control in SMEs: Time for
change, Production Planning and Control, 20, 7, 548 - 558.
Lean Lexicon, 2008, Lean lexicon: A graphical glossary for lean thinkers, 4th Edition, Eds. March-
winski, C., Shook, J., and Schroeder, A., Cambridge, MA: The Lean Enterprise Institute.
Lankford, R., 1980, Input/output control: making it work, American Production and Control
Inventory Society 1980, Conference Proceedings, 419 - 420.
Lawrence, S.R. and Buss, A.H., 1994, Shifting production bottlenecks: causes, cures, and conun-
drums, Production and Operations Management, 3, 21 - 37.
Leydesdor�, L., 1987, Various methods for the mapping of science, Scientometrics, 11, 5 - 6, 295
- 324.
Leydesdor�, L., 1998, Theories of citation?, Scientometrics, 43, 1, 5 - 25.
Leydesdor�, L., and Vaughan, L., 2006, Co-occurrence matrices and their applications in infor-
mation science: extending ACA to the web environment, Journal of the American Society for
Information Science and Technology, 57, 1616 - 1628.
Lin, H.X., Choong, Y., and Salvendy, G, 1997, A proposed index of usability: a method for compar-
ing the relative usability of di�erent software systems, Behaviour and Information Technology,
16, 4, 267 - 277.
Lingayat, S., Mittenthal, J., and O'Keefe, R., 1995, An order release mechanism for a �exible �ow
system, International Journal of Production Research, 33, 5, 1241 - 1256.
Lu, H. L, Huang, G. Q. and, Yang, H. D., 2010, Integrating order review/release and dispatching
rules for assembly job shop scheduling using a simulation approach, International Journal of
Production Research, DOI: 10.1080/00207540903524490.
Malhotra, M.K., Jensen, J.B., and Philipoom, P.R., 1994, Management of vital customer priorities
in job shop manufacturing environments, Decision Sciences, 25, 5-6, 711 - 733.
251
Marcus, A., 1992, Graphic design for electronic documents and user interfaces, ACM Press, ISBN
0-201-54364-8.
Mather, H., and Plossl, G., 1978, Priority �xation versus throughput planning, Production and
Inventory Management Journal, 19, 27-51.
Maxwell, W. L., and Mehra, M., 1968, Multiple-Factor rules for sequencing with assembly con-
straints, Naval Research Logistics Quarterly, 15, 241 - 254.
McKay, K.N., and Buzacott, J.A., 2000, The application of computerized production control
systems in job shop environments, Computers in Industry, 42, 79 - 97.
McKay, K.N., and Wiers, V.C.S., 2003, Integrated decision support for planning, scheduling, and
dispatching tasks in a focused industry, Computers in Industry, 50, 5 - 14.
Melnyk, S.A., and Ragatz, G.L., 1988, Order review/release and its impact on the shop �oor,
Production and Inventory Management Journal, 29, 13 - 17.
Melnyk, S.A., and Ragatz, G.L., 1989, Order review/release: research issues and perspectives,
International Journal of Production Research, 27, 7, 1081 - 1096.
Melnyk, S.A., Ragatz, G.L., and Fredendall, L., 1991, Load smoothing by the planning and order
review/release systems: A simulation experiment, Journal of Operations Management, 10, 4,
512- 523.
Melnyk, S.A., Denzler, D.R., and Fredendall, L., 1992, Variance control vs. dispatching e�ciency,
Production and Inventory Management, 33, 6 - 13.
Melnyk, S. A., Denzler, D. R., Magnan, G. L., and Fredendall, L., 1994a, An experimental model
for investigating the sensitivity of job shop performance to job release time distribution param-
eters, Production and Operations Management, 3, 64 - 74.
Melnyk, S. A., Tan, K. C., Denzler, D. R., and Fredendall L., 1994b, Evaluating variance control,
order review/release and dispatching: a regression analysis, International Journal of Production
Research, 32, 5, 1045 - 1061.
Missbauer, H., 1997, Order release and sequence-dependent set-up times, International Journal
of Production Economics, 49, 131 - 143.
Missbauer, H., 2002a, Aggregate order release planning for time-varying demand, International
Journal of Production Research, 40, 3, 699-718.
Missbauer, H, 2002b, Lot sizing in workload control systems, Production Planning and Control,
13, 7, 649-664
Missbauer, H., 2009, Models of the transient behaviour of production units to optimize the aggre-
gate material �ow, International Journal of Production Economics, doi:10.1016/j.ijpe.2008.11.014.
Moreira, M.R.A., and Alves, R.A.F.S., 2009, A methodology for planning and controlling work-
load in a job-shop: a four-way decision-making problem, International Journal of Production
Research, 47, 10, 2805 - 2821.
D. References
Muda, M.S. and Hendry, L.C., 2003, The SHEN model for MTO SME's: a performance improve-
ment tool, International Journal of Operations and Production Management, 23, 470-486.
Nyhuis, P. and Wiendahl, H. P., 1999, Logistische Kennlinien: Grundlagen, Werkzeuge und An-
wendungen, Springer Verlag, Berlin.
Oborski, P., 2004, Man-machine interactions in advanced manufacturing systems, International
Journal of Advanced Manufacturing Technology, 23, 227 - 232.
O'Grady, P.J, and Azoza, M.A., 1987, An adaptive approach to shop loading, Omega, 15, 121 -
128.
Onur, L., and Fabrycky, W.J., 1987, An input/output control system for the dynamic job shop,
IIE Transaction, 19, March, 88 - 97.
Oosterman, B., Land, M.J., and Gaalman, G., 2000, The in�uence of shop characteristics on
workload control, International Journal of Production Economics, 68, 1, 107 - 119.
Park, C., Song, J., Kim, J. and Kim, I., 1999, Delivery date decision support system for the
large scale make to order manufacturing companies: A Korean electric motor company case,
Production Planning and Control, 10, 6, 585 - 597.
Park, S., and Lim, C.H., 1999, A structured methodology for comparative evaluation of user
interface designs using usability criteria and measures, International Journal of Industrial Er-
gonomics, 23, 379 - 389.
Park, P.S., and Bobrowski, P.M., 1989, Job release and labour �exibility in a dual resource con-
straint job shop, Journal of Operations Management,8, 3, 230 - 249.
Park, P.S., and Salegna, G.J., 1995, Load smoothing with feedback in a bottleneck job shop,
International Journal of Production Research, 33, 6, 1549 - 1568.
Perona, M., and Portioli, A., 1996, An enhanced loading model for the probabilistic workload
control under workload imbalance, Production Planning and Control, 7, 1, 68 - 78.
Perona, M., and Portioli, A., 1998, The impact of parameter setting in load oriented manufacturing
control, International Journal of Production Economics, 55, 133 - 142.
Perona, M., and Miragliotta, G., 2000, Workload control: A comparison of theoretical and practical
issues through a survey in �eld, 11th International Working Seminar on Production Economics,
Conference Proceedings, 1 - 14.
Philipoom, P.R., and Fry, T.D., 1992, Capacity-based order review/release strategies to improve
manufacturing performance, International Journal of Production Research, 30, 11, 2559 - 2572.
Philipoom, P.R., Malhotra, M.K., and Jensen, J.B., 1993, An evaluation of capacity sensitive
order review and release procedures in job shops, Decision Sciences, 24, 6, 1109 - 1133.
Philipoom, P.R., and Fry, T.D., 1999, Order review/release in the absence of adherence to formal
scheduling policies, Journal of Operations Management, 17, 3, 327 - 342.
253
Pilkington, A., and Meredith, J., 2009, The evolution of the intellectual structure of operations
management 1980 - 2006: A citation/co-citation analysis, Journal of Operations Management,
27, 185 - 202.
Plossl, G. W., and Wight, O.W., 1971, Capacity planning and control, Working paper presented
at the APICS International Conference in St.Louis, Missouri.
Portioli, A., 2002, General bucket: a new release procedure for workload control, International
Working Seminar on Production Economics, Pre-Prints, 2, 305-406.
Qi, C., Sivakumar, A.I., and Gershwin S.B., 2009, An e�cient new job release control methodology,
International Journal of Production Research, 47, 3, 703 - 731.
Ragatz, G.L., and Mabert, V.A., 1984a, A Simulation Analysis of Due Date Assignment Rules,
Journal of Operations Management, 5, 1, 27 - 39.
Ragatz, G.L., and Mabert, V.A., 1984b, A framework for the study of due date management in
job shops, International Journal of Production Research, 22, 685 - 695.
Ragatz, G. L., and Mabert, V. A., 1988, An evaluation of order release mechanisms in a job shop
environment, Decision Sciences, 19, 167 - 189.
Remus, W., 1986, Graduate students as surrogates for managers in experiments on business deci-
sion making, Journal of Business Research, 14, 19 - 25.
Riezebos, J., Korte, G.J., and Land, M.J., 2003, Improving a practical DBR bu�ering approach
using workload control, International Journal of Production Research, 41, 4, 699-712.
Roderick, L.M., Phillips, D.T, and Hogg G.L., 1992, A comparison of order release strategies in
production control systems, International Journal of Production Research, 30, 3, 611 - 626.
Sabuncuoglu, I., and Karapinar, H.Y., 1999, Analysis of order review/release problems in produc-
tion systems, International Journal of Production Economics, 62, 259 - 279.
Sabuncuoglu, I., and Karapinar, H.Y., 2000, A load-based and due-date-oriented approach to
order review/release in job shops, Decision Sciences, 31, 2, 413-447.
Salegna, G., 1996, Integrating the planning and scheduling systems in a job shop, Production and
Inventory Management Journal, 4, 1 - 6.
Salegna, G.J., and Park, P.J., 1996, Workload smoothing in a bottleneck job shop, International
Journal of Operations and Production Management, 16, 1, 91 - 120.
Sculli, D., 1980, Priority dispatching rules in job shops with assembly operations and random
delays, Omega, 8, 2, 227 - 234.
Shimoyashiro, S., Isoda, K., and Awane, H., 1984, Input scheduling and load balance control for
a job shop, International Journal of Production Research, 22, 4, 597 - 607.
Siegel, G. B., 1971, An investigation of job shop scheduling for jobs with assembly constraints,
Unpublished dissertation (PhD), Cornell University.
D. References
Silva, C., and Magalhaes, J.M., 2003, Production planning in a make to order environment: A
case of a mould manufacturer, EurOMA Conference Proceedings, 2, 729 - 738.
Silva, C., Roque, L., and Almeida, A., 2006, MAPP - A web-based decision support system for
the mould industry, Decision Support Systems, 42, 2, 999 - 1014.
Smith, C.H., Minor, E.D., and Wen, H.J., 1995, Regression-based due date assignment rules for
improved assembly shop performance, International Journal of Production Research, 33, 9, 2375
- 2385.
Soepenberg, G.D., Land, M., and Gaalman, G., 2008, The order progress diagram: A supportive
tool for diagnosing delivery reliability performance in make-to-order companies, International
Journal of Production Economics, 112, 495-503.
Sousa, R., and Voss, C.A., 2008, Contingency research in operations management practices, Jour-
nal of Operations Management, 26, 697 - 713.
Spearman, M.L., Hopp, W.J. and Woodru�, D.L., 1989, A hierarchical control architecture for
CONWIP production systems, Journal of Manufacturing and Operations Management, 2, 147-
171.
Spearman, M.L., and Zhang, R.Q., 1999, Optimal Lead Time Policies, Management Science, 45,
2, 290 - 295.
Stalk, G, and Hout, T.M., 1990, Competing Against Time: How Time Based Competition is
Reshaping Global Markets, The Free Press, NY.
Stevenson, M., 2006a, Re�ning a workload control (WLC) concept: A case study, International
Journal of Production Research, 44, 4, 767 - 790.
Stevenson, M., 2006b, Bridging the gap: Re�ning a workload control concept for practical imple-
mentation, Ph.D Thesis, Lancaster University, UK.
Stevenson, M., Hendry, L.C., and Kingsman, B.G., 2005, A review of production planning and
control: The applicability of key concepts to the make to order industry, International Journal
of Production Research, 43, 5, 869 - 898.
Stevenson, M., and Hendry, L.C., 2006, Aggregate load oriented workload control: A review and
a reclassi�cation of a key approach, International Journal of Production Economics, 104, 676 -
693.
Stevenson, M., and Hendry, L.C., 2007a, Flexibility and lean manufacturing in customised b2B
supply chains, Control, 33, 1, 16 - 20.
Stevenson, M., and Hendry, L.C., 2007b, Improving supply chain integration using a workload
control concept and web-functionality, Production Planning and Control, 18, 2, 142 - 155.
Stevenson, M., and Silva, C., 2008, Theoretical development of a workload control methodology:
Evidence from two case studies, International Journal of Production Research, 46, 11, 3107 -
3131.
255
Stevenson, M., Huang, Y., and Hendry, L.C., 2009, The development and application of an interac-
tive end-user training tool: part of an implementation strategy for workload control, Production
Planning and Control, 20, 7, 622 - 635.
Suri, R., 1999, Quick Response Manufacturing: A Company Wide Approach to Reducing Lead
Times, Productivity Press, Cambridge, MA.
Szajna, B., and Scamell, R.W., 1993, The e�ects of information system user expectations on their
performance and perceptions, MIS Quarterly, 17, 4, 493 - 516.
Tatsiopoulos, I.P., 1983, A microcomputer-based interactive system for managing production and
marketing in small component manufacturing �rms using a hierarchical backlog control and lead
time management technology, PhD Thesis, Lancaster University, Lancaster, UK.
Tatsiopoulos, I.P., 1993, Simpli�ed production management software for the small manufacturing
�rm, Production Planning and Control, 4, 17 - 26.
Tatsiopoulos, I.P., and Kingsman, B.G., 1983, Lead time management, European Journal of Op-
erational Research, 14, 351 - 358.
Tenhiälä, A., 2010, Contingency theory of capacity planning: The link between process types and
planning methods, Journal of Operations Management, doi:101016/j.jom.2010.05.003.
Thürer, M., Silva, C., and Stevenson, M., 2011a, Optimising Workload Norms: The in�uence of
shop �oor characteristics on setting workload norms for the workload control concept, Interna-
tional Journal of Production Research, 49, 4, 1151 - 1171.
Thürer, M., Stevenson, M., and Silva, C., 2011b, Three Decades of Workload Control Research: A
Systematic Review of the Literature, International Journal of Production Research, (in press)
Thürer, M., Silva, C., and Stevenson, M., 2010a, Workload control release mechanisms: From
practice back to theory building, International Journal of Production Research, , 48, 12, 3593 -
3617.
Thürer, M., Silva, C., and Stevenson, M., 2010b, Improving the Applicability of Workload Control
(WLC): The In�uence of Sequence Dependent Set-Up Times on the Performance of WLC in
Job Shops, EUROMA 2010.
Tractinsky, N., Katz, A.S., and Ikar, D., 2000, What is beautiful is usable, Interacting with
Computers, 13, 127 - 145.
Weeks, J.K., 1979, A Simulation Study of Predictable Due Dates, Management Science, 25, 4, 363
- 373.
Weng, M.X., 2008, Multi-agent-based workload control for make-to-order manufacturing, Interna-
tional Journal of Production Research, 46, 8, 2197 - 2213.
Wein, 1988, L.M., Scheduling semiconductor wafer fabrication, IEEE Transaction on Semiconduc-
tor Manufacturing, 1, 115-130.
D. References
Wein, L.M., 1991, Due date setting and priority sequencing in a multiclass M/G/1 queue, Man-
agement Science, 38, 7, 1018 - 1033.
Wein, L.M., and Chevalier, P.B., 1992, A broader view of the job-shop scheduling problem. Man-
agement Science, 38, 7, 1018 - 1032.
White, H.D., and Gri�th, B.C., 1981, Author co-citation: A literature measure for intellectual
structure, Journal of the American Society for Information Science, 32, 3, 163 - 171.
White, C.H., and Wilson, R.C., 1977, Sequence dependent set-up times and job sequencing, In-
ternational Journal of Production Research, 15, 2, 191 - 202.
Wiendahl, H.P., 1991, Anwendung der Belastungsorientierten Fertigungssteuerung, München, Wien:
Hanser Verlag.
Wiendahl, H.P., 1995, Load oriented manufacturing control, Springer Verlag, Berlin Heidelberg,
New York.
Wiendahl, H.P., Gläÿner, J., and Petermann, D., 1992, Application of load-oriented manufacturing
control in industry, Production Planning and Control, 3, 2, 118 - 129.
Wight, O., 1970, Input/output control: A real handle of lead time, Production and Inventory
Management, 3, 9 - 31.
Wilbrecht, J.K., and Prescott, W.B., 1969, The in�uence of setup time on job shop performance,
Management Science, 18, 4, 274 - 280.
Wisner, J. D., 1995, A review of the order release policy research, International Journal of Oper-
ations and Production Management, 15, 6, 25 - 40.
Wu, M.C., and Chen, S.Y., 1997, A multiple criteria decision-making model for justifying the
acceptance of rush orders, Production Planning and Control, 8, 8, 753 - 761.
Zäpfel, G. and Missbauer, H., 1993a, Production planning and control systems including load-
oriented order release - problems and research perspectives, International Journal of Production
Economics, 30 - 31, 107 - 122.
Zäpfel, G. and Missbauer, H., 1993b, New concepts for production planning and control, European
Journal of Operational Research, 67, 297 - 320.
257