workshops the experience of exchange rate regimes … · the experience of exchange rate regimes in...
TRANSCRIPT

No. 13
Wo r k s h o p s
Proceed i n g s o f OeNB Workshops
The Experience of Exchange Rate Regimesin Southeastern Europe
in a Historical and Comparative Perspective
Second Conference of the South-EasternEuropean Monetary History Network (SEEMHN)
April 13, 2007
S tab i l i t y and Secur i t y.
Wo
rk
sh
ops N
0. 13
√
The
Exp
erie
nce
of E
xcha
nge
Rat
e R
egim
es in
Sou
thea
ster
nE
urop
e in
a H
isto
rica
l and
Com
para
tive
Per
spec
tive

WORKSHOPS NO. 13/2008 349
Paths of Monetary Transition and Modernization:
Exchange Rate Regimes and Monetary Policy in
Southeastern Europe including Turkey from the
1990s to 20061
Stephan Barisitz2
Oesterreichische Nationalbank
After looking at basic demographic and economic characteristics of the region since communism, the paper offers an analytical overview over the development of exchange rate regimes and monetary policy frameworks in Southeastern Europe incl. Turkey since the early 1990s. The following ten countries/non-sovereign territories are analyzed here: Albania, Bosnia-Herzegovina, Bulgaria, Croatia, Kosovo, the Republic of Macedonia, Montenegro, Romania, Serbia, Turkey. Over the last two decades, the population of the entire region – except for that of Kosovo and Turkey – has shrunk. In contrast to the past, Turkey today is economically much larger than the rest of Southeastern Europe taken together. This latter area had suffered temporary but major setbacks due to economic transition and the wars of Yugoslav succession, but it is now on a robust catching-up route. Four countries (Bosnia-Herzegovina, Bulgaria, Croatia and Macedonia) feature hard pegs and nominal exchange rate anchors, four others (Albania, Romania, Serbia and Turkey) conduct loosely managed floats and formal or informal inflation targeting, two countries/territories (Kosovo and Montenegro) boast unilaterally euroized regimes. Individual countries’/territories’ economic developments in recent years (late 1990s – end-2006) and current monetary and exchange rate policies, instruments, issues and outcomes are focused on in more detail. Inflation is found to have been
1 This paper is an extension and update of an earlier study entitled “Exchange Rate
Arrangements and Monetary Policy in: Southeastern Europe and Turkey: Some Stylized Facts”, published in Focus on European Economic Integration, no. 2/2004, OeNB.
2 Foreign Research Division, Economic Analysis and Research Section, OeNB, [email protected]. The standard disclaimer applies. The author is grateful to Doris Ritzberger-Grünwald, Peter Backé and Josef Schreiner (OeNB) for valuable comments and suggestions.

PATHS OF MONETARY TRANSITION AND MODERNIZATION
350 WORKSHOPS NO. 13/2008
on a declining trend across the region until around 2003/2004, since when it has been stagnating or witnessing some up-ticks, partly under the impact of gathering credit booms. In a number of cases, low inflation performance can be put down to the stabilizing influence of the exchange rate as an external anchor. But some countries applying inflation targeting have boasted remarkable disinflation recently. Therefore, one can conclude that various monetary strategies are being quite successfully practiced across the region. Overall monetary and economic policy soundness, credibility and perseverance may be the key to success here. In recent years, prudent fiscal policies and general policy discipline, favored by IMF and EU surveillance, have assisted central banks in pursuing their goals.
1. Introduction
The following article attempts to give an analytical survey of the evolution of exchange rate regimes and monetary policy frameworks in Southeastern Europe and Turkey from the onset of transition (the early 1990s) until 2006. Given this topic and the fact that Serbia (as a subject of international law) includes the province of Kosovo (UN administered) and therefore comprises two separately managed currency areas, in the following these two political entities will be dealt with separately. Accordingly, nine countries and one non-sovereign territory are analyzed here: Albania, Bosnia and Herzegovina, Bulgaria, Croatia, Kosovo/Kosova, the Republic of Macedonia, Montenegro, Romania, Serbia, Turkey. In the following, when all ten or a lesser number of political entities of the region – including Kosovo – are dealt with, for simplicity the term “countries” will be used, although the author is of course aware that Kosovo is not (fully) sovereign.
To start with, chapter 2 provides a general long-term comparative overview (reaching back to the mid-1980s) of demographic, economic and per capita income developments in the region. chapter 3 presents a global descriptive outline of the topic (as from the early 1990s) which also sketches the institutional importance of the euro as economic anchor for these countries. Chapter 4 focuses more on the de facto role of the euro in Southeastern Europe, on euro legacy currencies circulating in and outside banking sectors (up to end-2001), the effect of the euro cash changeover (of end-2001) and on euro-denominated deposits (up to 2005). Individual countries’ economic performance and monetary and exchange rate policies, instruments, issues and outcomes since the mid-1990s up to late 2006 are dealt with in somewhat more detail in Chapter 5. Chapter 6 gives a summarizing comparison of major results of the preceding chapters and draws some overall conclusions.

PATHS OF MONETARY TRANSITION AND MODERNIZATION
WORKSHOPS NO. 13/2008 351
2. Basic Traits of the Region’s Countries/Territories
Compared to the European Union, the Southeastern European countries are economically small to miniscule players. As can be seen from tables 1 and 2, Southeastern Europe – without Turkey – comprises a territory of about 14% the size of the EU-27’s territory, its population in 2005 came to 11% of that of the EU-27 and its GDP equaled just 1.6% of the GDP of the EU-27 (converted on the basis of current exchange rates)3. The largest former socialist country of the region, Romania, commands an economic size of 0.7% of that of the EU-27. The smallest country, Montenegro, accounts for 0.015% of the EU-27’s GDP. Average per capita GDP in Southeastern Europe without Turkey comes to about 15% of the average level of the Union.
Table 1: Southeastern European Countries’ Demography and Its Development over the Last Twenty Years
Country/Territory/RegionTerritory
(km2)mid-1980s 1992 1999 2005
Albania 28700 3.02 3.36 3.37 3.14Bosnia and Herzegovina 51100 4.27 4.38 3.73 3.85Bulgaria 111000 8.96 8.47 8.19 7.74Croatia 56500 4.64 4.79 4.55 4.44Kosovo (Serbia) 10900 1.72 1.95 2.05 2.40FYR Macedonia 25700 1.99 2.17 2.02 2.04Montenegro 13800 0.59 0.62 0.60 0.63Romania 238400 23.18 22.76 22.46 21.62Serbia (without Kosovo) 77500 7.82 8.03 7.76 7.45SEE without Turkey 613600 56.19 56.53 54.73 53.30Turkey 779500 51.61 60.73 66.30 72.07SEE with Turkey 1393100 107.80 117.26 121.03 125.37Memorandum itemsEU27 4322500 466.42 474.42 482.13 491.69USA 9809160 238.74 255.61 278.23 296.41
Population (million inhabitants)
Source: National Statistics, Eurostat, Der Fischer Weltalmanach – various issues, wiiw.
Adding Turkey changes the equation quite a bit. Not only in terms of territory, but also with respect to population and economic clout does Turkey outweigh all other Southeastern European countries taken together. Turkey’s GDP per capita is somewhat higher than Southeastern Europe’s average. Including Turkey, the region’s territory comes to 32% of that of the EU-27, its population would reach
3 If purchasing power parities were used, the ratio would be more than twice as large
(Gligorov, Podkaminer et al. 2006, vi; see also Gligorov 2004, 52).

PATHS OF MONETARY TRANSITION AND MODERNIZATION
352 WORKSHOPS NO. 13/2008
26%; but again, the size of the regional economy would remain relatively modest – some 4.3% of that of the EU-27.4
Table 2: Southeastern European Countries’ Estimated GDP and per Capita Income and Dynamics over the Last Twenty Years
Country/Territory/Regionmid-1980s* 1992 1999 2005 mid-1980s* 1992 1999 2005
Albania 1.9 0.84 3.32 6.72 630 250 990 2140Bosnia and Herzegovina 9.1 2.90 4.59 7.54 2130 660 1230 1960Bulgaria 24.5 8.82 12.56 21.45 2730 1040 1530 2770Croatia 18.5 6.60 18.68 30.95 3990 1380 4110 6970Kosovo (Serbia) 2.2 0.8* 1.05* 2.16* 1280* 410* 510* 900*FYR Macedonia 3.9 1.63 3.45 4.63 1960 750 1710 2270Montenegro 1.4 0.7* 1.00* 1.64 2370* 1130* 1670* 2600Romania 40.5 19.86 33.49 79.26 1750 870 1490 3670Serbia (without Kosovo) 23.9 9.7 13.10 19.47 3050 1210 1690 2610SEE without Turkey 125.9 51.85 91.24 175.66 2240 920 1670 3300Turkey 57.1 81.05 176.88 291.12 1110 1330 2670 4040SEE with Turkey 182.3 132.90 268.12 466.78 1690 1130 2220 3720Memorandum itemsEU27 . . 8536.35 10947.71 . . 17710 22270USA 4210.05 4813.17 8177.63 9992.51 17630 18830 29390 33710
* estimate based on data in selected issues of The Stateman's Yearbook and Der Fischer Weltalmanach, estimates particularly for Kosovo are subject to substantial uncertainties1) measurement of GDP and GDP per capita on the basis of current exchange rates; estimate: mid-1980s: 1 ECU = 0.93 USD (approx. average); 1992: 1 ECU = 1.23 USD
GDP (in ECU/EUR bn)1) GDP per capita (ECU/EUR)1)
Source: National Statistics, Eurostat, The Stateman’s Yearbook, Der Fischer Weltalmanach, L’état
du monde – various issues, wiiw.
A glance at developments over the last twenty years (table 1) reveals that all countries of the region – except for Kosovo and Turkey – have featured declining populations since the early 1990s, i.e. since the beginning of transition. Even after economic growth had returned and partly accelerated in the early years of the new millennium, demography continued its downward trend. In contrast, Turkey and Kosovo witnessed strongly growing populations over the entire period since the mid-1980s. Thus, diverging demographic trends have Southeastern Europe (without Turkey) on a shrinking path and Turkey on a swiftly expanding one.
A comparison of long-term economic growth trends (table 2) yields even more accentuated results.5 Although it had also experienced repeated economic upheavals, Turkey had not witnessed the depth and pain of the transition recession all the other Southeastern European countries had to go through in the early 1990s.
4 The size would exceed 8% if purchasing power parities were taken into account. 5 Given that table 2 is based on current exchange rates, and not on purchasing power
parities, appreciation pressures that have become dominant among the currencies of the region in recent years can more easily express themselves and have an impact on GDP measurement in floating exchange rate regimes (like Romania’s and Turkey’s in 2005) than in tighter regimes. But this does not decisively alter the major picture.

PATHS OF MONETARY TRANSITION AND MODERNIZATION
WORKSHOPS NO. 13/2008 353
Turkey had also not been affected to that degree by the repercussions of the violent disintegration of former socialist Yugoslavia and the wars that this had entailed (1991–95 and 1999). While Turkey’s (estimated) GDP had been less than half of that of the rest of Southeastern Europe (taken together) in the mid-1980s, by 1999 that relationship was (almost) reversed. Around the turn of the millennium, however, most of the other countries embarked on a stormy catching up process, have since then grown faster than Turkey, and by 2005 had made up some lost ground, especially in terms of per capita income. Given Central European experiences, the catching up will probably continue in the coming years and the average per capita income of the other countries might eventually become equal to Turkey’s again. In terms of national GDP, though, given divergent demographic dynamics, the other countries of the region will probably not catch up with Turkey in the foreseeable future.
Disregarding Turkey and looking in more detail at the other countries of the region which are quite heterogeneous, it is evident that their economies had all plunged considerably between the mid-1980s and 1992, and that by 1999 no country’s national GDP – except Albania’s and Croatia’s – had yet caught up with the pre-transition level. Given the strong growth after 1999, most Southeastern European countries regained their average standard of living of the second half of the 1980s in the early years of the new millennium – about one and a half decades later. However, Bosnia and Herzegovina and Serbia had not reached their pre-transition standards of living even by 2005 and Bulgaria had only just made it that year.
While Croatia has successfully defended its status as the richest country of the Balkans, boasting a per capita income comparable to Central European levels, the star of economic recovery among the largest Southeastern European countries appears to be Romania, which almost doubled its national GDP in the two decades to 2005 (though its point of departure arguably was quite bleak). The greatest catching up performance overall is however accomplished by Albania, which more than tripled its per capita GDP in this period. Whereas the Albanians had been the poorest of the region under communism (near-total isolation from the rest of the world under the Hoxha regime), the Kosovars are the poorest today, followed by the Bosnians.
3. Outline of Exchange Rate Regimes and Monetary Policy Frameworks in the Region
The euro plays an important de jure and/or de facto6 role for the economies and economic policies of Southeastern European countries. Five of the ten analyzed countries – namely successor countries/territories to the former Socialist Federative
6 See next chapter.
PATHS OF MONETARY TRANSITION AND MODERNIZATION
354 WORKSHOPS NO. 13/2008
Republic of Yugoslavia – changed their currencies in the 1990s. Six of the ten countries have geared their monetary policy to an external anchor. This external anchor is – without exception – the euro, as shown in table 3. Two of these six (Bosnia and Herzegovina, Bulgaria) run currency boards, two (non-sovereign) territories (Montenegro, Kosovo) have adopted the euro as their legal tender. The Republic of Macedonia has pegged its currency to the euro, Croatia has conducted a tightly managed float (with the euro as reference).
Four countries (Albania, Romania, Serbia, Turkey) have practiced managed or loosely managed floats, coupled with money growth targeting, most recently (2005 and 2006) three of them have opted for inflation targeting frameworks (table 3). In early 2005, Romania switched from a reference basket for its float, in which the euro had the largest weight, to the euro as sole reference currency. In August 2005, the country opted for inflation targeting and loosened its managed float. In early 2003, Serbia abandoned its previously tightly managed float and started to pursue what was characterized as a euro-oriented real exchange rate anchor. In February 2006, Serbia further loosened its float in preparation for the introduction of informal inflation targeting through “inflation objectives” in September 2006. Turkey has also been running an inflation targeting regime since January 2006. Albania has continued to stick to money growth targets coupled with informal inflation goals.
The currencies of seven countries (Bosnia and Herzegovina, Bulgaria, Croatia, Kosovo, Montenegro, Romania as well as Turkey) are fully (or almost fully) convertible. Two other countries’ (the Republic of Macedonia’s and Serbia’s) currencies are convertible for current account transactions. The Albanian currency does not yet feature unrestricted current account convertibility (IMF 2006, 44) 7.
7 For more information on the – quite eventful – historical background of economic
developments in the countries of the Western Balkans see Barisitz 1999.

PATHS OF MONETARY TRANSITION AND MODERNIZATION
WORKSHOPS NO. 13/2008 355
Table 3: Southeastern European Countries’ and Territories’ Monetary Characteristics
Country/ territory
Currency (since);
previous
Exchange rate regime (since); previous
Convertibility Monetary policy framework (since); previous
Albania Albanian lek (ALL) Loosely managed float (early 1990s), major reference currencies: EUR (up to 1/1/1999: DEM), USD
Not yet unrestricted current account convertibility (IMF Art. XIV status)
Informal inflation targeting through money growth targeting (1998)
Bosnia and Herzegovina
Konvertibilna marka (BAM, June 1998); YUM (redenominated) and HRK (used regionally), DEM (country-wide) (until Dec. 1999); YUD (until early 1990s)
Currency board, peg to EUR (up to 1/1/1999: DEM) (formally introduced: August 1997, de facto since mid-1998); multiple currencies
Full convertibility Nominal exchange rate anchor EUR (DEM) (August 1997)
Bulgaria Bulgarian lev (BGN, redenominated July 1999)
Currency board, peg to EUR (up to 1/1/1999: to DEM) (since July 1997); managed float
Full convertibility (IMF Art. VIII acceptance Sept. 1998)
Nominal exchange rate anchor EUR (DEM) (July 1997); money growth targeting
Croatia Croatian kuna (HRK) (May 1994); Croatian dinar (transitional); YUD
Tightly managed float, reference currency: EUR (up to 1/1/1999: DEM) (since Oct. 1993)
Almost full convertibility (IMF Art. VIII acceptance May 1995)
Nominal exchange rate anchor EUR (DEM) (Oct. 1993)
Kosovo/ Kosova (Serbia)
All foreign currencies legalized for transactions, EUR (DEM) predominant, YUM used regionally (Sept. 1999); YUM, YUD
Full convertibility EUR legal tender (September 1999)
Republic of Macedonia
Macedonian denar (MKD, April 1992); YUD
De facto peg to EUR (exchange rate target, up to 1/1/1999: DEM) (since Oct. 1995); managed float
Current account convertibility (IMF Art. VIII acceptance: June 1998)
Nominal exchange rate anchor EUR (Oct. 1995); money growth targeting
Monte-negro Unilaterally euroized/EUR (November 2000); November 1999-2000 EUR (DEM) parallel currency to YUM; before that YUM, YUD
Full convertibility EUR legal tender (November 1999/2000)
Romania Romanian leu (RON, redenominated July 2005)
Loosely managed float (Aug. 2005); managed float (1991), reference currency: EUR (since early 2005); previously: reference basket: EUR (75%), USD (25%) (early 2004), EUR (60%), USD (40%) (early 2002); before that: reference currency: USD
Almost full convertibility (IMF Art. VIII acceptance: March 1998)
Inflation targeting (August 2005); Money growth targeting (early 1990s)

PATHS OF MONETARY TRANSITION AND MODERNIZATION
356 WORKSHOPS NO. 13/2008
Table 3 continued: Southeastern European Countries’ and Territories’ Monetary Characteristics
Country/ territory
Currency (since); previous
Exchange rate regime (since); previous
Convertibility Monetary policy framework (since); previous
Serbia (without Kosovo/ Kosova)
Serbian dinar (RSD); previously called Yugoslav dinar (YUM, redenominated January 1994; YUD)
Loosely managed float (Feb. 2006); managed float (Jan. 2003), previously tightly managed float, reference currency: EUR (Dec. 2000); peg to EUR (DEM)
Current account convertibility (IMF Art. VIII acceptance: May 2002)
Informal inflation targeting through “inflation objectives” (Sept. 2006); real exchange rate anchor (Jan. 2003), previously nominal anchor EUR (DEM) (1994)
Turkey Turkish lira (YTL, redenominated January 2005)
Loosely managed float (February 2001); crawling peg, reference basket: USD (56%), EUR (44%) (Dec. 1999); managed float (early 1998)
Full convertibility (IMF Art. VIII acceptance: March 1990)
Inflation targeting (Jan. 2006); Money growth targeting, informal inflation targeting (Feb. 2001); exchange rate anchor (USD/EUR basket); monetary targeting
Source: Author’s compilation.
Based on the above information, in the following a very rough attempt is made to discern what might be long-term regional exchange rate regime trends. In the first half of the 1990s most exchange rate arrangements corresponded to managed or loosely managed floats. A number of countries/territories (in the Western Balkans) that were either not yet independent or had just become independent (Bosnia-Herzegovina, Kosovo, Montenegro and Serbia) remained dominated by the Yugoslav dinar. From the early 1990s until the beginning of 2001 most Southeastern European countries’ currency regimes (except that of Albania) appeared to be steadily moving into the orbit of the euro.
Since early 2001 (the time of the floating of the Turkish lira) however, two diverging tendencies seem to have emerged: A number of smaller countries (the largest one being Bulgaria) are holding on to the euro as a nominal anchor (from tightly managed float to unilateral euroization). In contrast, a smaller number of mostly larger countries (incl. Romania and Turkey) have progressively opted for inflation targeting (at least of an informal kind) and have thus loosened up their currency regimes and connections to the euro and reverted to loosely managed floats. Another aspect is that in crisis situations, currency regimes tend to temporarily loosen, or in some cases, to collapse – upon which the market may establish a more realistic realignment (as happened in Albania in 1997, in Bulgaria in 1996–1997, and in Serbia in late 2000 and early 2003). Then the situation tends to stabilize again and new, often – but not always – tighter, regimes tend to be installed.

PATHS OF MONETARY TRANSITION AND MODERNIZATION
WORKSHOPS NO. 13/2008 357
4. De facto Euroization in Southeastern Europe
Southeastern European countries are among the transition countries where the levels of foreign currency held by residents are highest. Holdings of foreign exchange in the region are primarily of euros and to a smaller extent of US dollars, Swiss francs etc. In this sense one can also speak of de facto euroization (or “official” euroization) – as opposed to unilateral de jure euroization (or “inofficial” euroization), which is reality in the Republic of Montenegro, or as opposed to the de jure introduction of the euro as dominant legal tender in the Province of Kosovo, with the UN provisional administration having been the decision-making body in this case.
In the mid-1990s the Bundesbank, using various methods, estimated the amount of German mark cash held outside Germany to come to 30–40% of total German currency in circulation, corresponding to ECU (EUR) 32–45 billion (Seitz, 1995). This was often quoted as the main estimate of euro/German mark holdings abroad. Most of the money was deemed to circulate in EU neighboring regions, including Central and Southeastern Europe and the Mediterranean. In the course of the 12 months preceding the euro cash changeover at end-2001, foreign exchange bank deposits in euro legacy currencies (i.e. German mark, Austrian schilling, French franc etc.) in 20 reporting countries neighboring the EU, including Southeastern Europe and Turkey, increased by EUR 9.2 billion to EUR 41.7 billion. In order to strengthen their respective banking systems, many countries promoted euro conversion by paying into bank accounts instead of exchanging cash over the counter. And in the months following the cash changeover, banks did not generally experience large withdrawals.
The EUR 60 billion of euro banknotes shipped by banks to destinations outside the euro area from December 2001 to December 2006 provide an updated approximate indicator of the amount of euro banknotes circulating abroad. This accounts for around a tenth of the total volume of euros in circulation. To give some details on the implications and effects of the cash changeover: Turkey and Croatia led (in absolute terms) all the EU’s eastern and southern neighbors as regards euro-denominated bank accounts at end-2001. In Turkey they amounted to over EUR 12 billion, in Croatia to around EUR 8 billion. The share of euro-denominated deposits in total deposits rose in Croatia from 56% in December 2000 to 62% in December 2001, then declined again to 55% in early 2005. In Bosnia the respective share expanded from 38% to 50%, before receding to 40%; in Bulgaria the evolution was from 12% via 18% to 11% and in Turkey from 12% via 15% down to 10%. In Kosovo and Montenegro, the share was, of course, above 90% and in Serbia it was also very high (84% in mid-2004) (ECB 2003, 52; ECB 2005, 58).
This change implies that the sum of cash euros in circulation in the region decreased; on the other hand, banks benefited from the surge of euro deposits,

PATHS OF MONETARY TRANSITION AND MODERNIZATION
358 WORKSHOPS NO. 13/2008
which also bears witness to the enhanced trust the public of various countries has harbored in the banking sector. Given that the banking sectors of most Southeastern European countries are in majority ownership of financial institutions of euro area countries, it is also likely that financial links between banks of EU neighboring regions and of the euro area have further strengthened.
Outside bank accounts, on the whole about EUR 19 billion of euro legacy currencies were exchanged for euro cash. On the other hand, up to EUR 10 billion of legacy currencies may have been exchanged for other international currencies, mainly the US dollar, implying a switch from currency substitution based on the euro to currency substitution based on other international currencies. But since 2002 and given the euro’s persistent appreciation with respect to the US dollar, the common European currency seems to have gained ground and popularity in the region. According to surveys commissioned by the Oesterreichische Nationalbank in Croatia and in Central European countries since late 2002, the euro has been perceived as more stable than the American currency and the share of the euro in cash holdings by individuals has been on an upward trend over the years in most countries. This is also likely to hold for other parts of Southeastern Europe (see also Ritzberger-Grünwald, Stix 2007).
5. Individual Countries’/Territories’ Economic Developments and Current Monetary Policy Issues
5.1 Albania
Table 4: Albania: Key Macroeconomic and Monetary Policy Indicators 1995 2000 2003 2005 2006*
GDP growth (real, %) 13.3 6.5 5.8 5.5 5.0General government budget balance (% of GDP) -10.1 -9.2 -4.3 -3.6 -3.2Current account balance (% of GDP) -7.2 -7.4 -8.0 -6.6 -7.4Net FDI inflows (% of GDP) 3.6 3.9 3.0 3.0 3.1Gross foreign debt (end-year, % of GDP) 30.6 31.8 24.1 20.1 19.1Gross reserves of central bank (excl. gold, end-year, % of GDP) 9.8 16.5 17.5 16.8 16.9Repo rate (end-year, %)1) 20.5 10.8 6.5 5.0 5.5Broad money growth (M2, end-year, %) 51.8 10.4 9.2 8.4 15.1Domestic credit growth (end-year, %) -10.0 8.6 11.0 13.2 14.6CPI-inflation (end-year, %) 6.0 4.2 3.3 2.0 2.5Exchange rate ALL/EUR (annual average) 123.5 132.6 137.5 124.2 123.1Exchange rate ALL/USD (annual average) 93.0 143.7 121.9 99.9 98.1Registered unemployment rate (end-year, %) 13.9 16.8 15.0 14.7 13.8
* preliminary data or estimates1) up to 2000 refinancing rate
Source: National Statistics, Banka Shqipërisë, EBRD, IMF, wiiw.

PATHS OF MONETARY TRANSITION AND MODERNIZATION
WORKSHOPS NO. 13/2008 359
Macro-Structural Background
Albania has witnessed robust growth in recent years, although the country remains saddled with serious structural shortcomings, particularly in the area of governance, transparency, rule of law, judiciary efficiency and infrastructure. Despite some progress in reducing administrative barriers to investment and enterprise creation, the business climate remains weak, the scale of the informal economy large. While the country continues to feature relatively high current account deficits, budgetary policies have been somewhat tightened in recent years. Net FDI inflows have not been covering more than about half of the current account shortfalls. The country’s export base remains narrow and oriented toward modest value-added products. Foreign liabilities are rather low and have been on a downward trend.
Monetary Policy
The Banka Shqipërisë’s (BS) cautious monetary policy has succeeded in keeping inflation at low one digit levels in recent years. The central bank has conducted a policy of money growth targeting since the early 1990s, to which it has added informal inflation targeting in recent years. Since 2003 the BS has successfully committed to holding CPI end-year inflation within a band of 2 to 4%; most recently, price increases have been nearer to the lower end of the band (end-2006: 2.5%). In order to achieve the informal goal, money supply (M3) and interest rates have been targeted. The monetary authorities intervene by varying their net domestic assets and net international reserves and by changing repo (repurchase agreement) rates, reverse repo rates and by conducting open market operations.
Depending of the economic situation, the BS has repeatedly intervened by increasing or decreasing the repo rate. For example, during banking turbulences in 2002 and during inflationary pressures that emerged in 2006 (the latter triggered by the gathering credit boom, oil price rises and excise tax adjustments), the monetary authorities ratcheted up the key interest rate. In contrast, when the financial crisis dissipated or the lek came under substantial appreciation pressure, which threatened the country’s fragile exports, as happened in 2003, the BS took action in the opposite direction.
This points to Albania’s flexible exchange rate regime (loosely managed float), the complement to its money growth targeting strategy. The central bank buys and sells on the foreign exchange market to smooth out speculation or sudden movements (relative to the euro and the US dollar). However, as alluded to above, the exchange rate can also become a (secondary) policy objective, but only if inflation remains comfortably within the band. More recently, some currency appreciation was allowed to contribute to achieving the inflation objective. The BS intends to gradually adjust its strategy toward an explicit inflation targeting régime

PATHS OF MONETARY TRANSITION AND MODERNIZATION
360 WORKSHOPS NO. 13/2008
with the aim of enhancing transparency and credibility of its monetary policies (European Commission 2006, 30–31).
5.2. Bosnia and Herzegovina
Table 5: Bosnia and Herzegovina: Key Macroeconomic and Monetary Policy Indicators
1995 2000 2003 2005 2006*GDP growth (real, %) 20.8 5.5 3.0 5.8 6.0General government budget balance (% of GDP) -0.3 -3.1 -2.2 0.8 -0.2Current account balance (% of GDP) -10.3 -13.1 -25.0 -23.7 -12.8Net FDI inflows (% of GDP)1) 0 3.2 4.9 6.5 6.4Gross foreign debt (end-year, % of GDP) 180.0 59.2 58.1 55.3 53.9Gross reserves of central bank (excl. gold, end-year, % of GDP) 8.62) 10.5 22.7 26.6 27.8Broad money growth (M2, end-year, %) 8.5 13.9 8.4 18.2 24.7Domestic credit growth (end-year, %) 16.23) 10.0 19.8 27.6 20.6CPI-inflation (end-year, %): Federation of BiH 7.72) 4.0 0.3 4.4 6.6CPI inflation (end-year, %): Republika Srpska -17.72) 16.1 1.3 3.7 4.7Exchange rate: BAM/EUR (annual average)4) 1.965) 1.96 1.96 1.96 1.96Exchange rate: BAM/USD (annual average)4) 1.735) 2.12 1.73 1.57 1.57Registered unemployment rate (end-year, %) 38.06) 39.7 42.0 44.2 45.67)
* preliminary data or estimates1) excluding capital transfers for reconstruction2) 19963) 19984) The konvertibilna marka was formally introduced in August 1997. 5) 19976) annual average 19987) October
Source: National statistics, Centralna Bosne i Herzegovine, EBRD, IMF, wiiw.
Macro-Structural Background
Following the war of 1992–95, Bosnia and Herzegovina have received considerable, if declining, international reconstruction assistance. Despite this assistance, the country has only made limited progress in putting in place viable and competitive export-oriented capacities. The economy has continued to be based largely on raw materials and related manufacturing. Strong resource price rises may be a reason why the gradual reduction of external assistance has not been accompanied by lower economic growth in recent years. The banking sector is one of the few areas where substantial progress in structural reform has been achieved. The State’s political structure remains highly decentralized, fragile and segmented

PATHS OF MONETARY TRANSITION AND MODERNIZATION
WORKSHOPS NO. 13/2008 361
in the two ethnically-defined Entities – the Muslim-Croat Federation and the Republika Srpska as well as Brčko District.
Attempts to dismantle bureaucratic barriers and improve the business environment have contributed to rising FDI inflows in the first years of the new millennium, but foreign direct investment remains far from matching the huge and persistent current account shortfalls. On the other hand, fiscal as well as monetary policies have been prudent in recent years, in particular the currency board regime has become a stabilizing anchor for the economy. The ratio of foreign debt to GDP has been on the decline, reflecting the confluence of shrinking public debt and expanding private liabilities.
Monetary Policy
The Centralna banka Bosne i Hercegovine (CBBH) has functioned as a currency board since 1998, irrevocably fixing the exchange rate of the konvertibilna marka to the German Mark (later: euro) and backing up unlimited convertibility of the domestic currency to the reserve currency by an adequate amount of foreign exchange reserves. The latter have been on the rise in recent years and at end-2006 came to almost five import-months of goods and services. No independent monetary policy is conducted, the central bank can neither grant credits to the government, nor act as a lender of last resort to banks. Managing reserve requirements is the only important monetary policy tool currently at the disposal of the CBBH.
The latter has been quite successful in keeping inflation at low levels. In the wake of important bank privatization transactions (sales to foreign strategic investors) and in connection with the euro changeover, bank deposits soared, and loans to households more than doubled in 2002 (albeit from a low base). This pushed up imports and called for intervention by the central bank, which reformed and raised reserve requirements, thereby tightening its monetary stance. New more restrictive bank capital requirements were pre-announced taking effect at end-2003. While inflation remained subdued through 2004, swift credit expansion did not lose much momentum. Actually, the total credit volume attained a level of 48% of GDP at end-2005, which is second only to Croatia in the entire region.
Swift loan growth as well as the surge of the oil price and administered price increases appear to have impacted inflation from 2005. 2006 witnessed the introduction of VAT at the beginning of the year, which immediately nearly doubled average CPI-inflation. To stem the inflationary pressures, at end-2005 the CBBH had hiked banks’ reserve requirements from 10% to 15% of liabilities. In the following months, price increases somewhat moderated again and at end-2006 came to 6.6% in the Federation and to 4.7% in the Republika Srpska. They are expected to recede to an average of around 4% in 2007. Price level changes have tended to be on overall converging paths in the two Entities whose economic

PATHS OF MONETARY TRANSITION AND MODERNIZATION
362 WORKSHOPS NO. 13/2008
structures are quite different. This may be a sign of (slowly) increasing domestic economic integration.
5.3 Bulgaria
Table 6: Bulgaria: Key Macroeconomic and Monetary Policy Indicators 1995 2000 2003 2005 2006*
GDP growth (real, %) 2.9 5.4 4.5 6.2 6.1General government budget balance (% of GDP) -5.6 -0.5 -0.9 1.9 3.3Current account balance (% of GDP) -0.2 -5.6 -9.3 -11.5 -14.8Net FDI inflows (% of GDP) 0.7 7.9 10.4 8.4 15.9Gross foreign debt (end-year, % of GDP) 77.4 88.6 67.4 69.2 82.1Gross reserves of central bank (excl. gold, end-year, % of GDP) 9.4 27.5 31.5 33.9 37.3Base rate (end-year, %) 34.0 4.6 2.8 2.1 3.3Broad money growth (M2, end-year, %) 40.3 7.5 18.8 24.4 26.8Domestic credit growth (end-year, %) 18.0 31.0 32.4 35.1 17.1CPI-inflation (end-year, %) 32.9 11.4 5.6 6.6 6.5Exchange rate: BGN/EUR (annual average)1) 0.09 1.96 1.96 1.96 1.96Exchange rate: BGN/USD (annual average)1) 0.07 2.12 1.73 1.57 1.56Unemployment rate (labor force survey, annual average, %) . 16.9 13.7 10.1 9.0
* preliminary data or estimates1) The lev was redenominated in July 1999. All exchange rates are based on the post-July 1999 lev.
Source: National statistics, Bălgarska narodna banka, EBRD, IMF, wiiw.
Macro-Structural Background
Following a deep financial and economic crisis in 1996/97, Bulgaria has since July 1997 strictly adhered to a German mark/euro-based currency board regime. The Bulgarian economy has witnessed overall favorable macroeconomic developments in recent years. GDP has expanded on average by 4–5% annually, and the growth rate even surpassed 6% in 2006. The current account deficit has consistently been high and expanded further strongly in 2005 and 2006 (into double digits). Net FDI inflows have also been substantial and have so far kept up with the current account shortfalls, which they have largely contributed to. However, this expansion has reached dimensions that may not be sustainable. Private investment, together with private consumption, are the main drivers of buoyant domestic demand. Persistent and robust expansion of capital formation has allowed competitiveness to be largely sustained and promises further advances once new export capacities come on-stream. After having contracted/ stagnated in recent years, foreign debt expanded again sharply in 2006; shrinking public debt has been more than offset by rising private liabilities.

PATHS OF MONETARY TRANSITION AND MODERNIZATION
WORKSHOPS NO. 13/2008 363
Monetary and Economic Policy
CPI-inflation in the last five years has remained fairly stubbornly at an average level of about 5% and most recently (in 2005 and 2006) exceeded 6% (end-year). The level of inflation is due to the continued confluence of a number of factors, like repeated food price rises, energy price hikes in recent years, repeated excise tax adjustments as well as demand pressures, namely the strong credit boom, particularly to households. Given that the monetary policy regime largely circumscribes instruments for macroeconomic management, fiscal policy is the main tool for controlling aggregate demand. Fiscal policy has become very cautious in recent years; since 2003 the general government budget has recorded no more deficits, in 2005 and 2006 surpluses topped 3% of GDP.
Monetization of the economy has increased and financial intermediation by the banking sector, which had been very weak for years, gained momentum early in the new millennium and entered a very swift catching-up process. The Bulgarian credit boom of recent years has attained some of the highest rates of expansion of household and overall credit among transition economies. The boom has sucked in imports and contributed to the deterioration of the current account and to inflationary pressures. It was originally partly triggered by the increase of bank deposits linked to the euro changeover, partly by repatriation of banks’ lower earning foreign assets, and partly by the overall brightening of the macroeconomic situation and strengthened confidence in the banking system. As of end-2003, the banking sector was fully privatized, with the overwhelming share of assets being held by foreigners.
To check the credit boom and its repercussions on monetary stability and external balances, the Bălgarska narodna banka (BNB) launched its containment strategy in 2003. It chose a number of monetary, prudential and administrative tightening measures: repeated increases of the BNB base interest rate and of reserve requirements, tightening of capital adequacy and risk exposure regulations, credit controls/ceilings for quarterly and annual loan growth. In 2004, the government withdrew funds (part of its fiscal reserve) deposited with credit institutions in order to reduce the level of liquidity in the banking system. While prudential indicators did not show signs of serious deterioration, bank lending eventually (in 2005 and 2006) slowed down. But the slowdown was partly circumvented by the transfer of credit activities abroad and by recourse to non-bank financial intermediation (e.g. leasing companies, retailers). This contributed to growth of private foreign debt. At the beginning of 2006, the monetary authorities extended supervision to the non-bank financial sector, and in the second half of the year, they started gradually relaxing administrative restrictions, but maintained a stringent supervisory framework.
After acceding to the EU in January 2007, the authorities are planning to join ERM II at an early date, while retaining the currency board as a unilateral
PATHS OF MONETARY TRANSITION AND MODERNIZATION
364 WORKSHOPS NO. 13/2008
commitment. The country then intends to fulfill the convergence criteria as soon as possible to qualify for euro adoption early in the next decade. Bringing inflation down to the Maastricht criterion in a sustained manner may require even further fiscal tightening, though.
5.4 Croatia
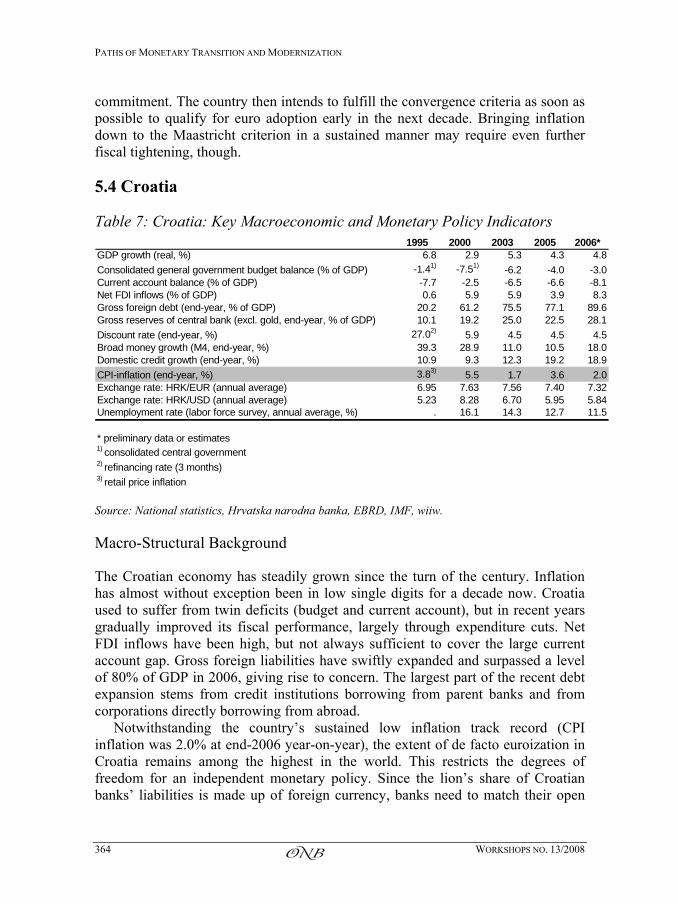
Table 7: Croatia: Key Macroeconomic and Monetary Policy Indicators 1995 2000 2003 2005 2006*
GDP growth (real, %) 6.8 2.9 5.3 4.3 4.8Consolidated general government budget balance (% of GDP) -1.41) -7.51) -6.2 -4.0 -3.0Current account balance (% of GDP) -7.7 -2.5 -6.5 -6.6 -8.1Net FDI inflows (% of GDP) 0.6 5.9 5.9 3.9 8.3Gross foreign debt (end-year, % of GDP) 20.2 61.2 75.5 77.1 89.6Gross reserves of central bank (excl. gold, end-year, % of GDP) 10.1 19.2 25.0 22.5 28.1Discount rate (end-year, %) 27.02) 5.9 4.5 4.5 4.5Broad money growth (M4, end-year, %) 39.3 28.9 11.0 10.5 18.0Domestic credit growth (end-year, %) 10.9 9.3 12.3 19.2 18.9CPI-inflation (end-year, %) 3.83) 5.5 1.7 3.6 2.0Exchange rate: HRK/EUR (annual average) 6.95 7.63 7.56 7.40 7.32Exchange rate: HRK/USD (annual average) 5.23 8.28 6.70 5.95 5.84Unemployment rate (labor force survey, annual average, %) . 16.1 14.3 12.7 11.5
* preliminary data or estimates1) consolidated central government2) refinancing rate (3 months)3) retail price inflation
Source: National statistics, Hrvatska narodna banka, EBRD, IMF, wiiw.
Macro-Structural Background
The Croatian economy has steadily grown since the turn of the century. Inflation has almost without exception been in low single digits for a decade now. Croatia used to suffer from twin deficits (budget and current account), but in recent years gradually improved its fiscal performance, largely through expenditure cuts. Net FDI inflows have been high, but not always sufficient to cover the large current account gap. Gross foreign liabilities have swiftly expanded and surpassed a level of 80% of GDP in 2006, giving rise to concern. The largest part of the recent debt expansion stems from credit institutions borrowing from parent banks and from corporations directly borrowing from abroad.
Notwithstanding the country’s sustained low inflation track record (CPI inflation was 2.0% at end-2006 year-on-year), the extent of de facto euroization in Croatia remains among the highest in the world. This restricts the degrees of freedom for an independent monetary policy. Since the lion’s share of Croatian banks’ liabilities is made up of foreign currency, banks need to match their open

PATHS OF MONETARY TRANSITION AND MODERNIZATION
WORKSHOPS NO. 13/2008 365
currency positions by extending loans mostly in foreign exchange. They also offer foreign currency (mostly euro-)indexed kuna loans. In this way, however, they transfer most of the foreign exchange risk to their often unhedged clients.
Monetary Policy
Croatia practices a tightly managed float with the euro as an exchange rate anchor. In fact, for the last 13½ years (since October 1993) the exchange rate of the kuna has been fluctuating in a de-facto corridor of approx. ±8% around the German mark/euro. Monetary policy is predominantly carried out and price stability secured by maintaining the nominal exchange rate stable against the euro. Forex market interventions constitute Hrvatska narodna banka’s (HNB) main policy instrument. Given the dominance of capital inflows in recent years, interventions have usually increased liquidity, which subsequently had to be sterilized by selling central bank bills or Treasury bills. But the central bank has not fixed the exchange rate. Thus, a limited degree of exchange rate flexibility is retained, also with a view to discourage one-sided bets of speculators.
Any substantial appreciation of the kuna would endanger Croatian enterprises’ fragile competitiveness, while a depreciation would increase real indebtedness and jeopardize banks’ balance sheets. Therefore, the HNB has refrained from more actively using interest rate policy. The monetary authority’s key interest rate, the discount rate, has remained unchanged since 2002. But reserve requirements have been frequently applied, sometimes even as an instrument to sterilize local currency liquidity, support the exchange rate and break speculation. This has happened in 2002–2003, with the goal of reining in strong credit expansion partly linked to the rise in bank deposits in the wake of the euro changeover. The credit boom threatened to aggravate the current account imbalance and foreign indebtedness.
But macroeconomic tensions persisted. In response, monetary policy became increasingly restrictive: An administrative measure introduced in early 2003 pertained to the compulsory purchase of central bank bills if a credit institution’s loans expanded at a rate higher than 16% p.a. As a consequence, nominal credit growth as well as banks’ profitability declined. A number of banks/banking groups attempted to evade the unattractive option by channelling funds into less regulated or supervised activities, like those of leasing companies and asset management outfits. Moreover, some enterprises were able to switch their borrowing from domestic to foreign banks (with local credit institutions typically directing their corporate customers to their parent banks abroad).
The administrative measure expired at end-2003. However, during 2004–2006 marginal and special reserve requirements were introduced and progressively tightened. In 2005 and 2006, prudential regulations were strengthened. But these steps could not prevent lending from re-accelerating in 2005 and 2006 (in each

PATHS OF MONETARY TRANSITION AND MODERNIZATION
366 WORKSHOPS NO. 13/2008
year the credit volume grew by about one fifth) and from contributing to the further swelling of foreign debt. In early 2006 the unified non-bank regulator Hrvatska agencija za nadzor finacijskih usluga (HANFA – Croatian Agency for Supervision of Financial Services) took up operations and started cooperating with the monetary authorities on financial stability issues. In December 2006, the HNB resorted to a new administrative intervention: It imposed a credit growth limit of 12% on banks for 2007. It remains to be seen to what degree the new measure will be more effective and less open to evasion than the old one.
5.5 Kosovo/Kosova (Serbia)
Table 8: Kosovo/Kosova: Key Macroeconomic and Monetary Policy Indicators
2001 2003 2005* 2006*GDP growth (real, %) 16 2.6 0.3 3.0General government budget balance (after grants, % of GDP) 3.7 2.1 -3.1 0.8Current account balance (after grants, % of GDP) -3.0 -9.6 -15.2 -17.3Net FDI inflows (% of GDP) 1.4 0.9 2.7 10.3Net foreign assets of monetary authority (end-year, % of GDP) 18.1 25.2 23.71) .Interest rate (non-financial firms, 3-12 month loans, %) . 14.6 15.5 13.7Growth of loans to the private sector (end year, %) 723 169 39 24CPI-inflation (end-year, %) 11.7 1.2 -1.7 0.9Exchange rate (EUR/USD) 0.90 1.13 1.24 1.26Unemployment rate (%) . 49.7 42.2 . * preliminary data or estimates/projections1) mid-2004
Source: Central Banking Authority of Kosovo, IMF, EC.
Macro-Structural Background
Kosovo’s economic recovery from the war of 1999 was almost totally driven by foreign financial aid and private inflows, particularly remittances from the Kosovar diaspora. A sharp decline of external donor assistance and the end of the post-conflict re-construction boom contributed to GDP growth grinding to a halt in 2002 and largely stagnating since. Foreign grants have shrunk from around 100% to below 20% of GDP. Workers’ remittances equal around 15% of the size of the economy and have been essential to the survival of many Kosovar families. The current account deficit after grants deteriorated from 3% of GDP in 2001 to 17% in 2006. Some fiscal loosening in 2004 and 2005 could not compensate for the drain of resources triggered by the downsizing of the international community’s presence in Kosovo. In 2006 fiscal policy was tightened again.

PATHS OF MONETARY TRANSITION AND MODERNIZATION
WORKSHOPS NO. 13/2008 367
A viable export sector is not yet in sight. Per capita GDP is still among the lowest and the jobless rate among the highest in Europe. Given a weak business climate, shaky security, inefficient judiciary, insufficient rule of law, sluggish structural reforms, in particular unsettled Serbian property claims, often poor infrastructure, a failing education system and uncertainty about the province’s future status, foreign investors have been extremely reticent so far. Overall investment in productive structures has remained feeble. On a more positive note, the private service sector, although largely operating in the gray economy, is reported to be vibrant. Small-scale agricultural production has also rebounded. Significant increases in the number of new businesses have been registered. Despite partly still unclear property rights, most recently (2005 and 2006) the privatization of socially-owned enterprises has made marked progress and a gradual increase in FDI inflows has been recorded.
Monetary Regime and Performance
The UN administration of Kosovo, more precisely the EU-led “Pillar IV: Reconstruction and Economic Development”8, fully overhauled the tax system and opened the way for a unilateral de jure euroization of the province [oder: sanctioned the wide-spread use of the euro’s legacy currencies] by giving [official] permission in September 1999 to freely use foreign currencies beside the Yugoslav dinar, which was highly inflationary at the time and was rejected by a major part of the population. The administration pays its employees solely in euros, levies taxes and carries out its transactions in euros. Transactions with the authorities in other currencies are subject to a processing fee. The euro has thus become the dominant legal tender, imposing financial discipline and securing a degree of stability. Kosovo boasted low single digit euro inflation since 2002. The dinar continues to be used in some areas of the province, though. In 2004 and 2005 Kosovo even experienced modest euro deflation, largely triggered by the shrinkage of the international presence and despite the upward pressure of oil prices. Whereas the international community had contributed to boosting prices in the early years of UNMIK’s mandate, its subsequent scaling down exercise resulted in adjustments downwards, also reflecting stagnation/ curtailment of economic activity.
The Banking and Payments Authority of Kosovo (BPK) was set up in November 1999 to provide a system for domestic payments and license and supervise banks and other financial institutions. In August 2006 the BPK was transformed into the Central Banking Authority of Kosovo (CBAK). Private
8 UNMIK (the United Nations Interim Administration Mission in Kosovo), created in June
1999 by Security Council resolution 1244, consists of four «pillars»: Pillar I: Police and Justice, under the direct leadership of the UN; Pillar II: Civil Administration, under the direct leadership of the UN; Pillar III: Democratization and Institution Building, led by the OSCE; Pillar IV: Reconstruction and Economic Development, led by the EU.

PATHS OF MONETARY TRANSITION AND MODERNIZATION
368 WORKSHOPS NO. 13/2008
banking has developed quickly, confidence in local banks has grown as witnessed by the swift expansion of deposits and loan portfolios, albeit from a tiny base. CBAK uses liquidity ratios and reserve requirements as main tools of prudential intervention. Foreign direct investors owned about 55% of the equity of all Kosovar banks at end-2005.
5.6 Republic of Macedonia
Table 9: FYR Macedonia: Key Macroeconomic and Monetary Policy Indicators
1995 2000 2003 2005 2006*GDP growth (real, %) -1.2 4.5 2.8 3.8 4.0General government budget balance (% of GDP) -1.0 2.5 -0.1 0.3 -0.6Current account balance (% of GDP) -5.0 -1.9 -3.2 -1.4 -0.4Net FDI inflows (% of GDP) 0.3 4.8 2.1 1.7 5.8Gross foreign debt (end-year, % of GDP) 23.7 41.3 39.5 39.3 40.6Gross reserves of central bank (excl. gold, end-year, % of GDP) 5.8 19.3 19.1 24.1 29.5Basic rate of NBRM (end-year, %) 16.0 8.9 7.0 6.5 6.5Broad money growth (M2, end-year, %) -1.11) 24.4 18.4 17.7 18.4CPI-inflation (end-year, %) 9.0 6.1 2.5 1.3 2.9Exchange rate: MKD/EUR (annual average) 50.33 60.73 61.26 61.30 61.19Exchange rate: MKD/USD (annual average) 37.90 65.89 54.30 49.29 48.79Unemployment rate (labor force survey, annual average, %) 36.02) 32.3 36.7 37.3 35.9
* preliminary data or estimates1) 19962) 1997
Source: National statistics, Narodna banka na Republika Makedonija, EBRD; IMF, wiiw.
Macro-Structural Background
The Macedonian economy has witnessed a hesitant recovery in the wake of the economic destabilization triggered by the ethnic and security crisis of 2001. However, growth seems to have gathered some momentum since 2004. Ethnic tensions have not yet been entirely overcome. Whereas the country used to be saddled with twin deficits, in recent years fiscal rigor was applied and the budget largely balanced; the current account gap narrowed substantially. Apart from the spike of privatization proceeds linked to the sale of the national telecoms operator in 2001 and a renewed uptick in 2006, FDI has so far not been impressive. The same goes for overall capital formation. Hesitations of foreign strategic investors reflect continued political risk, weak governance, a feeble judiciary, modest quality of transport connections and a difficult business climate.
PATHS OF MONETARY TRANSITION AND MODERNIZATION
WORKSHOPS NO. 13/2008 369
Monetary and Economic Policy
Still, the overall macroeconomic, structural and institutional environment has improved in recent years. Budgetary consolidation has been flanked by successful perseverance with a tight monetary stance, which has kept inflation under control. In 2006, CPI inflation rose to about 3%, influenced by a combination of higher energy prices, excise tax adjustments and declining food prices as a result of import liberalization due to the Republic of Macedonia’s WTO accession. The Narodna banka na Republika Makedonija (NBRM) had pegged the Macedonian denar to the German mark in 1995 and this peg – which the authorities call a “de-facto peg” – has since been upheld despite a few devaluations that took place in the second half of the 1990s. During the crisis of 2001, the authorities successfully defended the parity with the euro and they intend to maintain the regime.
Given continued mixed performance of exports in the post-crisis years, the exchange rate of the denar remained intermittently under pressure. The NBRM countered this pressure by repeatedly intervening on the foreign exchange market and upholding policy rates, which triggered contractionary effects on the money supply. Liquidity was also withdrawn through auctions of central bank bills and through augmenting the government’s denar deposits with the monetary authorities. In early 2004, treasury bills were introduced to the Macedonian financial market.
The improvement of the external accounts in 2005 and 2006, largely on the back of expanding remittances and of the privatization of the Macedonian Power Company (ESM), reduced macroeconomic tensions and enabled the central bank to replenish its forex reserves and to ease its monetary reins to some degree. However, as long as FDI doesn’t gather further momentum, it appears that the external equilibrium, the country’s competitiveness and confidence in the central bank’s exchange rate stance remain fragile. This may hopefully evolve in the near future, given that a number of important structural reforms were adopted recently (among them steps to increase labor market flexibility, to simplify enterprise and real estate registration, and to upgrade infrastructure). If not quite as fast as in neighboring countries, commercial banks’ deposits and credits are steadily expanding, reflecting growing re-intermediation and confidence in the financial system.

PATHS OF MONETARY TRANSITION AND MODERNIZATION
370 WORKSHOPS NO. 13/2008
5.7 Montenegro
Table 10: Montenegro: Key Macroeconomic and Monetary Policy Indicators
2000 2003 2005 2006*GDP growth (real, %) 3.1 2.4 4.1 6.3General government budget balance (% of GDP) -6.9 -4.9 -1.7 -0.3Current account balance (% of GDP) -4.5 -7.4 -9.1 -17.1Net FDI inflows (% of GDP) 0.91) 2.8 22.7 24.3Gross foreign debt (end-year, % of GDP) . 57.12) 39.3 38.4Gross reserves of monetary authority (excl. gold, end-year, % of GDP) . 3.6 10.5 11.1Broad money growth (M2, end-year, %) . 16.33) 49.6 87.4Domestic credit growth (end-year, %) . 42.43) 10.6 135.9CPI-inflation (end-year, %) 22.5 6.0 2.5 2.8Exchange rate (EUR/USD) (annual average) 0.92 1.13 1.24 1.26Unemployment rate (labor force survey, annual average, %) 23.71) . 30.3 30 * preliminary data or estimates1) 20012) 20023) 2004
Source: National Statistics, Centralna banka Crne Gore, EBRD, IMF, wiiw.
Macro-Structural Background
Montenegro’s recovery following the Kosovo war of 1999 has been rather feeble and may be somewhat understated by official statistics, since the gray economy is gauged to come to about a third of economic activities. In 2004, growth picked up and remained above 4% in the following years. While fiscal reforms (including an overhaul of the tax system and the adoption of a centralized treasury) contributed to reining in budget deficits, current account disequilibria have remained high. Despite growing tourism revenues and workers’ remittances, current account shortfalls expanded further recently (exceeding 17% of GDP in 2006 according to preliminary data). However, similar to other countries of the region, rising FDI inflows have been among the major drivers of this expansion. In 2005 and 2006, they clearly exceeded the current account gaps.
These FDI inflows included the privatization sales of Telekom Crna Gora, of the big and somewhat antiquated aluminium plant KAP (Kombinat Aluminijuma Podgorica), and of Podgoricka banka, one of the largest banks of the republic. At present, almost the entire banking sector is privatized and the majority in foreign hands. Given the small size of Montenegro and its economy, restructuring of the few large enterprises (particularly KAP, which traditionally accounted for the majority of the republic’s exports) can make an appreciable difference to Montenegro’s economic development.

PATHS OF MONETARY TRANSITION AND MODERNIZATION
WORKSHOPS NO. 13/2008 371
Monetary Regime and Performance
In order to escape the inflationary policies of Belgrade and become more independent of the then Milosevic regime, Podgorica introduced the German mark as a parallel currency to the dinar on Montenegrin territory in November 1999 and a year later fully withdrew the dinar. Thereby Montenegro unilaterally euroized in a de jure sense. The Centralna banka Crne Gore (CBCG) started to function in early 2001. Its gross reserves have grown, but are (still) relatively modest. Its major policy instrument is the regulation of commercial banks’ mandatory reserves; furthermore, it issues central bank bills as an indirect possibility to influence interest rates.
With the introduction of the euro, the monetary authorities seem to have succeeded in breaking the very high inflation of the past. While (euro-based) annual price increases had exceeded 20% in 2000, they declined to about 6% in 2003 and 2–3% since 2004. Starting in 2003, bank loans have been expanding briskly (they even more than doubled in 2006), albeit from a minute point of departure. The increase of loans was preceded by an improvement of the macroeconomic environment and positive tendencies in banking sector development, incl. incisive restructuring efforts. In the face of swift increases of the money supply (e.g. broad money growth accelerated to over 80% in 2006), the decline or low level of inflation reflects a strong re-monetization process. At least for the time being, the danger of euroized Montenegro losing competitiveness due to a too high inflation differential to the euro area seems to have retreated or dissipated. This may also be due to the above-mentioned upswing of productivity-enhancing capital inflows. Montenegrin independence achieved in June 2006 seems to have stabilized the overall institutional framework of economic and monetary policy making.

PATHS OF MONETARY TRANSITION AND MODERNIZATION
372 WORKSHOPS NO. 13/2008
5.8 Romania
Table 11: Romania: Key Macroeconomic and Monetary Policy Indicators 1995 2000 2003 2005 2006*
GDP growth (real, %) 7.1 2.1 5.2 4.1 7.7General government budget balance (% of GDP) -2.5 -3.8 -1.5 -1.4 -1.9Current account balance (% of GDP) -5.0 -3.6 -5.8 -10.2 -11.3Net FDI inflows (% of GDP) 1.2 2.8 3.6 6.7 9.4Gross foreign debt (end-year, % of GDP) 18.3 28.5 37.7 36.7 34.4Gross reserves of central bank (excl. gold, end-year, % of GDP) 0.8 6.7 13.5 21.3 23.1Discount rate (end-year, %) 35.0 35.0 20.4 7.5 8.8Broad money growth (M2, end-year, %) 71.6 38.0 23.3 33.9 29.4CPI-inflation (end-year, %) 27.8 40.7 14.1 8.6 4.9Exchange rate: RON/EUR (annual average)1) 2.69 2.00 3.76 3.62 3.52Exchange rate: RON/USD (annual average)1) 2.03 2.17 3.32 2.91 2.81Unemployment rate (acc. to labor force survey, average, %) . 6.9 7.0 7.1 7.0
* preliminary data or estimates1) The lei was redonominated in July 2005. All exchange rates have been converted to the post-July 2005 lei.
Source: National statistics, Banca Naţională a României, EBRD, IMF, wiiw.
Macro-Structural Background
After a protracted period of sluggish reforms and stagnation, followed by an economic and financial crisis (1997–99), Romania has since 2001 experienced robust GDP growth, which accelerated to above 7% in 2006. While the country used to be saddled with its own twin deficit problem, its fiscal imbalances have been on a clear-cut downward path recently. In contrast, the current account gap sharply widened in 2004 and further expanded in the following years. This deterioration was driven by an acceleration of domestic consumption and investment, stemming from rapid wage growth and swift expansion of credit to the private sector, buoyed by rising economic confidence. The leu also appreciated in 2005 and 2006. Strongly increasing FDI has also played a major role in the widening of the current account gap and has recently covered the lion’s share of the external disequilibrium. Erste Bank’s (Austria) takeover of Banca Comerciala Romana for about EUR 3.75 billion in 2005 was the largest privatization deal ever realized in Romania. However, despite recent improvements, administration and courts still suffer from serious transparency and enforcement problems and payments discipline remains unsatisfactory in a number of areas.

PATHS OF MONETARY TRANSITION AND MODERNIZATION
WORKSHOPS NO. 13/2008 373
Monetary Policy
Until recently, the Banca Naţională a României (BNR) conducted a money growth targeting strategy. This was coupled with a managed float reflecting nominal depreciation tendencies of the leu throughout the last decade which, on the whole, resulted in a degree of stability of the real effective exchange rate. The IMF characterized this regime as an implicit crawling band (IMF 2004, 767). The central bank’s monetary policies have often been subject to varying intense pressures from different sides, reflecting the overall fragile state of the economy. Although its general goal has been and is to control inflation, the BNR has at times found itself compelled to accelerate the nominal depreciation of the leu to alleviate price competitiveness problems of industry, to ease liquidity constraints of the domestic financial market, to make room for unforeseen deficit spending needs on the part of the fiscal authorities or to fulfill its lender-of-last-resort function to preserve the banking system from collapse.
An overall tighter and steadier monetary policy stance emerged in 2000. Since early 2002, the reference unit for the managed float has been a euro-US dollar currency basket, since early 2005, the reference unit has solely been the euro. The central bank’s most important instruments have been reserve requirements, foreign exchange and open market interventions and interest rate policy. Since the early years of the new millennium, the Romanian currency has been under overall appreciation pressure, which was punctuated from time to time by reversals and (short) intervals of weakness. Appreciation pressures have been partially countered by the build-up of foreign exchange reserves and sterilizing interventions (deposit-taking operations and transactions with government securities). Considerable amounts of liquidity were “mopped up” by open market operations. This stance, supported by a coherent policy mix, led inflation to decline from 41% in 2000 to 9% in 2004 (end-year). In response to the downward trend of inflation the central bank lowered its interest rates substantially.
2003 featured a sharp rise of the minimum wage at the beginning of the year (by 25% in real terms) and a strong and accelerating expansion of credit (albeit from a very modest level of departure), favored by the improved macroeconomic situation, enhanced business confidence and lower interest rates. Driven primarily by consumer and mortgage loans, the credit boom continued at a brisk pace the following years, reflecting a long-deferred structural catching-up process in consumption and capital formation. However, as alluded to above, this process has aggravated external balances, and rendered disinflation more difficult. Given that the share of foreign exchange-denominated loans in the total credit volume expanded, the risk emerged that unhedged borrowers could trigger financial problems for banks.
The BNR responded by tightening its reserve requirements and temporarily hiking its reference rate. Banking supervisory procedures and regulations were

PATHS OF MONETARY TRANSITION AND MODERNIZATION
374 WORKSHOPS NO. 13/2008
strengthened and in February 2004 credit restrictions per borrower were imposed. But the latter measure only proved effective in temporarily preventing a further acceleration of loan growth. Further liberalization of the capital account in April 2005 opened the way for larger capital inflows, heightening the upward pressure on the leu. In August 2005, the BNR shifted to inflation targeting, which the central bank expects will be a more effective monetary policy strategy in an environment of macroeconomic growth tensions and ubiquitous and volatile capital flows. The introduction of inflation targeting was flanked by the loosening of the exchange rate regime.
This loosening was followed by increased nominal (and real) appreciation of the Romanian currency, which rendered forex-denominated loans even more attractive, triggering the tightening of prudential regulations on foreign currency lending in September 2005. With inflation at 8.6% (end-year) in 2005, the monetary authorities slightly overshot their target for that year (7.5% ± 1%). Therefore, after interest rates had declined again, the reference rate was re-adjusted upward in the first half of 2006. Moreover, stepped-up liquidity drainage through open market operations, further nominal appreciation of the leu, as well as a pause in increases of administered prices and the downturn of the oil price in the fall of the year contributed to driving inflation further down to 4.9% in 2006, which easily complied with that year’s target (5% ± 1%). While this relatively low level is certainly a major Romanian achievement since the collapse of communism, the continued appreciation of the leu is likely to jeopardize the country’s competitiveness and exert pressure on the BNR to intervene.
As a member of the European Union since the beginning of 2007, Romania plans to join ERM II in (not before) 2012 and to become ready for entering the euro area two years later. The authorities take the view that the country needs some years to entrench macrostability, lower inflation and carry on structural reforms to fulfil the Maastricht criteria in a sustainable manner.

PATHS OF MONETARY TRANSITION AND MODERNIZATION
WORKSHOPS NO. 13/2008 375
5.9. Serbia (without Kosovo)
Table 12: Serbia: Key Macroeconomic and Monetary Policy Indicators 2000 2003 2005 2006*
GDP growth (real, %) 4.5 2.5 6.2 5.7General government budget balance (% of GDP) -1.0 -3.4 1.4 1.6Current account balance (% of GDP) -5.2 -9.9 -8.3 -10.6Net FDI inflows (% of GDP) 0.4 7.1 6.1 15.3Gross foreign debt (end-year, % of GDP) 167.4 71.4 63.8 68.4Gross reserves of central bank (excl. gold, end-year, % of GDP) 8.0 18.6 24.2 41.4Discount rate (end-year, %) 26.3 9.0 8.5 8.5Broad money growth (M2, end-year, %) 58.5 12.6 31.4 47.3CPI-inflation (end-year, %) 113.5 7.6 17.5 6.6Exchange rate: CSD/EUR (annual average) 15.30 65.05 82.91 84.06Exchange rate: CSD/USD (annual average) 16.69 57.58 66.71 66.82Unemployment rate (labor force survey, annual average, %) 12.1 14.6 20.8 22
* preliminary data or estimates Source: National Statistics, Narodna banka Srbije, EBRD, IMF, wiiw.
Macro-Structural Background
Serbia’s economic recovery from the 1999 war was stronger than Montenegro’s, but in the immediate post-war years remained subdued in view of the depth to which the country had been pushed throughout the 1990s by a string of wars, international sanctions and political and economic mismanagement. Genuine reforms and recovery had only started after political regime change in late 2000. Like other countries of the region, Serbia used to suffer from twin deficits, particularly from a high current account shortfall. Like in other countries of the region, accelerating growth, (first) successes of macrostabilization and fiscal reforms improved budgetary performance and led to budget surpluses in 2005 and 2006. Previously weak FDI gathered momentum in 2003 and further strongly expanded in 2006, driven by a few large successful privatizations. Although privatization and foreign direct investment commitments slowed down the following year, they re-accelerated in 2005 and 2006, signalling a clear improvement of the investment climate. Output gains in privatized enterprises contributed to the acceleration of economic growth in 2004 and to the relatively high level maintained in the following years. The same goes for the revival of banking activity.
After a major cleaning up operation in early 2002 that had involved the closure of four large banks comprising more than half of the book value of the entire sector, the banking supervisory and regulatory frameworks were overhauled, foreign strategic investors moved in and acquired the majority of assets, credit

PATHS OF MONETARY TRANSITION AND MODERNIZATION
376 WORKSHOPS NO. 13/2008
activity gathered momentum and turned into a boom. An increasing share of the loan volume has been generated by borrowing from abroad. While current account disequilibria have remained high (about 13% of GDP in 2006), about three quarters of the shortfalls have been covered by FDI in recent years. FDI and privatization proceeds have also allowed the central bank to steadily increase its reserves (to a level of over 40% of GDP) and the authorities to pre-pay some of their foreign liabilities.
Monetary Policy
The Serbian monetary authorities contributed to improving the weak investment climate by breaking with the lax monetary policies and very high inflation rates of the past. At end-2000 the central bank launched a tightly managed float of the dinar with reference to the German mark/euro as external nominal anchor. This sharply reduced inflationary expectations and engendered growing money demand and a remonetization of the economy. Although inflation had been brought down, in the two years until end-2002 the dinar appreciated by about 50% in real-effective terms (if from an undervalued base).
When the loose union of Serbia and Montenegro replaced the Federal Republic of Yugoslavia (FRY)9 in February 2003, the Narodna banka Jugoslavije (NBJ, which had already lost control of euroized Montenegro in 2000) was renamed Narodna banka Srbije (NBS). In order to better tackle the Serbian economy’s external constraints and forestall a further deterioration of its price competitiveness, the central bank chose to loosen somewhat the dinar’s float at the beginning of 2003. During the three years until the end of 2005, the Serbian currency nominally depreciated by a cumulative 40% against the euro (and by some percentage points against the US dollar), but the dinar’s real effective exchange rate remained broadly unchanged. The NBS thus pursued a “real exchange rate anchor” policy (not unlike the Romanian strategy until 2005). In striking a balance between inflation and external competitiveness, the monetary authorities assigned more weight to the external objective.
However, after it had fallen to around 8% in 2003 (end-year), inflation strongly increased again to 17.5% in 2005. The deterioration of the situation had been triggered by repeated adjustments of administered prices (which are reported to make up a share of about 45% of all consumer prices in Serbia), rising costs of oil and other fuel imports, and the one-off effect of VAT introduction in 2005. Moreover, despite above-mentioned progress in privatization, Serbia’s backlog in
9 The Federal Republic of Yugoslavia (only comprising the republics of Serbia and
Montenegro) had been established after the collapse of former socialist Yugoslavia in early 1992. In 2006, the union of Serbia and Montenegro was dissolved, as Montenegro became independent.

PATHS OF MONETARY TRANSITION AND MODERNIZATION
WORKSHOPS NO. 13/2008 377
still-to-be tackled restructuring efforts (compared to other countries of the region) implied that strong domestic demand met a still relatively unresponsive supply side coupled with weak competition. As of late 2006, the share of the private sector in Serbia’s GDP had not yet exceeded 55%. Furthermore, continuing dinar depreciation and widespread exchange rate indexation of prices played a major role.
The NBS reacted to the inflation “spike” of end-2005 by re-adjusting its strategy. It further loosened the exchange rate regime by withdrawing from forex interventions in early 2006. This discontinued the managed nominal depreciation tendency and brought about some considerable gains for the Serbian currency (+8% in nominal terms vis-à-vis the euro in 2006), triggered by persisting large capital inflows. In September 2006, the Narodna banka Srbije adopted a new monetary policy framework, focusing on achievement of price stability through aiming at numeric “inflation objectives”, which can be viewed as a kind of informal inflation targeting. These objectives are initially defined in terms of core inflation (excluding i.a. administered and food prices, end-year 2006 target: 7–9%) and are to be achieved primarily by adjusting the NBS’s key policy rate, the interest rate on its two-week repo operations. With efforts underway to strengthen its research capacity, the central bank envisages to adopt a formal inflation targeting regime in the future.
Disinflation success was impressive in 2006. By December, consumer prices had declined to 6.6% and core inflation performance came in at 5.9%. This was overfulfillment of the year’s inflation objective and was due to the combination of a number of factors: the sharp nominal appreciation of the dinar, the NBS’s substantial interest rate hike, its tightening of reserve requirements and the government’s (temporary) freezing of controlled prices. As a result of the marked deceleration of inflation and in order to check further dinar appreciation which threatened to put Serbian export industries under renewed pressure, the NBS cut its policy rate in a number of steps in late 2006 and early 2007.

PATHS OF MONETARY TRANSITION AND MODERNIZATION
378 WORKSHOPS NO. 13/2008
5.10 Turkey
Table 13: Turkey: Key Macroeconomic and Monetary Policy Indicators 1995 2000 2003 2005 2006*
GDP growth (real, %) 7.2 7.4 5.8 7.4 6.1General government budget balance (% of GDP)1) -3.82) -11.9 -8.6 -2.2 .Current account balance (% of GDP) -0.5 -4.9 -3.3 -6.4 -8.9Net FDI inflows (% of GDP) 0.5 0.5 0.5 2.4 4.8Gross foreign debt (end-year, % of GDP) 46.33) 59.0 53.3 49.0 49.6Gross reserves of central bank (excl. gold, end-year, % of GDP) 10.4 11.1 12.7 14.0 15.0Discount rate (end-year, %) 125.84) 204.9 31.0 17.5 22.5Broad money growth (M2, end-year, %) 102.5 40.1 13.0 24.5 .Credit growth to the private sector (end-year, %) 131.5 73.1 42.2 30.6 .CPI-inflation (end-year, %) 93.6 39.0 18.4 7.7 9.7Exchange rate: YTL/EUR (annual average)5) 0.61 0.58 1.69 1.68 1.81Exchange rate: YTL/USD (annual average)5) 0.46 0.63 1.50 1.35 1.44Unemployment rate (labor force survey, annual average, %) 6.96) 6.5 10.5 10.3 9.8
* preliminary data or estimates1) based on public sector borrowing requirement methodology (PSBR) including local public administration, social security and enterprises under public administration. 2) consolidated government3) 19964) One year treasury bill rate5) The lira was redenominated in January 2005. All exchange rates are based on the post-January 2005 lira.6) registered joblessness
Source: National statistics, Türkiye Cumhuriyet Merkez Bankasi, IMF, wiiw.
Macro-Structural Background
In the last decade the Turkish economy was characterized by erratic bouts of rapid growth which were followed by sharp recessions. The authorities did not really manage to get inflation under control. Fiscal profligacy was one of the major roots of monetary instability. Recently, there has been a succession of three stabilization programs, the latest of which has been most encompassing with respect to policy areas covered and has so far broadly delivered success, although macroeconomic fragility remains pronounced.
Overall instable developments in the mid-1990s were followed by the launching of a disinflation program in early 1998, which relied on monetary targeting and hiking interest rates, while floating the lira. But the program proved inadequate to reduce high fiscal deficits and to proceed with serious structural reforms. At end-1999 the country embarked on a new ambitious strategy relying on a crawling peg exchange rate anchor (with a reference basket consisting of the US dollar and the
PATHS OF MONETARY TRANSITION AND MODERNIZATION
WORKSHOPS NO. 13/2008 379
euro). The program contributed to a strong recovery in 2000. But the vulnerability of the banking sector, weak governance and management practices, sensitivity of foreign confidence to a widening current account deficit and the generally feeble structural environment set the stage for the eruption of a severe banking and currency crisis in late 2000 and early 2001, triggering the collapse of the exchange rate-based program.
Monetary and Economic Policy since 2001
The lira was floated in February 2001. The exchange rate of the Turkish currency immediately fell by about one-third, and ultimately by almost two-thirds against both the US dollar and the euro before eventually recovering. A new program was elaborated in the course of 2001, and drew IMF support. The new program has focused more deeply than previous ones on structural and institutional reforms, incl. public sector, fiscal and tax reforms, shaping up the banking sector, improving its regulation and supervision, and on product and labor market reforms. Monetary policy reverted to money growth targeting, while maintaining a loosely managed float of the lira.
The macroeconomic situation stabilized more quickly than expected. In 2002 the economy all but fully made up for the sharp slump it had suffered in 2001 and continued its brisk expansion in the following years. The main driving forces were private sector consumption and investment. Notwithstanding sizeable primary surpluses, budget deficits have traditionally been huge in Turkey, given very high interest and debt service payments (in the order of 15–20% of annual GDP in recent years). The latter derive from a legacy of huge public indebtedness and high interest rates.
Above-mentioned fiscal reforms and tight and sustained budgetary policies have contributed to spectacular results. After its crisis-driven peak in 2001, the fiscal imbalance steadily receded to 8.6% of GDP in 2003 and to less than 1% of GDP in 2006. This performance was of course also assisted by the unexpectedly strong and sustained economic growth. At the same time, robust growth has partly been responsible for the sharp widening of the current account shortfall in recent years (to 8.9% of GDP in 2006). While FDI has strongly increased in 2005 and 2006 and may have been largely driving the widening of the current account gap most recently, it has not covered more than one third to one half of the deficit. The rest has been financed by portfolio capital, credits and short term inflows.
The FDI expansion is a long awaited and important ingredient of structural adjustment and productivity growth related to privatization, but also to greenfield investments, and it may signal a decisive improvement of the investment climate. The breakthrough to increased FDI and confidence of foreign investors, if this is one, was apparently achieved by the launching of EU accession negotiations in 2005. FDI has also made inroads in the banking sector, lifting the share of foreign

PATHS OF MONETARY TRANSITION AND MODERNIZATION
380 WORKSHOPS NO. 13/2008
ownership in total sector assets from less than 5% in 2004 to almost a fifth in November 2006. Credit expansion has gained momentum in recent years; banks and enterprises have been attracted by lower forex interest rates and have taken recourse to foreign loans, which can be regarded as the second major driving force behind the recent swelling of the external disequilibrium.
One of the salient factors that contributed to the swift stabilization and the restoration of confidence after the crisis of early 2001 was the impressive adjustment of inflation and the re-establishment of trust in the lira. CPI inflation descended steadily over the years to below 8% at end-2005. This is the lowest inflation level Turkey has seen since the early 1970s. Inflationary expectations were reduced, money demand recovered and re-monetization gained momentum. This was achieved while at the same time large fiscal costs were incurred and total financial means of around USD 30 billion (i.e. around 15% of GDP) were earmarked for the banking sector cleanup. The Türkiye Cumhuriyet Merkez Bankasi (TCMB) adhered to restrictive base money targets while intensively engaging in open market operations to absorb excess liquidity injected to stabilize the sector.
After rising sharply in late 2001, interest rates steadily came down. Given the encouraging inflation environment, the central bank repeatedly cut its intervention rate (overnight deposit rate) in a number of steps down to a historical low of 13.5% in April 2006. The decline of interest rates and payments helped in reducing budgetary pressures and fiscal deficits, which in turn, reduced pressure on interest rates (virtuous circle). But inflation might not have come down as much as it did had the lira not substantially appreciated against the US dollar from 2003 to early 2006 and even against the euro in the course of 2005. This was triggered by rising capital inflows and happened despite the monetary authorities’ recurrent interventions to stem appreciation pressures and build up foreign currency reserves. In these conditions, at the beginning of 2006, the TCMB adopted formal inflation targeting. The end-year inflation target was set at 5% +/-2% (uncertainty bands). The nominal appreciation of the lira (on top of a still sizable inflation differential) started to raise concerns about the country’s competitiveness against the above-mentioned backdrop of fragile external accounts.
In the spring of 2006, global financial markets witnessed a widespread cut in risk appetite for emerging markets exposures, with tangible but transient consequences for Turkey. Capital flows temporarily reversed. In May–June 2006, the lira’s exchange rate against the euro fell by about 25%, but in the following months recovered again partially. The exchange rate shock pushed inflation up to 11.7% in July (year-on-year), before it declined again to 9.7% in December 2006. The monetary crisis was quickly overcome by the energetic response of the TCMB, which intervened on the forex market to defend the Turkish currency, withdrew liquidity thru open market transactions, reversed its policy of interest rate cuts and ratcheted its key rate back up by over four percentage points in the

PATHS OF MONETARY TRANSITION AND MODERNIZATION
WORKSHOPS NO. 13/2008 381
summer of 2006. (Thus the interest rate level reverted back where it had been in early 2005.) Inflation was brought back under control, even if the annual target was missed by a considerable margin. The monetary tightening may have contributed to the slight weakening of economic growth in 2006, though.
6. Comparative Overview and Conclusions
Within the admittedly short time span observed (second half of the 1990s–2006) most of the analyzed countries and territories have exhibited some remarkable similarities, at least in the macroeconomic sphere. Notwithstanding weaknesses in data measurement, economic expansion has been relatively strong in the last five years (with GDP growth on average in 2002–2006 around 5½% p.a.) in most countries. It has been less dynamic in the Republic of Macedonia and in Montenegro (3–3½%), and in Kosovo (stagnation). Southeastern European economic expansion in the last five years on the whole outstrips that of Central Europe (but not the Baltics), not to speak of the Western part of our continent. The Southeast, of course, has most catching up to do. While in the past relying on export-led growth, economic expansion in many countries of the region has been driven by private demand in recent years. Rising capital formation has contributed to the retooling/restructuring of industries.
Whereas in the late 1990s and at the turn of the millennium almost all countries (with the notable exception of the Republic of Macedonia) had featured more or less high twin deficits (budget and current account), fiscal gaps have narrowed impressively in recent years, owing to accelerating economic growth, tax reforms and budgetary tightening. Fiscal policies have generally become cautious (as opposed to policies pursued in some Central European neighbors). Practically all Southeastern European countries (again except for the Republic of Macedonia) remain saddled with high or very high current account shortfalls, which have even been on the rise most recently (apart from the situation in Bosnia and Herzegovina). Kosovo remains particularly dependent on foreign grants and financial assistance to help cover exorbitantly high current account gaps. But this support is dwindling, which contributes to keeping the issue of the viability of Kosovo’s economy in the focus of international attention. Foreign financial assistance to Bosnia and Herzegovina has already declined to very low levels, but the country’s current account has meanwhile benefited from high staple prices, masking continued serious structural weaknesses.
FDI used to be weak across the region, but expanded dynamically (in some cases multiplied from a basis of almost zero) in recent years. In 2005 and 2006, net foreign direct investment inflows covered current account deficits almost or fully in Bulgaria, the Republic of Macedonia (although both indicators remain modest in this country), Montenegro and Romania. Important progress has also been achieved in Croatia, Serbia and Turkey. FDI is still remarkably feeble in Albania, Bosnia

PATHS OF MONETARY TRANSITION AND MODERNIZATION
382 WORKSHOPS NO. 13/2008
and Kosovo. Gross foreign indebtedness is not generally high in Southeastern Europe and seems to be slowly declining (as a percentage of GDP) in most countries. The decline is generally being driven by prudent fiscal policies and swiftly contracting public liabilities, while enterprises’ and banks’ indebtedness has been rising. The most striking exception to the overall trend is Croatia, where the rise of private foreign debt has been overcompensating the decrease of public debt and where national liabilities have attained a very high level (in relation to GDP), although this does not appear to have perturbed the market so far. In Croatia – as elsewhere – foreign exchange reserves have been on the rise.
Except for Bulgaria, Romania and Turkey, joblessness is clearly in double digits all over region. It appears to be particularly high (above 30%) in Bosnia and Herzegovina, Kosovo and the Republic of Macedonia. On top of that, there seems to be a kind of polarizing trend perceptible in recent years, witnessing very high jobless rates increasing even further or stagnating, and countries with lower unemployment featuring declines of joblessness. In any case, a turnaround only appears to be materializing where substantial restructuring efforts have already preceded (e.g. in Bulgaria and Croatia).
CPI-inflation has been on a falling trend throughout the region until around 2003/ 2004, when it started to stagnate or from when some occasional upticks could be observed. As of end-2006, single digits had been reached everywhere, although in some countries (Turkey, Serbia) only just. Inflation has been low (below 4% p.a.) in Albania, Montenegro, Croatia, and almost inexistent in Kosovo and the Republic of Macedonia in recent years. Falling and then stagnating or slightly rebounding inflation appears to be linked to an overall reduction/slowdown of money growth, followed by a reversal in most countries. The reversal of money growth in turn seems to be connected to the take-off of credit expansion (if from a modest point of departure). The entrenchment of inflation in a number of countries put an end to the trend of declining interest rates. Policy rates were held constant in recent years and even raised in most countries in 2006. Of course some short-term factors (like energy price hikes, adjustments of indirect taxes and administrative tariffs, food price volatility) also played a role in recent inflation behavior.
Despite the recent upticks, there can be little doubt that years of monetary policy stringency have served Southeastern European countries well in improving their inflation track records. Such was the stabilizing influence of the exchange rate as an external nominal anchor (whether referring to a euro-oriented currency board, a fixed exchange rate or a tightly managed float), that all countries with hard pegs – apart from Bulgaria – have registered low single digits lately. Bulgaria witnessed the confluence of a number of inflation-fueling factors in recent years, namely strong food price rises, repeated excise tax adjustments, and a particularly strong credit boom. In Serbia, the transformation of the nominal exchange rate anchor into a “real exchange rate anchor” in early 2003 contributed to interrupting the downward tendency of dinar inflation in 2004 and 2005. The loosening of the

PATHS OF MONETARY TRANSITION AND MODERNIZATION
WORKSHOPS NO. 13/2008 383
exchange rate in early 2006 in the context of the transition to inflation targeting triggered a swift appreciation in an environment of rising FDI, portfolio capital and credit inflows. Disinflation resumed.
A comparable environment and a similar transition had corresponding effects in Romania in 2005 and 2006. The latter two inflation performances may embody a particular degree of dependence on – partly volatile – capital flows. Repercussions of such dependence have been recently suffered by Turkey, which had boasted a loosely managed float since early 2001 and introduced inflation targeting in early 2006. However, Turkey can point to a (so far) very successful path of breaking decades of inertia and bringing down stubbornly high price increases in a short time. Finally, Albania, a country conducting a loosely managed float for around 15 years now, has boasted an extended performance of impressively low inflation.
Therefore, the confidence and stability-enhancing effect of hard pegs appears to have borne out success in most analyzed countries; but this doesn’t preclude other monetary strategies (notably inflation or money growth targeting and a loose float) applied in a minority of countries (albeit, apart from Albania, the largest ones of the region) from also being effective. Overall monetary and economic policy soundness, credibility and perseverance may be the key to success here. In particular, prudent fiscal policies and general policy discipline, favored by IMF surveillance and EU accession aspirations, have assisted central banks in pursuing their goals.
Due to the overall progress on the route to price stability, despite occasional setbacks, confidence in domestic currencies/ monetary policies has been on the rise and is reflected in expanding money demand and re-monetization in most economies, which facilitates monetary policy. At the same time, de facto euroization and the attachment of the population to foreign currencies, particularly the euro, remain high and are reinforced by the increasing density of trade and economic relations of the region with the euro area and the EU. Foreign investment, notably from euro area and EU countries, has contributed to changing the structure and modernizing Southeastern European banking sectors and financial intermediation, although from quite humble points of departure.
Banking activities have benefited from the improving macroeconomic environment and from the euro changeover of 2001/2002, which provided a sizable net injection of liquidity into the sector and thus reflected increased confidence of the public in banks. Given a hitherto untapped catching-up potential in investment and consumption, the sharp rise of deposits and the improvement of the overall situation contributed to dynamic credit expansion in all countries of the region, without exception. Reflecting the prudence of authorities, the booms were often accompanied by steps to enhance banking supervision. Credit expansion stimulated domestic demand, pushed up imports and current account deficits and fanned inflationary pressures. Foreign currency-denominated loans gained importance and currency mismatches generated potential risks. Central banks reacted with

PATHS OF MONETARY TRANSITION AND MODERNIZATION
384 WORKSHOPS NO. 13/2008
prudential and monetary tightening, and in cases this was not sufficient – which often occurred – added administrative restrictions. While this typically slowed down loan growth (incl. that of forex loans) by credit institutions, borrowers and lenders tended to react in evasive ways (transfer of loan activities to non-bank financial institutions or re-shuffling abroad).
Finally, attempting a brief look into the future: Barring any major political setback, it remains highly probable that the bonds of economic and institutional integration between the Southeastern European countries and the European Union will further strengthen. Romania and Bulgaria are already EU Member States since 1 January 2007.10 Upon joining the Union, new Member States commit themselves to adopting the euro after all the pre-conditions, in particular, the Maastricht criteria, have been met. There are a number of exchange rate and monetary policy strategies that are compatible with the “Maastricht route”. Even currency boards, judged on a case-by-case basis, may be compatible (see the Estonian and Lithuanian examples). But unilateral de jure euroization is inconsistent with the EC Treaty. What would happen to the monetary regimes in Kosovo and Montenegro in the event that these countries joined the European Union and were still euroized, remains to be seen and decided. Without setting a precedent, a number of aspects like the very small economic size of both countries and the fact that de jure euroization took place in exceptional (post-war) circumstances, may have a bearing on the solutions that will emerge for these two specific cases.
Overall, one can conclude that a considerable range of monetary and exchange rate policy strategies are being applied with a fair degree of success across Southeastern Europe and Turkey, and that peer pressure, IMF surveillance, European ambitions and EU guidance are helping countries stay the course and advance further down the road of monetary modernization.
References
Backé, P. and Z. Walko. 2006. Bank Intermediation in Southeastern Europe: Depth and Structure. In: Focus on European Economic Integration 2. OeNB. 48–68.
Barisitz, S. 1999. The Southeastern European Nonassociated Countries – Economic Developments, the Impact of the Kosovo Conflict and Relations with the EU. In: Focus on Transition. OeNB 1. 60–94.
Barisitz, S. 2004. Exchange Rate Arrangements and Monetary Policy in Southeastern Europe and Turkey: Some Stylized Facts. In: Focus on European Economic Integration 2. OeNB. 95–118.
Coats, W. and M. Skreb. 2002. Ten Years of Transition – Central Banking in the CEE and the Baltics. Croatian National Bank Surveys 7. April.
10 On the other Southeastern European countries’ relations with the EU see European
Commission website: http://ec.europa.eu/enlargement/countries/index_en.htm.

PATHS OF MONETARY TRANSITION AND MODERNIZATION
WORKSHOPS NO. 13/2008 385
EBRD. 2006. Transition report 2006 – Finance in Transition. London. L’état du monde – Annuaire géopolitique mondiale. Paris : La Découverte (various
issues). European Central Bank. 2003, 2004, 2005. Review of the International Role of the
Euro. December 2003, October 2004, December 2005. European Commission. 2007. Candidate and Potential Candidate Countries.
Retrieved in March 2007. http://ec.europa.eu/enlargement/countries/index_en.htm
European Commission, Directorate-General for Economic and Financial Affairs. 2006. Progress toward Meeting the Economic Criteria for Accession: the Assessments of the 2006 Progress Reports. In: European Economy – Enlargement Papers 29, December.
European Commission, Directorate-General for Economic and Financial Affairs. 2007. CCEQ – Candidate and Pre-Accession Countries’ Economies Quarterly. 15
January. Der Fischer Weltalmanach – Zahlen, Daten, Fakten. Frankfurt/Main: Fischer
Taschenbuch Verlag (various issues). Gligorov, V. 2004. Southeast Europe (SEE) Overview: Diverse Developments. In:
Gligorov, V., J. Poeschl, S. Richter et al. 2004. As East You Go, the More They Grow: Transition Economies in a New Setting. wiiw Research Reports 308. July. 52–63.
Gligorov, V. L. Podkaminer et al. 2006. Broader-based Growth Resilient to Global Uncertainties. wiiw Research Reports 328. July.
IMF. 2004, 2005, 2006. Annual Report on Exchange Arrangements and Exchange Restrictions. Washington D.C.
Mazzaferro, F. et al. 2002. Economic Relations with Regions Neighboring the Euro Area in the “Euro Time Zone”. In: European Central Bank, Occasional Paper Series 7, December.
Moalla-Fetini, R. et al. 2005. Kosovo – Gearing Policies toward Growth and Development. IMF. Washington D.C.
OECD. 2003. Federal Republic of Yugoslavia – An Economic Assessment. OECD Paris. January.
Ritzberger-Grünwald, D. and H. Stix. 2007. Are Euro Cash Holdings in Central and Eastern Europe Driven by Experience or Anticipation? Results form an OeNB Survey. In: Focus on European Economic Integration 1. OeNB (forthcoming).
Seitz, F. 1995. Circulation of Deutsche Mark Abroad. Deutsche Bundesbank Discussion Paper 1.
Slačik, T. and Z. Walko. 2006. Developments in Selected Countries. In: OeNB Focus on European Economic Integration 2. 8–46.
The Statesman’s Yearbook – The Politics, Cultures and Economies of the World. Basingstoke, New York: Palgrave-Macmillan (various issues).

PATHS OF MONETARY TRANSITION AND MODERNIZATION
386 WORKSHOPS NO. 13/2008
Vujčič, B. 2003. Euro Adoption: Views from the Third Row, Presentation at OeNB’s Ost Jour Fixe. Vienna. 15 December.
Winkler, A. et al. 2004. Official Dollarization/Euroization: Motives, Features and Policy Implications of Current Cases. European Central Bank, Occasional Paper Series 11. February.