world bank document · document of the world bank ... project executing unit project information...
TRANSCRIPT

Document o f The World Bank
FOR OFFICIAL USE ONLY
Report No.: 32686-PE
PROJECT APPRAISAL DOCUMENT
ON A
PROPOSED LOAN
IN THE AMOUNT OF US$50.0 MILLION
AND
A PROPOSED GRANT FROM THE
GLOBAL ENVIRONMENT FACILITY TRUST FUND
IN THE AMOUNT OF US$lO.O MILLION
TO THE
REPUBLIC OF PERU
FOR A
RURAL ELECTRIFICATION PROJECT
FEBRUARY 7,2006
Finance, Private Sector and Infrastructure Department Bolivia, Ecuador, Peru and Venezuela Country Management Unit Latin America and the Caribbean Region
This document has a restricted distribution and may be used by recipients only in the performance o f their official duties. I t s contents may not otherwise be disclosed without World Bank authorization
Pub
lic D
iscl
osur
e A
utho
rized
Pub
lic D
iscl
osur
e A
utho
rized
Pub
lic D
iscl
osur
e A
utho
rized
Pub
lic D
iscl
osur
e A
utho
rized
Pub
lic D
iscl
osur
e A
utho
rized
Pub
lic D
iscl
osur
e A
utho
rized
Pub
lic D
iscl
osur
e A
utho
rized
Pub
lic D
iscl
osur
e A
utho
rized

CURRENCY EQUIVALENTS (Exchange Rate Effective 02/07/06)
CurrencyUnit = Soles 3.31 Soles = US$1
US$ = S D R l
January 1 - December 31 FISCAL YEAR
ADINELSA CAS CONAM CONATA D E P DGE EA EMPs ERR E S M A P FIRR FONAFE FONCODES FONER FOSE F M R s GEF GoP IADB IBRD INEI IPDF ISDS MEF MEM NGOs N P V OSINERG P D C P E U P I D PPIAF P V S A S I L SNIP SOE TA U N D P UNFCCC VAD WB
ABBREVIATIONS AND ACRONYMS
Administration Off ice o f Electric Infrastructure Country Assistance Strategy National Counci l for the Environment National Counci l for Taxation Executive Off ice for Projects General Off ice o f Electricity Environmental Assessment Environmental Management Plans Economic Rate o f Return Energy Sector Management Assistance Program Financial Internal Rate o f Return National Fund for Financing o f the Entrepreneurial Act iv i ty o f the State National Fund for Compensation and Development Fund for Rural Electrif ication Fund for Social Compensation o f Electricity Financial Management Reports Global Environmental Faci l i ty Government o f Peru Inter American Development Bank International Bank for Reconstruction and Development National Institute o f Statistics and Information-Technology Indigenous Peoples Development Framework Integrated Safeguards Data Sheet Min is t ry o f Economy and Finance Min is t ry o f Energy and Mines Non-Governmental Organizations Ne t Present Value Supervisory Commission for Energy Investment Project Directory Committee Project Executing Unit Project Information Document Public-Private Infrastructure Advisory Faci l i ty Photovoltaic Special Account Specific Investment Loan National System o f Public Investment Statements o f Expenses Technical Assistance United Nations Development Program United Nations Framework Convention on Climate Change Value Added for Distr ibution W o r l d Bank
Vice President: Pamela Cox
Sector Director: Makhtar D iop Sector Manager: Susan G. Goldmark
Country ManagedDirector: Marcel0 Giugale
Task Team Leader: Susan V. Bogach I Demetrios Papathanasiou

PERU Rural Electrification
CONTENTS
Page
A . STRATEGIC CONTEXT AND RATIONALE ................................................................. 1
Country and sector issues .................................................................................................... 1
Rationale for Bank involvement ......................................................................................... 2
Higher level objectives to which the project contributes .................................................... 2
PROJECT DESCRIPTION ................................................................................................. 3
2 . Project development objective and key indicators 4
3 . Project global environmental objective and key indicators 4
Project components ............................................................................................................. 4
Lessons learned and reflected in the project design ............................................................ 8
Alternatives considered and reasons for rejection .............................................................. 9
C . implementation .................................................................................................................... 10 Partnership arrangements .................................................................................................. 10
1 . 2 . 3 .
B . 1 . Lending instrument ............................................................................................................. 3
.............................................................. ................................................
4 . 5 . 6 .
1 . 2 Institutional and implementation arrangements., 11
3 Monitoring and evaluation o f outcomes/results 12
4 Sustainability and replicability 12
. ..............................................................
. ................................................................
. ......................................................................................... ............................................................... 5 . Critical r i sks and possible controversial aspects 13
Loan conditions and covenants ......................................................................................... 14 6 .
D . APPRAISAL SUMMARY ................................................................................................. 15
1 . 2 . 3 . 4 . 5 . 6 . 7 .
Economic and financial analyses ...................................................................................... 15
Technical ........................................................................................................................... 16
Fiduciary ........................................................................................................................... 16
Environment ...................................................................................................................... 17
Safeguard policies ............................................................................................................. 18 Policy exceptions and readiness ........................................................................................ 19
................................................................................................................................. Social 17

Annex 1: Country and Sector Background ............................................................................. 20
Annex 2: M a j o r Related Projects Financed by the Bank and/or other Agencies ................ 29
Annex 3: Results Framework and Monitoring ....................................................................... 30
Annex 4: Detailed Project Description ..................................................................................... 34
Annex 5: Project Costs ............................................................................................................... 42
Annex 6: Implementation Arrangements ................................................................................. 43
Annex 7 : Financial Management and Disbursement Arrangements ..................................... 51
Annex 8: Procurement Arrangements ...................................................................................... 59
Annex 9 : Economic and Financial Analysis ............................................................................. 65
Annex 10: Safeguards Policy Issues .......................................................................................... 90
Annex 11: Project Preparation and Supervision .................................................................... 93
Annex 12: Documents in the Project F i l e ................................................................................ 95
Annex 13: Statement o f Loans and Credits .............................................................................. 96
Annex 14: Country at a Glance ................................................................................................. 98
Annex 15: Incremental Cost Analysis .................................................................................... 100
MAP IBRD No . 33465

PERU RURAL ELECTRIFICATION PROJECT
Supplement Fully Blended?: Yes
PROJECT APPRAISAL D O C U M E N T
Themes: Rural services and infrastructure (P)
LATIN A M E R I C A AND C A R I B B E A N
Source Local Foreign BORROWEWRECIPIENT 46.30 5.15 INTERNATIONAL BANK FOR 12.50 37.50 RECONSTRUCTION AND DEVELOPMENT GLOBAL ENVIRONMENT FACILITY 4.00 6.00 ENTERPRISES 20.10 13.00 Total: 82.90 61.65
LCSFE
Total 5 1.45 50.00
10.00 33.10
144.55
Country Direcior: Marcel0 Giugale Sector Managerhlirector:
Project ID: PO90 1 16 Lending Instrument: Specific Investment Loan
Global Supplemental ID: PO901 10 Lending Instrument: Specific Investment Loan Focal Area: C-Climate change
Susan G. GoldmarWMakhtar Diop
?Y 2007 h u a l 3.10 k m u l a t i v e 3.10
Date: February 7,2006 Team Leaders: Susan V. Bogach / Demetrios Pap at hanas iou Sectors: Power (85%); Renewable energy (15%) Themes: Rural services and infrastructure Environmental screening category: Partial Assessment
2008 2009 2010 2011 2012 5.60 10.90 13.10 14.10 3.10 8.70 19.60 32.70 46.80 50.00
Safeguard screening category: L imi ted impact Team Leader: Susan V. Bogach / Demetrios Papathanasiou Sectors: Renewable energy (1 00%)
7Y 2007 2008 2nnual 0.50 2.30 Jumulative 0.50 2.80
2009 2010 2011 2012 2.00 2.00 2.70 0.50 4.80 6.80 9.50 10.00
Responsible Agency: Ministry o f Energy and Mines Av. Las Artes Sur 260, San Borja, L ima 41 Lima, Peru
Project implementation period: Start July l s t , 2006 End: June 30,201 1 Expected effectiveness date: July 1 st, 2006 Exnected closing. date: December 31st. 2012

[ ]Yes [XINO
[ ]Yes [XINO
[ ]Yes [XINO r vivae r i X T ~
Does the project depart f rom the CAS in content or other significant respects? Ref: PAD A. 3 Does the project require any exceptions f rom Bank policies? Ref: PAD D. 7
I s approval for any policy exception sought f rom the Board? Does the project include any critical r isks rated “substantial” or “high”?
Have these been approved by Bank management? ]Yes [ IN0
L AJ I L 1 i ’ lw Ref: PAD C.5 Does the project meet the Regional criteria for readiness for implementation? Ref: PAD D. 7 Project development objective Ref: PAD B.2, Technical Annex 3 The objective o f the proposed Project would be to increase access to efficient and sustainable electricity services in rural areas o f Peru.
[ X I Y e s [ 3 N o
Global Environment objective Ref: PAD B.2, Technical Annex 3 The project’s global environmental objective i s to achieve reduction o f greenhouse gas emissions through use o f renewable energy in rural areas for provision o f electricity.
Project description [one-sentence summary of each component] Ref: PAD B.3.a, Technical Annex 4 The proposed Project has five main components: (a) investment in rural electrification sub-projects by private and state-owned enterprises, supported by central government subsidies, to provide new electricity connections for rural households, businesses and public facilities, using both conventional grid electricity or renewable energy systems that would serve dispersed or remote populations; (b) technical assistance to catalyze private sector participation and create capacity for a demand driven approach for rural electrification (projects proposed by service providers in coordination with local communities and governments), as wel l as particular promotion o f renewable energy; (c) a pi lot program to promote productive uses; (d) a small hydro generation financing facility to provide project financing, during the construction and init ial operation period, for grid-connected plants; and (e) project management. Which safeguard policies are triggered, if any? Ref: PAD 0.6, Technical Annex 10 The safeguard policies that apply are: Environmental Assessment, Involuntary Resettlement, Indigenous Peoples, and Safety o f Dams. Significant, non-standard conditions, if any, for: Ref: PAD C.7 Board presentation: None Loadcredit effectiveness: There w i l l be a single effectiveness condition o f adoption o f the Operational Manual by MEM and dated covenants as follows:
1.
ii. iii.
iv.
i.
ii.
appointment o f external financial auditors within three months; a Supreme Decree creating the Project Directory Committee within three months; evidence that an adequate financial management system has been created within three months; and appointment o f procurement auditors within six months.
Disbursement conditions wi l l include: Administrative Financial Agreement established for rural electrification subsidy funds and contracts in place for key staff o f the PEU (Component 1); and
Administrative Financial Agreement established and Fund Manager services contracted for Small (Component 4)
Hydro Generation Financing Facility, Independent Investment Committee established

A. STRATEGIC CONTEXT AND RATIONALE
1. Country and sector issues
More than six mi l l ion people in the predominantly poor rural areas o f Peru do not have access to electricity. At about 30% coverage, this i s one o f the lowest rural electrification rates in Lat in America. Together with scarcity of other infrastructure services, lack o f electricity results in high costs for basic energy services, a lower quality o f l i fe, poor medical care and education, and limited opportunities for economic development. The incidence o f poverty in rural areas highlights the importance o f investing in provision o f basic infrastructure such as electricity, as part o f the national rural development agenda.
Rural electrification in Peru, after the power sector reform o f the early nineties, has been l imited to direct investment by the central government. The existing framework has not leveraged potential additional hnds from communities, regional governments, or the service providers. Electricity distribution companies hold concession areas concentrated in small areas around urban centers, with an obligation to meet service requests only within 100 meters o f the existing network. To expand coverage, the Government o f Peru (GoP) has been spending, in the last ten years, on average US$40-50 mi l l ion per year for electrification investments through the public sector. Investments were carried out through social funds (e.g. FONCODES) and more importantly, by the Executive Office for Projects (DEP), a division o f the Ministry o f Energy and Mines (MEM). DEP plans, designs and constructs projects. Once the construction phase i s completed, rural electricity systems are turned over for operation either to state-owned distribution companies, or to a specially created state-owned asset-holding company that manages the systems under operation contracts with state-owned companies, or municipalities.
The current model has a number of acknowledged limitations. Several attempts have been made to change the existing institutional and legal framework for rural electrification. Two laws have been passed by Congress but not implemented in recent years, because o f conflicts with provisions o f other laws (Law for Electrification o f Rural and Isolated or Frontier Areas in 2002, and Law to Regulate the Promotion o f Private Investment in Rural Electrification in 2004). Both initiatives, while incomplete, contained a number o f positive elements, including incentives for private investment, decentralized planning, and the proposed creation of a Rural Electrification Fund.
Peru recently reiterated i t s commitment to reduce the electrification gap, aiming to increase rural coverage from 30% to 75% by 2013.2 To help achieve these goals, the GoP aims to develop a new rural electrification framework that would increase economic efficiency in the sector and attract broader participation and financing from communities, regional governments and electricity service providers. Such a framework would need to: (a) encourage planning and implementation of projects in a demand-driven, decentralized manner; (b) introduce specific regulations to ensure the economic and financial viability o f projects in rural areas; (c) create incentive mechanisms for rural electrification investments by existing and new electricity service
Of the 9.4 mil l ion people l iv ing in rural areas o f Peru in 2002, 78% were poor and 5 1 % were extremely poor (compared to 42%
See the Rural Electrification Plan of 2004. T h i s i s estimated by MEM to require about US$860 mi l l ion (US$86 mi l l ion and 10% for urban areas).
annually).
1

providers; and (d) expand the use o f new technologies to serve remote populations, especially renewable energy.
The World Bank i s assisting MEM, through the Public Private Infrastructure Advisory Facility (PPIAF), to prepare proposals to reform the Rural Electrification Sector in Peru. Under this assistance, a new general framework for rural electrification was prepared in January 2005, “Propuesta para un Nuevo Marco General para la Electr i f icacih Rural en e l Peru.” To provide incentives for investment in rural electrification, i t was proposed in the general framework document to create a Fund for National Rural Electrification, which would be an entity specifically created to manage the mobilization, management and disbursement o f funds for rural electrification. The Fund would also support productive uses promotion campaigns. The general framework i s being used to assist preparation o f a model law for rural electrification.
2. Rationale for B a n k involvement
There are complex and interwoven issues that need to be addressed in introducing a new decentralized framework for rural electrification. Under this approach, electrification wil l be driven by communities, local and regional governments, and electricity providers to replace the current centralized provision. The proposed Bank and Global Environment Facility (GEF)- assisted Project would demonstrate key elements o f the proposed approach for rural electrification. The Bank would leverage i t s ongoing support to decentralization in Peru and exploit i t s comparative advantage in projects that use public-private service models for infrastructure services, as wel l as i t s experience with rural electrification and renewable energy. The proposed Project would function under the existing legal framework, in parallel with the development o f legal and regulatory instruments.
GEF participation would support full integration o f renewable energy options, including support for small and mini hydro grids, solar and wind systems into all activities o f the proposed project and the future legal and regulatory framework. Renewable energy options are l ikely to be cost effective in many jungle and highland areas o f Peru, where populations are remote and/or dispersed. Where electricity demand and capacity to pay are low, minimum service packages would be considered to provide power to schools, health clinics and other public facilities.
3. Higher level objectives to which the project contributes
The Bank’s participation in the proposed project would support the objectives o f employment generation, access to basic services and decentralization as set out in the Country Assistance Strategy (CAS), and discussed by the Board on December 7 , 2004. With expansion o f electricity service, the proposed project intends to improve the quality o f l i fe in rural areas and, in coordination with the productive uses promotion program, new opportunities for commercial and agro-industrial activities. The Project would aim not only to provide electricity service to rural households and businesses that do not have access to modern energy services, but also to introduce an approach to rural electrification that would result in more efficient provision o f rural electricity services and higher leveraging o f subsidies o f the central government with funds from electricity service providers, regional governments and local communities. The result would be increased access to electricity service in areas currently without service, and provision o f more
2

efficient and sustainable rural electricity services. governments to identify, plan and realize rural electrification projects would also be increased.
The capabilities o f regional and local
The Project i s consistent with GEF Operational Program Number 6, “Promoting the Adoption o f Renewable Energy by Removing Barriers and Reducing Implementation Costs”. In the Project, IBRD and GoP funds would provide minimum capital cost subsidies necessary to catalyze investments in rural electrification. Subsidies would be available to projects for grid extension or off-grid systems, including renewable energy. GEF support would be made available to fully integrate renewable energy into the Project. The GEF would provide for: (a) creation o f specific norms and regulations for renewable electricity provision, as wel l as capacity building o f al l participants to develop and propose renewable energy projects (strategic priori ty CC-3); (b) the creation o f a small hydro generation financing facility that would provide bridge financing to cover the construction period o f small hydropower plants connected to the grid (strategic priority CC-2); and (c) the pi lot program for productive uses o f electricity in areas that would increase income generation opportunities to rural communities using renewable energy (strategic priority cc-4).
The GoP i s taking important actions to tackle some o f i t s environmental problems. The National Council for the Environment (CONAM) was established in 1994, as an autonomous body within the Presidency o f the Council o f Ministers. I t s mandate i s to propose, coordinate, manage and evaluate national environmental policy. The overall mission o f C O N A M i s to conserve environment and take advantage o f natural resources in coordination with the public sector and c iv i l society in order to contribute to the sustainable development o f the country3. Peru signed the United Nations Framework Convention on Climate Change (UNFCCC) in M a y o f 1992, and the “Acuerdos Marrakech” and “Plan de Acci6n de Buenos Aires” in 2001. Peru has also ratified the Kyoto Protocol Agreement, while a number o f projects have been recently developed with World Bank assistance under the Clean Development Mechanism. C O N A M also has biodiversity, climatic change, air quality, solid waste, and environmental education programs. All o f the above mentioned initiatives indicate the Peruvian Government’s commitment to environmental sustainability.
B. PROJECT DESCRIPTION
1. Lending instrument
This fully blended Project includes both a GEF grant and an IBRD loan. The lending instrument i s a Specific Investment Loan (SIL) implemented over a five-year period. This approach was decided taking into account the need for a substantial investment component in order to demonstrate a new approach to rural electrification in Peru. A five-year period was considered both necessary and sufficient to demonstrate the new approach, as well as to assist GoP to develop the necessary instruments to incorporate the approach into Peru’s overall rural electrification program.
CONAM website: http:llwww.conam.gob.pel
3

2. Project development objective and key indicators
The objective o f the proposed Project would be to increase access to efficient and sustainable electricity services in rural areas o f Peru. The proposed Project would achieve this by: (a) investment in sub-proj ects to supply electricity services to about 160,000 currently unserved rural households, businesses and public facilities, such as schools and health clinics (serving about 800,000 people), using both conventional grid extension and renewable energy sources; (b) demonstration o f key elements o f a framework for electricity provision in rural areas o f Peru that would attract investment from private and public sector electricity providers, as well as national, regional and local governments; and (c) implementation o f a pi lot program to increase productive uses o f electricity that would increase opportunities for income generation in rural areas.
The key performance indicators would be the number o f new electricity connections, as wel l as increased productive use o f electricity in targeted rural areas (see Annex 3 for details).
3. Project global environmental objective and key indicators
The project’s global environmental objective i s to achieve reduction o f greenhouse gas emissions through use o f renewable energy in rural areas for provision o f electricity. The key global performance indicator i s avoided carbon dioxide emissions. Total estimated emission reductions from facilities installed during the project’s l i f e are estimated at 3.61 mi l l ion metric tons o f COz, over the lifetime o f the systems. The long-term national impact o f this Project i s expected to be much larger than this number, as broad replication i s expected to occur through the establishment o f a national framework for rural electrification and the development o f financing for small hydroelectric projects.
4. Project components
The proposed Project has five main components: (a) investment in rural electrification sub- projects by private and state-owned enterprises, supported by central government subsidies, to provide new electricity connections for rural households, businesses and public facilities, using both conventional grid electricity or renewable energy systems that would serve dispersed or remote populations; (b) technical assistance to catalyze private sector participation and create capacity for a demand driven approach for rural electrification (projects proposed by service providers in coordination with local communities and governments), as well as particular promotion o f renewable energy; (c) a pi lot program to promote productive uses; (d) a small hydro generation financing facility to provide project financing, during the construction and initial operation period, for grid-connected plants; and (e) project management.
Each o f these components i s described below (and in more detail in Annex 4):
R u r a l Electrification Sub-projects to provide service to about 160,000 newly connected rural households, businesses, and health centers, schools and community centers (serving about 800,000 people). The Project would provide targeted subsidies to public and private electricity
4
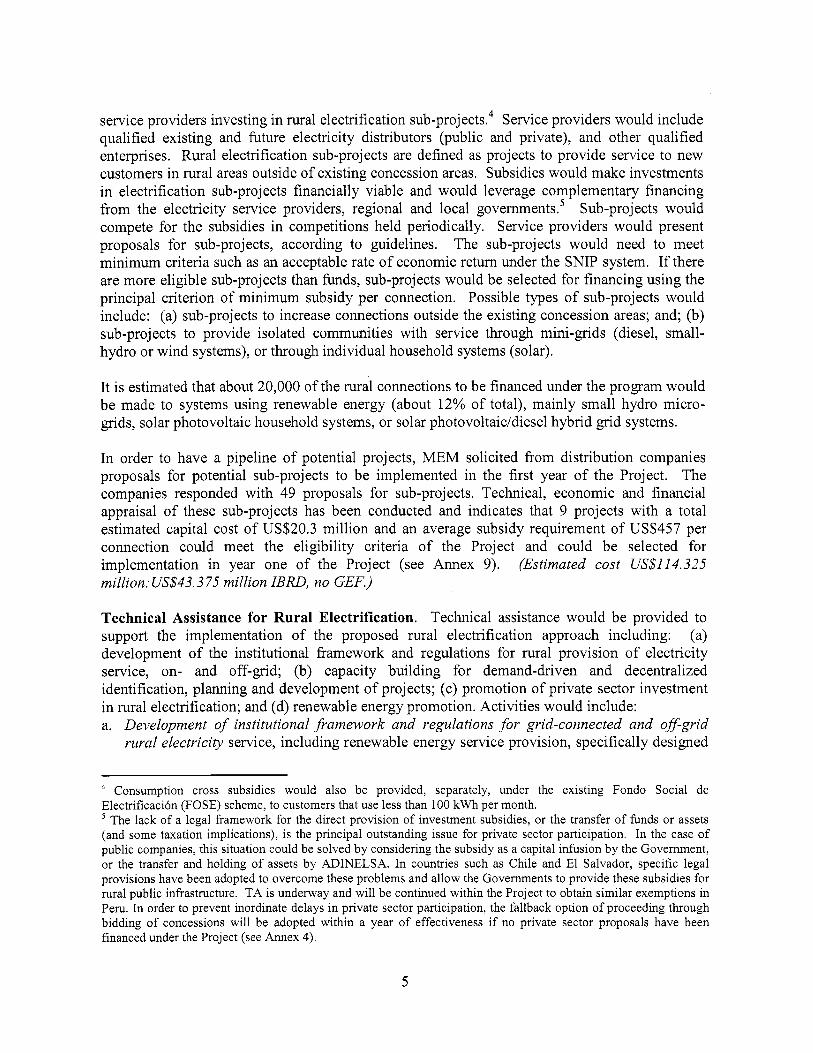
service providers investing in rural electrification sub- project^.^ Service providers would include qualified existing and future electricity distributors (public and private), and other qualified enterprises. Rural electrification sub-projects are defined as projects to provide service to new customers in rural areas outside o f existing concession areas. Subsidies would make investments in electrification sub-projects financially viable and would leverage complementary financing from the electricity service providers, regional and local g o v e m e n t ~ . ~ Sub-projects would compete for the subsidies in competitions held periodically. Service providers would present proposals for sub-projects, according to guidelines. The sub-projects would need to meet minimum criteria such as an acceptable rate o f economic return under the SNIP system. If there are more eligible sub-projects than funds, sub-projects would be selected for financing using the principal criterion o f minimum subsidy per connection. Possible types o f sub-projects would include: (a) sub-projects to increase connections outside the existing concession areas; and; (b) sub-projects to provide isolated communities with service through mini-grids (diesel, small- hydro or wind systems), or through individual household systems (solar).
I t i s estimated that about 20,000 o f the rural connections to be financed under the program would be made to systems using renewable energy (about 12% o f total), mainly small hydro micro- grids, solar photovoltaic household systems, or solar photovoltaic/diesel hybrid grid systems.
In order to have a pipeline o f potential projects, MEM solicited from distribution companies proposals for potential sub-projects to be implemented in the f i rst year o f the Project. The companies responded with 49 proposals for sub-projects. Technical, economic and financial appraisal o f these sub-projects has been conducted and indicates that 9 projects with a total estimated capital cost o f US$20.3 mi l l ion and an average subsidy requirement o f US$457 per connection could meet the eligibility criteria o f the Project and could be selected for implementation in year one o f the Project (see Annex 9). (Estimated cost US$114.325 million: US$43.3 75 million IBRD, no GEF.)
Technical Assistance for R u r a l Electrification. Technical assistance would be provided to support the implementation o f the proposed rural electrification approach including: (a) development o f the institutional framework and regulations for rural provision o f electricity service, on- and off-grid; (b) capacity building for demand-driven and decentralized identification, planning and development of projects; (c) promotion o f private sector investment in rural electrification; and (d) renewable energy promotion. Activities would include: a. Development of institutional framework and regulations for grid-connected and off-grid
rural electricity service, including renewable energy service provision, specifically designed
Consumption cross subsidies would also be provided, separately, under the existing Fondo Social de E lec t r i f i cac ih (FOSE) scheme, to customers that use less than 100 kWh per month.
The lack o f a legal framework for the direct provision o f investment subsidies, or the transfer o f funds o r assets (and some taxation implications), i s the principal outstanding issue for private sector participation. In the case o f public companies, this situation could be solved by considering the subsidy as a capital infusion by the Government, o r the transfer and holding o f assets by ADINELSA. In countries such as Chile and El Salvador, specific legal provisions have been adopted to overcome these problems and a l low the Governments to provide these subsidies for rural publ ic infrastructure. TA i s underway and wil l be continued within the Project to obtain similar exemptions in Peru. In order to prevent inordinate delays in private sector participation, the fallback option o f proceeding through bidding o f concessions wil l be adopted within a year o f effectiveness if no private sector proposals have been financed under the Project (see Annex 4).
5

b.
C.
d.
to improve the economic and financial efficiency o f the sector, including procedures for issuing rural concessions; guidelines for electricity systems design and construction appropriate for rural areas; norms for operations; procedures for calculating rural tariffs; and norms for rural quality o f service. Capacity building for identijkation and development of sub-projects that are effectively linked to regional development plans. The Project would strengthen the capacity o f electricity service providers to prepare and propose sub-projects. I t would also strengthen the capacity o f regional and local governments to coordinate planning and management o f electrification projects with other rural development activities (especially those with substantial revenues from resource development). The Project would assist the selection o f appropriate, least-cost technologies --such as renewable energy-- to electrify remote areas, or regions wi th dispersed populations, where grid extension would not be economically viable. Promotion of private sector investment in sub-projects. This sub-component would catalyze private sector investment in sub-projects. I t would include: development o f the legal framework and associated regulations to facilitate provision o f capital cost subsidies to private sector providers; promotion o f the electrification investment opportunities to potential private investors (e.g. mining companies and agribusiness); assistance to private investors to develop sub-project proposals; and, development o f bidding procedures and, bidding out o f specific sub-projects that could be attractive to the private sector. Promotion of renewable energy. This sub-component would focus on renewable energy for rural electrification and supply to the grid, especially using small hydropower, including activities such as: development o f appropriate policies and incentives; support for development o f MEM’s capacity to promote and manage renewable energy; cost-sharing preparation o f proposals and feasibility studies for renewable energy investment projects; and carrying out technical studies such as resource assessments. (Estimated cost US$3. 75 million of which US$O. 75 million IBRD and US$2.5 million GEF.)
Pilot P r o g r a m for Promotion o f Productive Uses o f Electricity. Electric power can result in productivity gains and economic growth, thus transforming the underdeveloped rural areas - if complementary elements for development such as market access, human and enterprise capacity, financial services, and resourceshaw materials are available. From a rural community or enterprise viewpoint, access and use o f electricity can contribute to a significant increase in income by reducing production costs, increasing efficiency and improving product quality.
Currently, the use of electricity in rural areas o f Peru i s overwhelmingly dedicated to evening lighting. The electricity load curve o f rural systems presents a sharp peak for three to four hours (peak to base ratio in many systems i s f ive to ten) which indicates significant under-utilization o f system resources and undermines the economic and financial viabi l i ty o f rural electrification. The use o f electricity for productive activities would make better use o f the underutilized electricity assets and therefore enhance the viability o f electrification sub-projects.
This component would support the removal o f key barriers to productive use o f electricity. Enterprises targeted would be those that currently use diesel power or other energy intensive farm and off-farm enterprises that could benefit from use o f electricity. The proposed approach i s one o f capacity building. It i s a marketing approach in the broadest sense - identifying target markets and segments; increasing awareness and skil ls, assisting potential productive users, user
6

groups and communities to identify opportunities, barriers and solutions; working closely with the electricity service suppliers to ease access; and facilitating access to other necessary services, including financing.
Initially, about 4-6 areas would be targeted, with services extended to other regions during the five-year implementation period of this component. They could be either areas newly electrified by the project, or areas that already have had electricity service for some years. The target areas will be selected based on the following criteria: (i) l o w load factor in the grids serving the area due to underutilized capacity, and not due to supply side constraints; (ii) the electricity service company i s committed to support the promotion o f productive uses; (iii) presence o f significant potential energy intensive productive activities in farm and off-farm enterprises including artisans and rural industries that might benefit from a shift to electricity; (iv) existence o f basic infrastructure (i.e. transport, communications, finance); and (v) for the renewable energy-focused “market” segment, service areas predominantly supplied with renewable energy-based electricity. (Estimated cost US$3.95 million of which US$2.0 million IBRD and US$1.5 million GEF.)
Small Hydro Financing Facility: Peru i s a country with significant hydroelectric resources due to i t s geography (Andean mountain range) and climatic conditions. In addition, irrigation and water resources management projects have created c iv i l engineering structures that present competitive hydroelectric generation opportunities for small-scale schemes. Through i t s carbon financing activities in the country, the World Bank has reviewed a‘significant number o f privately sponsored small hydro schemes that would be viable and could provide least-cost provision o f electricity to the grid.
Nevertheless, although the financial system in Peru i s quite liquid, local financial institutions are not experienced in project financing o f this type, and in general there i s no debt-financing available on a limited recourse basis. Project sponsors for small-hydro have to finance projects fully on equity, borrowing on balance-sheet, or pledging other assets for collateral. Given the shortage o f equity funds in the country and the inabi l i ty to leverage equity with debt, financial closure for small hydro projects that present attractive returns at the project level has been difficult. This has been a significant barrier to investments in small hydro schemes.
This project component would address the above barriers by using GEF funds to leverage private equity and commercial debt financing for grid-connected small hydro generating plants that would sel l power to the interconnected grid. The purpose o f the Small Hydro Financing Facility would be to assist in the financial closure o f small hydroelectric electricity generation plants (installed capacity less than 10 MW) on a project finance basis. The facility would provide ‘bridge-financing’ for small hydro projects, i.e. loans, at commercial interest rates, assuming the risk and covering the period o f construction and init ial operation; after that period the loans would be refinanced by commercial banks. Beneficiaries o f the facility would be private companies that would invest in, own, and operate, such small hydro plants. (This small hydro financing facility would not finance connections or distribution systems). (Estimated cost US$l5.0 million, of which US$5.0 million GEF.)
7

projects; c. Promotion o f private sector investment d. Promotion o f renewable electricity
3. Pi lot Program to Increase Productive Uses o f Electricity I a. Technical assistance for marketing and business
0.05 0.15 0.10 0.30 0.20 1.55 1.75 0.45 2.00 1.50 3.95 0.35 1.50 1.00 2.85
I development services 1 b. Demand Dr i ven TA
4. Small Hyd ro Financing Faci l i ty 5. Project Management
I a. Project management and administration (procurement and
5. Lessons learned and reflected in the project design
0.10 0.50 0.50 1.10 5.00 10.00 15.00
2.65 2.75 1.00 6.40 0.50 0.50 0.25 1.25
The Project builds on the Bank’s extensive experience in rural electrification. Many o f the lessons documented in the Bank’s 1994 study o f rural electrification in Asia6 are s t i l l val id and have been built into the Project. Recent rural electrification projects by the World Bank and others were examined, in Argentina, Bolivia, Chile, Ecuador, Laos, Philippines and Vietnam. Experience from other Latin American countries that have successfully established similar approaches to rural electrification, including Chile, Ecuador, and El Salvador, was also used to prepare the project.
financial management) b. Technical unit to evaluate investment sub-projects c. Moni tor ing and evaluation unit, including safeguards d. Administrative financial agreement fee
Total Baseline Cost (excludinEt front-end fee and unallocated see
Lessons learned and incorporated into the project include: (a) preparation should include a detailed estimate o f financial viability o f projects and amounts o f subsidy required, as well as a rigorous analysis o f benefits expected; (b) estimated costs o f supply should reflect generation costs at peak periods when rural demand largely occurs; (c) tariffs should be set high enough to cover the full costs o f generation and transmission at the medium voltage as well as the operation and maintenance costs at l ow voltage; (d) project design should include productive uses components to increase demand during the off-peak period and increase the economic impact o f projects; (e) selection o f sub-projects to be financed should be based on a simple, clear and transparent methodology; and (f) criteria for allocation o f subsidies should be technology neutral
0.50 0.50 0.25 1.25 0.40 0.50 0.50 1.40 1.25 1.25 2.50
51.45 48.875 100 33.10 143.425
Rural Electrif ication in Asia: a Review o f W o r l d Bank Experience, June 30, 1994; Meeting the Challenge o f Rura l Electrif ication in Developing Nations: The Experience o f Successful Programs, E S M A P Report (2005).
8

and should assure that the least-cost technology, including renewable energy, i s used where most viable technically and economically.
Other important lessons include the need for active participation o f communities, local and regional governments in both planning and implementation o f projects, especially their contribution o f financial resources. Experience has also shown the benefits o f demand driven identification and design o f projects, with communities proposing projects to the distribution companies, that then package and design sub-projects, based on clear and transparent criteria that are related to economic efficiency. In the absence o f an interested distribution company, the community, local governments, or private enterprises can propose projects to the fund for specific preparation and competitive bidding to interested sponsors.
While renewable energy technologies are fully integrated into the Project from the start, GEF support has been included in order to develop necessary institutional and regulatory requirements and processes, as well as build capacity o f all actors and provide data and technical assistance on resources and technologies. This i s to ensure that renewable energy technologies wil l take the place that i s justified by their economic and technical characteristics.
6. Alternatives considered and reasons for rejection Exclusive Focus on Private Sector Participation. The two rural electrification laws passed in the last four years were l imited to promotion o f private investment in rural electrification. The approach proposed under those laws i s for MEM/DEP to identify and prepare potential rural electrification projects which would be bid out to private sector entities and awarded on the basis of least subsidy. The Project approach would instead provide subsidies to sub-projects developed and proposed by service providers, with projects competing for the subsidies. The onus i s on the service providers to identify, prepare and propose sub-projects to the fund, rather than having the sub-projects identified by a central authority and then bid-out.
Since commercially-managed, state-owned distribution companies are the most important actors outside o f Lima, the Project would encourage involvement in rural electrification projects by commercially-managed public enterprises as well as private enterprises. The Project would also promote the participation o f small private sponsors/concessionaires, ensuring long-term financial sustainability and adequate rate o f return on project equity contribution to these new rural electrification projects. Nevertheless, theoretical analysis and empirical evidence show that cost functions in electricity distribution exhibit important economies o f scale, increasing returns to scale and economies o f output and customer density.’ Therefore, existing distribution companies, already serving relatively extensive territory with an established customer base, have a natural economic efficiency advantage in expanding their service to new areas. I t i s l ikely that
The costs of a distribution system are the costs o f bui lding and operating and maintaining the system o f service lines, mains and transformers. These costs depend upon: (i) the total number o f customers served; (ii) the maximum demand on the system; (iii) the size o f the distribution area; (iv) the capacity o f the transformers; (v) the length o f distribution lines; (vi) the total kWh sold; (vii) the price o f labor; and (viii) the price o f capital. Cost functions showing economies o f scale in the electricity distribution industry are w e l l documented theoretically and in empirical research (see references in Annex 1).
9

most o f the new rural electrification project proposals wil l come from existing distribution companies.
Approach of Competition Among Projects Proposed by Distributors. The approach proposed in the Project for provision o f subsidies with competition among projects proposed by electricity distributor companies i s now being used successfully in several countries, including Chile, Ecuador and El Salvador. These countries include those with private sector distribution companies (Chile and El Salvador) as well as public sector companies (Ecuador). Both Chile and El Salvador f i r s t tried a process o f bidding out concessions, but after limited success they opted for the system o f competition among projects that i s proposed in this Project.
Exclusion of productive uses component. The pi lot program for productive uses complicates the project. However, i t is considered important to explore ways to maximize the development impact and enhance the economic and financial performance o f the project. GEF assistance i s sought to support promotion o f productive uses, for communities to be supplied with renewable energy.
Inclusion of Activities in Other Sectors. The proposed project i s ambitious in that i t attempts to introduce a new demand driven mechanism for provision o f subsidies to service providers rather than the centralized approach currently in place, where the MEM i tse l f actually plans, designs, and constructs projects that are then transferred to others to operate. Because o f the challenges expected in implementing a new framework, and i t s importance to the future development o f the sector, i t was decided not to broaden the Project to include activities in other sectors. However, every effort wil l be made to ensure coordination with other projects on the Bank and GOP side.
C. IMPLEMENTATION
1. Partnership arrangements
Project implementation includes partnership among MEM, MEF and OSINERG (Supervisory Commission for Energy Investment) in a Project Directory Committee, which would approve the subsidies for sub-projects. Implementation also includes partnerships with banks, private f i r m s and NGOs that wil l assist in implementing productive uses technical assistance activities, as wel l as with distribution companies and local and regional governments.
Project preparation has been coordinated with: (a) the PPIAF-financed Technical Assistance on Design o f Enabling Framework for Public-Private Participation Models in Rural Electrification, which aims to develop a proposal for a new legal and regulatory framework for rural electrification; (b) an ESMAP assisted Rural Energy Survey conducted by MEM to support a strategy for rural electrification; (c) an earlier Wor ld Bank assisted study, Integral Strategy of Rural Electrification (Estrategia Integral de Electr i jkacidn Rural) in November 1999; and (d) USAID’s past rural electrification program in Peru.
During implementation, efforts would be made to leverage the Bank’s other on-going and projects under preparation on rural infrastructure (roads, water) and rural and social development (indigenous peoples, Sierra rural development, health and education). In addition, the project will coordinate wi th the implementation o f the technical assistance and programmatic loans of
10
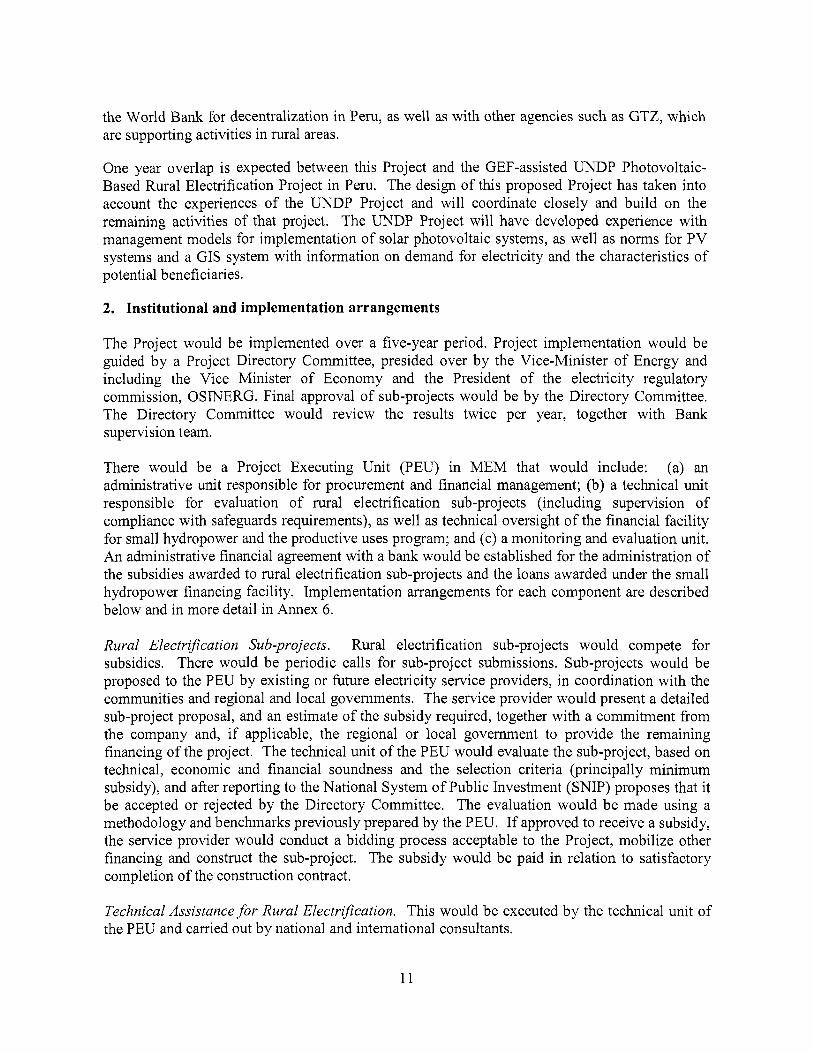
the Wor ld Bank for decentralization in Peru, as wel l as with other agencies such as GTZ, which are supporting activities in rural areas.
One year overlap i s expected between this Project and the GEF-assisted U N D P Photovoltaic- Based Rural Electrification Project in Peru. The design o f this proposed Project has taken into account the experiences o f the UNDP Project and wil l coordinate closely and build on the remaining activities of that project. The UNDP Project wi l l have developed experience with management models for implementation o f solar photovoltaic systems, as well as norms for P V systems and a GIS system with information on demand for electricity and the characteristics o f potential beneficiaries.
2. Institutional and implementation arrangements
The Project would be implemented over a five-year period. Project implementation would be guided by a Project Directory Committee, presided over by the Vice-Minister o f Energy and including the Vice Minister o f Economy and the President o f the electricity regulatory commission, OSINERG. Final approval o f sub-projects would be by the Directory Committee. The Directory Committee would review the results twice per year, together with Bank supervision team.
There would be a Project Executing Unit (PEU) in MEM that would include: (a) an administrative unit responsible for procurement and financial management; (b) a technical unit responsible for evaluation o f rural electrification sub-projects (including supervision o f compliance with safeguards requirements), as well as technical oversight o f the financial facility for small hydropower and the productive uses program; and (c) a monitoring and evaluation unit. An administrative financial agreement with a bank would be established for the administration o f the subsidies awarded to rural electrification sub-projects and the loans awarded under the small hydropower financing facility. Implementation arrangements for each component are described below and in more detail in Annex 6.
Rural Electrzjkation Sub-projects. Rural electrification sub-projects would compete for subsidies. There would be periodic calls for sub-project submissions. Sub-projects would be proposed to the PEU by existing or future electricity service providers, in coordination with the communities and regional and local governments. The service provider would present a detailed sub-project proposal, and an estimate o f the subsidy required, together with a commitment from the company and, if applicable, the regional or local government to provide the remaining financing o f the project. The technical unit o f the PEU would evaluate the sub-project, based on technical, economic and financial soundness and the selection criteria (principally minimum subsidy), and after reporting to the National System o f Public Investment (SNIP) proposes that i t be accepted or rejected by the Directory Committee. The evaluation would be made using a methodology and benchmarks previously prepared by the PEU. If approved to receive a subsidy, the service provider would conduct a bidding process acceptable to the Project, mobilize other financing and construct the sub-project. The subsidy would be paid in relation to satisfactory completion o f the construction contract.
Technical Assistance for Rural Electrij’kation. This would be executed by the technical unit o f the PEU and carried out by national and international consultants.
11

Pilot Program for Productive Uses Component. The technical unit o f the PEU wil l have overall responsibility for implementing this component. The PEU would recruit a support services contractor to assist the PEU to assist in supervising and coordinating the work o f a number o f regionally-based consultants. Each regional consultant would be responsible to implement the component in i t s regional area o f responsibility under the supervision o f the PEU. The PEU would select 4-6 departments or regions for support. The regional consultants would work collaboratively and build alliances with the critical facilitative services for credit, equipment supply, business development services, market linkages, etc. and development stakeholder organizations that already are available in the communities and, when necessary, mobilize the entry of additional ones. The regional consultants would also work closely with the local electricity service company to ensure that known issues are resolved in advance and that ones that arise during the campaign’s implementation are resolved.
Small Hydro Financing Facility. The facility wil l include an investment decision making function and a separate administrative financial agreement to handle the disbursement and recuperation o f specific project loans (lending “back-office” functions). A qualified company wil l be competitively selected to act as Fund Manager with responsibilities that wil l include: marketing and promotion o f the facility, preliminary screening o f project proposals, detailed evaluation and due diligence on projects, negotiation o f conditions and terms for specific loans and supervision o f investments. A separate three-member Investment Committee wil l be appointed by the Project Directory Committee o f the project to approve investments proposed by the Fund Manager. For approved investments, the disbursement and repayment o f loan wil l be handled through an administrative financial agreement wi th a qualified bank.
3. Monitor ing and evaluation of outcomes/results
Direct project output indicators will be measured by the PEU and reported semi-annually. Comprehensive monitoring and evaluation arrangements wi l l be implemented, that are consistent with Bank and GEF guidelines and requirements for measurement and evaluation. A comprehensive and detailed national Rural Energy Survey was carried out by MEM supported by the Bank’s Energy Management Assistance Program (ESMAP). The survey, carried out through the National Statistics Institute and international consultants, wil l provide important socio-economic data, which wil l be complemented by surveys to be carried out prior to the mid- term review and closing date o f the project. Such surveys will be particularly useful in estimating the socio-economic impact of the project. Local and regional governments, together with outreach by the PEU, wi l l be used to monitor consumer satisfaction in sub-project communi ties.
4. Sustainability and replicability
Sustainability. The Project’s approach, which relies on electricity service providers to propose sub-projects, together with the use o f capital cost subsidies only, i s intended to ensure the sustainability o f the rural electrification sub-projects. After receiving the capital cost subsidy, the electricity service provider i s solely responsible for operation and maintenance o f the system. The Government’s equity objectives would be implemented by incorporating the sub-projects
12

into the GoP’s overall FOSE scheme, where small consumers (especially below 30 kWh per month) are cross-subsidized by other consumers. OSINERG has proposed to implement a tar i f f increase for rural projects, as well as to increase the tari f f categories as required, to ensure that operation and maintenance as well as renovatiodreplacement expenses would be covered.
Replicability. The Project demonstrates key elements o f a new framework for rural electrification. In parallel to project implementation, the GoP i s preparing proposals for a new legal and regulatory fkamework, with assistance f i om the PPIAF. The replicability o f the Project ultimately depends, however, on the establishment o f a Rural Electrification Fund. A key challenge during implementation o f the Project wi l l be to build consensus on a new mechanism to mobilize funds, such as a surcharge on generation, or reduction o f the use o f FOSE to cover only consumers o f less than 30 kWh per month and transfer o f the funds released to subsidies for increasing access to rural electrification.
5. Cri t ical risks and possible controversial aspects ~
Risks Change in poli t ical commitment to Project approach
Insufficient demand for sub- projects, especially renewable energy sub-projects
Inadequate legal and regulatory framework, especially for private sector participation
Inadequate institutional and pol i t ical support for rural electrification
Changes to the distribution sector, e.g. privatization o f existing distribution
Risk Mitigation Measures Consensus building activities among ma in actors in the sector, including MEM, MEF, FONAFE, OSINERG, regional governments, electricity service providers. All stakeholders have been keen participants in project preparation, including OSINERG, the distribution companies and F O N A F E (the government holding company for public enterprises). Regional and local governments are increasingly funding Rura l Electrif ication and are expected to welcome the abi l i ty to leverage their funds through the Project. PPIAF support assisting consensus building on approach. Distribution companies already presented 49 conventional grid extension projects. Project to provide guidelines and TA to existing and future companies, including those f rom the private sector, during preparation and implementation to increase their awareness and capacity for preparation o f conventional and renewable energy projects. The Project is designed to be implemented within the existing legal framework. However, in order to improve efficiency and effectiveness o f private sector participation, TA i s provided for development o f appropriate legal framework and regulation. This work builds o n ongoing PPIAF assisted TA. Agreement has been reached with OSINERG to create new tar i f f categories, if required, to ensure adequate coverage o f operation and maintenance, renovation and replacement costs. GoP has consistently funded rural electrification at a level o f US$40-50 m i l l i on per year for the last 15 years. Interest in the issue o f rural electrif ication in Congress i s broad- based, reflected by passage o f two laws on Rural Electrif ication in 2002 and 2005. Project model would work equally w e l l with privatized companies, as shown in Chile and El Salvador that have privatized distribution but have successfully used a similar
~
Risk Rating
S
M
M
M
L
13

Risks companies o r merging o f several regional companies to fo rm larger entities Public distribution companies I The Project would finance about US$20 mi l l i on in sub- I
Risk M i t i g a t i o n Measures Risk R a t i n g model to that proposed in the Project for rural electrification.
unable to mobil ize their share o f financing
Failure to create rural electrification fund Financial Institutions not re- financing small hydro plants after construction and operation period
Capacity constraints that may prevent effective sFchon iza t i on of the ~ - ~ u a l operating and Procurement Plans and budgets, resulting in inadequate disbursements and f l o w o f funds.
Overa l l R a t i n g
M
projects-per year. The requirement for financing f rom any given company in any given year would be unl ikely to exceed U S $ l mil l ion, which could be mobil ized f rom their own funds. This is wi th in the capacity o f distribution companies. FONAFE has confirmed willingness to include investments in the budgets o f distribution companies. TA and support for consensus building on financing rural electrification is included within project Minimum requirement o f equity contribution (at 30%) would guarantee that asset value o f plant would be at about 140% o f debt refinancing needs. Interest rates charged for the project would be commercial and higher than regular corporate financing rates to provide incentives to a l l parties for refinancing 1. h igh ly qualif ied professionals in key positions (profiles in the Operations Manual) 2. highly qualif ied and experienced Financial Manager (profile in the Operations Manual) 3. Technical assistance and capacity strengthening measures will be provided by the financial management and disbursement teams 4. Successful implementation o f the FM action plan.
S
S
M
L
S: Substantial; M: Moderate; L: L o w
6. L o a n conditions and covenants
There would be a single effectiveness condition o f adoption o f the operational manual by MEM and dated covenants for:
0
0
0
0
appointment o f external financial auditors within three months; a Supreme Decree creating the Project Directory Committee within three months; evidence that an adequate financial management system has been created within three months; and appointment o f procurement auditors, within six months.
Disbursement conditions would include: 0
0
Administrative financial agreement established for rural electrification subsidy funds and contracts for key staff in place (Component 1). Administrative financial agreement established, Fund Manager services contracted for Small Hydro Generation Financing Facility, and Independent Investment Committee established (Component 4).
14

D. APPRAISAL SUMMARY
1. Economic and financial analyses
Although the full results o f a survey conducted in July 2005 have yet to be fully evaluated, most o f the critical assumptions (such as average monthly consumption levels) have been tested against survey results and may be taken as firm. The benefit estimates based on Willingness to Pay (WTP) are derived from end-use data f fom the survey. The technical and cost assumptions for subprojects have been confirmed by a detailed assessment (involving extensive consultation with the distribution companies). A detailed report on economic and financial analysis documents the assumptions, results and methodology that are summarized in Annex 9.
1.
2.
3.
4.
5.
The approach to the economic and financial analysis involved five steps: Preliminary screening: The first step was to assess the 49 proposals submitted by the distribution companies to MEM in M a y 2005 for general economic and financial feasibility: this resulted in the selection o f a short-list o f 1 6 sub-projects for more detailed analysis . Detailed analysis o f the short-list, including comparison o f key assumptions (e.g. for monthly consumption per household) against the results o f the survey, and discussions with the distribution companies to verify technical assumptions. 9 projects passed the short-list analysis for al l criteria (ERR>14%, financially sustainable at current tari f f levels after the subsidy, maximum subsidy US$800/HH, minimum size o f 1000 HH). The estimated ERR o f the accepted subprojects ranges from 21.7% - 59.1%, with an average o f 3 1.7%. Extrapolation o f the initial sub-project results to the entire program (again using survey results, for example to assess the market size o f potential grid-based RE projects). The risk o f not finding enough subprojects to consume US$92.4m in subsidy i s found to be extremely small. Estimate the ERR for the project as a whole. The aggregate ERR i s estimated at 23.8% (which i s lower than that estimated for the f i rst group o f projects as a result o f more conservative assumptions for projects selected in subsequent years o f the program). Comparison o f the proposed project against the project alternative (i.e. a continuation o f the existing approach to RE). W e show that for equivalent funding, the new approach would electrify about 150,000 HH, as opposed to 100,000 HH under the existing MEM approach; with a 20% contribution from distribution companies, 175,000 could be electrified for the same cost.
Tari f f levels to be paid by customers are affordable when compared to previous expenditures, and would be made even more affordable to rural consumers through the cross-subsidies provided by the FOSE. I t should be noted also that OSINERG proposes to raise the tariffs for category 5 (rural areas) in the next tar i f f revision. OSINERG has also proposed to put in place additional tari f f zones, as needed, in order to cover the full operating and maintenance costs o f rural electrification sub-projects
An Incremental Cost Annex was prepared to show the with and without GEF Project case, and to demonstrate how barriers to renewable energy use would be removed by using GEF funds. By h l l y integrating renewable energy into al l project activities, i t i s expected that the project would
15

result in 20,000 connections o f households or business customers to electricity provided using renewable energy. Additionally, 30 MW o f grid-connected renewable energy generating capacity would be established. In total, an estimated 6.063 GWh o f electricity would be generated from renewable sources, reducing C02 emissions by an estimated 3.61 mi l l ion tons over the lifetime o f the equipment installed. The estimated incremental cost per tons o f C02 emission reduction i s US$2.77.
2. Technical
Peru already has in place standards for rural electrification by extension o f the grid, based on the standards o f the National Rural Electricity Cooperative’s Association from the USA. The Project i s expected to assist MEM to develop or modify the following: procedures for issuing rural concessions; norms for electricity systems design and construction appropriate for rural areas; norms for operations; procedures for calculating rural tariffs; and norms for rural quality o f service. The aim o f these changes would be to make rural service provision more financially and economically sustainable. Development o f above norms, guidelines and procedures would be done separately for rural electrification sub-projects involving grid-extension, isolated grids using diesel or renewable energy sources, and individual renewable energy systems. I t would focus on increasing financial viability by ensuring flexibility for use o f l o w cost options. The Project would provide training to all stakeholders with respect to the revised norms. Successful development, adaptation and cost-effective implementation o f renewable energy technologies will be one o f the major challenges o f the demonstration subprojects o f this Project. Three main technologies are expected to emerge as cost-effective: hydro-based micro-grids, solar photovoltaic individual home systems; and renewable (hydro, solar)/diesel hybrid mini-grids.
3. Fiduciary A financial management assessment has been undertaken in accordance with OP/BP 10.02 and the Guidelines for Assessment o f Financial Management Arrangements in World Bank Financed Projects, in order to determine whether the Borrower has or wil l have in place acceptable financial management arrangements prior to effectiveness, capable o f providing with reasonable assurance, accurate and timely information on the status o f the project in agreed reporting formats.
Currently, the overall inherent and control r i sks have been assessed as moderate. More specifically, at the country and entity level the r isks are moderate, while at the project level the risk profile i s high. In order to mitigate the r isks posed by the lack o f an established PEU and o f recent engagement with the Bank, the fol lowing actions wil l be required: (a) high quality coordination and fluid communication within the Project Executing Unit and between the Unit and the participating entities; (b) high quality annual operating and procurement plans; (c) high quality annual and semi-annual budgets; (d) strong internal controls; (e) clear f low o f funds schema; ( f ) sound inter-institutional agreements; (g) qualified and skilled professionals in key positions (profiles in the Operations Manual); (h) a qualified and experienced Financial Manager (profile in the Operations Manual), (i) considerable degree o f technical assistance and capacity strengthening measures (to be provided by the financial management and disbursement Bank teams), and (g) successful implementation o f the FM action plan.
16

Similarly, a procurement capacity assessment was carried out at appraisal, together with detailed design o f the procurement arrangements o f the Project and a Procurement Plan for the f i rs t two years o f operation o f the Project.
4. Social
A National Rural Energy Survey has been completed, sponsored by MEM and carried out by INEI (National Institute o f Statistics and Information Technology). The survey provides: (i) extensive data on consumption and expenditures o f energy in households with and without electricity; (ii) information to enable more accurate assessment o f potential consumption in sub- projects; (iii) estimates o f the consumer surplus from rural electrification; (iv) socio-economic information on income, social characteristics, attitudes and perceptions o f benefits that wi l l serve as baseline information and be valuable to qualitatively evaluate the socio-economic benefits o f electrification.
The Project i s expected to have positive social impacts through increased access to electricity among rural households. I t i s expected that increased access to electricity would: (i) significantly improve the quality o f lighting, as well as disposable income o f rural households, since cost o f electricity would be less than alternatives (kerosene, candles, car batteries and dry cell batteries); (ii) provide increased opportunities for households to engage in income generating activities; (iii) allow household members to have more flexible working hours and work longer in the evenings; (iv) improve the access o f the household to news, information and entertainment; and (v) allow children to study and adults to read in the evening.
5. Environment
Environmental impacts o f the Peru Rural Electrification Project are expected to be minimal given the type o f interventions planned under this project, which has the potential to be very positive environmentally due to the reduction o f COz emissions. The project includes provisions to ensure that potential impacts, including induced and cumulative impacts, are assessed and mitigated in accordance with the Bank’s safeguard policies. Since the project wi l l be supporting investments through a dedicated subsidy fund, an environmental screening criteridguidelines and management procedures have been prepared as part o f the project’s environmental management framework. The project’s EA work has also addressed the institutional environmental management responsibilities and capacities, and has set forth enhancement provisions as needed to ensure that participating institutions have the capacity to address any environmental impacts associated with the project.
This framework wi l l be used for screening al l subprojects.
The main stakeholders were consulted as a part o f the process o f the preparation o f EA. Additional consultations (rural communities) are planned during the implementation o f the project, as part o f the preparation o f EMPs. The EA was made available at the offices o f the Project Executing Unit (PEU) and in the World Bank’s Infoshop by appraisal. Future EAs and EMPs wil l similarly be made available to the public.
17
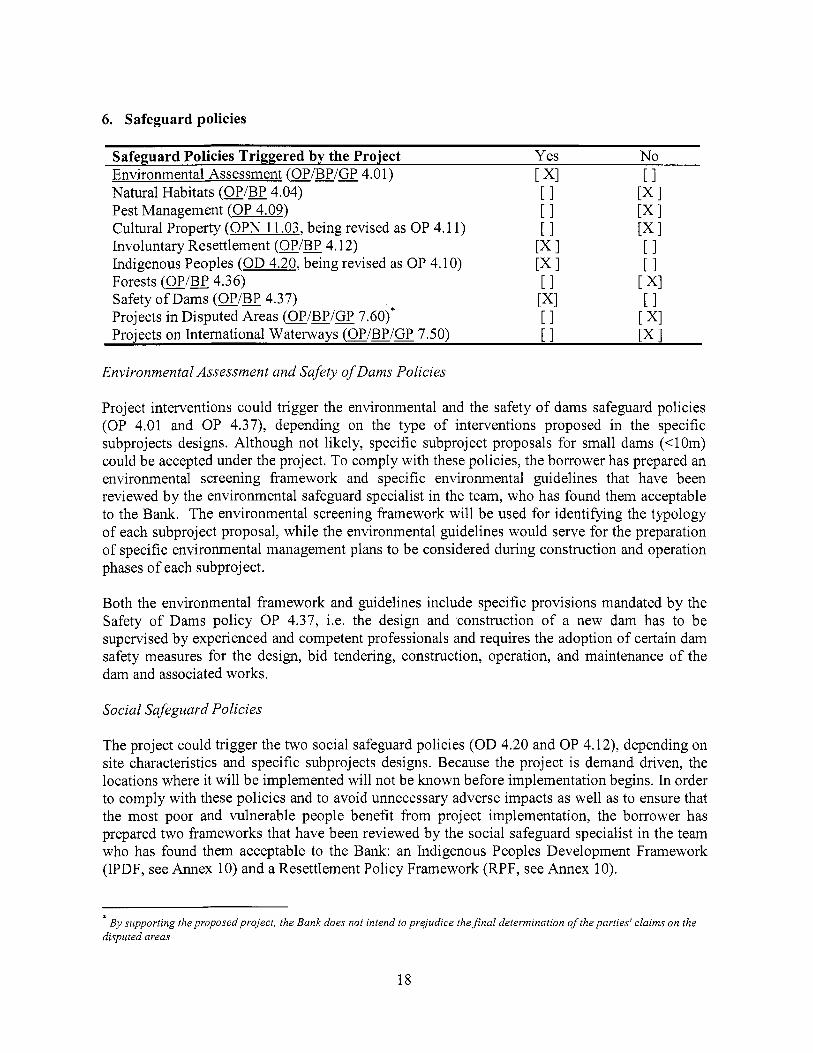
6. Safeguard policies
Safeguard Policies Triggered by the Project Yes N o Environmental Assessment (OP/BP/GP 4.01) [ XI [I Natural Habitats (OP/BP 4.04) [I [X 1 Pest Management (OP 4.09) [I [X 1 Cultural Property (OPN 11.03, being revised as OP 4.1 1) [X 1 Involuntary Resettlement (OP/BP 4.12) [X 1 [I Indigenous Peoples (OD 4.20, being revised as OP 4.10) 111 Forests (OP/BP 4.36) [I [ XI Safety o f Dams (OP/BP 4.37) [XI [I Projects in Disputed Areas (OP/BP/GP 7.60)* [I [ XI Projects on International Waterways (OP/BP/GP 7.50) [I [X 1
[I
[X 1
Environmental Assessment and Safety of Dams Policies
Project interventions could trigger the environmental and the safety o f dams safeguard policies (OP 4.01 and OP 4.37), depending on the type o f interventions proposed in the specific subprojects designs. Although not likely, specific subproject proposals for small dams (<1 Om) could be accepted under the project. To comply with these policies, the borrower has prepared an environmental screening framework and specific environmental guidelines that have been reviewed by the environmental safeguard specialist in the team, who has found them acceptable to the Bank. The environmental screening framework wi l l be used for identifying the typology of each subproject proposal, while the environmental guidelines would serve for the preparation o f specific environmental management plans to be considered during construction and operation phases o f each subproject.
Both the environmental framework and guidelines include specific provisions mandated by the Safety of Dams pol icy OP 4.37, i.e. the design and construction o f a new dam has to be supervised by experienced and competent professionals and requires the adoption o f certain dam safety measures for the design, bid tendering, construction, operation, and .maintenance o f the dam and associated works.
Social Safeguard Policies
The project could trigger the two social safeguard policies (OD 4.20 and OP 4.12), depending on site characteristics and specific subprojects designs. Because the project i s demand driven, the locations where it wil l be implemented wil l not be known before implementation begins. In order to comply with these policies and to avoid unnecessary adverse impacts as well as to ensure that the most poor and vulnerable people benefit from project implementation, the borrower has prepared two frameworks that have been reviewed by the social safeguard specialist in the team who has found them acceptable to the Bank: an Indigenous Peoples Development Framework (IPDF, see Annex 10) and a Resettlement Policy Framework (RPF, see Annex 10).
* By supporting theproposedproject, the Bank does not intend to prejudice the f ina l determination of the parties' claims on the disputed areas
18

The IPDF depicts the process and the principles by which Indigenous Peoples Development Plans would be prepared if the pol icy i s triggered due to its implementation in lands owned or used by Indigenous Peoples in the highlands and the upper selva regions, or whenever IP become beneficiaries o f the project. The IPDF provides an assessment o f the social, economic and cultural traits o f the Indigenous Peoples in these regions as well as demographic information; and assess the impacts, both adverse and positive ones that the project might have in these communi ties.
The IPDF has been submitted to a preliminary consultation. One consultation was held in the highland city o f Huancavelica, on July 20, 2005 with participants representing peasant communities, producers associations and local authorities. A second consultation was held in the central upper selva, in the town o f Pichanaki on July 24, 2005 with participants representing indigenous communities, indigenous organizations and members o f the electrification district committee. These consultations have provided useful feedback regarding the kind o f productive activities that these communities would l i ke to develop when having access to electricity (more information i s available in Annex 10).
The framework identifies the Project Management Unit as the entity responsible for the preparation of IPDPs. This unit wil l include a social specialist responsible for al l social issues within project management.
A Resettlement Pol icy Framework for Rural Electrification Sub-projects and Small Hydropower Facilities has been prepared by the borrower in case the pol icy i s triggered due to c iv i l works, r ights o f way for transmission lines and use o f water for hydropower facilities. Due to the small sizes o f the required works i t i s very unlikely that the pol icy wi l l be triggered regarding physical displacement o f affected populations. It i s more likely though that the pol icy wil l be triggered due to land acquisition, rights o f way or water usage. Nonetheless, the RPF details the process, the criteria and the principles to be followed for the preparation o f site specific Resettlement Plans as required by the pol icy (more information i s available in Annex 10).
The framework identifies the Project Management Unit as the entity responsible for the preparation o f RAPS and the DGAAE as the unit within MEM responsible for the supervision o f land acquisition, rights o f way and relationships with local communities.
The frameworks were disclosed prior to appraisal in-country in the Ministry o f Energy and Mines website as wel l as in the Infoshop.
7. Policy exceptions and readiness
The operation complies with al l applicable Bank policies.
19

Annex 1: Country and Sector Background
PERU: Rural Electrification
Country Background
Peru has had four years o f sustained economic growth with an average growth o f 4%. The economic program o f the present administration has focused o n maintaining macroeconomic stability, with the goal o f supporting a sustained recovery in economic activity and employment in a context o f l o w inflation and limited external vulnerability. Peru’s economic performance i s l ikely to continue improving in the coming years, contingent on a favorable external environment.
However, increasing economic globalization and the ongoing free trade agreements, continues to demand from Peru more dynamic, equitable, and sustainable growth. The recent economic growth has not yet had a significant effect o n reducing poverty, but has stopped the worsening trend in poverty that began during the recession o f the late 1990s, when the poverty rate increased by 7.5 percentage points between 1998 and 2001, Since then, the poverty rate has held steady at just over ha l f the country’s population, while the extreme poverty rate fe l l by almost 3 percentage points between 2001 and the end o f 2003. Poverty remains more severe in rural areas than in urban areas, and i s 20 percentage points higher in the sierra (highlands) and the selva (jungle) than o n the coast. For example, in 2003, 73% o f rural inhabitants l ived in conditions o f poverty8, Likewise, more than six mi l l ion people in the predominantly poor rural areas o f Peru do not have access to electricity. The incidence of poverty in rural areas highlights the importance o f investing in provision o f basic infrastructure such as electricity, as part o f the national rural development agenda.
The government strategy to reduce poverty i s organized around three central objectives, which form the framework for the CAS: (i) competitiveness and employment generation; (ii) equity and social justice, including access to health, education, culture and basic services; and (iii) institutionality, creating an efficient, transparent and decentralized state. K e y to these objectives i s the presence of an economic program and institutions ready to buffer the impact o f shocks, and thus ensure that poverty reduction gains are not lost, while addressing structural sources o f poverty. In light o f the high dollar indebtedness o f the economy, government i s working to strengthen fiscal balances through controls o n expenditures, improved debt management, and increased tax collections, as wel l as initiating a national competitiveness program for addressing barriers to private sector growth and increasing exports. However, a lack of government resources and the GOP’s fiscal austerity measures present challenges in achieving these goals.
Energy Sector Background
In 1992, a new legal and regulatory framework was put in place for the energy sector (electricity and hydrocarbons), in line with Mr. Fujimori’s f irst administration thorough economic reform. Under the reform, i t was planned that the private sector would be the principal actor and the public sector would concentrate i t s activities in regulation and supervision. An ample privatization program was established to transfer controlling ownership o f public enterprises to the private sector.
* Herrera, Javier (2004) “La Pobreza en e l P e d , 2003”, Institut de Recherche pour l e DCveloppement (1RD)-Instituto Nacional de Estadistica e Informatica (INEI), L ima. *Poverty i s defined by Basic Needs Unsatisfied (BNU) who resides in homes with at least one basic need unsatisfied.
20

In the hydrocarbon sub-sector, the business model chosen was an open competitive market in production and commercialization. Petroperu, the state-owned monopoly company, was partially divested (the integrated business was broken-up in production, refineryhtorage and commercial lines, divested separately.)
In the electricity sub-sector, the integrated utility model was replaced by a new sector structure based o n the unbundling o f generation, transmission, distribution and commercialization. Competitive markets would operate in the generation and commercialization segments and transmission and distribution would be regulated, based o n free-entry and open-access. The main regulatory body created by the new law was the “Organism0 Supervisor de l a Lnversi6n en Energia (OSINERG)” (“Supervisory Commission for Energy Investments”), in charge o f tar i f f setting, supervision and monitoring o f the legal and technical regulations for the electricity sector.
Electrolima and Electroperu, the two publicly-owned and vertically integrated electricity utility companies (serving L ima and the remainder of the country, respectively), were divested. Fol lowing the reform process, power shortfall was reduced, distribution losses fell drastically, and electricity tariffs stabilized to economic levels. Although the reform process was successful in general, with the active participation o f the private sector,’ the scheme suffered a setback in the distribution segment outside o f the capital city]’. The failure o f privatization o f electricity distribution companies can be mainly attributed to inadequate tariffs and the lack o f a cross-subsidy mechanism among different consumers which i s impl ic i t in companies of a large enough scale. Bo th o f these issues are being gradually addressed (introduction o f FOSE, see below, and contemplation o f additional incremental tar i f f for rural areas), but the rural sector remains challenging for distribution and around the wor ld requires subsidization.
In the restructuring o f the sector, the electricity tar i f f scheme was predicated o n full-cost recovery. An in i t ia l transition period o f four years was established during privatization to adjust tariffs to their economical efficient levels. This situation prevailed until the middle o f 2001, with n o explicit subsidies to the electricity rates. Under the new Toledo government, Congress passed legislation in August 2001, which established a “social tariff” for electricity consumption (the so called FOSE, “Fondo de Compensacih Social ElCctrica”). The application o f the FOSE subsidy began in November 2001, with a temporary duration of three years. However, in July 2004, the Congress extended indefinitely the application o f the subsidy, increasing the levels o f tar i f f reductions (increasing the amount o f the subsidy).
Presently, the private sector owns about 65% o f installed capacity in generation and a l l o f transmission (with the government owning only small minor i ty stakes that i t i s seeking to divest.) In distribution, two private companies serve Lima, whi le state-owned companies s t i l l serve the remainder o f the country, with about ha l f o f the total nationwide electricity users. Electricity generation in 2004, was 22,613 GWh, o f which 76% came from hydro (considerably less than in 2003, when hydro represented 86% o f generation.) Quality o f electricity service in urban areas i s considered satisfactory and the electricity distribution companies generally operate professionally. However, the existing electricity distribution
COPRI (the Peruvian private investment promotion entity, now called ProInversion) indicated init ial strategic investments o f over two bi l l ion US Dollars, and about US$700 in agreed new investments in the sector, in i ts 2000 report “Evaluacion del Proceso de Privatizacion del Sector de Electricidad.” lo Distriluz, an electricity distribution holding corporation composed o f four regional companies (Electronorte, Hidrandina, Electronoreste, and Electrocentro), was privatized in 1998 only to be returned to public hands in August 2001, after failing to comply with i t s contractual obligations with the State. N o w Distriluz i s administered by FONAFE, the “Fondo Nacional de Financiamiento de la Actividad Empresarial del Estado, ” a management unit under the Ministry o f Economy and Finance. Distriluz companies serve 12 Departments with a total o f 1.1 mi l l ion customers (about 6 mill ion people.)
21

companies hold concession areas concentrated in small areas around urban centers. Their obligation i s to meet service requests only within 100 meters o f the existing network.
“Contestable” Market (“Free” Clients)
- MWh
Background on Tariffs
Contract 1
Regarding the sector tar i f f structure, the L C E established two different hnds o f electricity users, the small retail users under regulated prices (denominated regulated users), and the large users with demands above 1,000 kW (denominated “free” users), which could contract their electricity service directly to generators or distributors, under bilateral contracts at negotiated generation prices. Generation prices are determined by merit order cost-based economic dispatch. Generators trade their energy surplus or deficits at the short-term (“spot”) marginal price (see figure below for a schematics o f the system.)
Client “Retailing” Services Regulated I, Distribution
System
Figure 1.1: Schematic o f Tariff System
“Retailing” Competition
Regulated “Market” (Regulated Clients) I
Distributors
Generation prices to the regulated users (called “busbar” prices) are calculated periodically (it was twice a year before a recent reform to the L C E that modified this to once a year) based o n a three-year (one historical and two future years) economic operation simulation. The transmission network has open access and tariffs are regulated under an economic cost-based procedure. The transmission tar i f f i s recalculated every year.
The distribution system, consisting mainly o f medium voltage (MV) primary distribution linedfeeders and low voltage (LV) distribution circuits, i s regulated under a cost-based efficient model company, for each o f four “typical distribution sectors” (urban high density; urban medium density; urban-rural; and rural), based o n users average maximum demand and consumption, load density and geographic dispersion. The distribution tar i f f i s called the VAD (Value Added for Distribution). The VAD for the different zones and distribution companies are recalculated every four years (a VAD tar i f f review i s underway and w i l l enter into effect in November 2005; for t h i s review, a new zone was established, by subdividing the actual zone two.)
22

Table 1.1: Distribution Tariffs as of June 2005 (in S/kW- month)
VADM VAD,
Zone 1 Zone 2 Zone 3 Zone 4 10.437 7.820 12.565 23.933 36.094 3 1.754 42.633 43.305
These per unit capacity costs are converted to more suitable energy units, using typical consumers’ demand curves, for establishing consumers’ tariffs. The tar i f f for a typical regulated residential f inal user consists of: the generation tariff, GT (the busbar price) + the transmission tariff, T T + the distribution tariff, VAD (VADM + VADL, the distribution added value for MV and LV networks.) For example, the electricity tariff for a residential consumer in Lima, the capital city, with a consumption above 100 kWh per month, i s S/. 0.33081kWh (about USSO.l02/kWh.) The tar i f f for a similar consumer in a rural area of Peru i s S/. 0.41 19/kWh (about US$0.127/kWh), 25% higher than in Lima. These are the f i l l -cost tariffs.
Users of
Interconnected System
Interconnected System
Isolated System
Isolated System
In the restructuring of the sector, the electricity tar i f f scheme was predicated o n a full-cost recovery. This situation prevailed until the middle o f 2001, with no explicit subsidies to the electricity rates. When Mr. Toledo took office in July 2001 announced legislation for establishing a “social tar i f f ’ for electricity consumption (the so called FOSE, “Fondo de Compensacih Social Electrica”). The subsidy was approved by congress in August 2001, and began to be applied in November 2001, with a temporary duration o f three years. The subsidy consisted o f 25% and 50% tar i f f reduction for monthly consumption up to 30 kWh, for users supplied by the interconnected system (ICs) and by isolated systems (IS), respectively. For consumption between 3 1 and 100 kWh, the reduction was gradual f rom a maximum of 25% to a minimum of 7.5%, in the case of I C s users and double this percentage in the case o f I S users. Consumption above 100 kWh per month would pay a surcharge in proportion to energy consumption above 100 kWh/month to finance the subsidy.
For consumption greater than 3o
kWhImonth up to 100
Tariff Reduction for Areas consumptions lower or
Urban 25% o f the energy charge A reduction o f 7.5 kWldmonth A reduction o f 15 kWWmonth Rural A reduction o f 15 kWWmonth Urban
Urban-Rural and 62.5% o f the energy A reduction o f
equal to 30 kWhImonth kWhlmonth
Urban-Rura1 and 50% o f the energy charge
50% o f the energy charge
Rural charge 18.75 kWWmonth
In July 2004, the Congress extended indefinitely the application o f the subsidy, increasing the levels of tar i f f reductions (increasing the amount of the subsidy). The new tar i f f subsidy for residential consumers with the FOSE i s shown in the table below.
This new level o f subsidy consists o f 25% and 62.5% tar i f f reductions for monthly consumption up to 30 kWh, for urban users supplied by the interconnected system (ICs) and for rural users supplied by isolated systems (IS), respectively. For consumption between 31 and 100 kWh, the reduction i s gradual, f rom a maximum o f 3 1.25% to a minimum of 7.5%, for rural users supplied by IS, and for urban users supplied
23

by the ICs, respectively. Consumption above 100 kWh per month would pay a cross subsidy in proportion to their energy consumption above 100 k W m o n t h to finance the FOSE discount.
The table below shows electricity tariffs, including the FOSE subsidy, for a residential user with monthly consumption up to 100 k w h :
Table 1.3: Residential Subsidized Tariffs (S/kWh) Consump tion Lima Rural
From 3 1 to 100 kWh 0.322 0.402
Statistics shows that about 33% o f al l residential users consume less than 30 kwh per month and about 35% consume between 31 and 100 kWh per month. This means that 68% o f a l l residential consumers receive some electricity price subsidy. This represents an increase o f slightly more than 3% in the full- cost o f electricity for the users providing the subsidy (the ones with monthly consumption over 100 kWh.).
Background on R u r a l Electrification
Electrification o f rural and remote areas was not explicitly addressed in the new legal and regulatory framework. The rural electricity market in Peru i s very small and dispersed. The distance and isolation of these communities make access to electricity in rural areas very difficult, which results in high installation, operation and maintenance costs for rural electric installations. These high costs discourage, private investment in rural electrification. Furthermore, the inhabitants o f rural areas generally have very l o w income levels, which make their demand for electricity and ability to pay tariffs very low. Due to these factors, there i s l i tt le incentive to invest in rural electrification without government subsidization. Consequently, only 32% o f rural households in Peru have access to electricity, the second lowest electrification coverage in Lat in America after Bolivia.
Although no clear strategy or pol icy was established, the Government has invested a considerable amount o f public funds in expanding electricity service to ruralhemote areas, and in non-served areas in the periphery and poor zones that surround the largest cities. In parallel with the reform program o f the energy sector, in 1993, the Ministry o f Energy and Mines established the Direccidn Ejecutiva de Proyectos (DEP), as an entity in charge o f implementing electrification projects, to complement the investment activities o f the privatized distribution companies. The main centralized development strategy pursued by DEP was to extend the grid and increase levels o f rural electrification. Therefore, rural electrification in Peru has been thus far l imited to direct investment by the central government - there i s n o adequate framework to mobil ize investments f rom communities, regional governments and the private sector in the current centralized strategy.
The activities o f the electricity distribution companies within their concessions, and o f the DEP and social funds such as FONCODES in rural areas and areas outside o f concessions have increased national coverage levels f rom 57% in 1993 up to 76% in 2004. Over this period, rural electrification increased from 5% to about 32%. The total investment by the DEP during th i s period was just over US$600 mill ion, with an annual average o f about US$50 mill ion. The DEP completed 608 projects during this time period. According to statistics f rom the DEP, about 4.8 mi l l ion people were benefited by these projects (close to one mi l l ion households). The average amount o f kilowatt-hours consumed per month by each household, which were beneficiaries o f the DEP projects, was around 20 kWh.
24
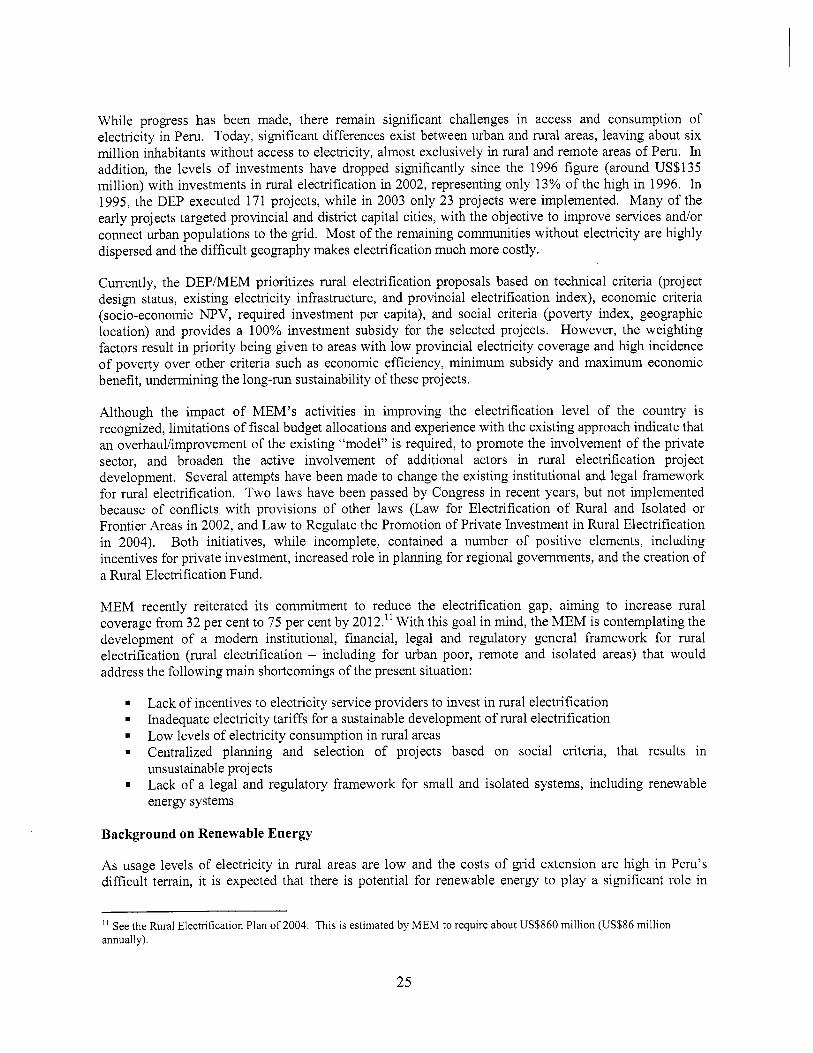
Whi le progress has been made, there remain significant challenges in access and consumption o f electricity in Peru. Today, significant differences exist between urban and rural areas, leaving about six mi l l ion inhabitants without access to electricity, almost exclusively in rural and remote areas o f Peru. In addition, the levels o f investments have dropped significantly since the 1996 figure (around US$135 mill ion) with investments in rural electrification in 2002, representing only 13% o f the high in 1996. In 1995, the DEP executed 171 projects, while in 2003 only 23 projects were implemented. Many o f the early projects targeted provincial and district capital cities, with the objective to improve services andor connect urban populations to the grid. Most o f the remaining communities without electricity are highly dispersed and the diff icult geography makes electrification much more costly.
Currently, the DEP/MEM prioritizes rural electrification proposals based o n technical criteria (project design status, existing electricity infrastructure, and provincial electrification index), economic criteria (socio-economic NPV, required investment per capita), and social criteria (poverty index, geographic location) and provides a 100% investment subsidy for the selected projects. However, the weighting factors result in priority being given to areas with l o w provincial electricity coverage and high incidence of poverty over other criteria such as economic efficiency, minimum subsidy and maximum economic benefit, undermining the long-run sustainability o f these projects.
Although the impact o f MEM’s activities in improving the electrification level o f the country i s recognized, limitations o f fiscal budget allocations and experience with the existing approach indicate that an overhaulhmprovement o f the existing “model” i s required, to promote the involvement o f the private sector, and broaden the active involvement o f additional actors in rural electrification project development. Several attempts have been made to change the existing institutional and legal framework for rural electrification. T w o laws have been passed by Congress in recent years, but not implemented because o f conflicts with provisions o f other laws (Law for Electrification o f Rural and Isolated or Frontier Areas in 2002, and L a w to Regulate the Promotion o f Private Investment in Rural Electrification in 2004). Both initiatives, whi le incomplete, contained a number o f positive elements, including incentives for private investment, increased role in planning for regional governments, and the creation o f a Rural Electrification Fund.
MEM recently reiterated i t s commitment to reduce the electrification gap, aiming to increase rural coverage f rom 32 per cent to 75 per cent by 2012.” With this goal in mind, the MEM i s contemplating the development o f a modern institutional, financial, legal and regulatory general framework for rural electrification (rural electrification - including for urban poor, remote and isolated areas) that would address the following main shortcomings o f the present situation:
. Lack o f incentives to electricity service providers to invest in rural electrification . Inadequate electricity tariffs for a sustainable development o f rural electrification . L o w levels o f electricity consumption in rural areas . Centralized planning and selection o f projects based o n social criteria, that results in unsustainable projects . Lack o f a legal and regulatory framework for small and isolated systems, including renewable energy systems
Background on Renewable Energy
As usage levels o f electricity in rural areas are l o w and the costs o f grid extension are high in Peru’s diff icult terrain, it i s expected that there i s potential for renewable energy to play a significant role in
See the Rural Electrification Plan o f 2004. T h i s i s estimated by MEM to require about US$860 mi l l ion (US$86 mi l l ion annually).
25

supplying rural electricity. Renewable resources abound: (a) in the highlands, the average solar radiation levels reach 5 k W m 2 / d a y , with small seasonal variations; (b) the wind velocity measurements in the coastal zone indicate average velocities o f 6 d s at 10 m level; (c) the hydroelectric potential i s vast, especially in the highlands and higher parts o f the jungle; and (d) the potential for biomass projects in the upper zone o f the jungle i s very promising. Groups such as the Intermediate Technology Development Group have carried out small-scale donor-financed projects to promote rural electrification using small hydropower, wind and solar energy, creating experience that the project can flu-ther build upon.
Work has been done by the MEM to investigate the potential o f renewable energy and promote i t s use within Peru. W i t h the assistance o f the UNDP/GEF assisted Solar Photovoltaic Based Rural Electrification Project, MEM has investigated solar resources, prepared a solar map, and i s in the process o f developing a GIS system that w i l l contain information o n solar resources and the populations that could be served by PV systems. MEM has also prepared norms for the design, operation and maintenance o f PV systems. A preliminary evaluation has been made o f geothermal energy and there i s a map o f potential locations. A preliminary investigation has been made o f wind power potential, and there are two turbines installed in the coastal areas o f Malabrigo and Marcona (the latter i s inoperative),
Although recently the Congress has passed a general law for the promotion and utilization o f renewable energy sources (Law No. 28546 o f June 16,2005), th i s law does not contain details o f how it would work, leaving most o f i t s application to future specific regulations. Also, there i s a law to promote geothermal energy, but it has never been made operational due to lack o f regulations. The Direccidn General de Electricidad (DGE) i s carrying out a study o n how to promote use o f renewable energy for electricity generation, but MEM has not yet developed an overall strategy for renewable energy utilization.
With respect to rural electrification, the majority o f rural electrification projects implemented thus far have been main grid extensions and in more isolated rural areas, the construction o f local diesel generators. The UNDP/GEF Project mentioned above i s expected to result in the installation o f about 7330 solar home systems in Peru, and to remove some o f the barriers to the use o f solar P V systems such as lack o f resource information, norms and capacity o f technicians.
Thus there has been litt le diffusion o f renewable energy systems in rural areas.
However, many barriers to rural electrification using renewable energy remain, including a lack of specific regulations by DGE and OSINERG to govern operation o f renewable energy systems, lack of capacity in regional governments and in distribution companies and suppliers to develop renewable energy rural electrification projects, a lack o f data and information o n renewable energy resources other than solar, a lack of systematic pol icy for renewable energy promotion in the MEM, and a lack o f promotion o f potential productive uses o f electricity f rom renewable energy.
New Proposed Rural Electrification Strategy Including Renewable Energy
The estimated required amount o f annual investments to achieve the goal o f increasing rural coverage from 30% to 75% by 2012, i s US$86 mill ion. The central government has been providing about US$40 mi l l ion f rom the l imi ted treasury hnds for this purpose; clearly not enough to achieve the indicated goal. The proposed Project wi l l test a new strategy, in parallel with DEP activities, aimed at leveraging the treasury funds and increasing economic efficiency in the sector and attract broader participation and financing from communities, regional governments and private enterprises. Such a strategy would need to: (a) encourage planning and implementation o f demand driven projects; (b) introduce rural electricity concessions wi th specific regulations to ensure the economic and financial viabil ity o f projects; (c) create incentive mechanisms for efficient rural electrification investments by existing and new distribution companies, and for local and regional governments to contribute toward subsiding investments; and (d) expand the use o f new technologies to serve remote populations, especially renewable energy.
26
In parallel to the preparation o f the proposed Peru Rural Electrification Project, the Wor ld Bank i s assisting MEM to prepare proposals to reform the Rural Electrification Sector in Peru. Under assistance f rom the Public Private Infrastructure Advisory Facility (PPIAF), a new general framework for rural electrification was proposed and agreed w i th major stakeholders at a workshop in January 2005, “Propuesta para un Nuevo Marc0 General para la Electrificacidn Rural en el Peru.” The general framework i s being used to assist preparation o f a new model law and regulatory framework for rural electrification, with PPIAF support.
The new proposed strategy reflected in the general framework would encourage planning and implementation o f demand driven projects. Regional and local governments would support demand evaluation and project planning at the regional decentralized levels. The strategy also aims to mobilize investments f rom communities, regional governments and the private sector to help co-finance these new rural electrification projects. Consequently, the new strategy would help address the current need for more efficient and decentralized planning and selection o f projects.
The strategy would create subsidy incentive mechanisms for rural electrification investments by existing and new distribution companies. To provide incentives for investment in rural electrification, the strategy proposes to create a Fund for National Rural Electrification, which would be an entity specifically created to manage the mobilization, management and disbursement o f funds for rural electrification. The Fund for National Rural Electrification would b e designated to provide a minimum subsidy for rural electrification projects, and mobilizeicatalyze other funds for project financing. Electricity service provision companies would propose rural electrification projects to the fund. The projects would compete for the subsidy, and would be evaluated o n economic efficiency criteria such as minimum capital cost subsidy and maximum economic benefit. The electricity companies, together w i t h local and regional governments, would identify, design, and propose projects to the fund. The electricity company also would provide an equity investment o n the rural electrification project in order to be eligible for the subsidy. The capital cost subsidy would therefore provide incentive to companies to participate in rural electrification projects, including companies in the private sector. This approach has been successfully used in several countries with diverse distribution models, including El Salvador and Chile (private sector distribution) and Ecuador (public sector distribution).
The new strategy wi l l also promote the participation o f small private sponsors/concessionaries, ensuring long-term financial sustainability and adequate rate o f return o n project equity contribution to these new rural electrification projects. Nevertheless, theoretical analysis and empirical evidence show that cost functions in electricity distribution exhibit important economies o f scale, increasing returns to scale and economies o f output and customer density. Therefore, existing distribution companies, already serving 12
l2 The costs o f a distribution system are the costs o f building and operating and maintaining the system o f service lines, mains and transformers. These costs depend upon: (i) the total number o f customers served; (ii) the maximum demand on the system; (iii) the size o f the distribution area; (iv) the capacity o f the transformers; (v) the length o f distribution lines; (vi) the total kWh sold; (vii) the price o f labor; and (viii) the price o f capital. Cost functions showing economies o f scale in the electricity distribution industry are we l l documented theoretically and in empirical research; see for example: Salvanes, K.G. and Tjotta, S.,1994, “Productivity Differences in Mul t ip le Output Industries: An Empirical Application to Electricity Distribution”, The Journal of Productivity Analysis, 5, 23-43; Power Technologies, Inc., 1966, “An Approach to Define the Smallest Viable Distr ibution Company with the Perspective o f Restructuring,” Commissioned by The World Bank, L A C Technical Department, Washington, DC; Thompson, H.G., 1997, “Cost efficiency in Power Procurement and Delivery Service in the Electric Utility Industry”, Land Economics, 73, 287-296; London Economics, 1999, “Efficiency and Benchmarking Study o f the N S W Distribution Businesses,” Commissioned by the Independent Pricing and Regulatory Tribunal of New South Wales, Sydney, Australia; Adonis Yatchew, “Scale Economies in Electricity Distribution: A Semiparametric Analysis”, Journal o f Applied Econometrics, Vol. 15, N o . 2, 2000, pp. 187-210; T. Jamasb and M. Poll itt, “Benchmarking and Regulation o f Electricity Distr ibution and Transmission Util i t ies: Lessons f r o m International
27

relatively extensive territory w i th an established customer base, have a natural economic efficiency advantage in expanding their service to new areas. Then, it i s expected that most o f the new rural electrification project proposals w i l l come from existing distribution companies.
Another objective o f the proposed new rural electrification strategy i s to introduce rural electricity concessions with specific regulations to improve the economic and financial viabil ity o f projects. A new institutional framework and regulations for grid-connected and off-grid rural electricity service are needed to improve the economic and financial efficiency o f the sector, including procedures for issuing rural concessions norms for electricity provision and service quality.
Furthermore, to ensure the economic and financial viability o f the new projects, the proposed new rural electrification strategy wi l l focus o n encouraging the distribution companies to extend their existing grids organically, focusing f irst o n those projects that are nearer existing grids that have existing or potential productive uses. These areas would be more densely populated than isolated rural areas and would have higher demand due to the current or potential productive activities in these areas. Part o f the sub-project selection criteria wi l l take into account the number o f connections (households) and the maximum economic benefit o f the project. This new approach would not only be more economically and financially viable, but also address the issues o f l o w electricity densification and l o w rural electricity consumption.
The final objective of this new strategy i s to expand the use o f new technologies to serve remote populations, especially using renewable energy. The strategy recognizes that given the l ow usage levels in rural areas, it would be more economically efficient to serve some o f the remote and isolated areas of the country, or areas where the population i s dispersed, using off-grid renewable energy technologies such as solar P V systems, or isolated grids where the electricity i s generated using renewable energy, e.g. small hydropower, wind power, or biomass power alone, or in combination with diesel. The strategy proposes to include fully renewable energy in al l aspects o f development o f the institutional framework, new concessions and regulations, to ensure that renewable energy technologies wi l l be used for provision o f electricity where these technologies would be more economically viable than grid extension or diesel mini-grids. Work under the PPIAF grant o n the general framework, the model law and the detailed framework s t i l l to be developed integrates fully renewable energy in al l aspects.
Experience,” in DAE Working Paper. Cambridge, U.K.: Department of Applied Economics, Univ. Cambridge, 2001; and M. Filippini, J. Wild, and M. Kuenzle, “Scale and cost efficiency in the Swiss Electricity Distribution Industry: Evidence from a Frontier Cost Approach,” in CEPE Working Paper 8. Zurich, Switzerland, 2001.
28
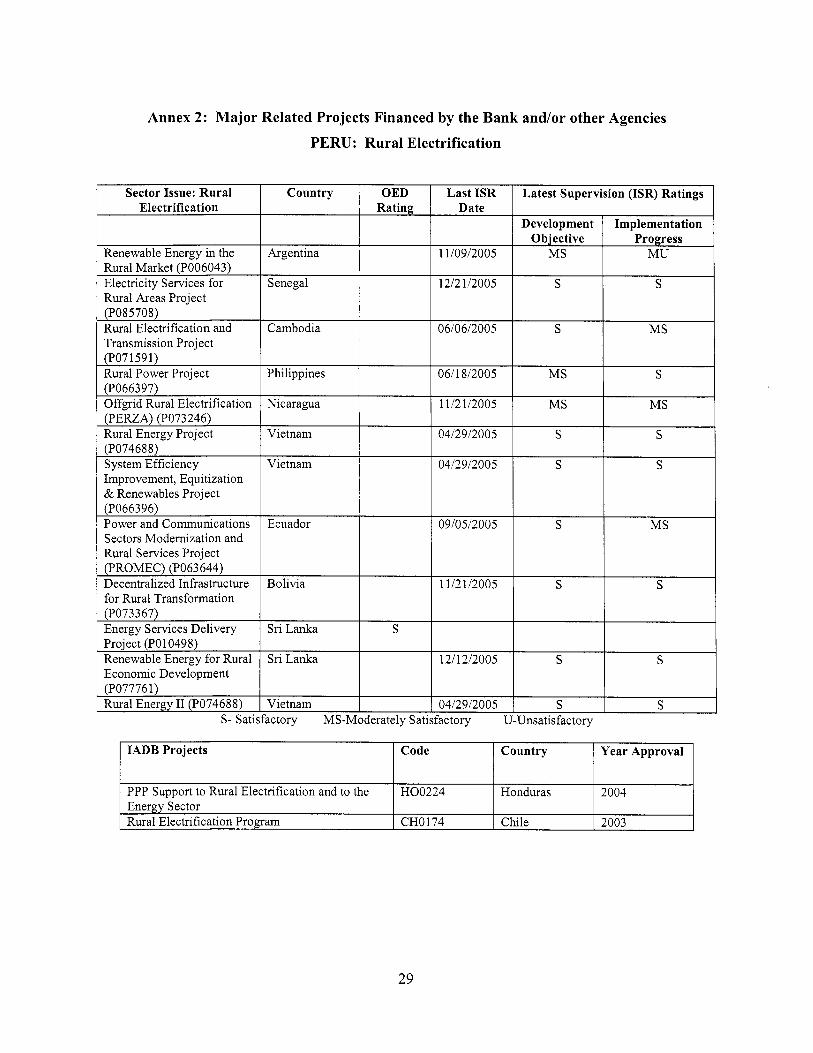
Annex 2: M a j o r Related Projects Financed by the B a n k a n d o r other Agencies PERU: R u r a l Electrification
Last ISR Date
Sector Issue: Rural Electrification
Latest Supervision (ISR) Ratings
Development I Implementation
Renewable Energy in the Rural Market (P006043) Electricity Services for Rural Areas Project (P085708) Rural Electrification and Transmission Project (PO7 159 1) Rural Power Project (P066397) Offgrid Rural Electrification (PERZA) (P073246) Rural Energy Project (P074688) System Efficiency Improvement, Equitization & Renewables Project (P066396) Power and Communications Sectors Modernization and Rural Services Project (PROMEC) (P063644) Decentralized Infrastructure for Rural Transformation (P073367) Energy Services Delivery Project (PO1 0498) Renewable Energy for Rural Economic Development
1110912005
(P077761) Rural Energy I1 (P074688)
S- Sati,
Objective Progress MS MU
Country
1212 112005
0610612005
0611812005
1112112005
0412912005
0412912005
OED Rating
S S
S MS
MS S
MS MS
S S
S S
Argentina
IADB Projects
PPP Support to Rural Electrification and to the Energy Sector Rural Electrification Program
Senegal 7
Code Country Year Approval
H00224 Honduras 2004
CHO 1 74 Chile 2003
Cambodia 7 Nicaragua
Vietnam
Vietnam ictory MS-Moderately Satj
29
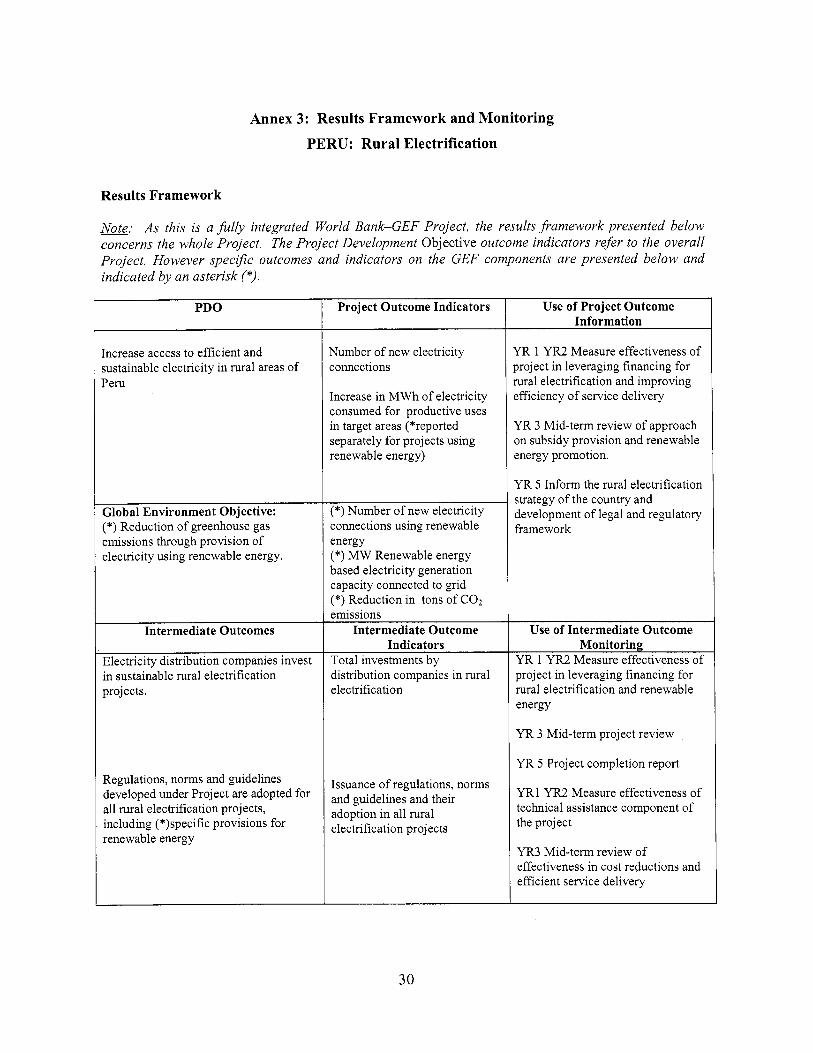
Annex 3: Results Framework and Monitoring
PERU: Rural Electrification
Results Framework
N s : As this is a fully integrated World Bank-GEF Project, the results framework presented below concerns the whole Project, The Project Development Objective outcome indicators refer to the overall Project. However speciJic outcomes and indicators on the GEF components are presented below and indicated by an asterisk (*).
PDO
I Increase access to efficient and sustainable electricity in rural areas o f Peru
I
Global Environment Objective: (*) Reduction o f greenhouse gas emissions through provision o f electricity using renewable energy.
Intermediate Outcomes
Electricity distribution companies invest
projects. r in sustainable rural electrification
Regulations, norms and guidelines developed under Project are adopted for a l l rural electrification projects, including (*)specific provisions for renewable energy
Project Outcome Indicators
Vumber o f new electricity :onnections
[ncrease in MWh o f electricity :onsumed for productive uses in target areas (*reported separately for projects using renewable energy)
(*) Number o f new electricity connections using renewable energy (*) MW Renewable energy based electricity generation capacity connected to grid (*) Reduction in tons o f COZ emissions
Intermediate Outcome Indicators
Total investments by distribution companies in rural electrification
Issuance o f regulations, norms and guidelines and their adoption in a l l rural electrification projects
Use of Project Outcome Information
YR 1 YR2 Measure effectiveness o f xo ject in leveraging financing for mral electrification and improving zfficiency o f service delivery
YR 3 Mid- term review o f approach on subsidy provision and renewable energy promotion.
YR 5 I n fo rm the rural electrification strategy o f the country and development o f legal and regulatory framework
Use o f Intermediate Outcome Monitoring
YR 1 YR2 Measure effectiveness o f project in leveraging financing for rural electrification and renewable energy
YR 3 Mid- term project review
YR 5 Project completion report
YR1 YR2 Measure effectiveness o f technical assistance component o f the project
YR3 Mid- term review o f effectiveness in cost reductions and efficient service delivery
30

PDO
Communities, Munic ipa l and Regional Governments collaborate with distribution companiesiproject sponsors to develop rural electrification projects
Rural populations in targeted project areas (* including renewables) use electricity for productive activities
provide funds for small hydro generation investments
Project Outcome Indicators
Number o f proposals approved for financing by the project
Number o f enterprises adopting electricity in targeted areas
Investment in electricity consuming equipment made by enterprises.
(*) MW o f small hydropower installed; MWh o f renewable electricity produced by these plants
Use of Project Outcome Information
YR1, YR2 Measure effectiveness o f capacity building for stakeholders
YR 3 Mid- term review o f technical assistance
YR 5 In fo rm country’s rural electrification and renewable energy strategy
YR1 YR2 Measure effectiveness o f productive uses component
YR 3 M id - te rm review o f components design and implementation
YR 5 I n f o r m rural electrification strategy that would contemplate specific productive uses promotion activities YR 2 Measure effectiveness o f small hydro financing faci l i ty YR 4, YR 5 Measure effectiveness o f refinancing mechanism
31
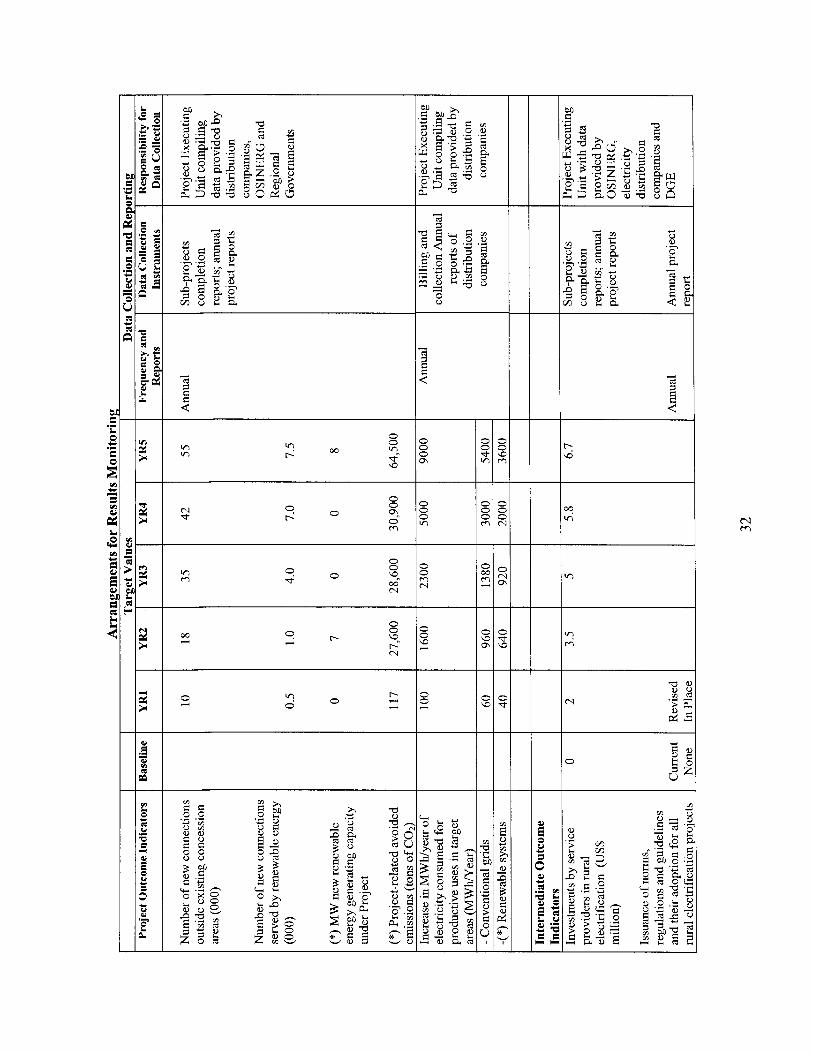
0
L c E
.- E
.c +
s + c c
: h P L
U +
E : E I L
a 0 0
2 9 F
cu
F 3 d
v! 0 0
'0 m
hl
0
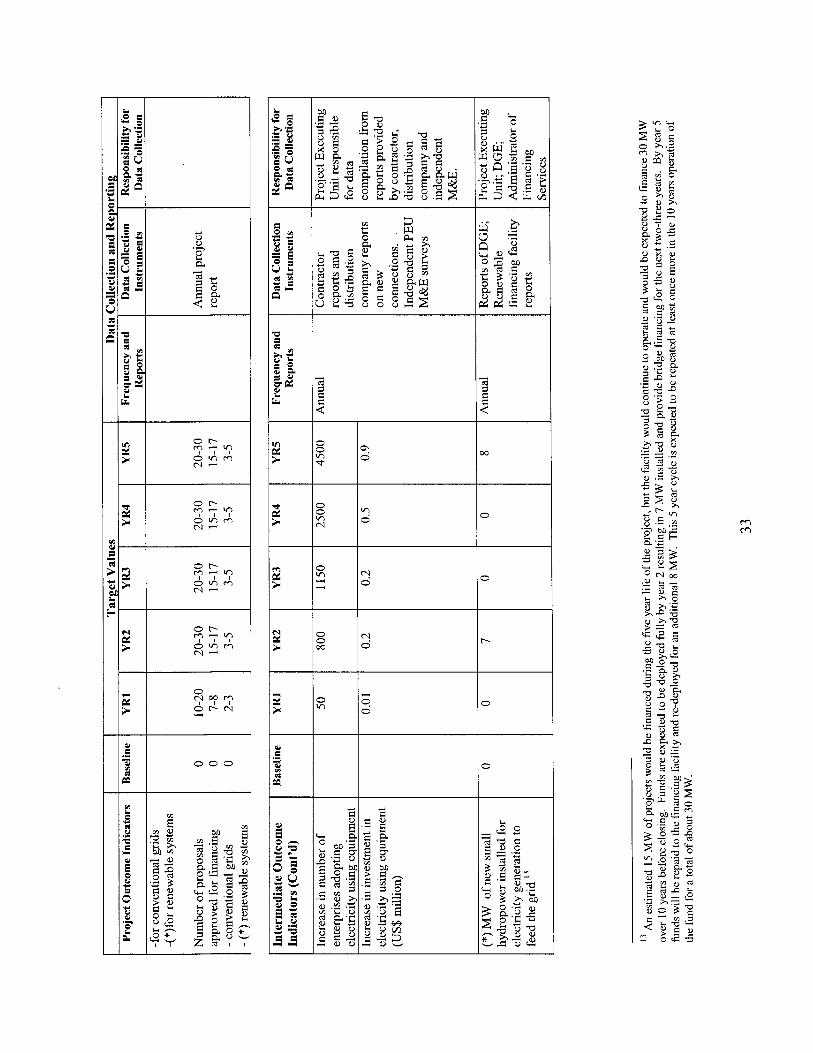
2
3 m m
3
0 m 3
3
3
2 * -
a *
0 0 CQ 2 r
3 z 0 m 0
0 0 0 0

A n n e x 4: Detai led Project Description
PERU: Rural Electrif ication
The project seeks to increase access to efficient and sustainable electricity services in rural areas o f Peru. T o achieve th i s objective the project would actively engage a l l stakeholders whi le allocating to the electricity service providers a central role o f responsibility in the scheme. To ensure sustainability and efficiency, electricity providers would be responsible for the identification, design, investment co- financing, and long-term operation o f projects under the existing -or any future, specifically adapted to rural areas- electricity concession system. Communities, local and regional governments would: (a) coordinate wi th electricity providers in the identification, prioritization and planning o f specific sub- projects, and (b) possibly provide co-financing for sub-projects. The central government through the Project Executing Unit would be responsible for the competitive selection o f projects and the provision o f capital investment subsidies under transparent procedures. The regulatory body fOSINERG), together with the Directorate General of Electricity (DGE) o f the Ministry o f Energy and Mines, would be responsible for appropriate norms and guidelines for rural electrification projects, as wel l as monitoring the service delivery.
The project components are aligned with the above project design and the allocation o f roles among different stakeholders: Component I refers to the specific investments for rural electrification sub- projects; Component 2 refers to technical assistance activities for stakeholders; Component 3 aims to enhance the economic and financial sustainability o f electrification by promoting productive uses for electricity; Component 4 addresses a key barrier in the implementation o f small hydropower generation investments -- lack o f appropriate financing in the early risk stage o f projects; and Component 5 concerns project management needs.
Component 1 - R u r a l Electrification Sub-projects (Estimated cost US$114.325 million, US$43.375 million IBRD, no GEF):
Overall Description. The investment component o f the Rural Electrification Project i s financed by a Wor ld Bank loan, counterpart funds from the government o f Peru, investments by electricity service providers, and grant contributions by regional and local governments. The component provides capital cost subsidies for part o f the investment cost o f rural electrification sub-projects that would be implemented by qualified electricity services providers to extend services to rural consumers.
Rural electrification sub-projects are defined as projects to provide service to new customers in rural areas outside o f existing concession areas, where the obligation to serve i s not mandatory. Examples o f such projects would be extension o f the existing grid to serve new customers grid (from the interconnected system or isolated networks), establishment o f new isolated systems with diesel or small hydro generation, or provision o f service to customers w i th individual renewable energy systems such as solar PV systems. Other types o f projects that meet the definition would be considered.
Prior to receiving a subsidy, the service provider would need to have an electricity concession, which ensures adequate experience and technical, commercial and financial capacity.
The geographical scope o f the Project i s national; a service provider can make an application for a subsidy for any project that meets the eligibil i ty criteria described below.
Project Procedures. The Project would provide a grant o f up to 90% o f the capital cost o f the rural electrification sub-proj ect. The electricity service provider must also invest. The subsidy would be
34
determined as the amount needed to provide a 12% rate o f return o n the share o f the investment provided by the electricity service provider at current tariffs. Any regionalAoca1 government grant contribution would reduce the subsidy required from the central government and increase the l ikelihood o f sub-proj ect selection. The service provider must have an electricity concession to receive the subsidy.
The service provider would present a detailed profi le o f the Project including financing plan, with evidence o f commitment with application for subsidy. Other Project components would support preparation o f feasibility studies for the f i rs t sub-proj ects proposed using renewable energy. Training and capacity building would also be provided to MEM, electricity service providers, regional and local governments for project implementation and supervision. Productive use pilots, including in health centers, schools, etc., would be promoted through targeted technical assistance.
MEM would s i g n a sub-project agreement with the electricity service provider, governing rights and responsibilities o f a l l parties. The sub-proj ect installations would be owned by the electricity service provider.
There would be two types o f criteria for sub-projects to be financed under the Project. All projects would be required to meet a set o f eligibil i ty criteria. If the amount o f subsidy required for eligible sub-projects i s greater than the amount available in a given evaluation period (two or three times per year), there would also be criteria for prioritization. Criteria would be specified in the operational manual and then adjusted w i th experience, based o n mutual agreement between GoP and Bank. Illustrative criteria are supplied below.
Eligibility criteria for sub-proj ects to receive a subsidy are: - - - - -
profi le sub-proj ect document i s complete, including safeguards screening; sub-project connects at least 1000 new electricity customers; sponsor makes a minimum investment o f 10% o f total capital cost; economic rate o f return i s above SNIP requirement (currently 14%); subsidy required i s n o more than US$SOO per connection.
T o maximize the impact o f central government funds, the principal prioritization criterion for sub- projects i s minimum central government subsidy per connection.
The above procedures would apply to both public and private sector projects. However, the lack o f a legal framework for the direct provision o f investment subsidies, or the transfer o f funds or assets (and some taxation implications), i s the principal outstanding issue for private sector participation. In the case of public companies, th i s situation could be solved by considering the subsidy as a capital infusion by the Government, or the transfer and holding o f assets by ADINELSA. In countries such as Chile and El Salvador, specific legal provisions have been adopted to overcome these problems and allow the Governments to provide these subsidies for rural public infrastructure. TA i s underway and would be continued within the Project to obtain similar exemptions in Peru. In'order to prevent inordinate delays in private sector participation, the fallback option o f proceeding through bidding o f concessions would be adopted within a year o f effectiveness if no private sector proposals have been financed under the Project.
Component 2 - Technical Assistance for R u r a l Electrification (Estimated cost US$3.75 million of which US$O.75 million IBRD and US$2.5 million GEF):
Overall Description. This component i s designed to provide the technical support and build the capacity o f a l l project participants, in order to ensure that the Project i s successful. I t includes sub-components to improve the regulatory environment, build capacity o f project participants, promote private sector investment and promote renewable energy as described below:
35

a. Regulations and norms. The electricity concessions law o f Peru, and the subsequent development o f regulations, has focused primarily o n provision o f electricity in urban areas. As a result, standards o f design, construction and quality when applied to rural areas cause over-sizing and over-designing o f systems which in turn tend to rise per unit costs and hinder the economic viabil ity o f projects. Furthermore, the lack o f a legal framework for the direct provision o f investment subsidies and the transfer o f assets o f rural electrification projects implemented by the DEP, forced the creation o f ADINELSA as a public company wi th the sole objective o f holding the ownership o f the assets created by these public investments. ADINELSA has n o mandate to operate and maintain the systems, therefore they s i g n management agreements with municipalities and other institutions to administer the assets and provide electricity service. Some DEP projects were transferred to public distribution companies as equity contribution, causing complaints f rom these companies, considering the non profitability o f the projects. This arrangement i s considered unsatisfactory and the Government i s searching for an adequate solution. In addition, the option o f using renewable energy in electricity provision remains largely underused and i t s potential i s not sufficiently exploited. Taking into consideration the above situation, t h i s component aims to address these issues through the provision o f technical assistance to develop and implement appropriate norms and guidelines for rural electrification including specific treatment o f renewable energy. The component i s expected to include activities such as:
0 Legal and regulatory arrangements for direct investment subsidies and transfer o f rural electrification assets; Concessions Regulations for Electricity Service Provision in Rural Areas; Regulations for Monitoring and Supervision o f Electricity Service Provision in Rural Areas; Tariff System for Grid-Connected and Off-Grid Renewable Energy Project; Product and Service Quality Regulations for Rural Electrification; Design and Construction Guidelines for Grid Extension Rural Electrification; Design and Construction Guidelines for Off-Grid Rural Electrification w i th Renewable Energy Sources.
0
0
0
0
0
b. Capacity building for stakeholders. Rural electrification has been so far mainly organized and delivered through the largely centralized mechanism o f the DEP. This component therefore aims to assist the various stakeholders that would have to work together under the proposed Project design. This component would strengthen the capacity o f local and regional governments to identify, plan and prioritize adequate projects in cooperation wi th the electricity service providers who would be ultimately responsible for the construction and operation o f projects. The Project would also strengthen the capacity o f service providers to propose projects, especially projects using renewable energy. The Project would assist the selection o f appropriate, least-cost technologies --such as renewable energy-- to electrify remote areas, or regions with dispersed populations, where grid extension would not be economically viable. The component i s expected to include activities such as:
0
0
0
0
Development and Implementation o f a GIs-Based Project Information System; Development o f Sectoral Institutional Structure in Regional (and Local) Governments; Capacity Building and Training in Sub-Proj ects Development Procedures in Regional (and Local) Governments; Capacity Building and Training for Development o f Electricity Distribution Business Plans for N e w Sub-projects Sponsors;
36

0
0
0
Capacity Building and Training for Sub-projects Technical Development for Existing Service Providers; Capacity Building and Training for Development o f Renewable Energy Sub-Projects; Computer Hardware and Software Support for Regional (and Local) Governments.
c. Promotion of Private Sector Participation: W h i l e the distribution companies serving L ima are currently private, the majority o f the existing distribution companies serving rural areas are in the public sector. This component aims to catalyze the participation o f new private entities in rural electricity distribution. This could include private distribution companies f rom L i m a or other countries, or companies in other sectors such as mining. I t i s expected to include activities such as the following:
Def in i t ion o f Legal and Regulatory Measures for Provision o f Capital Cost Subsidies to Private Sector Service Providers; Development o f a Project Bidding Mechanism for Private Participation in RE Projects; Preparation o f Bid Packages for Concessions; Capacity Building and Training for Development o f Electricity Distribution Business Plans for N e w Private Sub-projects Sponsors; Public Awareness and Promotion o f the Project's Renewable Energy Financing Facility; Development o f Electrification Projects as Part o f Private Investments in Other Sectors L i k e Mining, Agribusiness and Others; Business Development Activities for Identifying Potential Private Investors in Electrification.
d. Renewable Energy Promotion: Annex 15 contains an analysis o f the barriers to introduction o f renewable energy to Peru. The various components o f the Project are designed to remove a number o f barriers for renewable energy in Peru. Each o f the above components addresses selected barriers. This component would address specifically the lack o f reliable renewable energy data and information, specific policies to promote renewable energy in the country, and awareness among the general population and stakeholders. This component would focus on renewable energy for rural electrification and supply to the rural grid, especially using small hydropower due to the resource availability in many areas o f Peru. This component would include support to specific activities such as the following:
Development o f Capacity within MEM/DGE for Renewable Energy Promotion; Measurement and Other Technical Equipment for Evaluation o f Renewable Energy Sources; Complementary Evaluation o f Potential o f Renewable Energy Sources for Electricity Generation (mainly small hydropower); Development o f Policy and Regulatory Incentives and Overcoming Barriers for Renewable Electricity and Distributed Generation; Development o f Pre-Feasibility and Feasibility Renewable Electricity Projects; Development o f Financing Mechanisms for Renewable Electricity Projects Implementation; Development o f Public Awareness and Promotional Printed Material Regarding Renewable, Clean and Sustainable Energy Development; Public Conferences, Seminars and Technical Presentation o n Renewable Energy.
37

Component 3 - Pilot Program to Promote Productive Uses of Electricity (Estimated cost US$3.95 million of which US$2.0 million IBRD and US$1.5 million GEF):
There i s almost unanimous agreement that energy plays an important role in increasing productivity o f enterprises and in improving livelihoods. In the context o f rural areas, th i s generally implies productive use o f energy for the provision o f power for agricultural and small industrial or commercial uses. For example, motors are used to grind grain, operate power tools, irrigate farmland, process agricultural produce, and facilitate many commercial activities. Electric power can result in productivity gains and economic growth, thus transforming the underdeveloped rural landscape - if ancillary services such as market access, human and enterprise capacity, financial services, and resources/raw materials are available. F rom an electricity service company viewpoint, productive uses are essential to establish the long-term economic viabil ity and sustainability o f rural electrification.
Load factor and capacity utilization in rural areas o f Peru are currently low. Power demand peaks usually occur at night whi le daytime loads are minimal, indicating that electric power i s mainly used for domestic lighting and appliances (e.g. radio, TV). Load factors are often under 50%, and sometimes under 25%. For example, Electrosur reports that in i t s rural service areas, the load factor i s only around 25% with a two hour evening peak f rom 6-8pm. Many hydro grids have similar l o w load and capacity factors. According to MEM data, 50% of the hydropower plants with total installed capacities o f 580 MW have capacity factors less than 60% (implying that daytime loads are typically less than 50% o f peak generation capacity).
Achieving increases in productive uses o f electricity in rural areas confronts constraints o n both the supply (electricity service company) and demand (enterprise) side. O n the enterprise side these have included: (i) lack o f knowledge o n adopting electricity to improve productivity; (ii) inadequate access to investment financing to obtain an electricity connection and electric equipment; (iii) lack o f trained personnel; (iv) uncertainties or difficulties with regard to increased availability o f raw materials or access to larger markets; and (v) lack of knowledge in dealing with the electricity service company. O n the electricity service company side, these have included: (i) the selection criteria for rural electrification areas, w h c h in the past did not explicitly include existing or potential productive uses; (ii) the lack o f 24- hour service in some isolated systems (particularly true in the case o f municipal isolated grids in Peru); (iii) service quality, particularly outages and voltage fluctuations; (iv) delays in responding to business requests for connections and upgrading o f contracted power; (v) the tar i f f structure which hinders both init ial connection and the expansion o f installed capacity; and (vi) an incentive structure which does not encourage electricity service company staff to promote productive uses.
The component concept i s based o n several successful productive uses promotion projects in Peru, including the Marenass Project and the Incagro Project (by the Ministry o f Agriculture); the Corredor Puno-Cusco Project (by FONCODES and MIMDES); as wel l as the Rural Business Services component in the Indonesia Second Rural Electrification Project financed by the IBRD. Principal lessons from these projects are that targeted marketing interventions and price incentives which address information constraints and business needs o f small enterprises in rural areas are effective in load promotion. Furthermore, for success, cooperation and support f rom the local electricity service company i s essential to facilitate grid connections. Access to investment resources are also needed to finance the switch to electricity.
The objective o f this Productive Uses Promotion component i s to contribute to increase the productivity o f rural businesses by promoting a more intensive use o f electricity, which would in turn improve living conditions in rural areas o f Peru, as wel l as improve the uti l ization o f electricity supply infrastructure and electricity service company revenues. Priority would be given to those energy intensive operations that
38
currently employ diesels or other power sources, and those with strong potential for electricity use if additional value-added processing i s done in the region.
Since this component i s financed both by IBRD and GEF, the component would focus o n two distinct “market” segments: (a) isolated hydroelectric grids or hydroelectric-dominated grids where GEF assistance would be offered; and (b) other rural grids, isolated or interconnected where IBRD resources would be deployed. Target areas would be selected based o n four criteria: (i) l o w load factor in the grids serving the regions due to underutilized capacity, and not due to supply side constraints, and an electricity service company w i th interest and commitment to support productive uses promotion; (ii) presence o f a significant potential for energy intensive productive activities in farm and off-fann enterprises that might benefit from a shift to electricity; (iii) existence o f basic supporting infrastructure; (iv) for the renewable energy-focused “market” segment, service areas predominantly supplied with renewable energy-based electricity. Screening o f candidate areas based o n the four criteria noted above i s being undertaken during preparation. The MEM would approve the target areas.
The proposed approach for this component relies o n providing cost-shared and targeted technical assistance to entrepreneurs, associations or communities in rural areas interested in expanding their businesses through the use o f electric energy. The proposed approach i s broadly one o f capacity building. I t i s a marketing approach in the broadest sense - identifying target markets and segments; increasing awareness and sk i l ls , assisting potential productive users, user groups and communities to identify opportunities, barriers and solutions; working closely with the electricity service suppliers to ease access; and facilitating access to other necessary services, including financing.
The proposed core steps in designing a marketing-based productive uses program could be as follows: (i) conduct diagnostic to screen for promising areas/communities with significant opportunities for increased productive uses o f electricity where there are n o electricity supply constraints; (ii) identify constraints to productive uses in these areas and develop approaches to mitigating the barriers; and (iii) test them out in several marketing pilots, evaluate, adjust, reiterate, replicate.
The implementation approach proposed i s that the productive uses capacity building activities be implemented o n a campaign-like basis in the different areas that would include: (i) having the P E U lead the effort with support f rom an organization (either an NGO or private company), t o administer the program, and supervise and coordinate the work o f a number o f regionally-based consultants; (ii) giving the beneficiaries key decision making authority in selecting services and service providers, with appropriate guidance and ensururing the cost sharing o f services; (iii) using locally based implementers as much as possible, with guidance and support as necessary f rom others. They would use locally appropriate promotional and instructional materials, and standardized material; (iv) working collaboratively w i th and building alliances with the critical facilitative services and with the electricity service company to resolve issues and ensure support services are available.
Component 4 - Small Hydropower Financing Facility (Estimated cost US$15.0 million, of which US$5 million is from the GEF):
Peru i s a country with significant hydroelectric resources due to i t s geography (Andean mountain range) and climatic conditions. In addition, various irrigation projects and water resources management projects have already created c i v i l engineering structures that could result in competitive hydroelectric generation in small and micro schemes. Through i t s carbon financing activities in the country, the Wor ld Bank has reviewed a significant number o f privately sponsored small hydro schemes that would be viable and could l ikely provide least-cost solutions for supply o f electricity in Peru. Nevertheless, although the financial system in Peru i s relatively liquid, commercial banks are not experienced, and in general are unwilling to provide financing o n a project recourse basis. Project sponsors, therefore, have to finance projects fully
39

o n equity, borrowing on their balance-sheet, or pledging other assets for collateral. This has created significant financing barriers to investment in small hydro plants for sale to the grid, despite the viability o f the potential projects.
This project component would address the above barriers by using GEF funds to leverage private and commercial debt financing for small hydro generation plants to supply electricity to the grid. The project would provide bridge-financing for small hydro plants during the period o f construction and init ial operation, after which the loan would be refinanced by commercial banks. The project sponsor would provide an equity contribution (at a minimum o f 30% o f total capital cost) while the GEF funds (as wel l as other commercial financing) would provide debt finance for the remainder, during the period o f construction and init ial operation. The debt component o f the GEF would then be refinanced by commercial financial institutions, after the construction risk had been eliminated. This component would not finance electricity connections or distribution grids, which would be financed only under Component 1.
The facility would include an investment decision-making function and a separate revolving loan facility under a financial administrator-- to handle the disbursement and recuperation o f specific project loans (lending “back-office’’ functions). A qualified company would be competitively selected to act as Fund Manager with responsibilities that would include: marketing and promotion o f the facility, preliminary screening o f project proposals, detailed evaluation and due diligence o n projects, negotiation o f conditions and terms for specific loans and supervision o f investments. A separate three-member Investment Committee would be appointed by the Project Directory Committee to approve investments proposed by the Fund Manager. For approved investments, the disbursement and repayment o f the loans would be handled through an administrative financial agreement w i th a qualified bank.
Project sponsors would present hydro projects to the facility which would evaluate them o n the basis o f their financial, technical and economic soundness. Qualified projects would be presented to the Investment Committee for f inal approval. Once investments are approved, the financial management functions o f the lending operation would be handled under an administrative financial agreement. At the end o f the construction and in i t ia l operation period, the debt would be financed by commercial financial institutions. The financing o f small hydro would be possible because an already constructed and operating hydro system i s a valuable asset, which can be used as collateral to comply wi th the requirements o f commercial banks. Because o f the minimum equity requirement under t h s financing scheme, an operating plant would have a value o f about 140% o f the debt component to be refinanced.
The facility would continue i t s operations after the project i s completed for another f ive years under similar rules aiming to continue leveraging financing. The costs o f the administrative financial agreement would be covered after the init ial operation period through revenues f rom interest payments. It i s estimated that during the ten years o f the operation o f the facility, at least 30 MW o f small hydro projects would be thus financed, whi le it i s expected that as the scheme proves the concept o f project financing for small hydro systems, financial institutions would increasingly start to provide funds for such schemes assuming earlier project risk. At the end o f the period, after financing about 30 MW o f renewable energy projects, i t i s expected that funds would s t i l l be available in the facility. At that time, the GoP and the Wor ld Bank, in consultation with the GEF Secretariat, would agree o n the further use o f any remaining funds in accordance with GEF Climate Change Mit igat ion objectives.
40

Component 5 - Project Management (Estimated cost is US$6.4 million of which US12.75 million is IBRD and US$I million is GEF):
This component would include support for overall management o f the proposed Project including the Project Executing Unit which would consist o f a Project Manager; an administrative unit w i th staff to handle procurement and financial management; a technical unit that would evaluate sub-proj ect applications and oversee the functioning o f the finance facility and the productive uses component; and a monitoring and evaluation unit. I t i s expected that the actual administration o f the subsidy and the renewable energy finance facility would be carried out by a qualified bank under an administrative financial agreement.
41

Annex 5: Project Costs
PERU: R u r a l Electrification
42
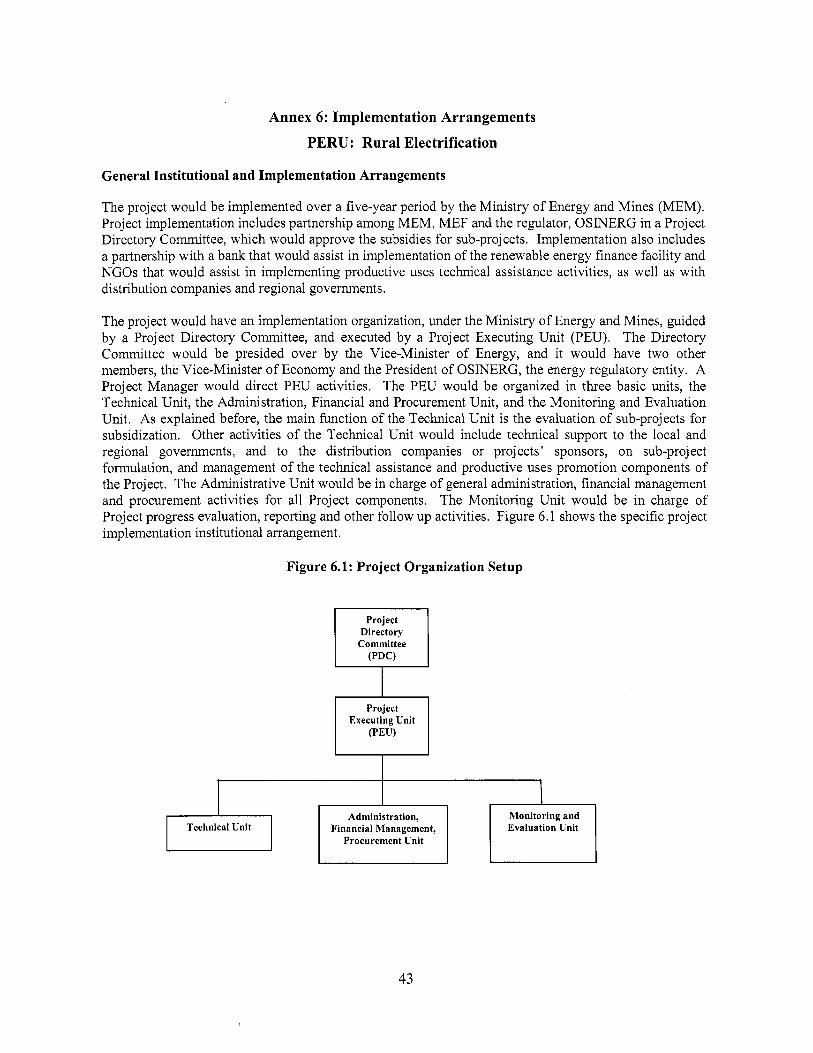
Annex 6: Implementation Arrangements
PERU: Rural Electrification
General Institutional and Implementation Arrangements
The project would be implemented over a five-year period by the Ministry o f Energy and Mines (MEM). Project implementation includes partnership among MEM, MEF and the regulator, OSINERG in a Project Directory Committee, which would approve the subsidies for sub-proj ects. Implementation also includes a partnership with a bank that would assist in implementation o f the renewable energy finance facility and NGOs that would assist in implementing productive uses technical assistance activities, as wel l as w i th distribution companies and regional governments.
The project would have an implementation organization, under the Ministry o f Energy and Mines, guided by a Project Directory Committee, and executed by a Project Executing Unit (PEU). The Directory Committee would be presided over by the Vice-Minister o f Energy, and i t would have two other members, the Vice-Minister o f Economy and the President o f OSINERG, the energy regulatory entity. A Project Manager would direct P E U activities. The PEU would be organized in three basic units, the Technical Unit, the Administration, Financial and Procurement Unit, and the Monitor ing and Evaluation Unit. As explained before, the main function o f the Technical Unit i s the evaluation o f sub-projects for subsidization. Other activities o f the Technical Unit would include technical support to the local and regional governments, and to the distribution companies or projects’ sponsors, o n sub-project formulation, and management o f the technical assistance and productive uses promotion components o f the Project. The Administrative Unit would be in charge o f general administration, financial management and procurement activities for a l l Project components. The Monitor ing Unit would be in charge o f Project progress evaluation, reporting and other follow up activities. Figure 6.1 shows the specific project implementation institutional arrangement.
Figure 6.1: Project Organization Setup
Project Directory Committee
Executing Unit
2 I Technical Unit Administration,
Financial Management, Procurement Unit
Monitoring and Evaluation Unit
43

R u r a l Electrification Sub-projects
I Contractors
Public intervention in rural electrification requires interactions between different institutions, f rom the central government to the final beneficiaries. In the case o f a particular project i t s institutional organization must manage and guide these interrelations. The implementation o f the proposed Project reflects th i s situation at different levels. First, rural electrification sub-proj ects would compete for the subsidy. Sub-projects to be presented for financing under the project would be prepared, starting at the community where the demand for electrification i s manifested. The community may request electricity service either directly f rom the service provider, or f rom the local or regional government. If requested f rom the local or regional government, these requests would be init ially screened by the local (municipalities) and regional governments that would define regional priorities and interest in project co- financing. The local or regional government would coordinate with the existing regional distribution company or with a qualified project sponsor (h ture service provider/distribution concessionary), for project preparation and submission to the Project Executing Unit for evaluation. The Project would be open to, and would promote the participation o f newly created private sponsorsiconcessionaries, while ensuring sub-proj ects long-term financial sustainability and adequate rate o f return o n project equity contribution. Sub-projects selected for subsidy would be contracted for construction and subsequently operated and maintained by the service provider. Figure 6.2 shows the overall institutional arrangement,
Existing or Potential
Provider ' Electricity Service 4
Figure 6.2: Overall Rura l Electrification Sub-project Implementation Arrangements
Project Executing I Unit '+' 4 7 1 Participating
Regional Government Government
I I
I Community /Users
The second institutional arrangement deals with sub-proj ect preparation, evaluation, prioritization, selection and subsidy allocation by the Project. For the proposed sub-project, the electricity service providers would prepare documentation fo l lowing standard guidelines, at the level o f a detailed profile, including an analysis o f demand and estimation o f length of distribution lines. The Technical Unit o f the P E U would be in charge of carrying out a detailed technical, economic and financial evaluation o f sub- projects, preparing a prioritized l i s t of selected projects and estimating the init ial amounts o f sub-projects' subsidies. The Technical Unit would prepare an evaluation and recommendation report to be considered by the Directory Committee. The Directory Committee would approve the selected sub-projects and the subsidy amount. T o implement the selected sub-projects, a sub-project agreement would be signed between MEM and the electricity service providers that would carry out the sub-projects. T o ensure economic efficiency in sub-proj ect implementation, their construction would be bid out by the service providers. Details o f the roles and responsibilities are given below. Figure 6.3 shows the sub-projects' processing cycle.
44
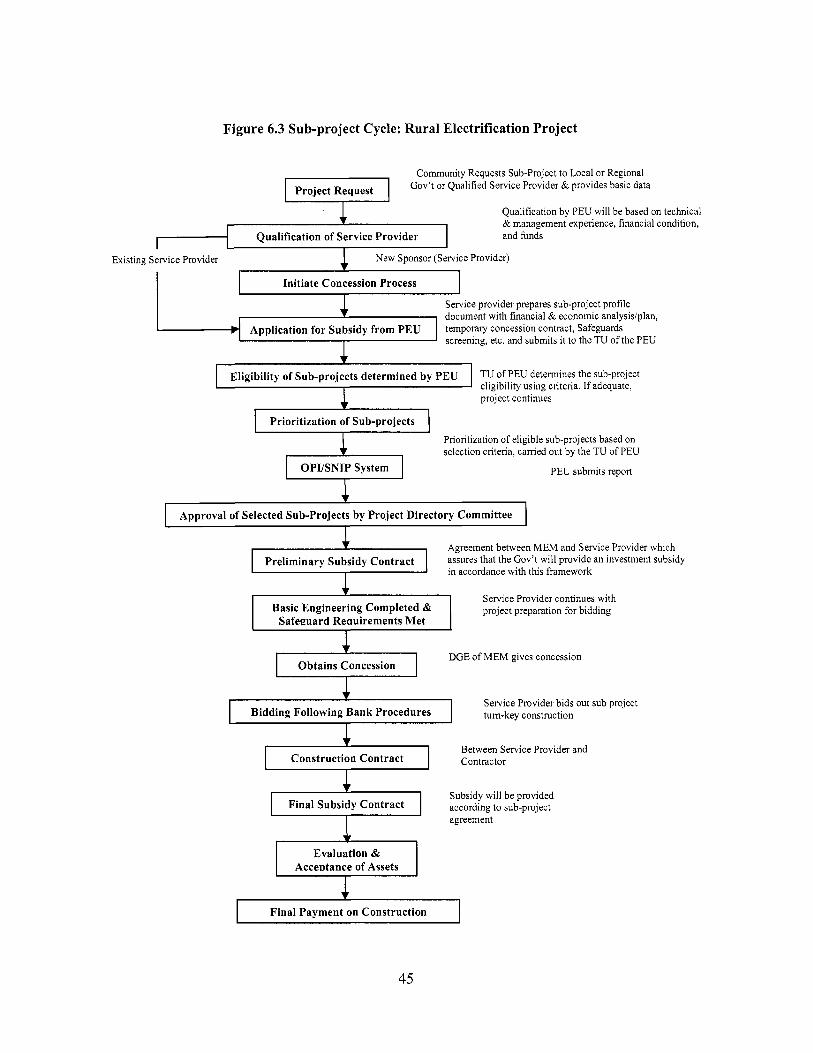
F igu re 6.3 Sub-project Cycle: R u r a l Electr i f icat ion Project
Pro.ject Request Gov’t or Qualified Service Provider &provides basic data
Qualification of Service Provider and funds
Subsidy will be provided according to sub-project agreement
Eligibility of Sub-pro,jects determined by PEU
Evaluation &
TU of PEU determines the sub-project
I Final Payment on Construction 1
OPI/SNIP System
45
PEU submits report
Basic Engineering Completed & Safeguard Reauirements Met
Service Provider continues with project preparation for bidding
Bidding Following Bank Procedures Service Provider bids out sub project turn-key construction
Construction Contract Between Service Provider and Contractor

Project Executing Unit of MEM: The P E U i s responsible for: 0
0
0
0
0
0
0
0
Creation o f awareness among communities, provincial authorities, other national agencies and other donors; Capacity building o f regional and local governments, electricity service providers, communities; Evaluation o f subsidy proposals according to criteria set forth in Section 3, and presenting the selected projects to the Directory Committee; Ensuring that each sub-project conforms to GoP and Bank environment and social safeguards, as required; Preparing a sub-project agreement for each sub-project, between MEM, the electricity service provider and third party investors, if any; Supervising bidding procedures by service providers to ensure they comply with Bank procurement procedures and rules; Review o f financial performance o f sub-projects o n an annual basis; Monitor ing and evaluation o f sub-proj ects’ impacts.
Participating Bank administrative financial agreement with PEU:
The participating Bank would have the following responsibilities, under an
0
0
Payment o f subsidy to electricity service provider; Financial management and reporting with respect to subsidy funds.
Electricity Sewice Provider: The electricity service provider would: 0
0
0
0
0
0
0
0
0
0
0
Receive request f rom community or regional/local government for electricity project; Coordinate w i th regionaUloca1 government and community, including arrangements for their grant contributions; Prepare and submit proposal for subsidy including profi le sub-proj ect proposal, financing plan, and preliminary safeguards screening; Have or obtain an electricity concession; If successful, s i g n sub-project agreement with MEM; Carry out detailed engineering and safeguards studies; Conduct tendering process for turnkey construction o f sub-proj ect according to Bank procedures; Sign contract with construction contractor; Supervise construction and authorize payments against progress; Evaluate and accept asset; Operate and maintain system, providing electricity service to rural customers that meet quality requirements.
Regional/Local Government 0
0
0
Coordinate with community and service provider; Prepare indicative rural electrification plans; Participate in priorit izing by optionally providing grant that reduces central government subsidy.
Community 0
0
0
Make request for service to electricity service provider and/or local or regional government; Provide necessary information o n demand, potential connections, identifying special loads, etc.; Provide contribution in kind or cash and commit to pay electricity tariffs.
46

Implementation Arrangements for Technical Assistance and Productive Uses Promotion Activities
I - - - - - - - - - - - ; Contracts - - - - - - - - - - - - - -
-r - - - - - - - - I-- I
The TU would contract out technical assistance activities under Component 2 to national and international consultants that would carry out the required investigations, studies, workshops and capacity building activities.
Project Execution Unit
The P E U would administer the Productive Uses Promotion Component which would be implemented through a number o f regionally-based consultants with assistance from a Support Services Contractor. The regional offices would be contracted separately. The organizational relationships are shown in Figure 6.4. The P E U would have overall responsibility for implementing this component, including administration, production o f training and capacity building materials, establishing operating procedures, and financial management. Each regional consultant would implement the Productive Uses Promotion Component in i ts regional area o f responsibility under the supervision o f the PEU. Capacity building and promotional services would be conducted by regional consultants. Cost sharing with the beneficiary would be required where individualized assistance i s provided to a specific enterprise. Specific responsibilities are shown below.
Figure 6.4 Productive Uses Component Organization
I
Promotion Support Services
I
I I-- - - - - - - - - - - -I--- L - - - - - - - - - - - - - I I
- - - - - - - - - - r - - - - - - - - - - - - I I I
Associations/Communities Assisted
Regional Regional Regional Regional Contractor 1 Contractor 2 Contractor 3 Contractor 4
m. The PEU would have overall responsibility for implementing t h i s component, including the following: (i) Overall management responsibility o f the Productive Uses Component; (ii) Approve the target regions for focusing the work o f this component; (iii) Update the Operations Manual and prepare the detailed Implementation Plan; (iv) Direct and supervise the performance o f the support services contractor(s) and the regional
consultants; (v) Overall fiduciary responsibility; (vi) Monitor and evaluate performance o f regional consultants and program effectiveness; (vii) Issue quarterly and annual report to the Steering Committee and Wor ld Bank, as required;
Regional Contractor N
47

(viii) Help build relationships and liaise wi th partner organizations, including financing institutions, electricity service companies, training and capacity building organizations, and trade and marketing associations; and Organize technical and financial support through alliances with existing programs w i th similar objectives.
(ix)
Support Services Contractor(s). Specific tasks would include the following: (i) Assist the PEU to supervise the performance o f the regional consultants; (ii) Assist PEU update the Operations Manual and prepare the detailed Implementation Plan; (iii) Lead the diagnostic work and recommend to the P E U any changes to the priority geographic areas
and priority sector/application to support; (iv) Prepare standardized marketing brochures, leaflets, advertisements, posters, training videos and a l l
other instruments; (v) Organize training sessions for regional branches and subcontracted institutions o n the wide range o f
businesses that could be helped to shift f rom manual and/or diesel source o f energy to electricity; (vi) Help build relationships and liaise wi th partner organizations, including financing institutions,
electricity service companies, training and capacity building organizations, and trade and marketing associations;
(vii) Arrange to leverage technical and financial support through alliances with existing programs with similar objectives (e.g., Peru Emprendedor, SENATI);
(viii) Assist PEU monitor and evaluate regional consultants and program effectiveness; and (ix) Prepare quarterly and annual report to the PEU, as required.
Regional Consultants. Each regional consultant would be responsible to implement the Productive Uses Promotion Component in i t s regional area o f responsibility under the supervision o f the PEU. The responsibilities would encompass the following:
Conduct a diagnostic o f specific energy intensive opportunities to increase productive loads and o f constraints faced by local entrepreneurs towards more electricity intensive operations or switch to electricity f rom using diesel or other power sources; Conduct targeted promotionallmarketing campaigns to in form the local Communities about the advantages o f switching to electricity use and o f the availability o f cost-shared assistance; Facilitate access to information o n electrical equipment, performances and costs; Using facilitators, visit potentially energy intensive enterprises, associations or communities to encourage their participation and assist interested organizations in seeking assistance. Priority would be given to those energy intensive operations that currently employ diesels or other power sources, particularly those needing electricity during the daytime; Screenievaluate requests for assistance and select promising proposals for cost-shared assistance; Provide direct assistance and advice in the most cost-effective manner possible, e.g. providing standard documentation, advice and training, or group advisory services. In exceptional cases, it may be necessary to support the implementation o f the proposed work by assisting beneficiaries to select and contract for technical assistance. The funds available under the project along with a 10- 20% contribution f rom the beneficiary would pay for technical services where individualized assistance i s provided to an enterprise or association. I t i s expected that during the period o f implementation, about 15,000 rural enterprises would be assisted; Establish relationships/partnerships wi th local electricity service companies as wel l as regional organizations that can provide supplementary services and investment financing and assist beneficiaries in obtaining such services. This may include assistance in preparing loan applications and electricity connection applications;
(viii) Conduct baseline and post-assistance surveys to determine effectiveness o f services provided. Monitor electricity consumption changes and other key performance indicators; and
48

(ix) Moni tor and supervise the provision o f services, manage finances and report to the PEU o n a regular basis.
Implementation Arrangements for Financing Facility for Renewable Energy Projects
The Facil ity includes an Independent Investment Committee, a Fund Manager (investment advisor) and an Administrative Financial Agreement where financial administration would be handled.
The Facil ity would be managed by a competitively selected qualified Fund Manager. The Fund Manager would be responsible for:
0
0
0
Promoting the Facil ity to prospective sponsors and financial institutions; Analyzing potential projects proposed by sponsors; Performing due diligence for short-listed projects (technical design assessment including resource assessment, costing and timing of works, and operational requirements; financial and economic assessment; compliance wi th environmental and social framework; risks assessment);
0 Actively seeking co-financing and closure o f refinancing upon end o f construction and init ial operation period;
0 Preparing necessary documentation and presenting investment recommendations to the Independent Investment Committee;
0 Advising the P E U o n issuing instructions for loan disbursements under the Administrative Financial Agreement for approved projects;
0 Supervising the project sponsor as necessary during the investment period.
The Fund Manager would be rewarded based o n proportion o f co-financing that i s brought to the deal and successful refinancing of the hydropower facility after i t s commissioning and operation for a period o f time.
The Independent Investment Committee would be composed o f three adequately qualified members, to be appointed by the Project Directory Committee. The Independent Investment Committee would review investment recommendations provided by the Fund Manager and provide i t s approval for worthy investments.
The Participating Bank would operate based o n an administrative financial agreement with PEU, as instructed by the PEU (disbursement o f funds as necessary to ensure project completion and costs minimization) issuing invoices and receiving loan repayments f rom project sponsor company, record- keeping and management o f legal documents.
49

Figure 6.5 Implementation Arrangements for Small Hydropower Generating Financing Facility
Independent Investment Committee (Appointed by PDC)
4 w Fund Manager Trust Fund (Investment Advisor) Revolving Loan
Small Hydro Facility b
50

A n n e x 7: Financial Management and Disbursement Arrangements
PERU: Rural Electrif ication
A Financial Management Assessment was performed in accordance with OPiBP 10.02 and the Guidelines for Assessment o f Financial Management Arrangements in Wor ld Bank Financed Projects. The evaluation was initiated jo in t ly by the FM and Procurement teams, o n June 24, 2005 and performed, in the offices o f the Ministry o f Energy and Mines (MEM) w i th a team led by the Project Preparation Manager and the Coordinator.
Executive Summary and Overall Conclusions
Project design and implementation require a robust financial management system, which at the time o f the assessment are not yet in place, since according to local regulations the Project Executing Unit (PEU) can only be established after the signing o f the loan agreement and the participating institutions and private enterprises have not yet been selected. Nevertheless, as one o f the products o f the preparation grant, a draft operations manual has been prepared, which, along with the proposed FM action plan, wi l l bring together planning, budgeting, .accounting, financial reporting, internal control, auditing, disbursement, physical performance for the project, and will, finally, determine the necessary steps to achieve adequate resources management and to reach the project development objectives.
Currently, the overall inherent and control r isks have been assessed as moderate. More specifically, at the country and entity level the r isks are moderate, while at the project level the risk prof i le i s high.
However, successful implementation o f the FM action plan, highly qualified professionals in key positions and adequate capacity building would generate acceptable financial management arrangements, resulting in moderate residual inherent and control risk ratings at the project level, too.
Risk Assessment
Overall:- both inherent and control risks have been assessed as moderate.
At the country level, C F A A findings and experience w i th the existing country portfolio in the areas o f financial accounting, reporting, audit quality and compliance, and the quality o f the FM profession, indicate that country r isks are m ~ d e r a t e . ’ ~
At the entitv level, the MEM has traditionally operated acceptable financial management arrangements, based o n national control norms, and MEM i s staffed with high level professionals with excellent capacity in planning, budgeting and financial management as wel l as internal controls. Entity level risk i s therefore assessed as moderate.
At the project level, the risk prof i le i s high, due to the relative size o f the loan, the multiple actors described in Annex 6 Implementation Arrangements, the f low o f funds mechanism, including a participating bank, which would make payments for Components 1 and 4, through an Administrative Financial Agreement “comisidn de confianza”, the need for robust coordination in planning and budget preparation, and technology capacity that would allow timely and accurate consolidation and reporting of financial and disbursement information.
l4 See the Country Financial Management Strategy note for a fuller description o f the country context.
51

In order to mitigate the risks posed by the lack o f an established P E U and lack o f recent engagement with the Bank, the fo l lowing wi l l be required: (a) highly qualified professionals in key positions (profiles in the Operations Manual); (b) a highly qualified and experienced Financial Manager (profile in the Operations Manual); (c) considerable degree o f technical assistance and capacity strengthening measures (to be provided by the financial management and disbursement Bank teams); (d) successful implementation o f the FM action plan; and (e) close supervision by the Bank FM team, during the f irst year o f project implementation.
Full analysis and development o f financial management issues w i l l be included in the Financial Management Assessment, included in the Project files.
Disbursement Arrangements and Flow o f Funds
Disbursement Arrangements
During project implementation, disbursements may be transaction based (ie against Statements o f expenditure (SOEs), full documentation, direct payments or special commitments) or Report-based. The Bank and client have discussed the use o f report-based disbursements for a l l components. However, given that the Project team wi l l be newly created and the IT systems are not yet operational, the Project wi l l use the transactions based disbursements mechanism (SOEs), during the capacity building period.
Indeed, report-based disbursements call for a substantial amount o f technical assistance to the PEU in the design o f the Financial Monitoring and additional disbursement required reports. Satisfactory IT systems that wi l l produce the reports and staff technical capacity wi l l be necessary for t imely disbursement and satisfactory f low o f funds. On the client side, the key elements for successful implementation o f report- based disbursements are the following: 1) the abil ity to make projections o f cash f low requirements; 2) synchronization with the annual operating plans, procurement plans; and 3) finalization o f the inter- institutional arrangements to ensure: (i) accountability in the different project levels; and (ii) timely transfers o f funds to the bank accounts o f the participating bank for payments and loans.
The project wi l l have access to funds advanced by the Bank to two Special Accounts in U S dollars (one for the loan and one for the GEF), for processing disbursements to beneficiaries for those eligible expenditures under project activities. The Special Accounts (SA) wi l l be opened by the Borrower in the Banco de la Nacion (Government commercial bank) and wi l l be managed by the central PEU, established within the MEM, responsible for implementing the project. Designated accounts wi l l be set up in coordination with “Credit0 Publico” and wil l consist o f both U S D and Local Currency accounts, Counterpart funds wil l be financed from the National Treasury and the Peruvian system i s set up to force two payments f rom the two sources o f funds.
Funds wil l be deposited into the Special Account as advances and wi l l fo l low the Bank’s disbursement operating policies and procedures.
In the case that withdrawals o f loan proceeds are made using Report-based Disbursements, the Bank wi l l deposit into the Special Account an amount, which the Bank has determined, based o n the reports submitted (FMRs and additional reports for disbursement purposes), required to finance eligible expenditures during the next period (no more than 9 months) fo l lowing the reporting period o f such FMRs. The disbursement o f up to 9 months cash f low needs to the sub-accounts managed by the Participating Bank was deemed necessary to provide contractors sufficient payment assurances.
52

Transaction-based disbursements may include direct payments to consultants and service providers, reimbursement to the Government for the Bank’s share o f pre-financed expenditures and Bank advances. Report-based disbursement would b e used almost exclusively for Bank advances to the project.
The counterpart funds from MEF and possibly f rom Regional Governments, that wi l l be used for the current project in the percentages stipulated in the Legal Agreement w i l l be monitored by the PEU according to the Operations Manual.
The project should design detailed procedures for the opening o f Bank Accounts, which include acceptable internal controls, as wel l as procedures for the transfer o f resources from the Special Accounts to the Rural Electrification Designated (sub) account and to project local currency accounts (Second Generation Special Accounts, or SGSAs), established by the PEU in a commercial bank acceptable to the Bank. Financial management capabilities o f the Participating Bank should be a criteria o f selection. The Bank FM team wil l assess the Participating Bank to ensure that i t i s capable o f managing Bank and GEF resources and that i t meets minimum Bank FM requirements.
F l o w o f Funds
Bo th sources o f external financing (IBRD loan and GEF grant) w i l l be managed by the PEU. Funds wil l f low from the Wor ld Bank Loan account to a USD Loan Special Account and from the GEF Grant Account to a U S D Grant Special Account. Both U S D special accounts wi l l have corresponding project local currency accounts for disbursements.
The PEU wil l make disbursements to suppliers and contractors f rom the special accounts for Components 2, 3, and 5.
The P E U w i l l transfer funds from the Loan Special Account to the Rural Electrification Designated (sub) account managed by the Participating Bank, under the Administrative Financial Agreement, for expenditures to be made under Component 1. The PEU wil l similarly transfer funds f rom the GEF Grant Special Account to a second designated sub-account managed by the Participating Bank for loans to be made under Component 4.
Counterpart funds w i l l be transferred f rom the Peruvian Treasury to the Project’s counterpart account, managed by the P E U for the Government’s share o f project expenditures, according to the percentages established in the Loan and Grant Agreements.
53
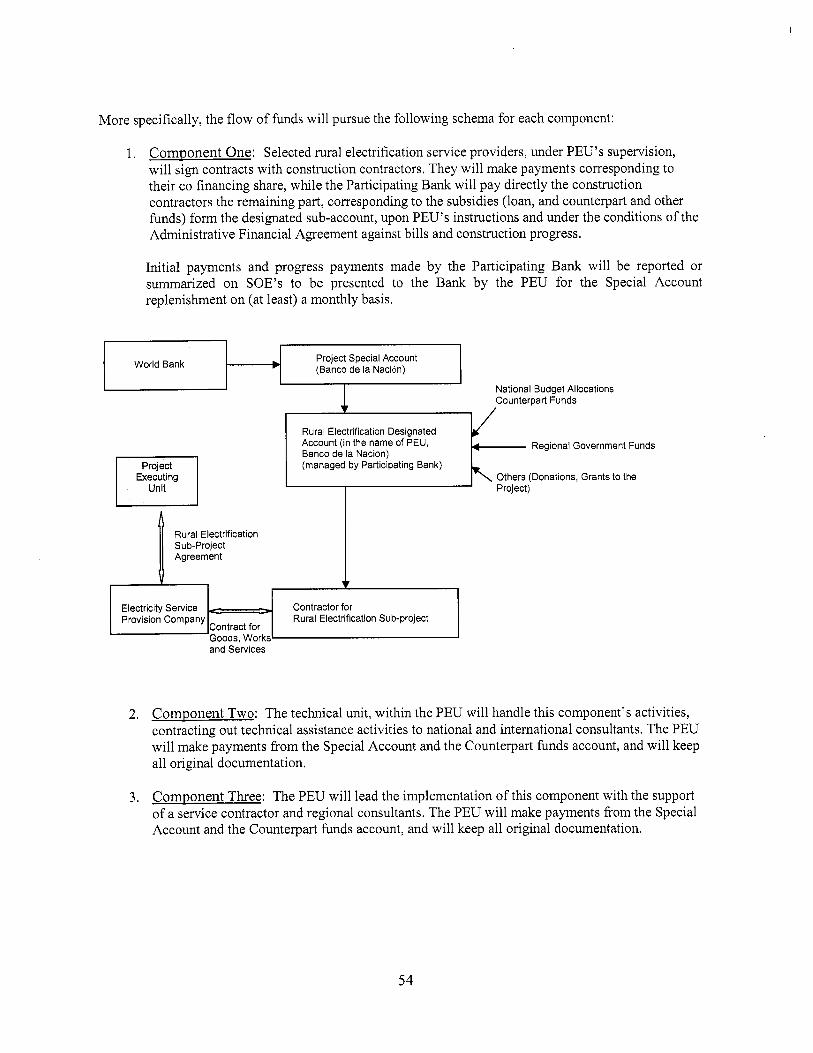
More specifically, the f low o f funds wil l pursue the following schema for each component:
Electricity Service Provision Company
1. Component One: Selected rural electrification service providers, under PEU’s supervision, w i l l s i g n contracts with construction contractors. They wi l l make payments corresponding to their co financing share, while the Participating Bank w i l l pay directly the construction contractors the remaining part, corresponding to the subsidies (loan, and counterpart and other funds) form the designated sub-account, upon PEU’s instructions and under the conditions o f the Administrative Financial Agreement against bills and construction progress.
Contractor for Rural Electrification Sub-project
Contract for
In i t ia l payments and progress payments made by the Participating Bank wil l be reported or summarized o n SOE’s to be presented to the Bank by the P E U for the Special Account replenishment o n (at least) a monthly basis.
b Project Special Account (Banco de la Naci6n) World Bank
I National Budget Allocations
Executina
Counterpart Funds
Rural Electrification Designated Account (in the name of PEU, Banco de la Nacion) (managed by Participating Bank)
4 Regional Government Funds
Others (Donations, Grants to the Project)
Rural Electrification Sub-project Agreement
2. Component Two: The technical unit, within the PEU w i l l handle this component’s activities, contracting out technical assistance activities to national and international consultants. The P E U wi l l make payments f rom the Special Account and the Counterpart funds account, and wi l l keep a l l original documentation.
3. Component Three: The P E U wi l l lead the implementation o f t h i s component with the support o f a service contractor and regional consultants. The P E U wi l l make payments f rom the Special Account and the Counterpart funds account, and wil l keep a l l original documentation.
54

4. Component Four: A Fund Manager wi l l select and propose to the Independent Investment Committee (within the PEU), renewable energy projects, according to a Facil ity Agreement. The Participating Bank wil l finance selected projects with GEF grant funds, under the conditions o f an Administrative Financial Agreement. I t w i l l provide loans to the selected small hydro projects, based on the instructions received from the PEU and receive and administer repayments (including interest). Upon signing a small hydro project loan agreement, the Participating Bank wi l l send an original copy of the loan agreement to the P E U for filing. The P E U wil l determine the amount o f loan disbursements and make monthly or biweekly transfers f rom the GEF special account to the Participating Bank GEF account. Loan disbursements reported by the Participating Bank w i l l be considered eligible expenditures for purposes o f the GEF grant and wi l l be reported or summarized o n SOE’s to be presented to the Bank by the P E U for the Grant Special Account replenishment, o n (at least) a monthly basis.
The loan repayments wi l l be deposited into the Participating Bank GEF ref low account and be used for additional small hydro project loans. Original documentation corresponding to loan repayments wi l l then be sent to the PEU’s archives. Finally, the Participating Bank i s expected to send to the P E U a GEF bank account statement, o n a monthly basis.
I I I I
I Project GEF Grant Special Accoun (Banco de la Naci6n) World Bank
I Proiect I Executing I Unit I
Rural Electrification GEF Grant Designated Account (in the name of PEU,
Banco de la Nacion) (managed by Participating Bank)
Participating Bank 1 iall Hydro Sub-project an Agreement Small Hydro I
Agreement
Contractor Payment: I I
Contractor for Rural Electrification Sub-project
5 . Component Five: The P E U wi l l carry out this component, make payments f rom the S A and the Counterpart funds account, and w i l l keep a l l original documentation.
The budgeting process necessary for Project’s implementation and disbursements would use in many cases a bottom-up approach, whi le the final budget would have to be consolidated by the PEU, for the
55
f inal approval f rom the MEF. The information would f low from the service providers, the TU, the Participating Bank and the Fund Manager to the P E U for consolidation.
Accounting
The PEU wil l maintain a l l Project records, consolidated accounts and financial statements, for disbursements and reporting. Therefore, the accounting function should be centralized at the PEU, making sure that: (i) all the participating entities maintain adequate accounting systems in order to operate al l the sub-accounts, and (ii) adequate charge codes are attributed to the upcoming expenses, harmonized among the implementing entities, thus identifying the origin and use o f the funds by category and by component. This i s necessary, in order to build three series o f financial statements for: 1) the IBRD loan; 2) the GEF grant; and 3) the consolidated or Project’s financial statements.
Information Systems
At present, the MEM i s using the Sistema Integral de Administracidn Financiera (SLAF) and the GESTOR, a parallel system compatible with SIAF, which allows the registration o f more detailed accounting information. Those systems w i l l be used by the P E U for project financial statements consolidation, reporting and disbursements.
Audit Arrangements
hzternal Audit: Project transactions undertaken by the PEU wil l be subject to review by the Internal Audit Department o f the MEM. This Department i s independent and reports the findings o f i t s ex-post control directly to ‘the country’s supreme audit institution ( Contraloria General de la Repziblica). However, as the rhythm o f implementation increases, the P E U wil l need to ensure that i t s o w n internal control structure i s sufficiently strong, and the FM function i s adequately staffed with professionals conversant with Bank policies and procedures in order to: (i) avoid ineligible expenses and delays in the f low o f hnds and Project implementation; (ii) safeguard o f Project’s assets; and (iii) avoid misuse o f funds.
External Audit: The P E U wi l l be responsible to provide the Bank annually with consolidated financial statements for the Project, including funds f rom the Wor ld Bank loan, GEF Grant and counterpart funds (including funds from loan repayments), audited by an independent auditing firm acceptable to the Bank and under terms and conditions satisfactory to the Bank, which wil l include an opinion o n the project financial statements and a management letter o n the internal control structure. The auditors should have access to a l l supporting records and make o n site examination o f a l l participating companies and institutions (including the Participating Bank). Annual audit reports with the related statements w i l l be submitted to the Bank within six months o f the end o f the Borrower’s fiscal year. All supporting records would be maintained at the Project and at al l participating companies and institutions sites for at least one year after submission to the Bank o f the audit report covering the year in which the final project expenditure was incurred. The Bank’s audit guidelines w i l l be used by the Borrower in determining the format and content o f the annual financial statements and in preparing the audit terms o f reference (TORS). The costs o f the Project audits may be subject to financing from loan proceeds.
Auditors would perform at least one interim inspection per year in order to promptly identify areas that require attention of the Project’s management. Such reviews wi l l identify problems related to accounting or/and internal control in a timely manner. Af ter each interim visit, a memorandum o n internal controls (management letter) would be produced to ensure that corrective actions are addressed pr ior to year end.
56

Annual project financial statements wi l l be audited in accordance with International Standards on Auditing (ISAs) issued by the International Federation o f Accountants (IFAC), by an independent firm acceptable to the Bank. The audit wi l l be performed in accordance with terms o f reference (TORS) approved by the Bank, and the audit opinion should cover the project financial statements, Special Account, Statement o f Expenditures (SOEs), compliance w i th Loan Agreement and applicable financial laws and regulations.
Legal
Preparation o f the standard institutional and operational arrangements between the PEU, Privet Electricity Providers, Fund Manager, Participating Bank (for Loan and Grant). Flow of Funds Flow o f Funds Design Flow o f Funds Chart (Comp. 1 & 4) Training in financial management, including planning
Financial Management Supervision during Implementation
During the f i rs t year o f implementation, supervision intensity wi l l be increased, considering the overall risk profile, and wi l l take the form o f technical assistance to the project, and wi l l review controls and transactions as appropriate. This w i l l be complemented by desk reviews o f the Financial Monitor ing Reports and annual audit. Thereafter, in addition to the main annual supervision mission, visits may be scheduled to fo l low up on the findings o f the desk reviews, as appropriate.
PEU Negotiations Accomplished
PEU During appraisal Accomplished WB Before negotiations Accomplished WB Project Launching
Financial Management Action Plan
Organization and Staffing PEU Organization Chart Preparation and submission o f TOR for staff o f the PEU to Bank for non objections. Formal nomination o f the Project Preparation General Manager Formal nomination o f the Project Preparation FM
The Financial Management Assessment concluded that the Project arrangements wi l l not meet minimum Bank requirements at signing as the P E U wil l not exist.
PEU Inclusion in Operations Manual Accomplished PEU Inclusion in Operations Manual Accomplished
MEM Prior to negotiations Accomplished
MEM Prior to negotiations Accomplished
As a result, the Act ion Plan that follows was proposed by the Bank FM team to strengthen institutional capacity. The action Plan was agreed with the Borrower during negotiations. In the discussions with the Project task team, it was decided that a l l important considerations for Financial Management should be included in the Operations Manual. A Draft Operations Manual was submitted for the Bank’s Review during negotiations. Whi le FM conditions of effectiveness are not proposed, as part o f fiduciary due diligence leading up to effectiveness, the Financial Management team w i l l visit the project and confirm that financial management capacity i s in place to ensure that the Operations Manual can be effectively implemented.
Activity Responsible 1 1 Target Date 1-7 Negotiations
and budgeting using country systems and Report-based Disbursements. I
57

I Activity
Full staffing in place
Target Date
Three months from effective date (Dated covenant, under Article 111, Section 3.04 o f the Legal Agreement) Condition o f disbursements for Category 4 (Schedule 1, A3(h)(ii) o f the Legal Agreement - Loan and
Internal audit staff in Bank Disbursement, Procurement
including institutional arrangements, f l o ~ o f funds design, staff functions, accounting policies and procedures, basis o f accounting, chart o f accounts tailored to include project components. disbursement catcgories and financing source, internal controls, segregation o f duties, fixed assets and records management procedures. Pro\,ision o f comments and recommendations.
Preparation o f draft TORS for audit and submission to Bank for no-ob'ection. Submission o f approved TORS to the CGR to initiate the process o f selection and contracting o f external auditors. Obtain waiver from the CGR for hiring o f the external auditors. Appointment o f external auditors.
Internal Controls Establishment o f own internal control mechanism
Status at Negotiations
Safeguard over Assets (physical and information) Imolementation o f Fixed Asset Policics and Procedures
Prior to negotiations
I i n k d i n g physical inventories, storage/transfer/
Accomplished
distributionhetirements o f assets etc.
collection and report generation o f same, for the Bank to provide its no-objection. Integrated Financial llanagement System Implementation o f Integrated Information systems.
Responsible
PEU
PEU
IBRD/PEU
PEU
IBRD
PEU
PEU
PEU
CGWPEU
PEU
PEU
PEU
PEU
PEU
Grant) Project launching;
Prior to negotiations Accomplished
Prior to effectiveness =- Prior to effectiveness
Within three months after effectiveness
Within six (6) months after effectiveness
To be reviewed bv external auditors I
(attached to the minutes)
Three months after effectiveness I
58
Annex 8: Procurement Arrangements
PERU: Rural Electrification
General
Procurement for the proposed project would be carried out in accordance with the Wor ld Bank's "Guidelines: Procurement Under IBRD Loans and IDA Credits" dated M a y 2004; and "Guidelines: Selection and Employment o f Consultants by Wor ld Bank Borrowers" dated M a y 2004, and the provisions stipulated in the Legal Agreement. The various items under different expenditure categories are described in general below. For each contract to be financed by the Loan, the different procurement methods or consultant selection methods, the need for pre-qualification, estimated costs, pr ior review requirements, and time frame are agreed between the Borrower and the Bank in the Procurement Plan. The Procurement Plan wil l be updated at least annually or as required to reflect the actual project implementation needs and improvements in institutional capacity.
Procurement of Works: Works to be procured under t h i s project would include construction o f infrastructure to extend the scope o f grid-connected electrification services and to develop off-grid electricity services in isolated communities with use o f renewable energy sources in rural settings. Procurement processes would be managed directly by awarded electricity distribution companies -under close monitoring o f the PEU- using Standard Bidding Documents under N C B procedures acceptable to the Bank. Procurement o f c iv i l works wi l l be carried out in 12 rounds throughout project implementation. At each round, contracting packages wil l be sub-divided in seven contracts, each one estimated to cost US$1.2 mi l l ion on average, to be procured under NCB. Whenever service providers are not available, the sub-proj ects could be proposed by communities or localhegional governments. In these cases, bidding processes for contracting o f c iv i l works and operational activities required for the provision o f electricity services w i l l be managed directly by the P E U staff following the procurement methods described above. Details o n procedures to be followed in cases where community participation i s expected shall be described in the procurement chapter o f the project Operations Manual.
Procurement of Goods: Goods to be procured under this Project would include office equipment and supplies, technical equipment for evaluation o f renewable energy sources, computer hardware and software support for the PEU and regional and local governments. Procurement wi l l be carried out by using Bank Standard Bidding Documents under I C B procedures, and National SBDs proposed by the PEU and agreed w i th or satisfactory to the Bank.
Procurement of non-consulting services: Expenses related to training activities for capacity building purposes -other than consultants- would be procured as non-consulting services. Under this sub-category, expenses such as rental o f facilities, purchase or reproduction o f training materials, food and other relevant expenses would be financed by the project. Also, contracts for administration o f GEF funds by financial institutions in support o f small electricity supply companies would be procured under th is contract category. Non-consulting services with estimated values less than US$50,000 per contract wi l l be procured w i th the use o f price comparison (shopping) procedures o f at least three quotations obtained from qualified local suppliers. For the use o f this procurement method, the P E U wi l l submit project standard procurement documents to be acceptable to the Bank.
Selection of Consultants: Consultant services to be provided by f i r m s and individual consultants under the project would include advisory services, technical assistance and training in activities related to the development o f institutional frameworks and regulations for grid-connected and off-grid rural electricity services, capacity building o f service providers and regional governments for development o f grid and off-grid sub-projects, promotion o f private sector investment and renewable energy, design and
59

implementation o f promotional/marketing campaign for productive uses o f electricity, assistance in business development for purchase o f electricity using equipment, and consultant services o f a technical and project administrative nature to enable project management and coordination and the carrying out o f project administrative tasks in support o f the PEU. Short l is ts o f consultants for services estimated to cost less than US$350,000 equivalent per contract may be composed entirely o f national consultants in accordance with the provisions o f paragraph 2.7 o f the Consultant Guidelines.
Consultant f i r m s wi l l be employed with the use o f QCBS; QBS, FBS, LCS, CQS and SSS procedures. Contracts for employment o f f i r m s to be procured under FBS and LCS methods may not exceed a ceiling o f US$200,000 equivalent per contract. Individual consultants wi l l be employed for assignments meeting the requirements established in para. 5.1 o f Section V in the Bank Consultant Guidelines and selected on the basis o f their qualifications for the assignment required under TOR agreed with the Bank team. Such consultants w i l l be competitively selected through the comparison o f at least three candidates among those approached directly by the project agency or who have expressed interest, as the case may be.
Operating Costs: Under this cost category, the Project would finance expenses needed to support project management and coordination tasks and monitoring, including rental o f the PEU facilities, utilities, operation and maintenance o f P E U computer and office equipments, travel, per diem, supervision costs and local contractual staff salaries but excluding salaries o f non-proj ect staff o f the Borrower’s c iv i l service at the national and regional levels. Except for local contractual staff salaries, expenses to be financed under this category wi l l not have to be included in the procurement plans.
Implementation o f proj ect procurement shall be systematically monitored o n the basis o f yearly-submitted procurement plans that wi l l include the particular contracts and proposed methods for procurement o f works, goods and consulting services, consistent with the ones agreed in the Loan Agreement. Therefore, aggregated amounts for project financing under each type o f contract are not necessary to include.
A detailed description o f the particular methods for procurement o f works, goods and non-consulting services, and selection o f consultants agreed for project implementation shall be included in the Operations Manual. Project standard procurement documents wi l l be also incorporated in a specific Annex to the Manual. The procurement methods and pr ior review conditions proposed for the project are indicated in Table 8.1 below.
Assessment of the Agency’s Capacity to Implement Procurement
Procurement activities wi l l be carried out by the Ministry o f Energy and Mining -through a dedicated Project Executing Unit- and awarded distribution companies. This Unit wil l closely oversee the procurement processes managed by service distribution companies. The PEU wi l l be staffed with a total o f 14 professionals headed by a Project Manager acting as Project Team Leader; 1 Administrative- Financial Coordinator supported by 1 Procurement Officer; 1 Accounting Officer; 1 Treasury Officer; and 1 Budget Officer; 1 Technical Coordinator assisted by 2 Technical Specialists; 1 Economist; 1 M&E Specialist; 1 Legal Specialist; and 1 Internal Auditor to be provided by MINEM. The procurement function wi l l be staffed by 1 Procurement Officer who would coordinate procurement planning and oversight tasks and provide technical assistance to MEM’s l ine units involved in specific component implementation and Distribution Companies participating in the project.
An assessment o f the capacity o f the Implementing Agency to implement procurement actions for the project has been carried out o n June 24, 2005. The assessment reviewed the organizational structure for implementing the project and the interaction between project staff responsible for procurement and the Min is t ry ’s relevant central unit for administration and finance.
60

The key issues and r isks concerning implementation o f project procurement have been identified and include: i) an organizational structure not yet defined for the P E U by MEM; ii) lack o f pr ior experience and skilled staff in both MEM and in potential electricity service providers to implement Bank-financed project procurement; iii) some degree o f uncertainty around the choice o f provision o f physical space, and computer and office equipment to enable the PEU’s full operation and; iv) lack o f an integrated project information system necessary to enable timely project monitoring, control and reporting. The corrective measures to be taken by MEM are: i) submission of an organizational structure and a staffing l ist, and i t s final decision o n the physical location; ii) hiring of a procurement consultant w i th experience in MDB- financed projects to provide project procurement coordination, supervision and technical assistance to MEM’s executing units and staff, and electricity service companies participating in the project; iii) incorporation in sub-project agreements to be entered into by MEM and Electricity Service Providers in rural areas whereby the latter wi l l adhere to the Bank rules for procurement o f c i v i l works and to close oversight and monitoring o f the PEU’s designated procurement specialist; and iv) full implementation by MEM o f an integrated PMIS w i th the capability o f recording timely information and monitoring procurement and FM related transactions not later than the end o f f i rs t year o f project implementation. Bank basic procurement training to both PEU staff and Electricity Service Provider’s wi l l by provided by Bank Procurement Specialists not later than project launching mission.
The overall project r i sk for procurement i s moderately HIGH.
Procurement Plan
The Borrower, at appraisal mission, developed a procurement plan for project implementation which provides the basis for the review o f proposed procurement methods. This plan has been agreed between the Borrower and the Project Team and i s available at the offices o f the Vice-Ministry o f Energy and Mining (MEM) in Lima. I t wi l l also be available in the project’s database and in the Bank’s external website. The Procurement Plan w i l l be updated in agreement with the Project Team annually or as required to reflect actual project implementation needs and improvements in institutional capacity.
Frequency of Procurement Supervision
In addition to the pr ior review supervision to be carried out f rom Bank offices, the capacity assessment o f the Implementing Agency has recommended one annual supervision mission to visit the f ie ld to carry out post review o f procurement actions.
Table 8.1: Thresholds for Procurement Methods and Prior Review*
Contract Value Contracts Subject to
(US$ thousands) (US$ thousands) Expenditure Category Threshold Procurement Method Prior Review
1 .Works Contract = > 3,000 ICB All
30004 Contract >250 N C B Contracts = > U S $ l .O mill; the first 2 contracts; and annual review o f procurement plan.
Post-review: Random sample o f contracts
First 2 contracts and Contract < = 250 3 quotations (Shopping)
61

Contract Value Contracts Subject to
(US$ thousands) (US$ thousands) Expenditure Category Threshold Procurement Method Prior Review
annual review o f procurement plan.
Post-review: sample of contracts
2. Goods and Non-Consulting Contract = > 250 ICB All Services
250 > Contract 7 50 NCB
Contract < = 50 National Shopping
3. Consulting Services and Training 3.1 Firms Contract = > 100 QCBS, QBS, FBS, LCS
3.2 Individuals
Contract < 100 QCBS, QBS, LCS, CQS, FBS or SSS
I C Contract = > 50
Contract < 50 IC, and SSS
Contracts = > 200; the first two contracts; and annual review of procurement plan
First 2 contracts and, annual review o f procurement plan.
Post-review: Random sample o f contracts
All contracts, including TOR, RFP, shortlist o f firms, full review o f technical and final evaluation reports, and final negotiated contract.
TOR and annual review o f the selection plan.
Post-review: Random sample o f contracts
All contracts, including TOR, CVs, and Form o f Contract
TOR, and annual review o f the selection plan
Post review: Random sample o f contracts
‘Thresholds generally differ by country and project. Consult Operational Directive (OD) 1 1.04, “Review o f Procurement Documentation,” and contact the Regional Procurement Adviser for guidance.
Total value o f contracts subject to pr ior review: [US$109.97 million]
62

Details o f the Procurement Arrangements Involving International Competition
1 2
Ref. Contract No. (Description)
None
1. Goods, Works, and Non Consulting Services
3 4 5 6 7 8 9
Estimated Procurement P-Q Domestic Review Expected Comments . Cost Method Preference by Bank Bid-
Date (yesho) (Prior / Post) Opening
1 1 2
(b) ICB awarded contracts estimated to cost above US$3.0 m i l l i on for procurement o f works; and N C B awarded contracts above US$1 .O mil l ion for procurement o f goods per contract; and a l l direct contracting wi l l be subject to pr ior review by the Bank.
3
2. Consulting Services
(a) L i s t o f consulting assignments with short-list o f international f i rms ,
5 6 7
Ref. No. Review by Bank (Prior / Post)
2.d.3
Expected Comments Proposals
Submission Date
Description of Assignment
2.b.l
Estimated cost
Development and Implementation o f a Gis-Based Project Information System 0.23 Evaluation o f
3.a.l.l
0.32
krm) 0.50 Region 1 Office & Promotional Consultancy 1 3.b. 1 1 Services 1 0.46 Region 2 Office
3.b.2 & Promotional 0.46
4
Selection Method
OB S
Prior
Jan-07
Prior
May-06
Prior
Aug-06 Prior
Aug-06
63

Ref. No. 1 Fund
3.b.3 I Prior
I 3.b.4
2
Description of Assignment
Consultancy
3.b.5
3.b.6
3 4
Estimated Selection cost Method
5
Review by Bank (Prior / Post)
6 7
Expected Comments Proposals
Submission Date
Promotional Consultanc y Services Region 4 Office & Promotional Consultanc y
Region 3 Office I
0.46
QB S
Services
& Promotional Consultancy I
0.46 Region 5 Office I QB S
Services
Dec-06
0.46 Region 6 Office I
(b) Consultancy services estimated to cost above US$lOO,OOO for employment o f f i rms; and US$50,000 for employment o f individuals per contract; and single source selection o f consultant f i r m s and individuals wi l l be subject to prior review by the Bank.
QBS
(c) Short l i s t s composed entirely o f national consultants: Short l i s t s o f consultants for services estimated to cost less than US$350,000 equivalent per contract, may be composed entirely o f national consultants in accordance with the provisions o f paragraph 2.7 o f the Consultant Guidelines.
& Promotional Consultanc y Services
64
0.46
Management 0.27 QCBS Jun-06

Annex 9: Economic and Financial Analysis”
PERU: Rural Electrification
A. RURAL ELECTRIFICATION SUB-PROJECTS
Background The main economic objective o f the project i s to improve the cost-effectiveness o f the Government’s rural electrification program presently implemented by MEM. In the past, MEM’s project selection was largely based o n social criteria (to serve the poorest in the most remote communities), with litt le regard for cost- effectiveness. As a result, many such schemes have low electricity consumption, and some, fo l lowing population migration to urbanized areas, have been effectively abandoned. Rural electrification (RE) schemes built by MEM have been handed over to distribution companies for operation, an unpopular arrangement since these often inadequately designed schemes typically incur high financial losses, Table 9.1 shows MEM’s existing Rural Electrification Plan. Average connection costs over the 2006-2012 plan period are US$940/HH (household): in the past, this entire amount has been provided as a subsidy since the full construction cost was borne by MEM.
Table 9.1: Average US$/connection in each year of MEM’s existing R u r a l Electrification P lan
Year Investment Households $HH Cumulative Cumulative US$ million connected Investment, HH
US$million connected 2006 49,124 59,227 840 49,124 59,227 2007 58,050 62,78 1 925 107,774 122,008 2008 67,502 17,704 869 175,276 199,713 2009 62,835 67,953 925 238,111 267,666 2010 36,392 38,925 935 274,503 306,591 201 1 66,O 12 62,144 1062 340,515 368,735 2012 60,533 61,407 986 401,048 430,142 2013 71,324 72,217 988 472,372 502,359 total 472,372 502,359 940
Source: MEM, Plan Nacional de Electrificacion Rural 2004-201 3
A new approach i s proposed by the project. I t s emphasis w i l l be to provide rural electrification to rural areas adjacent to existing distribution company franchise areas (where demand levels wi l l generally be higher, and investment costs per household lower), and to ask the distribution companies themselves to design (and construct) rural electrification schemes for which they wi l l be responsible for operating. This i s expected to improve the prospects for financial sustainability, and provide higher rates o f economic return than under the existing approach.
Outline of the Analysis
The economic and financial analysis consists o f f ive steps:
1. Preliminary screening: 49 proposals submitted by the distribution companies to MEM in M a y 2005 were evaluated for general economic and financial feasibility: th is resulted in the selection o f a short-list o f 16 sub-projects.
l5 This i s a summary taken f rom the detailed report o n Economic and Financial Analysis. I t reflects the preliminary analysis o f results o f the Rura l Energy Survey conducted in June-July. I t i s unl ikely that the ma in findings would change significantly when survey results are finalized,
65
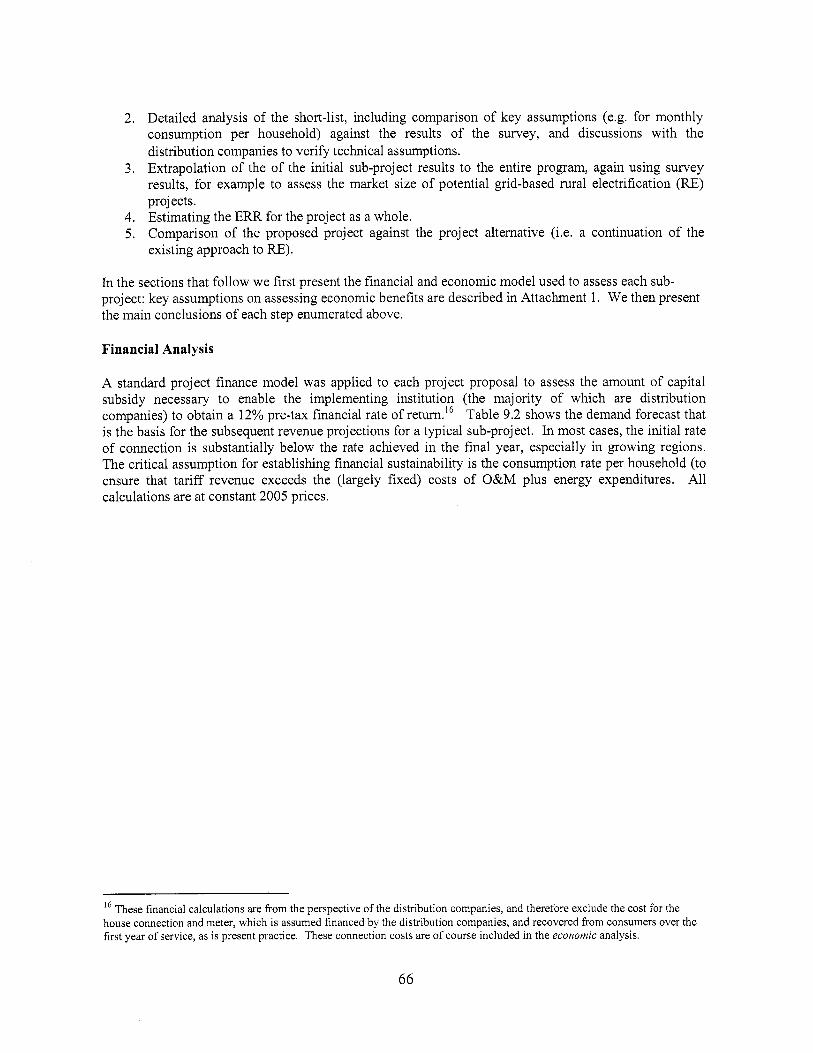
2. Detailed analysis o f the short-list, including comparison o f key assumptions (e.g. for monthly consumption per household) against the results o f the survey, and discussions with the distribution companies to verify technical assumptions.
3. Extrapolation o f the o f the init ial sub-project results to the entire program, again using survey results, for example to assess the market size o f potential grid-based rural electrification (RE) projects.
4. Estimating the ERR for the project as a whole. 5. Comparison o f the proposed project against the project alternative (Le. a continuation o f the
existing approach to RE).
In the sections that fo l low we f i rs t present the financial and economic model used to assess each sub- project: key assumptions o n assessing economic benefits are described in Attachment 1. W e then present the main conclusions o f each step enumerated above.
Financial Analysis
A standard project finance model was applied to each project proposal to assess the amount o f capital subsidy necessary to enable the implementing institution (the majority o f which are distribution companies) to obtain a 12% pre-tax financial rate o f return.I6 Table 9.2 shows the demand forecast that i s the basis for the subsequent revenue projections for a typical sub-project. In most cases, the in i t ia l rate of connection i s substantially below the rate achieved in the final year, especially in growing regions. The critical assumption for establishing financial sustainability i s the consumption rate per household (to ensure that tar i f f revenue exceeds the (largely fixed) costs o f O&M plus energy expenditures. All calculations are at constant 2005 prices.
l6 These financial calculations are from the perspective o f the distribution companies, and therefore exclude the cost for the house connection and meter, which i s assumed financed by the distribution companies, and recovered from consumers over the first year o f service, as i s present practice. These connection costs are o f course included in the economic analysis.
66

Table 9.2: Demand Analysis
Consumption Project 3 Company I
Connexions NW 0 I 2 3 4 5 6 7 8 9 10 I1
domestic [#I "on-domesric [#I genenl [#I small indusrty [#I rpcrlal loads [#I to tal Monthly Consumption domestic kwhlmer non-domesri< kWhlmeS general kwhlmes small i ndu i t v kwhlmes speclal loads kwhlmes
domerrk <I5kWhlm MWh 015-30 MWh 0 >30 MWh
non-domestic MWh genenl MWh small in6ustry MWh special loads MWh Annual ronsumptlon MWh public lighting n t c public lightlng MWh T O S l MWh
Annual consumption
I O S l C S PI energr required [MWhl
6583 6846 7120 7405 7701 8009 8330 8663 9009 9370 9744 65 68 70 73 76 79 82 86 a9 93 96
0 0 0 0 0 0 0 0 0 0 0 0 0 0 0 0 0 0 0 0 0 0 0 0 0 0 0 0 0 0
6648 6914 7190 7478 7777 8088 8412 8748 9098 9462 9841
300 30.3 30.6 30.9 31.2 31.5 318 900 909 91.8 92.7 937 946 955
0 0 0.0 0.0 0.0 0 0 0.0 0.0 0.0 0.0 0.0 0.0 0.0 0.0 0.0 0.0 0.0 0.0 0.0 0.0
1184.9 1131.3 1281.6 1332.9 1386.2 1441.7 1499.3 11849 1232.3 1281.6 1331.9 1386.2 1441.7 1499.3
0 0 24.6 51 5 80 8 I12 6 147.1 184.5 702 73.7 77.5 81.4 85.5 89.8 94.3
0 0 0 0 0.0 0.0 0.0 0.0 0.0 0 0 0 0 0.0 0 0 0 0 0.0 0.0
32.2 96 5 0.0 0.0 0.0
1559.3 1559.3 1 1 5 0
99 0 0.0 0.0
32 5 97 5 0 0 0 0 0 0
1621 7 1621 7 268 7 1040
0 0 0 0
32 8 98 4 0 .o 0 0 0 .o
1686.5 1686.5 316.0 109.3
0.0 0 0
33.1 99 4
0 .o 0 .o 0 .o
1754.0 1754.0 367 0
I 14.8 0 0 0 0
0.0 0 0 0 0 0 0 0.0 0.0 0 0 0 0 0 0 0 0 0 0 2440.1 2563.1 26922 2817.9 2970.4 3120.1 3277.4 34426 3616 I 3798.3 3989.7
5 0%
1220 128.2 1346 1414 148.5 1560 1639 1721 1808 1899 199.5 2562 I 2691 2 2826.8 29693 31190 3276.1 3441.3 3614.7 37969 3988.2 4189.2
10%
28468 29901 31409 32992 3465.5 36402 38236 40163 42187 44314 46547 e n e m 'OSt IUS$lkWhl 0 0599 m i m nowdomesti< ronsurnption 70 74 77 81 85 90 94 99 104 IO9 1 1 5 a5 f n i t l on 0ftoS.l 3% 3% 3% 3% 3% 3% 3% 3% 3% 3% 3% connexlon a t e 47% 49% 51% 53% 56% 58% 60% 62% 65% 68% 70%
Note: Calculations are for the entire 20-year planning horizon: in the interests o f clarity, only first 11 years o f operation are shown here.
The results o f the survey have been used to cross-check the plausibility o f the electricity demand assumptions presented by the distribution companies. Average national consumption per household (in rural areas) i s 26 kWh/month (with 95% confidence l i m i t s as shown).
Table 9.3: Electrification Rates and Average Consumption Total HH Electrified HH % electrified k Wh/HH/ 95%
Costa Nor te 156,419 54,584 35% 39 - +2.01
Costa Sur 27,787 19,65 1 71% 49 - +2.81
Sierra Sur 565,743 250,561 44% 15 - +2.02 Selva 383,403 68,990 18% 31 - +2.80
month confidence limit
Costa Centro 75,3 I 5 45,378 60% 59 - +3.00
Sierra Nor te 362,029 80,261 22% 19 - +I .56 Sierra Centro 634,240 332,084 52% 26 - +1.90
Nat ional Average 2204935 851510 39% 26 +0.74
Table 9.4 illustrates the financial analysis for a typical project. As indicated in the project summary, the costs and subsidy per household vary according to the year chosen. For purposes o f determining eligibil i ty for subsidy, set at US$800iHH, subsidy per households connected in the f i rs t year i s used (US$571/HH in the example shown). The subsidy itself i s calculated as that contribution necessary for the distribution company to achieve a 12% pre-tax rate o f return.
67

Table 9.4: Financial Analysis
Economic Analysis
For the economic analysis, costs were adjusted for duties and taxes, whi le benefits are based o n estimates of willingness-to-pay (WTP) derived f rom survey results: the methodology and a summary o f the derivation o f the specific values used are provided in Attachment 1. For the first 15 k W H tranche o f high-valued electricity used for domestic lighting and TV, the average W T P i s estimated at 2.3 Soles/kWh , and 1.4 So ledkwh for the next 15 kWh/HH/month. Beyond 30 kWh/HH/month the WTP i s assumed at the tariff. Average use in non-domestic enterprises i s 90kWh/month, for which the average WTP i s estimated at 3.20 So ledkwh (and at the average tar i f f thereafter). These are quite conservative assumptions (both in comparison to those encountered in other countries, as wel l as to past estimates, such as the 4.2 soles/kWh estimate by NRECA). W e test below the robustness o f the ERR estimates with respect to th i s uncertainty.
Moreover, it should be noted that the quantification o f benefits by estimating WTP for given end-uses such as lighting and TV-viewing represents only a lower bound o f the actual benefits, which include increased returns o n education and wage income; improved access to modern communication and information devices (computers, fax); social benefits to the community (street lighting increases safety allowing women to participate in community l i fe at night); health benefits (reduced burn injuries f rom kerosene lamps), time savings (e.g. avoiding trips for battery charging). These are diff icult to quantify and incorporate into the ERR calculation, but they nevertheless represent a significant part o f the social benefits o f rural electrification. In one o f the few studies to have attempted quantification o f education, income generation and time saving benefits to rural electrification (for the Philippines)17, these were estimated at US$95/year, compared to US$56/year for the directly estimated benefits (lighting, TV, etc.)
W o r l d Bank, 2002. Rural Electrif ication and Development in the Philippines: Measuring the Social and Economic Benefits, ESMAP Report 255102, Washington, D.C.
68

The table o n distribution of costs and benefits displays the l ifetime impacts o n stakeholders (expressed as l ifetime NPV at 14%, in US$lOOOs). Rows of this table represent individual transactions, and columns represent the costs and benefits incurred by each o f the stakeholders. The negative impact o n the distribution company (-US$104,000) arises because o f the difference .in discount rates and income taxes: if the calculations were at the 12% discount rate, and at zero income tax, then the net impact on the distribution company in NPV terms would be zero (since at the 12% pre-tax FIRR, the NPV i s exactly zero). The net economic benefit i s simply the sum o f the entries in each r o w with transfers, taxes and duties netted out.’8 Consumers with less than 100 kWh monthly consumption benefit f rom a cross- subsidy provided by the Fondo de Cornpensacion Social Electrica (FOSE), with equalization at the national level: this adds about 3% to the subsidy providers’ average electricity bill (and appears in the table o f distribution o f benefits and costs as “other consumers”). Public lighting i s similarly cross- subsidized by a complicated scheme equalized at the distribution company level: most o f the cost i s paid by large consumers with consumption greater than 5,00OkWh/m0nth.’~
Screening and Project Selection
Forty nine subprojects were submitted to MEM in M a y 2005 for potential funding under the proposed project. These were subjected to a preliminary screening for general economic and financial feasibility. About 20 o f these were resubmissions o f earlier proposals submitted to DEP, most o f which failed the SNIP hurdle rate for ERR (14%) and had O&M costs in excess o f probable tar i f f revenues. A short-list o f 17 projects was selected for more detailed analysis, that included extensive discussions with the distribution companies to verify technical assumptions.
The following screening criteria were used to select projects f rom the short-list: 0
0
0
Financial sustainability, which requires that tar i f f revenues must exceed the costs o f O&M and energy purchases; Minimum project size o f 1,000 HH (connected in the f i rst year); Max imum subsidy o f US$800/HH (based o n the number o f HH connected in the f i rs t year); Minimum ERR o f 14% (as currently required by the SNIP).
’* The GoP funds include those borrowed f rom the Wor ld Bank. The presentation ignores the additional transaction costs o f the loan (fees, charges and interest charged on the amounted loaned to GoP). However, these are relatively small amounts. l9 Mos t o f the distribution companies are VAT neutral (Le. VAT levied o n construction costs are offset by VAT receipts f rom electricity sales), so the financial and economic costs are a l i t t le different. Such differences as remain relate to import duties o n imported equipment: the shadow-priced economic costs are 97% o f the financial costs. However, there is a VAT exemption for the Selva, where electricity is classified as a “service” free o f VAT. However, a distribution company must st i l l pay VAT o n that port ion o f equipment imported f rom other parts o f the country, without the abi l i ty to recover i t o n electricity sales. This has l e d to significant losses, and the affected distribution companies have launched a court action in an attempt to change the rules.
69

Table 9.5: Economic Analysis
Economic Analysis Project 3 Company I N W ( I 4%) 0 I 2 3 4 5 6 7 8 9 I O I I
costs 6583.0 263.3 273.8 2848 2962 308.0 3204 333.2 346.5 360.4 374.8
connexion cost3 [$IOOO] 384.0 329.2 132 137 142 148 15.4 16.0 167 17.3 180 187 195 investment [$IOOO] 3772.0 4300.1 energy [$lOOO] 1343.5 170.4 179.0 188.0 1975 207.4 2179 228.8 140.4 2525 2652 2786 O& M [$ I0001 890.2 136.5 1393 142.1 1449 1478 150.7 153.8 156.8 160.0 1632 166.4 to-1 cos- [$lOOO] 6389.7 4629.2 320.1 331.9 344.3 357.2 370.6 384.6 399.3 414.5 4305 447.1 464.5
8eiierits
connexions added [#I
0
domestic flrst I5kWt[$lOOO] 5641 7651 7957 8276 8607 8951 9309 9681 10069 10471 10890 11326 0 15-30 kWh [$1000] 3570 4341 5035 5236 544.6 5664 5890 6126 6371 662.6 6891 7166 0 >30 kWh [$1000] 208 0.0 4.2 8 8 13.8 193 25.2 31.6 38.6 46.1 54.2 62.9
non-domestic first90 kW [$1000] 506 642 67.4 708 74.4 78.1 82.1 86.2 90.6 95.1 99.9 104.9 0 >PO [$10001 0 0.0 0.0 0 0 0.0 0.0 0.0 0.0 0.0 0.0 0.0 0.0
small Industry [$ IO001 0 0 0 0 0 0 0 0.0 0 0 0.0 0 0 0 0 0.0 0 0 0 0
special loads [$ I0001 0 0.0 0.0 0.0 0.0 0.0 0.0 0.0 0.0 0.0 0 0 0.0 public lighting [$10001 330 41 8 43.9 46.2 48 5 50.9 53 5 542 59.0 62.0 65 I 68.4 neteconomicflows [$ lOOO] 3866 -46292 1035.2 1082.9 1132.7 11848 1239.2 1296.1 13555 1417.5 1482.4 1550.1 1620.9 ERR 1b .5cs T O ~ I consumption [MWhlYr] 20203 2562 2691 2827 2969 3119 3276 344 3615 3797 3988 4189
levelired economii cost [$US/kWh] 0.32 levelized net economic bent [$US/kWh] 0 51
[Soles/kWh 1.78
consumers domestic consumers company GoP net benefit benefits Lil 8 -
= 4 - ?
O&M -890 ago z'
Electriciq Benefla 9419 506 9925 2 330 Publlc Llghting 330
costs Meters -384 -384 Ppoject cost -3889 117 .3772 '
INW@I4%, $USIOOOs1 8
Distribution of costs and benefits
In proleit beneficiaries domestic now otherdbtributton
- P -1344 -1344
$ 0 384
n r--
1 - 1 I
Table 9.6 shows the results o f the financial analysis screening, o n the basis o f which 10 projects meet al l of the f i rs t three (financial) criteria. Projects 20, 19 and 43 show distribution company contributions that are negative: these projects require a subsidy greater than the construction cost to make up for future revenues that are below O&M costs (i.e. they fa i l the test o f financial sustainability). These projects also fail o n grounds o f a subsidy requirement>US$800/HHH. Project 23 i s financially (and economically) attractive, but the beneficiaries are owners o f groundwater irrigation systems rather than HH, and therefore l ie outside the scope and objectives o f the project (which i s to electrify rural households). Overall, among the projects that meet the criteria, the average distribution company contribution i s 25.3%. The nine sub-projects have an average subsidy o f US$457/HH, which would take up US$l5.2 mi l l ion o f the available subsidy funds.
70

Table 9.6: Results of the Financial Analysis Screening
[ I ] [3] [4] [5] [6] D1 PI [ I O ] accepted
I Project I Company I 3264 3 5 3 5 2292 702 1931 592 I 5 8% 3 Project3 Company I 6583 30 70 4433 673 3762 57 I 15 I%
54 Project 54 Company 2 I188 23 29 657 553 480 434 270%
21 Project21 Company4 I590 5 5 19 71 3 448 378 238 469%
47 Project47 Company 5 3677 20 2685 1636 445 I93 5 3 88 2% 49 Project49 Company 2 I343 25 77 615 458 67 50 89 1 %
toed (average) accpeted p r o p c h 33235 4272 20335 612 15200 457 25 3%
4 Project4 Company I 9034 32 97 5731 634 4971 5 50 I 3 3%
14 Project 14 Company 3 2195 15 17 1021 465 827 377 189%
46 Project46 Company 5 436 I 25 1242 3237 742 2591 594 200%
repc ted , rubr1dy~800$ HH 5 Project 5 Company I 2 Project2 Company I
20 Project20 Company6 19 Project 19 Company8 43 Project43 Company 3
repc ted . less dtvt 1000 H H 23 Proiect23 Company7
2444 42 26 2333 955 2126 8 7 0 8 9% 2428 3 5 26 3331 1372 2658 1 0 9 5 20 2% 2108 35 8014 7208 3419 7209 3420 -0.0% I980 15 14 1584 800 1752 8 8 5 -106% I058 1 5 I1 1526 1442 1595 1508 -4 6%
0 0 I163 434 I70 60 8%
Table 9.7 shows the corresponding economic analysis. W e note the close alignment o f the results o f the economic analysis with the financial analysis. Projects with ERR less than the 14% hurdle rate also fail one or more o f the financial criteria; and three out o f four projects (2, 19, and 20), rejected o n grounds o f too high a subsidy, also have ERRS only marginally above the hurdle rate (15.5-16.1%). Whatever may be the uncertainty in estimating WTP, one may be confident that strict adherence to the financial screening criteria w i l l also select the best sub-projects f rom the standpoint o f economic returns. Because the economic costs include connection costs, even when taxes and duties are omitted, the average cost per HH (US$644/HH) remains higher than that shown in Table 9.5 (US$612/HH).
Table 9.7: Results of the Economic Analysis Screening
3 Project 3 Company I 4 Project4 Company I
54 Project 54 Company2 14 Project 14 Company 3 21 Project21 Company4 46 Project45 Company 5 47 Project47 Company 5
6583 30 2370 70 4629 703 0.32 26.5% 9034 32 3469 97 601 I 66 5 0.30 27.8% I188 23 326 29 697 587 0.32 27.7% 2195 15 395 17 1100 50 I 0.46 21.756 I590 5 5 IO49 19 77 I 485 0.18 42.4% 436 I 25 1308 1242 3358 770 0.26 35.3% 3677 20 882 2685 1771 482 0.16 59.1%
49 Project49 Company 2 I343 25 406 77 663 494 0.33 3 5.9% 33235 I I577 4272 21 387 644 31.7%
rejected, sribsidy>8001~HH 5 Project 5 Company I 2444 42 1232 26 2385 474 0.30 21.5% 2 Project2 Company I 2428 35 I020 26 3353 883 0.42 15.5%
19 Project19 Company 8 I980 1 5 356 14 1636 66 3 0 74 16.1% 20 Project20 Company6 2108 35 885 8014 7097 2631 021 15.5%
r e p c t e d , less t h a n IO00 HH 23 Project23 Company 7 35 Project35 Company 7
0 0 0 1163 42 I 0.1 I 40.4% 630 1 5 1 1 3 3 253 282 0.36 38.2%
r e p c t e d , ERR< 1.1% hurdle r a t e
( I ) including connexton cost excludingwes and duties 43 Prolect43 Company 3 1058 1 5 I90 I I 1533 1189 0 97 10.9%
71

Criteria for Selection of Projects
The criterion o f minimum size o f 1,000 HH i s based on a judgment o f transaction costs, and the l ikely abil ity o f the Project Implementation Unit (PIU) to process applications. In the f i r s t 49 proposals received f rom the distribution companies, 15 were for small projects o f less than 100HH, for which clearly the transaction costs for evaluation, approval, management and monitoring do not warrant consideration. The target number o f HH to be electrified i s 154,000, in projects ideally to be identified over four years, say 40,000 per year. I f the average size i s 4000, that means that 10 subprojects must be processed per year. Clearly if too large a proportion o f these were below 1000 HH, the workload o n the PIU would be unreasonable. The specific choice o f 1,000 HH therefore represents the judgment o f the Steering Committee o f what i s a reasonable minimum size.
The principal selection criterion o f minimizing subsidy per HH corresponds to the ma in objective o f the program, which i s to maximize the number o f rural households that can be connected with the available funding. Subsidy per HH and economic rate o f return are closely correlated, as shown in Figure 9.1, In other words, projects with the lowest subsidy per HH are highly l ikely to have the highest economic rate o f return (ERR).
Figure 9.1: ERR v. Subsidy per HH, Projects in the Short List
o'8 1 accept E
c 0.4
E
0.2 w L
reject
0 0
r e j e c t
1 2 3 4 subsidy/HH, 1 O O O $
One could o f course introduce multiple objectives (minimize subsidy per HH, maximize ERR or economic NPV, etc), but these would then require weighting schemes to produce rankings whose resulting rank order would be sensitive to the (subjective) weights chosen. However, the precision that results f rom such a weighting summation scheme i s judged spurious, and i s offset by the simplicity and transparency o f a single objective. In any event, no project less than the 14% SNIP hurdle rate wi l l be implemented. In sum, there i s high certainty that choosing the projects with the lowest U S $ subsidy per HH also corresponds to a selection o f projects that maximizes total economic benefits.
Environmental Benefits
Most o f the projects have negligible environmental effects: there i s some local air quality benefit to the displacement o f kerosene for lighting and diesel for battery charging, and some small increment to GHG
72

emissions f rom grid-based thermal generations2’ The only sub-projects that have more significant environmental impacts are those with significant industrial loads that displace diesel self-generation: however, many o f these projects would be financially viable without subsidy (and therefore did not enter the short-list).
Reconciliation of Financial and Economic Flows
40 p ro jec t beneficiaries domestic non- o t h e r distr ibut ion
consumers domestic consumers company GoP ne t benef i t benefits Electricity Benefits 44632 12238 56870 $ 30 Public Lighting 1128 2128 t CWtS M e t e m -1902 -1902 ,G Project cost -17838 5 3 5 -17303 5 O&M -3985 -3985 10
Tariff m e t e E - I902 I902
; 20
Energy cost -10012 -10012 2 0 0
consumption -13118 -3916 17035 0 .s public lighting -820 820 0 ; Transfer Pxyni ents = -10 FOSE 5053 642 -5694 0 Investment Subsidy 13572 -13572 VAT -1688 -622 -1082 3392
= 0 .
; -20
Table 9.8 shows a reconciliation o f the aggregate financial and economic flows o f the nine accepted projects o f Table 9.7. The Government o f Peru (GoP) funds include those borrowed from the Wor ld B a r k 2 ’ The distribution o f costs and benefits follows the general pattern observed in individual projects. The ERR i s 3 1.7%, and the NPV (of economic benefits at 14%) i s US$25.8 mill ion.
- -
-
-
I
-
Overall Program and Risk Assessment
While the economic returns and financial sustainability o f the nine projects selected from the shortlist may be confidently assumed, these account for only US$15.2 m i l l i on in subsidy and electrify only some 33,235 HH (in the first year), and take up only 16.5% o f the US$92.5 mi l l ion available for subsidy. Therefore three additional questions must be answered:
Are there a sufficient number o f additional rural electrification schemes -- that a l l meet the required SNIP criterion for ERR, and are financially sustainable -- to justify a US$92.4 m i l l i on subsidy program? If there do in fact exists a sufficient number o f additional projects, what i s the l ikely ERR for the project as a whole (which must meet the SNIP criterion no less than must individual projects)? H o w does such an overall program compare to the business-as-usual alternative (Le. to MEM’s current approach to rural electrification)?
0
0
0
2o These are preliminary calculations based o n general assumptions. Carbon emissions are valued at US$20/ton carbon equivalent. Local air emission damage costs are based o n Lvovsky et al., “Environmental Costs o f Fossil Fuels: A Rapid Assessment Method with Application to Six Cities”, W o r l d Bank Environment Department. October 2000. The Economic Analysis Report provides h r the r details. 21 The additional transaction costs of the loans (fees, charges and interest) are sufficiently small to be ignored in this summary.
73

I s there likely to be a sufficient number ofprojects to warrant a $92.4 million program?
From the preliminary screening it was observed that the key issue in both economic and financial feasibility i s monthly consumption, whose average was 22 k W H H / m o n t h for satisfactory projects, but only 16 kWh/HH/month for projects that failed the ERR criterion, Therefore, a narrower question can be posed, namely whether there are a sufficient number o f projects whose monthly consumption i s 2 2 / k W H H month or more.
The survey results can be used to answer this question. First, we hypothesize an average reference project based o n the characteristics o f the projects submitted to MEM to date. I f we assume a representative subproject size o f 4,000 HH, and an average subsidy o f US$600iHH, then we need to identify a total o f 39 projects to justify a U S 9 2 . 4 mi l l ion in total subsidy. As shown in Table 9.9, the assumptions are more conservative than those o f the average project that passed the short l is t .
T a b l e 9.9: T h e Reference Project
Reference Passed project Shortlist
(Table 9.7)
Typical consumption [ KWhiHHimonth] 22 25
Average subsidyIHH [$IHH] 600 457
Key assumptions
Average distribution company share [ ] 20% 25%
Costs per HH [$IHH] 750 612 HH per project [HHI 4000 3,690
Total Projects to be identified Subsidy amount [$million] $92.4m $15.2m Number o f HH connected [# HHI 154000 33,235 Number o f subprojects [#I 39 9
The survey results are easily aggregated by “conglomerate” (the basic unit used by INEI), each o f which represents some 4,900 HH. The universe o f unelectrified HH i s 2.2 mi l l ion. The average consumption in each electrified conglomerate i s readily calculated, and i s distributed as shown in Figure 9.2A: f rom this figure it i s evident that 70% o f all conglomerates have consumption o f 22 kWh/HH/month or more.
However, t h i s includes conglomerates that are in Departments already heavily electrified (such as L ima and Tacna). These are l ike ly to have a disproportionate number o f high consumption HH, and represent Departments not l ikely to be targeted by the proposed program. Therefore, if Departments w i th present overall electrification rates greater than 80% are excluded (Arequippa, Junin, Ica, Lambayeque, Lima, Moquegua, Tacna and Tumbes), then the universe o f unelectrified HH reduces to 1.19 mill ion, and the number o f potential projects (at the reference project size o f 4,000 HH) reduces to 298 potential projects. H o w l ikely i s i t that 39, or 13% o f these, have consumption o f 22 k W H W m o n t h ?
74

Figure 9.2: Percentages of Conglomerates (villages) with Monthly Consumption Greater than a Given Value
A. All conglomerates B. Excluding Departments with high electricity coverage
1.2
1
0.8 * .... .- - a 1 0.6 e n
0.4
0.2
0 10 20 30 40 50 60 70 80 90 100 0 average kW hlHHlmonth 0 10 20 30 40 50 60 70 80 90 100
average kW hlHHImonth
From the recalculated probability curve shown in Figure 9.2B, 52% o f (electrified) conglomerates have average electricity consumption o f 22 kWWHWmonth or more. Therefore 52% o f 298, or 155 projects, are l ikely to have the necessary consumption. Since 9 projects are already identified, 145 projects remain, out o f which the remaining 30 must be identified. Provided that consumption in unelectrified areas i s similar to consumption in electrified areas (captured by the survey), then there are over four times as many actual projects with 22 k W H W m o n t h as we need to find to consume US$92.4m in subsidy.
In fact, th i s condition is met, because in the past, MEM’s RE program emphasized electrification o f areas o f high poverty (but this also meant in areas o f l o w consumption). As shown in Figure 9.3, the distribution o f rural electrification by expenditure decile i s flat. In other words, the presently electrified areas (captured by the survey) have roughly similar average incomes as the unelectrified areas, Thus there i s no reason to suppose that potential consumption in the presently unelectrfzed areas (i.e. the market for the proposed project) would be any lower than in the presently electrified areas (which are represented in the curve o f Figure 9.2).
75

Figure 9.3: Electrification Rates of Conglomerates by Expenditure Decile 22
0.2 % m
0.1
0 4 I 5 I 6 I 7 1 8 1 9 lO[hig”l]
42% I 40% 1 34% 1 37% I 40% I 34% 1 42%
Thus we may reasonably conclude that:
0 The r i sks o f not finding 30 additional projects over the next three years, among 145 projects that are l ikely to have more than 22 kWh/HH/month, i s small. The market effort required to find these i s surely within the capabilities o f the project implementation unit;
The risk that consumption in the presently unelectrified areas wil l prove lower than in the presently electrified areas (whose actual electricity consumption i s known from the survey) i s very small;
The risk o f not consuming US$92.4million in subsidies, o n projects that meet the SNIP and financial sustainability criterion, i s extremely small.
0
0
Aggregate ERR of the entire program
The reference project, based o n the assumptions o f Table 9.8 - namely a cost per connection of US$750, and 22 kWh/HWmonth, has an ERR o f 20.5%. I f the additional 30 reference projects are assumed implemented in years 2 to 5 o f the project, then the aggregate ERR o f the overall program i s 23.8%.
The plausibility o f the reference project, and the use of 22 k W H W m o n t h as i t s monthly domestic consumption, may be confirmed by a simple calculation of sustainability. Even without non-domestic consumption, a project of 22 k W H H / m o n t h would s t i l l be financially viable, as shown in Table 9.10: this project has an average net revenue to the distribution company o f 30 soles/HH/year. This i s clearly not true of a project with an average o f only 11 k W H H / m o n t h .
22 Use o f income deciles wou ld be preferred, but these are s t i l l in preparation f r o m the survey database. However, INEI data show h igh rank correlation between average income and expenditure aggregates (the Department with the highest average income also has the highest average expenditure, etc.), so the effect o n decile classifications i s not expected to be significant.
76
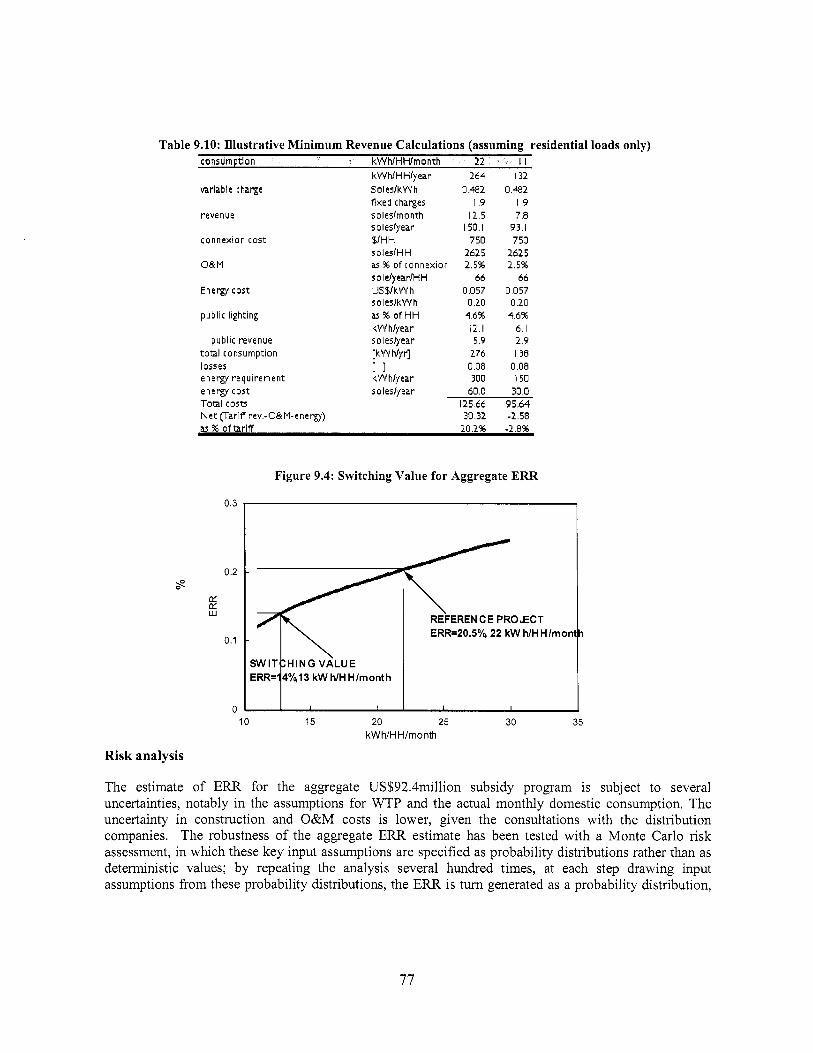
Table 9.10: Illustrative Minimum Revenue Calculations (assuming residential loads only) consumption kW h/HH/month 22 I I
variable charge
revenue
connexion cost
0 & M
Energy cost
public lighting
public revenue tom1 consumption losses energy requirement energycost
Net (Tariff rev.-O&M-energy) Tom1 COSG
k W hlHHlyear 264 132 SoleslkWh 0.482 0.482 fixed charges I .9 I .9 soleslmonth 12.5 7.8 soleslyear 150.1 93.1 $lH H 750 750 soies/H H 2625 1625 as % of connexior 2.5% 2.5% solelyeadHH 66 66 US$lkW h 0.057 0.057 soles/kWh 0.20 0.20 a s % o f H H 4.6% 4.6% k W hlyear 12.1 6. I
[kW hlyr] 276 138 0.08 0.08 300 150 k W hlyear
soles/year 60.0 30.0 125.66 95.64 30.32 -2.58
so ledyear 5.9 2.9
[ I
0.3
0.2 s
cc cc w
0.1
0
Figure 9.4: Switching Value for Aggregate ERR
SWIT HINGVALUE iRR= 4%13 kW hlHHlmonth F
REFERENCE PROSECT ERR=20.5% 22 kW hlH Hlrnon
10 15 20 kWhIH Hlmonth
Risk analysis
h
25 30 35
The estimate o f ERR for the aggregate US$92.4mill ion subsidy program i s subject to several uncertainties, notably in the assumptions for WTP and the actual monthly domestic consumption. The uncertainty in construction and O&M costs i s lower, given the consultations with the distribution companies. The robustness of the aggregate ERR estimate has been tested with a Monte Carlo r i sk assessment, in which these key input assumptions are specified as probability distributions rather than as deterministic values; by repeating the analysis several hundred times, at each step drawing input assumptions from these probability distributions, the ERR i s turn generated as a probability distribution,
77
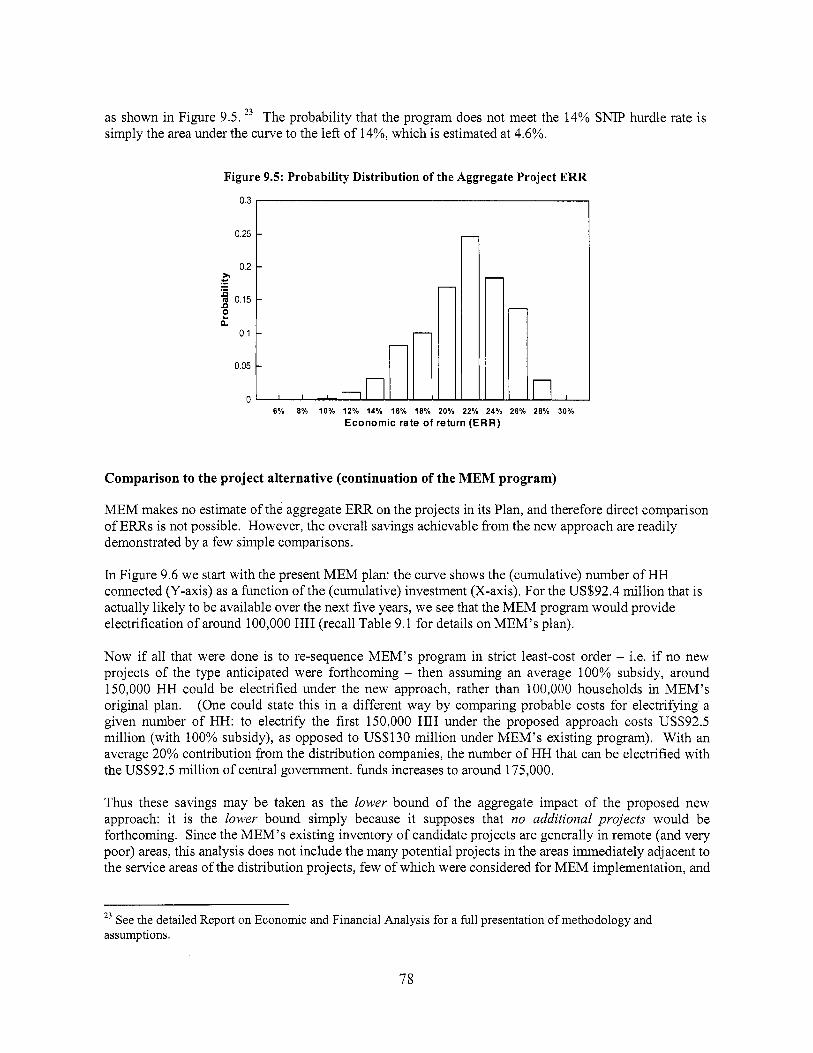
as shown in Figure 9.5. 23 The probability that the program does not meet the 14% SNIP hurdle rate i s simply the area under the curve to the left o f 14%, which i s estimated at 4.6%.
Figure 9.5: Probability Distribution of the Aggregate Project ERR
0’3 I 0.25
0.2 sr 94 .- - s m 0.15
e n P
0.1
0.05
0 II Comparison to the project alternative (continuation of the MEM program)
MEM makes n o estimate o f the aggregate ERR o n the projects in i t s Plan, and therefore direct comparison o f ERRS i s not possible. However, the overall savings achievable f rom the new approach are readily demonstrated by a few simple comparisons.
In Figure 9.6 we start w i th the present MEM plan: the curve shows the (cumulative) number o f HH connected (Y-axis) as a function o f the (cumulative) investment (X-axis). For the US$92.4 mi l l ion that i s actually l ikely to be available over the next f ive years, we see that the MEM program would provide electrification o f around 100,000 HH (recall Table 9.1 for details o n MEM’s plan).
N o w if al l that were done i s to re-sequence MEM’s program in strict least-cost order - i.e. if no new projects o f the type anticipated were forthcoming - then assuming an average 100% subsidy, around 150,000 HH could be electrified under the new approach, rather than 100,000 households in MEM’s original plan. (One could state th i s in a different way by comparing probable costs for electrifying a given number o f H H : to electrify the f i rs t 150,000 HH under the proposed approach costs US$92.5 mi l l ion (with 100% subsidy), as opposed to US$130 m i l l i on under MEM’s existing program). With an average 20% contribution f rom the distribution companies, the number o f HH that can be electrified with the US$92.5 mi l l ion o f central government. funds increases to around 175,000.
Thus these savings may be taken as the lower bound o f the aggregate impact o f the proposed new approach: i t i s the lower bound simply because it supposes that no additional projects would be forthcoming. Since the MEM’s existing inventory o f candidate projects are generally in remote (and very poor) areas, t h i s analysis does not include the many potential projects in the areas immediately adjacent to the service areas o f the distribution projects, few o f which were considered for MEM implementation, and
23 See the detailed Report o n Economic and Financial Analysis for a full presentation o f methodology and assumptions.
78

which are l ikely to have lower capital costs (per connected household) because they have higher load densities, and are more l ikely to have productive uses.
Figure 9.6: Comparison of the Proposed Program with the MEM Alternative
MEM PLAN RESORTED IN LEAST COST ORDER, 80%
MEM PLAN RESORTED IN LEAST COST ORDER, 100%
50 100 150 cumulative investment, $million
200
B. SMALL HYDRO Peru has significant potential for small run-of-river hydro schemes, both as adjuncts to existing irrigation schemes (in the coastal regions), as wel l as in the hydro-rich Selva. Table 9.11 shows a sample o f identified projects, the f i r s t o f which, Santa Rosa, i s currently being implemented (with carbon sales to the Community development Carbon Fund). Most have satisfactory ERRs in the range o f 14-22%; only one (El Sauce) fails to meet the hurdle rate. When carbon emission reduction benefits are valued at US$5/ton C02 (the purchase price obtained by the Santa Rosa project), ERRs increase by 1-1.5%.
Table 9.11: Small Hydro Schemes Tarucani Moche CMulato El Sauce Graton Tanguche Quitaracsa I Santa Santa
Z&ZZ zz Rita R~~~
Data Installed capacity [MW] 49 20.6 8.6 9.4 5 30.3 114.6 170 4.1 capital cost [$USml 54.3 16.7 8.7 11.7 5.1 27.5 119.9 137.0 3.6
costikw [MWI 1108 812 1008 1239 1029 908 1046 806 872 construction time [years] 2 3 2 2 2 1.5 3 3 1.5
annual O&M cost [$USm] 2.56 0.50 0.24 0.21 0.13 0.74 2.00 3.16 0.11 [as%of capital] [ ] 4.7% 3.0% 2.8% 1.8% 2.6% 2.7% 1.7% 2.3% 3.0%
load factor [ ] . 85.7% 55.5% 69.1% 48.1% 63.2% 80.3% 63.5% 66.4% 83.5% Generation [ GWhgiyear] 368 100 52 40 28 213 63 8 989 30 Economic returns ERR 16.6% 14.7% 16.0% 8.6% 14.3% 21.9% 13.5% 18.3% 22.6% ERR with carbon 17.7% 15.7% 17.1% 9.3% 15.3% 23.3% 14.3% 19.4% 24.0%
79

As shown in Figure 9.7, the estimated ERRS are strongly correlated wi th load factor: those with load factors above 70% are typically associated with irrigation schemes that benefit f rom upstream regulation.
Figure 9.7: ERR v. Annual Load Factor
025 I I
0.2
6 015
0 1
0 %t;fata
8auca 0 C.MuIil0 0 Moche 1811 Grdon
0 Quitaaza I
0.05 0.4 0.5 0.6 0.7 0.8 0.9
annual load factor
The critical assumption i s the assumption for valuation o f economic benefit: the calculations shown above use the Santa Rosa PPA price (based o n the busbar price o f the interconnected system at the Huacho substation namely power: US$lO/kW-month, and energy 3.86 UScentdkWh peak, and 2.85/kWh of f - peak). This matches wel l the average (energy only) spot market price o f 3.35 UScentdkWh, used as the baseline benefit estimate. The ERR i s robust wi th respect to th is assumption, as shown in the sensitivity analysis o f Figure 9.8. One estimate o f LRMC (that pre-dates the recent increases in international o i l and gas prices) i s somewhat lower, at 2.27 UScentdkWh; the resulting ERR i s s t i l l 18.8%. Indeed the switching value i s 2,05UScents/kWh, which implies wor ld o i l prices below US$25/bbl. One may therefore be confident that there exist many small hydro projects with good economic returns, that warrant support f rom the proposed small hydro finance facility.
Figure 9.8: ERR v. Benefit Assumption (for Tanguche 11)
O 3 I 0 25
m 02
0.15
0.1 15 2 25 3 35 4
Eco~ion~ic I,rncfit, UScc~its/l~WI~
80

Financial Cashflow to the Small Hydropower Facility
Table 9.11A below contains a cashflow for the proposed facility. I t i s an excerpt f rom a larger financial model for the Small Hydropower Finance Facil ity that i s available in the Project files. This analysis shows that the revenues from interest payments would be more than sufficient to cover the costs o f the facility, after the first two years.
81

N 00

Pv SOLAR HOMES
The economic cost o f a 50 Wp PV system, (based o n quotations for 1,000 systems, including retail margin, but excluding a l l taxes and duties) i s estimated at US$564. Operating and maintenance costs are as shown in the economic and financial analysis o f a representative system shown in Table 9.12. The general business model would be analogous to that proposed for grid extension, with enterprises bidding for subsidy o n similar criteria.
Table 9.12: Economic and Financial Analysis, PV Systems
RMefitS KWhhonth [KWhhnonth] 10 10 10 10 10 10 10 10 IO 10
B W h M W 12013 12013 I1013 I2013 I2013 I2013 12013 11013 12013 12013 WTP 389 [SolaskWh]
1 . 1 I W W h ] [U~*wl 1332 1332 1332 1332 1332 1332 1332 1332 1332 1332
corn Capid Cost [Bus1 563 6 Battery 60 [8US] 60 60
Li$?tc WJSI 1513 1513
tota costs w 5 1 56364 12130 12130 12130 87130 12130 12130 12130 87130 12130 57130
Net economic flows 5 6 4 1212 1212 1212 462 1112 1212 1212 462 1212 7 6 2 ERR 18.1%
Reglators PUS1 45
Balance of maintenance co[BUS] 121) I213 I213 1113 1213 I213 1213 I213 1213 1213
The economic benefits are based o n the P V system delivering the same level o f service as a grid customer consuming 10 kWh/month (sufficient for lighting, radiohound equipment, and possibly even for B&W TV) - a pattern o f use verified by the survey results. The capital costs include the costs o f two 1 1 W CFLs for each HH. This consumption i s valued at the WTP for lighting (US$1.1 l/kWh for the init ial tranche o f kWh consumption, see Annex below), and which results in an ERR o f 18.1 %.
The financial analysis, and the determination o f financial cost, i s complicated by VAT, the business model that applies, and the region in question. One o f the difficulties i s the VAT exemption that applies in the Selva, but only provided the company in question i s headquartered in the Selva. “Electricity service” i s VAT exempt in the Selva, which as noted above creates problems even for conventional grid- based service. Three cases may be considered, as indicated in Table 9.13.
Table 9.13: Business Models
( 1 ) (2) (3) Region Costa/Sierra Costa/Sierra Selva Implementing entity Distribution Other Distribution
company company company
Consumers pay VAT on electricity Yes No existing No, VAT service customers exempt Effective financial cost of system USS591 USS708 USS618
(e.g.Tenesoi)
83

Table 9.14 shows the financial analysis for Business Model 1, which involves a VAT neutral distribution company. The distribution company requires a 49% subsidy, US$292/HH, to obtain a 12% rate o f return. The incremental VAT revenue collected by the Government occurs only once customers are bi l led for their monthly service charge: this i s analogous to the grid extension case, which i s similarly VAT neutral in the construction phase.
Table 9.14: Financial Analysis, Business Model 1 NW 0 I 2 3 4 5 6 7 8 9 I O I I I 2
& c l b d i l 5 Monthlychay 20 [Soleshonth]
Relenue [BUS1 398 69 69 69 69 69 69 69 69 69 69 69 69 531 [BUShonth]
Cor6 Capital Cost Wl 518 591 Battery 60 BUS] 67 60 60 60
Li*o [BUS] 17 15 15 15
total cos8 [BUS] 682 591 I2 I2 I 2 87 12 I 2 I 2 87 12 57 I1 87
Replaton [BUS] I I 45
G M olerheads [BUS] 70 12 12 I 2 12 I 2 I1 12 12 I 2 I 2 I 2 I1
Net financial flow -284 5 9 1 57 57 57 -18 57 57 57 -18 57 I 2 57 -18 FlRR no subsidy 2 9 % Subsidyrequired to achiew 12% FlRR -256 -292
49 % IS %of capital cost Disbibution company equity 51% clolrrrllnrl carlrn4wr connefion cost
VAT 13 13 13 2 3 2 3 2 3 2 3 2 3 2 3 2 3 2 3 2 3 2 3 tot4 cost 83 OD 143 143 143 143 143 143 143 143 143 143 143 143 Govr Rcveirnr Sub s id y -156 -291
monthlysenice c h a y 70 l2D I1D 12D 12D 12.0 120 120 120 1213 I1D I1D 12D
VAT 13 2 3 2 3 2 3 2 3 2 3 2 3 2 3 2 3 2 3 2 3 2 3 13 tot4 -243 -292 13 2 3 2 3 2 3 13 2 3 2 3 2 3 2 3 2 3 2 3 2 3
If there i s no VAT exemption (business model 2 o f Table 9.13), the subsidy required increases to 58% (US$41O/HH). However, overall, the Government i s better o f f (in NPV terms), with a net cost (subsidy and VAT) o f US$267 (as opposed to US$243 in business model 1). Finally, in the case o f business model 3 (distribution company in the Selva), the subsidy required i s US$320/HH, and the net cost t o the Government i s US$280. The influence o f VAT regime differences wil l need to be considered in any competitive solicitation for PV subsidy.
A metered tar i f f i s not meaningful for a P V system, and therefore the business model requires a flat monthly charge (that would be set according to the size o f the panel, here assumed at 50Wp). The subsidy requirement wil l then be inversely proportional to the value o f this flat monthly charge as shown in Figure 9:9 (The amount actually paid by the consumer i s reduced by FOSE to 50% o f this). For a 15 Sole/month charge, the distribution company would require a 75% subsidy contribution (US$508/HH, which i s lower than the subsidy proposed for grid electrification in four o f the nine projects shown in Table 9.5). Clearly the subsidy requirement would be further reduced by whatever up-front contribution i s made by the household: for the sake o f equity (compared to households charged for a grid connection) and in the interest o f motivating due care and attention to the system, some such contribution should be made.
84

Figure 9.9: Subsidy Requirement for PV System v. Monthly Charge
I 120
loo s -0- ,: 80 3 E 3 60
v) 4
40
20
'
'
'
0 1 I I I 0 10 20 30
Fixed monthly charge, Soles 40
85

Attachment 1 to Annex 9: Methodology for Estimating Willingness to Pay (WTP)
The methodology adopted for the economic analysis to establish W T P follows that used in a number o f other countries for rural electrification projects (Philippines, Bol ivia, Vietnam, among others). Section 4 o f the economic analysis report provides a complete description o f the methodology.
Willingness-to-pay i s the area under the demand curve, as illustrated in Figure 9.10; for the case o f l ighting (similar curves may be drawn for other services such as TV viewing). The demand curve i s downward sloping, and typically has a shape that i s concave (with respect to the origin). This shape frequently emerges where more than two points on the curve can be plotted (here only the points x and y are assumed known). The concave shape also follows f rom the (convenient) assumption o f constant elasticity (an assumption often made in econometric models).
Figure 9.10: Demand curve for lighting price
Before electrification, these services are typically provided by a m i x o f kerosene, candles, dry cells and car batteries (for lighting) and dry cells and car batteries (for radio and TV). In this example, for simplicity, assume that the only service provided i s l ight ing provided by kerosene lamps: the quantity o f services so consumed i s QKERO, at the price PKERO. The total household expenditure on l ighting is therefore QKERo x PKERo, equal to the area B + D.
The total willingness to pay (WTP) for the service at level Q m R o i s the total area under the demand curve to that level o f consumption, Le. areas A + B + D. This i s the total benefit to the consumer. However, the cost is area B + D, and therefore the net benefit, also called the consumer surplus, is the difference between the two, namely the area A.
After electrification, the level o f service (in the case o f lighting, the number o f lumen-hours) typically increases substantially; consumption increases f rom QKERo to QE, but the price paid for the electrified service also falls (typically) f rom PKERO t o PE. N o w the household’s expenditure for electricity i s PE x QE, equal to the area D+E.
At this level o f consumption, the total area under the demand curve to QE, i.e. the total benefit, is n o w the area A + B + C + D +E. Therefore the net benefit, o r consumer surplus, after subtracting the cost D +E, i s A + B + C. Thus i t follows that the net economic benefit o f electrification is the increase in consumer surplus, which is the area B + C.
Areas B, D and E are readi ly calculated f rom knowledge o f consumption before and after electrification, f rom the household budget for kerosene (and battery charging), and f rom the tar i f f o f electrified service: i.e. given knowledge of the two points on the demand curve x and y , the areas B, D and E are immediately calculable. But area C is more
86

diff icult to estimate, since i t requires knowledge o f the shape o f the demand curve between points x and y . The most convenient assumption- and therefore the one most frequently encountered -- i s that the demand curve is linear. Unfortunately such an assumption will lead to an overestimate o f the area C, and o f the net benefits o f electrification, because the empirical evidence i s that in fact the demand curve i s much more l ike ly to have a concave shape, as shown in Figure 9.10.24 Given some functional form for such a demand curve, the area C i s readily calculated as the definite integral: here we use a standard functional specification with constant elasticity p
r D i p L 'JJ
whose corresponding area C (e.g. between QKERo and QE) easily calculates f rom the corresponding definite integral.
TV viewing
TV viewing i s one o f the most desired aspects o f electrification, and many non-electrified households devote significant money and t ime for auto-battery charging. In Peru, the survey estimates that 17% o f non-electrified households use car-battery charging, the ma in use o f which i s for TV. The cost can b e calculated f rom survey- provided information about appliance wattage and appliance use, and f rom expenditure data o n the cost o f batteries, and the costs o f recharging. The average HH using auto-batteries spends 15.3 Solesimonth o n this TV viewing (including some use o f radios, sound equipment). Calculations show that on average, auto-batteries provide 4.2 ki lowatt hoursimonth, f rom which point x in Figure 9.11 calculates to 3.61 solesikWh (US$l.O4ikWh). Once electrified, on average, kilowatt-hour use for TV (and related equipment) increases to around 11 kWh (in consequence o f increased use o f color TV and higher-wattage appliances and to a greater number o f TV-watching hours. The average price o f electricity o f course falls dramatically to about 0.61 SolesikWh. The total area under the demand curve(areas B + C + D + E in Figure 9.10) then calculates to 24.9 solesiHHimonth, and hence the average W T P (over the 11 kWh consumed for TV-viewing) is 2.26 SolesikWh.
Figure 9.1 1 : Demand curve for N-viewing
4
3
7 ' 2 - 0 v)
1
0
Lighting
B = I ? 3
D=? 5 E l 4 2
0 2 4 6 8 10 1 2 kWh 'nboiitli
Table 9.15 shows the assumptions for the derivation o f W T P for lighting, which i s estimated at US$1.1 likWh for HH making the transition f rom kerosene l ighting to electricity.
24 Recognising this problem, some studies (e.g. the W o r l d Bank's Solar Homes project in Bolivia) take the area Cas one third o f the area determined by a linear demand curve.
87

Table 9.15: Lumen consumption Peru Bolivia Philippines Laos
QKERO kLhimonth 4.6 7 4.1 20 QELEC kLhimonth 363 90 204 435
Assumptions
PKERO $ per kLh 0.57 0.48 0.36 0.195 PELEC $ per kLh 0.01 0.04 0.0075 0.003 Results
-1.08 -1.03 ** -0.74 1.45 3.84 B $US 2.58 3.08
C $US 9.95 5.56 35.20 6.05 D $US 0.05 0.28 0.03 0.06 E $US 3.58 3.32 1.50 I .25 total WTP (per HWmonth) $US 16.16 12.24 38.18 11.20 average kwh KWh 14.5 average WTPlkWh $USkWh 1.11
Elasticity [ I
kLh = kilo-lumen-hour Bol iv ia data from Annex 9, ERTIC Project PAD, 2003. Philippines data from ESMAF', Rural Electri jkation and Development in the Philippines: Measuring
Laos data from PAD, 2"d Southern Provinces Rural Electrification Project, 2004 ** Based on linear demand curve!
The Social and Economic Benejts, Report 255102, May 2002.
Table 9.15 also shows the comparable results f rom three other studies, Bol ivia, Laos and the Philippines. The Peru results are consistent with those in Bol iv ia and Laos, but significantly lower than those o f the Philippines. This i s due to the latter's use o f a linear demand curve: when the constant elasticity demand curve i s used, the Phil ippine result reduces to a total benefit o f US$7/HH/month. As can be seen f rom Figure 9.12 which shows the lumen-hour demand curve for Peru, the benefit is almost entirely determined by the area C, and hence the assumption made for the shape o f the demand curve is critical.
Figure 9.12: Demand curve for lighting (lumen-hours) 0.4
0 50 100 150 zoo 250 Idll, I l l O l l t l l
Table 9.16 shows the estimates o f average W T P for l ighting by region.
Table 9.1 6: Estimates of WTP for lighting, by region (US$/kWh) Peru Costa Costa Costa Sierra Sierra Sierra Selva
Norte Centro Sur Norte Centro Sur average WTP/kWh 1.19 1.29 1.08 1.13 1.20 1.17 1.45 1.19
88

Attachment 2 to Annex 9: Summary for Typical Rural Electrification Sub-project
Project 3 Company 1
PROJECT CHARACTERISTICS F I N A N C I A L VIABILITY First-year domestic connexions 6583
Produductive use [MWhlyr] 70.2 Distribution company equity share 15.1% Avenge domestic load p e r connxion 30 Project FlRR before subsidy -4.2%
[as%tOUl] 3%
(92 1 %) domestic
(2 9%) non-domestic (5 0%) public lighting
E C O N OM I C V I AB1 L lTY Summary investment, s u bsidyl
ERR 26.5% H H Investment H H subsidy H H ieveiized economic cost [BUSlkWh] 0.32 first year H H connected 6583 4433 673 3762 57 i ieveiized net economic benefit [BUSlkWh] 0.51 at end of project (5th year) 7777 4433 570 3762 484
Foles/kWh i .78 avenge numberofHH 10226 4433 434 3762 368 economic cost per [first year H H connexion) [BIHH] 703 end of planning horizon I3869 4433 320 3762 271
subsidyas % ofinvestment cost 8 5% Diroibution o f r o r a ondbenefia
I 0 2
--u- hurdle rate: FIRR=12%
er
I I
-0.1 I 0 0.2 0.4 0.6 0.8 1 1.2
- 4 ~
doinertic o t h e r coi isi i i i iers OoP tion domert ic Dirtr. Co. N e t Benef i t D i s t r i b u t i o n coi i iyany e q u i t y share
89

Annex 10: Safeguards Policy Issues
PERU: R u r a l Electrification
Environment
The Project i s expected to have a positive environmental impact due to the reduction o f COz emissions through the use o f renewable energy in rural areas for provision o f electricity. This i s a National Project with specific locations for projects that were determined during project preparation and others expected to be identified during implementation. Such locations include rural areas o f Peru currently without electricity service. An environmental assessment has been undertaken, identifying any possible negative environmental effects due to the installation o f equipment and other minor works proposed by the project. The assessment has concluded that the probability o f negative environmental effects i s very small.
The Project i s classified as Environmental Category: B (Partial Assessment).
The Environmental Assessment (EA) includes: (i) a br ief summary o f the potential for renewable energy projects in Peru; (ii) a proposal for screening criteriaiguidelines and management procedures for al l investment sub-components, ensuring compliance with the Bank's safeguard policies and the local legislation; (iii) an outline o f the main environmental issues, and (iv) main environmental aspects to be included in the bidding documents.
What are the main features of the EMP and are they adequate?
Each investment activity w i l l be screened using the environmental framework, and Environmental Management Plans (EMPs) wi l l be developed consequently using the environmental guidelines provided in the Environmental Assessment. E M P wi l l be developed as an inherent part o f the preparation o f each transaction, and i t s conclusions and recommendations w i l l be integrated into the contracts with private sector providers that wi l l be responsible to install, operate and maintain the electricity systems. The appropriate procedures wi l l be described in the Operational Manual.
B o t h the environmental framework and guidelines include specific provisions mandated by OP 4.37 Safety o f Dams for the construction o f new small dams (<lorn), i.e. the design and construction o f a new dam has to be supervised by experienced and competent professionals and requires the adoption o f certain dam safety measures for the design, bid tendering, construction, operation, and maintenance o f the dam and associated works.
How have stakeholders been consulted at the stage of (a) environmental screening and (b) draft EA report on the environmental impacts and proposed environ,ment management plan? Describe mechanisms of consultation that were used and which groups were consulted?
The main stakeholders were consulted as a part o f the process o f the preparation o f EA and guidelines. Additional consultations (rural communities) are planned during the implementation o f the Project, as a part o f the preparation o f EMPs. The EA i s available at the offices o f the Project Management Unit (PEU) and in Wor ld Bank's Infoshop. Future EAs and EMPs wi l l similarly be made available to the public.
What mechanisms have been established to monitor and evaluate the impact of the Project on the environment? Do the indicators reflect the objectives and results of the EMP?
90

Mit igat ion measures wil l be included in the contractors' bidding documents and environmental indicators wi l l be monitored by the PMU. The overall impact o f the Project o n greenhouse gas reduction wi l l be monitored as a key output indicator.
Social
The Project could trigger the two social safeguard policies (OD 4.20 and OP 4.12), depending o n site characteristics and specific subprojects designs. Because the Project i s demand-driven, we do not know before implementation the locations where i t wi l l be implemented. In order to comply with these policies and to avoid unnecessary adverse impacts as wel l as to ensure that the most poor and vulnerable peoples benefit f rom project implementation, the borrower has prepared two frameworks that have been reviewed by the social safeguard specialist in the team who have found them acceptable to the Bank: an Indigenous Peoples Development Framework (PDF) and a Resettlement Policy Framework (RPF).
The PDF depicts the process and the principles by which Indigenous Peoples Development Plans would be prepared if the pol icy i s triggered due to i t s implementation in lands owned or used by Indigenous Peoples in the highlands and the upper selva regions, or whenever P become beneficiaries o f the Project. The PDF also provides an assessment o f the social, economic and cultural traits o f the Indigenous Peoples in these regions, as wel l as demographic information; and assesses the impacts, both adverse and positive ones that the Project might have in these communities. I t includes a thorough legal framework, both national and international, that supports Indigenous Peoples rights in Peru.
The PDF has been submitted to a preliminary consultation. One consultation was held in the highland ci ty o f Huancavelica, o n July 20, 2005 wi th participants representing peasant communities, producers associations and local authorities. A second consultation was held in the central upper selva, in the town o f Pichanaki o n July 24, 2005 with participants representing indigenous communities, indigenous organizations and members o f the electrification district committee. These consultations have provided useful feedback regarding the kind o f productive activities that these communities would l ike to develop when having access to electricity.
The provision o f electricity to rural communities in the highlands and upper selva in Peru could have the following positive outcomes that would contribute to reduce poverty levels:
Implementation o f productive activities for transforming agricultural and forest produce and optimize their use; Improvement in health and education services; Creation o f employment due to the diverse productive uses o f electricity; Improvement in family income due to new productive opportunities; A better and more balanced link o f Indigenous Peoples to the market; Improvement o f infrastructure for tourism; and Better l i n k s between the rural areas and isolated areas through communication systems.
0
0
0
0
0
0
Both in the highlands and the upper selva, the people consulted welcomed the idea o f having electricity but the indigenous peoples in the upper selva expressed concern about the payment o f tariffs. Andean peasants and selva settlers are more prone to make productive uses o f electricity for their economy i s more l inked to the market than the one of the indigenous peoples o f the selva region. The latter wi l l require more time to adapt as wel l as more capacity building support to take advantage o f the use o f electricity. Those consulted were also more inclined to favor conventional energy sources rather than of f - grid alternatives. They also expressed their willingness to support the Project with the implementation of forest management and water usage in the case o f small hydropower facilities.
91

I t i s worth noticing that the indigenous communities o f the upper selva are mostly found in the departamentos o f Amazonas, Cusco, Junin and Pasco. Whi le those departamentos with the higher number o f Quechua and Aymara speakers are Apurimac, Ayacucho, Huancavelica, Cusco and Puno. The IPDF also provides information on those rural areas where access to electricity i s most marginal or does not exist.
Finally, the PDF explains the institutional arrangements that according to the Peruvian legal framework are needed for the implementation o f PDPs . I t has identified two institutions for this purpose: INDEPA, which has been recently created and s t i l l lacks adequate budget and personnel, and the Project Management Unit within the MEM, which w i l l be responsible for the preparation o f PDPs. This unit wi l l include a social specialist to manage a l l social issues related to the project.
A Resettlement Policy Framework for Rural Electrification Sub-Proj ects and Small Hydropower Facilities has been prepared by the Borrower in case the policy i s triggered due to c iv i l works, rights o f way for transmission lines and water usage for hydropower facilities. Due to the small sizes o f the required works, i t i s very unlikely that the policy w i l l be triggered regarding physical displacement o f affected populations. I t i s more l ikely though that the pol icy wi l l be triggered due to land acquisition, rights of way or water usage. Nonetheless, the RPF details the process, the criteria and the principles to be followed for the preparation o f site specific Resettlement Plans as required by the policy.
This framework also depicts the legal framework and explains the role o f the various institutions involved in resettlement activities in the country such as CONATA, PETT, etc., and identifies the Project Management Unit as the entity responsible for the preparation o f RAPS and the DGAAE as the unit in charge within the MEM for the supervision and monitoring o f these activities.
Both frameworks were disclosed pr ior to appraisal in the country and in the Infoshop and w i l l be included in the Operational Manual for the project.
92

Annex 11: Project Preparation and Supervision
PERU: Rural Electrification
Planned Actual PCN Review 08/03/2004 In i t ia l PID to PIC In i t ia l ISDS to PIC Appraisal Negotiations BoardIRVP Approval Planned Date o f Effectiveness Planned Date o f Mid-Term Review Planned Closing Date
08/06/2004 11/08/2004 08/09/2004 08/09/2004
10124/2005 0911 5/2005 01/04/2006 03/09/2006 07/01/2006 0113 112009 1213 1/20 12
K e y institutions responsible for preparation o f the project:
Ministry o f Energy and Mines
Bank staff and consultants who worked on the Project included:
Name Title Unit Susan V. Bogach Sr. Energy Economist, Task Team LCSFE
Demetrios Papathanasiou
Isabella M ica l i Drossos Patricia M c Kenzie Regis Cunningham Robert O’Leary Keisgner Al faro R. Ani1 Cabraal Alonso Zarzar Casis Douglas French Barnes Malco lm Cosgrove-Davies I r i s del Val le Oliveros Eduardo Zolezzi Luis M. Vaca Soto Roberto Gabriel Aiel lo Nicolas Drossos Peter Meier Laura Wendell Berman Albert0 Didoni Chris Rathnayake TTA and I M 3 , Spain
Leader Energy Economist, Co-Task Team Leader Senior Counsel Sr. Financial Management Specialist Sr. Finance Officer Sr. Finance Officer Sr. Procurement Specialist Lead Energy Specialist Sr. Social Scientist Sr. Energy Analyst, Peer Reviewer Sr. Energy Analyst, Peer Reviewer Task Team Assistant Consultant Consultant Consultant Consultant Consultant Consultant Consultant Consultant Consultants
LCSFE
LEGLA LCOAA LOAGl LOAGl LCOPR EWDEN LCSEO EWDES AFTEG LCSFE LCSFE LCSFE L C S E N L C O A A L C SFE LCSFE LCSFR
93

Bank funds expended to date on project preparation:
1. Bank resources: US$447,150 2. Trust Funds: (US$l06,000 Spanish CTF);
(US$29,000 Italian CTF); (US$74,800 PHRD); (US$40,000 GEF PDF)
Sub-total Trust Funds: US$249,800 3. Total: US$696,950
Estimated approval and supervision costs: 1. Remaining costs to approval: 2. Estimated annual supervision cost:
US$17,000 US$120,000
94

Annex 12: Documents in the Project File
PERU: Rural Electrification
A. Bank Staff Assessments
Mission Aide MCmoires Project Concept Note Procurement Capacity Assessment Financial Management Assessment
B. Other Documents
Plan de Electrificaci6n Rural 2004, Departamento Ejecutivo de Proyectos, Ministerio de Energia y Minas
Propuesta Para un Nuevo Marco General para Electrificacion Rural en el Ped , NRECA, January 2005 (PPLAF assisted)
Ley Modelo de Elect r i f icac ih Rural, Junio, 2005 (PPIAF assisted)
Informe de E v a l u a c i h de 10s Sub-proyectos, Trama-Tecnico Ambiental con I M 3 Ingenieros Emetres, S.L., Agosto 2005
Economic and Financial Analysis
Draf t Operational Manual including Policy Frameworks for Environment, Resettlement and Indigenous People’s Management Plans
Results o f National Rural Energy Survey (forthcoming, w i th support f rom ESMAP)
95
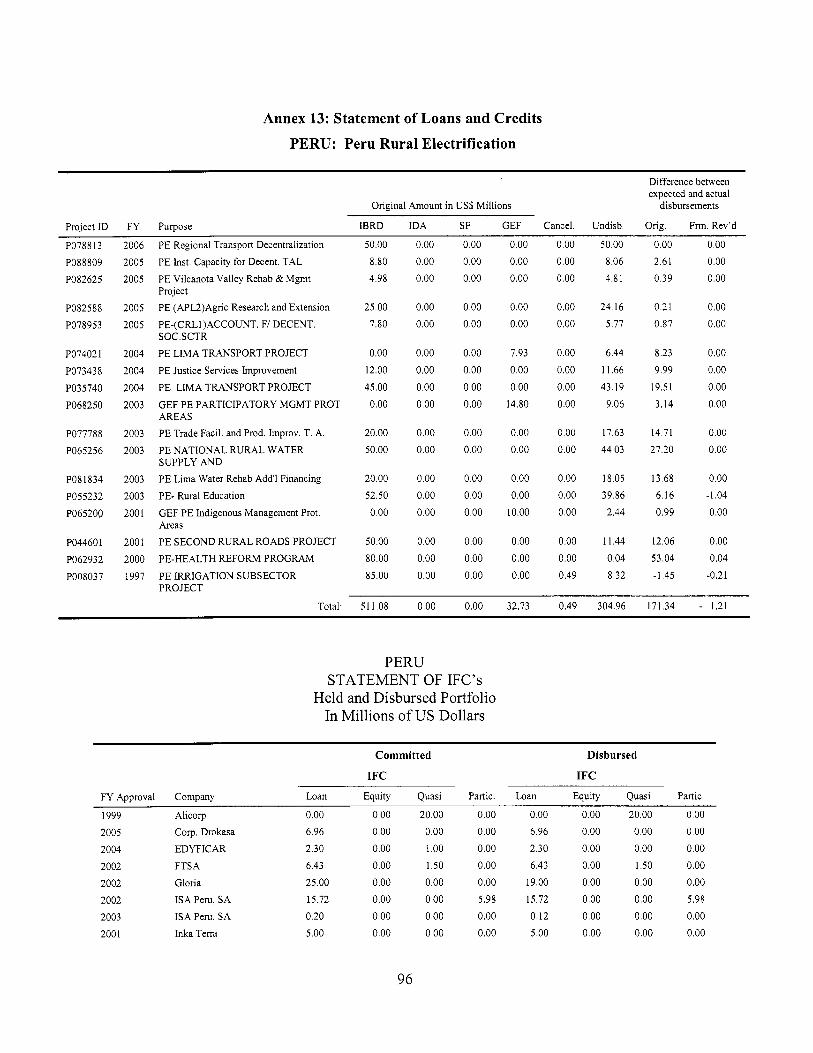
Annex 13: Statement of Loans and Credits
PERU: Peru Rural Electrification
Difference between expected and actual
disbursements Original Amount in US$ Millions
Project ID FY Purpose IBRD IDA SF GEF Cancel. Undisb. Orig. F rm Rev’d
PO78813
PO88809
PO82625
2006
2005
2005
PE Regional Transport Decentmlization
PE Inst. Capacity for Decent. TAL
PE Vilcanota Valley Rehab & Mgmt Project PE (APL2)Agric Research and Extension
PE-(CRL1)ACCOUNT. F/ DECENT. SOC.SCTR
PE L I M A TRANSPORT PROJECT
PE Justice Services Improvement
PE L IMA TRANSPORT PROJECT
GEF PE PARTICIPATORY MGMT PROT AREAS PE Trade Facil. and Prod. Improv. T. A.
PE NATIONAL RURAL WATER SUPPLY AND PE Lima Water Rehab Add1 Financing
PE- Rural Education
GEF PE Indigenous Management Prot. Areas PE SECOND RURAL ROADS PROJECT
PE-HEALTH REFORM PROGRAM
PE IRRIGATION SUBSECTOR PROJECT
50.00
8.80
4.98
0.00
0.00 0.00
0.00 0.00
0.00 0.00
0.00 0.00
0.00 0.00
0.00
50.00 0.00 0.00
8.06 2.61 0.00
4.81 0.39 0.00
2005
2005
25.00
7.80
0.00
0.00
0.00 0.00 0.00 0.00
0.00 0.00
24.16 0.21 0.00 5.77 0.87 0.00
PO82588
PO78953
2004
2004
2004
2003
0.00 12.00
45.00
0.00
0.00 0.00 0.00 0.00
0.00 7.93
0.00 0.00
0.00 0.00 0.00 14.80
0.00 0.00 0.00 0.00
6.44 8.23 0.00 11.66 9.99 0.00
43.19 19.51 0.00 9.06 3.14 0.00
PO74021
PO73438
PO35740
PO68250
20.00
50.00
0.00
0.00
0.00 0.00 0.00 0.00
0.00 0.00
17.63 14.71 0.00 44.03 27.20 0.00
PO77788
PO65256
2003 2003
20.00
52.50
0.00
0.00
0.00
0.00
0.00 0.00 0.00 0.00 0.00 10.00
0.00 0.00 0.00
18.05 13.68 0.00 39.86 6.16 -1.04
2.44 0.99 0.00
PO8 1834
PO55232
PO65200
2003
2003
2001
PO44601
PO62932
PO08037
2001
2000
1997
50.00
80.00
85.00
0.00
0.00 0.00
0.00 0.00 0.00 0.00
0.00 0.00
0.00 0.00 0.49
11.44 12.06 0.00 0.04 53.04 0.04
8.32 -1.45 -0.21
Total: 511.08 0.00 0.00 32.73 0.49 304.96 171.34 - 1.21
PERU STATEMENT OF IFC’s
Held and Disbursed Portfolio In Millions o f U S Dollars
Committed Disbursed
IFC IFC
FY Approval Company Loan
1999 Alicorp 0.00 2005 Corp. Drokasa 6.96
2004 EDYFICAR 2.30
2002 FTSA 6.43
2002 Gloria 25.00
2002 ISA Peru, SA 15.72
2003 ISA Peru, SA 0.20
2001 Inka Terra 5.00
Equity Quasi Loan Equity Quasi Partic Partic.
0.00 0.00
0.00
0.00 0.00 0.00 0.00 0.00
20.00 0.00 1 .oo 1.50 0.00
0.00 0.00 0.00
0.00
0.00
0.00
0.00 0.00
5.98
0.00
0.00
0.00
6.96
2.30
6.43
19.00
15.72
0.12
5.00
0.00
0.00
0.00
0.00
0.00
0.00
0.00
0.00
20.00 0.00
0.00 0.00
0.00 0.00
1.50 0.00
0.00 0.00
0.00 5.98
0.00 0.00
0.00 0.00
96

~
Disbursed
IFC IFC
FY Approval Company Loan Equity Quasi Partic. Loan Equity Quasi Partic.
2004
2002
2003
2005
2000 2004
1998 2002
1999
2005
2003
1998
2001
1994
1993
1996
2000
200 1 1999
2005
2001
2005
1993
Interbank-Peru
lnterseguro
Interseguro
lnterseguro
Laredo
Laredo
Latino Leasing
MIBANCO
Milki to
Miraflores
Norvial S.A.
Paramonga
Peru OEH Peru Prvtzn Fund
Quellaveco
Quellaveco
Quellaveco
Quellaveco
RANSA
RANSA Tecnofil S.A.
USMP
Y anacoc ha
40.00
0.00
0.00 0.00 5.00
0.30
1.78
0.67
5.50
10.00 18.00
11.50
5.70
0.00 0.00 0.00
0.00 0.00 5.00
10.00
3.60
9.00
0.00
0.00 4.00
0.59
0.60
0.00
0.00
0.00 0.00 0.00 0.00 0.00
0.00 0.00 3.81
4.67
3.98
0.45
0.57
0.00 0.00 2.00
0.00 0.33
0.00 0.00
0.00 0.00 5 .oo 0.00 0.00 0.00 3.50
0.00 0.00 0.00 3.40
0.00 0.00 0.00
0.00 0.00 0.00 0.00 0.00 0.00 0.00
0.00 0.00 0.00 0.00 0.00
0.00 0.00 0.00 0.00 0.00 0.00 9.71
0.00
0.00 0.00 0.00
0.00 0'00 0.00 0.00 0.00 0.00 0.00
0.00 0.00
0.00 0.00 5 .oo 0.08 1.78
0.67
3.50
10.00
5.90
11.50
1.70
0.00 0.00 0.00 0.00 0.00 5.00
10.00 3.60
4.50
0.00
0.00 4.00
OS9
0.00 0.00
0.00 0.00 0.00 0.00 0.00
0.00 0.00 0.00
3.81
4.67
3.98
0.45
0.54
0.00 0.00 2.00
0.00 0.33
0.00 0.00 0.00 0.00 5.00
0.00 0.00 0.00 3.50
0.00 0.00 0.00
3.40
0.00 0.00 0.00 0.00 0.00 0.00 0.00 0.00 0.00 0.00
0.00
0.00 0.00 0.00
0.00 0.00 0.00 0.00
0.00
0.00 0.00 9.71
0.00 0.00 0.00 0.00 0.00 0.00 0.00 0.00 0.00 0.00 0.00
Total portfolio: 187.66 21.00 34.40 15.69 118.76 20.37 33.40 15.69
Approvals Pending Commitment
FY Approval Company Loan Equity Quasi Partic.
2004 UPC I1 0.00 0.00 0.00 0.00
2005 Drokasa PCG 0.00 0.00 0.00 0.00 2004 CMAC Arequipa 0.01 0.00 0.00 0.00
Total pending commitment: 0.01 0.00 0.00 0.00
97

Annex 14: Country at a Glance
PERU: Peru R u r a l Electrification
POVERTY and S O C I A L Lat in Lower-
Amer ica middle- P e r u & C a r i b . income
2004
GNipercapita (Atlas method, US$) 2,360 GNI (Atlas method, US$ billions) 65.0
Average annual g rowth , 1998-04
Population ('37) 1.5 Labor force (%) 2.7
Population, mid-year (millions) 27.5
M o s t recent es t imate ( la tes t year avai lable, 1998.04)
Po vert y (77 o f po pulatio n beio w natlo nai poverty line)
Life expectancyat birth (pars) 70 lnfa nt mortal it y (per 1000 live births) 26
81 88 118
Male 18 Female 118
Urban population (%of totalpopulation) 74
Child malnutrition(%ofchildrenunder5) 7 Access to an improved water source (%ofpopulation) Literacy (%of population age 159 Gross primaryenrollment (%of school-age population)
KEY ECONOMIC RATIOS and LONG-TERM T R E N D S
1984 1994
GDP (US$ biiiions) 8.8 44.9 Gross capital formation/GDP 20.6 22.2 Exports of goods and serviceslGDP 8 . 3 T2.8 Gross domestic savings/GDP 24.6 18.9 Gross national savings/GDP .. 16.4
Current account baianceiGDP -2.0 -5.7 Interest paymentslGDP 3.1 1.2 Total debt/GDP 613 59.0 Total debt service/exports 29.6 8.7 Present value of debt/GDP Present value of debtlexports
1984-94 1994-04 2003 (average annual growth)
GDP per capita -2.7 12 2.5 Exports of goods and services 2.2 8.1 6.2
GDP -0.7 2.8 4.0
541 3,600 1,946
1.4 0.9
77 71 26
89 89 P 3 I26 P 2
2003
60.8 16.8 l i .7 18.8 n.3
-15 2.1
49.1 21.3 54.6
277.5
2,430 1580 3,847
1.0 0.7
49 70 33 11
81 90 114 115 1 8
2004
68.6 18.5 20.9 211 18.3
0.0 2.1
43.7 25.2
2004 2004-08
4.8 5.1 3.3 3.8
14.7 8.4
Deve lopment diamond'
Life expectancy
Gross per t- * primary capita enrollment
i
Access to improved water source
._ - I Peru
Lower-mrddle-income gro UP
E c o n o m i c ra t ios '
Trade
T Capital formation
1 Domestic savings -$- 1 1
Indebtedness
_-I.- .per"
Lo wer-middle-income orom
STRUCTURE o f the E C O N O M Y
(% of GD P) Agriculture industry
Services
Household final consumption expenditure General gov't final consumption expenditure Imports of goods and services
Manufacturing
(average annual growth) Agriculture Industry
Services
Household final consumption expenditure General gov't final consumption expenditure Gross capital formation Imports of goods and services
Manufacturing
1984 1994
.. 9.2
.. 31.2
.. n.7
.. 59.6
65.7 72.3 9.7 8.8
25.4 16.2
1984-94 1994-04
1.1 4.4 0.4 2.0
-0.6 2.0 -15 3.0
-10 2.6 -0.9 3.2
3.1 -0.6 4.8 2.3
2003
0.1 30.1 15.4 59.8
70.8 0 . 4 8.7
2003
1.5 5.4 2.1 3.1
3.2 3 7 5 4 4.0
2004
0 . 1 29.9 16.0
60.0
68.7 0 . 1 18.3
2004
2.0 6.2 3.0 3.5
3.4 4.0 5.8 0 .4
G r o w t h o f c a p i t a l and G D P (%) $ 3 7
G r o w t h o f expor ts a n d i m p o r t s (%)
2o T
I Exports -imports I
Note: 2004 data are preliminaryestimates. *Thediamonds showfourkeyindicators inthecountry(in bo1d)comparedwith its income-groupaverage. If data are missing, thediamondwiil
be incomplete.
98

Peru
PRICES and GOVERNMENT FINANCE
Domestic prices (% change) Consumer prices Implicit GDP deflator
Government finance (% of GDP, includes current grants) Current revenue Current budget balance Overall surplusldeficit
TRADE
(US$ millions) Total exports (fob)
Copper Fishmeal Manufactures
Total imports (cif) Food Fuel and energy Capital goods
Export price index (2000=100) Import price index (2000=100) Terms of trade (2000=100)
BALANCE of PAYMENTS
(US$ millions) Exports of goods and services Imports of goods and services Resource balance
Net income Net current transfers
Current account balance
Financing items (net) Changes in net reserves
Memo: Reserves including goid (US$ millions) Conversion rate (DEC, local/US$)
EXTERNAL DEBT and RESOURCE FLOWS
(US$ millions) Total debt outstanding and disbursed
IBRD IDA
Total debt service IBRD IDA
Composition of net resource flows Official grants Ofk ia i creditors Private creditors Foreign direct investment (net inflows) Portfolio equity (net inflows)
World Bank program Commitments Disbursements Principal repayments Net flows Interest payments Net transfers
1984
110.3 109.9
1984
1984
3,817 3,031
786
-1,177 0
-391
641 -250
0 3.47E-6
1984
12,157 508
0
1,184 84 0
100 409 489 -89
0
40 130 40 90 44 46
1994
23.1 26.2
14.7 0.9
-3.2
1994
4,598 824 710
1,199 5,596
523 325
1,698
102 89
114
1994
5,662 7,161
-1,499
-1,804 748
-2,555
5,614 -3,059
7,355 2.2
1994
26,510 1,554
0
1,144 189
0
226 160 460
3,289 465
334 171 80 91
109 -18
2003
2.3 2.3
14.9 0.0
-1.8
2003
9,091 1,261
742 2,620 8,255
560 1,376 1,984
108 105 103
2003
10,786 10,804
-1 8
-2,144 1,221
-935
1,412 -477
10,240 3.5
2003
29,822 2,789
0
2,553 279
0
182 -12
1,182 1,377
1
373 344 163 180 115 65
2004
3.7 5.7
15.1 0.5
-1.2
2004
12,617 2,446
955 3,476 9,824
722 1,754 2,365
130 116 112
2004
14,531 12,581
1,950
-3,421 1,461
-10
2,362 -2,352
12,665 3.4
2004
29,991 2,834
0
4,023 281
0
130 -42
1,802 -74
294 234 189 45 92
-47
Inflation (%) 1
88 00 01 02 03 04
*iiY.. GDP deflator -4-CPI
I Export and import levels (US$ mill.)
1 l l r O O T
10 000
5 000
0
O4 I 88 88 00 01 02 03
0 Exports W Imports
Current account balance to GDP ( O h ) 1
omposition of 2004 debt (US$ mill.)
G: 2,525 A 2’834 - ..
j ~ IBRD 1 -IDA D - Other multilateral F -Private ; ~ IMF G -Short-term
E - Bilateral
Dewlopment Economics 9/9/05
99

Annex 15: Incremental Cost Analysis
PERU: Rural Electrification
Overall Context for Rura l Electrification in Peru
More than six mi l l ion people in the predominantly poor rural areas o f Peru do not have access to electricity. At 30% coverage, this i s one o f the lowest rural electrification rates in Lat in America (only Bol iv ia has worse coverage in rural areas). Together w i th scarcity o f other infrastructure services, lack o f electricity results in a lower quality o f life, poor medical care and education, and l imi ted opportunities for economic development.
In Peru, power sector reform has not touched rural electrification issues. The existing electricity distribution companies hold concession areas concentrated in small areas around urban centers. Their obligation i s to meet service requests only wi th in 100 meters o f the existing network. Therefore, to expand coverage, the Government o f Peru (GoP) has been investing US$40-50 m i l l i on per year for the last ten years in direct subsidies for the capital cost o f rural electrification. All o f the investments were carried out and financed by agencies o f the central government. Investments were made through social funds (e.g. FONCODES) and more importantly by the Executive Office for Projects o f the Ministry o f Energy and Mines (MEMDEP). F rom Lima, the M E M i D E P identifies designs, constructs and transfers the rural electrification sub-projects to the distribution companies or to ADINELSA, a public holding company. There i s currently no mechanism to mobilize investments for rural electrification f rom communities, regional governments and the private sector.
MEM recently reiterated i t s commitment to reduce the electrification gap, in the National Rural Electrification Plan (Plan), aiming to increase rural coverage from 30% to 75% by 2013. The 2004 Plan states that the objective i s to broaden the coverage o f rural electrification, using technologies that minimize the cost o f investment, in order to accelerate socio-economic development and improve the quality o f l i fe o f people living in isolated and rural areas o f Peru. In order to realize this commitment, the Plan shows an estimated investment o f US$860 mill ion, or US$86 mi l l ion per year, to provide service to an additional 860,000 households or 4.3 mi l l ion people.
Whi le the Plan contains ambitious goals, foreseeable financing i s inadequate to realize these goals. Given limitations on funding from the treasury, funding for rural electrijkation subsidies at national level is unlikely to exceed US$40 million per year. Therefore, the GoP requested assistance f rom the Wor ld Bank to develop a new rural electrification framework that would increase economic efficiency in the sector and attract broader participation and financing f rom communities, regional governments and private enterprises.
The GoP’s request to the Wor ld Bank for assistance with the rural electrification program specifically emphasized the potential role o f renewable energy where it would be cost-effective. As usage levels o f electricity in rural areas are l o w and the costs o f grid extension are hgh in Peru’s diff icult terrain, it i s expected that there i s potential for renewable energy to play a significant role in supplying rural electricitg5. Renewable resources abound: (a) in the highlands, the average solar radiation levels reach five kWh/m2/day, w i th small seasonal variations; (b) the wind velocity measurements in the coastal zone indicate average velocities o f 6 m/s at 10 m level; (c) the hydroelectric potential i s vast, especially in the
25 The Plan includes ambitious plans for renewable energy, including for the 2004-2013 period, investments o f US$30 million in small hydropower systems to serve 27,500 users, US$96 million in solar PV systems to serve 122,000 users and US$16 million to serve 27,300 users.
100

highlands and higher parts o f the jungle; and (d) the potential for biomass projects in the upper zone o f the jungle i s very promising. Groups such as the Intermediate Technology Development Group have carried out small-scale donor-financed projects to promote rural electrification using small hydropower, wind and solar energy, creating experience that the project can further build upon.
Proposed W o r l d Bank and GEF Support for Rural Electrification
The proposed GEF Project i s fully integrated into the Bank’s Program to support rural electrification efforts in Peru. This Program began in 1999, with the Estrategia Integral de Electripcacidn Rural Study (NRECA). It continued with the ESMAP financed Peru: Rural Electrification Study in 2001, and the Peru Rural Infrastructure Strategy completed in 2004. The GoP formally requested Bank investment program support for rural electrification in M a y 2004. Fol lowing this, the Bank and MEM initiated several on-going activities in parallel. The first i s a technical assistance activity with PPIAF support to develop a new legal and regulatory framework, Design of Enabling Framework for Public-Private Participation Models in Rural Electripcation. With ESMAP support, the Bank and MEM are conducting a national Rural Energy Survey to provide data o n energy demand, willingness to pay and electricity pricing issues.
Most importantly, MEM requested Wor ld Bank and GEF assistance for the h l ly blended investment operation under preparation, the proposed GoPIIBRDIGEF Rural Electrification Project, that would demonstrate key elements o f the new rural electrification framework. As we l l as bringing substantial financing for investment, the Bank would bring i t s knowledge o f rural electrification legal and regulatory frameworks and experience with private and public sector partnerships. GEF resources are required to develop the policy, institutional, financial and regulatory framework for renewable-hydro, or biomass, based community-scale isolated grids and for electrification projects using individual renewable energy systems. In addition, GEF resources are required to increase the availability o f financing for investments in grid-connected renewable energy generating plants, especially using small hydro.
By fully incorporating renewable energy into the GoP/Bank Project framework, the GEF Project aims not only to promote investments in renewable energy under the Project, but more importantly to shape the overall national rural electrification program. The new approach would enable a significant share o f the overall rural electrification investments, estimated at a total cost o f US$856 mill ion, to be in renewable systems. This program could realistically be achieved in about 20 years, given the expected level of financing o f US$40 mi l l ion per year. Assuming a 10-20% share of renewable energy, this would mean that a successful GEF project could facilitate investments o f US$86-162 m i l l i on in renewable energy, over 20 years, as part o f the overall rural electrification program in Peru.
Baseline Scenario for R u r a l Electrification 2006-2011
In the Baseline Scenario, the GoP would continue to implement rural electrification projects through the MEMIDEP, in parallel with a new project that would be implemented by the Bank, without GEF support, As noted above, annual funding for rural electrification subsidies at national level over the next f ive years can be expected to be n o more than US$40 mi l l ion per year. Over the five-year period 2006-2010, this would result in total investments o f US$200 mill ion. Of this investment, about ha l f or US$lOO mi l l ion would be dedicated to a continuation of the existing program by MEM through the MEMIDEP, the other ha l f or US$lOO mi l l ion would be implemented through the new GoP/Bank Project.
Continued Activities by M E M D E P . The MEM/DEP would continue i t s top down approach. I t would continue to identify, select, and design sub-projects. I t would then bid out construction and transfer ownership o f the sub-project to either existing public distribution companies or the public holding company ADINELSA. The criteria for sub-proj ect selection would continue to b e primarily social--low
101

coverage rates o f electricity and high poverty in the project area. Assuming that M E M D E P ’ s budget would be approximately US$lOO mi l l ion over 2006-2010, based o n average costs in the 2004 plan o f US$830/connection, MEMDEP would provide electricity service to about 120,000 households, including about 10,000 households that would receive service using P V systems. Some o f these projects would require not only capital subsidies, but also operating subsidies that would be managed through AD INEL S A.
Part o f the MEM/DEP’s activities in the Baseline Scenario would be the completion o f the U N D P Photovoltaic-based Rural Electrification Project, according to the restructuring proposed. The results are expected to include: (a) establishment o f a data base including data o n solar energy and the target population, in the form o f a GIS database; (b) establishment o f norms for installation, maintenance and operation o f solar P V systems; (c) selection o f target communities for installation o f PV systems under the UNDP Project; (d) installation and operation o f about 7,000 P V systems to serve households and institutions in rural areas; (e) capacity building for professionals, technicians and users o f solar PV systems; and (0 information available f rom monitoring and evaluation o f the Project. It i s expected that this would be the most significant renewable energy activity carried out by the MEM/DEP, over the period, in the baseline.
Baseline BanWMEM Project--Without GEF Support. The Baseline Rural Electrification Project would a im to introduce a decentralized, demand driven approach to rural electrification, where the service providers in collaboration with local and regional governments would propose and co-finance sub-projects. It i s considered that the electricity service providers have the best knowledge o f sub- projects with l o w costs, and high economic benefits including productive uses, which would result in more efficient provision o f electricity in rural areas.
The objective o f the proposed Project would be to provide sustained and efficient electricity services to rural consumers. The Baseline Project would have four main components as shown in Table 15-1: (a) investment by private and publicly owned enterprises to provide electricity to about 160,000 new connections including households, public facilities and businesses; (b) technical assistance to support the demand driven approach rural electrification (projects proposed by service providers); (c) a pi lot program to promote productive uses through an information campaign and access to business development services; and (d) project management.
The Project i s expected to deliver rural electricity services more efficiently than the current system. Rural electrification sub-proj ects proposed by service providers, in collaboration with regional governments, would compete for the subsidy. Project selection would be based o n criteria such as minimum subsidy provided by the central government andor maximum economic benefits. Sub-projects would be financially viable based o n the proposed subsidy and tariff-there would be n o subsidies o n operation. The Project would focus o n encouraging the distribution companies to extend their existing grids organically, focusing first o n those projects that are nearer existing grids that have existing or potential productive uses. For this reason, the average cost assumed per connection i s less than in the case o f the MEMIDEP, at about US$700 per connection26. Also, the subsidy funds provided by the central government are assumed to be leveraged by the funds o f the distribution companies/regional governments, in the ratio o f 80/20. The result i s the abil ity to connect 160,000 households and businesses using subsidy funds f rom the Project o f approximately US$92 mi l l ion.
26 If the projects in the PNER are sequenced in order o f lowest to highest cost, the PNER contains sub-projects that would result in 160,000 connections at an average cost o f less than US$640. An average cost o f US$700 i s therefore considered conservative.
102

While the subsidy funding would in principle be available for both grid-connected and renewable projects, the focus of both the MEM and the distribution companies would inevitably be o n development o f grid-connected electrification projects. In the absence o f GEF support, the Bank Project would theoretically offer financing to renewable energy projects, but in fact would finance almost entirely grid- extension projects, or diesel-based generation, because o f the barriers noted below.27
Barriers to Rural Electrification Using Renewable Energy. As noted above, the UNDP-assisted Photovoltaic-based Rural Electrification Project i s expected to build experience and develop capacity in Peru w i th respect to use o f solar PV technology for rural electrification. However, even after completion o f th is project, a number o f barriers to development o f renewable energy wi l l remain, including:
Lack of Regulations SpeciJically for Renewable Energy Systems. Neither the DGE, responsible for concessions, norms and standards nor OSINERG, responsible for tariffs and oversight of operation o f concession, have developed regulations specifically designed for renewable energy systems, either for rural electrification or connection to the grid.
Lack of Capacity in Regional Governments, Distribution Companies and Suppliers To Develop Sub-project Proposals. There i s l i tt le capacity in regional governments, distribution companies or other potential service providers to identify, select, design and propose renewable energy sub- projects for the subsidy.
Lack of Data and Information on Renewable Energy Resources. For resources other than solar energy, including small hydropower, geothermal energy and wind, there has only been very preliminary work done o n estimation o f resources. There i s a need for systematic information
27 Electricity supply for these rural households wou ld come almost entirely f rom thermal generation, since rural demand occurs mainly in the early morning and evening hours, coinciding with the system peak load.
103

and data gathering and dissemination, in a form that could be used reliably for project development.
4. Lack of Systematic Policy for Renewable Energy Promotion in MEM. Peru has no effective policies for renewable energy promotion. A law to promote geothermal energy was passed by Congress, but never implemented. There i s no law or pol icy that provides a basis for promotion o f renewable energy, or use o f financial incentives to encourage i t s development.
5. Lack of Promotion of Potential Productive Uses of Electricity. As i s the case with provision o f grid-connected electricity, it i s expected that use o f renewable systems wi l l l ikely be limited to a few lights, radio and TV, with l i t t le promotion o f opportunities to take advantage o f possible increases in economic benefit by carrying out income generating activities.
6 . Lack of Financing for Renewable Energy Generating Facilities. While definitive data i s not available, Peru has considerable potential for development o f small hydropower and possibly geothermal, biomass and wind energy, to supply electricity to the grid. However, commercial banks in Peru do not provide project financing. Debt financing o f small hydropower plants, for example, would require both a hgh proportion o f equity (30-50%), and guarantees to cover the debt financing provided by commercial banks. Under such conditions, i t i s diff icult to put financing packages together even for plants that have high financial rates o f return. The most fundamental barrier i s the aversion o f commercial banks to construction risk. I t has been reported that the requirement for guarantees has been waived once a plant has been constructed and i s in operation.
Other activities, including the GEF-assisted U N D P Photovoltaic-based Rural Electrification in Peru and bilateral efforts, would result in electrification o f 10,000 households, using SHS, and would overcome some o f the barriers above for this technology. However, in the absence o f GEF support, the GoP would maintain a commitment o n paper to the use o f renewable resources, but would not mobil ize the necessary resources to overcome fully the lack o f an institutional, financial and technical framework for implementation o f rural electrification using renewable technologies (which require different design guidelines, standards for quality o f service and tariffs). Service provision and extension o f new service in rural areas would continue to take place using isolated diesel, gasoline, generation systems.
GEF Project Alternative R u r a l Electrification 2006-2011
The GEF Project would be fully blended with the GoP/Bank investment operation that would demonstrate key elements o f the new rural electrification framework, through the proposed GoP/IBRD/GEF Rural Electrification Project2*. The GoP would bring i t s commitment to the introduction o f a new framework, as wel l as substantial investment financing. The Bank would bring investment financing, as wel l as i t s knowledge o f rural electrification legal and regulatory frameworks and experience with private and public sector partnerships. GEF resources are required to develop the policy, institutional, financial and regulatory framework for renewable-hydro, or biomass, based community-scale isolated grids and for electrification projects using individual renewable energy systems. In addition, GEF resources are required to increase the availability o f financing for investments in grid-connected renewable energy generating plants, especially using small hydro.
The objectives o f the GEF Project under the blended operation would b e to:
28 The Bank i s executing in parallel a TA activity with PPIAF support to develop a new legal and regulatory framework, Design of Enabling Framework for Public-Private Participation Models in Rural Electrification.
104

a) provide electricity services to about 20,000 households, businesses and public facilities such as schools and health clinics, using renewable energy sources to serve remote and dispersed populations;
b) provide technical assistance to ensure that renewable energy options are fully incorporated into electricity provision in rural areas o f Peru;
c) p i lot a program to increase productive uses o f electricity f rom renewable sources that would increase opportunities for income generation in rural areas; and
d) provide an estimated 15 MW o f renewable energy generation for sale to the grid, mainly f rom small hydropower, during the Project l i fe and 30 MW over the ten-year l ifetime o f the financing facility.
Support f rom the GEF Project would enable MEM to incorporate renewable energy fully into each o f the components o f the proposed IBRD/GoP Rural Electrification Project. The total incremental cost o f GEF support i s estimated at US$10 mill ion, as described below and shown in Table 15-2.
Component I : Rural Electrification Sub-projects. There would be no GEF support to the investment cost o f provision o f electricity services (Component 1). However, GEF support to the other components would enhance the capability o f a l l participants to identify, design and propose renewable energy-based sub-projects for subsidies using BRD and GoP funds under the Project. I t i s estimated that, w i th GEF support, about 20,000 (1 2%) o f the connections to be financed under the project would uti l ize renewable energy, mainly small hydro micro-grids or solar photovoltaic household systems, or solar photovoltaic/diesel hybrid grid systems. This ratio i s based o n the projected investments shown in renewable energy in the Plan 2004, where about 15% o f the projects to be financed use renewable energy. Therefore, t h i s component i s expected to enable provision o f electricity services to remote areas or dispersed areas that would otherwise not be served under the rural electrification program o f the GoP.
Component 2: Technical Assistance for Rural Electr i jkat ion. Technical assistance would be provided by GEF to support the implementation o f renewable energy sub-proj ects including:
a. Development of institutional framework and regulations for grid-connected and off-grid rural electricity service, including renewable energy service provision, specifically designed to improve the economic and financial efficiency o f the sector, such as procedures for issuing rural concessions; norms for electricity systems design and construction appropriate for rural areas; norms for operations; procedures for calculating rural tariffs; and norms for rural quality o f service (addresses Barrier 1 above).
b. Capacity building for identi jkation and development of sub-projects using renewable energy, i s effectively l inked to regional development plans. The Project would strengthen the capacity of electricity service providers to prepare and propose sub-proj ects, as wel l as strengthen the capacity o f regional and local governments to coordinate planning and management of electrification projects with other rural development activities. The Project would assist the selection o f appropriate, least-cost technologies --such as renewable energy-- to electrify remote areas, or regions with dispersed populations, where grid extension would not be economically viable (addresses Barrier 2 above).
c. Promotion of renewable energy, including: (i) development o f appropriate policies and incentives; (ii) cost-sharing o f preparation o f sub-proj ects; and (c) carrying out technical studies such as resource assessments. This component would focus o n renewable energy for rural electrification and supply to the rural grid, especially using small hydropower, geothermal and biomass energy and wind power (addresses Barriers 3 and 4 above). (Incremental cost US$2.5 mill ion GEF.)
105

Component 3: Pilot Program for Productive Uses of Electricity. This project component would promote productive uses o f renewable electricity, such as tailor shops, hair cutting, entertainment businesses using TV, small refrigerators, etc. I t would include a promotional/marketing campaign, as well as business development assistance in deep rural areas. This project component would be tested f i r s t in areas that had been electrified by isolated small hydropower plants, and then expanded to project areas, including those using renewable energy. Since power f rom renewable energy systems i s often limited, and the remoteness o f the population l i m i t s economic activities, specific programs are needed for areas served with such technologies (addresses Barrier 5 above). (Incremental cost US$1.5 million GEF.)
Component 4: Small Hydro Financing Facility. There i s considerable potential to lower costs and improve service through provision o f grid-connected small hydropower to rural networks. Peru i s a country with significant hydroelectric resources due to i t s geography (Andean mountain range and climatic conditions). In addition, various irrigation projects and water resources management projects have already created c iv i l engineering structures that could result in competitive hydroelectric generation in small and micro schemes. Through i t s carbon financing activities in the country the Wor ld Bank has reviewed a significant number o f privately-sponsored small hydro schemes that would be viable and could l ikely provide least-cost solutions for rural electrification. Nevertheless, although the financial system in Peru i s relatively liquid, commercial banks are not experienced and in general unwilling to provide financing o n a project recourse basis. Project sponsors therefore have to finance projects fully o n equity, borrowing on their balance-sheet, or pledging other assets for collateral.
However, because small hydropower generation projects are unfamiliar to commercial banks in Peru and the construction risk i s considered unacceptable, banks in Peru have been reluctant to finance such projects. The GEF would facilitate commercial debt financing o f small hydro generating plants by providing bridging financing during construction and init ial operation, after which the loan would be refinanced by the participating bank at agreed terms, subject to satisfactory financial operating performance o f the project. A revolving loan facil i ty would be operated, w i th an estimated turn-around period o f two to three years. Project proponents would be asked to propose projects for financing by the facility. An estimated 15 MW o f projects would be financed during the five-year l i f e o f the project, but the facility would continue to operate and would be expected to finance to finance 30 MW over ten years before it would finally close (addresses Barrier 6 above). This facility would not finance connection costs or distribution systems. (Estimated incremental cost US$15.0 million of which US$5.0 million is GEF and US$I 0 million is from investors.)
Component 5: Project Management: This component would include support for incremental cost for management o f the GEF components o f the Project, including a share o f the time o f the Project Manager; an administrative unit w i th staff to handle procurement and financial management; a technical unit that would evaluate sub-project applications and oversee the hnct ion ing o f the finance facility and the productive uses component; and a monitoring and evaluation unit. (Estimated incremental cost US$I million is GEF.)
106

ovemments for development o f grid and off-grid sub-
financial management) b. Technical unit to evaluate investment sub-projects c. Moni tor ing and evaluation unit, including safeguards d. Administrative financial agreement fee
0.50 0.50 0.25 1.25 0.40 0.50 0.50 1.40 1.25 1.25 2.50
Coordination of Implementation with UNDP Photovoltaic-Based Renewable Energy Project. The Bank/GEF Project would build upon the experience o f the UNDP/GEF Project. Outputs of the UNDP/GEF Project would be useful to the Bank’s Project including the solar data base and GIS system; norms for solar P V systems; analysis o f alternative management models for service provision; and monitoring and evaluation o f PV systems installed under the UNDP Project. During the expected year of overlap in implementation in 2006 and early 2007, the Bank project wi l l closely coordinate any installation o f solar PV systems to ensure that there i s n o geographical overlap with the UNDP/GEF project, which would be expected to have selected the sites for installation o f most o f i t s systems by the time that the Bank Project starts operation in early 2006.
Benefits Expected. As shown above, US$2.5 mi l l ion of GEF support would be used for technical assistance for promotion of renewable energy projects, US$1.5 m i l l i on would be used for TA to support promotion o f productive uses in areas where electricity i s provided by renewable energy, and US$5 mi l l ion o f GEF support would go directly to a revolving fund for bridge financing for the construction phase grid-connected renewable energy projects, mainly small hydropower. Together, GEF support i s expected to leverage: (a) U S 1 7 . 5 m i l l i on (from the GoP, the Wor ld Bank and enterprises) for renewable energy rural electrification investments, benefiting thereby around 20,000 households and institutions such as health centers, schools and community centers; and (b) U S 1 5 m i l l i on over the five years o f the Project or US$30 mi l l ion over the l i f e o f the Renewable Energy Finance facility, f rom enterprises and banks in grid-connected renewable energy generating plant investments (mainly small hydropower). I t i s
107
expected that the rural electrification connections would be consumers that would l ikely be unserved in the absence o f GEF support, in the poorer and more remote areas o f Peru such as Loreto, Amazonas, San Martin, etc. In addition, GEF support would leverage investments outside the project as the momentum for adoption o f renewable energy as a viable rural electrification option builds.
Global Benefits Expected. Assuming that the project results in 20,000 new connections using renewable energy systems that would otherwise have been connected using the grid, an estimated 120 GWh o f thermal electricity would have been replaced over 20 years o f operation (since rural electricity use i s primarily during peak hours when thermal electricity predominates.) The 30 MW o f thermal generation installed over the 10 year l i fe o f the renewable finance facility, would similarly result in 5913 GWh o f generation (assumes 75% plant factor). At emission factors averaging 779.1 tons o f COz avoided per GWh at peak and 594.8 tons o f C02 avoided per GWh o f generation o n average, total C 0 2 emissions reduction directly f rom the project would be 3.607 mi l l ion tons. Incremental cost per ton o f C 0 2 emission reduction would then be estimated at US$2.77. Indirect emission reductions impact o f the project could be expected to be several times greater than the direct impacts.
Sustainability and Replicability. Sub-proj ects would be selected to ensure financial sustainability through the combination o f the proposed subsidy and tariffs. The sustainability o f the approach depends o n the adoption o f the new framework for the entire GoP rural electrification program. Parallel Bank support, under the PPIAF assisted TA, i s building consensus o n the adoption o f a new legal and regulatory framework based o n the approach in the Project. The Project aims to build consensus o n the collection o f funds from within the sector to finance rural electrification, using a surcharge. Even if th is i s not achieved, the GoP has been funding rural electrification at the level o f US$40 mi l l ion per year for the last ten years. Once the demand driven approach o f distribution companies andor local governments proposing projects for subsidy has been demonstrated, it i s expected that the government w i l l choose this approach as the major channel for funding rural electrification projects in the future. The demand driven approach i s expected to be chosen for the following reasons: (a) i t i s expected to leverage resources f rom service providers and regional governments (at least 20%); and (b) given the competition among projects for the subsidy, the distribution companies are expected to propose the most economically viable sub- projects, given their knowledge o f potential productive activities and other infrastructure investments, and to design them efficiently
The approach proposed in the project has considerable potential for replication outside o f Peru. Competition among projects for a subsidy i s already widely practiced, in countries such as Ecuador, El Salvador and Chile. However, the incorporation o f renewable energy sources from the in i t ia l operation o f such a facil i ty i s new, as i s the use o f a revolving fund for bridge financing o f the construction and init ial operation o f renewable energy generation facilities. Regulations for renewable energy service provision and capacity building efforts o f service providers could be replicated in other countries.
108

BenefitsKosts
Domestic Benefits
Global Benefits
Table 15-3 Incremen Baseline
MEMiDEP continues RE activities, provides connections to 120,000 hh, including 7000 using SHS under UNDPiGEF Project.
Bank project without GEF support supports 160,000 connections using grid extension. Subsidy fund i s nominally open to renewable energy projects but few come forward.
Rural electrification continues to be based on grid extension with minor role played by MEMiDEP executed P V projects.
New framework established for more efficient demand driven rural electrification demonstrated including revised regulations, increased capacity o f service providers and regional governments to identify and propose projects.
Productive uses promotion piloted for grid-connected projects.
Diff icult for entrepreneurs to finance small hydropower plants using commercial financing.
Learning impacts o f UNDP GEF Project l imited to those o f project itself. P V model l imited to MEMiDEP executed projects.
1 Benefits and Costs GEF Alternative
Same as Baseline.
Bank project with GEF support results in 160,000 connections including 20,000 connections using renewable energy.
Increased penetration o f renewable energy technologies within project and also in long-term electrification program.
Support provided to fully incorporate renewable energy options including specific regulations for renewable micro-grids and off-grid service provision, capacity building for renewable energy options and promotion o f renewable energy options.
Productive uses promotion piloted specifically for renewable energy projects.
Bridging finance provided for construction and initial operation using revolving fund facility.
Bank project builds on and strengthens capacities built by UNDP Project for solar PV, builds capacity o f project proponents to propose renewable projects to subsidy fund.
ncremental Domestic md Global Benefits and zests GEF Alternative +one.
3lectricity service provision :xtended to dispersed )opulations and remote rural ireas where economically ustified but grid cannot .each.
Ceplicable experience o f full ncorporation o f renewable mergy in rural electrification subsidy program from leginning.
’ Elements o f enabling Jolicies and regulations for -enewable energy in place . Local expertise built for identifying and designing renewable energy projects - Renewable energy data base and resource information available to project developers.
Increased income in households benefiting from program in remote and poorer areas o f the country.
15 MW small hydropower constructed during l i fe o f project, 30MW over ten-year l i fe o f facility.
Synergies from combined UNDP and Bank Project with respect to P V systems.
Direct reduction in C02 emissions o f 3.607 mi l l ion tons from renewable rural electrification and generation to feed the grid.
109

BenefitsICosts
Cost by Component (million US%)
1, Investment in Provision o f Rural Electricity Service 2006-201 1
2. T A for Rural Electrification
3. Pilot to Promote Productive Uses
4. Renewable Energy Finance Facility
5. Project Management
Total
Incremental Cost GEF
Total Direct Carbon Avoided
Total CostlDirect Carbon Avoided
Baseline
MEMIDEP-
Bank Project
Bank Project
Bank Project
_ _ _
Bank Project
MEMiDEP Bank Project
100.00
114.325
1.25
2.35
5.40
100.00 123.325
GEF Alternative
MEMiDEP 100.00
BanWGEF Project 114.325
BanWGEF Project 3.75
BanWGEF Project 3.95
BanWGEF Project 15.00
BanWGEF Project 6.40
MEMiDEP 100.00 BanWGEF Project 143.425
Incremental Domestic and Global Benefits and Costs GEF Alternative
None
None
GoP 0.10 GEF 2.50
GEF 1 S O
Enterprises 10.00 GEF 5.00
GEF 1 .oo
None BanWGEF Project 20.10
US$lO.OO mill ion
3.607 mill ion tons
US$2.77iton C02
110

MAP SECTION


AAnnddeessMM
ttnnss..
NevadaNevadaHueascarHueascaráánn(6768 m)(6768 m)
NevadaNevadaYYerupajaerupaja(6634 m)(6634 m)
NevadaNevadaSalcantaySalcantay(6271 m)(6271 m)
NevadaNevadaCoropunaCoropuna(6271 m)(6271 m)
NudoNudoAusandateAusandate(6384 m)(6384 m)
TUMBESTUMBES
HUANUCOHUANUCO
PPA S C OA S C O
J U N I NJ U N I N M A D R EM A D R ED E D I O SD E D I O S
I C AI C A
A R E Q U I PA R E Q U I PAA
TTA C N AA C N A
L I M AL I M ACC
AAJJ AA
MMAA
RR CCAA
P I U R AP I U R A
AAMM
AAZZ
OONN
AASS
ANCASHANCASH
L O R E T OL O R E T O
S A NS A NM A RM A R T I NT I N
U C AU C AYYA LA L ÍÍ
HUANCA-HUANCA-VELICAVELICA
P U N OP U N O
C U Z C OC U Z C O
AAYYAA
CCUU
CCHH
OO
AA PPUURR IIMM AA CC
LA LIBERLA LIBERTTADADSantaSantaLuciaLucia
TTalaraalaraSullanaSullana
TTarapotoarapoto
YYurimaguasurimaguas TTamamáánconco
ArcadiaArcadia
PuerPuerto Curarayto Curaray
CaballocochaCaballococha
TTingo Maringo Marííaa
SanSanIgnacioIgnacio
SihuasSihuas
AAyar Mancoyar Manco
SaySayáánnSatipoSatipo
AAynayna
QuillabambaQuillabambaSintuyaSintuya
AtalayaAtalaya
LanlacuniLanlacuniBajoBajo
AstilleroAstillero
CaillomaCailloma
DesaguaderoDesaguadero
AlcaAlca
JuliacaJuliaca
NazcaNazca
PuquioPuquio
LaLaOroyaOroya
GoyllarisquizgaGoyllarisquizga
HuarazHuaraz
ChiclayoChiclayo
PiuraPiura
HuancavelicaHuancavelica
HuancayoHuancayo
AAyacuchoyacucho
AbancayAbancayCuscoCusco
PuerPuertotoMaldonadoMaldonado
PunoPuno
MoquegaMoquega
TTacnaacna
ArequipaArequipa
IcaIca
Cerro deCerro de Pasco Pasco
Hu Huáánuconuco
MoyobambaMoyobamba
IquitosIquitos
CajamarcaCajamarca
ChachapoyasChachapoyas
PucallpaPucallpa
LIMALIMAAA
nndd
eess
MMtt
nnss
..
ECUADOR COLOMBIA
BRAZIL
BOLIVIA
CHILE
To Loja
To Machala
To Belén
To Visviri
To La Paz
To Carabuco
To SanBuenaventura
To Cruzeirodo Sul
7575°°WW 7070°°WW
1515°°SS
1010°°SS
TUMBES
LAMBA-YEQUE
HUANUCO
PA S C O
J U N I N M A D R ED E D I O S
I C A
A R E Q U I PA
MOQUEGUA TA C N A
L I M AC
AJA
MA
R CA
P I U R A
AM
AZ
ON
AS
ANCASH
L O R E T O
S A NM A R T I N
U C AYA L Í
HUANCA-VELICA
P U N O
C U Z C O
AYA
CU
CH
O
A PUR IM A C
LA LIBERTAD
Huacho
Chimbote
SantaLucia
TalaraSullana
Tarapoto
Yurimaguas Tamánco
Arcadia
Puerto Curaray
Caballococha
Tingo María
SanIgnacio
Sihuas
Ayar Manco
Sayán
Pisco
Satipo
Ayna
QuillabambaSintuya
Atalaya
LanlacuniBajo
Astillero
Cailloma
Desaguadero
Alca
Juliaca
Mollendo
NazcaCaballas
San Juan
Antiquipa
Atico
Puquio
LaOroya
Goyllarisquizga
Callao
Huaraz
Trujillo
Chiclayo
Tumbes
Piura
Huancavelica
Huancayo
Ayacucho
AbancayCusco
PuertoMaldonado
Puno
Moquega
Tacna
Arequipa
Ica
Cerro de Pasco
Huánuco
Moyobamba
Iquitos
Cajamarca
Chachapoyas
Pucallpa
LIMA
ECUADOR COLOMBIA
BRAZIL
BOLIVIA
CHILE
Napo
Pasta
za
Putumayo
Yavari
Amazonas
Ucaya
li
UcayaliApurim
ac
Marañon
Santiago
Huallaga
Urubamba
Madre de Dios
Inam bari
Purús
Tigre
Corrientes
PACIFICOCEAN
LagoTiticaca
To Loja
To Machala
To Iquique
To Belén
To Visviri
To La Paz
To Carabuco
To SanBuenaventura
To Cruzeirodo Sul
AndesM
tns.
An
de
s
Mt
ns
.
NevadaHueascarán(6768 m)
NevadaYerupaja(6634 m)
NevadaSalcantay(6271 m)
NevadaCoropuna(6271 m)
NudoAusandate(6384 m)
80°W 75°W 70°W
75°W
10°S
5°S
0°
15°S
10°S
5°S
0°
PERU
IBRD 33465
OCTOBER 2004
PERUSELECTED CITIES AND TOWNS
DEPARTMENT CAPITALS
NATIONAL CAPITAL
RIVERS
MAIN ROADS
RAILROADS
DEPARTMENT BOUNDARIES
INTERNATIONAL BOUNDARIES
0 100 200
0 100 200 Miles
300 Kilometers