world geography sept. 12, 2014. today - population (part 1)
TRANSCRIPT

WORLD GEOGRAPHY
Sept. 12, 2014


“I’m not afraid of nuclear war. China has a population of 600,000,000; even if half of them are killed, there are still 300,000,000 left.”
- Mao Zedong, 1956

20 years later…
Maybe one kid is enough…

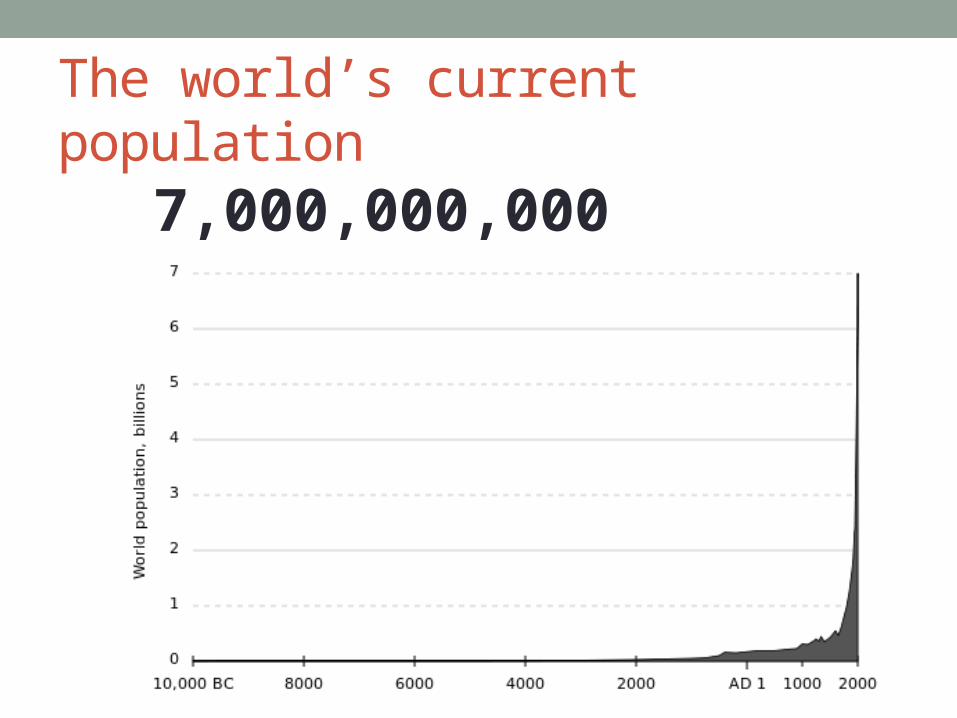
The world’s current population
7,000,000,000

The world’s current population
7,000,000,000
(well, actually about 7.2 billion)
- How did we get to this number?
http://www.youtube.com/watch?v=VcSX4ytEfcE
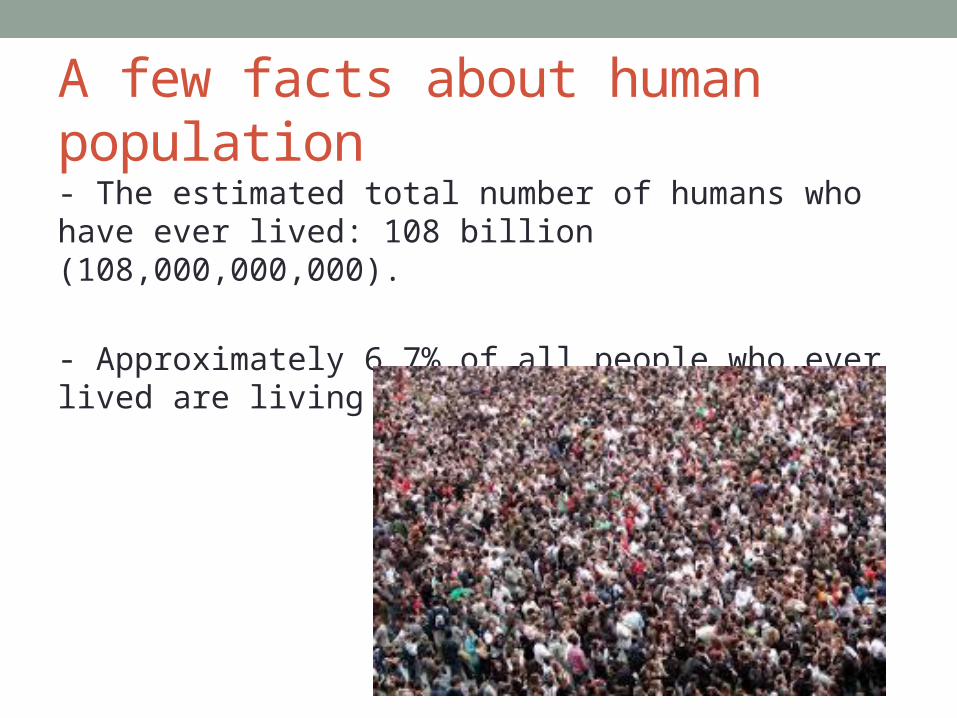
A few facts about human population
- The estimated total number of humans who have ever lived: 108 billion (108,000,000,000).
- Approximately 6.7% of all people who ever lived are living today.

A few facts about human population
For every 1,000 females…
1,010 males

A few facts about human population
- 30% of the world’s population regularly eats with these:

A few facts about human population
- One of every three people is Chinese or Indian.
1.39 billion
1.27 billion

A few facts about human population
- Half of the world’s people live in China, India, USA, Indonesia, Brazil, and Pakistan.

A few facts about human population
- The most densely populated country is:
SingaporeFor every km2, there are 7,300 people.
Human population
A key factor to studying and understanding human geography is knowing about human population: Demography:
- Where is everyone?
- Why do some places have more people than others?
- Why does the population increase at different rates?
- What about overpopulation?

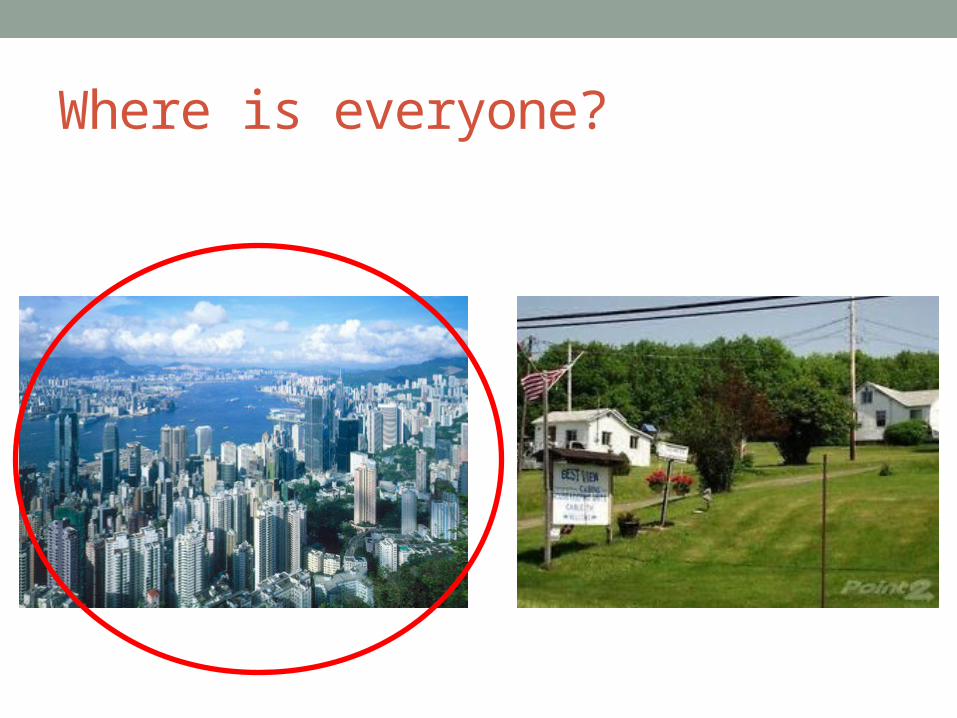
Where is everyone?
90% of the world’s population lives in the northern hemisphere
Where is everyone?

Where is everyone?
1925
2000
Where is everyone?
Today, approx. 53% of the world’s population lives in urban areas.

Reporting population
Several ways of doing this:
- Population
- Population density (arithmetic)
- Physiological population density

Population density (arithmetic)
Simply the population size relative to land size (also called “crude density”).
- Provides some insight into population, but does not provide the whole picture.
Population density (arithmetic)
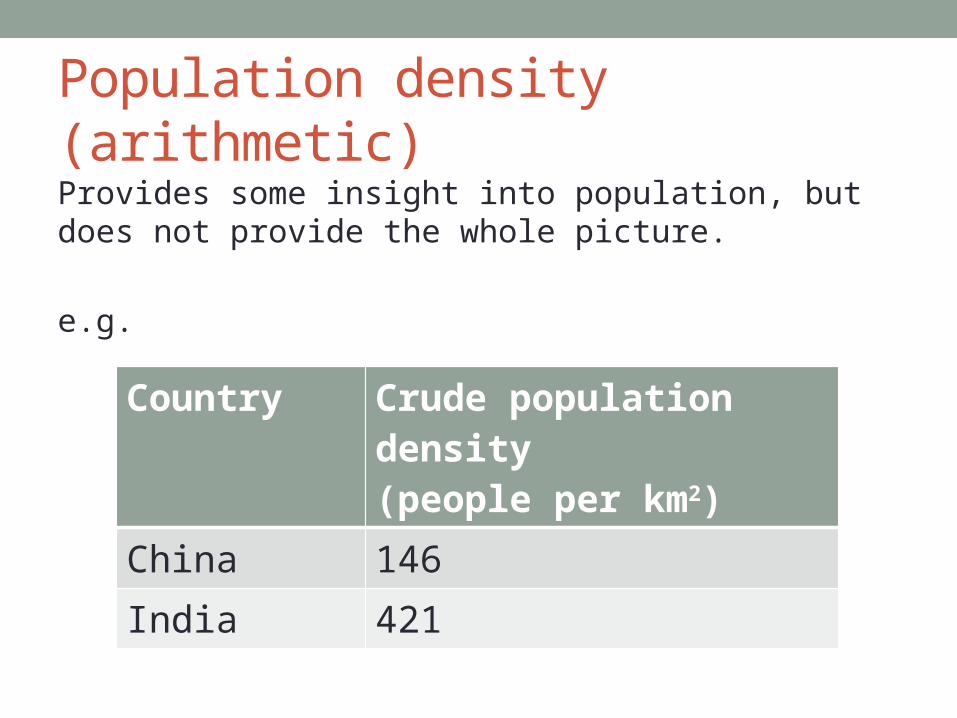
Provides some insight into population, but does not provide the whole picture.
e.g.
Country Crude population density(people per km2)
China 146India 421

Population density (arithmetic)

Physiological population density
Number of people per unit of area of arable land.
Arable land = farmland (productive agriculture)

Physiological population density
Number of people per unit of area of arable land.
- e.g. Egypt
Arithmetic vs. Physiological pop. density
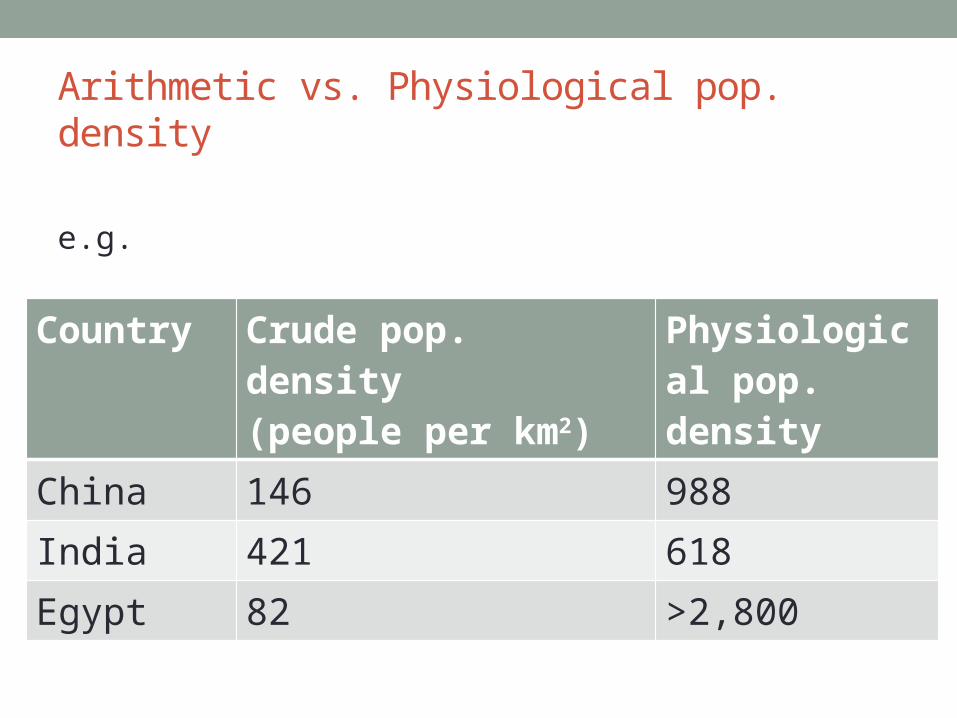
e.g.
Country Crude pop. density(people per km2)
Physiological pop. density
China 146 988India 421 618Egypt 82 >2,800

Population distribution- Locations and places where people live.
- Often represented on dot maps
Each dot represents a certain number of people.
e.g. 100, 1,000, 100,000
- Depends on scale
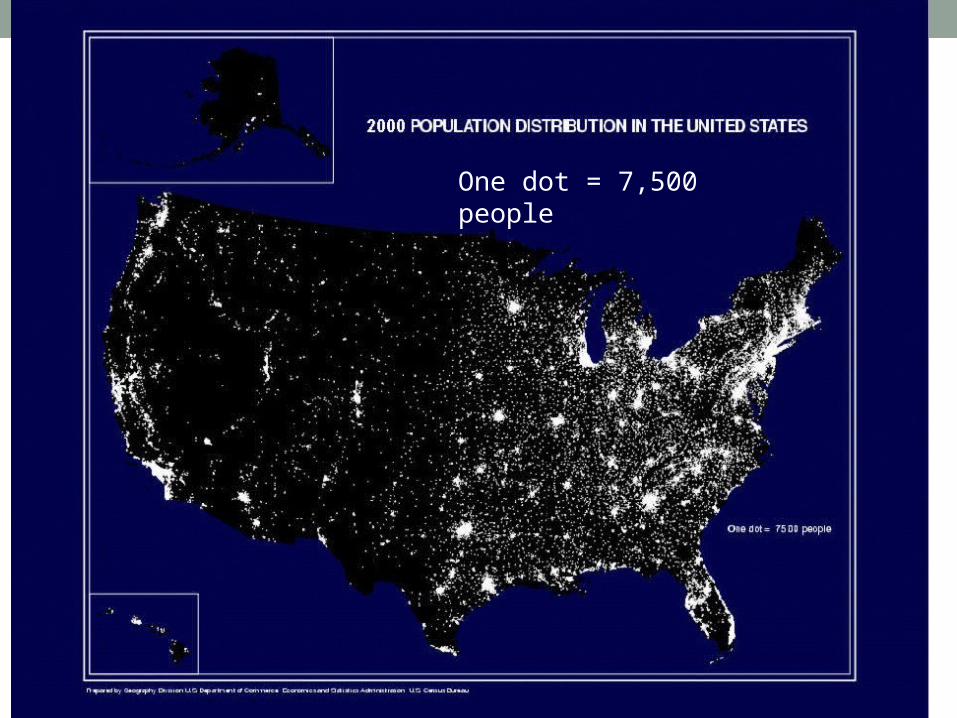
One dot = 7,500 people

One dot = 50 people

One dot = 500,000 people

Population distribution- Clearly, people are not evenly distributed across the
Earth.
- Population clusters started where food was grown.
- Cities developed from these areas.
- Only recently have advances in agriculture and transport technologies allowed for the traditional patterns to change.

World population concentrations
Four major concentrations:
1. East Asia - China, Japan, Korea, Taiwan
2. South Asia - India, Pakistan, Bangladesh
3. Europe
4. North America

World population concentrations
1. East Asia - China, Japan, Korea, Taiwan
- approx. 1.5 billion (22% of the world’s pop.)

World population concentrations
2. South Asia - India, Pakistan, Bangladesh
- approx. 1.5 billion

World population concentrations
3. Europe
- approx.. 750 million
World population concentrations
More than 4 billion of the world’s people are within these three clusters/concentrations.
- Referred to as the Eurasian land mass.

World population concentrations
4. North America – USA, Mexico, Canada
- approx. 560 mil.

Dynamic population
http://www.worldometers.info/world-population/
- The world’s population is growing at a rate of 1.2%/year.
- This may seem small, but actually, huge.
- rate amounts to 75,000,000 people/year.

Dynamic population
The world’s population is growing enormously.
- due to shortened doubling time.

Population growth- The percent (%) by which a country’s population grows or
decreases.
- Many factors affect this: life-style, standards of living, religious views, etc.


Population growth- Natural increase: difference between number of births and
number of deaths.
- Crude birth rate (CBR) - # of births per year per 1,000 people.
- Crude death rate (CDR) - # of deaths per year per 1,000 people.

Natural increase

CBR

Mortality rate
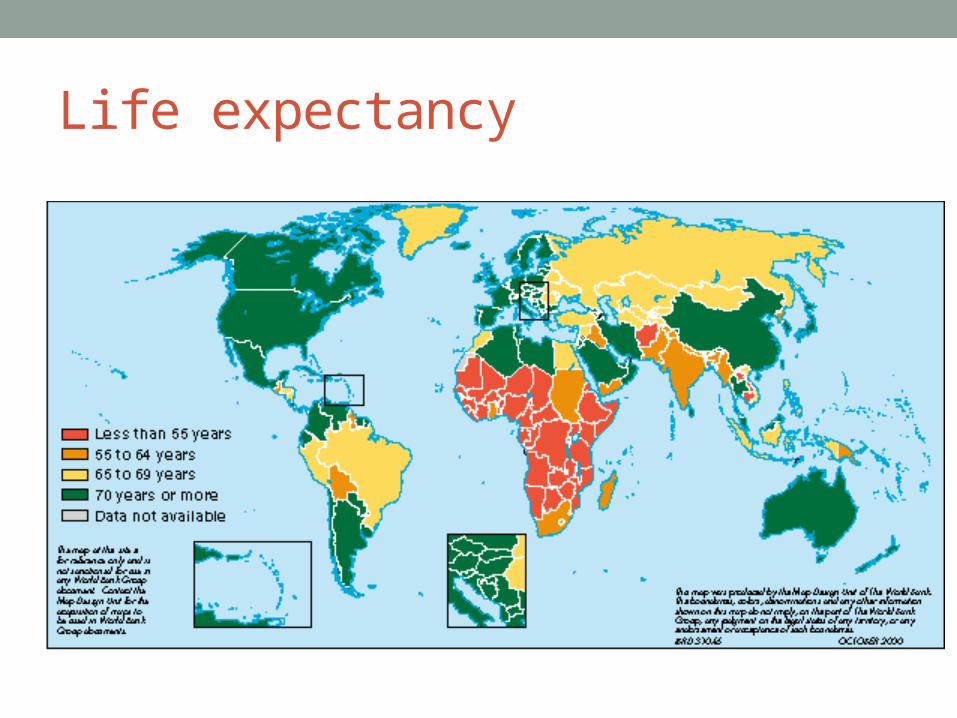
Life expectancy
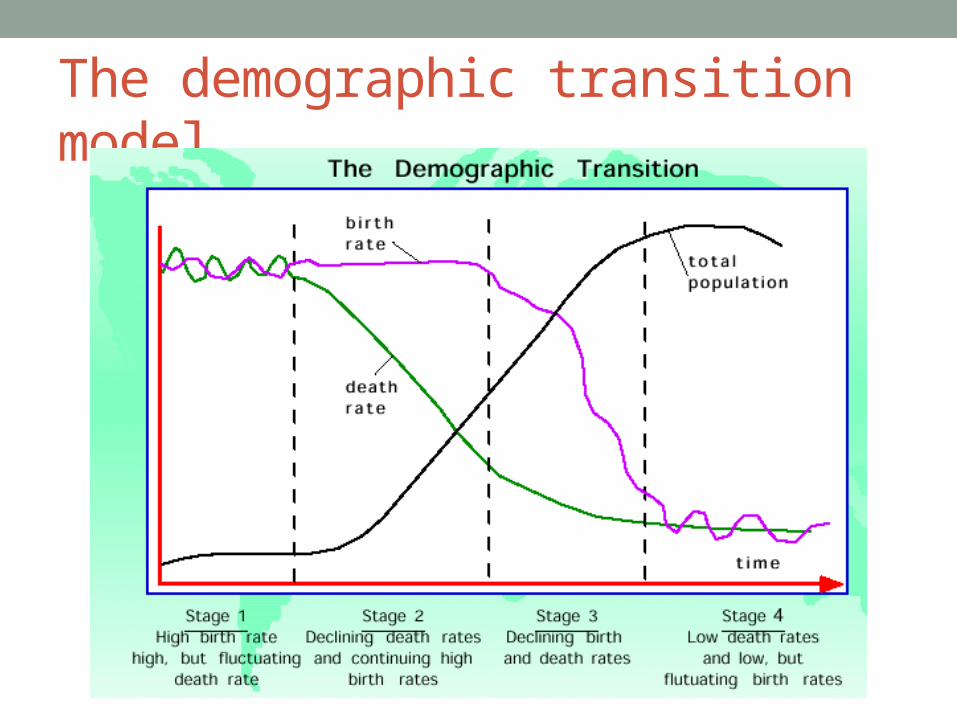
The demographic transition model

The demographic transition model
The demographic transition model
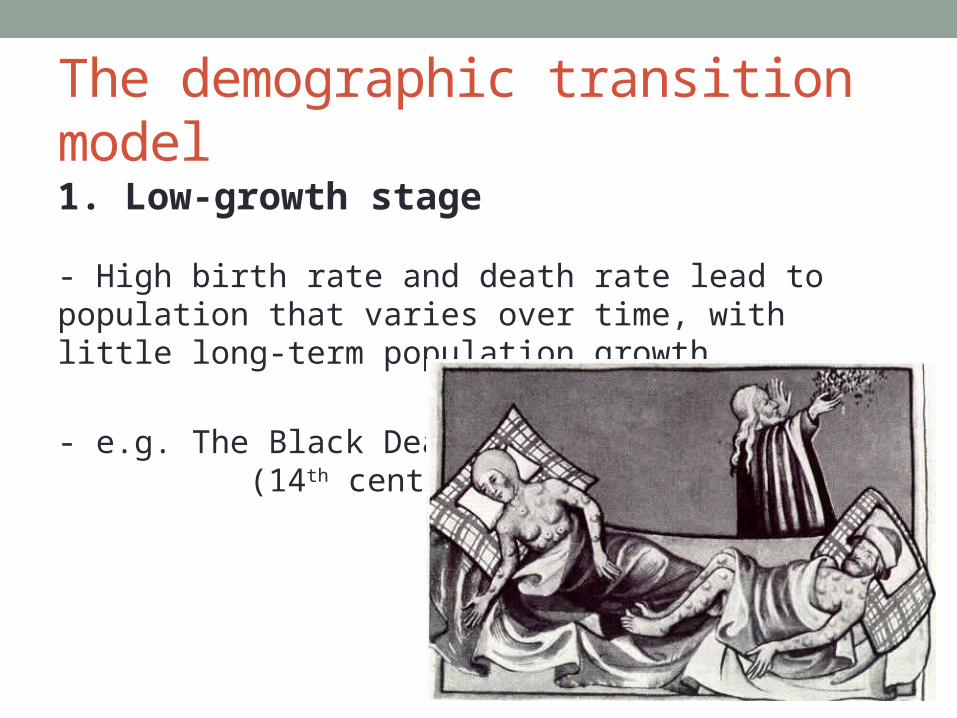
1. Low-growth stage
- High birth rate and death rate lead to population that varies over time, with little long-term population growth.
- e.g. The Black Death (14th century)

The demographic transition model

The demographic transition model
2. High-growth stage
- High birth rate and declining death rate lead to sustained and significant population increase.
e.g. Industrial Revolution and advancement in science and improved standard of living.
Europeans went all over the globe, made death rates drop in South America, India, and Africa (after some unpleasantness).

The demographic transition model

The demographic transition model
3. Moderate-growth stage
- Declining birth rate combined with already-low death rate to continuing population growth.
e.g. 1900’s in USA – infant and child mortality rates dropped, people use to have many kids because of a chance they might die young and needed farm hands, no more.

The demographic transition model

The demographic transition model
4. Low-growth (or stationary) stage
- Low birth rate and low death rate lead to a very low rate of growth.
e.g. Birth Rates are the lowest in the world where women are most involved in the labor force and educated. Europe and USA

The demographic transition model
Stage 5?
- Decline in populationas death rate overtakesbirth rate


Before next class
Do the reading on the website (they will be “live” tomorrow).