world ngl production - aspo france2 ngl production data is a mess and it is almost impossible to...
TRANSCRIPT

1
Jean Laherrère 17 June 2019
World NGL production For a long time I complained about the discrepancy between the NGPL (natural gas plant liquid) reported by EIA and the NGL reported by IEA where the definition of condensate varies with the sale agreement (following NPD in Norway), being either crude if sold with crude or NGL if sold with NGL. I complained also about the discrepancy of IEA forecasts My 2014 paper « Quoi de neuf dans la production d’énergie » 13 novembre Mastere OSE Mines Paris http://aspofrance.viabloga.com/files/JL_Sophia2014.pdf displayed world NGL & NGPL forecasts with a difference of more than 2 Mb/d Fig 40: world NGL IEA/WEO 2006-2013 & NGPL EIA/IEO2014
Fig 41: conventional crude oil +NGL for WEO 2000 to 2013
The range of uncertainty on forecast on crude + NGL is over 20 Mb/d
0!
0,15!
0,3!
0,45!
0,6!
0!
5!
10!
15!
20!
1980! 1990! 2000! 2010! 2020! 2030! 2040!N
GL
annu
al p
rodu
ctio
n IE
A G
t!
Mb/
d!
year!
world NGL forecasts IEA/WEO 2006 to 2013 & EIA/IEO NGPL forecasts!
WEO 2006!WEO 2008!WEO2010 NP!WEO2012 NP!WEO 2013 NP!EIA NGPL actual!EIA/IEO2014!IEA NGL Gt!
Jean Laherrere Sept 2014!
60!
70!
80!
90!
100!
110!
1980! 1990! 2000! 2010! 2020! 2030! 2040!
Mb/
d!
year!
world conventional crude oil +NGL forecasts WEO 2000 to 2013!
WEO 2000!WEO 2002!WEO 2004!WEO 2006!WEO 2008!WEO2010 NP!WEO2012 NP!WEO 2013 NP!
Jean Laherrere Sept 2014!

2
NGL production data is a mess and it is almost impossible to find reliable historical NGL data for each country and the world. Furthermore, most of data are in volume and added despite a large range of heat content: it is adding oranges and apples! The big problem is about condensate. Condensate was produced in the past in the US with crude oil and measured together, it is why EIA reports lease condensate with crude oil in their historical data and the liquids extracted in the gas plants as NGPL. NGL is the sum of NGPL and condensate. Condensate is excluded by the OPEC members in their quotas, it is why OPEC data does not report condensate production in their ASB. NGL production for OPEC always includes condensate, but not always for Non-OPEC and IEA does not report Non-UPEC NGLs As I often said in the world of football there are rules, umpires and red cards, in the world of oil there is no rules, no umpire and no red card! Most of data is reported without a clear definition of the product. There are problems with condensate, ethane, LPG (liquified petroleum gases) and pentanes! -API Condensate Condensate is a low-density hydrocarbon mixture that exists as a gas in an oil or natural gas reservoir, but condenses to a liquid as temperature and pressure decrease during extraction. Condensate is sometimes called "natural gasoline" because it has a similar boiling point to refined gasoline; it generally enters the crude oil stream after production. Conventional Oil In conventional crude oil production, a well is drilled into a geologic formation in which the reservoir and fluid characteristics permit the oil to readily flow to the wellbore. The oil gravity is measured in the US in °API and as US rules the oil world, crude oil benchmarks are reported in API The range of gravity of the world main crude benchmarks is from 10°API (Boscan) to over 69 °API (Bintulu condensate). The median is 33.4° and the average is 34.2°.

3
°API is related to specific gravity (d) as °API = 141.5/d-131.5 The range of oil products is from 10 °API (=density of water) = Boscan crude oil to over 250 °API (ethane NGL)
-IEA IEA classification has a double definition for condensate: either crude, either NGL: it is a bad practice leading to confusion!
0
10
20
30
40
50
60
70
80
0 50 100 150 200 250 300
°API
rank by °API
API gravity of crude oil products
Boscan 10.1 °API
Bintulu condensate 69.3 °APIAlgerian condensate 68.7 °API
WTI 39.6 °APIBrent 38.3 °API
https://en.wikipedia.org/wiki/List_of_crude_oil_products
Jean Laherrere June 2019
0,3
0,4
0,5
0,6
0,7
0,8
0,9
1,0
10 20 30 40 50 60 70 80 90 100110120130140150160170180190200210220230240250260270
spec
ific
grav
ity d
°API
specific gravity versus °API
Jean Laherrere June 2019
liquids fuels densitypentane 0,63butane 0.59propane 0.51ethane 0.37
crude oil °APIBoscan 10 Brent 38.3WTI 39.6Bintulu cond 69.6
°API = 141.5/d - 131.5d = 141.5/(API+131.5)

4
And in the IEA manual ethane is on page 170 excluded from NGL Where is the umpire and the red card? IEA glossary: Condensates are liquid hydrocarbon mixtures composed of C5 and higher carbon number hydrocarbons, normally recovered from fractionation of gaseous flows at associated and non-associated gas field. They normally have an API between 50° and 85° Natural gas liquids comprising LPG (ethane, propane and butane and their derivatives) and pentanes and pentanes-plus. Only NGL deriving directly from oil and gas field operations, or from natural-gas processing plants, are included in OMR oil supply data. LPG production from oil refineries is therefore excluded Why C5 first and later pentanes? It is not clear that condensate = C5 (pentane) is included in IEA NGLs IEA statistics manual 2010 Page 170 is in contradiction with page 189 about ethane Page 170 Natural gas liquids are liquid hydrocarbon mixtures, which are gaseous at reservoir temperatures and pressures, but are recoverable by condensation and absorption. Natural gas liquids can be classified according to their vapour pressure; this is the pressure exerted by a vapour escaping from a liquid – it quantifies the tendency of molecules to enter the gaseous phase. A natural gas liquid with a low vapour pressure is a condensate; with an intermediate pressure, it is a natural gasoline, and with a high vapour pressure it is a liquid petroleum gas. Liquid petroleum gas (LPG) is thus gaseous at ambient temperature and pressure and comprises propane and butane. Natural gasoline includes pentanes plus and heavier hydrocarbons. It is liquid at ambient temperature and pressure. Natural gas liquids include propane, butane, pentane, hexane and heptane, but not methane and ethane, since these hydrocarbons need refrigeration to be liquefied. It is wrong to write that ethane is excluded from NGL, as methane, in the manual page 170, but not in the definition page 189 and in the glossary? LPG includes ethane in the glossary but page 170, page 181(LPG = 70% propane +30% butane by mass) and page 188 ethane is excluded? Page 189

5
Natural gas liquids (NGL): Natural gas liquids are liquid or liquefied hydrocarbons recovered from natural gas in separation facilities or gas processing plants. Natural gas liquids include ethane, propane, butane (normal and iso-), (iso)pentane and pentanes plus (sometimes referred to as natural gasoline or plant condensate). The natural gas may be extracted with crude oil (associated gas) or from a gas field without crude oil. The NGL may be removed from the natural gas stream close to the well-head or transported to a distant gas processing plant. Where gas processing and crude oil production are both occurring, it is common for some of the condensate fraction of the NGL to be injected into the crude oil stream. In ASS = Annual Statistical Supplement or OMR (Oil Market Report), IEA reports only NGLs for OPEC but not for non-OPEC, meaning that NGLs are included with crude oil for Non-OPEC. It is hard to get homogeneous data on NGLs IEA 2014 MTOMR reports this forecast, but it is not found in later forecasts NGL production = pentanes + LPG (Liquefied Petroleum Gas = propane + butane) + Ethane
But this 2014 table 2.6 is wrong with a total of 9.1 Mb/d, IEA reports for 2013 world NGL at 13.3 Mb/d: quite a correction! Ethane density is reported with different densities on the web IEA statistics data browse reports oil production broken in crude, NGL, naphtha and LPG
It is a mess; in the manual NGL is assumed to include LPG (without no mention on the source), but in IEA browser NGL and LPG are reported separately! In fact, there are two LPG: LPG coming from gas treatment plants and LPG coming from refineries. These refinery LPG are not production but conversion! We are interested only in LPG from gasfield plants.

6
The above graph is wrong by adding crude oil production with LPG & naphtha productions which are coming through refinery from crude oil. In fact it is not ;a production it is a transformation! Manuel page 188 & 189 Liquefied petroleum gases (LPG): LPG are light paraffinic hydrocarbons derived from the refinery processes, crude oil stabilisation and natural gas processing plants. They consist mainly of propane (C3H8) and butane (C4Hl0) or a combination of the two. They could also include propylene, butylene, isobutene and isobutylene. LPG are normally liquefied under pressure for transportation and storage. Naphtha: Naphtha is a feedstock destined for either the petrochemical industry (e.g. ethylene manufacture or aromatics production). Naphtha comprises material in the 30°C and 2l0°C distillation range or part of this range. Pentanes are not mentioned in IEA 2010 manual! IEA 2019: “oil information database documentation” Page 15 product definition: NGL are the liquid or liquefied hydrocarbons recovered from natural gas in separation facilities or gas processing plants. They include ethane, propane, (normal and iso-) butane, (iso) pentane and pentanes plus (sometimes referred to as natural gasoline or plant condensates). Page 36 for Canada Condensates and pentanes plus are included in crude oil from 2005, in NGL from 1990 to 2004, and in LPG prior to 1990. Historical revisions are pending. The Canadian administration plans to report condensates and pentanes plus in crude oil for the entire time series because the split between the two products is not available for all supply flows. Page 58 oil products: average densities, volume and heat equivalents Pentanes (indicated in NGL) do not appear! Page 60 -Mt = million tonnes -mb = million barrels Why two different symbols for the same number (million)? It is clear that IEA is not clear in their definitions! Using IEA 2019 page 58 b/t for naphtha and LPG and NGL Mb/d from WEO, the plot of other products in Mt and Mb/d

7
The fit for NGL Mt and Mb/d indicates that NGL 100 Mt corresponds to 3.7 Mb/d or b/t = 13.8 The NGL corresponding value for b/t = 13.8 in IEA graph b/t vs API is about 180 °API Using data from page 58, the plot of b/t versus density(d) for oil products (from ethane to bitumen) is on a hyperbolic curve where b/t = 6290/d. Unfortunately, IEA does not report NGL b/t, but the comparison of IEA in Mt and in Mb/d (WEO) leads to b/t= 13.8 IEA does not report pentanes b/t, but the density of pentanes is given at 630, corresponding to b/t = 10
Converting density into °API the plot is linear: b/t = 0.0455 (°API + 131,5)
01234567891011121314151617
0
50
100
150
200
250
300
350
400
450
1990 1995 2000 2005 2010 2015 2020
Mb/
d
Mt
year
other products production from IEA browser Mt
LNG MtNaphtha MtLPG MtNGL Mb/d WEOnaphtal Mb/d 8,91 b/tLPG Mb/d 11,67 b/t
Jean Laherrere May 2019
6
7
8
9
10
11
12
13
14
15
16
17
18
300 400 500 600 700 800 900 1000 1100
b/t
density kg/m3
b/t versus density for oil products from IEA 2019
b/t6290/d
Jean Laherrere June 2019
ethane
propane
butane
naphtha
LPG
crude oil
bitumen
NGL b/t=13.8
pentanes d = 0.63b/t = 10

8
The plot of the gross calorific value versus density is linear (except for bitumen) with MBtu/b = 0,0065*d+0,51
This graph of calorific value per volume is the opposite of the calorific value per weight: the linear equation GJ/t =-0.014*d + 57
6
7
8
9
10
11
12
13
14
15
16
17
18
5 31 57 83 109 135 161 187 213 239 265
b/t
°API
b/t versus °API for oil products from IEA 2019
b/t
0,0445*(°API+131.5)
Jean Laherrere June 2019
ethane
propane
butane
naphtha
LPG
crude oil
bitumen
NGL b/t=13.8
pentanes d = 0.63b/t = 10
2
3
4
5
6
7
300 400 500 600 700 800 900 1000 1100
MBt
u/b
density kg/m3
gross calorific value versus density for oil products from IEA 2019
gross calorific value MBtu/b
Mbtu/b = 0,0065*d+0,51
Jean Laherrere June 2019
ethane
propane
butane
naphtha
LPG
crude oil
bitumen

9
Oil production should be reported in weight instead than in volume! Data in weight is closer to data in energy than data in volume. IEA MTOMR2016 reports in table 2.1 non-OPEC Supply but without giving the breakdown of NGLs. MTOMR is not anymore reporting NGL. IEA did not answer our request to get non-OPEC NGL production. -JODI (close to IEA) Jodi 2nd manual 1. Crude oil: Including lease condensate – excluding NGL. 2. NGL: Liquid or liquefied hydrocarbons recovered from gas separation plants and gas processing facilities 3. Other: Refinery feedstocks + additives/oxygenates + other hydrocarbons 4. Total: Sum of categories (1) to (3) Total = Crude oil + NGL + Other. 5. LPG: Comprises propane and butane. 6. Naphtha: Comprises naphtha used as feedstocks for producing high octane gasoline and also as feedstock for the chemical/petrochemical industries Oil production should be only crude +NGL: the total adding other coming from refinery (in fact from crude) is not field production ! There is confusion between the NGL production (including LPG) from oil and gas fields and gas processing plants and oil products from refinery as LPG (propane and butane) and naphtha. Oil products does not represent the real oil production of a country.
y = -0,0138x + 57,23
40
45
50
55
300 400 500 600 700 800 900 1000
gros
s cal
orifi
c va
lue
GJ/
t
density kg/m3
IEA gross calorific values for petroleum products per weight
Jean Laherrere Ap 2015
ethane
propane
butane
motor gasoline
fuel oil high S
diesel
1 toe = 42 GJ

10
I quitted using JODI data because when adding, JODI confused no data with zero data JODI reports monthly NGL production in kb/d, but the comparison in Canada with NEB annual data shows that JODI data is not reliable, with a sharp decrease from December 2015 to January 2016! Before it was too high, after it is too low!
-OPEC OPEC in 1982, in order to maintain high oil price, tried to regulate oil production by installing quotas for the crude production based on population, consumption, debt and proven reserves (OPEC quotas and crude oil production Jan 2011 http://theoildrum.com/node/7363)
0
5
10
15
20
25
30
35
40
45
50
1 995 2 000 2 005 2 010 2 015 2 020
M.m
3
year
Canada NGL production from NEB & JODI
NEB
JODI
Jean Laherrere June 2019

11
The problem with OPEC (producers’ club in opposition with IEA consumers’ club) is that the number of OPEC varies with time (departure of Indonesia and Qatar, arrival of Angola and Equatorial Guinea, some leave and return as Gabon, Ecuador) OPEC quotas vary (as also the number of members) and real production is always above.
Condensate is not included in OPEC quota (neither NGL) and it is why OPEC reports only crude oil production OPEC glossary: Natural gas liquids (NGLs): those reservoir gases liquefied at the surface in lease separators, field facilities or gas processing plants. NGLs consist of field condensates and natural gas plant products such as ethane, pentane, propane, butane and natural gasoline. OPEC MOMR May 2019 reports OPEC crude oil production table 5-9 based on secondary sources (Venezuela 2017 = 1.354 Mb/d, April 2019 = 0.768 Mb/d) and table 5-10 based on direct communication (Venezuela 2017 = 1,516 Mb/d or 12% more, April 2019 = 1.037 Mb/d or 35% more!) After the 1986 countershock, OPEC members increased their reserves to increase their quotas by around 50%. Kuwait started in 1986, Saudi Arabia ended in 1988. But the Neutral Zone (owned 50/50 SA & Kuwait) did not move. Venezuela increased sharply their reserves in 2010 by including Orinoco extra-heavy oil (in production since 1979)

12
Proven reserves of Saudi Arabia are about 260 Gb since 1988, meaning that for 30 years each year the same volume of oil was discovered as the volume produced: it is unlikely! OAPEC reports the number of oil & gas discoveries for Arab producers and for the period 1996-2016 Saudi Arabia has no oil discoveries for 9 years! OPEC proved reserves are political and using them for forecasting production is a joke.
-EIA EIA glossary: condensate = Light liquid hydrocarbons recovered from lease separators or field facilities at associated and non-associated natural gas wells. Mostly pentanes and heavier hydrocarbons. Normally enters the crude oil stream after production. In the past US oil producers in particular with stripper wells collected crude oil and condensate in the same tank. It is why EIA report crude oil and condensate together. Natural gas is treated in plant where gas liquids are extracted: it is why NG production is reported
1 000
10 000
100 000
1 000 000
1 960 1 970 1 980 1 990 2 000 2 010 2 020
prov
en re
serv
es M
b lo
g sc
ale
OPEC proven crude oil reserves from ASB2018 T31
VenezuelaSaudi ArabiaIranIraqKuwaitUAEQatarplus 100%plus 50%
Jean Laherrere May 2019
OPEC fight for quotas1984-1989
0
2
4
6
8
10
12
14
16
18
20
1995 2000 2005 2010 2015 2020
num
ber
year
Oil discoveries from OAPEC
Algeria oil
Libya oil
Kuwait oil
S Arabia oil
Iraq oil
UAE oil
Qatar oil
Jean Laherrere May 2019

13
either wet or dry. EIA reports NG production as marketed (wet gas) or as dry gas in Tcf and the NGPL in Tcf is the difference marketed less dry. -US EIA reports only since 2015 the USL48 crude oil production by API gravity. In 2018 out of 10 Mb/d only 1 Mb/d has a gravity higher than 50 °API, but it is forgetting that NGPL 2018 production is 3.7 Mb/d with above 100°API gravity
EIA reports US NG production as marketed and as dry: the difference is the extraction of NGPL and for 2018 it is 2.3 Tcf
The plot of US NGPL in Tcf and in Mb gives a relationship of 1 Tcf = 710 Mb = 1.9 Mb/d
0
5
10
15
20
25
30
35
40
1900 1910 1920 1930 1940 1950 1960 1970 1980 1990 2000 2010 2020
Tcf
year
US natural gas production
marketeddryNGPL = mark-dry Tcf
Jean Laherrere May 2019

14
EIA reports US lease condensate production only after 1979, before condensate was reported with crude production and cannot be separated. US NGPL increased from 1950 to 1973 from 0.5 Mb/d to 1.7 Mb/d; was bumpy flat until2008 and increased sharply: a 2 Mb/d increase in 10 years
USDOE « NGL primer » June 2018 shows that ethane is the main product and forecasts its increase.
0
300
600
900
1200
1500
1800
2100
0
1
2
3
1930 1940 1950 1960 1970 1980 1990 2000 2010 2020
Mb
Tcf
year
US NGPL production in Tcf and Mb
NGPL = mark-dry TcfNGPL Mb
Jean Laherrere May 2019
0,0
0,3
0,5
0,8
1,1
1,4
1,6
1,9
2,2
2,5
2,7
3,0
3,3
3,6
3,8
4,1
4,4
0
100
200
300
400
500
600
700
800
900
1000
1100
1200
1300
1400
1500
1600
1950 1960 1970 1980 1990 2000 2010 2020
Mb/
d
annu
al p
rodu
ctio
n M
b
year
US NGL production from EIA
NGPL+condensate = NGLTotal NGPLTotal LPGEthanePropanePentanes Plus = natural gasolineIsobutaneNormal Butanelease condensate
Jean Laherrere May 2019

15
-world For the world, EIA reported from 1994 until October 2015 monthly production values for oil producing countries of crude +condensate, NGPL and all liquids. Beyond 2015 by lack of budget EIA/MER reports only in table 11-1 crude +condensate values for main producers.
The extraction of liquids depends upon the relative price of each liquid compared to the price of NG. Some country does not extract liquids for a certain time by lack of plant, as for example Equatorial Guinea started producing gas in 1993, but only NGPL in 2004, or Mozambique starting NG production in 1998, but not yet producing NGPL, same with Gabon starting NG production in 1991, but most is reinjected. -heat content Reporting oil production by volume misses the point that the heat content (kBtu/b) of oil varies for crude oil between fields and countries but also between products. It is why EIA reports oil production in quad (10E15 Btu) or energy. In Europe oil production is reported in
21,922,623,424,124,825,626,327,027,728,529,229,930,731,432,132,933,634,335,035,8
50
55
60
65
70
75
80
85
90
95
100
1980 1985 1990 1995 2000 2005 2010 2015 2020
annu
al p
rodu
ctiio
n G
b
prod
uctio
n M
b/d
year
World crude & liquids production from EIA
EIA liquids = total oil supply
crude +condensate + NGPL
crude + condensate table 11-1b
Jean Laherrere May 2017
EIA reports total oil & NGPL until Oct 2015 but since only crude+condensate : www.eia.gov/beta/MERhttps://www.eia.gov/totalenergy/data/monthly/#international

16
weight and as there is a linear relationship between heat content and gravity, oil production in Mt is a better picture of the energy than the production in Mb/d
EIA measures heat content taking in account the water vapor (higher calorific value, called gross by IEA) when in Europe often the lower calorific value (excluding the heat of the water formed during the combustion), called net by IEA https://www.engineeringtoolbox.com/fuels-higher-calorific-values-d_169.html US NGPL production heat content has decreased from 4.5 MBtu/b in 1950 to 3.7 MBtu in 2018. The heat content of gas liquids consumption is less. EIA report heat content for NGPL production as liquids consumption. Heat content of gas liquids consumption was fat from 1950 to 1969, in contrary to production: it appears that the heat content was arbitrary
5000
5100
5200
5300
5400
5500
5600
5700
5800
5900
6000
6100
6200
6300
6400
6500
0 10 20 30 40 50 60 70 80
heat
con
tent
kBt
u/b
cumulative crude +condensate Mb/d
EIA 2014 crude oil +condensate heat content versus production
heat content kBtu/b
Jean Laherrere 2015
Sudan 5084
Cuba 6393
US 5800 constant since 1950!
average 5860 kBtu/bmedian 5880 kBtu/b
3,5
3,6
3,7
3,8
3,9
4,0
4,1
4,2
4,3
4,4
4,5
4,6
1950 1955 1960 1965 1970 1975 1980 1985 1990 1995 2000 2005 2010 2015 2020
MBt
u/b
year
EIA heat content for US NGPL production & gas liquids consumption
US NGPL production
gas liquids consumption
Jean Laherrere June 2019

17
As NGPL heat content is less, US NGPL production in quad has increased less than in Mb/d
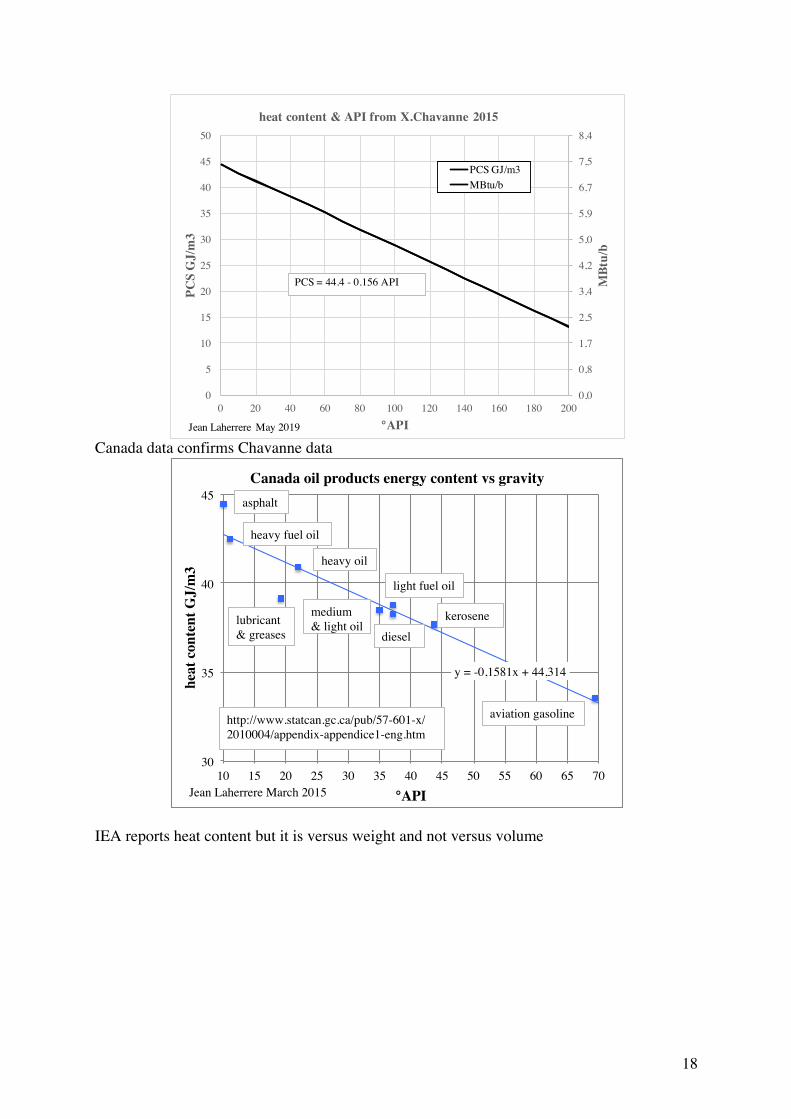
In my paper Club de Nice 2015 "Tentatives d'explication du prix du pétrole et du gaz" http://www.clubdenice.eu/2015/Jean_LAHERRERE.pdf Xavier Chavanne’s graph displays a linear correlation between heat content and gravity API from Chevron’s data where PCS = 44.4 – 0.156 °API Fig 6:
To get higher API values up to 200 °, I plot Chavanne equation to get in GJ/m3 and for MBtu/b
0
0,5
1
1,5
2
2,5
3
3,5
4
4,5
5
5,5
0,0
0,5
1,0
1,5
2,0
2,5
3,0
3,5
4,0
1950 1955 1960 1965 1970 1975 1980 1985 1990 1995 2000 2005 2010 2015 2020
quad
Mb/
d
year
US NGPLproduction in Mb/d & quad
US NGPF Mb/dUS NGPL quad
Jean Laherrere May 2019
18
Canada data confirms Chavanne data
IEA reports heat content but it is versus weight and not versus volume
0,0
0,8
1,7
2,5
3,4
4,2
5,0
5,9
6,7
7,5
8,4
0
5
10
15
20
25
30
35
40
45
50
0 20 40 60 80 100 120 140 160 180 200
MBt
u/b
PCS
GJ/
m3
°API
heat content & API from X.Chavanne 2015
PCS GJ/m3MBtu/b
Jean Laherrere May 2019
PCS = 44.4 - 0.156 API
y = -0,1581x + 44,314!
30!
35!
40!
45!
10! 15! 20! 25! 30! 35! 40! 45! 50! 55! 60! 65! 70!
heat
con
tent
GJ/
m3!
°API!
Canada oil products energy content vs gravity!
Jean Laherrere March 2015!
aviation gasoline!
asphalt!
heavy fuel oil!
lubricant & greases!
light fuel oil!
kerosene!diesel!
http://www.statcan.gc.ca/pub/57-601-x/2010004/appendix-appendice1-eng.htm!
heavy oil!
medium & light oil!

19
-world The world NGL production from IEA, EIA and OPEC in Mb/d and in Mt with the breakdown in NGPL and condensate shows that the data is uncomplete (data starts only in 1970) and uncertain. IEA NGL in Mt/28 is about the same as NGL in Mb/d, meaning that the density is about is very light with 1 t = 365/28 b = 13 b or above 100 °API! I did not find on the web any value of NGPL in °API except https://www.reuters.com/article/us-condensate-usa-kemp/new-definitions-needed-for-condensate-and-gas-liquids-kemp-idUSKCN0HZ03220141011 “The API gravity of condensate is typically 50 degrees to 120 degrees,” according to Schlumberger’s online Oilfield Glossary. Hexane has an API gravity over 80, pentane over 90 and butane over 110, The gravity of natural gasoline is around 80 °API This API versus specific gravity graph (equation °API = 141.5/sg – 131.5) misses the lighter NGLs: ethane, propane & butane.
y = -0,0138x + 57,23
40
45
50
55
300 400 500 600 700 800 900 1000
gros
s cal
orifi
c va
lue
GJ/
t
density kg/m3
IEA gross calorific values for petroleum products per weight
Jean Laherrere Ap 2015
ethane
propane
butane
motor gasoline
fuel oil high S
diesel
1 toe = 42 GJ

20
APIdata excel reports the API of many products www.pe.tamu.edu/barrufet/public_html/PETE310/APIDATA.XLS ethane 266 °API, propane 148 °API, N-Butane 111 °API & N-pentane 93 °API IEA NGL production in volume is reported less than in weight.,
The ratio b/t is increases from 12 in 1990 to over 13 in 2010, getting lighter. In fact, IEA/OMR reports only NGL for OPEC and not for the world.
0
50
100
150
200
250
300
350
400
450
500
0
2
4
6
8
10
12
14
16
18
1980 1990 2000 2010 2020
NG
L pr
oduc
tion
Mt
NG
L pr
odut
ion
Mb/
d
year
world NGL production from IEA
WEO
NGL IEA Mb/d
NGL IEA Mt
Jean Laherrere May 2019

21
-Canada NGL is reported without condensate, or condensate could be in the pentanes (careful Mb/d = kb/d) NEB 2017 NGL demand outlook where the increase after 2015 comes from pentanes plus = condensate
The forecast from statcan for the NGL production is similar: sharp increase of condensate (LTO?) since 2015
11,5
12
12,5
13
13,5
14
0
50
100
150
200
250
300
350
400
450
1990 2000 2010 2020
b/t
NG
L M
t
year
world NGL production from IEA
NGL IEA Mtb/t IEA
Jean Laherrere May 2019

22
In my Canada2018 paper my NGL production forecast was less optimistic for an ultimate of 14 Gb than NEB2017, but for 2040 same as NEB2013
Updated forecast in 2019 with the same ultimate of 14 Gb for the NGL production from CAPP data (NEB is higher) expects a peak this year or next. NEB 2018 NGL forecast is quite different from NEB 2016
0
50
100
150
200
250
300
350
400
450
1950 1960 1970 1980 1990 2000 2010 2020 2030 2040 2050 2060 2070
annu
al p
rodu
ctio
n M
b
year
Canada natural gas liquids production
NEB2017 NGL
NEB2013 NGL
U = 14 Gb
prod Mb
Jean Laherrere April 2018
NEB NGL = ethane + propane + butanes + pentanes plus

23
The ultimate of 14 Gb is from extrapolating HL parallel to the period 1995-2012 from the last data
Statcan reports for 1995-2017 Canada NGL production in volume (megaliter) and energy (terajoule) converted in million m3 and petajoule
0
2 000
4 000
6 000
8 000
10 000
12 000
14 000
0
100
200
300
400
500
600
700
1940 1950 1960 1970 1980 1990 2000 2010 2020 2030 2040 2050 2060 2070
cum
ulat
ive
prod
uctio
n M
b
annu
al p
rodu
ctio
n M
b
year
Canada NGL production
NEB2018 NGL forecast
NEB2016 NGL forecast
U = 14 Gb
CAPP NGL Mb
U = 14 Gb
CP NGL Mb
Jean Laherrere June 2019
0
1
2
3
4
5
6
7
8
9
10
0 2000 4000 6000 8000 10000 12000 14000
aP/C
P%
cumulative production Mb
Canada HL of NGL production 1947-2017
aP/CP%1995-2012
Jean Laherrere June 2019

24
Canada NGL production heat content in GJ/m3*-1 is plotted versus °API
Canada NGL production varies for heat content between 21 and 25 GJ/m3 and for gravity between 130 and 146 °API Canada NGL production heat content is less than US NGPL, and trending differently. Canada NGL production heat content from NEB is different from Canada NGPL (constant?) values from EIA.
0
5
10
15
20
25
30
35
0
100
200
300
400
500
600
700
800
1995 2000 2005 2010 2015 2020
M.m
3
peta
joul
e
year
Canada NGL production in volume & energy from statcan
petajoule
M.m3
Jean Laherrere May 2019
128
130
132
134
136
138
140
142
144
146
148
-25
-24
-23
-22
-21
1995 2000 2005 2010 2015 2020
°API
GJ/
m3
* -1
year
Canada NGL prodution heat content *-1 & API
GJ/m3*-1
°API
Jean Laherrere May 2019

25
-world NGL World NGL & NGPL production from different sources shows that the data is poor and incomplete, with the problem of IEA omitting to report NGLs from non-OPEC (NOPEC).
The correlation of NGL production and NG (gross-reinjected) production is fair for the period 1980-2010 with 1 Mb/d NGL for 11 Tcf NG production. After 2010 NGL increases more.
3
4
5
6
1995 2000 2005 2010 2015 2020
MBt
u/b
year
Canada & US NGL & crude oil production heat content
Canada EIA crude oil
US EIA crude oil
Canada EIA NGPL
US NGPL
Canada NEB NGL
Canada statcan NGL
Jean Laherrere May 2019

26
NGL production is higher for NOPEC than for OPEC
The problem for this graph is that the number of members of OPEC varies with time: the departure of Qatar from OPEC in 2018 will change all the data in 2019 -NGL production forecasts IEA/WEO NP (new policy) NGL production forecast is displayed from the editions 2006 to 2018 for 2015, 2020, 2025, 2030, 2035 & 2040. WEO forecasts are up and down, in particular for 2030 with WEO2018 being equal to WEO 2008. WEO forecasts seem to have some relationship with Brent oil price multiplied by -1
0
20
40
60
80
100
120
140
160
180
0
2
4
6
8
10
12
14
16
1900 1910 1920 1930 1940 1950 1960 1970 1980 1990 2000 2010 2020
NG
gro
ss-r
einj
ecte
d p
rodu
ctio
n Tc
f
NG
L pr
odut
ion
Mb/
d
year
world NGL & NG production
NGL IEA Mb/dMt/28NGPL +condensateNG/11prod NG gross-reinj Tcf
Jean Laherrere May 2019
0
1
2
3
4
5
6
7
8
9
10
11
12
13
14
15
1900 1920 1940 1960 1980 2000 2020
annu
al p
rodu
tion
Mb/
d
year
NGL production: OPEC & NOPEC
world NGL synt Mb/d
OPEC NGL
NOPEC NGL
Jean Laherrere May 2019

27
My NGL forecast is based on an ultimate of 550 Gb and future production will peak around 2040 at less than 18 Mb/d when WEO2018 forecasts 21 Mb/d but when WEO2014 forecasted 18 Mb/d NGPL is plotted together with NGPL WEO2014
HL (Hubbert linearization) of world NGL production is assumed to trend towards 550 Gb, being parallel to the slope of the period 1998-2008
-160
-140
-120
-100
-80
-60
-40
12
13
14
15
16
17
18
19
20
21
22
2006 2008 2010 2012 2014 2016 2018
Bren
t $/b
*-1
NG
L pr
odut
ion
Mb/
d
WEO edition year
WEO NP forecasts on world NGL productionprod 2040prod 2035prod 2030prod 2025prod 2020prod 2015Brent $/b*-1
Jean Laherrere May 2019
0
50
100
150
200
250
300
350
400
450
500
550
0
2
4
6
8
10
12
14
16
18
20
22
1900 1920 1940 1960 1980 2000 2020 2040 2060 2080 2100
cum
ulat
ive
prod
uctio
n G
b
annu
al p
rodu
tion
Mb/
d
year
world NGL production
U = 550 GbWEO2018WEO2017WEO2016WEO2015WEO2014world NGL synt Mb/dNGPL IEO2014NGPL EIA Mb/dU = 550 GbCP NGL Gb
Jean Laherrere May 2019

28
-OPEC NGL production OPEC NGL production is plotted from different sources, continuous from OPEC ASB since 1960 and discontinuous from IEA ASS and OMR. OPEC NGL production is reported in ASB only since 2015. I trust more OPEC data being v continuous. The discrepancy between IEA and OPEC is about 1 Mb/d in 2018
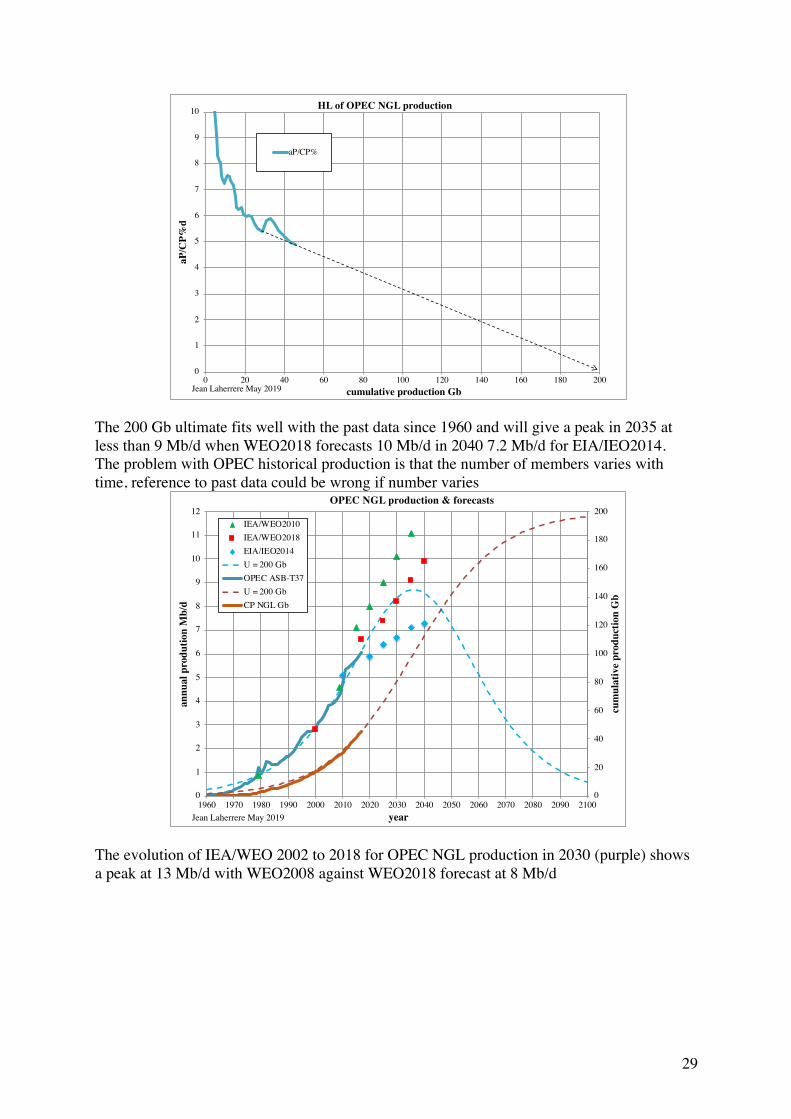
HL of OPEC NGL production trends towards 200 Gb, but this estimate is uncertain.
0
1
2
3
4
5
6
0 50 100 150 200 250 300 350 400 450 500 550
aP/C
P%
cumulative NGL production Gb
HL of world NGL production
aP/CP%
1998-2008
Jean Laherrere May 2019
0
1
2
3
4
5
6
7
8
9
10
1960 1970 1980 1990 2000 2010 2020 2030 2040
Mb/
d
year
OPEC NGL production from different sources
OPEC ASB-T37IEA/OMR2018OMR table 1OMR table 3WEO2018WEO2017IEA/ASS2018IEA/ASS2004IEA/ASS1993
Jean Laherrere May 2019
29
The 200 Gb ultimate fits well with the past data since 1960 and will give a peak in 2035 at less than 9 Mb/d when WEO2018 forecasts 10 Mb/d in 2040 7.2 Mb/d for EIA/IEO2014. The problem with OPEC historical production is that the number of members varies with time, reference to past data could be wrong if number varies
The evolution of IEA/WEO 2002 to 2018 for OPEC NGL production in 2030 (purple) shows a peak at 13 Mb/d with WEO2008 against WEO2018 forecast at 8 Mb/d
0
1
2
3
4
5
6
7
8
9
10
0 20 40 60 80 100 120 140 160 180 200
aP/C
P%d
cumulative production Gb
HL of OPEC NGL production
aP/CP%
Jean Laherrere May 2019
0
20
40
60
80
100
120
140
160
180
200
0
1
2
3
4
5
6
7
8
9
10
11
12
1960 1970 1980 1990 2000 2010 2020 2030 2040 2050 2060 2070 2080 2090 2100
cum
ulat
ive
prod
uctio
n G
b
annu
al p
rodu
tion
Mb/
d
year
OPEC NGL production & forecasts
IEA/WEO2010IEA/WEO2018EIA/IEO2014U = 200 GbOPEC ASB-T37U = 200 GbCP NGL Gb
Jean Laherrere May 2019

30
But WEO2002 includes in NGL the future GTL (gas to liquids) with 1.1 Mb/d in 2020 and 2.3 Mb/d in 2030. The detail of OPEC members for NGPL production from EIA (1980-2011) shows that Saudi Arabia is the largest producer, followed by UAE & Algeria
OPEC/MOMR December 2018 T 11-4 reports OPEC for 2017 at 6 Mb/d, but MOMR January 2019 in T 11-3 reports NGL for 2017 at 4.8 Mb/d a decline of 1.2 Mb/d to exclude Qatar production, as Qatar has left OPEC. OPEC reports also with OPEC NGL OPEC NCO = non-conventional oil annual productions.
5
6
7
8
9
10
11
12
13
14
2002 2004 2006 2008 2010 2012 2014 2016 2018
NG
L pr
odut
ion
Mb/
d
WEO edition year
WEO NP forecasts on OPEC NGL production
prod 2040prod 2035prod 2030prod 2025prod 2020prod 2015
Jean Laherrere May 2019
0
1
2
3
4
5
6
7
1970 1980 1990 2000 2010 2020
Mb/
d
year
OPEC NGPL from EIA & NGL production fom OPEC
OPEC NGLOPEC NGPL from EIASaudi Arabia NGPLSama.gov NGLUnited Arab Emirates NGPLAlgeria NGPLQatar NGPLVenezuelaIranKuwaitAngolaLibyaIraqEcuadorNigeria
Jean Laherrere May 2019

31
-Heat content and production in quad The NGL production data in Mb/d is added to the crude oil production but it is adding apples and oranges, because a large difference in heat content. It is better to add NGL and crude oil in weight or in energy (quad or Mtoe or PJ) Saudi Arabia is by far the OPEC largest NGL producer
The heat content of NGPL varies from Qatar 3.8 MBtu/b to Algeria 5.1 MBtu/: a large range from 1 to 1.34.
0
1
2
3
4
5
6
7
8
9
10
11
12
13
14
15
1900 1910 1920 1930 1940 1950 1960 1970 1980 1990 2000 2010 2020
annu
al p
rodu
tion
Mb/
d
year
NGL production: OPEC & NOPEC
world NGL synt Mb/d
Non-OPEC NGL
OPEC NGL ASB T3.7
OPEC NGL MOMR T11-4 May 2019 excluding Qatar
Jean Laherrere May 2019
0,0
0,2
0,4
0,6
0,8
1,0
1,2
1,4
1,6
1,8
2,0
2,2
2,4
1980 1990 2000 2010
quad
year
NGPL production in quad from EIA
Saudi ArabiaUnited Arab EmiratesAlgeriaVenezuelaLibyaKuwaitIranIraq
Jean Laherrere May 2019

32
-Algeria Algerian ministry of energy (MEM) in 2011 published this graph of oil and gas 1962-2010 production in Mtoe, showing the importance of NG.
MEM publishes annual energy report since 2002 reporting crude oil, condensate and liquefied petroleum gas production in tonne and toe and natural gas in G.m3 (km3). Crude oil production has peaked in 2007, but NG production is rising in 2017.
3500
4000
4500
5000
5500
1950 1960 1970 1980 1990 2000 2010 2020
kBtu
/b
year
NGPL heat content from EIA
AlgeriaOmanUnited Arab Emirates
LibyaIraqIran
SyriaSaudi ArabiaVenezuelaKuwait
QatarUS
Jean Laherrere May 2019

33
EIA NGPL and condensate production in quad is different from MEM data
Condensate production in quad is widely different from MEM and from EIA and I am unable to explain why and where.
0
10
20
30
40
50
60
70
80
90
100
0
10
20
30
40
50
60
70
80
90
100
1980 1985 1990 1995 2000 2005 2010 2015 2020
Mt,
G.m
3
Mto
e
year
Algeria oil & gas production from MEMNGcrude+condcrudeEIA NGPL MtoecondensateLPGNG G.m3crude Mtcond MtLPG Mt
Jean Laherrere June 2019 http://www.mem-algeria.org/fr/statistiques
MEM 1 toe =crude 1.103 tcondensate 1.132 tLPG 1.18 t
0
0,1
0,2
0,3
0,4
0,5
0,6
0,7
0,8
0,9
0,00
0,05
0,10
0,15
0,20
0,25
0,30
0,35
0,40
0,45
0,50
1980 1985 1990 1995 2000 2005 2010 2015 2020
quad
Mb/
d
year
Algeria NGPL & condensate production from EIA
NGPL Mb/d
NGPL quad
condensate quad
condensate quad MEM
Jean Laherrere June 2019 http://www.mem-algeria.org/fr/statistiques

34
-Norway NPD publishes the graph in volume oil equivalent of oil, condensate, NGL and gas production.
NPD gives definitions in glossary https://www.npd.no/en/about-us/information-services/abc-of-oil/ Condensate: A mixture of the heaviest components of natural gas. Condensate is fluid at normal pressure and temperature. Crude oil: Liquid petroleum from the reservoir. Most of the water and dissolved natural gas have been removed. NGL (Natural Gas Liquids): A collective term for the petroleum qualities, ethane, propane, isobutane, normal butane and naphtha. NGL are partially liquid at normal pressure. In the past NPD defined condensate either as crude either as NGL following the way it was sold, leading to confusion. Kristin production at the beginning reports condensate only and no oil, and when oil was reported, condensate disappeared.
0
0,1
0,2
0,3
0,4
0,5
0,6
0,7
0,8
0,9
0,00
0,50
1,00
1,50
2,00
1970 1975 1980 1985 1990 1995 2000 2005 2010 2015 2020
quadMt
year
Algeria condensate production from EIA & MEM
cond Mt graph MEM 2011
condensate quad MEM
condensate quad EIA
Jean Laherrere June 2019 http://www.mem-algeria.org/fr/statistiques

35
Norway oil production from different sources shows that condensate from NPD in Mboe/d (yellow) coincidences with NGPL from EIA in Mb/d, but NGPL is assumed to exclude condensate.
The comparison of NGPL production in Mb/d and in quad from EIA shows that since 1980 NGPL is getting more energetic!

36
Norway NGPL heat content is much higher than US NGPL and staying high
-UK Dukes reports since 1998 OK oil production in kt & kb with the breakdown of oil products
0
0,1
0,2
0,3
0,4
0,5
0,6
0,00
0,05
0,10
0,15
0,20
0,25
0,30
0,35
0,40
1980 1985 1990 1995 2000 2005 2010 2015 2020
quad
Mb/
d
year
Norway NGPL production from EIA
NGPL Mb/d EIA
NGPL quad
Jean Laherrere June 2019
3,6
3,7
3,8
3,9
4,0
4,1
4,2
4,3
4,4
1980 1985 1990 1995 2000 2005 2010 2015 2020
MBt
u/b
year
Norway NGPL production heat content compared with US
NW NGPL MBtu/b
US NGPL Mbtu/b
Jean Laherrere June 2019

37
But the density looks queer being the same at 11.5 b/t for ethane, propane, butane and condensate! The graph page 7 reports b/t: ethane 17, propane 12, butane 11, pentane 10. It means that UK data in Mt is wrong, using wrong densities. It is the same with the b/t from BP statistical data being about 8.7 in the 1970s
0
20
40
60
80
100
120
140
160
1990 2000 2010 2020
oil p
rodu
ctio
n M
t
year
UK oil production in Mt from Dukes
Total primary oilCrude oilTotal NGLPropaneButaneCondensateEthaneFeedstock
Jean Laherrere June 2019
density b/tcrude 7.55ethane 11.50propane 11.50butane 11.50condensate 11.50
0
200
400
600
800
1000
1200
1990 2000 2010 2020
oil p
rodu
ctio
n M
b
year
UK oil production in Mb from Dukes
Total primary oil
Crude oilTotal NGL
PropaneButane
Condensate
EthaneFeedstock
Jean Laherrere June 2019
density b/tcrude 7.55ethane 11.50propane 11.50butane 11.50condensate 11.50

38
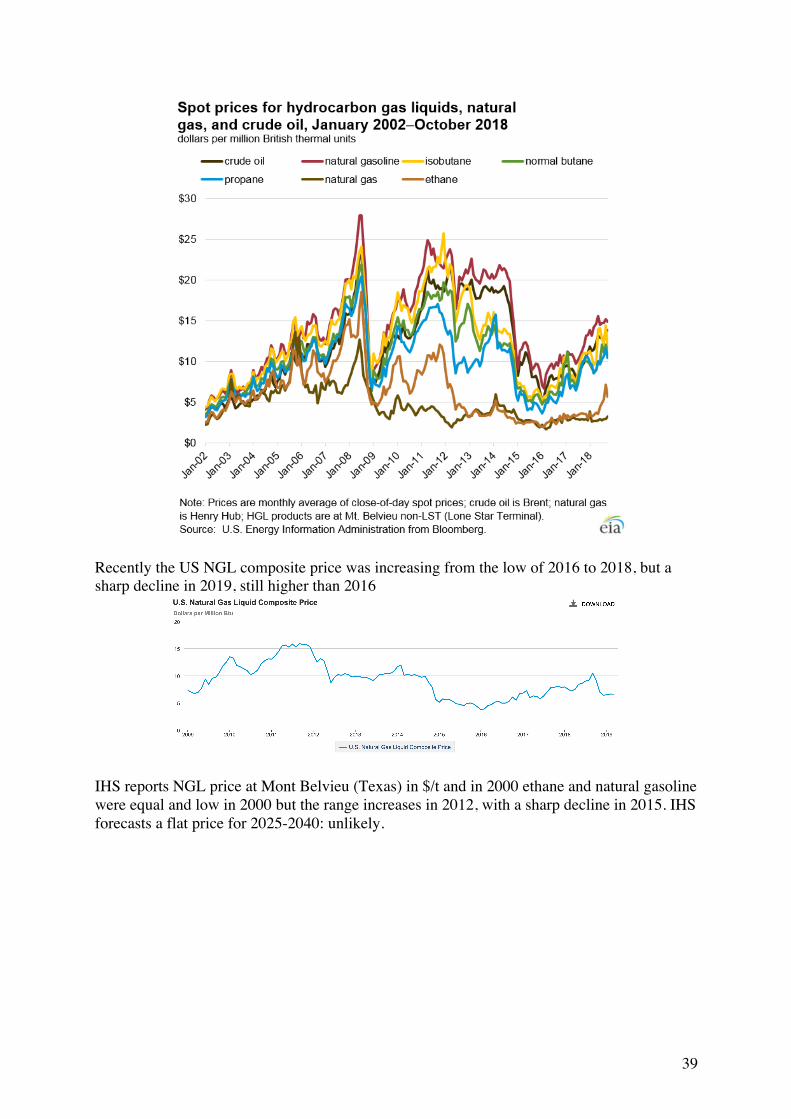
It appears that UK oil production data in weight is unreliable -NGL price US NGL prices ($/MBtu) (as crude oil and NG) for the period 2002-2018 from EIA displays a large variation in price and in range. In 2002 the range was between 2 to 4, in 2008 13 to 28 and in 2008 3 to 15
7,4
7,6
7,8
8
8,2
8,4
8,6
8,8
0
0,5
1
1,5
2
2,5
3
1960 1970 1980 1990 2000 2010 2020
b/t
oil p
rodu
ctio
n M
b/d
year
UK oil production from BP, OPEC & Dukes
oil Mb/d BPoil Mb/d Dukescrude Mb/d OPECcrudeMb/d Dukesoil BP b/t
Jean Laherrere June 2019
39
Recently the US NGL composite price was increasing from the low of 2016 to 2018, but a sharp decline in 2019, still higher than 2016
IHS reports NGL price at Mont Belvieu (Texas) in $/t and in 2000 ethane and natural gasoline were equal and low in 2000 but the range increases in 2012, with a sharp decline in 2015. IHS forecasts a flat price for 2025-2040: unlikely.

40
-Conclusion It is obvious that world NGL production in volume should be reported separately from crude oil because their heat content is much less; adding ethane (260 °API) production in Mb/d with bitumen production (10°API) is wrong. Aggregation of oil production should be only when converted in energy (quad or PJ) In Canada NGL density is about 140°API! The first problem is there is no world consensus on the definition of oil products. The second problem is the definition of condensate and its reporting. Condensate in the past was measured together with crude in the US. Condensate for OPEC members is not included in the OPEC quota and it is reported separately. The third problem is the definition of NGL. EIA reports NGPL because condensate is reported with crude oil. IEA reports NGLs for OPEC but not for non-OPEC. IEA in reporting oil production in weight confuses LPG from fields and LPG from refineries. Even IEA manual is not clear on ethane, being part of NGL! IEA reports NGL production for OPEC, but not for Non-OPEC. The problem with historical series on OPEC is that the number of members varies with time. As it is not possible to prevent country to joint or leave OPEC, historical OPEC data needs to be dated of the year of edition: OPEC2019 is not the same as OPEC2018. World NGL production was 15 Mb/d in 2017 and is forecasted by IEA/WEO2018 NP to be 21 Mb/d in 2040; when my forecast is less than 18 Mb/d, peaking (as NG production). To conclude NGL reporting is a mess, because there is no consensus on NGL definition. IEA and OPEC should jointly agree on a definition of NGL and then should provide right historical series, covering OPEC and Non-OPEC production Presently OPEC ABS is the best historical complete database for 1960-2017 production by country, but it provides NGL production only for OPEC members: it is incomplete! ABS is obsolete and needs to be improved. NB sorry for my broken English, but the most important is the graphs, not the text!