world office yield spectrum report - · pdf fileworld office yield spectrum 1h/2016 3 |...
TRANSCRIPT

savills.com Savills World Research
World Office Yield Spectrum1H/2016

AsiaPacific
Americas
Europe
Africa
62Offices
US,
M
exico & Caribbean
102Offices
Europe
133Offices
Asia Pacific
271Offices
Midd
le East & Africa
137Offices
Uni
ted
Kingdom & Ireland
UK, Ireland & Channel Islands EnglandGuernseyIrelandJerseyNorthern IrelandScotlandWales
Asia Pacific AustraliaCambodiaChinaHong KongIndiaIndonesiaJapanMacauMalaysiaMyanmarNew ZealandPhilippinesSingaporeSouth KoreaTaiwanThailandVietnam
Continental Europe AustriaBelgiumCroatiaDenmarkFinlandFranceGermanyGibraltarGreeceItalyLuxembourgMonacoMontenegroNetherlandsNorway Poland
PortugalRussiaSerbiaSpainSwedenSwitzerland
Middle East & Africa BahrainBotswanaKenyaMauritiusMozambiqueNamibiaOmanQatarSeychellesSouth AfricaUnited Arab EmiratesZambiaZimbabwe
Americas, Canada & CaribbeanBahamasBarbadosCanadaCayman IslandsColombiaGrenadaMexicoPanamaSt Kitts & NevisSt LuciaUS
Savills global presenceOver 700 owned and associate offices worldwide

World Office Yield Spectrum 1H/2016 | 3
Introduction
With investment capital becoming more global in its search for returns and diversification, the need for a standardised set of indicators to make sense of opportunities, risk and return expectations has become critical.
The Savills/Deakin University World Office Yield Spectrum is designed to fill a void in market knowledge.
For too long the global property investment community has been denied a credible, factual yields series which can be reliably used to compare ‘apples with apples.’ This unique global publication is the culmination of substantial work by dozens of researchers in the international Savills team.
Savills Research trusts you find this body of work useful, illuminating and of value to you in your endeavours. As always your thoughts, feedback and ideas are most welcome. Please feel free to contact your Savills representative with regard to this publication.
Methodology
Market YieldsThis yield is derived by capitalising current market rents (Net Face) against current capital values for office buildings. The Net Face rent is the rent payable by the tenant excluding both statutory and operating outgoings (recoverables) and includes the value of any incentive paid to the tenant by way of fitout, cash, rental rebate or rent free. The capital value is calculated to be for the office component only and excludes retail, excess car parking, signage, storage and other “non-office” sources of income.
Effective YieldsThis yield is derived by capitalising current market rents (Net Effective) against current capital values for office buildings. The Net Effective rent is the rent payable by the tenant excluding both statutory and operating outgoings (recoverables) and excludes the value of any incentive paid to the tenant by way of fitout, cash, rental rebate or rent free. The capital value is calculated to be for the office component only and excludes retail, excess car parking, signage, storage and other ‘non-office’ sources of income.
Weighted Average Cost of Capital (WACC)The WACC is derived by having reference to the rents described above, the rental growth outlook and the management fee recoverable from owning the building (in sum a proxy for equity) and the current cost of debt. Using a 30 percent/70 percent equity/debt split, a WACC is calculated.
Accretive PremiumsBy subtracting the effective and market yields derived above from the WACC we can calculate the ‘accretion’ inherent in each market using the metrics as described.
Market Risk PremiumsHaving reference to the market yield calculated above we subtract the risk free rate (10 year bond) then add the expected annual income growth rate to establish the ‘expected return for risk.’
Effective Risk PremiumsHaving reference to the effective yield calculated above we take that yield, subtract the risk free rate (10 year bond) then add the expected annual income growth rate to establish the ‘expected return for risk.’
4 | World Office Yield Spectrum 1H/2016
World Cities
The calendar year 2015
marks the official end of
the GFC as the US Federal
Reserve increases rates by
25 basis points to begin
the slow haul towards
‘normalisation’. The first time interest rates have risen in the United States in almost a decade. Over the past six months, 10 year bond yields have firmed by an average 20 basis points around the world. Over the past 12 months, 10 year bond yields have firmed an average 44 basis points.
Economic indicators in the United States point to the beginning of economic recovery however the quality of the recovery is not as strong as may be desired. Europe is also showing signs of recovery but it is not as widespread as may be desired – stimulatory policies remain in place. Asia remains tied to the fortunes of China and a great deal of volatility in the region is symptomatic of current affairs in China.
The capital markets had a volatile year in 2015 with the S&P500 finishing the year almost unchanged but down 7.7 percent for the final six months of 2015. European bourses fared little better with most indices down between 15 percent and 20 percent over the last six months of 2015. Leveraged sharemarket investments in China wreaked havoc with their bourse and sent shock waves around the world in late 2015. Indices in the region were down between 7 percent and 20 percent in the last six months of 2015.
World Office Yield Spectrum 1H/2016 | 5
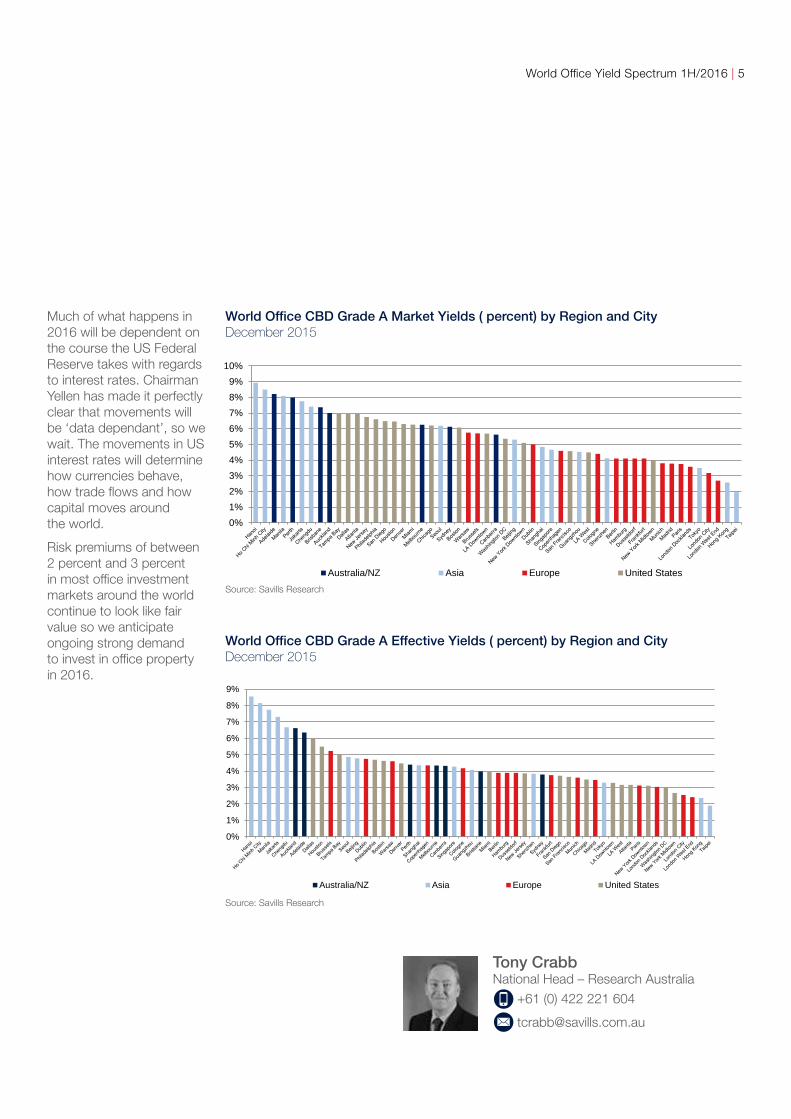
Much of what happens in 2016 will be dependent on the course the US Federal Reserve takes with regards to interest rates. Chairman Yellen has made it perfectly clear that movements will be ‘data dependant’, so we wait. The movements in US interest rates will determine how currencies behave, how trade flows and how capital moves around the world.
Risk premiums of between 2 percent and 3 percent in most office investment markets around the world continue to look like fair value so we anticipate ongoing strong demand to invest in office property in 2016.
0%
1%
2%
3%
4%
5%
6%
7%
8%
9%
World OfficeCBD Grade A Effective Yields (%) by Region and City
Dec-15
Australia/NZ Asia Europe United StatesSource: Savills Research
World Office CBD Grade A Effective Yields ( percent) by Region and City December 2015
Source: Savills Research
Tony Crabb National Head – Research Australia
+61 (0) 422 221 604
0%1%2%3%4%5%6%7%8%9%
10%
World OfficeCBD Grade A Market Yields (%) by Region and City
Dec-15
Australia/NZ Asia Europe United StatesSource: Savills Research
World Office CBD Grade A Market Yields ( percent) by Region and City December 2015
Source: Savills Research

6 | World Office Yield Spectrum 1H/2016

World Office Yield Spectrum 1H/2016 | 7
World Cities/CBD/Grade A Office
Market Yields December 2015 Effective Yields December 2015
Source: Savills Research
Source: Savills Research
Source: Savills Research Source: Savills Research
Source: Savills Research
Source: Savills Research
Market Yield Change June 2015–December 2015 Effective Yield Change June 2015–December 2015
Market Risk Premium December 2015 Effective Risk Premium December 2015
World OfficeTop Cities CBD Grade A Market Yields (%)Dec-15
0%
2%
4%
6%
8%
10%
World OfficeTop Cities CBD Grade A Market Yields (%)
Dec-15
Source: Savills Research
0%
2%
4%
6%
8%
10%
World OfficeTop Cities CBD Grade A Effective Yields (%)
Dec-15
Source: Savills Research
World OfficeTop Cities CBD Grade A Market Risk Premium (%)Dec-15
0%
1%
2%
3%
4%
5%
6%
7%
8%
World OfficeTop Cities CBD Grade A Market Risk Premium (%)
Dec-15
Source: Savills Research
0%
1%
2%
3%
4%
5%
6%
World OfficeTop Cities CBD Grade A Effective Risk Premium (%)
Dec-15
Source: Savills Research
World OfficeTop Cities CBD Grade A Market Yield Change (%)Jun-15 to Dec-15
-1.0%
-0.5%
0.0%
0.5%
1.0%
World OfficeTop Cities CBD Grade A Market Yield Change (%)
Jun-15 to Dec-15
Source: Savills Research
-1.0%
-0.5%
0.0%
0.5%
1.0%
World OfficeTop Cities CBD Grade A Effective Yield Change (%)
Jun-15 to Dec-15
Source: Savills Research
World OfficeTop Cities CBD Grade A Market Risk Premium (%)Dec-15
0%
1%
2%
3%
4%
5%
6%
7%
8%
World OfficeTop Cities CBD Grade A Market Risk Premium (%)
Dec-15
Source: Savills Research
0%
1%
2%
3%
4%
5%
6%
World OfficeTop Cities CBD Grade A Effective Risk Premium (%)
Dec-15
Source: Savills Research
World OfficeTop Cities CBD Grade A Market Yields (%)Dec-15
0%
2%
4%
6%
8%
10%
World OfficeTop Cities CBD Grade A Market Yields (%)
Dec-15
Source: Savills Research
0%
2%
4%
6%
8%
10%
World OfficeTop Cities CBD Grade A Effective Yields (%)
Dec-15
Source: Savills Research

8 | World Office Yield Spectrum 1H/2016
Asia
Asian real estate has
enjoyed a strong run over
recent years, fuelled by
cheap debt and ample
liquidity flooding out
of local markets, including
China in particular. While value from core assets in first tier cities appears to have been mined as cap rates have ground lower, opportunistic plays remain in some sectors and geographies for investors prepared to push further up the risk curve. In the last quarter of 2015, Asian markets were finally able to put US interest rate worries behind them as the US Federal Reserve increased the base rate by 25 basis points, with little immediate fall out.
Uncertainties surrounding China’s economy have come to dominate concerns, however, not just for the impact they may have on the domestic economy, but also on trading partners. The dangers of rising rates have not disappeared, and we expect to see further (though modest) rises later in 2016 with implications for debt of all kinds.
For now, with the exception of Japan and Australia where volumes remain robust, capital outflows from Asia are the new norm and China’s outbound real estate capital (both to Asia and the West) hit new highs in 2015. In an uncertain world, the US has assumed a primacy in terms of global destination of choice for Asian investors, especially safe haven gateway cities such as New York, Los Angeles, San Francisco and Chicago.
$0
$5,000
$10,000
$15,000
$20,000
$25,000
$30,000
Asian OfficeOffice Property Sales (US$m)
Mar-07 to Dec-15
Source: RCA/Savills Research
Asian Office Property Sales (US$ million) March 2007 – December 2015
Source: Savills Research
Asian OfficeOffice Property Buyer Profile (%) 12 months to Dec-15Trust15%
Fund35%
Private Investor29%
Foreign Investor15%
Owner Occupier6%
Asian OfficeOffice Property Buyer Profile (%)
12 months to Dec-15
Source: RCA/Savills Research
Asian Office Property Buyer Profile 12 months to December 2015
Source: RCA/Savills Research
Source: RCA/Savills Research
Simon Smith Senior Director – Research Asia Pacific
+852 2842 4573

World Office Yield Spectrum 1H/2016 | 9
Asia/CBD/Grade A Office
Market Yields December 2015 Effective Yields December 2015
Market Yield Change June 2015–December 2015 Effective Yield Change June 2015–December 2015
Market Risk Premium December 2015 Effective Risk Premium December 2015
World OfficeAsian CBD Grade A Market Yields (%)Dec-15
0%
2%
4%
6%
8%
10%
12%
World OfficeAsian CBD Grade A Market Yields (%)
Dec-15
Source: Savills Research
0%
2%
4%
6%
8%
10%
12%
World OfficeAsian CBD Grade A Effective Yields (%)
Dec-15
Source: Savills ResearchWorld OfficeAsian CBD Grade A Market Risk Premium (%)Dec-15
0%
1%
2%
3%
4%
5%
6%
7%
8%
World OfficeAsian CBD Grade A Market Risk Premium (%)
Dec-15
Source: Savills Research
-1%
0%
1%
2%
3%
4%
5%
6%
World OfficeAsian CBD Grade A Effective Risk Premium (%)
Dec-15
Source: Savills Research
World OfficeAsian CBD Grade A Market Yield Change (%)Jun-15 to Dec-15
-1.0%
-0.5%
0.0%
0.5%
1.0%
1.5%
World OfficeAsian CBD Grade A Market Yield Change (%)
Jun-15 to Dec-15
Source: Savills Research
-1.0%
-0.5%
0.0%
0.5%
1.0%
1.5%
World OfficeAsian CBD Grade A Effective Yield Change (%)
Jun-15 to Dec-15
Source: Savills Research
World OfficeAsian CBD Grade A Market Risk Premium (%)Dec-15
0%
1%
2%
3%
4%
5%
6%
7%
8%
World OfficeAsian CBD Grade A Market Risk Premium (%)
Dec-15
Source: Savills Research
-1%
0%
1%
2%
3%
4%
5%
6%
World OfficeAsian CBD Grade A Effective Risk Premium (%)
Dec-15
Source: Savills Research
World OfficeAsian CBD Grade A Market Yields (%)Dec-15
0%
2%
4%
6%
8%
10%
12%
World OfficeAsian CBD Grade A Market Yields (%)
Dec-15
Source: Savills Research
0%
2%
4%
6%
8%
10%
12%
World OfficeAsian CBD Grade A Effective Yields (%)
Dec-15
Source: Savills Research
Source: Savills Research
Source: Savills Research
Source: Savills Research Source: Savills Research
Source: Savills Research
Source: Savills Research

10 | World Office Yield Spectrum 1H/2016
Europe
2016 should see a closing of the differential between the performance of the UK and the rest of the European markets, as the recent strong run of capital value growth in the UK starts to slow.
The mainland European markets, most of which are a year or so behind the UK on the recovery curve are forecast to have another year of good capital and rental value growth, and this is expected to lead to a rise in investor interest in mainland Europe over the UK.
We believe opportunistic investors will remain active in Europe’s peripheral markets, targeting either GDP growth stories or late cycle recovery plays. Also, risk-averse investors will continue to focus on the Tier 1 office markets, and the larger experience-led malls.
Generally we expect the gap between core and periphery yields to continue to close in 2016, with a similar story around the gap between prime and secondary. However, as the bounce in capital values begins to tail off, investors will be asking more searching questions about the rental growth prospects of individual assets and markets. We forecast this rental growth will come from a variety of sources including asset management, local supply/demand imbalances, and a rising interest in development and refurbishment opportunities outside the core locations.
Fund13%
Institution45%
Private16%
Public18%
Owner Occupier5%
Undisclosed3%
Europe and UK OfficeOffice Property Buyer Profile (%)
9 months to Sep-15
Source: Savills Research
Europe and UK Office Property Buyer Profile 9 months to September 2014
Source: Savills Research
Looking to the medium term we do see some risks to European property as an asset class if interest rates begin to rise. However, so long as rents are flat or rising there is relatively little linkage between the base rate and the property yield. This means that rental growth and income returns should be of steadily rising importance to investors in years to come.
Lydia BrissyDirector – Research Europe
+33 1 44 51 73 88
0
50,000
100,000
150,000
200,000
250,000
Europe and UK OfficeOffice Property Sales (€m)
Dec-05 to Dec-15
Source: Savills Research
Europe and UK Office Property Sales (£ million) December 2005 – December 2015
Source: Savills Research

World Office Yield Spectrum 1H/2016 | 11
Europe/CBD/Grade A Office
Market Yields December 2015 Effective Yields December 2015
Market Yield Change June 2015-December 2015 Effective Yield Change June 2015-December 2015
Market Risk Premium December 2015 Effective Risk Premium December 2015
World OfficeEuropean CBD Grade A Market Yields (%)Dec-15
0%
2%
4%
6%
8%
10%
World OfficeEuropean CBD Grade A Market Yields (%)
Dec-15
Source: Savills Research
0%
2%
4%
6%
8%
10%
World OfficeEuropean CBD Grade A Effective Yields (%)
Dec-15
Source: Savills Research
World OfficeEuropean CBD Grade A Market Yields (%)Dec-15
0%
2%
4%
6%
8%
10%
World OfficeEuropean CBD Grade A Market Yields (%)
Dec-15
Source: Savills Research
0%
2%
4%
6%
8%
10%
World OfficeEuropean CBD Grade A Effective Yields (%)
Dec-15
Source: Savills Research
World OfficeEuropean CBD Grade A Market Risk Premium (%)Dec-15
0%
1%
2%
3%
4%
5%
6%
7%
8%
World OfficeEuropean CBD Grade A Market Risk Premium (%)
Dec-15
Source: Savills Research
0%
1%
2%
3%
4%
5%
6%
World OfficeEuropean CBD Grade A Effective Risk Premium (%)
Dec-15
Source: Savills ResearchWorld OfficeEuropean CBD Grade A Market Yield Change (%)Jun-15 to Dec-15
-1.0%
-0.5%
0.0%
0.5%
1.0%
World OfficeEuropean CBD Grade A Market Yield Change (%)
Jun-15 to Dec-15
Source: Savills Research
-1.0%
-0.5%
0.0%
0.5%
1.0%
World OfficeEuropean CBD Grade A Effective Yield Change (%)
Jun-15 to Dec-15
Source: Savills Research
World OfficeEuropean CBD Grade A Market Yield Change (%)Jun-15 to Dec-15
-1.0%
-0.5%
0.0%
0.5%
1.0%
World OfficeEuropean CBD Grade A Market Yield Change (%)
Jun-15 to Dec-15
Source: Savills Research
-1.0%
-0.5%
0.0%
0.5%
1.0%
World OfficeEuropean CBD Grade A Effective Yield Change (%)
Jun-15 to Dec-15
Source: Savills Research
World OfficeEuropean CBD Grade A Market Risk Premium (%)Dec-15
0%
1%
2%
3%
4%
5%
6%
7%
8%
World OfficeEuropean CBD Grade A Market Risk Premium (%)
Dec-15
Source: Savills Research
0%
1%
2%
3%
4%
5%
6%
World OfficeEuropean CBD Grade A Effective Risk Premium (%)
Dec-15
Source: Savills Research
Source: Savills Research
Source: Savills Research
Source: Savills Research Source: Savills Research
Source: Savills Research
Source: Savills Research
12 | World Office Yield Spectrum 1H/2016
United States
Call it what you will – a wall
or tsunami of money, dry
powder or patient capital
– there is no shortage of
investors seeking safety
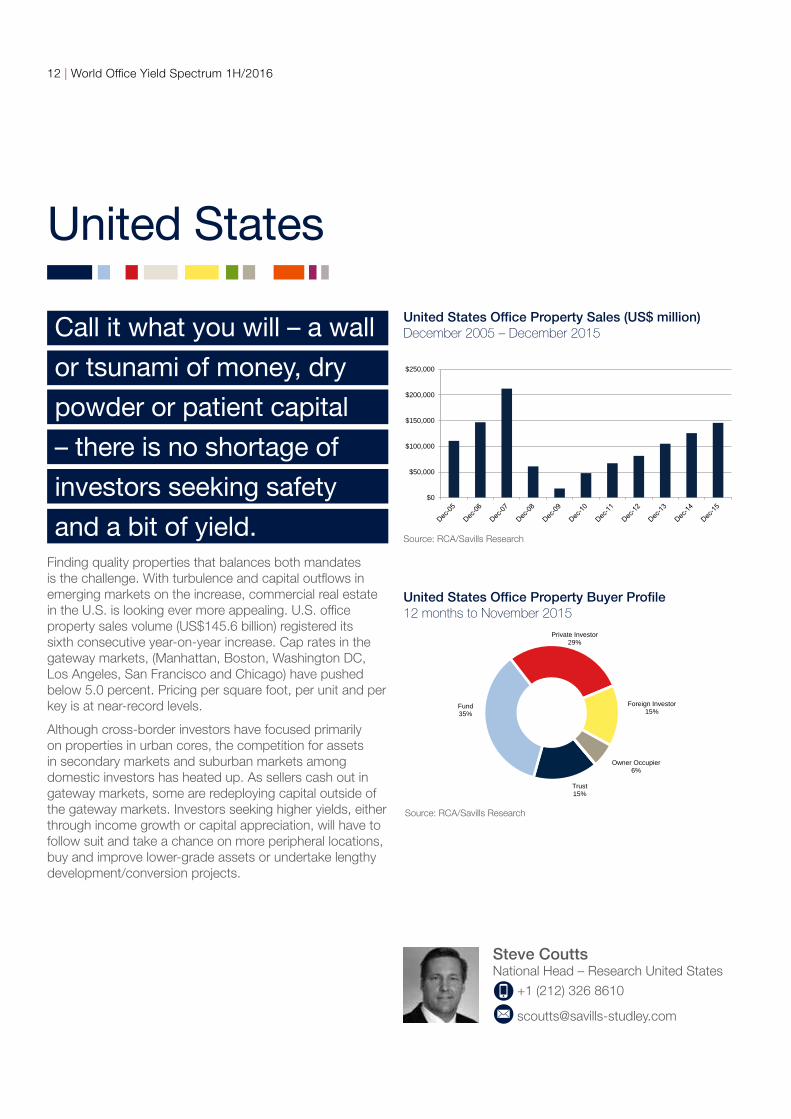
and a bit of yield. Finding quality properties that balances both mandates is the challenge. With turbulence and capital outflows in emerging markets on the increase, commercial real estate in the U.S. is looking ever more appealing. U.S. office property sales volume (US$145.6 billion) registered its sixth consecutive year-on-year increase. Cap rates in the gateway markets, (Manhattan, Boston, Washington DC, Los Angeles, San Francisco and Chicago) have pushed below 5.0 percent. Pricing per square foot, per unit and per key is at near-record levels.
Although cross-border investors have focused primarily on properties in urban cores, the competition for assets in secondary markets and suburban markets among domestic investors has heated up. As sellers cash out in gateway markets, some are redeploying capital outside of the gateway markets. Investors seeking higher yields, either through income growth or capital appreciation, will have to follow suit and take a chance on more peripheral locations, buy and improve lower-grade assets or undertake lengthy development/conversion projects.
United States Office Property Buyer Profile 12 months to November 2015
United States OfficeOffice Property Buyer Profile (%) 12 months to Nov-15Trust15%
Fund35%
Private Investor29%
Foreign Investor15%
Owner Occupier6%
United States OfficeOffice Property Buyer Profile (%)
12 months to Nov-15
Source: RCA/Savills Research
Source: RCA/Savills Research
Steve Coutts National Head – Research United States
+1 (212) 326 8610
$0
$50,000
$100,000
$150,000
$200,000
$250,000
United States OfficeOffice Property Sales (US$m)
Dec-05 to Dec-15
Source: RCA / Savills Research
United States Office Property Sales (US$ million) December 2005 – December 2015
Source: RCA/Savills Research

World Office Yield Spectrum 1H/2016 | 13
United States/CBD/Grade A Office
Market Yields December 2015 Effective Yields December 2015
Market Yield Change June 2015-December 2015 Effective Yield Change June 2015-December 2015
Market Risk Premium December 2015 Effective Risk Premium December 2015
World OfficeUnited States CBD Grade A Market Yields (%)Dec-15
0%
2%
4%
6%
8%
10%
World OfficeUnited States CBD Grade A Market Yields (%)
Dec-15
Source: Savills Research
0%
2%
4%
6%
8%
10%
World OfficeUnited States CBD Grade A Effective Yields (%)
Dec-15
Source: Savills Research
World OfficeUnited States CBD Grade A Market Risk Premium (%)Dec-15
0%
1%
2%
3%
4%
5%
6%
7%
8%
World OfficeUnited States CBD Grade A Market Risk Premium (%)
Dec-15
Source: Savills Research
0%
1%
2%
3%
4%
5%
6%
World OfficeUnited States CBD Grade A Effective Risk Premium (%)
Dec-15
Source: Savills Research
World OfficeUnited States CBD Grade A Market Yield Change (%)Jun-15 to Dec-15
-1.0%
-0.5%
0.0%
0.5%
1.0%
World OfficeUnited States CBD Grade A Market Yield Change (%)
Jun-15 to Dec-15
Source: Savills Research
-1.0%
-0.5%
0.0%
0.5%
1.0%
World OfficeUnited States CBD Grade A Effective Yield Change (%)
Jun-15 to Dec-15
Source: Savills Research
World OfficeUnited States CBD Grade A Market Yields (%)Dec-15
0%
2%
4%
6%
8%
10%
World OfficeUnited States CBD Grade A Market Yields (%)
Dec-15
Source: Savills Research
0%
2%
4%
6%
8%
10%
World OfficeUnited States CBD Grade A Effective Yields (%)
Dec-15
Source: Savills ResearchSource: Savills Research
Source: Savills Research
Source: Savills Research Source: Savills Research
Source: Savills Research
Source: Savills Research

14 | World Office Yield Spectrum 1H/2016
Australia
The calendar year 2015
marked another year
of strong performance
in property investment
markets. Weakness in the currency, high relative yields and economic growth (however below trend) attracted record amounts of foreign capital to commercial property markets. Domestic institutions, recovering from the GFC and replacing private investors as competitive buyers once again suddenly found themselves outbid. The large amount of capital from overseas has encouraged many investors to dispose of property, reweight portfolios and change exposures. This led to a record year of approximately AU$30 billion of turnover in commercial property. Conversely, many market fundamentals demonstrated the two-tone nature of the Australian economy – some indicators deteriorated in Perth and Brisbane, many showed substantial improvement in Melbourne and Sydney. Brisbane appears to have reached a base whilst Melbourne and Sydney continue to improve.
Capital markets exhibited greater degrees of volatility throughout the year and have finished the year largely unchanged with the ASX200 returning around 1 percent, the Australian dollar down over 10 percent against the US dollar and 10 year bonds yielding approximately 2.8 percent.
Investment yields firmed across the board – a theme we have been writing about for several years now. We do not believe it has fully run its course. In some markets, fundamentals are improving rapidly. We believe this will lead to further tightening in yields as investment capital starts to price in expectations of future NOI growth. This part of the yield cycle is just beginning.
$0
$2,000
$4,000
$6,000
$8,000
$10,000
$12,000
$14,000
$16,000
$18,000
$20,000
Australian OfficeOffice Property Sales (AU$m)
Dec-05 to Dec-15
Source: Savills Research
Office Property Sales (AU$ million) December 2005 – December 2015
Source: Savills Research
Office Property Buyer Profile12 months to December 2015
Trust9%
Fund26%
Private Investor7%
Developer3%
Foreign Investor44%
Syndicate4%
Owner Occupier1%
Undisclosed5%
Government1%
Australian OfficeOffice Property Buyer Profile (%)
12 months to Dec-15
Source: Savills Research
Source: Savills Research
Tony Crabb National Head – Research Australia
+61 (0) 422 221 604

World Office Yield Spectrum 1H/2016 | 15
Australia & New Zealand/CBD/Grade A Office
Market Yields December 2015 Effective Yields December 2015
Market Yield Change June 2015– December 2015 Effective Yield Change June 2015– December 2015
Market Risk Premium December 2015 Effective Risk Premium December 2015
World OfficeAustralia/New Zealand CBD Grade A Market Yields (%)Dec-15
0%
2%
4%
6%
8%
10%
World OfficeAustralia/New Zealand CBD Grade A Market Yields (%)
Dec-15
Source: Savills Research
0%
2%
4%
6%
8%
10%
World OfficeAustralia/New Zealand CBD Grade A Effective Yields (%)
Dec-15
Source: Savills Research
World OfficeAustralia/New Zealand CBD Grade A Market Risk Premium (%)Dec-15
0%
1%
2%
3%
4%
5%
6%
7%
8%
World OfficeAustralia/New Zealand CBD Grade A Market Risk Premium (%)
Dec-15
Source: Savills Research
-6%
-4%
-2%
0%
2%
4%
6%
World OfficeAustralia/New Zealand CBD Grade A Effective Risk Premium (%)
Dec-15
Source: Savills Research
World OfficeAustralia/New Zealand CBD Grade A Market Yield Change (%)Jun-15 to Dec-15
Jun-15 Dec-15
-1.0%
-0.5%
0.0%
0.5%
1.0%
World OfficeAustralia/New Zealand CBD Grade A Market Yield Change (%)
Jun-15 to Dec-15
Source: Savills Research
-1.0%
-0.5%
0.0%
0.5%
1.0%
World OfficeAustralia/New Zealand CBD Grade A Effective Yield Change (%)
Jun-15 to Dec-15
Source: Savills Research
Source: Savills Research
Source: Savills Research
Source: Savills Research
Source: Savills Research
Source: Savills Research
Source: Savills Research


World Office Yield Spectrum 1H/2016 | 17
About
Savills With a rich heritage and a reputation for excellence that dates back to 1855, Savills is a leading global real estate provider listed on the London Stock Exchange.
Savills advises corporate, institutional and private clients, seeking to acquire, lease, develop or realise the value of prime residential and commercial property across the world’s key markets.
Savills is a company that leads rather than follows with more than 700 owned and associate offices throughout the UK, Europe, Americas, Asia Pacific, Africa and the Middle East. With more than 30,000 staff, we seek out people who possess that rare mix of entrepreneurial flair and rock solid integrity, and are focused on delivering clients with advice and expertise of the highest calibre.
A powerful combination of global connections and deep local knowledge provides Savills with an almost unparalleled ability to connect people and property.
Savills extensive Asia Pacific network spans 50 offices throughout Australia, New Zealand, China, Hong Kong, India, Indonesia, Japan, Korea, Macao, Malaysia, Myanmar, Philippines, Singapore, Taiwan, Thailand and Vietnam.
Savills offers the full spectrum of services from providing strategic advice to managing assets and projects and transacting deals. With a firmly embedded corporate culture that values initiative, innovation and integrity, clients receive outstanding service and can be assured of the utmost professionalism.
For advice that gives advantage, contact Savills.
Deakin University Through its agenda LIVE the future, Deakin aims to build the jobs of the future, using the opportunities of the digital age to widen access to education and make a difference to the communities it serves.
Deakin enjoys a reputation for being accessible, helpful and friendly. It has a longstanding record for its use of cutting-edge information technology while providing highly personalised experiences, whether in the cloud on Deakin’s media-rich campuses or through a combination of cloud and campus learning. Deakin has over 50,000 students, with a third choosing to study wholly in the cloud (online).
Deakin was awarded a 5-star rating by the prestigious university ranking organisation Quacquarelli Symonds (QS); the rating indicates Deakin is world-class in a broad range of areas, has cutting-edge facilities and is internationally renowned for its research and teaching. Deakin is in the top 50 of the QS ranking of the world’s universities under 50 years.
Deakin is now in the top 3 percent of the world’s universities in each of the three major international rankings including the prestigious Shanghai Jiao Tong Academic Ranking of World Universities (ARWU), Times Higher Education and QS World University Rankings. Established in 1974, Deakin was Victoria’s fourth university and the first in regional Victoria. In 2014 Deakin celebrated its 40th anniversary.
Deakin has been strengthened by a series of successful mergers with strong partners, each of whom has contributed significantly to our character and approach. Today, Deakin operates in a global, connected world with the digital economy influencing every aspect of our activities.
Tony Crabb National Head – Research Australia
+61 (0) 422 221 604
Professor Richard ReedChair in Property & Real Estate
+61 (0) 3 9251 7605

United Kingdom Simon HopeHead of GlobalCapital Markets+44 (0) 20 7409 [email protected]
Rasheed HassanDirector, Head ofCross Border Investment+44 (0) 20 7409 [email protected]
Ned BaringDirector, ResidentialCross Border Investment+44 (0) 20 7409 [email protected]
Savills Investment Management Jon CrossfieldHead of Investment Mandates+44 (0) 207 409 [email protected]
Europe Tristam LarderDirector, European Investment+44 (0) 20 7409 [email protected]
Nick Hart Head of UK & European Shopping Centre Investment +44 (0) 207 409 [email protected]
Chris GillumDirector, Cross Border Investment+44 (0) 20 7409 [email protected]
Asia Pacific Frank MarriottRegional Head,Capital Markets+852 2842 [email protected]
Middle EastHassan FarranDirector, Cross Border Investment+44 (0) 20 7409 [email protected]
AustralasiaPaul CraigManaging Director+61 (0) 8 9488 [email protected]
North AmericaRobert StammManaging Director+1 (949) 679 [email protected]
Savills Key Contacts
Cross Border Investment
Revisions: For technical reasons revisions were undertaken to the previous edition in the following market: Vietnam.
This information is general information only and is subject to change without notice. No representations or warranties of any nature whatsoever are given, intended or implied. Savills will not be liable for any omissions or errors. Savills will not be liable, including for negligence, for any direct, indirect, special, incidental or consequential losses or damages arising out of our in any way connected with use of any of this information. This information does not form part of or constitute an offer or contract. You should rely on your own enquiries about the accuracy of any information or materials. All images are only for illustrative purposes. This information must not be copied, reproduced or distributed without the prior written consent of Savills. ©Savills 2015

Worldwide Research
Asia PacificSimon SmithSenior Director, Research +852 2842 [email protected]
AustraliaTony CrabbNational Head, Research+61 (0) 422 221 [email protected]
BelgiumHenry ColleSenor Investment Analyst+32 2 542 40 [email protected]
ChinaJames MacdonaldDirector, China+8621 6391 [email protected]
Jack XiongDirector+8610 5925 [email protected]
Dave Law Senior Associate Director +8628 8658 7120 [email protected]
Sam HeSenior Manager+8620 3892 [email protected]
DenmarkSimon Weileby LutscherAnalyst+45 33 64 65 [email protected]
EuropeMat OakleyHead of European Research+44 (0) 20 7409 [email protected]
Lydia BrissyEuropean Research Director+33 1 44 51 73 [email protected]
Eri MitsostergiouEuropean Research Director+44 20 7499 [email protected]
FranceMarie Josée LopesHead of France Research+33 1 44 51 17 [email protected]
GermanyMatthias PinkHead of Germany Research+49 30 726 165 [email protected]
Hong KongJack TongDirector, Research & Consultancy+852 2842 [email protected]
Ron MakManager, Research & Consultancy+852 2842 [email protected]
IndonesiaAnton SitorusAssociate, Research & Consultancy+62 (21) 293 293 [email protected]
IrelandJohn McCartneyDirector of Research+353 1 618 [email protected]
JapanHafiz IsmailResearch & Consultancy+81 (3) 6777 [email protected]
KoreaJoAnn Jieun Hong Director, Research & Consultancy+82 (0) 2 2124 4182 [email protected]
Jihea LeeSenior Manager, Research & Consultancy +82 (0) 2 2124 [email protected]
New ZealandSteven DunlopDirector+64 9 951 [email protected]
PhilippinesAntton NordbergHead of Research+63 (917) 599 44 [email protected]
PolandWioleta WojtczakSenior Consultant+48 22 222 [email protected]
SingaporeAlan CheongSenior Director, Research & Consultancy+65 6415 [email protected]
SpainGema de la Fuente Director, Research +34 91 310 10 16
TaiwanErin TingSenior Manager+886 (2) 8789 5828 [email protected]
VietnamTroy GriffithsDeputy Managing Director+84 (0) 933 276 [email protected]
United StatesSteve CouttsNational Head Research United States+1 (212) 326 [email protected]
Keith DeCosterSenior Manager, U.S. Real Estate Analytics+1 (212) 326 [email protected]

savills.com Savills World Research