world urbanization united nations prospects highlights department of economic and social affairs...
TRANSCRIPT
2014 REVISION
highlights[ ]
World Urbanization Prospects
United Nations
Department of Economic and Social Affairs
The Department of Economic and Social Affairs of the United Nations Secretariat is a vital interface between global policies in the economic, social and environmental spheres and national action. The Department works in three main interlinked areas: (i) it com-piles, generates and analyses a wide range of economic, social and environmental data and information on which States Members of the United Nations draw to review common problems and take stock of policy options; (ii) it facilitates the negotiations of Member States in many intergovernmental bodies on joint courses of action to address ongoing or emerging global challenges; and (iii) it advises interested Governments on the ways and means of translating policy frameworks developed in United Nations conferences and summits into programmes at the country level and, through technical assistance, helps build national capacities.
Note
The designations employed in this report and the material presented in it do not imply the expression of any opinion whatsoever on the part of the Secretariat of the United Nations concerning the legal status of any country, territory, city or area or of its authorities, or concerning the delimitation of its frontiers or boundaries.
Symbols of United Nations documents are composed of capital letters combined with fig-ures.
Suggested citation:
United Nations, Department of Economic and Social Affairs, Population Division (2014). World Urbanization Prospects: The 2014 Revision, Highlights (ST/ESA/SER.A/352).
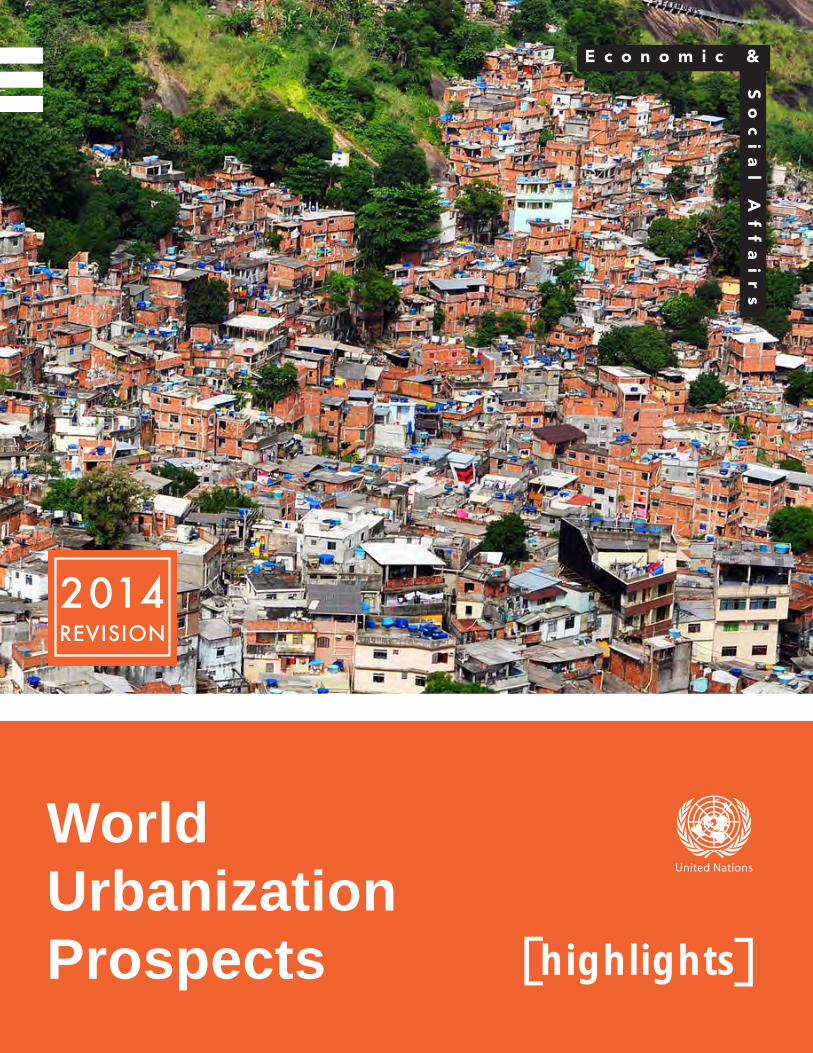
Cover photo: Asst. Prof. Chen Siyuan (2014) “Rocinha IV”
Published by the United Nations
ISBN 978-92-1-151517-6
Copyright © United Nations, 2014
All rights reserved
ST/ESA/SER.A/352
Department of Economic and Social Affairs
World Urbanization Prospects The 2014 Revision
Highlights
asdfUnited Nations New York, 2014
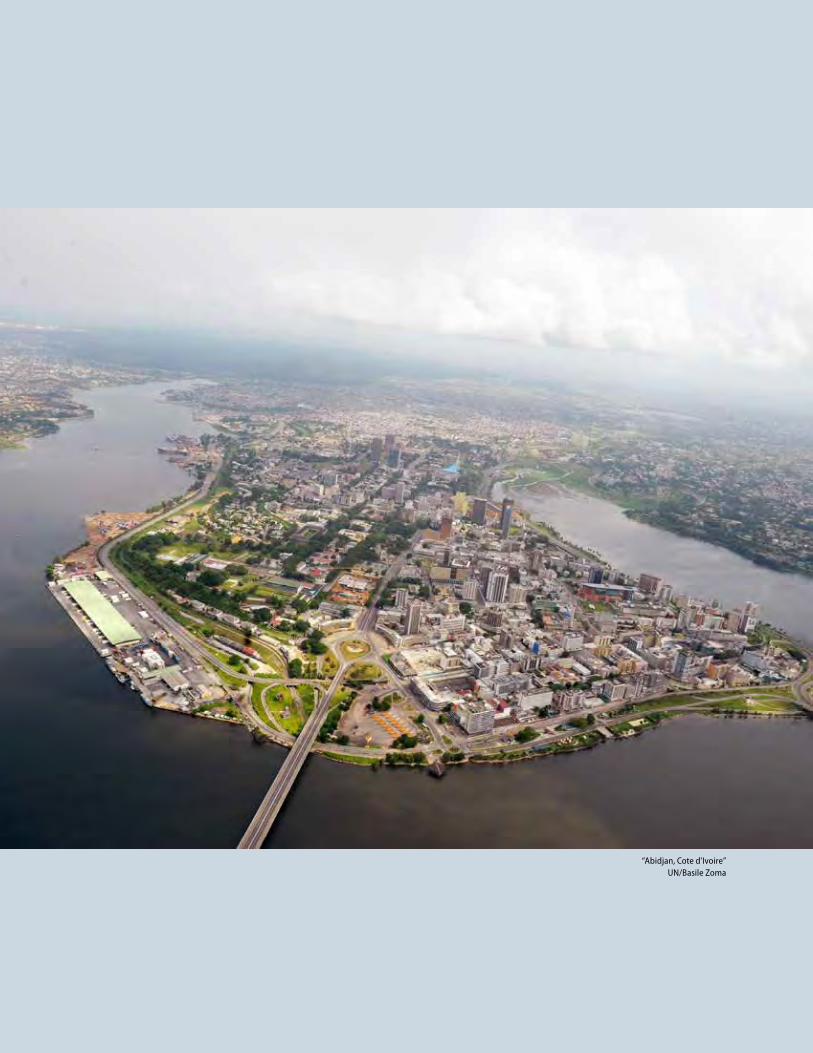
“Abidjan, Cote d'Ivoire” UN/Basile Zoma
1
World Urbanization Trends 2014: Key Facts
• Globally, more people live in urban areas than inrural areas, with 54 per cent of the world’s popu-lation residing in urban areas in 2014. In 1950, 30per cent of the world’s population was urban, andby 2050, 66 per cent of the world’s population isprojected to be urban.
• Today, the most urbanized regions include North-ern America (82 per cent living in urban areas in2014), Latin America and the Caribbean (80 percent), and Europe (73 per cent). In contrast, Africaand Asia remain mostly rural, with 40 and 48 percent of their respective populations living in ur-ban areas. All regions are expected to urbanizefurther over the coming decades. Africa and Asiaare urbanizing faster than the other regions andare projected to become 56 and 64 per cent urban, respectively, by 2050.
• The rural population of the world has grown slowly since 1950 and is expected to reach its peak in afew years. The global rural population is now close to 3.4 billion and is expected to decline to 3.2 bil-lion by 2050. Africa and Asia are home to nearly 90 per cent of the world’s rural population. India hasthe largest rural population (857 million), followed by China (635 million).
• The urban population of the world has grown rap-idly since 1950, from 746 million to 3.9 billion in2014. Asia, despite its lower level of urbanization,is home to 53 per cent of the world’s urban popu-lation, followed by Europe (14 per cent) and LatinAmerica and the Caribbean (13 per cent).
• Continuing population growth and urbaniza-tion are projected to add 2.5 billion people to theworld’s urban population by 2050, with nearly 90 per cent of the increase concentrated in Asia and Africa.
• Just three countries—India, China and Nigeria—together are expected to account for 37 per cent of
the projected growth of the world’s urban popula-tion between 2014 and 2050. India is projected to add 404 million urban dwellers, China 292 million and Nigeria 212 million.
• Close to half of the world’s urban dwellers residein relatively small settlements of less than 500,000 inhabitants, while only around one in eight livein the 28 mega-cities with more than 10 millioninhabitants.
• Tokyo is the world’s largest city with an agglom-eration of 38 million inhabitants, followed by Delhi with 25 million, Shanghai with 23 million, andMexico City, Mumbai and São Paulo, each witharound 21 million inhabitants. By 2030, the worldis projected to have 41 mega-cities with more than 10 million inhabitants. Tokyo is projected to re-main the world’s largest city in 2030 with 37 mil-lion inhabitants, followed closely by Delhi wherethe population is projected to rise swiftly to 36million. Several decades ago most of the world’slargest urban agglomerations were found in themore developed regions, but today’s large citiesare concentrated in the global South. The fastest-growing urban agglomerations are medium-sizedcities and cities with less than 1 million inhabitants located in Asia and Africa.
• Some cities have experienced population declinein recent years. Most of these are located in thelow-fertility countries of Asia and Europe wherethe overall population is stagnant or declining. Eco-nomic contraction and natural disasters have con-tributed to population losses in some cities as well.
• As the world continues to urbanize, sustainabledevelopment challenges will be increasingly con-centrated in cities, particularly in the lower-mid-dle-income countries where the pace of urbaniza-tion is fastest. Integrated policies to improve thelives of both urban and rural dwellers are needed.
World Urbanization Prospects: The 2014 Revision2
Introduction
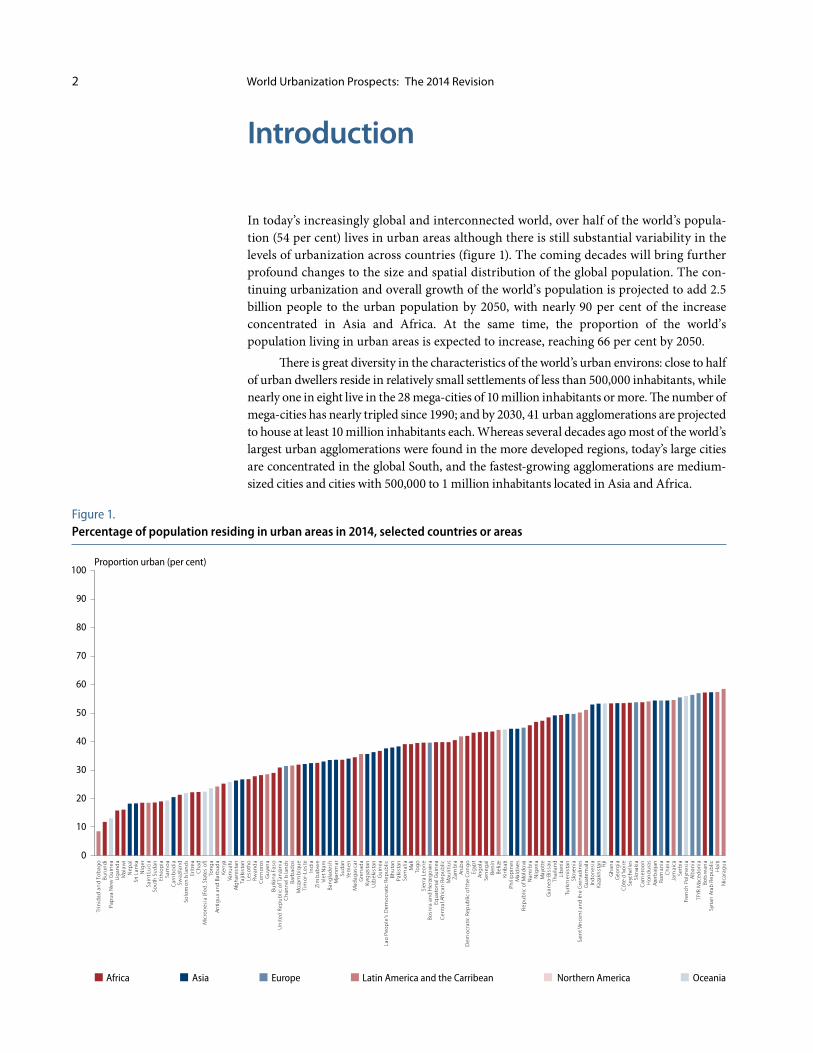
In today’s increasingly global and interconnected world, over half of the world’s popula-tion (54 per cent) lives in urban areas although there is still substantial variability in the levels of urbanization across countries (figure 1). The coming decades will bring further profound changes to the size and spatial distribution of the global population. The con-tinuing urbanization and overall growth of the world’s population is projected to add 2.5 billion people to the urban population by 2050, with nearly 90 per cent of the increase concentrated in Asia and Africa. At the same time, the proportion of the world’s population living in urban areas is expected to increase, reaching 66 per cent by 2050.
There is great diversity in the characteristics of the world’s urban environs: close to half of urban dwellers reside in relatively small settlements of less than 500,000 inhabitants, while nearly one in eight live in the 28 mega-cities of 10 million inhabitants or more. The number of mega-cities has nearly tripled since 1990; and by 2030, 41 urban agglomerations are projected to house at least 10 million inhabitants each. Whereas several decades ago most of the world’s largest urban agglomerations were found in the more developed regions, today’s large cities are concentrated in the global South, and the fastest-growing agglomerations are medium-sized cities and cities with 500,000 to 1 million inhabitants located in Asia and Africa.
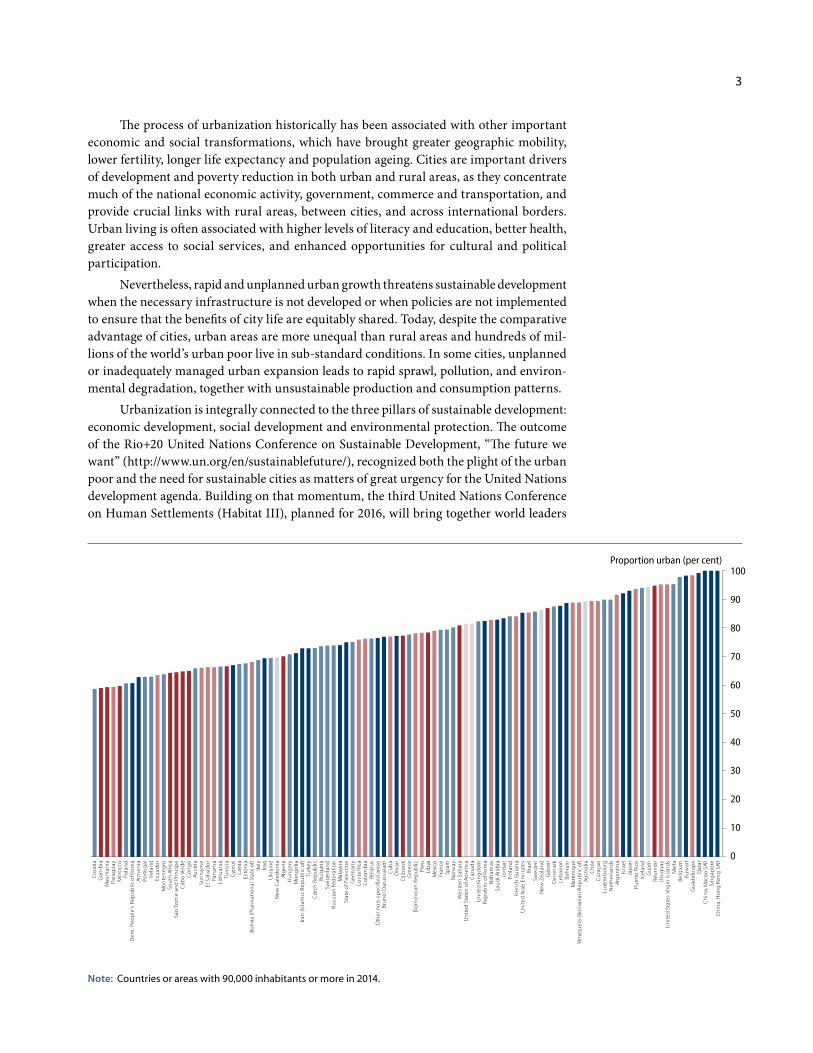
Figure 1.Percentage of population residing in urban areas in 2014, selected countries or areas
OceaniaNorthern AmericaLatin America and the CarribeanAfrica EuropeAsia
100
80
60
40
30
50
90
70
20
10
0
100
80
60
40
30
50
90
70
20
10
0
Cro
atia
Gam
bia
Mau
rita
nia
Para
gu
ayM
oro
cco
Pola
nd
Dem
.Peo
ple
'sR
epu
blic
ofK
ore
aAr
men
iaPo
rtu
gal
Irela
nd
Ecu
ado
rM
on
ten
egro
Sou
thAf
rica
Sao
Tom
ean
dPr
inci
pe
Cab
oVe
rde
Co
ng
oAu
stri
aSu
rin
ame
ElSa
lvad
or
Pan
ama
Lith
uan
iaTu
nis
iaC
ypru
sLa
tvia
Esto
nia
Boliv
ia(P
luri
nat
ion
alSt
ate
of)
Italy
Iraq
Ukr
ain
eN
ewC
aled
on
iaAl
ger
iaH
un
gar
yM
on
go
liaIra
n(Is
lam
ic R
epu
blic
of)
Turk
eyC
zech
Rep
ub
licBu
lgar
iaSw
itzer
lan
dR
uss
ian
Fed
erat
ion
Mal
aysi
aSt
ate
ofP
ales
tine
Ger
man
yC
ost
aR
ica
Co
lom
bia
Bela
rus
Oth
er n
on
-sp
ecifi
edar
eas
Bru
nei
Dar
uss
alam
Cu
ba
Om
anD
jibo
uti
Gre
ece
Do
min
ican
Rep
ub
licPe
ruLi
bya
Mex
ico
Fran
ceSp
ain
No
rway
Wes
tern
Sah
ara
Un
ited
Stat
eso
fAm
eric
aC
anad
aU
nite
dKi
ng
do
mR
epu
blic
ofK
ore
aBa
ham
asSa
ud
iAra
bia
Jord
anFi
nla
nd
Fren
chG
uia
na
Un
ited
Arab
Emir
ates
Braz
ilSw
eden
New
Zeal
and
Gab
on
Den
mar
kLe
ban
on
Bah
rain
Mar
tiniq
ue
Ven
ezu
ela
(Bo
livar
ian
Rep
ub
lic o
f)Au
stra
liaC
hile
Cu
raça
oLu
xem
bo
urg
Net
her
lan
ds
Arg
entin
aIs
rael
Jap
anPu
erto
Ric
oIc
elan
dG
uam
Réu
nio
nU
rug
uay
Un
ited
Stat
esVi
rgin
Isla
nd
sM
alta
Belg
ium
Kuw
ait
Gu
adel
ou
pe
Qat
arC
hin
a,M
acao
SAR
Sin
gap
ore
Ch
ina,
Ho
ng
Kon
gSA
R
Trin
idad
an
d T
ob
ago
Buru
nd
iPa
pu
a N
ew G
uin
eaU
gan
da
Mal
awi
Nep
alSr
i Lan
kaN
iger
Sain
t Lu
cia
Sou
th S
ud
anEt
hio
pia
Sam
oa
Cam
bo
dia
Swaz
ilan
dSo
lom
on
Isla
nd
sEr
itrea
Ch
adM
icro
nes
ia (F
ed. S
tate
s o
f)To
ng
aAn
tigu
a an
d B
arb
ud
aKe
nya
Van
uat
uAf
gh
anis
tan
Tajik
ista
nLe
soth
oR
wan
da
Co
mo
ros
Gu
yan
aBu
rkin
a Fa
soU
nite
d R
epu
blic
of T
anza
nia
Ch
ann
el Is
lan
ds
Barb
ado
sM
oza
mb
iqu
eTi
mo
r-Le
ste
Ind
iaZi
mb
abw
eVi
et N
amBa
ng
lad
esh
Mya
nm
arSu
dan
Yem
enM
adag
asca
rG
ren
ada
Kyrg
yzst
anU
zbek
ista
nG
uin
eaLa
o P
eop
le's
Dem
ocr
atic
Rep
ub
licBh
uta
nPa
kist
anSo
mal
iaM
ali
Tog
oSi
erra
Leo
ne
Bosn
ia a
nd
Her
zeg
ovi
na
Equ
ato
rial
Gu
inea
Cen
tral
Afr
ican
Rep
ub
licM
auri
tius
Zam
bia
Aru
ba
Dem
ocr
atic
Rep
ub
lic o
f th
e C
on
go
Egyp
tAn
go
laSe
neg
alBe
nin
Beliz
eKi
rib
ati
Phili
pp
ines
Mal
div
esR
epu
blic
of M
old
ova
Nam
ibia
Nig
eria
May
ott
eG
uin
ea-B
issa
uTh
aila
nd
Lib
eria
Turk
men
ista
nSl
ove
nia
Sain
t Vin
cen
t an
d th
e G
ren
adin
esG
uat
emal
aIn
do
nes
iaKa
zakh
stan Fi
jiG
han
aG
eorg
iaC
ôte
d'Iv
oir
eSe
ych
elle
sSl
ova
kia
Cam
ero
on
Ho
nd
ura
sAz
erb
aija
nR
om
ania
Ch
ina
Jam
aica
Serb
iaFr
ench
Po
lyn
esia
Alb
ania
TFYR
Mac
edo
nia
Bots
wan
aSy
rian
Ara
b R
epu
blic
Hai
tiN
icar
agu
a
Proportion urban (per cent)
Proportion urban (per cent)
3
The process of urbanization historically has been associated with other important economic and social transformations, which have brought greater geographic mobility, lower fertility, longer life expectancy and population ageing. Cities are important drivers of development and poverty reduction in both urban and rural areas, as they concentrate much of the national economic activity, government, commerce and transportation, and provide crucial links with rural areas, between cities, and across international borders. Urban living is often associated with higher levels of literacy and education, better health, greater access to social services, and enhanced opportunities for cultural and political participation.
Nevertheless, rapid and unplanned urban growth threatens sustainable development when the necessary infrastructure is not developed or when policies are not implemented to ensure that the benefits of city life are equitably shared. Today, despite the comparative advantage of cities, urban areas are more unequal than rural areas and hundreds of mil-lions of the world’s urban poor live in sub-standard conditions. In some cities, unplanned or inadequately managed urban expansion leads to rapid sprawl, pollution, and environ-mental degradation, together with unsustainable production and consumption patterns.
Urbanization is integrally connected to the three pillars of sustainable development: economic development, social development and environmental protection. The outcome of the Rio+20 United Nations Conference on Sustainable Development, “The future we want” (http://www.un.org/en/sustainablefuture/), recognized both the plight of the urban poor and the need for sustainable cities as matters of great urgency for the United Nations development agenda. Building on that momentum, the third United Nations Conference on Human Settlements (Habitat III), planned for 2016, will bring together world leaders
OceaniaNorthern AmericaLatin America and the CarribeanAfrica EuropeAsia
100
80
60
40
30
50
90
70
20
10
0
100
80
60
40
30
50
90
70
20
10
0
Cro
atia
Gam
bia
Mau
rita
nia
Para
gu
ayM
oro
cco
Pola
nd
Dem
. Peo
ple
's R
epu
blic
of K
ore
aAr
men
iaPo
rtu
gal
Irela
nd
Ecu
ado
rM
on
ten
egro
Sou
th A
frica
Sao
To
me
and
Pri
nci
pe
Cab
o V
erd
eC
on
go
Aust
ria
Suri
nam
eEl
Sal
vad
or
Pan
ama
Lith
uan
iaTu
nis
iaC
ypru
sLa
tvia
Esto
nia
Boliv
ia (P
luri
nat
ion
al S
tate
of)
Italy
Iraq
Ukr
ain
eN
ew C
aled
on
iaAl
ger
iaH
un
gar
yM
on
go
liaIra
n (I
slam
ic R
epu
blic
of)
Turk
eyC
zech
Rep
ub
licBu
lgar
iaSw
itzer
lan
dR
uss
ian
Fed
erat
ion
Mal
aysi
aSt
a te
of P
ales
tine
Ger
man
yC
ost
a R
ica
Co
lom
bia
Bela
rus
Oth
er n
on
-sp
ecifi
ed a
reas
Bru
nei
Dar
uss
alam
Cu
ba
Om
anD
jibo
uti
Gre
ece
Do
min
ican
Rep
ub
licPe
ruLi
bya
Mex
ico
Fran
ceSp
ain
No
rway
Wes
tern
Sah
ara
Un
ited
Sta
tes
of A
mer
ica
Can
ada
Un
ited
Kin
gd
om
Rep
ub
lic o
f Ko
rea
Bah
amas
Sau
di A
rab
iaJo
rdan
Fin
lan
dFr
ench
Gu
ian
aU
nite
d A
rab
Em
irat
esBr
azil
Swed
enN
ew Z
eala
nd
Gab
on
Den
mar
kLe
ban
on
Bah
rain
Mar
tiniq
ue
Ven
ezu
ela
(Bo
livar
ian
Rep
ub
lic o
f)Au
stra
liaC
hile
Cu
raça
oLu
xem
bo
urg
Net
her
lan
ds
Arg
entin
aIs
rael
Jap
anPu
erto
Ric
oIc
elan
dG
uam
Réu
nio
nU
rug
uay
Un
ited
Sta
tes
Virg
in Is
lan
ds
Mal
taBe
lgiu
mKu
wai
tG
uad
elo
up
eQ
atar
Ch
ina,
Mac
ao S
ARSi
ng
apo
reC
hin
a, H
on
g K
on
g S
AR
Trin
idad
and
Tob
ago
Buru
nd
iPa
pu
aN
ewG
uin
eaU
gan
da
Mal
awi
Nep
alSr
iLan
kaN
iger
Sain
tLu
cia
Sou
thSu
dan
Eth
iop
iaSa
mo
aC
amb
od
iaSw
azila
nd
Solo
mo
nIs
lan
ds
Eritr
eaC
had
Mic
ron
esia
(Fed
.Sta
tes
of)
Ton
ga
Antig
ua
and
Barb
ud
aKe
nya
Van
uat
uAf
gh
anis
tan
Tajik
ista
nLe
soth
oR
wan
da
Co
mo
ros
Gu
yan
aBu
rkin
aFa
soU
nite
dR
epu
blic
ofT
anza
nia
Ch
ann
elIs
lan
ds
Barb
ado
sM
oza
mb
iqu
eTi
mo
r-Le
ste
Ind
iaZi
mb
abw
eVi
etN
amBa
ng
lad
esh
Mya
nm
arSu
dan
Yem
enM
adag
asca
rG
ren
ada
Kyrg
yzst
anU
zbek
ista
nG
uin
eaLa
oPe
op
le's
Dem
ocr
atic
Rep
ub
licBh
uta
nPa
kist
anSo
mal
iaM
ali
Tog
oSi
erra
Leo
ne
Bosn
iaan
dH
erze
go
vin
aEq
uat
ori
alG
uin
eaC
entr
alAf
rica
nR
epu
blic
Mau
ritiu
sZa
mb
iaAr
ub
aD
emo
crat
ic R
epu
blic
oft
he
Co
ng
oEg
ypt
Ang
ola
Sen
egal
Ben
inBe
lize
Kiri
bat
iPh
ilip
pin
esM
ald
ives
Rep
ub
lic o
fMo
ldo
vaN
amib
iaN
iger
iaM
ayo
tte
Gu
inea
-Bis
sau
Thai
lan
dLi
ber
iaTu
rkm
enis
tan
Slo
ven
iaSa
intV
ince
nta
nd
the
Gre
nad
ines
Gu
atem
ala
Ind
on
esia
Kaz a
khst
an Fiji
Gh
ana
Geo
rgia
Cô
ted
'Ivo
ire
Seyc
hel
les
Slo
vaki
aC
amer
oo
nH
on
du
ras
Azer
bai
jan
Ro
man
iaC
hin
aJa
mai
caSe
rbia
Fren
chPo
lyn
esia
Alb
ania
TFYR
Mac
edo
nia
Bots
wan
aSy
rian
Arab
Rep
ub
licH
aiti
Nic
arag
ua
Proportion urban (per cent)
Proportion urban (per cent)
Note: Countries or areas with 90,000 inhabitants or more in 2014.
World Urbanization Prospects: The 2014 Revision4
to review the global urban agenda and to forge a new model of urban development that integrates all facets of sustainable development, to promote equity, welfare and shared prosperity in an urbanizing world.
Accurate, consistent and timely data on global trends in urbanization and city growth are critical for assessing current and future needs with respect to urban growth and for setting policy priorities to promote inclusive and equitable urban and rural devel-opment. In order to systematically track levels and trends in urbanization around the world, the Population Division of the Department of Economic and Social Affairs of the United Nations has issued, since 1988, biennial estimates and projections of the urban and rural populations of all countries and of the populations of major urban agglomerations.
This report presents the highlights of the 2014 Revision of World Urbanization Pros-pects, which contains the latest estimates of the urban and rural populations of 233 coun-tries or areas from 1950 to 2014 and projections to 2050, as well as estimates of population size from 1950 to 2014 and projections to 2030 for all urban agglomerations with 300,000 inhabitants or more in 2014.1 The annex tables in these Highlights provide data on the estimated and projected urban and rural populations, the percentage of the population that live in urban areas and the annual growth rate of the percentage urban for 233 coun-tries or areas of the world. The tables also show the rank and annual growth rate of urban agglomerations with 5 million inhabitants or more in 2014.
Data and methods
The estimates of the proportion of the population that is urban and the size of urban agglomerations presented in World Urbanization Prospects: The 2014 Revision are based on national statistics. Population censuses are the most commonly used sources of data, although estimates obtained from population registers or administrative statistics are also incorporated for some countries.
There is no common global definition of what constitutes an urban settlement. As a result, the urban definition employed by national statistical offices varies widely across countries, and in some cases has changed over time within a country. The criteria for clas-sifying an area as urban may be based on one or a combination of characteristics, such as: a minimum population threshold; population density; proportion employed in non-agricul-tural sectors; the presence of infrastructure such as paved roads, electricity, piped water or sewers; and the presence of education or health services.
In estimating the proportion urban for World Urbanization Prospects, adjust-ments are made to the national estimates only to ensure consistency of the definitions of urban settlements within countries across time. No attempt is made to impose consist-ency in definitions across countries. Several efforts are underway at various institutions to produce globally comparable estimates of the urban population with uniform criteria to define urban areas based on satellite imagery of land cover or night-time lights, for example. However, these approaches have not generated, to date, the long historical time series of urbanization estimates required for this report. In interpreting the estimates and projections from World Urbanization Prospects: The 2014 Revision, readers should keep in mind the heterogeneity of the urban definition across countries.
1 The full report, descriptions of the data, methodology, and complete data tables representing all coun-tries and areas, regions, income groups, development groups, and periods can be accessed at http://esa.un.org/unpd/wup/index.htm.
5
In compiling information on city population size, the Population Division has endeavoured to use data or estimates based on the concept of urban agglomeration. When those data are not consistently available, population data that refer to the city as defined by its administrative boundaries were used. However, when the administrative boundaries of cities remain fixed for long periods of time, they are likely to misrepresent the actual growth of a city with respect to both its territory and its population. For a number of cit-ies, the data available refer to two concepts: the city proper as defined by administrative boundaries and its metropolitan area. In those instances, the data referring to the met-ropolitan area were usually preferred because they are thought to approximate better the territory associated with the urban agglomeration. For any given city, an effort was made to ensure that the time series of population estimates derived from national sources con-forms to the same definition over time. Adjustments were made when necessary to achieve internal consistency.
Since censuses are usually taken every 5 or 10 years, to fill the data gaps within the period 1950–2014, the estimates of the proportion urban and the city populations are interpolated or, for the interval between the last data point and 2014, the estimates are extrapolated from the last observed data point. For years beyond 2014, the proportion urban is projected to 2050 and the city populations are projected to 2030. The projection of the proportion urban is based on a projection of the urban-rural growth differential. It is assumed that the urban-rural growth difference for the most recent period available in a given country converges, over a period of 25 years, to a hypothetical urban-rural growth difference, or world norm, that is consistent with historical experience. The method to project city populations is similar, as the last observed city growth rate converges towards an expected value, estimated on the basis of the city population and the growth rate of the overall urban population in the country.
The estimated and projected values of the proportion urban from 1950 to 2050 for each country or area were then applied to the total population as estimated or projected in the medium variant in World Population Prospects: The 2012 Revision (United Nations, 2013a) in order to obtain country-level estimates of the urban and rural populations. The 2014 Revision of World Urbanization Prospects updates and supersedes all previous esti-mates and projections of urban and rural populations and of urban agglomerations pub-lished by the United Nations.

“Urbanization in Asia” UN Photo/Kibae Park
7
Trends in urbanization
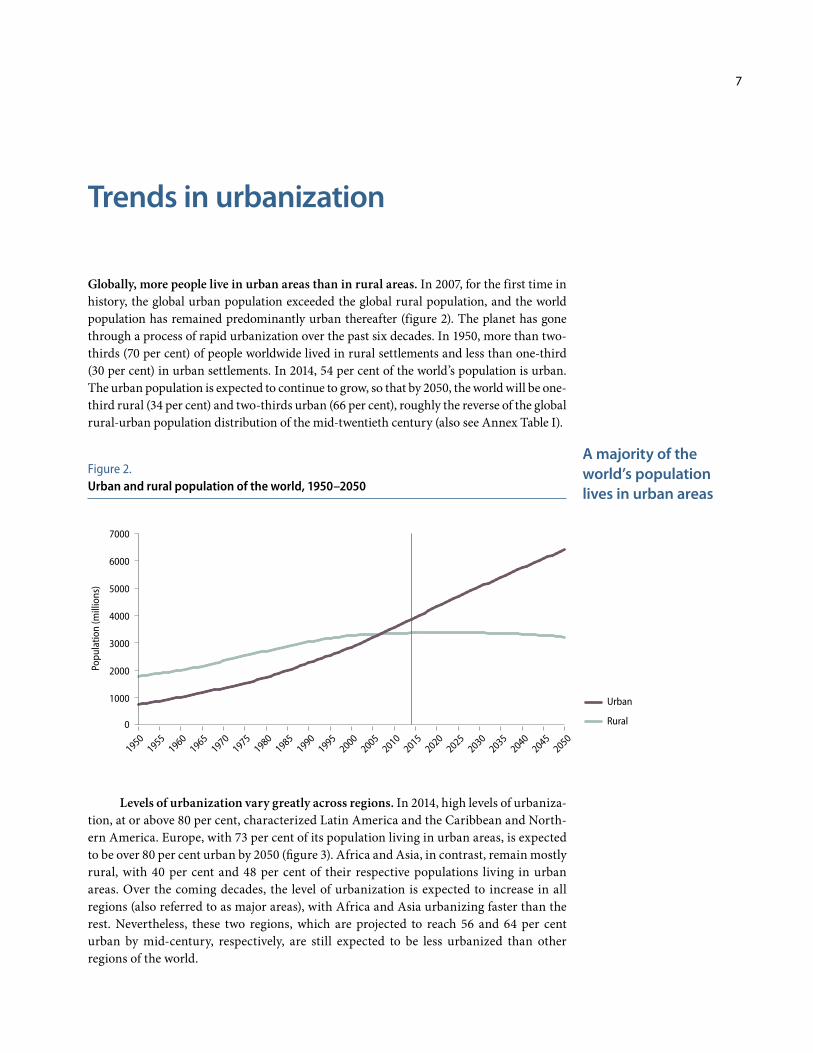
Globally, more people live in urban areas than in rural areas. In 2007, for the first time in history, the global urban population exceeded the global rural population, and the world population has remained predominantly urban thereafter (figure 2). The planet has gone through a process of rapid urbanization over the past six decades. In 1950, more than two-thirds (70 per cent) of people worldwide lived in rural settlements and less than one-third (30 per cent) in urban settlements. In 2014, 54 per cent of the world’s population is urban. The urban population is expected to continue to grow, so that by 2050, the world will be one-third rural (34 per cent) and two-thirds urban (66 per cent), roughly the reverse of the global rural-urban population distribution of the mid-twentieth century (also see Annex Table I).
Figure 2.Urban and rural population of the world, 1950–2050
20502045
20402035
20302025
20202015
20102005
20001995
19901985
19801975
19701965
19601955
Popu
latio
n (m
illio
ns)
0
1000
2000
3000
4000
5000
6000
7000
1950
Urban
Rural
Levels of urbanization vary greatly across regions. In 2014, high levels of urbaniza-tion, at or above 80 per cent, characterized Latin America and the Caribbean and North-ern America. Europe, with 73 per cent of its population living in urban areas, is expected to be over 80 per cent urban by 2050 (figure 3). Africa and Asia, in contrast, remain mostly rural, with 40 per cent and 48 per cent of their respective populations living in urban areas. Over the coming decades, the level of urbanization is expected to increase in all regions (also referred to as major areas), with Africa and Asia urbanizing faster than the rest. Nevertheless, these two regions, which are projected to reach 56 and 64 per cent urban by mid-century, respectively, are still expected to be less urbanized than other regions of the world.
A majority of the world’s population lives in urban areas

World Urbanization Prospects: The 2014 Revision8
Figure 3.Urban and rural population as proportion of total population, by major areas, 1950–2050
In 2014, sixteen countries still have low levels of urbanization, i.e. below 20 per cent. The largest among them, with total populations of 10 million inhabitants or more, include Burundi, Ethiopia, Malawi, Niger, South Sudan and Uganda in Africa and Nepal and Sri Lanka in Asia (see Map 1). By 2050, all of these countries are expected to become signifi-cantly more urbanized, with as much as twice their respective proportions urban in 2014. In contrast, 59 countries are already more than 80 per cent urban. Among those with populations of at least 10 million inhabitants, the most highly urbanized countries are Belgium (98 per cent urban), Japan (93 per cent), Argentina (92 per cent) and the Nether-lands (90 per cent). By 2050, 89 countries are expected to become more than 80 per cent urban. When interpreting the differences in levels of urbanization across countries, it is important to keep in mind the heterogeneity of the urban definition across countries.
Africa and Asia are urbanizing more rapidly than other regions of the world. The rate of urbanization, measured as the average annual rate of change of the percentage urban, is highest in Asia and Africa, where currently the proportion urban is increasing by 1.5 and 1.1 per cent per annum, respectively. Regions that already have relatively high levels of urbanization are urbanizing at a slower pace, at less than 0.4 per cent annually (figure 4). In general, the pace of urbanization tends to slow down as a population becomes more urbanized.
Urbanization has occurred in all major areas, yet Africa and Asia remain mostly rural
2050
2040
2030
2020
2010
2000
1990
1980
1970
1960
1950
0
20
40
60
80
100
2050
2040
2030
2020
2010
2000
1990
1980
1970
1960
1950
2050
2040
2030
2020
2010
2000
1990
1980
1970
1960
1950
0
10
20
30
40
100
90
80
70
60
50
2050
2040
2030
2020
2010
2000
1990
1980
1970
1960
1950
2050
2040
2030
2020
2010
2000
1990
1980
1970
1960
1950
2050
2040
2030
2020
2010
2000
1990
1980
1970
1960
1950
Africa Asia Europe
Latin America and the Carribean Northern America Oceania
Urban population
Prop
ortio
n of
tota
l pop
ulat
ion
(per
cen
t)Pr
opor
tion
of to
tal p
opul
atio
n (p
er c
ent)
Rural population
90
70
50
30
10
40.047.5
73.4
79.5 81.5
70.8
Trends in urbanization 9
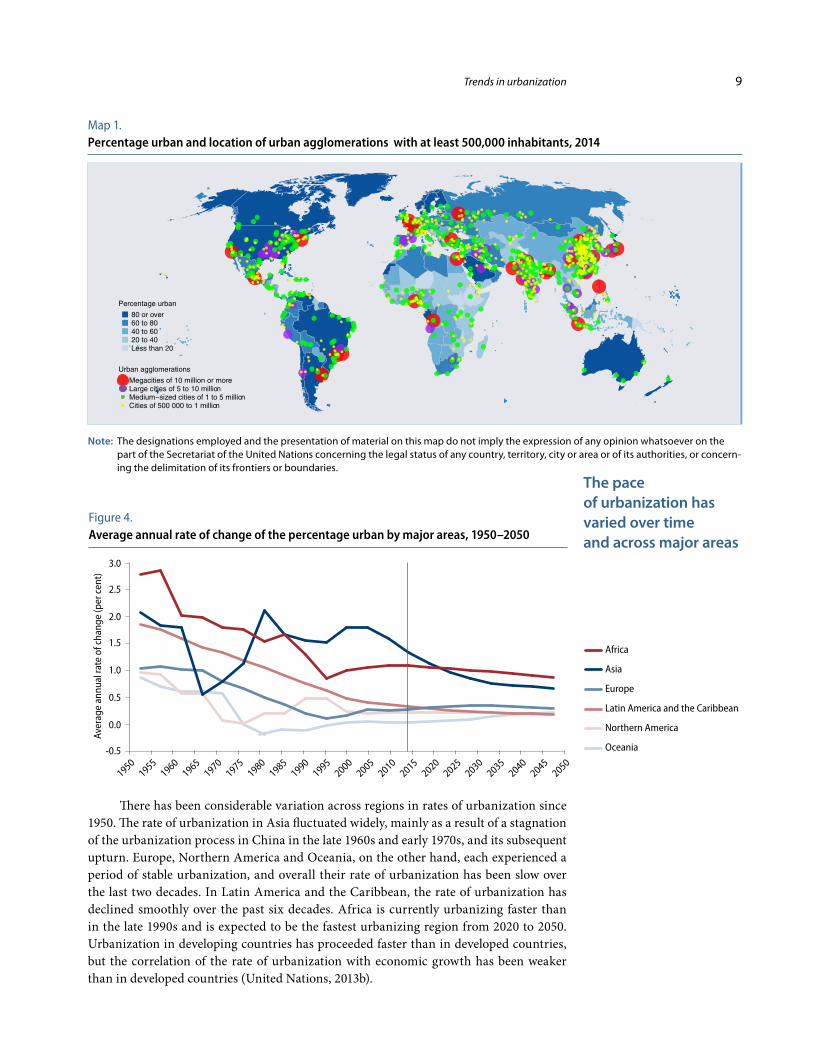
Map 1.Percentage urban and location of urban agglomerations with at least 500,000 inhabitants, 2014
Note: The designations employed and the presentation of material on this map do not imply the expression of any opinion whatsoever on the part of the Secretariat of the United Nations concerning the legal status of any country, territory, city or area or of its authorities, or concern-ing the delimitation of its frontiers or boundaries.
There has been considerable variation across regions in rates of urbanization since 1950. The rate of urbanization in Asia fluctuated widely, mainly as a result of a stagnation of the urbanization process in China in the late 1960s and early 1970s, and its subsequent upturn. Europe, Northern America and Oceania, on the other hand, each experienced a period of stable urbanization, and overall their rate of urbanization has been slow over the last two decades. In Latin America and the Caribbean, the rate of urbanization has declined smoothly over the past six decades. Africa is currently urbanizing faster than in the late 1990s and is expected to be the fastest urbanizing region from 2020 to 2050. Urbanization in developing countries has proceeded faster than in developed countries, but the correlation of the rate of urbanization with economic growth has been weaker than in developed countries (United Nations, 2013b).
-0.5
0.0
0.5
1.0
1.5
2.0
2.5
3.0
Oceania
Northern America
Latin America and the Caribbean
Europe
Asia
Africa
20502045
20402035
20302025
20202015
20102005
20001995
19901985
19801975
19701965
19601955
1950
Aver
age
annu
al ra
te o
f cha
nge
(per
cen
t)
Figure 4.Average annual rate of change of the percentage urban by major areas, 1950–2050
The pace of urbanization has varied over time and across major areas
Urban agglomerations
Megacities of 10 million or moreLarge cities of 5 to 10 million
ed cities of 1 to 5 millionCities of 500 000 to 1 million
Percentage urban
80 or over60 to 8040 to 6020 to 40Less than 20
World Urbanization Prospects: The 2014 Revision10
0102030405060708090
100
Low income countries
Lower-middle-income countries
Upper-middle-income countries
High-income countries
20502045
20402035
20302025
20202015
20102005
20001995
19901985
19801975
19701965
19601955
1950
Prop
ortio
n ur
ban
(per
cen
t)
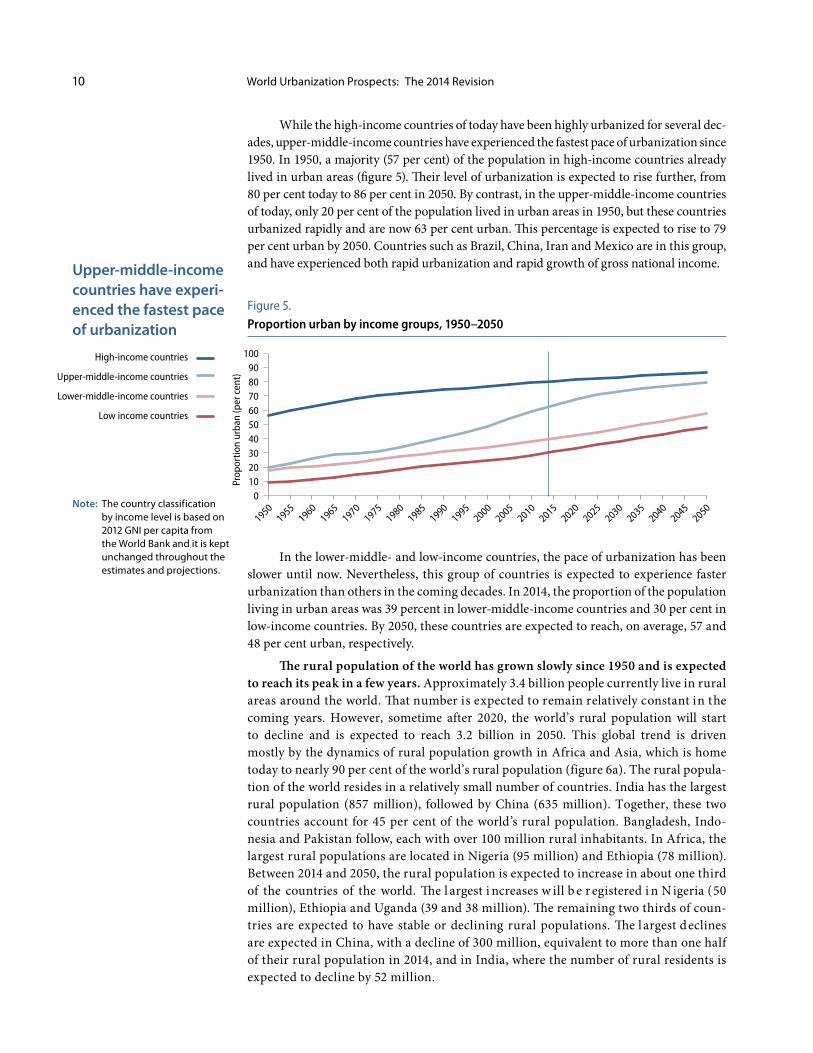
While the high-income countries of today have been highly urbanized for several dec-ades, upper-middle-income countries have experienced the fastest pace of urbanization since 1950. In 1950, a majority (57 per cent) of the population in high-income countries already lived in urban areas (figure 5). Their level of urbanization is expected to rise further, from 80 per cent today to 86 per cent in 2050. By contrast, in the upper-middle-income countries of today, only 20 per cent of the population lived in urban areas in 1950, but these countries urbanized rapidly and are now 63 per cent urban. This percentage is expected to rise to 79 per cent urban by 2050. Countries such as Brazil, China, Iran and Mexico are in this group, and have experienced both rapid urbanization and rapid growth of gross national income.
Figure 5.Proportion urban by income groups, 1950–2050
In the lower-middle- and low-income countries, the pace of urbanization has been slower until now. Nevertheless, this group of countries is expected to experience faster urbanization than others in the coming decades. In 2014, the proportion of the population living in urban areas was 39 percent in lower-middle-income countries and 30 per cent in low-income countries. By 2050, these countries are expected to reach, on average, 57 and 48 per cent urban, respectively.
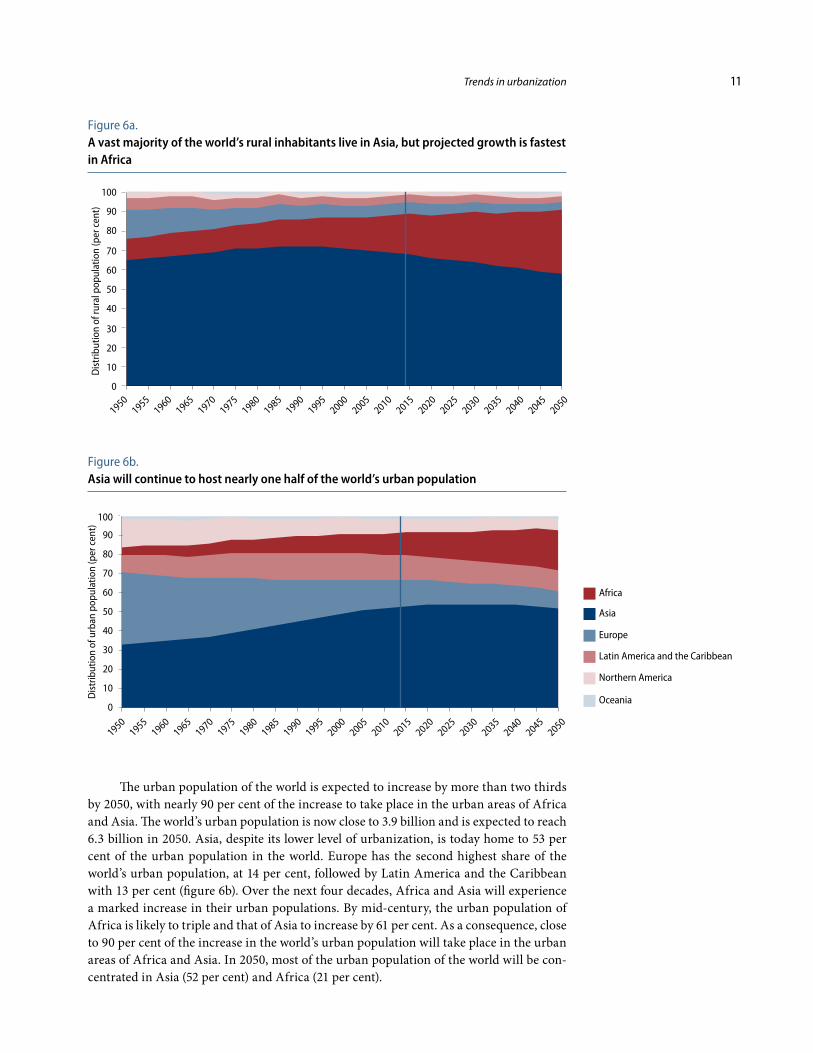
The rural population of the world has grown slowly since 1950 and is expected to reach its peak in a few years. Approximately 3.4 billion people currently live in rural areas around the world. That number is expected to remain relatively constant in the coming years. However, sometime after 2020, the world’s rural population will start to decline and is expected to reach 3.2 billion in 2050. This global trend is driven mostly by the dynamics of rural population growth in Africa and Asia, which is home today to nearly 90 per cent of the world’s rural population (figure 6a). The rural popula-tion of the world resides in a relatively small number of countries. India has the largest rural population (857 million), followed by China (635 million). Together, these two countries account for 45 per cent of the world’s rural population. Bangladesh, Indo-nesia and Pakistan follow, each with over 100 million rural inhabitants. In Africa, the largest rural populations are located in Nigeria (95 million) and Ethiopia (78 million). Between 2014 and 2050, the rural population is expected to increase in about one third of the countries of the world. The l argest i ncreases w ill b e r egistered i n N igeria (50 million), Ethiopia and Uganda (39 and 38 million). The remaining two thirds of coun-tries are expected to have stable or declining rural populations. The l argest declines are expected in China, with a decline of 300 million, equivalent to more than one half of their rural population in 2014, and in India, where the number of rural residents is expected to decline by 52 million.
Upper-middle-income countries have experi-enced the fastest pace of urbanization
Note: The country classification by income level is based on 2012 GNI per capita from the World Bank and it is kept unchanged throughout the estimates and projections.
Trends in urbanization 11
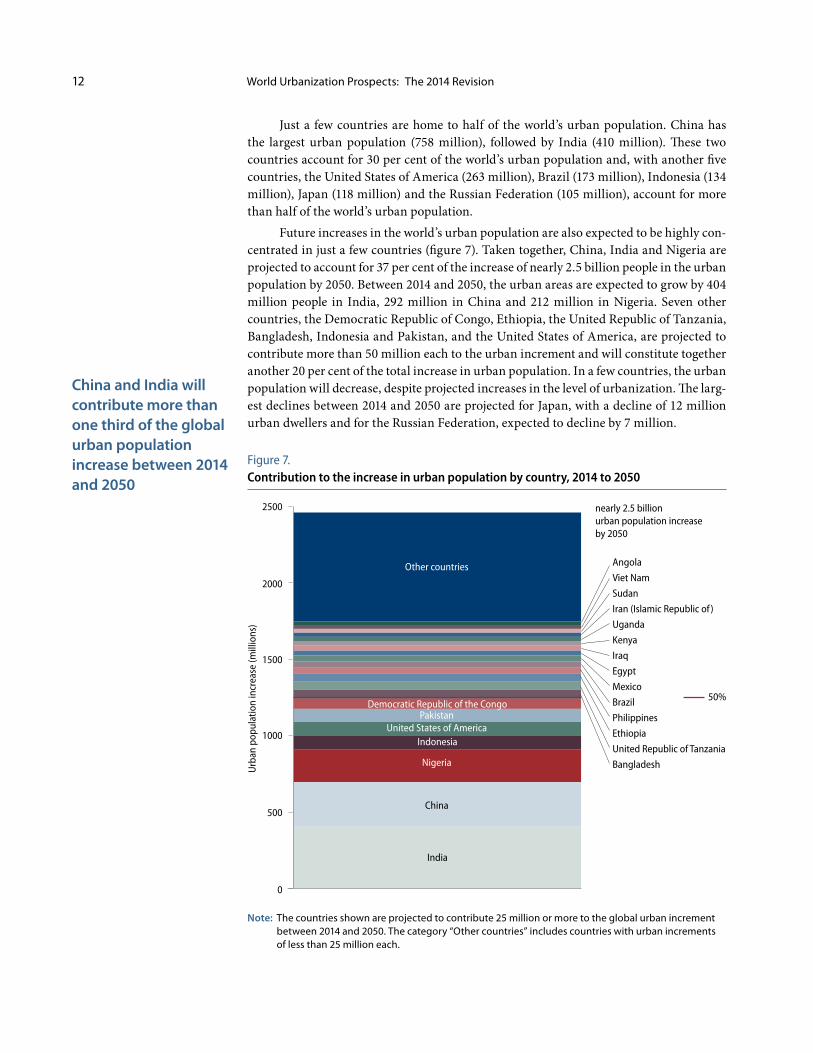
The urban population of the world is expected to increase by more than two thirds by 2050, with nearly 90 per cent of the increase to take place in the urban areas of Africa and Asia. The world’s urban population is now close to 3.9 billion and is expected to reach 6.3 billion in 2050. Asia, despite its lower level of urbanization, is today home to 53 per cent of the urban population in the world. Europe has the second highest share of the world’s urban population, at 14 per cent, followed by Latin America and the Caribbean with 13 per cent (figure 6b). Over the next four decades, Africa and Asia will experience a marked increase in their urban populations. By mid-century, the urban population of Africa is likely to triple and that of Asia to increase by 61 per cent. As a consequence, close to 90 per cent of the increase in the world’s urban population will take place in the urban areas of Africa and Asia. In 2050, most of the urban population of the world will be con-centrated in Asia (52 per cent) and Africa (21 per cent).
0
10
20
30
40
50
60
70
80
90
100
20502045
20402035
20302025
20202015
20102005
20001995
19901985
19801975
19701965
19601955
1950
Dis
trib
utio
n of
rura
l pop
ulat
ion
(per
cen
t)
Oceania
Northern America
Latin America and the Caribbean
Europe
Africa
Asia
Figure 6a.A vast majority of the world’s rural inhabitants live in Asia, but projected growth is fastest in Africa
Oceania
Northern America
Latin America and the Caribbean
Europe
Africa
Asia
0
10
20
30
40
50
60
70
80
90
100
20502045
20402035
20302025
20202015
20102005
20001995
19901985
19801975
19701965
19601955
1950
Dis
trib
utio
n of
urb
an p
opul
atio
n (p
er c
ent)
Figure 6b.Asia will continue to host nearly one half of the world’s urban population
World Urbanization Prospects: The 2014 Revision12
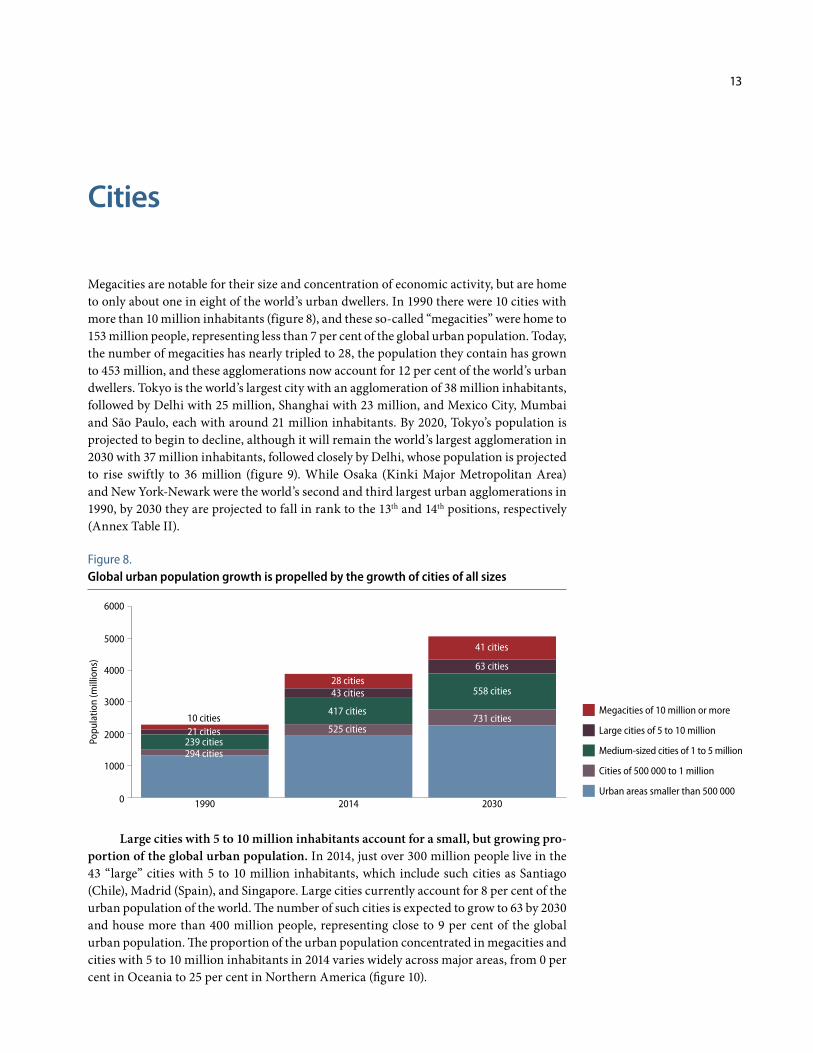
Just a few countries are home to half of the world’s urban population. China has the largest urban population (758 million), followed by India (410 million). These two countries account for 30 per cent of the world’s urban population and, with another five countries, the United States of America (263 million), Brazil (173 million), Indonesia (134 million), Japan (118 million) and the Russian Federation (105 million), account for more than half of the world’s urban population.
Future increases in the world’s urban population are also expected to be highly con-centrated in just a few countries (figure 7). Taken together, China, India and Nigeria are projected to account for 37 per cent of the increase of nearly 2.5 billion people in the urban population by 2050. Between 2014 and 2050, the urban areas are expected to grow by 404 million people in India, 292 million in China and 212 million in Nigeria. Seven other countries, the Democratic Republic of Congo, Ethiopia, the United Republic of Tanzania, Bangladesh, Indonesia and Pakistan, and the United States of America, are projected to contribute more than 50 million each to the urban increment and will constitute together another 20 per cent of the total increase in urban population. In a few countries, the urban population will decrease, despite projected increases in the level of urbanization. The larg-est declines between 2014 and 2050 are projected for Japan, with a decline of 12 million urban dwellers and for the Russian Federation, expected to decline by 7 million.
Figure 7.Contribution to the increase in urban population by country, 2014 to 2050
China and India will contribute more than one third of the global urban population increase between 2014 and 2050
Note: The countries shown are projected to contribute 25 million or more to the global urban increment between 2014 and 2050. The category “Other countries” includes countries with urban increments of less than 25 million each.
0
500
1000
1500
2000
2500
Other countries
Democratic Republic of the Congo
China
India
nearly 2.5 billion urban population increase by 2050
50%
Nigeria
IndonesiaUnited States of America
Pakistan
Urb
an p
opul
atio
n in
crea
se (m
illio
ns)
Iraq
Angola
Viet Nam
Sudan
Iran (Islamic Republic of )
Uganda
Kenya
Egypt
Mexico
Brazil
Philippines
Ethiopia
United Republic of Tanzania
Bangladesh
13
Cities
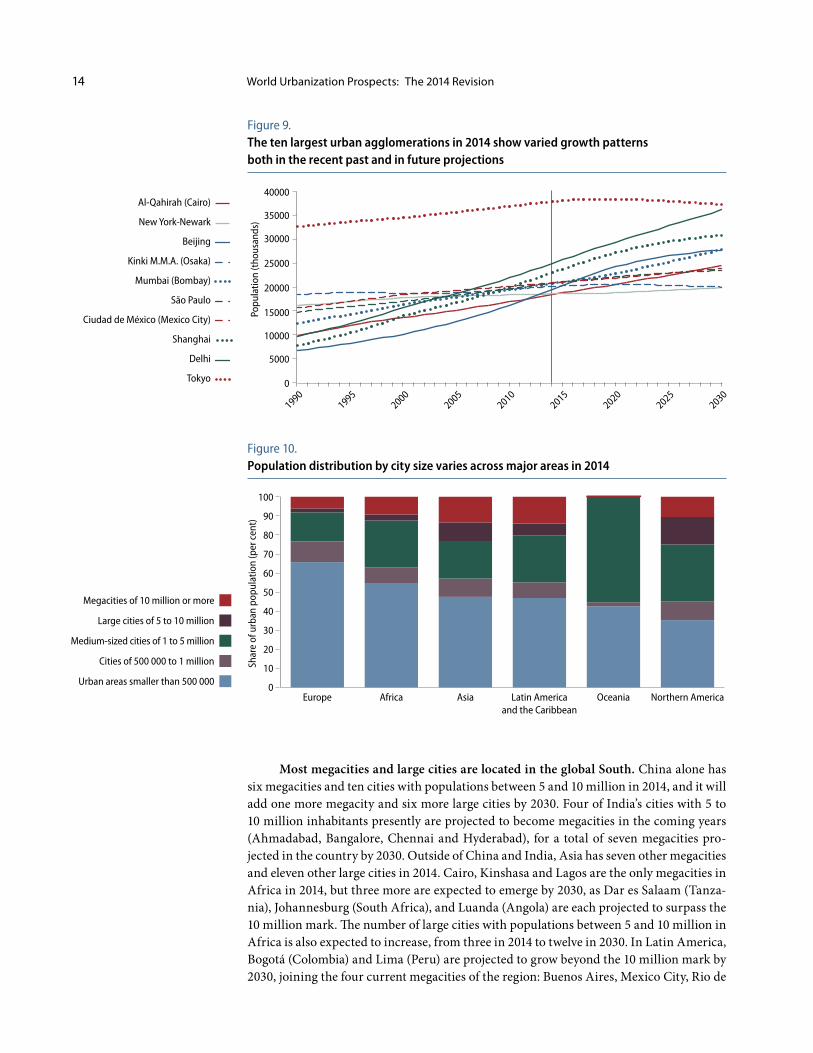
Megacities are notable for their size and concentration of economic activity, but are home to only about one in eight of the world’s urban dwellers. In 1990 there were 10 cities with more than 10 million inhabitants (figure 8), and these so-called “megacities” were home to 153 million people, representing less than 7 per cent of the global urban population. Today, the number of megacities has nearly tripled to 28, the population they contain has grown to 453 million, and these agglomerations now account for 12 per cent of the world’s urban dwellers. Tokyo is the world’s largest city with an agglomeration of 38 million inhabitants, followed by Delhi with 25 million, Shanghai with 23 million, and Mexico City, Mumbai and São Paulo, each with around 21 million inhabitants. By 2020, Tokyo’s population is projected to begin to decline, although it will remain the world’s largest agglomeration in 2030 with 37 million inhabitants, followed closely by Delhi, whose population is projected to rise swiftly to 36 million (figure 9). While Osaka (Kinki Major Metropolitan Area) and New York-Newark were the world’s second and third largest urban agglomerations in 1990, by 2030 they are projected to fall in rank to the 13th and 14th positions, respectively (Annex Table II).
Figure 8.Global urban population growth is propelled by the growth of cities of all sizes
Large cities with 5 to 10 million inhabitants account for a small, but growing pro-portion of the global urban population. In 2014, just over 300 million people live in the 43 “large” cities with 5 to 10 million inhabitants, which include such cities as Santiago (Chile), Madrid (Spain), and Singapore. Large cities currently account for 8 per cent of the urban population of the world. The number of such cities is expected to grow to 63 by 2030 and house more than 400 million people, representing close to 9 per cent of the global urban population. The proportion of the urban population concentrated in megacities and cities with 5 to 10 million inhabitants in 2014 varies widely across major areas, from 0 per cent in Oceania to 25 per cent in Northern America (figure 10).
0
1000
2000
3000
4000
5000
6000
Megacities of 10 million or more
Large cities of 5 to 10 million
Medium-sized cities of 1 to 5 million
Cities of 500 000 to 1 million
Urban areas smaller than 500 000203020141990
294 cities239 cities21 cities10 cities
28 cities43 cities
417 cities
525 cities731 cities
558 cities
63 cities
41 cities
Popu
latio
n (m
illio
ns)
World Urbanization Prospects: The 2014 Revision14
Figure 10.Population distribution by city size varies across major areas in 2014
Most megacities and large cities are located in the global South. China alone has six megacities and ten cities with populations between 5 and 10 million in 2014, and it will add one more megacity and six more large cities by 2030. Four of India’s cities with 5 to 10 million inhabitants presently are projected to become megacities in the coming years (Ahmadabad, Bangalore, Chennai and Hyderabad), for a total of seven megacities pro-jected in the country by 2030. Outside of China and India, Asia has seven other megacities and eleven other large cities in 2014. Cairo, Kinshasa and Lagos are the only megacities in Africa in 2014, but three more are expected to emerge by 2030, as Dar es Salaam (Tanza-nia), Johannesburg (South Africa), and Luanda (Angola) are each projected to surpass the 10 million mark. The number of large cities with populations between 5 and 10 million in Africa is also expected to increase, from three in 2014 to twelve in 2030. In Latin America, Bogotá (Colombia) and Lima (Peru) are projected to grow beyond the 10 million mark by 2030, joining the four current megacities of the region: Buenos Aires, Mexico City, Rio de
0
10000
15000
20000
25000
30000
35000
40000Al-Qahirah (Cairo)
New York-Newark
Beijing
Kinki M.M.A. (Osaka)
Mumbai (Bombay)
São Paulo
Ciudad de México (Mexico City)
Shanghai
Delhi
Tokyo
20302025
20202015
20102005
20001995
1990
Popu
latio
n (t
hous
ands
)
5000
0
20
40
60
80
100
90
70
50
30
10
Northern AmericaOceaniaLatin Americaand the Caribbean
AsiaAfricaEurope
Megacities of 10 million or more
Large cities of 5 to 10 million
Medium-sized cities of 1 to 5 million
Cities of 500 000 to 1 million
Urban areas smaller than 500 000
Shar
e of
urb
an p
opul
atio
n (p
er c
ent)
Figure 9.The ten largest urban agglomerations in 2014 show varied growth patterns both in the recent past and in future projections
Cities 15
Janeiro, and São Paulo. Notably, there are varying degrees of uncertainty in the projec-tions of cities, with greater uncertainty for cities like Kinshasa or Luanda where census data have not been collected or reported in decades.
One in five urban dwellers worldwide lives in a medium-sized city with 1 million to 5 million inhabitants. While considered medium-sized by global standards, these cit-ies are, in fact, the largest cities in 79 countries or areas. Examples include Sydney (Aus-tralia), Addis Ababa (Ethiopia), and Montevideo (Uruguay). The global population living in medium-sized cities nearly doubled between 1990 and 2014, and is expected to increase by another 36 per cent between 2014 and 2030, growing from 827 million to 1.1 billion. The number of people living in cities of between 500,000 and 1 million inhabitants is expected to grow at a similar pace, increasing from 363 million in 2014 to 509 million in 2030, but continuing to hold only around 10 per cent of the global urban population.
In 2014 close to one half of the world’s urban population lives in settlements with fewer than 500,000 inhabitants. While this proportion is projected to shrink over time, by 2030 these small cities and towns will still be home to around 45 per cent of urban dwellers. The proportion of the urban population in small cities varies considerably across regions. Close to two thirds of Europe’s urban dwellers reside in small urban places as do more than half of Africa’s urban dwellers. In contrast, just one third of urban residents in Northern America live in settlements with fewer than 500,000 people. Regional differ-ences also reflect differences in settlement patterns, as well as variations in the definition of urban areas across countries and regions.
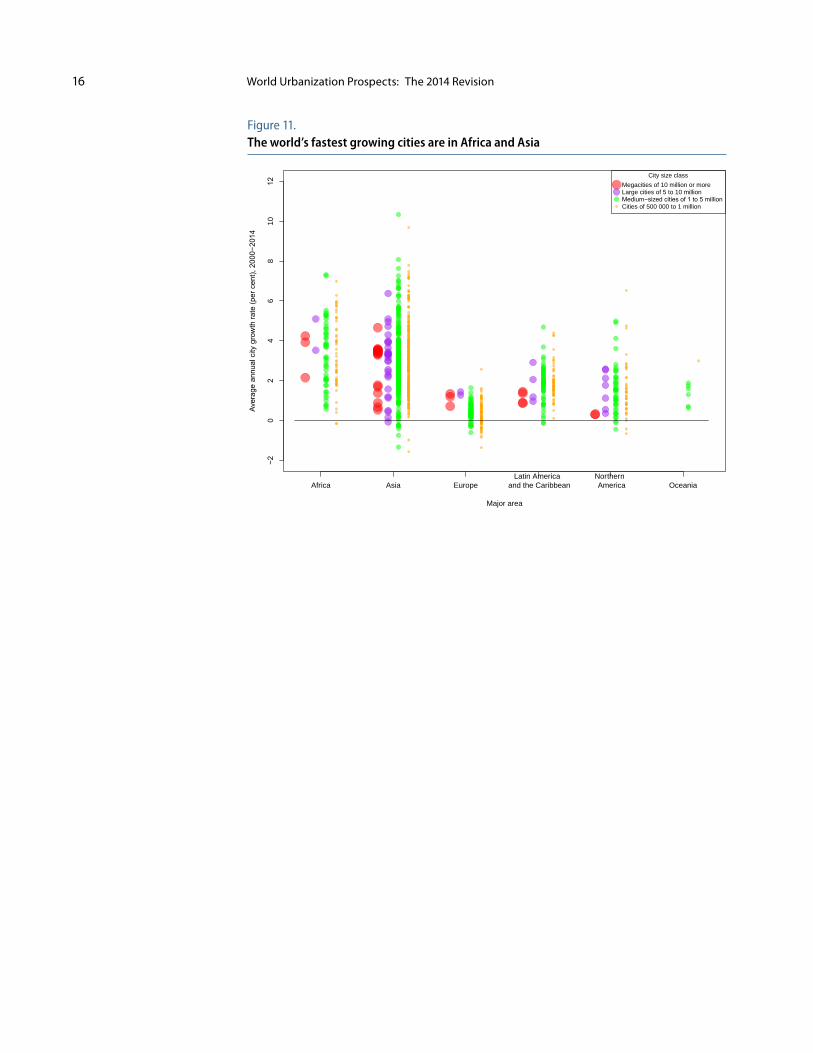
The fastest growing urban agglomerations are medium-sized cities and cities with less than 1 million inhabitants located in Asia and Africa. Between 2000 and 2014 the world’s cities with more than 500,000 inhabitants grew at an average annual rate of 2.4 per cent. However, 43 of these cities grew more than twice as fast, with average growth rates in excess of 6 per cent per year (figure 11). Of these, 4 are located in Africa, 38 in Asia (18 in China alone), and 1 in Northern America. By way of comparison, Suzhou, in China’s Jiangsu Province, is the only city with more than 5 million inhabitants to have experi-enced such rapid growth. In general, most of the world’s fastest growing urban agglom-erations are smaller cities: agglomerations with 500,000 to 1 million inhabitants in 2014 account for 26 of the 43 fastest-growing cities, while another 16 are medium-sized cities with between 1 million and 5 million inhabitants.
Some cities have experienced population decline since 2000, most of which are located in low-fertility countries of Asia and Europe with stagnating or declining popu-lations. A few cities in Japan and the Republic of Korea (for example, Nagasaki and Busan) have experienced population decline between 2000 and 2014. Several cities in the Russian Federation and Ukraine have lost population since 2000 as well. In addition, several capital cities around the world have seen their populations decline between 2000 and 2014, includ-ing Bratislava (Slovakia), Riga (Latvia), Sarajevo (Bosnia and Herzegovina) and Yerevan (Armenia). In addition to low fertility, emigration has also contributed to smaller popula-tion sizes in some of these cities.
Economic contraction and natural disasters have contributed to population loss in some cities. In the United States, for example, Buffalo and Detroit each experienced net losses of population between 2000 and 2014, concurrent with a loss of industry and jobs in those cities, while New Orleans experienced population decline in the wake of the 2005 Hurricane Katrina.
World Urbanization Prospects: The 2014 Revision16
Figure 11.The world’s fastest growing cities are in Africa and Asia
−20
24
68
1012
Major area
Aver
age
annu
al c
ity g
row
th ra
te (p
er c
ent),
200
0−20
14
Africa Asia EuropeLatin America
and the CaribbeanNorthern America Oceania
City size classMegacities of 10 million or moreLarge cities of 5 to 10 millionMedium−sized cities of 1 to 5 millionCities of 500 000 to 1 million
17
Policy implications
As the world continues to urbanize, sustainable development challenges will be increas-ingly concentrated in cities, particularly in the lower-middle-income countries where the pace of urbanization is fastest. At the same time, cities offer opportunities to expand access to services, such as health care and education, for large numbers of people in an economically efficient manner. Providing public transportation, as well as housing, elec-tricity, water and sanitation for a densely settled population is typically cheaper and less environmentally damaging than providing a similar level of services to a predominantly rural household. Urban dwellers also have access to larger and more diversified labour markets, and enjoy healthier lives overall.
Governments must implement policies to ensure that the benefits of urban growth are shared equitably and sustainably. The Rio +20 Conference outcome, “The future we want”, recognized that cities can lead the way towards economically, socially and environ-mentally sustainable societies, but that a holistic approach to urban planning and manage-ment is needed to improve living standards of urban and rural dwellers alike. Sustainable urbanization requires that cities generate better income and employment opportunities, expand the necessary infrastructure for water and sanitation, energy, transportation, information and communications; ensure equal access to services; reduce the number of people living in slums; and preserve the natural assets within the city and surrounding areas.
Diversified policies to plan for and manage the spatial distribution of the popu-lation and internal migration are needed. History has shown that policies that aim to restrict rural-urban migration are ineffective at forestalling city growth, and can even produce economic, social and environmental harms. In recent years, a growing number of countries have been favouring other strategies for rural and urban development, such as allocating land rights, managing land use, land redistribution, creating regional develop-ment zones and promoting economic diversification and competitiveness in rural areas through the mobilization of investment and the improvement of rural livelihoods.2
Policies aimed at a more balanced distribution of urban growth, avoiding excessive concentration in just one or two very large urban agglomerations within a single coun-try, can also support sustainable development. These policies, as well as those promoting the growth of intermediate-size cities common in Latin America, can help to address the problems of excessive centralization of economic and administrative functions, while also responding to the challenges of providing urban infrastructure and basic social services for the urban poor, and mitigating the negative environmental impacts often associated with large and rapidly growing urban agglomerations.
2 United Nations (2008) World Population Monitoring, focusing on population distribution, urbanization, internal migration and development. Report of the Secretary-General to the forty-first session of the Commission on Population and Development, E/CN.9/2008/3
World Urbanization Prospects: The 2014 Revision18
Accurate, consistent and timely data on global trends in urbanization and city growth are critical for assessing current and future needs with respect to urban growth and for setting policy priorities to promote inclusive and equitable urban and rural devel-opment. In order to systematically track levels and trends in urbanization around the world and to monitor progress in sustainable development goals in urban and rural areas, Governments, with the support of international cooperation, should continue their efforts to produce more extensive and better quality data on the size, distribution and character-istics of the population.
Successful sustainable urbanization requires competent, responsive and account-able governments charged with the management of cities and urban expansion, as well appropriate use of information and communication technologies (ICTs) for more efficient service delivery. There is a need for building institutional capacities and applying inte-grated approaches so as to attain urban sustainability.
19
References
United Nations (1974). Methods for the Projection of Urban and Rural Population. Population Studies, No. 55 (United Nations publication, Sales No. E.74.XIII.3).
__________ (1980). Patterns of Urban and Rural Population Growth. Population Studies No. 68 (United Nations publication, Sales No. E.79.XIII.9).
__________ (2013a). World Population Prospects: The Revision 2012. Volume 1, Comprehensive Tables (United Nations publications ST/ESA/SER.A/336).
__________ (2013b). World Economic and Social Survey: Sustainable Development Challenges (E/2013/50/Rev. 1 ST/ESA/344).
UN-Habitat (2012) State of the World’s Cities, 2012/2013. Nairobi, Kenya. ISBN: 978-92-1-132494-5
Annex
Table IUrban and rural population, proportion urban and average annual rate of change of the proportion urban
Major area, region, country or area
Population (thousands)
Proportion urban (per cent)
Average annual rate of change (per cent)Urban Rural
1990 2014 2050 1990 2014 2050 1990 2014 2050 2010–2015
WORLD 2 285 031 3 880 128 6 338 611 3 035 786 3 363 656 3 212 333 43 54 66 0.9
More developed regionsa 830 952 980 403 1 113 500 317 326 275 828 189 610 72 78 85 0.3
Less developed regionsb 1 454 079 2 899 725 5 225 111 2 718 460 3 087 828 3 022 723 35 48 63 1.2
Least developed countriesc 107 335 283 855 895 701 402 019 635 275 914 889 21 31 49 1.7
Less developed regions, excluding least developed countriesd
1 346 744 2 615 870 4 329 410 2 316 440 2 452 553 2 107 834 37 52 67 1.3
Less developed regions, excluding China
1 126 378 2 115 652 4 148 069 1 854 345 2 446 901 2 684 617 38 46 61 0.9
High-income countriese 834 931 1 035 404 1 212 666 287 614 256 311 185 266 74 80 87 0.3
Middle-income countries 1 325 274 2 555 840 4 284 327 2 346 129 2 484 859 2 139 791 36 51 67 1.3
Upper-middle-income countries 793 208 1 541 090 2 155 352 1 153 047 920 812 562 801 41 63 79 1.5
Lower-middle-income countries 532 067 1 014 751 2 128 975 1 193 082 1 564 047 1 576 990 31 39 57 1.1
Low income countries 109 850 268 441 819 856 394 871 616 562 883 673 22 30 48 1.5
Sub-Saharan Africaf 132 971 345 617 1 136 822 357 144 579 083 937 624 27 37 55 1.4
AFRICA 196 923 455 345 1 338 566 433 064 682 885 1 054 609 31 40 56 1.1
Eastern Africa 35 564 96 610 378 763 162 822 287 296 490 458 18 25 44 1.7
Burundi 352 1 233 7 025 5 254 9 250 19 666 6 12 26 2.5
Comoros 115 212 576 298 540 932 28 28 38 0.3
Djibouti 448 685 1 028 142 202 216 76 77 83 0.1
Eritrea 517 1 451 6 029 2 755 5 086 8 284 16 22 42 1.9
Ethiopia 6 064 18 363 70 522 41 979 78 143 117 051 13 19 38 2.3
Kenya 3 927 11 476 42 636 19 520 34 070 54 536 17 25 44 1.7
Madagascar 2 721 8 125 30 518 8 825 15 447 24 979 24 34 55 1.9
Malawi 1 092 2 710 12 437 8 355 14 119 28 766 12 16 30 0.9
Mauritius1 464 497 570 592 752 661 44 40 46 -0.5
Mayotte 33 108 237 59 120 229 36 47 51 -0.8
Mozambique 3 392 8 454 29 440 10 176 18 019 30 490 25 32 49 0.8
Réunion 496 840 1 089 115 46 36 81 95 97 0.2
Rwanda 391 3 369 13 349 6 824 8 731 12 029 5 28 53 3.7
Seychelles 34 50 65 35 43 35 49 54 65 0.6
Somalia 1 875 4 223 15 664 4 447 6 583 11 412 30 39 58 1.2
South Sudan 765 2 182 8 403 4 999 9 556 16 357 13 19 34 1.0
Uganda 1 942 6 124 33 367 15 593 32 721 70 711 11 16 32 2.1
United Republic of Tanzania2 4 813 15 685 68 569 20 672 35 073 60 848 19 31 53 2.3
Zambia 3 091 6 079 25 759 4 753 8 942 18 447 39 40 58 1.1
Zimbabwe 3 033 4 745 11 479 7 429 9 854 14 774 29 33 44 -0.5
Middle Africa 22 566 60 685 192 108 47 434 78 798 124 003 32 44 61 1.2
Angola 2 644 9 580 34 676 7 690 12 558 19 648 26 43 64 1.9
Cameroon 4 787 12 281 34 003 7 284 10 538 14 596 40 54 70 1.1
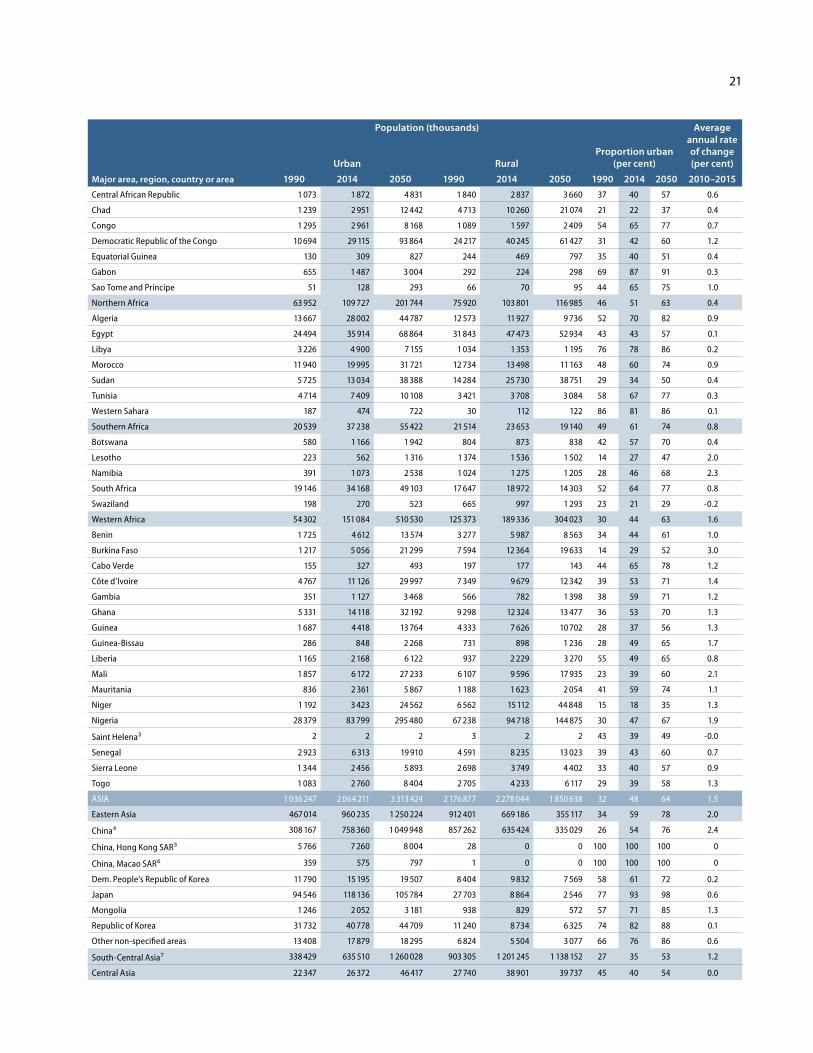
21
Major area, region, country or area
Population (thousands)
Proportion urban (per cent)
Average annual rate of change (per cent)Urban Rural
1990 2014 2050 1990 2014 2050 1990 2014 2050 2010–2015
Central African Republic 1 073 1 872 4 831 1 840 2 837 3 660 37 40 57 0.6
Chad 1 239 2 951 12 442 4 713 10 260 21 074 21 22 37 0.4
Congo 1 295 2 961 8 168 1 089 1 597 2 409 54 65 77 0.7
Democratic Republic of the Congo 10 694 29 115 93 864 24 217 40 245 61 427 31 42 60 1.2
Equatorial Guinea 130 309 827 244 469 797 35 40 51 0.4
Gabon 655 1 487 3 004 292 224 298 69 87 91 0.3
Sao Tome and Principe 51 128 293 66 70 95 44 65 75 1.0
Northern Africa 63 952 109 727 201 744 75 920 103 801 116 985 46 51 63 0.4
Algeria 13 667 28 002 44 787 12 573 11 927 9 736 52 70 82 0.9
Egypt 24 494 35 914 68 864 31 843 47 473 52 934 43 43 57 0.1
Libya 3 226 4 900 7 155 1 034 1 353 1 195 76 78 86 0.2
Morocco 11 940 19 995 31 721 12 734 13 498 11 163 48 60 74 0.9
Sudan 5 725 13 034 38 388 14 284 25 730 38 751 29 34 50 0.4
Tunisia 4 714 7 409 10 108 3 421 3 708 3 084 58 67 77 0.3
Western Sahara 187 474 722 30 112 122 86 81 86 0.1
Southern Africa 20 539 37 238 55 422 21 514 23 653 19 140 49 61 74 0.8
Botswana 580 1 166 1 942 804 873 838 42 57 70 0.4
Lesotho 223 562 1 316 1 374 1 536 1 502 14 27 47 2.0
Namibia 391 1 073 2 538 1 024 1 275 1 205 28 46 68 2.3
South Africa 19 146 34 168 49 103 17 647 18 972 14 303 52 64 77 0.8
Swaziland 198 270 523 665 997 1 293 23 21 29 -0.2
Western Africa 54 302 151 084 510 530 125 373 189 336 304 023 30 44 63 1.6
Benin 1 725 4 612 13 574 3 277 5 987 8 563 34 44 61 1.0
Burkina Faso 1 217 5 056 21 299 7 594 12 364 19 633 14 29 52 3.0
Cabo Verde 155 327 493 197 177 143 44 65 78 1.2
Côte d’Ivoire 4 767 11 126 29 997 7 349 9 679 12 342 39 53 71 1.4
Gambia 351 1 127 3 468 566 782 1 398 38 59 71 1.2
Ghana 5 331 14 118 32 192 9 298 12 324 13 477 36 53 70 1.3
Guinea 1 687 4 418 13 764 4 333 7 626 10 702 28 37 56 1.3
Guinea-Bissau 286 848 2 268 731 898 1 236 28 49 65 1.7
Liberia 1 165 2 168 6 122 937 2 229 3 270 55 49 65 0.8
Mali 1 857 6 172 27 233 6 107 9 596 17 935 23 39 60 2.1
Mauritania 836 2 361 5 867 1 188 1 623 2 054 41 59 74 1.1
Niger 1 192 3 423 24 562 6 562 15 112 44 848 15 18 35 1.3
Nigeria 28 379 83 799 295 480 67 238 94 718 144 875 30 47 67 1.9
Saint Helena3 2 2 2 3 2 2 43 39 49 -0.0
Senegal 2 923 6 313 19 910 4 591 8 235 13 023 39 43 60 0.7
Sierra Leone 1 344 2 456 5 893 2 698 3 749 4 402 33 40 57 0.9
Togo 1 083 2 760 8 404 2 705 4 233 6 117 29 39 58 1.3
ASIA 1 036 247 2 064 211 3 313 424 2 176 877 2 278 044 1 850 638 32 48 64 1.5
Eastern Asia 467 014 960 235 1 250 224 912 401 669 186 355 117 34 59 78 2.0
China4 308 167 758 360 1 049 948 857 262 635 424 335 029 26 54 76 2.4
China, Hong Kong SAR5 5 766 7 260 8 004 28 0 0 100 100 100 0
China, Macao SAR6 359 575 797 1 0 0 100 100 100 0
Dem. People’s Republic of Korea 11 790 15 195 19 507 8 404 9 832 7 569 58 61 72 0.2
Japan 94 546 118 136 105 784 27 703 8 864 2 546 77 93 98 0.6
Mongolia 1 246 2 052 3 181 938 829 572 57 71 85 1.3
Republic of Korea 31 732 40 778 44 709 11 240 8 734 6 325 74 82 88 0.1
Other non-specified areas 13 408 17 879 18 295 6 824 5 504 3 077 66 76 86 0.6
South-Central Asia7 338 429 635 510 1 260 028 903 305 1 201 245 1 138 152 27 35 53 1.2
Central Asia 22 347 26 372 46 417 27 740 38 901 39 737 45 40 54 0.0
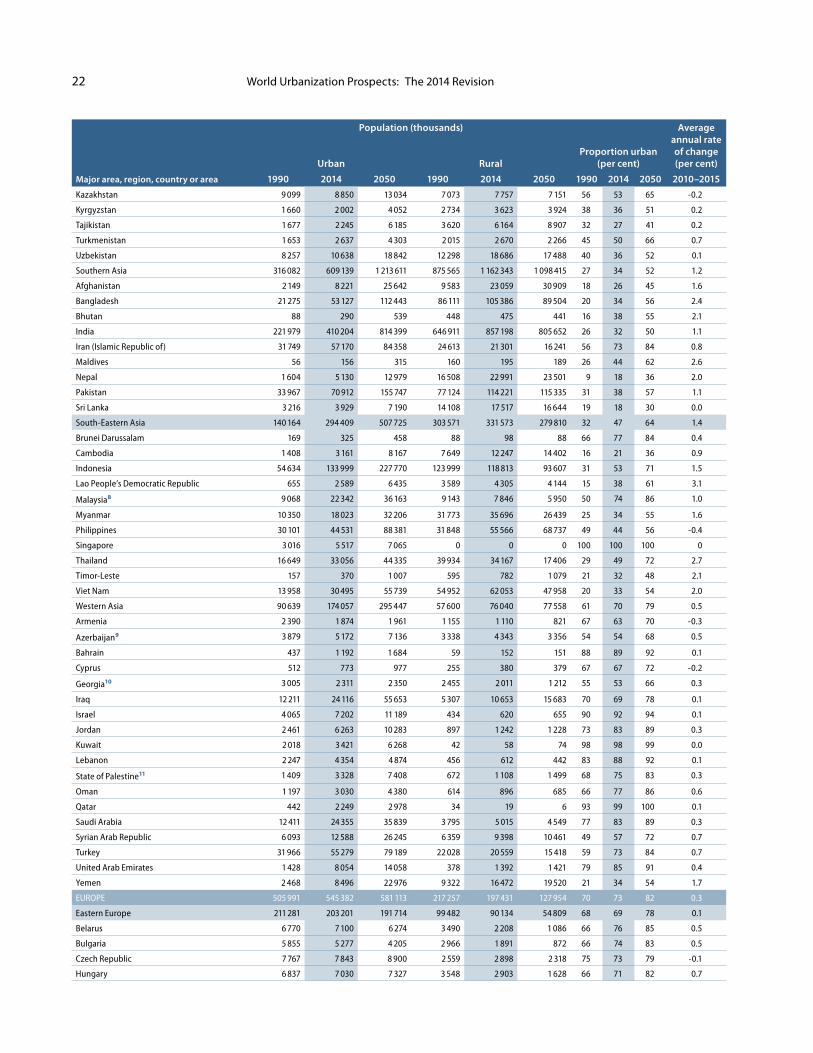
World Urbanization Prospects: The 2014 Revision22
Major area, region, country or area
Population (thousands)
Proportion urban (per cent)
Average annual rate of change (per cent)Urban Rural
1990 2014 2050 1990 2014 2050 1990 2014 2050 2010–2015
Kazakhstan 9 099 8 850 13 034 7 073 7 757 7 151 56 53 65 -0.2
Kyrgyzstan 1 660 2 002 4 052 2 734 3 623 3 924 38 36 51 0.2
Tajikistan 1 677 2 245 6 185 3 620 6 164 8 907 32 27 41 0.2
Turkmenistan 1 653 2 637 4 303 2 015 2 670 2 266 45 50 66 0.7
Uzbekistan 8 257 10 638 18 842 12 298 18 686 17 488 40 36 52 0.1
Southern Asia 316 082 609 139 1 213 611 875 565 1 162 343 1 098 415 27 34 52 1.2
Afghanistan 2 149 8 221 25 642 9 583 23 059 30 909 18 26 45 1.6
Bangladesh 21 275 53 127 112 443 86 111 105 386 89 504 20 34 56 2.4
Bhutan 88 290 539 448 475 441 16 38 55 2.1
India 221 979 410 204 814 399 646 911 857 198 805 652 26 32 50 1.1
Iran (Islamic Republic of) 31 749 57 170 84 358 24 613 21 301 16 241 56 73 84 0.8
Maldives 56 156 315 160 195 189 26 44 62 2.6
Nepal 1 604 5 130 12 979 16 508 22 991 23 501 9 18 36 2.0
Pakistan 33 967 70 912 155 747 77 124 114 221 115 335 31 38 57 1.1
Sri Lanka 3 216 3 929 7 190 14 108 17 517 16 644 19 18 30 0.0
South-Eastern Asia 140 164 294 409 507 725 303 571 331 573 279 810 32 47 64 1.4
Brunei Darussalam 169 325 458 88 98 88 66 77 84 0.4
Cambodia 1 408 3 161 8 167 7 649 12 247 14 402 16 21 36 0.9
Indonesia 54 634 133 999 227 770 123 999 118 813 93 607 31 53 71 1.5
Lao People’s Democratic Republic 655 2 589 6 435 3 589 4 305 4 144 15 38 61 3.1
Malaysia8 9 068 22 342 36 163 9 143 7 846 5 950 50 74 86 1.0
Myanmar 10 350 18 023 32 206 31 773 35 696 26 439 25 34 55 1.6
Philippines 30 101 44 531 88 381 31 848 55 566 68 737 49 44 56 -0.4
Singapore 3 016 5 517 7 065 0 0 0 100 100 100 0
Thailand 16 649 33 056 44 335 39 934 34 167 17 406 29 49 72 2.7
Timor-Leste 157 370 1 007 595 782 1 079 21 32 48 2.1
Viet Nam 13 958 30 495 55 739 54 952 62 053 47 958 20 33 54 2.0
Western Asia 90 639 174 057 295 447 57 600 76 040 77 558 61 70 79 0.5
Armenia 2 390 1 874 1 961 1 155 1 110 821 67 63 70 -0.3
Azerbaijan9 3 879 5 172 7 136 3 338 4 343 3 356 54 54 68 0.5
Bahrain 437 1 192 1 684 59 152 151 88 89 92 0.1
Cyprus 512 773 977 255 380 379 67 67 72 -0.2
Georgia10 3 005 2 311 2 350 2 455 2 011 1 212 55 53 66 0.3
Iraq 12 211 24 116 55 653 5 307 10 653 15 683 70 69 78 0.1
Israel 4 065 7 202 11 189 434 620 655 90 92 94 0.1
Jordan 2 461 6 263 10 283 897 1 242 1 228 73 83 89 0.3
Kuwait 2 018 3 421 6 268 42 58 74 98 98 99 0.0
Lebanon 2 247 4 354 4 874 456 612 442 83 88 92 0.1
State of Palestine11 1 409 3 328 7 408 672 1 108 1 499 68 75 83 0.3
Oman 1 197 3 030 4 380 614 896 685 66 77 86 0.6
Qatar 442 2 249 2 978 34 19 6 93 99 100 0.1
Saudi Arabia 12 411 24 355 35 839 3 795 5 015 4 549 77 83 89 0.3
Syrian Arab Republic 6 093 12 588 26 245 6 359 9 398 10 461 49 57 72 0.7
Turkey 31 966 55 279 79 189 22 028 20 559 15 418 59 73 84 0.7
United Arab Emirates 1 428 8 054 14 058 378 1 392 1 421 79 85 91 0.4
Yemen 2 468 8 496 22 976 9 322 16 472 19 520 21 34 54 1.7
EUROPE 505 991 545 382 581 113 217 257 197 431 127 954 70 73 82 0.3
Eastern Europe 211 281 203 201 191 714 99 482 90 134 54 809 68 69 78 0.1
Belarus 6 770 7 100 6 274 3 490 2 208 1 086 66 76 85 0.5
Bulgaria 5 855 5 277 4 205 2 966 1 891 872 66 74 83 0.5
Czech Republic 7 767 7 843 8 900 2 559 2 898 2 318 75 73 79 -0.1
Hungary 6 837 7 030 7 327 3 548 2 903 1 628 66 71 82 0.7
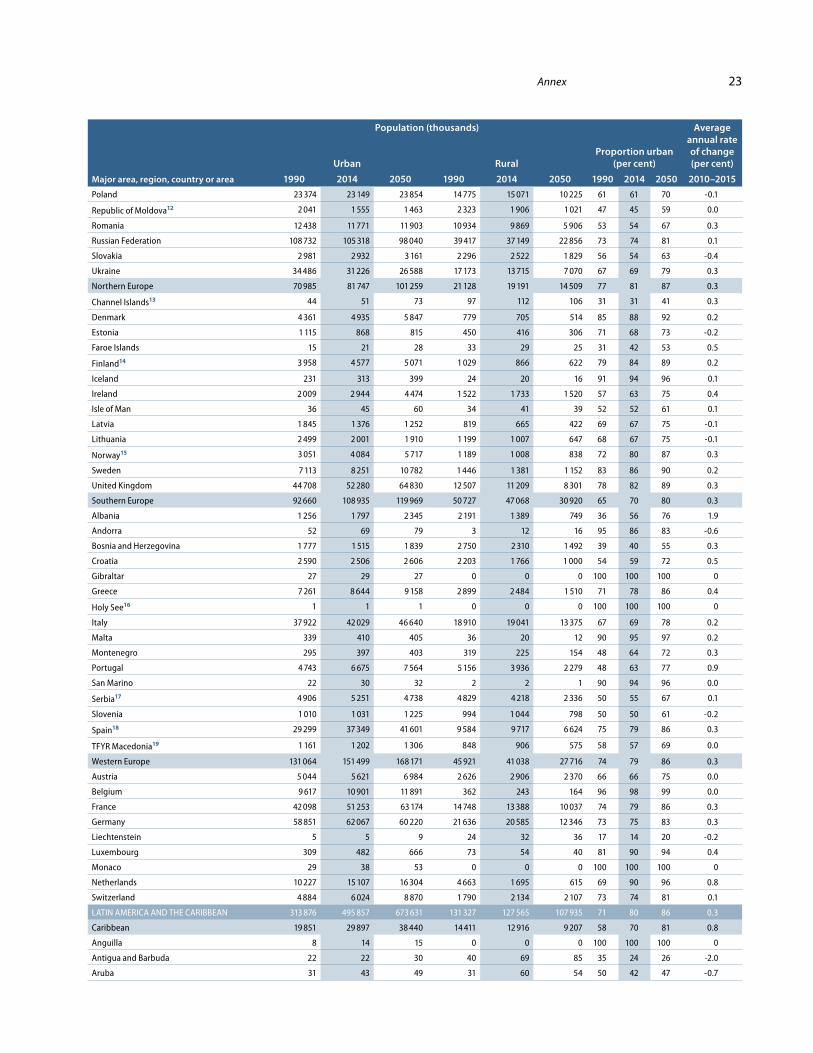
Annex 23
Major area, region, country or area
Population (thousands)
Proportion urban (per cent)
Average annual rate of change (per cent)Urban Rural
1990 2014 2050 1990 2014 2050 1990 2014 2050 2010–2015
Poland 23 374 23 149 23 854 14 775 15 071 10 225 61 61 70 -0.1
Republic of Moldova12 2 041 1 555 1 463 2 323 1 906 1 021 47 45 59 0.0
Romania 12 438 11 771 11 903 10 934 9 869 5 906 53 54 67 0.3
Russian Federation 108 732 105 318 98 040 39 417 37 149 22 856 73 74 81 0.1
Slovakia 2 981 2 932 3 161 2 296 2 522 1 829 56 54 63 -0.4
Ukraine 34 486 31 226 26 588 17 173 13 715 7 070 67 69 79 0.3
Northern Europe 70 985 81 747 101 259 21 128 19 191 14 509 77 81 87 0.3
Channel Islands13 44 51 73 97 112 106 31 31 41 0.3
Denmark 4 361 4 935 5 847 779 705 514 85 88 92 0.2
Estonia 1 115 868 815 450 416 306 71 68 73 -0.2
Faroe Islands 15 21 28 33 29 25 31 42 53 0.5
Finland14 3 958 4 577 5 071 1 029 866 622 79 84 89 0.2
Iceland 231 313 399 24 20 16 91 94 96 0.1
Ireland 2 009 2 944 4 474 1 522 1 733 1 520 57 63 75 0.4
Isle of Man 36 45 60 34 41 39 52 52 61 0.1
Latvia 1 845 1 376 1 252 819 665 422 69 67 75 -0.1
Lithuania 2 499 2 001 1 910 1 199 1 007 647 68 67 75 -0.1
Norway15 3 051 4 084 5 717 1 189 1 008 838 72 80 87 0.3
Sweden 7 113 8 251 10 782 1 446 1 381 1 152 83 86 90 0.2
United Kingdom 44 708 52 280 64 830 12 507 11 209 8 301 78 82 89 0.3
Southern Europe 92 660 108 935 119 969 50 727 47 068 30 920 65 70 80 0.3
Albania 1 256 1 797 2 345 2 191 1 389 749 36 56 76 1.9
Andorra 52 69 79 3 12 16 95 86 83 -0.6
Bosnia and Herzegovina 1 777 1 515 1 839 2 750 2 310 1 492 39 40 55 0.3
Croatia 2 590 2 506 2 606 2 203 1 766 1 000 54 59 72 0.5
Gibraltar 27 29 27 0 0 0 100 100 100 0
Greece 7 261 8 644 9 158 2 899 2 484 1 510 71 78 86 0.4
Holy See16 1 1 1 0 0 0 100 100 100 0
Italy 37 922 42 029 46 640 18 910 19 041 13 375 67 69 78 0.2
Malta 339 410 405 36 20 12 90 95 97 0.2
Montenegro 295 397 403 319 225 154 48 64 72 0.3
Portugal 4 743 6 675 7 564 5 156 3 936 2 279 48 63 77 0.9
San Marino 22 30 32 2 2 1 90 94 96 0.0
Serbia17 4 906 5 251 4 738 4 829 4 218 2 336 50 55 67 0.1
Slovenia 1 010 1 031 1 225 994 1 044 798 50 50 61 -0.2
Spain18 29 299 37 349 41 601 9 584 9 717 6 624 75 79 86 0.3
TFYR Macedonia19 1 161 1 202 1 306 848 906 575 58 57 69 0.0
Western Europe 131 064 151 499 168 171 45 921 41 038 27 716 74 79 86 0.3
Austria 5 044 5 621 6 984 2 626 2 906 2 370 66 66 75 0.0
Belgium 9 617 10 901 11 891 362 243 164 96 98 99 0.0
France 42 098 51 253 63 174 14 748 13 388 10 037 74 79 86 0.3
Germany 58 851 62 067 60 220 21 636 20 585 12 346 73 75 83 0.3
Liechtenstein 5 5 9 24 32 36 17 14 20 -0.2
Luxembourg 309 482 666 73 54 40 81 90 94 0.4
Monaco 29 38 53 0 0 0 100 100 100 0
Netherlands 10 227 15 107 16 304 4 663 1 695 615 69 90 96 0.8
Switzerland 4 884 6 024 8 870 1 790 2 134 2 107 73 74 81 0.1
LATIN AMERICA AND THE CARIBBEAN 313 876 495 857 673 631 131 327 127 565 107 935 71 80 86 0.3
Caribbean 19 851 29 897 38 440 14 411 12 916 9 207 58 70 81 0.8
Anguilla 8 14 15 0 0 0 100 100 100 0
Antigua and Barbuda 22 22 30 40 69 85 35 24 26 -2.0
Aruba 31 43 49 31 60 54 50 42 47 -0.7
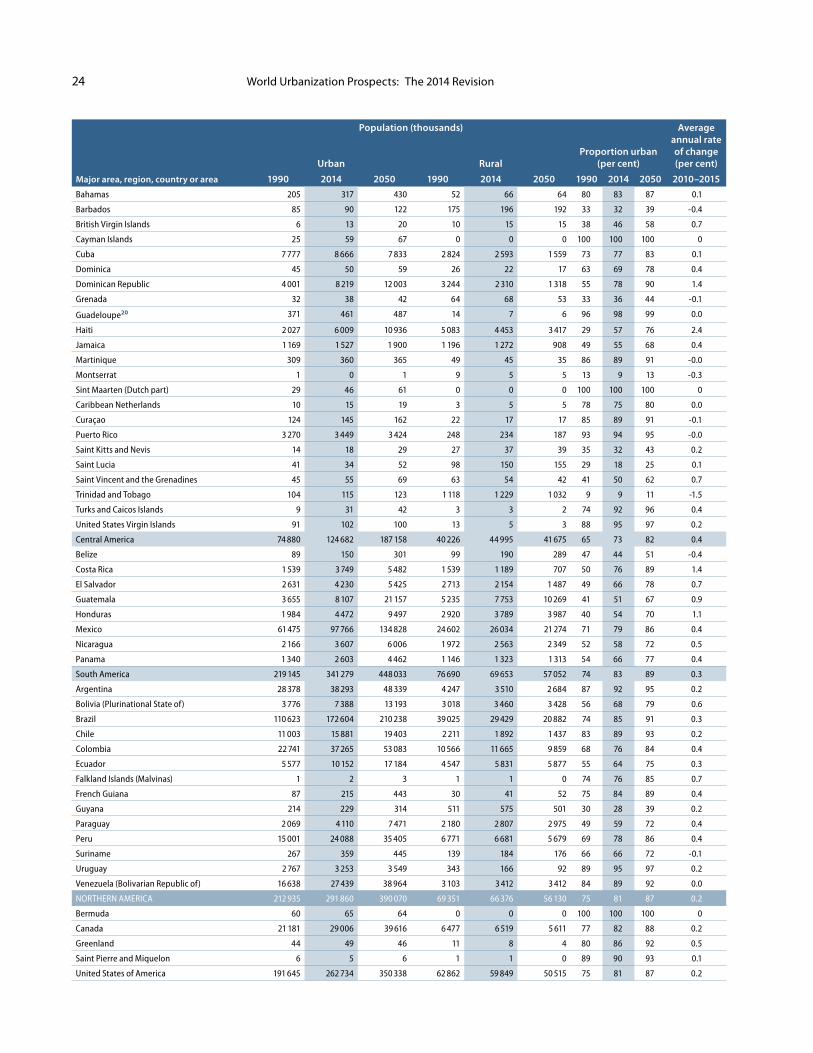
World Urbanization Prospects: The 2014 Revision24
Major area, region, country or area
Population (thousands)
Proportion urban (per cent)
Average annual rate of change (per cent)Urban Rural
1990 2014 2050 1990 2014 2050 1990 2014 2050 2010–2015
Bahamas 205 317 430 52 66 64 80 83 87 0.1
Barbados 85 90 122 175 196 192 33 32 39 -0.4
British Virgin Islands 6 13 20 10 15 15 38 46 58 0.7
Cayman Islands 25 59 67 0 0 0 100 100 100 0
Cuba 7 777 8 666 7 833 2 824 2 593 1 559 73 77 83 0.1
Dominica 45 50 59 26 22 17 63 69 78 0.4
Dominican Republic 4 001 8 219 12 003 3 244 2 310 1 318 55 78 90 1.4
Grenada 32 38 42 64 68 53 33 36 44 -0.1
Guadeloupe20 371 461 487 14 7 6 96 98 99 0.0
Haiti 2 027 6 009 10 936 5 083 4 453 3 417 29 57 76 2.4
Jamaica 1 169 1 527 1 900 1 196 1 272 908 49 55 68 0.4
Martinique 309 360 365 49 45 35 86 89 91 -0.0
Montserrat 1 0 1 9 5 5 13 9 13 -0.3
Sint Maarten (Dutch part) 29 46 61 0 0 0 100 100 100 0
Caribbean Netherlands 10 15 19 3 5 5 78 75 80 0.0
Curaçao 124 145 162 22 17 17 85 89 91 -0.1
Puerto Rico 3 270 3 449 3 424 248 234 187 93 94 95 -0.0
Saint Kitts and Nevis 14 18 29 27 37 39 35 32 43 0.2
Saint Lucia 41 34 52 98 150 155 29 18 25 0.1
Saint Vincent and the Grenadines 45 55 69 63 54 42 41 50 62 0.7
Trinidad and Tobago 104 115 123 1 118 1 229 1 032 9 9 11 -1.5
Turks and Caicos Islands 9 31 42 3 3 2 74 92 96 0.4
United States Virgin Islands 91 102 100 13 5 3 88 95 97 0.2
Central America 74 880 124 682 187 158 40 226 44 995 41 675 65 73 82 0.4
Belize 89 150 301 99 190 289 47 44 51 -0.4
Costa Rica 1 539 3 749 5 482 1 539 1 189 707 50 76 89 1.4
El Salvador 2 631 4 230 5 425 2 713 2 154 1 487 49 66 78 0.7
Guatemala 3 655 8 107 21 157 5 235 7 753 10 269 41 51 67 0.9
Honduras 1 984 4 472 9 497 2 920 3 789 3 987 40 54 70 1.1
Mexico 61 475 97 766 134 828 24 602 26 034 21 274 71 79 86 0.4
Nicaragua 2 166 3 607 6 006 1 972 2 563 2 349 52 58 72 0.5
Panama 1 340 2 603 4 462 1 146 1 323 1 313 54 66 77 0.4
South America 219 145 341 279 448 033 76 690 69 653 57 052 74 83 89 0.3
Argentina 28 378 38 293 48 339 4 247 3 510 2 684 87 92 95 0.2
Bolivia (Plurinational State of) 3 776 7 388 13 193 3 018 3 460 3 428 56 68 79 0.6
Brazil 110 623 172 604 210 238 39 025 29 429 20 882 74 85 91 0.3
Chile 11 003 15 881 19 403 2 211 1 892 1 437 83 89 93 0.2
Colombia 22 741 37 265 53 083 10 566 11 665 9 859 68 76 84 0.4
Ecuador 5 577 10 152 17 184 4 547 5 831 5 877 55 64 75 0.3
Falkland Islands (Malvinas) 1 2 3 1 1 0 74 76 85 0.7
French Guiana 87 215 443 30 41 52 75 84 89 0.4
Guyana 214 229 314 511 575 501 30 28 39 0.2
Paraguay 2 069 4 110 7 471 2 180 2 807 2 975 49 59 72 0.4
Peru 15 001 24 088 35 405 6 771 6 681 5 679 69 78 86 0.4
Suriname 267 359 445 139 184 176 66 66 72 -0.1
Uruguay 2 767 3 253 3 549 343 166 92 89 95 97 0.2
Venezuela (Bolivarian Republic of) 16 638 27 439 38 964 3 103 3 412 3 412 84 89 92 0.0
NORTHERN AMERICA 212 935 291 860 390 070 69 351 66 376 56 130 75 81 87 0.2
Bermuda 60 65 64 0 0 0 100 100 100 0
Canada 21 181 29 006 39 616 6 477 6 519 5 611 77 82 88 0.2
Greenland 44 49 46 11 8 4 80 86 92 0.5
Saint Pierre and Miquelon 6 5 6 1 1 0 89 90 93 0.1
United States of America 191 645 262 734 350 338 62 862 59 849 50 515 75 81 87 0.2
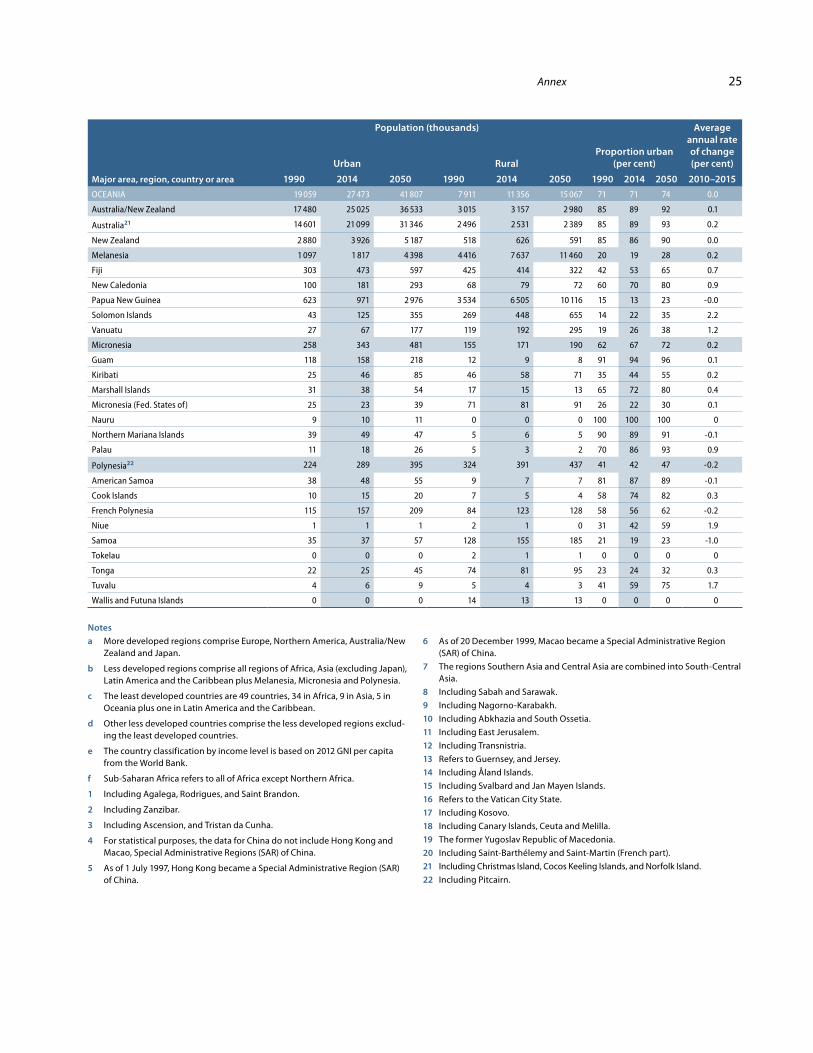
Annex 25
Major area, region, country or area
Population (thousands)
Proportion urban (per cent)
Average annual rate of change (per cent)Urban Rural
1990 2014 2050 1990 2014 2050 1990 2014 2050 2010–2015
OCEANIA 19 059 27 473 41 807 7 911 11 356 15 067 71 71 74 0.0
Australia/New Zealand 17 480 25 025 36 533 3 015 3 157 2 980 85 89 92 0.1
Australia21 14 601 21 099 31 346 2 496 2 531 2 389 85 89 93 0.2
New Zealand 2 880 3 926 5 187 518 626 591 85 86 90 0.0
Melanesia 1 097 1 817 4 398 4 416 7 637 11 460 20 19 28 0.2
Fiji 303 473 597 425 414 322 42 53 65 0.7
New Caledonia 100 181 293 68 79 72 60 70 80 0.9
Papua New Guinea 623 971 2 976 3 534 6 505 10 116 15 13 23 -0.0
Solomon Islands 43 125 355 269 448 655 14 22 35 2.2
Vanuatu 27 67 177 119 192 295 19 26 38 1.2
Micronesia 258 343 481 155 171 190 62 67 72 0.2
Guam 118 158 218 12 9 8 91 94 96 0.1
Kiribati 25 46 85 46 58 71 35 44 55 0.2
Marshall Islands 31 38 54 17 15 13 65 72 80 0.4
Micronesia (Fed. States of) 25 23 39 71 81 91 26 22 30 0.1
Nauru 9 10 11 0 0 0 100 100 100 0
Northern Mariana Islands 39 49 47 5 6 5 90 89 91 -0.1
Palau 11 18 26 5 3 2 70 86 93 0.9
Polynesia22 224 289 395 324 391 437 41 42 47 -0.2
American Samoa 38 48 55 9 7 7 81 87 89 -0.1
Cook Islands 10 15 20 7 5 4 58 74 82 0.3
French Polynesia 115 157 209 84 123 128 58 56 62 -0.2
Niue 1 1 1 2 1 0 31 42 59 1.9
Samoa 35 37 57 128 155 185 21 19 23 -1.0
Tokelau 0 0 0 2 1 1 0 0 0 0
Tonga 22 25 45 74 81 95 23 24 32 0.3
Tuvalu 4 6 9 5 4 3 41 59 75 1.7
Wallis and Futuna Islands 0 0 0 14 13 13 0 0 0 0
Notes
a More developed regions comprise Europe, Northern America, Australia/New Zealand and Japan.
b Less developed regions comprise all regions of Africa, Asia (excluding Japan), Latin America and the Caribbean plus Melanesia, Micronesia and Polynesia.
c The least developed countries are 49 countries, 34 in Africa, 9 in Asia, 5 in Oceania plus one in Latin America and the Caribbean.
d Other less developed countries comprise the less developed regions exclud-ing the least developed countries.
e The country classification by income level is based on 2012 GNI per capita from the World Bank.
f Sub-Saharan Africa refers to all of Africa except Northern Africa.
1 Including Agalega, Rodrigues, and Saint Brandon.
2 Including Zanzibar.
3 Including Ascension, and Tristan da Cunha.
4 For statistical purposes, the data for China do not include Hong Kong and Macao, Special Administrative Regions (SAR) of China.
5 As of 1 July 1997, Hong Kong became a Special Administrative Region (SAR) of China.
6 As of 20 December 1999, Macao became a Special Administrative Region (SAR) of China.
7 The regions Southern Asia and Central Asia are combined into South-Central Asia.
8 Including Sabah and Sarawak.
9 Including Nagorno-Karabakh.
10 Including Abkhazia and South Ossetia.
11 Including East Jerusalem.
12 Including Transnistria.
13 Refers to Guernsey, and Jersey.
14 Including Åland Islands.
15 Including Svalbard and Jan Mayen Islands.
16 Refers to the Vatican City State.
17 Including Kosovo.
18 Including Canary Islands, Ceuta and Melilla.
19 The former Yugoslav Republic of Macedonia.
20 Including Saint-Barthélemy and Saint-Martin (French part).
21 Including Christmas Island, Cocos Keeling Islands, and Norfolk Island.
22 Including Pitcairn.
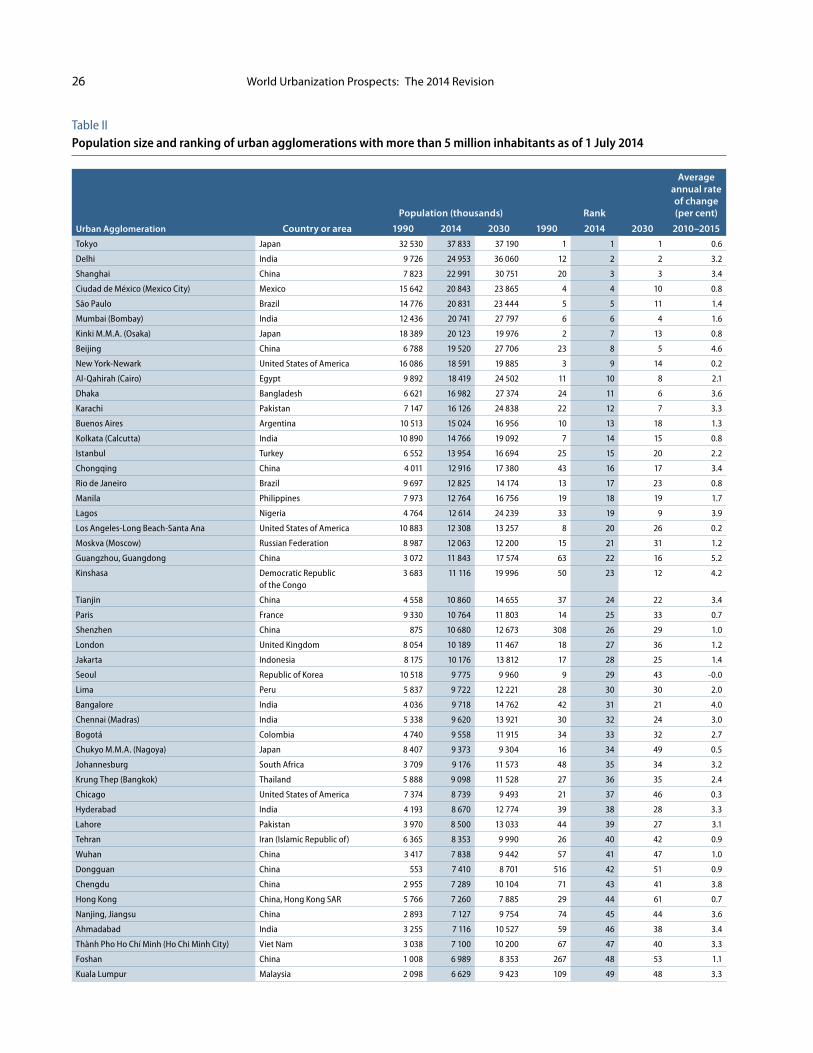
World Urbanization Prospects: The 2014 Revision26
Table IIPopulation size and ranking of urban agglomerations with more than 5 million inhabitants as of 1 July 2014
Population (thousands) Rank
Average annual rate of change (per cent)
Urban Agglomeration Country or area 1990 2014 2030 1990 2014 2030 2010–2015
Tokyo Japan 32 530 37 833 37 190 1 1 1 0.6
Delhi India 9 726 24 953 36 060 12 2 2 3.2
Shanghai China 7 823 22 991 30 751 20 3 3 3.4
Ciudad de México (Mexico City) Mexico 15 642 20 843 23 865 4 4 10 0.8
São Paulo Brazil 14 776 20 831 23 444 5 5 11 1.4
Mumbai (Bombay) India 12 436 20 741 27 797 6 6 4 1.6
Kinki M.M.A. (Osaka) Japan 18 389 20 123 19 976 2 7 13 0.8
Beijing China 6 788 19 520 27 706 23 8 5 4.6
New York-Newark United States of America 16 086 18 591 19 885 3 9 14 0.2
Al-Qahirah (Cairo) Egypt 9 892 18 419 24 502 11 10 8 2.1
Dhaka Bangladesh 6 621 16 982 27 374 24 11 6 3.6
Karachi Pakistan 7 147 16 126 24 838 22 12 7 3.3
Buenos Aires Argentina 10 513 15 024 16 956 10 13 18 1.3
Kolkata (Calcutta) India 10 890 14 766 19 092 7 14 15 0.8
Istanbul Turkey 6 552 13 954 16 694 25 15 20 2.2
Chongqing China 4 011 12 916 17 380 43 16 17 3.4
Rio de Janeiro Brazil 9 697 12 825 14 174 13 17 23 0.8
Manila Philippines 7 973 12 764 16 756 19 18 19 1.7
Lagos Nigeria 4 764 12 614 24 239 33 19 9 3.9
Los Angeles-Long Beach-Santa Ana United States of America 10 883 12 308 13 257 8 20 26 0.2
Moskva (Moscow) Russian Federation 8 987 12 063 12 200 15 21 31 1.2
Guangzhou, Guangdong China 3 072 11 843 17 574 63 22 16 5.2
Kinshasa Democratic Republic of the Congo
3 683 11 116 19 996 50 23 12 4.2
Tianjin China 4 558 10 860 14 655 37 24 22 3.4
Paris France 9 330 10 764 11 803 14 25 33 0.7
Shenzhen China 875 10 680 12 673 308 26 29 1.0
London United Kingdom 8 054 10 189 11 467 18 27 36 1.2
Jakarta Indonesia 8 175 10 176 13 812 17 28 25 1.4
Seoul Republic of Korea 10 518 9 775 9 960 9 29 43 -0.0
Lima Peru 5 837 9 722 12 221 28 30 30 2.0
Bangalore India 4 036 9 718 14 762 42 31 21 4.0
Chennai (Madras) India 5 338 9 620 13 921 30 32 24 3.0
Bogotá Colombia 4 740 9 558 11 915 34 33 32 2.7
Chukyo M.M.A. (Nagoya) Japan 8 407 9 373 9 304 16 34 49 0.5
Johannesburg South Africa 3 709 9 176 11 573 48 35 34 3.2
Krung Thep (Bangkok) Thailand 5 888 9 098 11 528 27 36 35 2.4
Chicago United States of America 7 374 8 739 9 493 21 37 46 0.3
Hyderabad India 4 193 8 670 12 774 39 38 28 3.3
Lahore Pakistan 3 970 8 500 13 033 44 39 27 3.1
Tehran Iran (Islamic Republic of) 6 365 8 353 9 990 26 40 42 0.9
Wuhan China 3 417 7 838 9 442 57 41 47 1.0
Dongguan China 553 7 410 8 701 516 42 51 0.9
Chengdu China 2 955 7 289 10 104 71 43 41 3.8
Hong Kong China, Hong Kong SAR 5 766 7 260 7 885 29 44 61 0.7
Nanjing, Jiangsu China 2 893 7 127 9 754 74 45 44 3.6
Ahmadabad India 3 255 7 116 10 527 59 46 38 3.4
Thành Pho Ho Chí Minh (Ho Chi Minh City) Viet Nam 3 038 7 100 10 200 67 47 40 3.3
Foshan China 1 008 6 989 8 353 267 48 53 1.1
Kuala Lumpur Malaysia 2 098 6 629 9 423 109 49 48 3.3
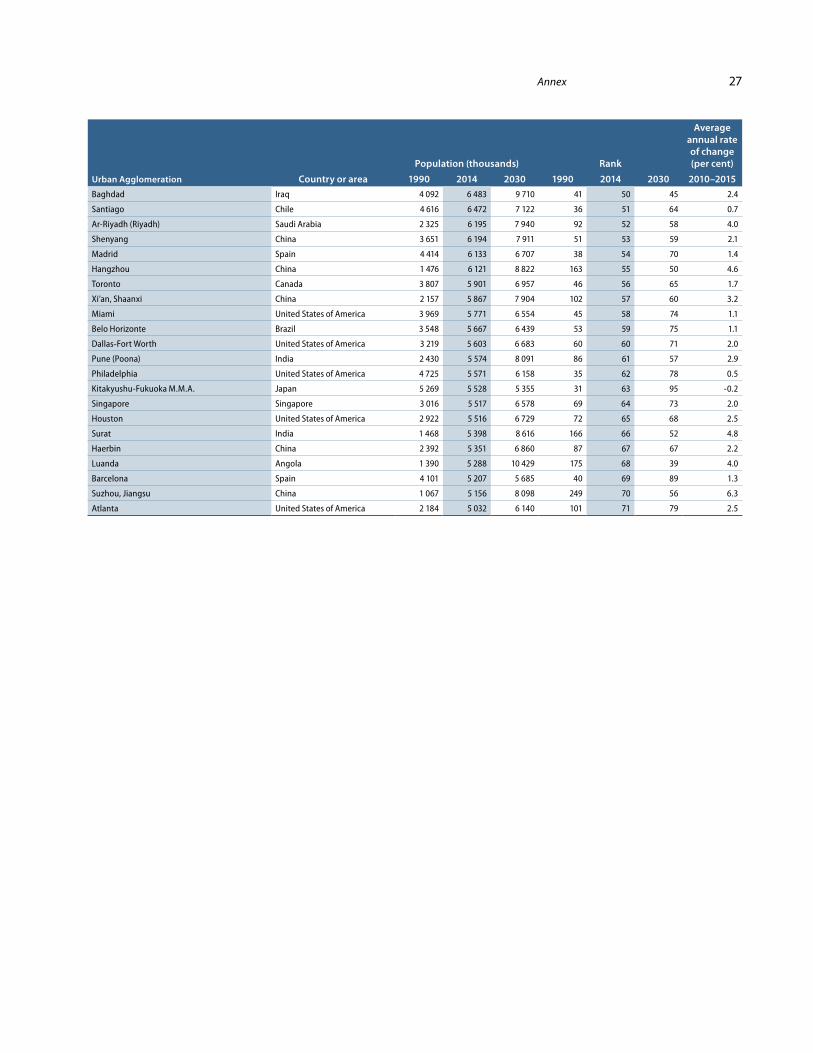
Annex 27
Population (thousands) Rank
Average annual rate of change (per cent)
Urban Agglomeration Country or area 1990 2014 2030 1990 2014 2030 2010–2015
Baghdad Iraq 4 092 6 483 9 710 41 50 45 2.4
Santiago Chile 4 616 6 472 7 122 36 51 64 0.7
Ar-Riyadh (Riyadh) Saudi Arabia 2 325 6 195 7 940 92 52 58 4.0
Shenyang China 3 651 6 194 7 911 51 53 59 2.1
Madrid Spain 4 414 6 133 6 707 38 54 70 1.4
Hangzhou China 1 476 6 121 8 822 163 55 50 4.6
Toronto Canada 3 807 5 901 6 957 46 56 65 1.7
Xi’an, Shaanxi China 2 157 5 867 7 904 102 57 60 3.2
Miami United States of America 3 969 5 771 6 554 45 58 74 1.1
Belo Horizonte Brazil 3 548 5 667 6 439 53 59 75 1.1
Dallas-Fort Worth United States of America 3 219 5 603 6 683 60 60 71 2.0
Pune (Poona) India 2 430 5 574 8 091 86 61 57 2.9
Philadelphia United States of America 4 725 5 571 6 158 35 62 78 0.5
Kitakyushu-Fukuoka M.M.A. Japan 5 269 5 528 5 355 31 63 95 -0.2
Singapore Singapore 3 016 5 517 6 578 69 64 73 2.0
Houston United States of America 2 922 5 516 6 729 72 65 68 2.5
Surat India 1 468 5 398 8 616 166 66 52 4.8
Haerbin China 2 392 5 351 6 860 87 67 67 2.2
Luanda Angola 1 390 5 288 10 429 175 68 39 4.0
Barcelona Spain 4 101 5 207 5 685 40 69 89 1.3
Suzhou, Jiangsu China 1 067 5 156 8 098 249 70 56 6.3
Atlanta United States of America 2 184 5 032 6 140 101 71 79 2.5
14-0
4178
ISBN 978-92-1-123195-3
Accurate, consistent and timely data on global trends in urbanization and city growth are critical for assessing current and future needs with respect to urban growth and for setting policy priorities to promote inclusive and equitable urban and rural development. This report presents the highlights of the 2014 Revision of World Urbanization Prospects, which contains the latest estimates of the urban and rural populations of 233 countries or areas from 1950 to 2014 and projections to 2050, as well as estimates of population size from 1950 to 2014 and projections to 2030 for all urban agglomerations with 300,000 inhabitants or more in 2014.