wp 2008-4 theisen cpad 080811 cpadcipotato.org/wp-content/uploads/2014/08/004343.pdf · iv abstract...
TRANSCRIPT

ISSN 0256-8748Social SciencesWorking PaperNo. 2008 - 4
Wo
rkin
g P
aper
200
8-4
Implementing CIP’s Vision:Impact targeting
Kelly Theisen, ConsultantGraham Thiele, International Potato Center (CIP)

ii
3
Inte
rna
tio
na
l P
ota
to C
en
ter
• W
ork
ing
Pa
pe
r 1
Wo
rkin
g P
aper
Implementing CIP’s Vision:
Impact targeting
Kelly Theisen, ConsultantGraham Thiele, International Potato Center (CIP)

4
Inte
rna
tio
na
l P
ota
to C
en
ter
• W
ork
ing
Pa
pe
r 1
© International Potato Center (CIP), 2008
ISSN 0256-8748
CIP publications contribute important development information to thepublic arena. Readers are encouraged to quote or reproduce materialfrom them in their own publications. As copyright holder CIP requestsacknowledgement, and a copy of the publication where the citationor material appears. Please send a copy to the Communication andPublic Awareness Department at the address below.
International Potato CenterP.O.Box 1558, Lima 12, [email protected] • www.cipotato.org
Produced by the CIP Communication and PublicAwareness Department (CPAD)
Correct citation:Theisen, K. and Thiele, G. 2008. Implementing CIP’s Vision: Impacttargeting. International Potato Center (CIP), Lima, Peru. Social SciencesWorking Paper 2008-4. 24 p.
Production CoordinatorCecilia Lafosse
Design and LayoutElena Taipe and contributions from Graphic Arts
Printed in Peru by Comercial Gráfica SucrePress run: 250August 2008
Implementing CIP’s Vision:Impact targeting
The Social Sciences Working Paper Series is intended to advance social science knowledge about production and utili-zation of potato, sweetpotato, and root and tuber crops in developing countries to encourage debate and exchange ofideas. The views expressed in the papers are those of the author(s) and do not necessarily reflect the official position ofthe International Potato Center.
Comments are invited.

iii
Table of Contents Background................................................................................................................................................................. 1 Composite Indicators of Livelihood.................................................................................................................... 2 Per Capita Crop Indicators ..................................................................................................................................... 6 Areas of High Priority .............................................................................................................................................18 Further Applications ..............................................................................................................................................21 Data Sources.............................................................................................................................................................22 References .................................................................................................................................................................24 List of Tables Table 1. Classification of livelihood indicators ............................................................................................... 3 Table 2. Determination of composite livelihood scores ............................................................................. 5 Table 3. Countries by composite livelihood scores ...................................................................................... 6 Table 4. Potato production per capita ............................................................................................................13 Table 5. Sweetpotato production per capita................................................................................................16 List of Maps Map 1. Population by livelihood indicators ..................................................................................................................4 Map 2. Population by per capita potato production .................................................................................12 Map 3. Population by per capita sweetpotato production .....................................................................12 Map 4. Population by priority for potato .......................................................................................................19 Map 5. Population by priority for sweetpotato............................................................................................19
9

iv
Abstract
This study reports an updated targeting exercise to identify priority populations of the world for
CIP’s commodity research, combining indicators of livelihood and the importance of the two
crops of principal concern to CIP, potato and sweetpotato. Indicators of livelihood are
determined by a composite of several factors – including income, nutritional status, and mortality
rates of children and of mothers during pregnancy or childbirth – as reported by the United
Nations’ Millennium Development Goals. The importance of each crop is estimated by
production per capita. The exercise is applied to populations of nations and sub-national areas, to
the extent that relevant data are available, as displayed by accompanying maps and tables.

I M P L E M E N T I N G C I P ’ S V I S S I O N : I M P A C T T A R G E T I N G 1
Implementing CIP’s Vision: Impact targeting
BACKGROUND
In 2003-04 the International Potato Center (Centro Internacional de la Papa, CIP) conducted a
Vision Exercise which proposed a major realignment of the Center’s research program to address
the Millennium Development Goals (MDGs) for reducing poverty (CIP, 2004). Part of this exercise
included a global targeting analysis using indicators of livelihoods in areas where potato or
sweetpotato is an important crop.
The objectives of the targeting exercise were:
• To identify the regions of the world where increasing potato and sweetpotato
productivity is most likely to enhance the livelihoods of the most disadvantaged
people, and
• To examine the multiple dimensions of livelihood in order to establish priorities by a
wider set of poverty indicators, including not only income-based measures, but also
indicators such as malnutrition, child mortality and maternal mortality.
Similar targeting exercises linking commodities with poverty maps at different scales of
geographic resolution have been conducted by other CGIAR centers (Byerlee, 2000, Bigman and
Loevinson 2003, and Bellon, 2005).
The analysis reported in this paper extends the 2004 exercise by combining the MDG livelihood
measures used in 2004 into a more robust composite indicator for each country, and by utilizing
more spatially refined data of potato and sweetpotato production, classified according to
production per capita. Although the use of the composite indicator helps guide overall alignment
of CIP’s research program, specific indicators can be more appropriate for targeting particular
technologies or interventions, e.g. distribution of Vitamin A deficiency to guide the release of
newly developed orange-fleshed sweetpotato varieties rich in beta-carotene.

C I P • S O C I A L S C I E N C E S W O R K I N G P A P E R 2 0 0 8 - 4
2 I M P L E M E N T I N G C I P ’ S V I S I O N : I M P A C T T A R G E T I N G
COMPOSITE INDICATORS OF LIVELIHOOD
Indicators used by the initial impact targeting analysis have been retained, but updated. They
include:
• Income: the percentage of the population with incomes below US$1 per day, adjusted to
purchasing power parity (PPP), a widely cited and internationally comparable indicator
useful for global analysis
• Malnutrition: the percentage of a population classified as chronically malnourished,
based on estimates of the amount of food available in each country and a measure of
inequality in distribution derived from household income and expenditure surveys
• Child Mortality: the number of children who die before reaching five years of age, per
1,000 live births annually
• Maternal Mortality: the number of women who die during pregnancy or childbirth per
100,000 live births.
All data are provided by the United Nations Millennium Development Goals Indicators. (See
“Data Sources” for more information about specific data tables.) For consistency of presentation,
all data have been converted to percentages in this updated analysis.
In order to provide a comprehensive measure of livelihood which can be displayed on one global
map, each of the original four indicators has been classified into six categories, “0” to “5.”
Composite country scores also range from “0” (highest indicator of livelihood, of lowest priority to
CIP) to “5” (lowest indicator, and highest priority to CIP). Scores for livelihood indicators are
determined for each percentage class of the relevant population (Table 1).
Classification of each of the four indicators is determined primarily by natural breaks, where
differences are greatest between adjacent observations. Since the entire population of any
country is assigned the same value for an indicator, it is not feasible to classify countries by
quantiles, so that each class would contain a roughly equivalent number of people. Much of the
world’s population of highest priority to CIP is contained in only two countries, China and India.

C I P • S O C I A L S C I E N C E S W O R K I N G P A P E R 2 0 0 8 - 4
I M P L E M E N T I N G C I P ’ S V I S I O N : I M P A C T T A R G E T I N G
3
Table 1. Classification of livelihood indicators.
Income Below US$1 (Percent of Population): Malnutrition (Percent of Population):
• Above 40: 5 • Above 40 5
• 20 – 40: 4 • 26 – 40: 4
• 10 – 19: 3 • 15 – 25: 3
• 3 – 9: 2 • 6 – 14: 2
• 2: 1 • 3 – 5: 1
• Below 2: 0 • Below 3: 0
Child Mortality (Percent of Live Births): Maternal Mortality (Percent of Live Births):
• Above 14.9: 5 • Above 0.880: 5
• 8.1 – 14.9: 4 • 0.301 – 0.880: 4
• 4.6 – 8.0: 3 • 0.141 – 0.300: 3
• 2.0 – 4.5: 2 • 0.051 – 0.140: 2
• 1.5 – 1.9: 1 • 0.030 – 0.050: 1
• Below 1.5: 0 • Below 0.030: 0
The income (percent of population) data value of “2,” which is scored as a livelihood indicator of
“1,” is consistent with MDG reporting. That specific value is assigned by the MDG classification to
several countries where income poverty is relatively low (e.g. Chile and Estonia). Wealthier
countries not included in the MDG poverty report are classified as “Below 2” (e.g. Japan and the
United Kingdom) and are scored as “0.”
A composite score for a country is generally based on the sum of the scores of the four indicators,
with a highest possible sum of 20 where all four indicators are reported. However, if one indicator
is strongly divergent from the average, the higher score(s) is given greater weight. This provision
is intended to account for the possibility that an indicator is either inaccurately reported or is not
locally relevant. If, for example, the four livelihood indicators for a country are reported as “0,” “1,”
“4,” and “5,” the higher scores (indicating lower livelihood) would be more heavily weighted.
Nigeria, for example, is reported at a very high 70.8 percent of the population living at a daily
income of less than US$1, but a much lower nine percent chronically malnourished. This wide
disparity of data is especially doubtful considering that Nigeria’s population is estimated to be 44
percent urban (PRB), and thus likely to be cash-dependant for subsistence needs. A classification
based only on nutritional status would therefore incorrectly label Nigeria as a lower priority
country. In this case, the income score is effectively given greater weight.

C I P • S O C I A L S C I E N C E S W O R K I N G P A P E R 2 0 0 8 - 4
4 I M P L E M E N T I N G C I P ’ S V I S I O N : I M P A C T T A R G E T I N G
A single indicator can be essentially correct, but nevertheless provide an incomplete account of
poverty. Although the US$1 per day indicator is widely used for global comparative analysis, it is
not always equally relevant across regions. Several countries report low levels of poverty based
on the US$1 indicator, but significantly higher scores on other indicators. Armenia, for example,
reports two percent of the population living below the US$1 level (for a score of “1,”), while 29
percent is reported as chronically malnourished (for a score of “4”).
The four indicators are not available for every country. Where the data set is incomplete,
reporting three or fewer of the four indicators, the final composite country score is based on
those which are reported. In these cases, the higher scores are weighted still more heavily, to
account for the possibility that the factors indicating lowest livelihood conditions are those least
likely to be reported.
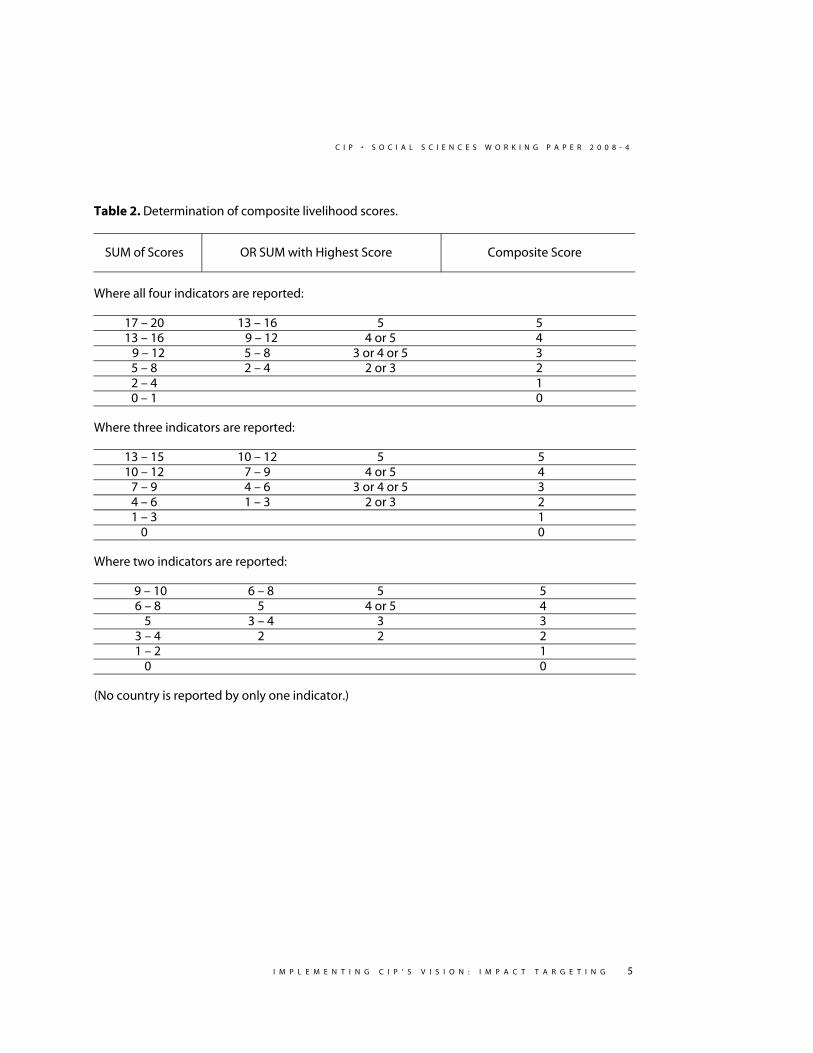
Composite livelihood scores, by country, are determined as indicated in Table 2. Data of all
countries with a population over 500,000 people and a composite rating above “0” are included
in Table 3 and displayed by Map 1: Population by Livelihood Indicators.
Map 1.Population by
livelihood indicators.
C I P • S O C I A L S C I E N C E S W O R K I N G P A P E R 2 0 0 8 - 4
I M P L E M E N T I N G C I P ’ S V I S I O N : I M P A C T T A R G E T I N G
5
Table 2. Determination of composite livelihood scores.
SUM of Scores OR SUM with Highest Score Composite Score
Where all four indicators are reported:
17 – 20 13 – 16 5 5 13 – 16 9 – 12 4 or 5 4 9 – 12 5 – 8 3 or 4 or 5 3
5 – 8 2 – 4 2 or 3 2 2 – 4 1 0 – 1 0
Where three indicators are reported:
13 – 15 10 – 12 5 5 10 – 12 7 – 9 4 or 5 4
7 – 9 4 – 6 3 or 4 or 5 3 4 – 6 1 – 3 2 or 3 2 1 – 3 1
0 0
Where two indicators are reported:
9 – 10 6 – 8 5 5 6 – 8 5 4 or 5 4
5 3 – 4 3 3 3 – 4 2 2 2 1 – 2 1
0 0
(No country is reported by only one indicator.)

C I P • S O C I A L S C I E N C E S W O R K I N G P A P E R 2 0 0 8 - 4
6 I M P L E M E N T I N G C I P ’ S V I S I O N : I M P A C T T A R G E T I N G
Table 3. Countries by composite livelihood scores.
Includes all rated above "0" with a population above 500,000
Sums of
Ratings by
Country Income Below
US$1 Malnutrition Under-Five
Mortality Maternal Mortality
Number of Values
Reported Composite
Value Rating Value Rating Value Rating Value Rating (2) (3) (4) Score Afghanistan 25.7 5 1.900 5 10 5 Albania 2 1 6 2 1.8 1 0.055 2 6 2 Algeria 2 1 5 1 3.9 2 0.140 2 6 2 Angola 38 4 26 5 1.700 5 14 5 Argentina 7 2 2.5 0 1.8 1 0.082 2 5 2 Armenia 2 1 29 4 2.9 2 0.055 2 9 4 Azerbaijan 4 2 10 2 8.9 4 0.094 2 10 4 Bangladesh 41 5 30 4 7.3 3 0.380 4 16 5 Belarus 2 1 3 1 1.2 0 0.035 1 3 1 Benin 31 4 14 2 15 5 0.850 4 15 5 Bhutan 7.5 3 0.420 4 7 4 Bolivia 23 4 23 3 6.5 3 0.420 4 14 4 Bosnia- Herz. 9 2 1.5 1 0.031 1 4 2 Botswana 30 4 12 4 0.100 2 10 4 Brazil 7 2 8 2 3.3 2 0.260 3 9 3 Brunei 3 1 0.9 0 0.037 1 2 1 Bulgaria 2 1 9 2 1.5 1 0.032 1 5 2 Burkina Faso 27 4 17 3 19.1 5 1.000 5 17 5 Burundi 54 5 67 5 19 5 1.000 5 20 5 Cambodia 34 4 33 4 14.3 4 0.450 4 16 4 Cameroon 17 3 25 3 14.9 4 0.730 4 14 4 Cape Verde 3.5 2 0.150 3 5 3 Central African Rep. 45 5 19.3 5 1.100 5 15 5 Chad 33 4 20.8 5 1.100 5 14 5 Chile 2 1 4 1 1 0 0.031 1 3 1 China 10 3 12 2 2.7 2 0.056 2 9 3 Colombia 7 2 14 2 2.1 2 0.130 2 8 2 Comoros 62 5 7.1 3 0.480 4 12 5 Congo, DRC 72 5 21 5 0.990 5 15 5 Congo, Rep. 34 4 10.8 4 0.510 4 12 4 Costa Rica 3 2 4 1 1.2 0 0.043 1 4 2 Cote d'Ivoire 15 3 14 2 19.5 5 0.690 4 14 5 Croatia 2 1 7 2 0.7 0 0.008 0 3 2 Cuba 2.5 0 0.7 0 0.033 1 1 1 Cyprus 2 0 0.5 0 0.047 1 1 1 Djibouti 26 4 13.3 4 0.730 4 12 4 Dominican Rep. 3 2 27 4 3.1 2 0.150 3 11 4 Ecuador 18 3 5 1 2.5 2 0.130 2 8 3 Egypt 3 2 3 1 3.3 2 0.084 2 7 2 El Salvador 19 3 11 2 2.7 2 0.150 3 10 3 Equat. Guinea 20.5 5 0.880 4 9 5 Eritrea 73 5 7.8 3 0.630 4 12 5 Estonia 2 1 3 1 0.7 0 0.063 2 4 2 Ethiopia 23 4 46 5 16.4 5 0.850 4 18 5 Fiji 4 1 1.8 1 0.075 2 4 2 Gabon 5 1 9.1 4 0.420 4 9 4
(continued)

C I P • S O C I A L S C I E N C E S W O R K I N G P A P E R 2 0 0 8 - 4
I M P L E M E N T I N G C I P ’ S V I S I O N : I M P A C T T A R G E T I N G
7
Table 3. Countries by composite livelihood scores (continued).
Includes all rated above "0" with a population above 500,000
Sums of
Ratings by
Country Income Below
US$1 Malnutrition Under-Five
Mortality Maternal Mortality
Number of Values
Reported Composite
Value Rating Value Rating Value Rating Value Rating (2) (3) (4) Score Gambia 59 5 27 4 13.7 4 0.540 4 17 5 Georgia 6 2 13 2 4.5 2 0.032 1 7 2 Ghana 49 5 12 2 11.2 4 0.540 4 15 5 Guatemala 13 3 23 3 4.3 2 0.240 3 11 3 Guinea 24 3 15 5 0.740 4 12 5 Guinea-Bissau 37 4 20 5 1.100 5 14 5 Guyana 2 1 9 2 6.3 3 0.170 3 9 3 Haiti 54 5 47 5 12 4 0.680 4 18 5 Honduras 15 3 22 3 4 2 0.110 2 10 3 India 34 4 20 3 7.4 3 0.540 4 14 4 Indonesia 8 2 6 2 3.6 2 0.230 3 9 3 Iran 2 1 4 1 3.6 2 0.076 2 6 2 Iraq 31 4 12.5 4 0.250 3 11 4 Jamaica 2 1 10 2 2 2 0.087 2 7 2 Jordan 2 1 7 2 2.6 2 0.041 1 6 2 Kazakhstan 2 1 8 2 7.3 3 0.210 3 9 3 Kenya 23 4 31 4 12 4 1.000 5 17 5 Korea, DPR 35 4 5.5 3 0.650 4 11 4 Kyrgyzstan 2 1 4 1 6.7 3 0.110 2 7 3 Laos 27 4 21 3 7.9 3 0.650 4 14 4 Latvia 2 1 3 1 1.1 0 0.042 1 3 1 Lebanon 3 1 3 2 0.150 3 6 3 Lesotho 12 2 13.2 4 0.550 4 10 4 Liberia 49 5 23.5 5 0.760 4 14 5 Libya 2.5 0 1.9 1 0.097 2 3 2 Macedonia 2 1 7 2 0.023 0 3 2 Madagascar 61 5 34 4 11.9 4 0.550 4 17 5 Malawi 21 4 24 3 12.5 4 1.800 5 16 5 Malaysia 2 1 3 1 1.2 0 0.041 1 3 1 Mali 36 4 28 4 21.8 5 1.200 5 18 5 Mauritania 26 4 10 2 12.5 4 1.000 5 15 5 Mauritius 6 2 1.5 1 0.024 0 3 2 Mexico 3 2 5 1 2.7 2 0.083 2 7 2 Moldova 11 2 0.036 1 3 2 Mongolia 11 3 28 4 4.9 3 0.110 2 12 4 Morocco 2 1 6 2 4 2 0.220 3 8 3 Mozambique 38 4 45 5 14.5 4 1.000 5 18 5 Myanmar 5 1 10.5 4 0.360 4 9 4 Namibia 23 3 6.2 3 0.300 3 9 3 Nepal 23 4 17 3 7.4 3 0.740 4 14 4 Nicaragua 45 5 27 4 3.7 2 0.230 3 14 5 Niger 60 5 32 4 25.6 5 1.600 5 19 5 Nigeria 71 5 9 2 19.4 5 0.800 4 16 5 Oman 1.2 0 0.087 2 2 2 Pakistan 17 3 23 3 9.9 4 0.500 4 14 4 Palestine (Occupied) 16 3 2.3 2 0.100 2 7 3 Panama 7 2 25 3 2.4 2 0.160 3 10 3
(continued)

C I P • S O C I A L S C I E N C E S W O R K I N G P A P E R 2 0 0 8 - 4
8 I M P L E M E N T I N G C I P ’ S V I S I O N : I M P A C T T A R G E T I N G
Table 3. Countries by composite livelihood scores (continued).
Includes all rated above "0" with a population above 500,000
Sums of
Ratings by
Country Income Below
US$1 Malnutrition Under-Five
Mortality Maternal Mortality
Number of Values
Reported Composite
Value Rating Value Rating Value Rating Value Rating (2) (3) (4) Score Papua New Guinea 13 2 7.4 3 0.300 3 8 3 Paraguay 13 3 15 3 2.3 2 0.170 3 11 3 Peru 11 3 12 2 2.7 2 0.410 4 11 4 Philippines 15 3 19 3 3.3 2 0.200 3 11 3 Romania 2 1 2.5 0 1.9 1 0.049 1 3 1 Russian Federation 2 1 3 1 1.8 1 0.067 2 5 2 Rwanda 60 5 36 4 20.3 5 1.400 5 19 5 Saudi Arabia 4 1 0.023 0 1 1 Senegal 17 3 23 3 13.6 4 0.690 4 14 4 Serbia-Montenegro 10 2 1.5 1 0.011 0 3 2 Sierra Leone 50 5 28.2 5 2.000 5 15 5 Slovakia 2 1 6 2 0.8 0 0.003 0 3 2 Slovenia 2 1 3 1 0.4 0 0.017 0 2 1 Somalia 22.5 5 1.100 5 10 5 South Africa 11 3 6.8 3 0.230 3 9 3 Sri Lanka 6 2 22 3 1.4 0 0.092 2 7 3 Sudan 27 4 9 4 0.590 4 12 4 Suriname 10 2 3.9 2 0.110 2 6 2 Swaziland 19 3 16 5 0.370 4 12 5 Syria 4 1 1.5 1 0.160 3 5 3 Tajikistan 7 2 61 5 1.1 0 0.100 2 9 4 Tanzania 58 5 44 5 12.2 4 1.500 5 19 5 Thailand 2 1 21 3 2.1 2 0.044 1 7 3 Timor-Leste 8 2 6.1 3 0.660 4 9 4 Togo 25 3 13.9 4 0.570 4 11 4 Trinidad-Tobago 11 2 1.9 1 0.160 3 6 3 Tunisia 2 1 2.5 0 2.4 2 0.120 2 5 2 Turkey 3 2 3 1 2.9 2 0.070 2 7 2 Turkmenistan 8 2 10.4 4 0.031 1 7 4 Uganda 58 5 19 3 13.6 4 0.880 4 16 5 Ukraine 2 1 3 1 1.7 1 0.035 1 4 1 United Arab Emirates 2.5 0 0.9 0 0.054 2 2 2 Uruguay 2 1 3 1 1.5 1 0.027 0 3 1 Uzbekistan 2 1 26 4 6.8 3 0.024 0 8 3 Venezuela 19 3 18 3 2.1 2 0.096 2 10 3 Viet Nam 17 3 1.9 1 0.130 2 6 3 Yemen 16 3 37 4 10.2 4 0.570 4 15 4 Zambia 76 5 47 5 18.2 5 0.750 4 19 5 Zimbabwe 45 5 13.2 4 1.100 5 14 5

C I P • S O C I A L S C I E N C E S W O R K I N G P A P E R 2 0 0 8 - 4
I M P L E M E N T I N G C I P ’ S V I S I O N : I M P A C T T A R G E T I N G
9
PER CAPITA CROP INDICATORS
Indicators of the importance of potato and sweetpotato were derived in the 2004 targeting study
by an analysis of both crop production and land use at the national level, except for China, India,
and Russia, where sub-national data were utilized. Since the initial study, CIP has further
investigated potato and sweetpotato crops within high-priority nations using more detailed sub-
national data wherever possible. Several nations of highest priority to CIP are included as
chapters in the World Potato Atlas (WPA) and the World Sweetpotato Atlas (WSA), where more
detailed information is available. (See Data Sources.)
Utilizing more complete and current crop and population data, the updated targeting study is
more directly based on the importance of each crop relative to the local population. In some
areas of the world, potato and sweetpotato crops are essential to the livelihoods of a moderately
high concentration of people, while in other areas they are less essential, but still very important
for subsistence and income generation to a great many. Here the local importance of each crop is
displayed relative to population, not to land, classified according to production in kilograms per
capita for a given area.
Production per capita is presented as a globally relevant indicator of the local importance of each
crop, but it is a highly generalized indicator. Both crops serve various local roles. Potato crops
provide an essential staple in fresh form to millions of people throughout the world. However,
the rapid growth of potato production in Asia over the past several decades has been driven to a
large extent by market forces, as much of the crop is consumed as a vegetable or in processed
forms by people in urban areas. Sweetpotato presents an even more complex picture, as the crop
is of enormous importance as a direct source of nutrition in some areas of the world, especially
the more humid areas of Africa, but is being developed for other purposes elsewhere. In China,
which produces roughly eighty percent of the world’s crop (FAOSTAT), sweetpotato is becoming
less important as a direct source of food, but is vitally important as animal feed (especially for
pigs) and is being developed as a raw material for several industrial products, such as starch and
alcohol (WSA, China).
Some countries can be adequately represented by a single value of production per capita, but
where there is considerable variability within a country, finer estimates based on additional
sources are used wherever possible. In most cases, these estimates are reported by agencies of
the respective government and are consistent with FAO data. In a few countries, the analysis is
based on more detailed crop surveys which are not consistent with FAO. (Examples include

C I P • S O C I A L S C I E N C E S W O R K I N G P A P E R 2 0 0 8 - 4
10 I M P L E M E N T I N G C I P ’ S V I S I O N : I M P A C T T A R G E T I N G
Cameroon and Ethiopia for potato, Mozambique for sweetpotato, and Malawi for both crops. See
“Cropping Data Notes by Selected Countries” for more details.)
More specific reasons for representing a country by a single per capita value, or several, are
indicated below.
1. One value is displayed for the entire country, for one of four reasons, with examples:
1A . The crop is produced for countrywide consumption.
Potato might be cultivated in a few areas of intensive production, as in the United States,
but it is widely marketed and consumed within the country (and in some cases exported
internationally). One value of average per capita potato production for the entire
country is therefore appropriate. Other countries within this category for potato include
Canada, Japan, Australia, and all countries of Western and Central Europe.
1B. The distributions of people and crops generally coincide.
The crop might be produced either for local consumption or for commercial markets, but
crops and people are generally concentrated in the same areas, so that the local
importance of the crop is likely to be fairly consistent across populations within the
country. Examples include potato in most countries of Central Asia and North Africa, and
sweetpotato in Papua New Guinea.
1C. Within-country data are not complete or reliable.
This category includes countries where sufficient and reliable data are not available to
estimate variable per-capita production. Russia is an obvious example for potato, where
production data are available only for the entire country. Several countries in Africa are
likewise assigned to this category for either or both crops.
1D. The country is very small in area and/or population.
Given the limitations of cartographic display for a global map, one value is reported for
small countries, e.g. potato in Bhutan and sweetpotato in Haiti.
2. Values are displayed at variable rates within the country for one of two reasons:
2A. The crop is produced for a mix of distant markets and local consumption.
In these countries, demand for the crop by urban populations is often a factor of
growing importance, but the local importance of the crop (as reflected in marketing
and/or consumption) is highest in areas of high production, often far from population
centers. Estimates have been made based on the literature for each country, especially
those included as atlas chapters. Annual per capita use of potato by people living in
major cities of Asia is generally estimated to be around 20 kilograms. For people living in

C I P • S O C I A L S C I E N C E S W O R K I N G P A P E R 2 0 0 8 - 4
I M P L E M E N T I N G C I P ’ S V I S I O N : I M P A C T T A R G E T I N G
11
major cities of Latin America, per capita potato consumption is typically 50 to 60
kilograms. Countries in this category include, for potato: China, India, Turkey, Morocco,
South Africa, Kenya, and all countries with a significant potato crop in South and Central
America. For sweetpotato, Viet Nam and China are both examples of this category,
although to the extent that sweetpotato is utilized less as a direct source of food and
more for other uses as noted above, the importance of the crop would become less
localized and more consistent across each country.
2B. Production is mostly for local consumption and/or local markets.
Where a crop is significant, but rarely travels far after harvest, per capita production is
estimated from the best available within-country data of production and population.
Potato or sweetpotato might be a very important crop in one region of a country and
unknown elsewhere, accounting for per capita production values as low as zero in some
cases. Countries in this category include nearly all of Sub-Saharan Africa, e.g. Ethiopia
and Cameroon for potato, and Angola and Mozambique for sweetpotato.
To estimate values of production per capita, population data provided by the Environmental
Systems Research Institute (ESRI, the creator of ArcGIS/ ArcMap software) have in many cases
been revised, usually upwards, based on a consensus of other sources, including the Population
Reference Bureau (PRB), United Nations data reported by the Food and Agriculture Organization
(FAOSTAT), and Population Statistics (Populstat). (See “Data Sources” for links.)
A summary of these data is provided for potato in Table 4 and for sweetpotato in Table 5. The
data are displayed relative to global population density for potato in Map 2 and for sweetpotato
in Map 3.

C I P • S O C I A L S C I E N C E S W O R K I N G P A P E R 2 0 0 8 - 4
12 I M P L E M E N T I N G C I P ’ S V I S I O N : I M P A C T T A R G E T I N G
Map 3.Population by per capitasweetpotato production.
Map 2.Population by per capita
potato production.

C I P • S O C I A L S C I E N C E S W O R K I N G P A P E R 2 0 0 8 - 4
I M P L E M E N T I N G C I P ’ S V I S I O N : I M P A C T T A R G E T I N G
13
Table 4. Potato production per capita (in kilograms).
Country Category Average Range
Afghanistan 2A 4 - 12
Albania 1D 52
Algeria 1B 61
Angola * 2B 0 - 87
Argentina 2A 30 - 127
Armenia * 1D 184
Australia 1A 61
Austria 1A 84
Azerbaijan 1D 118
Bangladesh * 2A 18 - 38
Belarus 1B 904
Belgium-Luxembourg 1A 277
Bolivia * 2A 20 - 125
Bosnia-Herzegovina 1D 116
Brazil 2A 3 - 35
Bulgaria 1B 56
Burundi * No Data
Cameroon * 2B 0 - 77
Canada 1A 154
Chad 2B 0 - 7
Chile 2A 45 - 105
China * 2A 11 - 170
Colombia * 2A 10 - 134
Costa Rica 1D 15
Croatia 1D 85
Cuba 1A 27
Cyprus 1D 154
Czech Republic 1A 88
Denmark 1A 281
Dominican Republic 2A 0 - 9
Includes all potato-producing countries with a population above 500,000 Data for most countries provided by FAO, values averaged 2004 – 2006 Other data sources are utilized for countries marked with an asterisk (*). (continued)

C I P • S O C I A L S C I E N C E S W O R K I N G P A P E R 2 0 0 8 - 4
14 I M P L E M E N T I N G C I P ’ S V I S I O N : I M P A C T T A R G E T I N G
Table 4. Potato production per capita (in kilograms) (continued).
Country Category Average Range
Ecuador * 2A 10 - 116
Egypt 1B 34
Eritrea 2B 0 - 16
Estonia 1D 136
Ethiopia * 2B 0 - 62
Finland 1A 122
France 1A 110
Georgia 1D 73
Germany 1A 140
Greece 1A 86
Guatemala 2A 8 - 65
Hungary 1A 65
India * 2A 15 - 105
Indonesia 2A 3 - 9
Iran 2A 41 - 115
Iraq 2A 15 - 70
Ireland 1A 102
Israel 1A 80
Italy 1A 30
Japan 1A 22
Jordan 1B 30
Kazakhstan 1B 156
Kenya * 2A 5 - 40
Korea, South 1A 14
Korea, North 1C 88
Kyrgyzstan 1B 240
Laos 2B 0 - 25
Latvia 1D 265
Lebanon 1D 133
Lesotho 1D 17
Libya 1B 33
Includes all potato-producing countries with a population above 500,000 Data for most countries provided by FAO, values averaged 2004 – 2006 Other data sources are utilized for countries marked with an asterisk (*). (continued)

C I P • S O C I A L S C I E N C E S W O R K I N G P A P E R 2 0 0 8 - 4
I M P L E M E N T I N G C I P ’ S V I S I O N : I M P A C T T A R G E T I N G
15
Table 4. Potato production per capita (in kilograms) (continued).
Country Category Average Range
Lithuania 1D 192
Macedonia 1D 93
Madagascar 2B 0 - 24
Malawi * 1B 23
México 2A 5 – 42
Moldova 1D 84
Mongolia 1B 35
Morocco 2A 11 - 69
Mozambique 2B 0 - 16
Myanmar * 2B 0 - 70
Nepal * 1B 65
Netherlands 1A 424
New Zealand 1A 118
Nigeria * 2B 0 - 38
Norway 1A 78
Pakistan * 2A 5 - 16
Papua New Guinea * No Data
Peru * 2A 28 - 277
Philippines 2A 0 - 6
Poland 1B 284
Portugal 1A 62
Romania 1B 166
Russian Federation 1C 264
Rwanda * 2B 18 - 368
Saudi Arabia 1A 8
Serbia-Montenegro 1B 98
Slovakia 1B 60
Slovenia 1B 66
South Africa 2A 21 - 115
Spain 1A 58
Sudan 1C 6
Includes all potato-producing countries with a population above 500,000 Data for most countries provided by FAO, values averaged 2004 – 2006 Other data sources are utilized for countries marked with an asterisk (*).
(continued)
C I P • S O C I A L S C I E N C E S W O R K I N G P A P E R 2 0 0 8 - 4
16 I M P L E M E N T I N G C I P ’ S V I S I O N : I M P A C T T A R G E T I N G
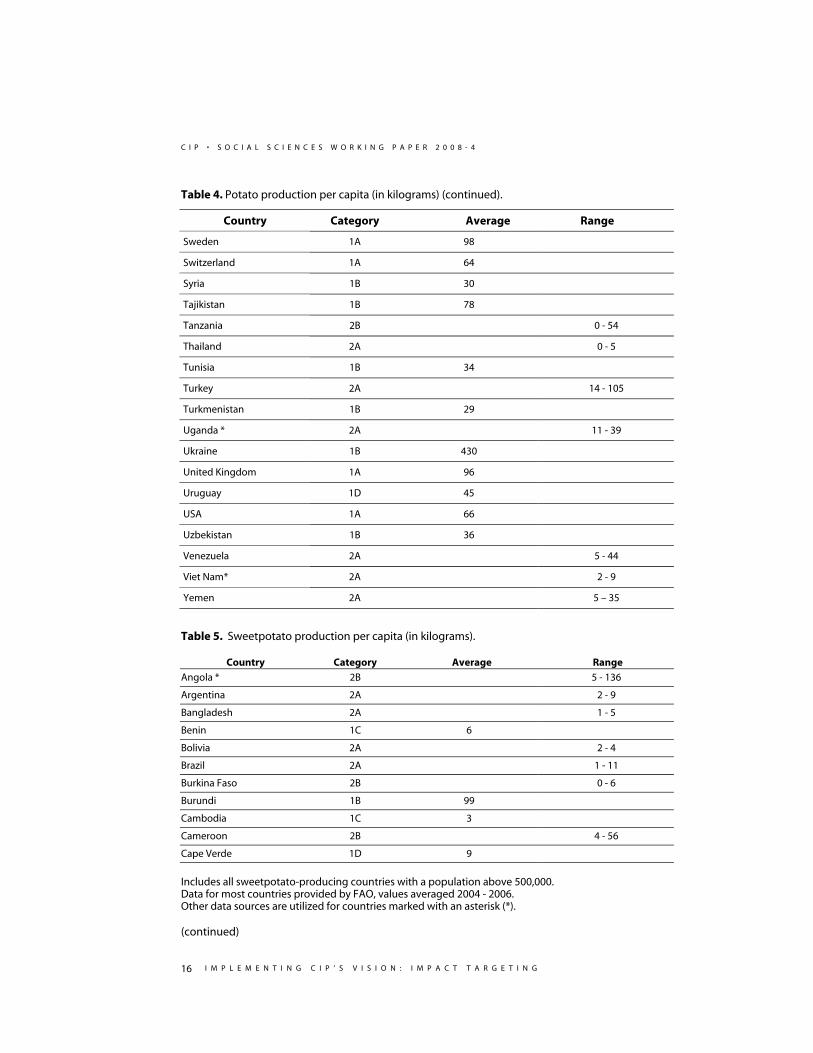
Table 4. Potato production per capita (in kilograms) (continued).
Country Category Average Range
Sweden 1A 98
Switzerland 1A 64
Syria 1B 30
Tajikistan 1B 78
Tanzania 2B 0 - 54
Thailand 2A 0 - 5
Tunisia 1B 34
Turkey 2A 14 - 105
Turkmenistan 1B 29
Uganda * 2A 11 - 39
Ukraine 1B 430
United Kingdom 1A 96
Uruguay 1D 45
USA 1A 66
Uzbekistan 1B 36
Venezuela 2A 5 - 44
Viet Nam* 2A 2 - 9
Yemen 2A 5 – 35
Table 5. Sweetpotato production per capita (in kilograms).
Country Category Average Range
Angola * 2B 5 - 136
Argentina 2A 2 - 9
Bangladesh 2A 1 - 5
Benin 1C 6
Bolivia 2A 2 - 4
Brazil 2A 1 - 11
Burkina Faso 2B 0 - 6
Burundi 1B 99
Cambodia 1C 3
Cameroon 2B 4 - 56
Cape Verde 1D 9 Includes all sweetpotato-producing countries with a population above 500,000. Data for most countries provided by FAO, values averaged 2004 - 2006. Other data sources are utilized for countries marked with an asterisk (*). (continued)

C I P • S O C I A L S C I E N C E S W O R K I N G P A P E R 2 0 0 8 - 4
I M P L E M E N T I N G C I P ’ S V I S I O N : I M P A C T T A R G E T I N G
17
Table 5. Sweetpotato production per capita (in kilograms) (continued).
Country Category Average Range
Central African Republic No Data
Chad 2B 0 - 10
China * 2A 0 - 95
Comoros 1D 7
Congo, Republic of No Data
Congo, DRC 2B 0 - 12
Cote d'Ivoire 1C 4
Cuba 1A 42
Dominican Republic 1C 4
Ecuador 2A 1 - 4
Egypt 1B 4
Equatorial Guinea 1D 69
Ethiopia 2B 0 - 37
Fiji 1D 7
Gabon 1C 3
Gambia No Data
Ghana 1C 4
Guinea 1C 23
Guinea Bissau No Data
Guyana 1C 3
Haiti 1C 20
India 2A 1 - 9
Indonesia 2A 2 - 135
Jamaica 1C 9
Japan 1A 8
Kenya 2A 0 - 54
Korea, North No Data
Korea, South 1A 6
Laos 1B 31
Liberia 1C 6
Madagascar * 2B 9 - 105
Malawi * 1B 210
Malaysia 1C 1
Mali 1C 0 - 6
Mauritania 1C 0 - 1
Mexico 2A 4 - 7
Includes all sweetpotato-producing countries with a population above 500,000. Data for most countries provided by FAO, values averaged 2004 - 2006. Other data sources are utilized for countries marked with an asterisk (*). (continued)

C I P • S O C I A L S C I E N C E S W O R K I N G P A P E R 2 0 0 8 - 4
18 I M P L E M E N T I N G C I P ’ S V I S I O N : I M P A C T T A R G E T I N G
Table 5. Sweetpotato production per capita (in kilograms) (continued).
Country Category Average Range
Morocco 2A 0 - 1
Mozambique * 2B 8 - 116
Myanmar 1C 1
New Zealand 1A 5
Niger 2B 0 - 7
Nigeria 1C 24
Papua New Guinea 1B 86
Paraguay 1B 23
Peru 2A 3 - 9
Philippines 1B 7
Portugal 1A 2
Rwanda * 2B 34 - 150
Senegal 2B 0 - 19
Sierra Leone 2B 5 - 8
South Africa 2A 0 - 5
Sri Lanka 1C 2
Sudan No Data
Swaziland 1C 2
Tanzania 2B 2 - 57
Togo No Data
Uganda * 2A 52 - 104
USA 1A 2
Uruguay 1D 20
Viet Nam * 1B 19
Zambia 1C 5 Includes all sweetpotato-producing countries with a population above 500,000. Data for most countries provided by FAO, values averaged 2004 - 2006. Other data sources are utilized for countries marked with an asterisk (*).
AREAS OF HIGH PRIORITY
Areas of highest priority to CIP, determined by a combination of livelihood indicators and the
importance of each crop, are displayed in Map 4 and Map 5. Areas characterized by lowest
priority (“0” values) for either factor are not displayed. Areas rated “1” through “5” in both factors
have been classified into one of 25 possible combinations, the most important overall being
those where livelihood indicators are most severe, and the crop is locally very important. On both
maps, areas displayed in vivid red or orange are those of overall highest priority.

C I P • S O C I A L S C I E N C E S W O R K I N G P A P E R 2 0 0 8 - 4
I M P L E M E N T I N G C I P ’ S V I S I O N : I M P A C T T A R G E T I N G
19
Map 4. Population by priority for potato.
Map 5. Population by priority for sweetpotato.

C I P • S O C I A L S C I E N C E S W O R K I N G P A P E R 2 0 0 8 - 4
20 I M P L E M E N T I N G C I P ’ S V I S I O N : I M P A C T T A R G E T I N G
The countries identified by the initial CIP Vision study generally remain those of highest priority in
this updated study, but analysis at a finer geographic scale can reveal large populations of high
priority that would be obscured by data reported only at the country level. For example, potato is
generally a minor crop in Cameroon, in most areas not cultivated at all. However, in the western
highlands, home to over six million people, per capita production ranges from around fifty to
over seventy kilograms (WPA, Cameroon). Likewise, sweetpotato is generally a minor crop in
Ethiopia, where national per capita production is estimated at five kilograms (FAO). The only
extensive area suited to sweetpotato is the southwest, characterized by lower altitude and higher
precipitation. For a population of roughly eleven to twelve million people in this part of the
country, sweetpotato is cultivated at an estimated annual rate of over 30 kilograms per capita.
Considering the degree of poverty which characterizes this region, a finer geographic scale
reveals a population of high priority.
For potato, areas of high priority include, with a few examples:
• Higher altitude areas of several countries of Sub-Saharan Africa (Ethiopia, Cameroon,
Kenya, Rwanda, Uganda, Tanzania, Malawi, Angola, Mozambique, and Madagascar).
• Andean South America (Bolivia, Peru, Ecuador, and Colombia).
• The Indo-Gangetic basin of southern Asia (Bangladesh, India, Nepal, and Pakistan).
• China, with high production found in several interior provinces.
• Central and western Asia (Tajikistan, Kyrgyzstan).
• The Caucasus region (Armenia, Azerbaijan).
For sweetpotato, areas include:
• Humid areas of several countries of southern, central and western coastal Africa
(Madagascar, Angola, Mozambique, Rwanda, Uganda, Ethiopia, and Nigeria).
• Lower altitude areas of central and southern China, where most of the world’s
crop is grown.
Several areas of Central Africa rank very high for both crops (though not usually in the same
immediate zone) and are among those which also score highest in priority for livelihood
indicators. They include: Rwanda, Uganda, the Kivu District of Democratic Republic of the Congo,
and areas of Tanzania, Kenya, Ethiopia, Mozambique, Angola, and Madagascar.

C I P • S O C I A L S C I E N C E S W O R K I N G P A P E R 2 0 0 8 - 4
I M P L E M E N T I N G C I P ’ S V I S I O N : I M P A C T T A R G E T I N G
21
In addition to better identifying populations of high priority at a finer scale, sub-national
mapping can also reveal areas where data quality is doubtful, typically where sharp transitions
conform to administrative boundaries absent other geographic factors. In China, for example, the
coastal province of Fujian is reported to be a high producer of potato, but very little production is
reported from adjacent provinces. It is possible that Fujian is over-reported, or that other areas
are under-reported, or that some combination of both factors occurs.
FURTHER APPLICATIONS
Since this analysis is global and therefore highly generalized, it can provide only a first step toward
identifying populations of high priority to CIP in respect to either potato or sweetpotato. However,
by utilizing more refined and reliable data as they become available, CIP is better able to identify
populations where either or both crops are locally important. This effort can be extended and
refined via the use of Geographic Information Systems, utilizing data provided by more complete
surveys and by more technically advanced methods, such as remote sensing where feasible.
Refining this global approach to identify populations of high priority, CIP’s research attempts to
address specific aspects of poverty for people in geographically well-defined areas of greatest
need. One clear example is CIP’s role as a partner in the Vitamin A for Africa (VITAA) project,
directing research to develop sweetpotato varieties which are rich in beta-carotene, used by the
body to synthesize Vitamin A, and with high dry matter content and other agronomic
characteristics sought by farmers in many of the poorest regions of Africa.
This study is limited to reported production data of potato and sweetpotato, however tentative
such data often are. What has yet to be considered is the unmet potential for either crop to
provide an important role in food security and economic development in areas which are
physically suitable for either crop, but where effective research services and other infrastructure
are not available. For example, potato could be a very significant crop in the higher altitude areas
of the Kivu District of the Democratic Republic of Congo, but if farmers have not had access for
several years to either new varieties or sources of seed free of viral infection, that potential is not
likely to be realized. An assessment of the production possibilities for potato and sweetpotato,
not only their actual production, could provide further guidance to CIP of where its research
efforts could have the strongest effect.
More refined and regularly updated analysis, displayed by global and more localized maps, provides
a significantly improved framework to guide CIP’s research and development program to those
areas of the world where we may expect the greatest impact on the livelihoods of poor people.

C I P • S O C I A L S C I E N C E S W O R K I N G P A P E R 2 0 0 8 - 4
22 I M P L E M E N T I N G C I P ’ S V I S I O N : I M P A C T T A R G E T I N G
DATA SOURCES
Indicators of Livelihood Indicators are provided by the United Nations Millennium Development Goals Indicators
(http://mdgs.un.org/unsd/mdg/Data.aspx), accessed October 30, 2007. (These data are
occasionally revised.)
Databases utilized for this analysis include:
• Goal 1: Population below US$1 (PPP) per day, percentage (data reported various years,
none prior to 1997).
• Goal 1: Population undernourished, percentage (data reported 2002).
• Goal 4: Children under five mortality rate, per 1,000 live births (data reported 2005).
• Goal 5: Maternal mortality ratio per 100,000 live births (data reported 2000).
Cropping Data The primary source of cropping data for potato and sweetpotato at the national level is FAO, with
several exceptions and revisions for countries marked with an asterisk in Tables 4 and 5. FAO data
are frequently collected and reported by the governments of each respective country, hence are
of widely varied quality in terms of accuracy and completeness. In some cases, national level data
reported by FAO have been utilized, with the addition of other sources for sub-national
distribution.
More complete information of cropping data is available for countries included in the World
Potato Atlas (http://research.cip.cgiar.org/confluence/display/wpa/Home) and the World
Sweetpotato Atlas (http://research.cip.cgiar.org/confluence/display/wsa/Home)
Countries included in the World Potato Atlas are, by continent:
• Africa: Cameroon, Ethiopia, Kenya
• Eurasia: Armenia, Bangladesh, China, India, Myanmar, Nepal, Pakistan, Tajikistan
• South America: Bolivia, Colombia, Ecuador, Peru
Countries included in the World Sweetpotato Atlas are, by continent:
• Africa: Angola, Madagascar, Mozambique, Nigeria, Rwanda, Uganda
• Asia: China, Papua New Guinea, Viet Nam
C I P • S O C I A L S C I E N C E S W O R K I N G P A P E R 2 0 0 8 - 4
I M P L E M E N T I N G C I P ’ S V I S I O N : I M P A C T T A R G E T I N G
23
Other notes are listed for potato production by country below. With the exception of Malawi, all
countries marked with an asterisk in Table 5 are included as chapters in the World Sweetpotato Atlas.
Cropping Data Notes by Selected Countries
Angola: FAO data have indicated rapid increases in area cultivated, from 11,500 hectares in 2001
to a tenfold increase of 115,000 hectares in 2006. National distribution has been estimated
according to a July 2003 report of potato and sweetpotato production issued by the FAO and the
World Food Programme. (See the WSA Angola chapter.)
Burundi: Potato area has been reported by FAO at a consistent 10,000 hectares over the past
several years, very likely well below potential and actual production, especially considering
production under similar physical conditions in adjacent Rwanda. The country is, for the time
being, classified as “no data.”
Malawi: Data for both crops are displayed as reported via the Famine Early Warning System
(FEWS) for 2004, not as reported via FAO. FAO reports much higher production of potato and
nothing of sweetpotato (grown much more extensively than potato), apparently reflecting a
confusion of the two crops.
Nigeria: Data reported by FAO indicate a gradual but consistent national upward trend over the
past five years, known from other sources to be concentrated in areas of higher altitude, centered
on the Plateau and Kano States. Cropping data in general are very tentative for Nigeria. (Please
refer to the WSA Nigeria chapter.)
Papua New Guinea: Potato production is not reported by FAO, but some potato cultivation is
reported in other literature cited in the WSA Papua New Guinea chapter. For the time being, the
country is reported as “no data.”
Rwanda: Sub-national distribution of potato production reported by FAO was estimated via
literature cited in the WSA Rwanda chapter.
Uganda: Sub-national distribution is estimated by Government of Uganda reporting for 2003,
updated with national production estimates reported by FAO.

C I P • S O C I A L S C I E N C E S W O R K I N G P A P E R 2 0 0 8 - 4
24 I M P L E M E N T I N G C I P ’ S V I S I O N : I M P A C T T A R G E T I N G
Population Data Population data provided by ESRI, the company that produces ARC Geographic Information
Systems software used in this analysis, have been updated by composite figures provided by
three other sources:
• Population Reference Bureau/ Datafinder
(http://www.prb.org/DataFind/datafinder7.htm).
• United Nations, FAO Data Archives/ Population
(http://faostat.fao.org/site/430/default.aspx).
• Populstat (http://www.populstat.info/), especially for sub-national population estimates.
REFERENCES
Bellon, M.R., Hodson, D., Bergvinson, D., Beck, D., Martinez-Romero, E., and Montoya, Y.
2005. Targeting agricultural research to benefit poor farmers: Relating poverty mapping to maize
environments in Mexico. Food Policy 30: 476-492.
Bigman, D. and Loevinsohn, M. 2003. Targeting agricultural research and development for
poverty reduction: general principles and an illustration for Sub-Saharan Africa. In: Mathur, S.
and Pachico, D. (Eds.). Agricultural research and poverty reduction. Some issues and evidence:
131-152.
Byerlee, D. 2000. Targeting poverty alleviation in priority setting for agricultural research. Food
Policy 25: 429-445.

International Potato CenterApartado 1558 Lima 12, Perú • Tel 51 1 349 6017 • Fax 51 1 349 5326 • email [email protected]
The International Potato Center (CIP) seeks to reduce poverty and achieve food security on asustained basis in developing countries through scientific research and related activities onpotato, sweetpotato, and other root and tuber crops, and on the improved management ofnatural resources in the Andes and other mountain areas.
THE CIP VISIONThe International Potato Center (CIP) will contribute to reducing poverty and hunger; improvinghuman health; developing resilient, sustainable rural and urban livelihood systems; and im-proving access to the benefits of new and appropriate knowledge and technologies. CIP, a WorldCenter, will address these challenges by convening and conducting research and supportingpartnerships on root and tuber crops and on natural resources management in mountain sys-tems and other less-favored areas where CIP can contribute to the achievement of healthy andsustainable human development.www.cipotato.org
CIP is a Future Harvest Alliance Center and receives its funding from a group of governments,private foundations, and international and regional organizations known as the ConsultativeGroup on International Agricultural Research (CGIAR).www.futureharvest.org • www.cgiar.org