wp ha ivanova ohnsorge unsal (2019) (002)...analytics, internal world bank databases, and various...
TRANSCRIPT

Policy Research Working Paper 8738
Inflation
Concepts, Evolution, and Correlates
Jongrim HaAnna Ivanova
Franziska OhnsorgeFiliz Unsal
Macroeconomics, Trade and Investment Global Practice February 2019
Pub
lic D
iscl
osur
e A
utho
rized
Pub
lic D
iscl
osur
e A
utho
rized
Pub
lic D
iscl
osur
e A
utho
rized
Pub
lic D
iscl
osur
e A
utho
rized

Produced by the Research Support Team
Abstract
The Policy Research Working Paper Series disseminates the findings of work in progress to encourage the exchange of ideas about development issues. An objective of the series is to get the findings out quickly, even if the presentations are less than fully polished. The papers carry the names of the authors and should be cited accordingly. The findings, interpretations, and conclusions expressed in this paper are entirely those of the authors. They do not necessarily represent the views of the International Bank for Reconstruction and Development/World Bank and its affiliated organizations, or those of the Executive Directors of the World Bank or the governments they represent.
Policy Research Working Paper 8728
In the past four to five decades, inflation has fallen around the world, with median annual global consumer price infla-tion down from a peak of 16.6 percent in 1974 to 2.6 percent in 2017. This decline began in advanced economies in the mid-1980s and in emerging market and developing economies in the mid-1990s. By 2000, global inflation had stabilized at historically low levels. Lower inflation has been accompanied by reduced inflation volatility, especially in advanced economies. This improvement in
inflation outcomes has stemmed in large part from struc-tural economic changes, including improved monetary and fiscal policy frameworks as well as international trade and financial liberalization. Lower and more stable inflation has often been associated with better growth and development outcomes, partly by reducing uncertainty, fostering a more efficient allocation of resources, and helping preserve finan-cial stability.
This paper is a product of the Macroeconomics, Trade and Investment Global Practice. It is part of a larger effort by the World Bank to provide open access to its research and make a contribution to development policy discussions around the world. Policy Research Working Papers are also posted on the Web at http://www.worldbank.org/research. The authors may be contacted at [email protected].

Inflation: Concepts, Evolution, and Correlates
Jongrim Ha, Anna Ivanova, Franziska Ohnsorge, and Filiz Unsal*
JEL Classification: E30, E31, E42, E52, F14, F15, F45, F62 Keywords: Prices, Inflation, Deflation, Monetary Systems, Monetary Policy, Economic Integration, Empirical Studies of Trade, Open Economy Macroeconomics, Macroeconomic Impacts of Globalization.
∗ J. Ha: World Bank Group, Email: [email protected]. A. Ivanova: International Monetary Fund, Email: [email protected]. F. Ohnsorge: World Bank Group, Email: [email protected]. F. Unsal: International Monetary Fund, Email: [email protected]. The findings, interpretations, and conclusions expressed in this paper are entirely those of the authors. They do not necessarily represent the views of the International Bank for Reconstruction and Development/World Bank and its affiliated organizations, or those of the Executive Directors of the World Bank or the governments they represent. The authors would like to appreciate detailed feedback from Carlos Arteta, Matteo Ciccarelli Alistair Dieppe, Andreas Jobst, Atsushi Kawamoto, Gene Kindberg Hanlon, M. Ayhan Kose, and Christopher Towe. We thank seminar participants at the World Bank for useful comments. Xinyue Wang and Heqing Zhao provided excellent research assistance. The authors gratefully acknowledge support from the PHRD fund.

2
1. Introduction
Inflation has declined sharply around the world since the global financial crisis. Global inflation—defined as median consumer price inflation among all countries—fell from 9.2 percent (year-on-year) in the second quarter of 2008 to 2.3 percent in the second quarter of 2018. In 80 percent of emerging market and developing economies (EMDEs), inflation in the second quarter of 2018 ranged between 0.9 and 7.5 percent (year-on-year), compared with a range of 4.8 to 25.3 percent in the second quarter of 2008. Among EMDEs, this has created room for monetary policy to support activity. In advanced economies, however, persistent below-target inflation since the crisis has increased risks of de-anchoring inflation expectations and led central banks to resort to unconventional monetary policy instruments to support demand.
The recent easing of inflation continues a trend that spans nearly 50 years. After a rapid rise during the 1960s, global inflation peaked in 1974 at 16.6 percent (annual average), four times the global inflation in 2017 (Figure 1). Similarly, inflation in EMDEs declined from a peak of 17.3 percent (annual average) in 1974 to 3.5 percent in 2017. The disinflation over the past four to five decades has been the result of a confluence of factors, including the adoption of new monetary and fiscal policy frameworks, severe global shocks, and structural changes in national economies and the global economy.
Low and stable inflation has often been associated with more stable output and employment and more rapid output growth and investment. Low and stable inflation increases the transparency of relative price changes, provides confidence for long-term savers and investors, protects the purchasing power of household income and wealth, and enhances financial stability (Annexes 1 and 2). By contrast, economies that have experienced high inflation have suffered significantly lower growth (Kremer, Bick, and Nautz 2013). Extended periods of chronically high inflation, often in Latin America, have frequently ended in large output losses during stabilization programs, or even balance of payments crises.
Extremely low inflation, however, such as has prevailed in many advanced economies over the past decade, may make it difficult for central banks to lower real short-term interest rates sufficiently to provide the requisite stimulus to demand, given that the lower bound on nominal rates is close to zero. Extremely low inflation may therefore limit the room for maneuver of conventional monetary policy and lead central banks to use unconventional measures, including large-scale purchases of longer-term financial assets, to reduce longer-term rates. Such difficulties in implementing expansionary monetary policy, in turn, increase the risk of sliding into a self-reinforcing period of deflation that raises debt burdens and further depresses activity. Extremely low inflation may also hinder the adjustment of absolute and relative real wages, because of the general downward rigidity of nominal wages.
This paper focuses on the factors that have supported long-term disinflation across the world. It also discusses the benefits from such long-term disinflation. It discusses the following questions:
How does inflation support or hinder economic activity? How has global inflation evolved over the past four to five decades? What factors have contributed to these trends in global inflation?

3
FIGURE 1. Global inflation
Global inflation fell sharply between 1970 and 2000. It has been low since then, a trend shared by all measures of inflation. The post-crisis period of globally low inflation has helped bring inflation into target ranges in the majority of EMDEs but has raised concerns about deflation in advanced economies. A. Global inflation B. Inflation in advanced economies and
EMDEs
C. Share of advanced economies and EMDEs with inflation below or within target range
D. Share of advanced economies with low inflation
E. Global core and headline inflation F. Global PPI, CPI, and GDP deflator inflation
Source: World Bank.
Note: All inflation rates refer to year-on-year inflation. CPI = consumer price index; EMDEs = emerging market and developing economies; GDP = gross domestic product; PPI = producer price index.
A. Median consumer price inflation among 153 economies. B. Median consumer price inflation of 29 advanced economies and 124 EMDEs. C. Share of 11 advanced economies and 24 EMDEs with consumer price inflation below target or within target range. The horizontal line indicates 50 percent. D. Percent of 29 advanced economies with consumer price inflation below zero and between 0 and 2 percent. Horizontal lines indicate 1970-2017 averages. E. Median for 41 economies. F. Median for 39 economies.
0
2
4
6
8
10
2007
2008
2009
2010
2011
2012
2013
2014
2015
2016
2017
Median inflation
1970-2017 average
Percent
0
2
4
6
8
10
12
2007
2008
2009
2010
2011
2012
2013
2014
2015
2016
2017
Advanced economies EMDEsPercent
0
20
40
60
80
100
2007
2008
2009
2010
2011
2012
2013
2014
2015
2016
2017
Advanced economies EMDEsPercent of countries
0
20
40
60
80
100
2007
2008
2009
2010
2011
2012
2013
2014
2015
2016
2017
0 to 2 percentBelow 0 percent1970-2017 0 to 2 percent1970-2017 Below 0 percent
Percent
0
5
10
15
20
1970
1973
1976
1979
1982
1985
1988
1991
1994
1997
2000
2003
2006
2009
2012
2017
Core CPI Headline CPIPercent
-5
0
5
10
15
20
25
30
1970
1973
1976
1979
1982
1985
1988
1991
1994
1997
2000
2003
2006
2009
2012
2017
PPI CPI GDP deflatorPercent

4
Contribution to the literature. This paper’s contributions are threefold.
First, it documents the broad-based disinflation over the past four to five decades using a rich database of countries and inflation measures. The analysis is based on a comprehensive data set for a virtually global sample of countries over almost half a century (141 EMDEs and 34 advanced economies for 1970-2018). Earlier studies have documented the broad-based global disinflation, but with data sets that covered a narrower set of countries or a shorter time period. These studies have been mostly restricted to advanced economies and have not taken account of either the drop in the price of oil in 2014 or the period of unusually depressed post-crisis inflation.
Second, in contrast to earlier studies, this paper identifies a rich set of stylized facts that are robust across different measures of inflation. Trend disinflation over the past four to five decades manifested in all measures of inflation (headline and core consumer prices, producer prices, import prices, and the gross domestic product (GDP) deflator).
Third, the paper provides a uniquely comprehensive and systematic analysis of the structural factors that have been credited with lowering inflation over the past four to five decades. The literature has identified many structural changes that have supported the long-term trend toward lower and more stable inflation. These include increased global economic integration and strengthened macroeconomic policy frameworks. However, no study to date has presented a systematic analysis of the role of these factors. This paper provides such an analysis as well as a preliminary quantification of their associations with the trend decline in inflation.
Findings. The paper documents the following findings:
Inflation has fallen around the world. Median consumer price inflation declined from a peak of 16.6 percent (annual average) in 1974 to 2.6 percent in 2017. Similarly, median inflation in EMDEs declined from a peak of 17.3 percent (annual average) in 1974 to 3.5 percent in 2017, and, in low-income countries (LICs) it declined from a peak of 24.9 percent (annual average) in 1994 to 5.0 percent in 2017. The decline began in advanced economies in the mid-1980s and in EMDEs in the mid-1990s. By 2000, global inflation had stabilized at historically low levels. Lower inflation was accompanied by lower inflation volatility, especially in advanced economies.
Structural economic changes have supported global disinflation. The most significant drivers of global disinflation have included globalization—increased international economic integration—and a shift toward more effective and more resilient monetary and fiscal policy frameworks and exchange rate regimes. On average, inflation has declined faster in countries with greater trade and capital account openness, more transparent central banks, and a switch to inflation targeting regimes.
The current low and stable inflation environment resembles those of the Bretton Woods fixed exchange rate system from the post-war period to 1971 and of the gold standard of the early 1900s. All three episodes are characterized by inflation below 5 percent for an extended period (7-19 years), but the current environment differs from the two earlier episodes in its lower inflation volatility.
The gains of the past four to five decades in terms of inflation are by no means guaranteed. Inflation can easily make a comeback if the fundamental structural and policy changes that

5
have compressed inflation over the past four to five decades lose momentum or even reverse. However, as long as strong monetary policy frameworks are supported by sound fiscal policies and institutional structures, it would be possible to keep in check the inflationary implications of fluctuations in business and financial cycles, and movements in commodity prices.
2. Conceptual considerations Before exploring the longer-term drivers of inflation, several conceptual issues require clarification. These include the relationship between inflation and relative price changes, the interpretation of different measures of inflation, the appropriate rate of inflation as a policy objective, and the implications of inflation volatility and persistence.
Inflation versus relative price changes. Inflation refers to a sustained and broad-based increase in the overall price level.1 This is distinct from changes in relative prices, which measure the price of one good or service relative to the price of another (or a weighted average of all other goods and services) and signal information about relative surpluses or shortages in different product markets. A rising relative price of a certain good or service indicates that the demand for it outstrips supply and encourages production while discouraging consumption. Hence, in contrast to inflation, relative price movements are critical for the efficient allocation of resources. If goods, services, and factor markets were fully flexible, inflation (which in principle involves no change in relative prices) would not affect the allocation of resources and relative price changes would occur without inflation. However, if nominal rigidities limit the scope for downward price adjustments, then broad-based inflation can facilitate relative price adjustments by allowing above-average price increases for goods, services, or factors of production that are in high demand (Taylor 2000). This is particularly relevant to the market for labor because of the general downward rigidity of nominal wages.
Disinflation versus deflation. Deflation refers to negative inflation—that is, a decline in price levels—whereas disinflation refers to a decline in inflation rates that are still positive (Federal Reserve Bank of San Francisco 1999). Disinflation has been widespread since the mid-1970s, whereas outright deflation has been rare.
Headline versus core inflation. Headline inflation usually refers to changes in the prices of all goods and services in a basket of goods and services that is representative of consumer expenditures. Core inflation measures are intended to capture the underlying, common trend in all prices, regardless of relative price changes. In practice, core inflation is often measured by excluding from the calculation movements in the prices of goods and services that are most volatile, in particular food and energy. For example, swings in food and energy prices tend to be changes in relative prices that shift consumption and production patterns. Alternatively, core inflation is sometimes calculated as the common component of price movements of all goods and services (Stock and Watson 2007, 2010; Schembri 2017).
1 When the word “inflation” was first used in economic contexts in the early- to mid-19th century, it referred to growth of the money supply. In the 1930s, it began to be associated with rising prices, which were attributed to growing money supply (Bryan 1997, 2002).
6
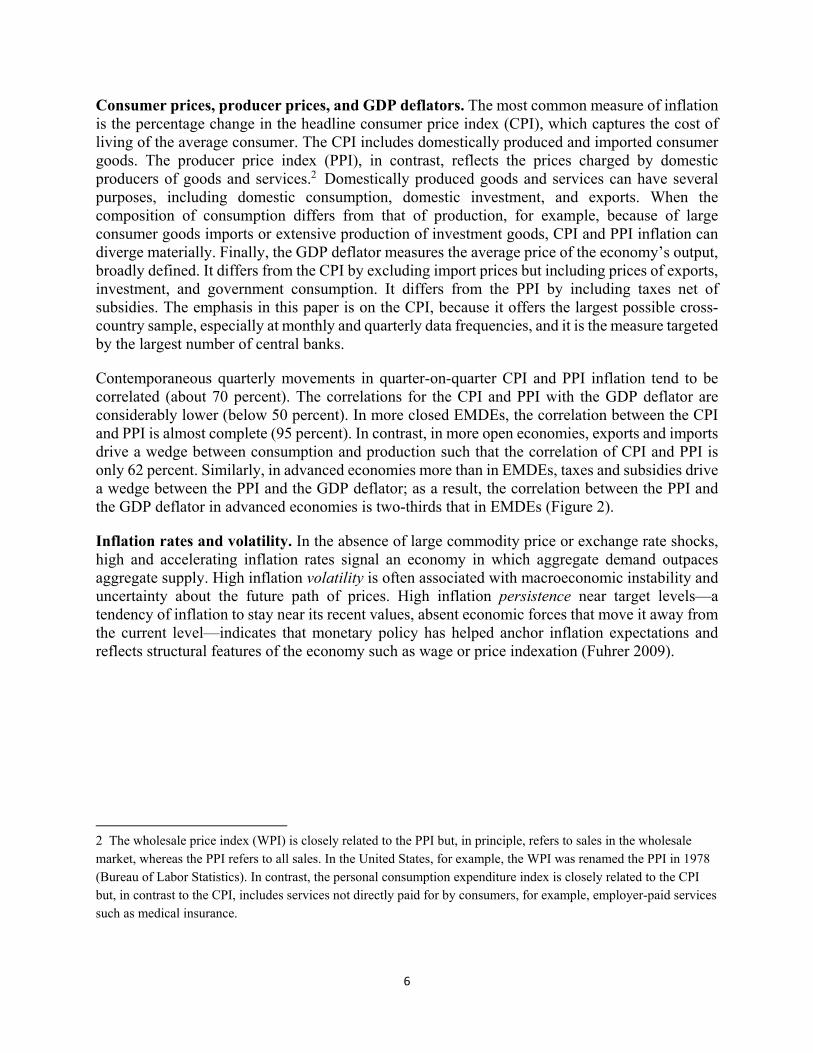
Consumer prices, producer prices, and GDP deflators. The most common measure of inflation is the percentage change in the headline consumer price index (CPI), which captures the cost of living of the average consumer. The CPI includes domestically produced and imported consumer goods. The producer price index (PPI), in contrast, reflects the prices charged by domestic producers of goods and services.2 Domestically produced goods and services can have several purposes, including domestic consumption, domestic investment, and exports. When the composition of consumption differs from that of production, for example, because of large consumer goods imports or extensive production of investment goods, CPI and PPI inflation can diverge materially. Finally, the GDP deflator measures the average price of the economy’s output, broadly defined. It differs from the CPI by excluding import prices but including prices of exports, investment, and government consumption. It differs from the PPI by including taxes net of subsidies. The emphasis in this paper is on the CPI, because it offers the largest possible cross-country sample, especially at monthly and quarterly data frequencies, and it is the measure targeted by the largest number of central banks.
Contemporaneous quarterly movements in quarter-on-quarter CPI and PPI inflation tend to be correlated (about 70 percent). The correlations for the CPI and PPI with the GDP deflator are considerably lower (below 50 percent). In more closed EMDEs, the correlation between the CPI and PPI is almost complete (95 percent). In contrast, in more open economies, exports and imports drive a wedge between consumption and production such that the correlation of CPI and PPI is only 62 percent. Similarly, in advanced economies more than in EMDEs, taxes and subsidies drive a wedge between the PPI and the GDP deflator; as a result, the correlation between the PPI and the GDP deflator in advanced economies is two-thirds that in EMDEs (Figure 2).
Inflation rates and volatility. In the absence of large commodity price or exchange rate shocks, high and accelerating inflation rates signal an economy in which aggregate demand outpaces aggregate supply. High inflation volatility is often associated with macroeconomic instability and uncertainty about the future path of prices. High inflation persistence near target levels—a tendency of inflation to stay near its recent values, absent economic forces that move it away from the current level—indicates that monetary policy has helped anchor inflation expectations and reflects structural features of the economy such as wage or price indexation (Fuhrer 2009).
2 The wholesale price index (WPI) is closely related to the PPI but, in principle, refers to sales in the wholesale market, whereas the PPI refers to all sales. In the United States, for example, the WPI was renamed the PPI in 1978 (Bureau of Labor Statistics). In contrast, the personal consumption expenditure index is closely related to the CPI but, in contrast to the CPI, includes services not directly paid for by consumers, for example, employer-paid services such as medical insurance.

7
FIGURE 2 Correlation between inflation measures Movements in CPI and PPI inflation tend to be highly correlated, especially in more closed EMDEs. In advanced economies especially, taxes and subsidies drive a wedge between CPI and PPI inflation and GDP deflator inflation, such that their correlations are lower than in EMDEs.
A. Correlation for advanced economies and EMDEs
B. Correlations among EMDEs
Source: World Bank.
Note: Correlation coefficients for quarter-on-quarter seasonally adjusted (not annualized) inflation among 53 economies (of which 23 are EMDEs) for which CPI, PPI, and GDP deflator data are available. CPI = consumer price index; EMDEs = emerging market and developing economies; GDP = gross domestic product; PPI = producer price index.
B. Trade openness measured as the sum of exports and imports as a percentage of GDP.
3. Inflation and economic activity
Historically, low and stable inflation, combined with well-anchored inflation expectations, has been associated with greater short-term stability of output and employment and higher long-term growth.
Lower inflation has tended to be accompanied by lower inflation volatility and higher output growth. Lower inflation volatility, in turn, has typically been accompanied by lower output growth volatility and higher investment and savings (Figure 3). Several channels account for the beneficial effects of low and stable inflation on economic activity. These include greater predictability for investors and households, greater transparency of relative price changes, and greater financial stability. The large literature documenting these channels is summarized in Annex 2. The following provides a short summary:
First, low inflation reduces uncertainty. By inspiring confidence in the future real value of nominal assets and reducing the uncertainty surrounding future returns on productive investment, low and stable inflation fosters long-term investment. Such investment can be an important source of productivity and income growth, especially when new technologies are embodied in investment.
Second, low and stable—but positive—inflation makes relative price changes more transparent. This reduces the need for costly search for information that would be required when high inflation obscures relative price changes.
0.0
0.2
0.4
0.6
0.8
CPI and PPI CPI andGDP deflator
PPI andGDP deflator
Correlation coefficient
Advanced economies EMDEs
0.0
0.2
0.4
0.6
0.8
1.0
CPI and PPI CPI andGDP deflator
PPI andGDP deflator
Correlation coefficientTrade openness > 50 percent of GDPTrade openness ≤ 50 percent of GDP

8
Third, low and stable inflation helps preserve the real value of after-tax incomes, especially when tax brackets are fixed in nominal terms, and savings (Annex 2). This encourages investment and saving.
Fourth, low and stable inflation tends to be associated with greater financial sector stability. This, in turn, supports macroeconomic stability. Stable inflation is usually associated with lower long-term nominal interest rates. This can help reduce rollover or default risk and the cost of financing for long-term investments. Stable inflation also reduces the risks faced by financial intermediaries that hold long-term nominal assets.
FIGURE 3 Inflation and economic activity in EMDEs
Low and stable inflation has been associated with higher and more stable growth, investment and savings. A. Inflation volatility by inflation level B. Growth volatility by inflation volatility
C. Growth, by inflation level and volatility D. Savings and investment rates by
inflation volatility
Source: World Bank. Note: The sample includes 84 EMDEs, including 20 low-income countries. Inflation volatility is defined as the standard deviation. Inflation refers to year-on-year inflation. EMDEs = emerging market and developing economies; GDP = gross domestic product. A, Average inflation volatility from 1980 to 2016 for countries with average inflation in the top quartile and average inflation in the bottom quartile. B. Average real GDP growth volatility from 1980 to 2016 for country-year pairs with inflation volatility in the top quartile and average inflation volatility in the bottom quartile. C. Average real GDP growth from 1980 to 2016 for countries with average inflation (left column and bar) or standard deviation of inflation (right column and bar) in the top quartile and average inflation in the bottom quartile. D. Average savings and investment from 1980 to 2016 for countries with a standard deviation of inflation in the top quartile and standard deviation of inflation in the bottom quartile.
3
4
5
6
Low inflation volatility High inflation volatility
Percent
2
3
4
5
Inflation level Inflation volatility
Low HighPercent
0
5
10
15
20
25
30
Savings Investment
Low inflation volatilityHigh inflation volatility
Percent of GDP

9
4. Evolution of global inflation
Globally, inflation fell sharply from its 1974 peak of 16.6 percent, to 2.6 percent in 2017. This decline began in advanced economies in the mid-1980s and in EMDEs in the mid-1990s. By 2000, global inflation had stabilized at historically low levels. Lower inflation has been accompanied by lower inflation volatility, especially among advanced economies. The current environment of low and stable inflation resembles that during the Bretton Woods fixed exchange rate system in the post-war period up to 1971 and the gold standard of the early 1900s. This section discusses the developments in detail.
Data. The analysis rests on a comprehensive database of inflation measures and the key drivers of inflation. Data on headline, core, energy, and food CPI inflation; PPI inflation; and GDP deflators, as well as their components, are available for up to 175 countries for 1970-2017 (34 advanced economies and 141 EMDEs, of which 27 are LICs). The data were assembled from a wide range of sources, including ILOSTAT, UNdata, OECDstat, International Financial Statistics, Haver Analytics, internal World Bank databases, and various editions of the International Monetary Fund (IMF) World Economic Outlook database. These inflation series are complemented with data on inflation targets, central bank independence, exchange rate regime, inflation expectations, and international trade and financial openness. Global inflation is defined as median CPI inflation, unless otherwise specified. The details of the database can be found in Ha, Kose and Ohnsorge (2019).
Trend disinflation, 1970-2017. Since its peak in the mid-1970s, global inflation has been on a declining trend. Global inflation fell from a peak of 16.6 percent (annual average) in 1974 to 2.6 percent in 2017 (Figure 4). In EMDEs, inflation declined from a peak of 17.3 percent (annual average) in 1974 to 3.5 percent in 2017; in LICs, it fell from a peak of 24.9 percent (annual average) in 1994 to 5.0 percent in 2017. The trend decline started earlier (in the mid-1980s) in advanced economies than in EMDEs and LICs (in the mid-1990s) (Annex 3).
In EMDEs, this disinflation process cut across all regions, including those with a history of persistently high inflation, such as Latin America and the Caribbean and Sub-Saharan Africa. The downward trend has manifested in all inflation measures, including headline CPI, core CPI, PPI, and GDP deflator inflation. By the early 2000s, the disinflation was largely completed, although it resumed after the global financial crisis at a milder pace.
The “near-universal” character of disinflation since the mid-1970s was already recognized by Rogoff (2003), but most other studies have focused on advanced economies. The widely shared disinflation in advanced economies has been attributed partly to common terms-of-trade shocks, such as oil price swings (Rogoff 2003). Among Group of Seven economies, it may also have reflected changes in monetary policy regimes, including the increased focus on price stability, which also occurred during the early 1980s and early 1990s (Cecchetti et al. 2007; Levin and Piger 2006).

10
FIGURE 4 Global inflation trends Since its peak in the mid-1970s, global inflation has been on a decline. The decline began in the mid-1980s among advanced economies before moving to EMDEs and low-income countries in the mid-1990s. This disinflation process cut across all EMDE regions and manifested in all inflation measures. By the early 2000s, the disinflation was largely completed and resumed only after the global financial crisis, albeit at a more modest pace. A. Global CPI inflation B. Global CPI trend inflation
C. Median CPI headline inflation, by region D. Median CPI headline inflation, by
country group
E. Median CPI, PPI headline inflation, and the GDP deflator
F. Median core, food, and energy CPI inflation
Source: World Bank. Note: All inflation rates refer to year-on-year inflation. CPI = consumer price index; EMDEs = emerging market and developing economies; GDP = gross domestic product; LICs = low-income countries; PPI = producer price index. A. Based on 153 countries. The last observation is 2017. The values show headline inflation. B. Based on 77 countries, including 50 EMDEs. The values show median trend inflation, as defined in Stock and Watson (2016). C. The horizontal lines reflect median inflation across all EMDEs over 1970-97 and 1998-2017. EAP = East Asia and Pacific; ECA = Europe and Central Asia; LAC = Latin America and the Caribbean; MNA = Middle East and North Africa; SAR = South Asia; SSA = Sub-Saharan Africa. D. Median of inflation trend of 25 advanced economies, 97 EMDEs (excluding LICs), and 27 LICs. The last observation is 2017:1. E. Based on data for inflation in 39 countries, including 15 EMDEs. F. Based on data for inflation in 47 countries, including 18 EMDEs.
0
4
8
12
16
20
1970
1973
1977
1981
1985
1989
1993
1997
2001
2005
2009
2013
2017
Average MedianPercent
0
4
8
12
16
20
1971
1974
1977
1980
1983
1986
1989
1992
1995
1998
2001
2004
2007
2010
2013
2016
Percent
048
121620
1970
-199
7
1998
-201
7
1970
-199
7
1998
-201
7
1970
-199
7
1998
-201
7
1970
-199
7
1998
-201
7
1970
-199
7
1998
-201
7
1970
-199
7
1998
-201
7
EAP ECA LAC MNA SAR SSA
Median 1970-1997
Median 1998-2017
Percent
0
4
8
12
16
2019
70
1975
1980
1985
1990
1995
2000
2005
2010
2017
Advanced economies
EMDEs
Percent
-5
0
5
10
15
20
25
1970
1975
1980
1985
1990
1995
2000
2005
2010
2017
PPI CPI GDP deflatorPercent
0
5
10
15
20
25
1970
1975
1980
1985
1990
1995
2000
2005
2010
2017
Core Food EnergyPercent

11
Other factors may have included sounder fiscal policies, deregulation, globalization, and, in the 1990s, accelerating productivity growth in parts of the world (Rogoff 2003; IMF 2006). Studies of disinflation in EMDEs have focused on specific policy experiments in individual countries, such as the introduction of inflation targeting, greater exchange rate flexibility, or macroeconomic stabilization programs (Mishkin 2000; Bernanke et al. 2001; Mishkin and Schmidt-Hebbel 2007; Aizenmann, Chinn, and Ito 2011).
1970s. In the wake of two major oil crises—the quadrupling of oil prices in 1973 and the doubling of oil prices in 1979-80—global median inflation tripled from 4.4 percent in 1970 to 13.7 percent in 1980.3 Some advanced economy central banks, freed in 1971 from the constraints of the Bretton Woods system of fixed exchange rates, aimed to support economic activity with monetary expansion. The elimination of the nominal anchor of fixed exchange rates set off an inflationary wage-price spiral with weak economic growth (often termed “stagflation”). Among EMDEs, accommodative monetary policy facilitated a spillover of inflation from advanced economies (IMF 2011b).
1980s. In advanced economies, monetary policy tightening in the late 1970s and early 1980s helped rein in inflation, to a median of 3 percent by 1986 from its peak of 15 percent in 1974, and establish central bank credibility, although often at the cost of deep recessions. In the United States, for example, short-term interest rates almost quadrupled between the end of 1976 and mid-1981 (Annex 4). In the wake of these interest rate increases, U.S. output contracted by more than 2 percent between early 1981 and mid-1982. In parts of advanced economy Europe, central banks responded more strongly and earlier to rising inflation. In several countries, disinflation was less pronounced than in the United States, but it was also accompanied by output losses in the early 1980s.
In EMDEs, disinflation was delayed by persistent large fiscal and current account deficits, often in conjunction with fixed exchange rate regimes, deteriorating terms of trade for commodity exporters, and political disruptions (Dornbusch 1986; Edwards 1989). For example, for several decades, Argentina, Brazil, Chile, Israel, Mexico, Peru, and Uruguay had chronically high inflation of more than 20 percent for five or more consecutive years. Multiple stabilization programs were attempted, typically resulting in recessions (Calvo and Végh 1994).
1990s. In the second half of the 1980s and during the 1990s, many EMDEs implemented macroeconomic stabilization programs and structural reforms to improve economic efficiency. These initiatives often included the removal or easing of foreign exchange market controls, trade liberalization, tighter fiscal policy, and stronger fiscal and monetary policy frameworks. In EMDEs across Europe, Central Asia, and South Asia, inflation soared, as previously centrally planned economies collapsed, and the accompanying price and exchange rate liberalization released pent-up demand pressures. Subsequent stabilization efforts were associated with deep output losses. As transition economies exited high inflation and even hyperinflation during 1989-94, output declined sharply—for example, cumulatively by 16 percent in Uzbekistan and 75 percent in Georgia—often amid civil wars and trade embargoes (Fischer, Sahay, and Végh 1996). Within two years, on average, these economies started growing again. In Latin America and the Caribbean, renewed
3 During the Arab-Israeli War in 1973, global oil prices quadrupled to about $12 per barrel. Around the time of the Iranian Revolution, oil prices more than doubled in 1979-80 to about $36 per barrel.

12
stabilization programs that centered around sound fiscal discipline and greater central bank independence gained traction and inflation declined (Figure 5).
FIGURE 5 Inflation in Latin America and Europe and Central Asia
Median inflation was 14 percent in Latin America during the 1980s and 128 percent in Eastern Europe and Central Asia during the first half of the 1990s. Eventually, a combination of macroeconomic stabilization and liberalization policies, against the backdrop of global disinflation, helped rein in high inflation in these regions.
A. Inflation in LAC countries B. Inflation in ECA countries
C. Share of LAC countries with inflation above 20 percent
D. Share of ECA countries with inflation above 20 percent
Source: World Bank.
Note: Inflation refers to year-on-year inflation. ECA = Europe and Central Asia; LAC = Latin America and the Caribbean.
A.C. The grey area denotes the 1980s. LAC includes 32 countries in the region. The orange line in panel C indicates 50 percent of the countries. B.D. The grey area denotes the 1990s. ECA includes 22 countries in the region. The orange line indicates 50 percent of the countries.
2000s. The disinflation of the 1980s and 1990s paused in the early 2000s in the run-up to the global financial crisis, partly as a result of rapidly rising energy and food prices. However, the global financial crisis ushered in a renewed period of mild disinflation and, in many advanced economies, spells of negative inflation. Post-crisis, deflation or low inflation was unusually pervasive across advanced economies: in 2015, inflation was negative in more than half of the advanced economies and, in 2016, inflation was in the low single digits in three-quarters of the advanced economies (Figure 6). This raised concerns about low inflation, or possibly even deflation, becoming entrenched in inflation expectations. To reduce the risk of falling into a deflationary environment, advanced economy central banks implemented exceptionally accommodative monetary policy after the global financial crisis, including through unconventional measures. In EMDEs, inflation
0
10
20
30
40
50
60
1970
1972
1974
1976
1978
1980
1982
1984
1986
1988
1990
1992
1994
1996
1998
2000
2002
Percent Median Interquartile range
0
200
400
600
800
1000
1200
1400
1989
1990
1991
1992
1993
1994
1995
1996
1997
1998
1999
2000
2001
2002
PercentMedian Interquartile range
0
10
20
30
40
50
60
1970
1972
1974
1976
1978
1980
1982
1984
1986
1988
1990
1992
1994
1996
1998
2000
2002
Percent Inflation 20-50 percentInflation above 50 percent
0
20
40
60
80
100
1988
1989
1990
1991
1992
1993
1994
1995
1996
1997
1998
1999
2000
2001
2002
Percent Inflation 20-50 percent
Inflation above 50 percent

13
fell within or below target ranges in 60 percent of inflation targeting economies (from less than 50 percent in 2007), making room for monetary policy rate cuts to support economic activity. In 80 percent of EMDEs, inflation in the second quarter 2018 ranged between 0.8 and 6.7 percent (year-on-year), compared with a range of 3.9 to 23.9 percent in the second quarter of 2008.
Broad-based disinflation. The disinflation over the past three to five decades has been broad-based across country groups and reflected in headline inflation, core inflation, and energy and food price inflation. Domestic food and energy prices constitute a large share of domestic consumption price baskets. Food prices have been an important contributor to the persistent and steady decline in global inflation over the past four to five decades, whereas energy prices mainly have contributed to declining inflation during major oil price plunges.
Food prices contributed about 5.5 percentage points to the almost 14 percentage point decline in global headline inflation between 1974 and 2017. This was in addition to food prices’ important role in cyclical swings in headline inflation around this general disinflationary trend. Yet, food CPI has reflected global food commodity price developments only to a limited degree. Especially in advanced economies, the estimated pass-through from international food prices to domestic food prices has been modest (Furceri et al. 2015) (Figure 7).
Energy prices have contributed to global disinflation only in episodes of major oil price plunges, most recently in 2014-16. Cumulatively, energy prices contributed 3.2 percentage points to the almost 14 percentage point decline in headline global inflation between 1974 and 2017. Energy price inflation has clearly fallen from its 1970s peaks, and it was broadly stable throughout the 1990s and 2000s.
Subsidies, offsetting exchange rate fluctuations, and a growing domestic services content of cost drove a wedge between domestic food and energy prices and global commodity prices. Domestic energy price inflation was even less homogeneous across EMDEs than domestic food inflation, possibly reflecting a wide variety of fuel subsidy schemes. Domestic food and energy prices have a sizable tradable component, because many countries import energy and food products, but the share of nontradable domestic services (such as logistics and retail) in domestic food and energy prices is growing. As a result, the correlation of domestic food and energy prices with domestic headline inflation has increased (Furceri et al. 2015).
Declining inflation volatility. Trend disinflation has been accompanied by a trend decline in inflation volatility across all EMDE regions, measures of inflation, and inflation components. Inflation volatility is measured as the time-varying volatility of trend and cyclical inflation (Stock and Watson 2016). CPI inflation volatility has fallen in advanced economies and EMDEs (Figure 8). Although most of the volatility decline has reflected declining volatility of the trend component of inflation, which approximates the volatility of core inflation, declining cyclical inflation, which captures temporary shocks, has also contributed. Declining trend inflation volatility in part reflects the lower volatility of structural economic shocks. The significant decline in macroeconomic volatility in advanced economies between the mid-1980s and the global financial crisis has been labeled the “Great Moderation.”4
4 Stock and Watson (2003); Bernanke (2004); Clark (2009). In the United States, the Great Moderation has been attributed to smaller variance of shocks and positive and stable technological shocks (“good luck”), new inventory

14
FIGURE 6 Distribution of inflation
Post-crisis inflation has been unusually homogeneous and low in advanced economies and EMDEs. A. CPI inflation distribution: 1970-97 B. CPI inflation distribution: 2010-17
C. Inflation distribution: Advanced economies D. Inflation distribution: EMDEs
E. Number of advanced economies, by deviation from inflation target
F. Number of EMDEs, by deviation from inflation target
Source: World Bank.
Note: CPI = consumer price index; EMDEs = emerging market and developing economies; LICs = low-income countries.
A.-D. Inflation refers to quarter-on-quarter annualized inflation. C.D. Sample includes 27 advanced economies and 50 EMDEs. E.F. Sample includes 17 advanced economies and 27 EMDEs. “Within” indicates the number of countries with inflation within target ranges or within ±1 percentage point of the inflation target for those countries that do not announce a range or below the inflation target for those countries that announce an inflation target ceiling.
processes and labor supply shocks that reduced wage and marginal cost pressures (“structural change”), and more stabilizing monetary policy (“good policies”) (Fernández- Villaverde, Guerrón-Quintana, and Rubio-Ramírez 2010).
0
10
20
30
-10 -7 -3 1 5 8 12 16 19 23 27 31 34 38 42 45
Advanced economiesEMDEs ex. LICsLICs
Percent of countries
Inflation, percent
0
10
20
30
40
50
-10 -7 -3 1 5 8 12 16 19 23 27 31 34 38 42 45
Advanced economiesEMDEs ex. LICsLICs
Percent of countries
Inflation, percent
0
20
40
60
80
100
1970
1980
1990
2000
2010
2018
>10 percent 5-10 percent 2-5 percent0-2 percent <0 percent
Percent of countries
0
20
40
60
80
100
1970
1980
1990
2000
2010
2018
>10 percent 5-10 percent 2-5 percent0-2 percent <0 percent
Percent of countries
0
4
8
12
1990
1993
1996
1999
2002
2005
2008
2011
2014
2017
Within Below AboveNumber of countries
0
5
10
15
20
25
30
1999
2002
2005
2008
2011
2014
2017
Within Below AboveNumber of countries

15
FIGURE 7 Components of inflation
The disinflation over the past three decades was broad-based in its components, reflected in headline inflation, core inflation, and food price inflation, and cutting across advanced economies and EMDEs. A. Median food inflation in EMDEs, by region B. Median energy inflation in EMDEs, by
region
C. Median food price inflation and global food commodity price inflation
D. Median energy price inflation and global energy commodity price inflation
E. Correlation of domestic inflation cycle with global commodity price cycle
F. Correlation of inflation cycle with global commodity price cycle
Source: Pink Sheet, World Bank.
Note: CPI = consumer price index; EMDEs = emerging market and developing economies; GDP = gross domestic product.
A.B. Weights are food and energy weights used to calculate CPI. Weights are weights of food (A) and energy (B) in CPI baskets.
Inflation refers to year-on- year inflation. EAP = East Asia and Pacific; ECA = Europe and Central Asia; LAC = Latin America and the Caribbean; MNA = Middle East and North Africa; SAR = South Asia; SSA = Sub-Saharan Africa. C.D. Energy and food commodity price inflation from the World Bank’s Pink Sheet of commodity prices. Correlation of detrended headline CPI and GDP deflator with detrended global energy and food price inflation. Detrended using the Hodrick-Prescott filter. Correlation between detrended domestic headline, energy, and food price inflation with detrended global energy and food price inflation. Detrended using the Hodrick-Prescott filter.
0
10
20
30
40
50
60
02468
1012141618
ECA LAC SSA SAR EAP MNA
1970-1997 1998-2017 Weights (RHS)Percent Percent
0
10
20
30
0
10
20
30
40
50
ECA LAC SAR SSA EAP MNA
1970-1997 1998-2017 Weights (RHS)Percent Percent
-8
-4
0
4
8
12
16
20
-40
-20
0
20
40
60
80
100
1970
1975
1980
1985
1990
1995
2000
2005
2010
2017
Global Domestic (RHS)Percent Percent
-16
-8
0
8
16
24
32
40
-100
-50
0
50
100
150
200
25019
70
1974
1978
1982
1986
1990
1994
1998
2002
2006
2010
2017
Global Domestic (RHS)Percent Percent
0.0
0.2
0.4
0.6
0.8
1.0
CPI GDPdeflator
CPI GDPdeflator
Energy commodities Food commodities
1970-1997 1998-2017Correlation coefficient
0.0
0.2
0.4
0.6
0.8
1.0
CPI Energy CPI Food
Energy commodities Food commodities
Advanced economies EMDEs
Correlation coefficient

16
FIGURE 8 Global inflation volatility Trend disinflation was accompanied by a trend decline in inflation volatility that cut across EMDE regions, measures of inflation and inflation components. A. Median CPI and PPI inflation volatility B. Energy, PPI, and global oil price
volatility
C. Inflation volatility, by country group D. Inflation volatility, by region
E. Inflation volatility, by region F. Median food and energy inflation volatility, by country group
Source: Pink Sheet, World Bank. Note: Volatility of cyclical components of inflation, as estimated by Stock and Watson (2016). Trend inflation is defined as the part of inflation that follows a permanent stochastic trend; cyclical inflation is a serially uncorrelated transitory component of inflation. Inflation refers to year-on-year inflation. AEs = advanced economies; CPI = consumer price index; EMDEs = emerging market and developing economies; GDP = gross domestic product; LICs = low-income countries; PPI = producer price index. A. Balanced sample of 28 countries. The latest data point is 2017:1. C. The sample includes 27 advanced economies, 44 EMDEs, and 10 LICs. D.E. EAP = East Asia and Pacific; ECA = Europe and Central Asia; LAC = Latin America and the Caribbean; MNA = Middle East and North Africa; SAR = South Asia; SSA = Sub-Saharan Africa. F. Volatility defined as the cross-country median of the standard deviation. Weights are the weight of food and energy in CPI consumption baskets.
0
2
4
6
8
10
12
1971
1974
1977
1980
1983
1986
1989
1992
1995
1998
2001
2004
2007
2010
2013
2017
CPI PPIPercent
0
5
10
15
20
25
30
35
0
5
10
15
20
1971
1974
1977
1980
1983
1986
1989
1992
1995
1998
2001
2004
2007
2010
2013
2017
PPI inflationEnergy Component of CPIOil price(RHS)
Percent Percent
0
5
10
15
20
25
1971
1974
1977
1980
1983
1986
1989
1992
1995
1998
2001
2004
2007
2010
2013
2016
Advanced economies EMDEs LICsPercent
048
121620
1970
-199
7
1998
-201
7
1970
-199
7
1998
-201
7
1970
-199
7
1998
-201
7
EAP ECA LAC
Median 1970-1997Median 1998-2017
Percent
0
4
8
12
1970
-199
7
1998
-201
7
1970
-199
7
1998
-201
7
1970
-199
7
1998
-201
7
MNA SAR SSA
Median 1970-1997Median 1998-2017
Percent
0
20
40
60
80
100
0
2
4
6
8
10
AEs EMDEs LICs AEs EMDEs LICs
Food Energy
1990-2007 2010-17 Weights (RHS)Percent Percent

17
Differences in inflation volatility among the major groups of economies persist but have narrowed somewhat. EMDEs, especially LICs, have continued to experience higher inflation volatility than advanced economies. Partly because of the inflation swings around economic liberalization in the early 1990s and partly because of domestic conflict, inflation volatility in Europe and Central Asia, South Asia, and Sub-Saharan Africa was high until 1997, but since then it has declined sharply in Europe and Central Asia and Sub-Saharan Africa. In South Asia, it remains elevated because of the high volatility of food prices, which account for a large share of the region’s CPI basket (46 percent).
Declining inflation expectations. Well-anchored inflation expectations can ensure that trend inflation remains unaffected by temporary shocks. In both advanced economies and EMDEs, long-term (five-year-ahead) inflation expectations have declined over the past three decades. In advanced economies, inflation expectations have remained stable at about 2 percent per year since 2000, after declining rapidly in the 1990s, with little cross-country variation (Figure 9). In EMDEs, inflation expectations decreased markedly in the second half of the 1990s, but then trended up during 2005-14 before retreating somewhat over the following three years. The increase in inflation expectations during 2005-14 was somewhat more pronounced in countries with low central bank transparency than in those with high transparency. Throughout the past three decades, cross-country variation in inflation expectations across EMDEs exceeded the variation across advanced economies.
Historical precedent. The current low and stable global inflation environment resembles inflation during the Bretton Woods fixed exchange rate system in the post-war period until 1971 and during the gold standard of the early 1900s— both of which provided nominal anchors to countries across the globe (Figure 10). In all three periods, global inflation was below 5 percent for an extended time span (7-19 years). The loss of a nominal anchor at the end of the earlier regimes was followed by a period of high inflation until the widespread implementation of inflation targeting and strengthening central bank credibility helped anchor expectations again (Bernanke et al. 2001; Rose 2007; Beyer et al. 2009). However, the post-crisis period of extremely low global inflation differs from the Bretton Woods fixed exchange rate regimes and the gold standard in its lower inflation volatility.
5. Long-term correlates of inflation
Several structural changes have accompanied global disinflation over the past four to five decades. On average, inflation has declined more in countries that have participated more in global value chains, have moved to inflation targeting regimes, have more independent and transparent central banks, and have more open capital accounts. Inflation is often affected by unexpected short-term shocks. But, over time, wages and prices adjust and inflation reverts to its long-term trend. This trend is determined by the monetary and fiscal policies, institutional frameworks, and structural features of an economy.5
5 Monetary policy can cause changes in real activity if inflation expectations are unchanged or adapt with a lag to monetary policy changes (Taylor 1980; Rotemberg 1982; Calvo 1983) or if the wage and price settings adapt with a lag to monetary policy changes (Sims and Zha 1998).

18
FIGURE 9 Global inflation expectations
In advanced economies, inflation expectations have been broadly stable since the mid-2000s, following a decline during the 1990s. In EMDEs, inflation expectations fell markedly during the late 1990s but then rose during 2005-14 before retreating again.
A. Inflation expectations in advanced economies (5-year-ahead forecasts)
B. Inflation expectations in EMDEs (5-year-ahead forecasts)
C. Share of countries with declines in 5-year-ahead inflation expectations, 1995-2018
D. Inflation expectations and actual inflation: Advanced Economies
Source: Consensus Economics, International Monetary Fund, Dincer and Eichengreen 2014, World Bank.
Note: EMDEs = emerging market and developing economies.
A.B. Solid lines indicate the median and dotted lines indicate the interquartile range.
C. The orange line indicates 50 percent of the countries.
D. High (low) transparency countries are defined as those with central bank transparency above the 75th (below the 25th) percentile of EMDEs.
0
1
2
3
4
5
1990
1993
1997
2000
2004
2007
2011
2014
2018
Median Interquartile rangePercent
0
2
4
6
8
1995
1997
1999
2001
2003
2005
2007
2009
2011
2013
2015
2018
Median Interquartile rangePercent
20
30
40
50
60
70
80
Advanced economies EMDEs
Percent of countries
0
2
4
6
8
1995
1998
2001
2004
2007
2010
2013
2016
High Transparency Low TransparencyPercent

19
FIGURE 10 Historical perspective
The current period of low and stable inflation resembles inflation during the Bretton Woods system of fixed exchange rates in the 1950s and 1960s and during the gold standard in the early 1900s—both systems provided nominal anchors.
A. Inflation distribution B. Inflation and inflation volatility
C. Inflation in 1900-13, 1944-71 and 2010-17 D. Inflation volatility in 1900-13, 1944-71 and
2010-17
Source: World Bank.
Note: OPEC = Organization of the Petroleum Exporting Countries
A.B. Based on a sample of 26 countries.
B. A = gold standard and stability (1880-1913); B = World War I and high inflation (1914-18); C = post–World War I depresion and deflation (1920-22); D = Great Depression (1929-33); E = World War II, monetary controls and post-war inflation (1945-49); E and F = Bretton Woods system of fixed exchange rates (1944-71); F = floating exchange rates and oil shocks (OPEC, 1971-79); G = introduction of inflation targeting (1990-2000); H = global financial crisis.
B.D. Volatility is defined as the rolling standard deviation.
C.D. Cross-country average and standard deviation of annual average inflation. Orange lines denote 1900-2017 average.
The Phillips curve summarizes the response of inflation to unexpected short-term shocks. Demand-side inflationary pressures include monetary and fiscal policy as well as asset price swings that can affect consumption through wealth effects. Supply-side factors include raw material (energy and food) price shocks, wage growth, and currency depreciation
020406080
100
1900
-191
3
1950
-196
0
1944
-197
1
1998
-200
7
2010
-201
7
Below 0 percent 0 to 2 percent2 to 5 percent 5 to 10 percentAbove 10 percent
Percent
-15
-10
-5
0
5
10
15
20
1900
1910
1920
1930
1940
1950
1960
1970
1980
1990
2000
2010
2017
Level Volatility
BA GFD EC H
Percent
0.0
1.0
2.0
3.0
4.0
5.0
1900-1913 1944-1971 2010-17
AveragePercent
0.0
1.0
2.0
3.0
4.0
5.0
1900-1913 1944-1971 2010-17
AveragePercent

20
Empirically, variants of the Phillips curve have been used to model inflation dynamics.6 Wage Phillips curve models link wage growth to labor market slack (or broader economic slack) and wage bargaining power (Phillips 1958; Gali 2010; Kahn 1980). Price Phillips curve models link price inflation to unit labor cost or, more generally, labor market slack and material cost (Bhattarai 2016; Blanchard and Gali 2008). Open economy Phillips curve models include external cost-push factors such as foreign inflation, commodity prices, import prices, and exchange rates, and external demand-pull factors represented by global output gaps (Draghi 2015; Abbas, Bhattacharya, and Pasquale 2016).
Long-term structural factors can affect how inflation and inflation expectations respond to short-term shocks and the level at which inflation settles absent such shocks. Matusoka, Kose, Panizza and Vorisek (2019) document how the presence of inflation targeting regimes has helped better anchor inflation expectations. Among EMDEs, other supporting factors have included greater central bank credibility, greater trade openness, and lower government debt.
These long-term correlates of inflation are the focus of the remainder of this paper. They have changed significantly over the past four to five decades. Global trade and financial flows have more than doubled since 1970, as many economies have liberalized trade regimes and capital accounts. Many economies have adopted inflation targeting and moved away from fixed exchange rate regimes while strengthening fiscal frameworks and liberalizing labor markets.
In EMDEs, similar structural changes have taken place as in advanced economies, although somewhat later and, in some respects, to a lesser degree. For example, by 1998, when Poland became the first EMDE to adopt a full inflation targeting regime, more than one-quarter of advanced economies had already switched to inflation targeting. During 2000-14, central bank independence and transparency improved in the median advanced economy and EMDE, but the increase was considerably more pronounced (2.25 index points) in advanced economies than in EMDEs (1 index point). And central bank independence and transparency in the median EMDE remains at only one-third the level in the median advanced economy. Similarly, whereas the increase in trade openness in EMDEs occurred broadly in step with advanced economies, the increase in financial integration during the 1980s and 1990s was considerably more pronounced in advanced economies than in EMDEs.
Trends in long-term drivers have contributed to global disinflation. On average, inflation has been lower and declined by more in countries that have been more open to trade, had (or switched to) inflation targeting regimes, had more independent and transparent central banks, and had more open capital accounts. This section presents these correlations in descriptive statistics and, more formally, in regression analysis and frames them in the context of the literature.
A series of bivariate regressions is estimated to identify the main correlates of the decline in inflation between the 1980s and the 2010s. The sample includes 73-77 countries (depending on the availability of the correlates of inflation), of which 49-53 countries are emerging market and
6 Evidence for a Phillips curve relationship is found by Batini, Jackson, and Nickell (2005); Rumler (2007); Osorio and Unsal (2013); Ciccarelli and Mojon (2010); Eickmeier and Pijnenburg (2013); Gamber and Hung (2001); Guerrieri, Gust, and López-Salido (2010); Bianchi and Civelli (2015); Ihrig et al. (2010); Milani (2012); Zhang (2015); and Nguyen et. al. (2017). Evidence that the link between inflation and output gaps has declined is found by Roberts (2006); Mishkin (2007); and Szafranek (2017).

21
developing economies. Countries with populations of less than 3 million are dropped, since they tend to be outlier observations.
Specifically, the regression is estimated as ∆inflation it = α + β X it , with robust standard errors. All
changes are between averages for 1980-89 and 2010-17. The constant α in this regression denotes the unconditional average decline in inflation over the three decades. To avoid multicollinearity, since most of the regressors are highly correlated with each other, the regression only estimates bivariate correlations.
The regressors X it include the change in trade openness (identified as trade as a percentage of gross domestic product [GDP]); the change in capital account openness (defined as the Chinn-Ito index of financial openness); the switch to an inflation targeting regime; the switch to a pegged exchange rate regime (as defined by Shambaugh [2004]); the change in Dincer and Eichengreen’s (2014) central bank independence and transparency index; the switch to a status of being highly integrated into global value chains (as defined in Ha, Kose and Ohnsorge 2019); the initial level of government debt as a percentage of GDP; net energy imports as a percentage of GDP; and net food imports as a percentage of GDP.
5.1. Trade integration Literature. Trade integration—increased openness to international trade—is typically accompanied by higher shares of imports in consumption and production and lower prices (compared with a closed economy), owing to competitive pressures from foreign producers.7 Increasing trade integration may also account for rising international comovement in inflation. The impact on the responsiveness of inflation to domestic economic slack (that is, the slope of the Phillips curve) is ambiguous: greater foreign competition reduces firms’ ability to raise prices and wages in response to domestic demand pressures, hence flattening the Phillips curve; alternatively, if greater foreign participation in domestic markets increases competitive pressures, it could encourage a faster response to demand pressures, hence steepening the Phillips curve.8 Greater trade openness appears to be associated with lower inflation volatility.9
Trade in intermediate goods—a proxy for integration into global value chains—may be more informative about international competitive pressures on inflation than trade in final goods (Lombardo and Ravenna 2014; Burstein, Kurz, and Tesar 2008). Global value chain integration has facilitated the adoption of “just-in-time” inventory practices and is associated with lower inflation volatility (Hakkio 2013). It has also been associated with a greater role of global factors in domestic inflation and greater international synchronization of inflation (Auer, Borio, and Filardo 2017).
7 Yellen (2006); Romer (1993); Terra (1998); Lane (1997); Al Naseer, Sachsida, and Mário (2009); Vuletin and Zhu (2011). In particular, the increased trade integration of China into the global trading system, since its World Trade Organization accession in 2001, may have reduced inflation globally (Frankel 2007; IMF 2016; Eickmeier and Kühnlenz 2013). Meanwhile, the rising role of services, which are less subject to external shocks, may have helped reduce inflation volatility, but the increasing productivity gap between tradables and nontradables with relatively subdued wage growth might have lifted inflation rates (Roncaglia de Carvalho 2014; Lünnemann and Mathä 2005). 8 Borio and Filardo (2007), Iakova (2007), Kohn (2006), Razîn and Binyamini (2007), and Yellen (2006) argue for flattening Phillips curves; Sbordone (2007) and Benigno and Faia (2016) argue for steepening Phillips curves. 9 Granato, Lo, and Wong (2006); Bowdler and Malik (2005).

22
Trends in trade integration. Over the past four to five decades, global trade openness (the sum of exports and imports relative to GDP) has increased by more than half—to 74 percent of global GDP in 2016, from almost 50 percent of global GDP in 1970. In the median EMDE, trade openness increased from almost 50 percent of GDP in 1970 to 72 percent of GDP in 2016. Similarly, in the median advanced economy, trade openness increased from 47 percent of GDP in 1970 to 80 percent of GDP in 2016. The expansion of trade by EMDEs has been accompanied by rapidly rising trade integration among EMDEs, with China becoming the largest trading partner for one-fifth of the countries in this group (World Bank 2016). The most rapid expansion of trade occurred in the 1990s and early 2000s (Figure 11).
Since the 1990s, trade integration has fostered the creation and expansion of global value chains, especially among advanced economies. As a result, the share of foreign value added embodied in exports in advanced economies (backward integration) increased from 10 percent in the 1970s to about 30 percent on average during 2000-16. Although less rapidly and somewhat later, the share of foreign value added in domestic exports in EMDEs also increased in the 1990s and 2000s, to 10 percent in 2016, from 1.5 percent in 1990.
Correlation with inflation. Inflation levels and volatility have typically been lower in economies and time periods with greater trade openness. The full sample was split into country-year pairs in the bottom and top quartiles of trade-to-GDP ratios and shares of foreign value added in exports. Median inflation was 4 percentage points lower and half as volatile in the top quartile than in the bottom quartile of trade-to-GDP ratios. Inflation was also more than 3 percentage points lower and one-fifth as volatile in the top quartile than in the bottom quartile of global value chain participation.
The bivariate panel regression suggests that, in countries where trade openness increased by 10 percentage points of GDP over the past four decades—about the median in the sample—inflation declined (although insignificantly) by 0.2 percentage point more than average over the same period. This relationship was even weaker among EMDEs (Tables 1 and 2).
5.2. Financial openness
Literature. In theory, financial openness could raise or depress inflation volatility. If capital flows help smooth fluctuations in consumption in a financially open economy, they can moderate domestic demand swings that might otherwise generate inflationary or disinflationary pressures. This would reduce inflation volatility. Conversely, procyclical capital inflows could themselves generate larger domestic demand swings and cause greater volatility in output and inflation.
Empirically, greater capital account openness has been associated with lower inflation. Multiple studies have found in large cross-sections of countries that greater capital account openness has been accompanied by lower average inflation (Badinger 2009; Gruben and McLeod 2002; Aizenman, Chinn, and Ito 2008). This pattern has been attributed to a stronger anti-inflation bias of central banks amid sharper trade-offs between output growth and inflation (Badinger 2009), or to a greater interest rate elasticity of money demand (Gruben and McLeod 2002).

23
FIGURE 11 Trade integration and inflation
Since the 1970s, global trade and global value chain integration has deepened significantly. Greater trade openness and deeper supply chain integration have been associated with lower inflation and inflation volatility and a sharper decline in inflation since the 1970s, especially in EMDEs. A. Trade in advanced economies and EMDEs B. Participation in global value chains
C. Inflation, by trade openness and global value chain participation
D. Correlation between disinflation and changes in trade openness (1980s-2010s)
Source: IMF Direction of Trade Statistics; OECD; World Bank World Development Indicators; WTO.
Note: Inflation volatility is defined as volatility in cyclical inflation, detrended using Stock and Watson’s (2016) methodology. Inflation refers to year-on-year inflation. EMDEs = emerging market and developing economies; GDP = gross domestic product; GVC = global value chain.
A. Median trade-to-GDP ratio in EMDEs, advanced economies, and globally.
B.C.D. Backward participation in global value chains is a measure of how much foreign value added is embodied in a country’s exports, as a percentage of total gross exports. Data are available for 59 countries for 1995, 2000, 2005, and 2008-11. Forward participation in global value chains is a measure of how much a country’s value added is embodied in foreign exports, as a percentage of total gross exports. Data are available for 59 countries for 1995, 2000, 2005, and 2008-11. Data are available for a maximum of 166 countries, but with uneven coverage; the data are available for 1988-2016 for 137 countries (World Bank 2017a, 2017b).
C. Columns indicate median inflation in countries with global value chain integration and trade openness in the top quartile. Horizontal bars indicate median inflation in countries with trade openness and global value chain integration in the bottom quartile. The difference in inflation levels and volatility (except for volatility in advanced economies) between high and low trade openness and GVC participation is statistically significant at the 1 percent level.
D. Blue bars show the coefficient estimates from bivariate panel regressions of changes (between the decadal averages of the 1980s and 2010s) in inflation on changes in trade openness over the same period (see Tables 1 and 2). Vertical lines are ±1.64 standard errors of the coefficient estimate
0
20
40
60
80
100
1970
1975
1980
1985
1990
1995
2000
2005
2010
2017
World Advanced economies EMDEsPercent of GDP
0102030
Ba
ckw
ard
For
war
d
Inte
rmed
iate
Ba
ckw
ard
For
war
d
Inte
rmed
iate
Ba
ckw
ard
For
war
d
Inte
rmed
iate
All Advancedeconomies
EMDEs
1970s 2000-16Percent
0
4
8
12
All
Ad
van
ced
eco
no
mie
s
EM
DE
s
All
Ad
van
ced
eco
no
mie
s
EM
DE
s
All
Ad
van
ced
eco
no
mie
s
EM
DE
s
All
Ad
van
ced
eco
no
mie
s
EM
DE
s
Trade GVC Trade GVC
Inflation level Inflation volatility
High trade openness High integrationLow trade openness Low integration
Percent
-6.0
-3.0
0.0
3.0
6.0
-0.2
-0.1
0.0
0.1
0.2
All EMDEs All EMDEs
Trade GVC (RHS)
Coefficient Percent

24
Trends in financial openness. Advanced economies liberalized their capital accounts almost fully between 1970 and 2000, whereas capital account liberalization in EMDEs has proceeded at a more guarded pace (Figure 12). In the median advanced economy, the Chinn and Ito (2017) index of capital account openness, which ranges between 0 and 1, increased to 0.9 in 2017 from 0.4 in 1970. In the median EMDE, this index temporarily increased from 0.2 to 0.4 in the mid-1990s, but then declined again as restrictions were reimposed in the aftermath of the Asian crisis. Similarly, capital account openness in EMDEs increased again in the mid-2000s until the global financial crisis but narrowed again thereafter. Since 1970, financial integration has surged: in the median EMDE, as in the median advanced economy, the share of international assets and liabilities has more than tripled, to 121 percent of GDP in 2017 (although they remain only one-quarter the level in advanced economies).
Correlation with inflation. Capital account openness has been associated with lower inflation and inflation volatility. The country-year pairs with the top quartile of most open capital accounts had, on average, 12 percentage points (10 percentage points for EMDEs) lower inflation, and lower volatility, than the bottom quartile of country-year pairs with the least open capital accounts. Similarly, in countries and years with international assets and liabilities relative to GDP in the top quartile of the sample, inflation was less than half (and volatility was one-fifth) its level in those in the bottom quartile. The difference in inflation levels may reflect the disinflation in advanced economies after their capital accounts were largely liberalized. In EMDEs, capital account openness has also been associated with lower inflation, but this relationship has been less pronounced than in advanced economies.
Again, the panel regression suggests that an increase of 0.5 point in the capital account openness index over the past four decades was associated, on average globally, with a 4.7 percentage point stronger disinflation and, among EMDEs, a 4.0 percentage point stronger disinflation (Tables 1 and 2). Such an increase in capital account openness would be approximately in line with the top quartile for advanced economies (0.58 point increase) and the top decile in EMDEs (0.53 point increase) over the past four decades. Similarly, in EMDEs, an increase in international assets and liabilities of 30 percentage points of GDP—the median increase between the 1980s and 2010s—was associated with a statistically significant 1.5 percentage point stronger disinflation over the past four decades (Tables 1 and 2).
5.3. Monetary policy frameworks and exchange rate regimes
Literature. Pegged exchange rate regimes and inflation targeting monetary policy regimes—if supported by other policies—can provide the nominal anchor for inflation expectations that can help ensure low and stable inflation (Bernanke and Mishkin 1997; Fischer 2001; Mussa et al. 2000). Particularly for countries with weak institutions, a formal pegged exchange rate regime can signal a commitment to monetary and fiscal policy discipline. Implementation of such a strategy may not be straightforward, however. The level of the exchange rate at which the domestic currency is pegged is especially important if domestic inflation exceeds inflation in the country whose currency forms the peg: the domestic economy will then continue losing international competitiveness until the inflation rates converge. Even after the inflation rates have converged, the domestic economy may be burdened by the loss of competitiveness that has occurred since the peg was established. These issues may give rise to pressures that test the viability of the peg.

25
FIGURE 12 Capital account openness and inflation Over the past five decades, advanced economies have liberalized their capital accounts and, at a slower pace, EMDEs have partially liberalized their capital accounts. Greater capital account openness has been associated with lower and more stable inflation. A. Index of capital account openness B. International assets and liabilities
C. Index of capital account openness, EMDEs
D. Inflation by capital account openness
E. Correlation between disinflation and changes in capital account openness index (1980s-2010s)
F. Correlation between disinflation and changes in international assets and liabilities(1980s-2010s)
Source: IMF Direction of Trade Statistics; World Bank World Development Indicators. Note: Capital account openness is defined as in Chinn and Ito (2006) and ranges from 0 (closed capital account) to 1 (open capital account). Inflation refers to year-on-year inflation. A.B. Medians (A) or unweighted averages (B). C.D. Columns indicate median inflation and inflation volatility in country-year pairs with a Chinn-Ito Index (C) or a sum of international assets and liabilities relative to GDP (D) in the top quartile over 173 economies (C) or 175 economies (D) during 1970-2017. Horizontal bars indicate countries in the bottom quartile. Financial integration is defined as the sum of international assets and liabilities as a percentage of GDP. The difference in inflation levels and volatility between high and low capital account openness and financial assets and liabilities is statistically significant at the 1 percent level.E.F. Blue bars show the coefficient estimates from bivariate panel regressions of change in average annual inflation between the 1980s and the 2010s and the change in the decadal average Chinn-Ito index (E) or the change in the sum of international assets and liabilities relative to GDP (F) over the same period (Tables 1 and 2). Vertical lines are ±1.64 standard errors of the coefficient estimate.
0.0
0.2
0.4
0.6
0.8
1.0
1.2
1970
1975
1980
1985
1990
1995
2000
2005
2010
2016
World Advanced economies EMDEsPercent of GDP
0
200
400
600
1970
1975
1980
1985
1990
1995
2000
2005
2010
2016
World Advanced economies EMDEsPercent of GDP
0
3
6
9
12
15
18
All AEs EMDEs All AEs EMDEs
Inflation level Inflation volatility
High capital account opennessLow capital account openness
Percent
0
3
6
9
12
15
All AEs EMDEs All AEs EMDEs
Inflation level Inflation volatility
High financial integrationLow financial integration
Percent
-18
-12
-6
0
All EMDEs
Coefficient
-0.012
-0.008
-0.004
0.000
0.004
All EMDEs
Coefficient

26
For countries with sufficiently strong institutions to implement credible inflation targeting regimes, this can anchor expectations at the inflation target. Thus, a pegged exchange rate or inflation targeting monetary policy regime can ensure that temporary shocks to inflation—caused, for example, by exchange rate swings or food price spikes—remain temporary, without being passed through to trend or core inflation.
Pegged exchange rate regimes have been associated with lower inflation than have other exchange rate regimes (Bleaney and Fielding 2002; Ghosh et al. 1997). In transition economies during the 1990s and 2000s, the switch to a pegged exchange rate regime was associated with disinflation (Domaç and Yuzefovichî 2003). In some EMDEs, the lower inflation achieved by pegging the exchange rate has been at the cost of higher volatility of output growth and inflation (Bleaney and Fielding 2002), whereas in broader samples during an earlier period, pegged exchange rate regimes were associated with more stable inflation (Ghosh et al. 1997; Moreno 2001). That said, any difference between inflation and its volatility in pegged and more flexible exchange rate regimes may partly reflect the highly diverse nature of more flexible regimes, which include countries with a wide range of institutional arrangements (Rose 2011).
In advanced economies, inflation targeting regimes have been associated with limited lasting effects on inflation levels and volatility but with lower inflation persistence. In seven advanced economies, the shift to inflation targeting in the 1990s was not always accompanied by significantly lower inflation rates or inflation volatility (Ball and Sheridan 2005; Bernanke et al. 2001; Lin and Ye 2007). Among a broader and more recent sample of advanced economies, the adoption of inflation targeting was associated with lower inflation within two years but at the cost of higher inflation volatility (Fang, Miller, and Lee 2012; Levin, Natalucci, and Piger 2004). In addition, inflation targeting was accompanied by a more modest response of inflation to exchange rate and oil price shocks (Mishkin and Schmidt-Hebbel 2007). Several studies have attributed declining inflation persistence in advanced economies in the early 2000s to inflation targeting or its introduction (Benati 2008; Canarella and Miller 2017). Widespread adoption of inflation targeting regimes has been shown to help promote global economic stability (Rose 2007; Taylor 2014).
In EMDEs, in contrast to advanced economies, inflation targeting regimes have been associated with significantly lower and more stable inflation (Fang, Miller, and Lee 2012). The introduction of such regimes has been associated with significantly larger drops in inflation than in other EMDEs (Gonçalves and Salles 2008). This reduction of inflation has partly been attributed to better anchoring of inflation expectations and, in some EMDEs, lower inflation persistence (Batini and Laxton 2007; Canarella and Miller 2017; Gerlach and Tillmann 2012). That said, some studies have found that the effectiveness of inflation targeting in lowering inflation in EMDEs varies widely by country characteristics, including fiscal positions and the length of time since the adoption of inflation targeting (Mishkin 2000, 2008a; Lin and Ye 2009).
Trends in exchange rate and inflation targeting regimes. Over the past four to five decades, inflation targeting monetary policy regimes have become widespread, while pegged exchange rate regimes, which were predominant up to the 1970s, have receded. In 1990, New Zealand was the only economy implementing inflation targeting. A growing number of advanced economies and EMDEs have subsequently adopted inflation targeting regimes, in an effort to replace the nominal anchor offered by pegged exchange rates. The number of inflation targeting central banks increased to 14 by 2000 and 35 by 2017 (Figure13), and the share of EMDEs relying on pegged

27
exchange rate regimes fell by one-third between 1970 (84 percent of countries) and 2017 (54 percent). Many inflation targeting central banks, especially in EMDEs, have brought inflation within target ranges while also lowering the midpoints of target ranges. The transition from fixed to floating exchange rate regimes was smoother in some countries (for example, Chile) than in others (for example, Brazil) where it was followed by exchange rate crises.
Correlation with inflation. Among countries with pegged exchange rate regimes or inflation targeting monetary policy frameworks, inflation was, on average, 3-4 percentage points lower than under other exchange rate and monetary policy regimes (Figure 14). This was most evident among EMDEs: fixed exchange rate regimes and inflation targeting regimes were associated with 3-4 percentage points lower inflation, whereas in advanced economies, the difference was less than 2 percentage points. Compared with other exchange rate and monetary policy regimes, inflation targeting regimes were also associated with lower inflation volatility, while pegged exchange rate regimes were not.
A panel regression suggests that, over the past four decades, a switch to an inflation targeting regime tended to be accompanied by 6.5 percentage points more disinflation (9.1 percentage points more for EMDEs) than average (Table 1). One-quarter of the advanced economies and one-tenth of the EMDEs in the sample made the switch to an inflation targeting regime over this period. A switch to a pegged exchange rate regime had no statistically significant impact among EMDEs.
5.4. Central bank independence and transparency
Literature. A stability-oriented monetary policy and exchange rate regime can be bolstered by central bank independence and transparency. A more independent central bank is in a more credible position to achieve monetary policy targets, even at the expense of other economic policy targets. More transparent central bank operations, strategy, and communications can safeguard the legitimacy of the central bank, enhance public understanding of and confidence in sound monetary policy, promote informed discussion among market participants and the broader public, and more effectively guide and stabilize inflation expectations.
Empirically, central bank transparency has been found to help anchor inflation expectations in advanced economies (van der Cruijsen and Demertzis 2007; Demertzis and Hallett 2007). In these economies, central bank transparency has reduced inflation expectations and, therefore, inflation and inflation uncertainty (Weber 2016; Siklos 2003; Demertzis and Hallett 2007). More narrowly, among 87 advanced and emerging market economies, greater detail in central bank forecasts has been accompanied by lower inflation, except in countries with exchange rate targeting regimes (Chortareas, Stasavage, and Sterne 2001). That said, Cecchetti and Krause (2002) find that in 63 advanced and emerging market economies, a long history of low inflation is more important for macroeconomic stability than any particular institutional arrangement. The impact on inflation persistence remains ambiguous (Dincer and Eichengreen 2010).

28
FIGURE 13 Inflation targeting regime and inflation
Over the past five decades, inflation targeting monetary policy regimes have become widespread, while pegged exchange rate regimes, which were predominant in the 1970s, have receded.
A. Share of countries with pegged exchange rate regimes
B. Countries with inflation targeting regimes
C. Inflation targets
D. Number of advanced economies and EMDEs meeting inflation targets
Source: Caceres, Carrière-Swallow, and Gruss 2016; International Monetary Fund; Shambaugh 2004; World Bank.
Note: Pegged exchange rates are defined, based on a de facto classification, as exchange rates fluctuating within a +/-2 percent band or at most, one one-time devaluation over the preceding 11-month period relative to a country-specific refer- ence currency (Shambaugh 2004). Inflation targeting regimes are defined as in Caceres, Carrière-Swallow, and Gruss (2016) and the IMF Annual Report on Exchange Arrangements and Exchange Restrictions. EMDEs = emerging market and developing economies.
B. Bars indicate the number of countries with inflation targeting regimes in which inflation is within or below the target range or below the point target (“Within or below target”) or above the target range or point target (“Above target”).
C. Median inflation target among 34 advanced economies and 141 EMDEs. Dashed lines represent interquartile ranges of upper and lower bounds.
D. Number of advanced economies and EMDEs meeting their inflation targets, 2000-17
0
20
40
60
80
100
1970
1975
1980
1985
1990
1995
2000
2005
2010
2015
Advanced economies EMDEsPercent of countries
0
10
20
30
40
1990
1992
1994
1996
1998
2000
2002
2004
2006
2008
2010
2012
2014
2017
Within or below target
Above target
Number of countries
0
1
2
3
4
5
6
7
2000
2002
2004
2006
2008
2010
2012
2014
2017
Advanced economies EMDEsPercent of countries
0
2
4
6
8
10
12
2000
2002
2004
2006
2008
2010
2012
2014
2017
Advanced economies EMDEsNumber of countries

29
FIGURE 14 Monetary framework, exchange rate regime, and inflation Among countries with pegged exchange rate regimes or inflation targeting monetary policy frameworks, inflation was lower and less volatile and has declined more strongly since the 1970s than under other exchange rate and monetary policy regimes. A. Inflation, by monetary policy and exchange rate regime
B. Difference in disinflation associated with switch in exchange rate regime and monetary policy regime (1980s-2010s)
Source: Caceres, Carrière-Swallow, and Gruss 2016; Shambaugh 2016; World Bank World Development Indicators; World Bank. Note: Pegged exchange rates are defined, based on a de facto classification, as exchange rates fluctuating within a ±2 percent band or at most one one-time devaluation over the preceding 11-month period relative to a country-specific reference currency (Shambaugh 2004). Inflation targeting regimes (“IT”) are defined as in Caceres, Carrière-Swallow, and Gruss (2016) and the IMF Annual Report on Exchange Arrangements and Exchange Restrictions. Inflation refers to year-on-year inflation. AEs = advanced economies; EMDEs = emerging market and developing economies; EX = exchange rate regime; IT = inflation targeting regime. A. Columns show median inflation in countries with pegged or inflation targeting monetary policy regimes during 1970- 2017. Horizontal bars indicate median inflation in countries without pegged or inflation targeting monetary policy regimes during the same period. The difference in inflation levels and volatility between inflation targeting and other regimes is statistically significant at the 1 percent level. B. Blue bars show the coefficient estimates from bivariate panel regressions of changes (between 1980-89 and 2010-17) in inflation on a switch (over the same period) to an inflation targeting regime or pegged exchange rate regime (Tables 1 and 2). Vertical lines are ±1.64 standard errors of the coefficient estimate. The difference in inflation levels and volatility between high and low central bank independence and transparency is statistically significant at the 1 percent level.
Trends in central bank independence and transparency. Central bank independence and transparency have increased considerably over the past two decades, especially in EMDEs (Figure 15). In the median EMDE, the index of central bank independence and transparency increased more than one-and-a-half-fold since 1990, to 5.4 in 2014. Notably, the turnover rate of heads of central banks fell by one-third among EMDEs between 1990 and 2016, with the most widespread improvements in East Asia and Pacific and Europe and Central Asia.10
Correlation with inflation. On average, country-year pairs ranking in the top quartile of the index of central bank independence and transparency have had 4 percentage points lower inflation (3 percentage points for EMDEs) and one-half to one-fifth of the inflation volatility of country-year pairs ranked in the bottom quartile of the sample. These differences are most pronounced in EMDEs. A panel regression suggests that a one-point improvement in the Dincer and Eichengreen
10 For sources and definitions of data on turnover rates, see Ha, Kose and Ohnsorge (2019).
02468
10
All
AE
s
EM
DE
s
All
AE
s
EM
DE
s
All
AE
s
EM
DE
s
All
AE
s
EM
DE
sEX
regimeMonetary
policyEX
regimeMonetary
policy
Inflation level Inflation volatility
Peg IT Non-peg Non-ITPercent
-16
-12
-8
-4
0
4
All EMDEs All EMDEs
Peg IT
Percentage points
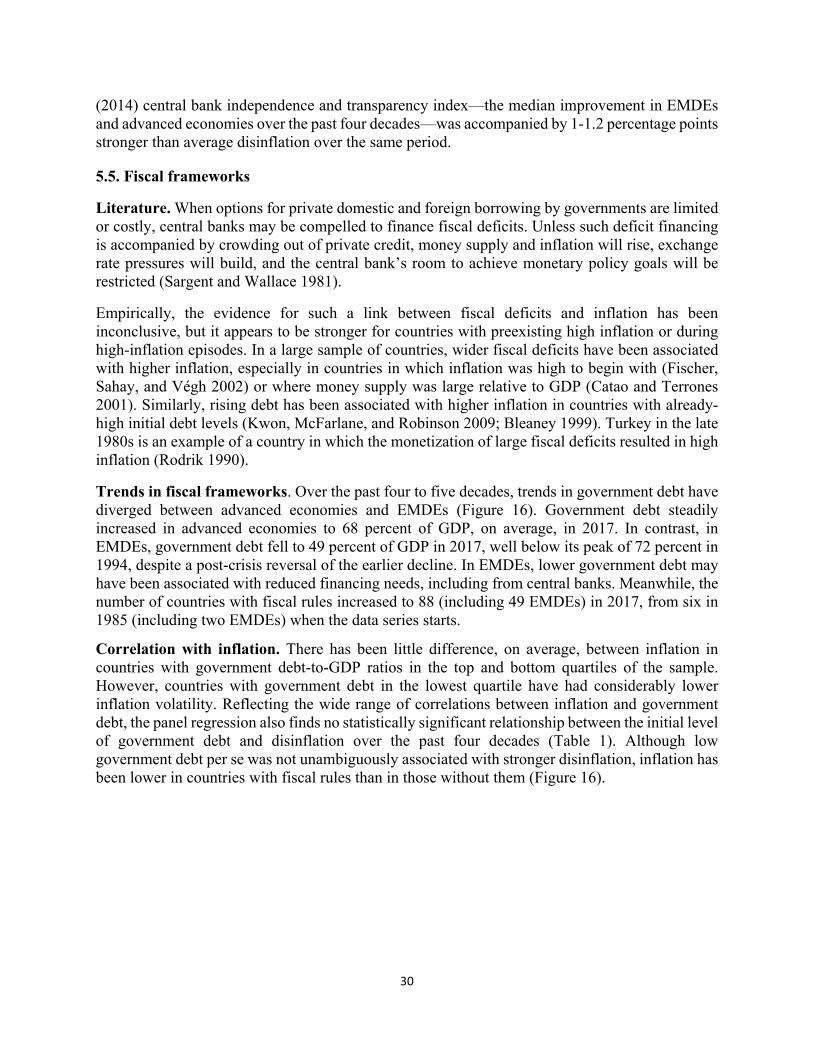
30
(2014) central bank independence and transparency index—the median improvement in EMDEs and advanced economies over the past four decades—was accompanied by 1-1.2 percentage points stronger than average disinflation over the same period.
5.5. Fiscal frameworks
Literature. When options for private domestic and foreign borrowing by governments are limited or costly, central banks may be compelled to finance fiscal deficits. Unless such deficit financing is accompanied by crowding out of private credit, money supply and inflation will rise, exchange rate pressures will build, and the central bank’s room to achieve monetary policy goals will be restricted (Sargent and Wallace 1981).
Empirically, the evidence for such a link between fiscal deficits and inflation has been inconclusive, but it appears to be stronger for countries with preexisting high inflation or during high-inflation episodes. In a large sample of countries, wider fiscal deficits have been associated with higher inflation, especially in countries in which inflation was high to begin with (Fischer, Sahay, and Végh 2002) or where money supply was large relative to GDP (Catao and Terrones 2001). Similarly, rising debt has been associated with higher inflation in countries with already-high initial debt levels (Kwon, McFarlane, and Robinson 2009; Bleaney 1999). Turkey in the late 1980s is an example of a country in which the monetization of large fiscal deficits resulted in high inflation (Rodrik 1990).
Trends in fiscal frameworks. Over the past four to five decades, trends in government debt have diverged between advanced economies and EMDEs (Figure 16). Government debt steadily increased in advanced economies to 68 percent of GDP, on average, in 2017. In contrast, in EMDEs, government debt fell to 49 percent of GDP in 2017, well below its peak of 72 percent in 1994, despite a post-crisis reversal of the earlier decline. In EMDEs, lower government debt may have been associated with reduced financing needs, including from central banks. Meanwhile, the number of countries with fiscal rules increased to 88 (including 49 EMDEs) in 2017, from six in 1985 (including two EMDEs) when the data series starts.
Correlation with inflation. There has been little difference, on average, between inflation in countries with government debt-to-GDP ratios in the top and bottom quartiles of the sample. However, countries with government debt in the lowest quartile have had considerably lower inflation volatility. Reflecting the wide range of correlations between inflation and government debt, the panel regression also finds no statistically significant relationship between the initial level of government debt and disinflation over the past four decades (Table 1). Although low government debt per se was not unambiguously associated with stronger disinflation, inflation has been lower in countries with fiscal rules than in those without them (Figure 16).

31
FIGURE 15 Central bank transparency and inflation Over the past three decades, central banks have become more independent and transparent. Greater central bank independence and transparency has been associated with lower and more stable inflation. A. Countries with improving central bank independence and transparency, by region (1998-2014)
B. Countries with improving central bank independence and transparency, by country group (1998-2014)
C. Inflation, by central bank independence and transparency
D. Correlation between disinflation (1980s-2010s) and changes in central bank independence and transparency
Source: Dincer and Eichengreen 2014; World Bank World Development Indicators.
Note: The CBI is defined as in Dincer and Eichengreen (2014), extrapolated as described in Ha, Kose and Ohnsorge (2019). The index ranges from 0 (least independent and transparent) to 15 (most independent and transparent). Inflation refers to year-on-year inflation. AEs = advanced economies; CBI = central bank independence and transparency index; EAP = East Asia and Pacific; ECA = Europe and Central Asia; EMDEs = emerging market and developing economies; LAC = Latin America and the Caribbean; LICs = low-income countries; MNA = Middle East and North Africa; SAR = South Asia; SSA = Sub-Saharan Africa.
C. Columns indicate the median inflation levels and inflation volatility in country-year pairs with a CBI in the top quartile of the sample. Bars denote medians for country-year pairs in the bottom quartile. The difference in inflation levels and volatility between high and low CBI is statistically significant at the 1 percent level.
D. Blue bars show the coefficient estimates from bivariate panel regressions of changes in average inflation between the 1980s and the 2010s on the change in average CBI over the same period (Tables 1 and 2). Vertical lines are ±1.64 standard errors of the coefficient estimate.
0
20
40
60
80
100
EAP ECA LAC MNA SAR SSA
Percent of countries
0
20
40
60
80
100
Advancedeconomies
EMDEs LICs
Percent of countries
02468
10
All
Ad
van
ced
eco
nom
ies
EM
DE
s
All
Ad
van
ced
eco
nom
ies
EM
DE
s
Inflation level Inflation volatility
High CBI Low CBIPercent
-2.5
-2.0
-1.5
-1.0
-0.5
0.0
All EMDEs
Coefficient
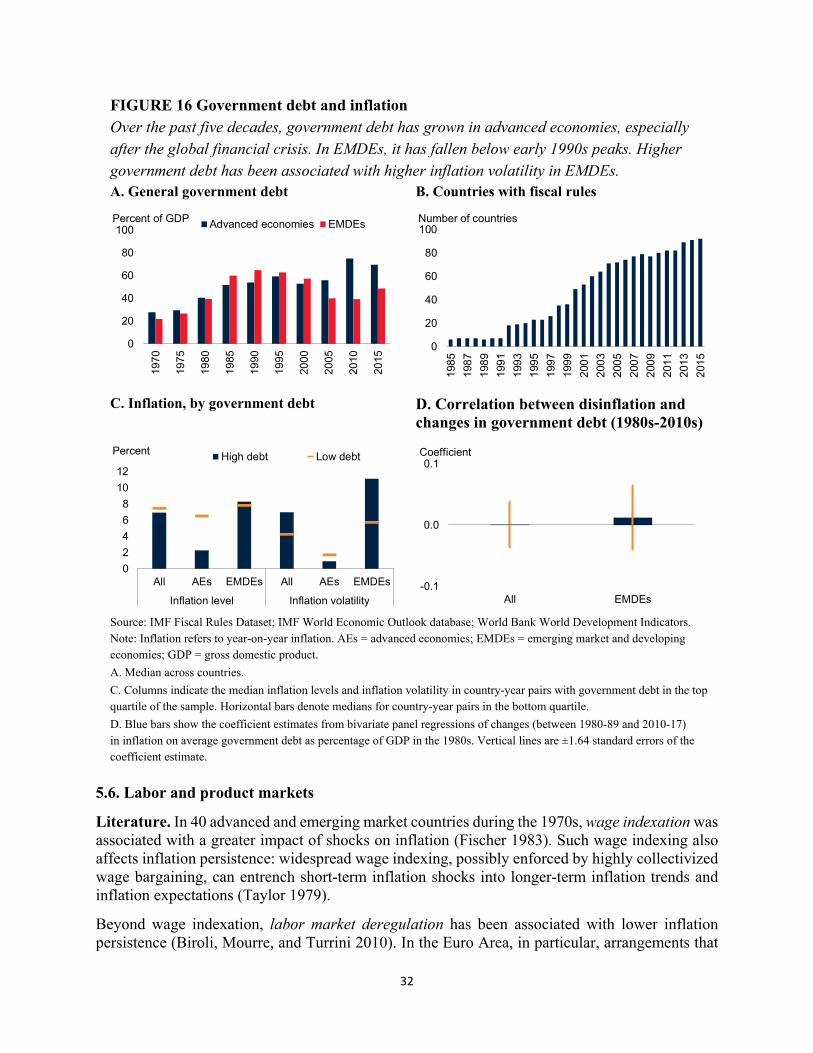
32
FIGURE 16 Government debt and inflation Over the past five decades, government debt has grown in advanced economies, especially after the global financial crisis. In EMDEs, it has fallen below early 1990s peaks. Higher government debt has been associated with higher inflation volatility in EMDEs. A. General government debt B. Countries with fiscal rules
C. Inflation, by government debt
D. Correlation between disinflation and changes in government debt (1980s-2010s)
Source: IMF Fiscal Rules Dataset; IMF World Economic Outlook database; World Bank World Development Indicators. Note: Inflation refers to year-on-year inflation. AEs = advanced economies; EMDEs = emerging market and developing economies; GDP = gross domestic product.
A. Median across countries.
C. Columns indicate the median inflation levels and inflation volatility in country-year pairs with government debt in the top quartile of the sample. Horizontal bars denote medians for country-year pairs in the bottom quartile.
D. Blue bars show the coefficient estimates from bivariate panel regressions of changes (between 1980-89 and 2010-17) in inflation on average government debt as percentage of GDP in the 1980s. Vertical lines are ±1.64 standard errors of the coefficient estimate.
5.6. Labor and product markets
Literature. In 40 advanced and emerging market countries during the 1970s, wage indexation was associated with a greater impact of shocks on inflation (Fischer 1983). Such wage indexing also affects inflation persistence: widespread wage indexing, possibly enforced by highly collectivized wage bargaining, can entrench short-term inflation shocks into longer-term inflation trends and inflation expectations (Taylor 1979).
Beyond wage indexation, labor market deregulation has been associated with lower inflation persistence (Biroli, Mourre, and Turrini 2010). In the Euro Area, in particular, arrangements that
0
20
40
60
80
100
1970
1975
1980
1985
1990
1995
2000
2005
2010
2015
Advanced economies EMDEsPercent of GDP
0
20
40
60
80
100
198
5
198
7
198
9
199
1
199
3
199
5
199
7
199
9
200
1
200
3
200
5
200
7
200
9
201
1
201
3
201
5
Number of countries
0
2
4
6
8
10
12
All AEs EMDEs All AEs EMDEs
Inflation level Inflation volatility
High debt Low debtPercent
-0.1
0.0
0.1
All EMDEs
Coefficient

33
facilitate labor market flexibility—such as lower employment protection, less union density, and more limited collective bargaining—have been found to reduce inflation persistence (Jaumotte and Morsy 2012). A similar result was found for a broader sample of countries in the Organisation for Economic Co-operation and Development (OECD) (Geronikolaou, Spyromitros, and Tsintzos 2016).
Greater product market flexibility can enhance competition and vice versa. By making wages and prices more flexible, including by deregulating administrative prices, it reduces and makes more transitory the real effects of monetary policy and, hence, reduces the incentive for central banks to use stimulus to boost growth and employment (Rogoff 2003). As a result, inflation expectations and inflation could be lower. Empirically, there is some tentative evidence of lower inflation persistence among advanced economies with greater product market flexibility (Biroli, Mourre, and Turrini 2010).
Trends in labor and product markets. Since 2000, labor market flexibility has increased in advanced economies and EMDEs (Figure 17). For example, in EMDEs, union membership declined sharply to 5-15 percent of the labor force in 2013, well below the 2000 level (15-35 percent). In some EMDEs with already-elevated wage bargaining coverage, union membership has expanded, but it remains well below the levels in advanced economies, where it has receded somewhat since 2008.
Correlation with inflation. Lower union membership has been associated with lower inflation and inflation volatility in EMDEs (Figure 17). In EMDEs in the bottom third of the sample for union membership, inflation was about 1 percentage point lower, on average, and inflation volatility was less than half that in the top third of the sample.11 For advanced economies, in contrast, the difference was modest.
5.7. Economic structure
Literature. Unless commodity-reliant economies can fully stabilize output growth and exchange rate swings, they may face greater macroeconomic volatility, including inflation volatility, as a result of volatile commodity prices (Bayoumi and Ostry 1997). Conversely, countries that rely heavily on food imports may be subject to greater global food price volatility. However, the consequences of resource reliance for macroeconomic stability depend on policy frameworks: monetary policy independence and financial openness may mitigate the volatility caused by global commodity price swings in resource-based economies (Aizenman, Chinn, and Ito 2010).
Economic structure in EMDEs. About two-thirds of EMDEs rely heavily on commodity exports. In these countries, the commodity sector accounts for 30-80 percent of exports, 20-70 percent of government revenues, and 5-20 percent of GDP. The fall in commodity prices from their peaks in early 2011 has encouraged some economic diversification. In 2016, the share of exports accounted for by commodities in these countries had fallen to 25-70 percent.
Correlation with inflation. The oil price plunge during 2014-16 helped reduce inflation, particularly among EMDEs with a high share of energy imports in GDP. For every additional 10 percentage points of GDP in higher energy imports, disinflation over the past four decades was
11 These measures are unavailable for a panel of countries from the 1970s to the 1990s. Hence, labor market variables were not included in the panel regression.

34
about 0.7 percentage point steeper. In contrast, higher net food imports were associated with slower disinflation over the past four decades.
FIGURE 17 Labor markets and inflation Over the past two decades, wage-setting institutions and labor markets more broadly, have become more flexible. A. Union membership B. Labor market flexibility
C. Collective bargaining coverage D. Inflation by union membership
Source: Fraser Institute’s Economic Freedom of the World Database; ILOStat; World Bank.
Note: AEs = advanced economies; EMDEs = emerging market and developing economies.
A. Median trade union density rate in 2000 and 2013 for all, AEs, and EMDEs, with 25th and 75th percentile error bars. Data available from 2000 to 2013.
B. Median labor market flexibility index of the Fraser Institute’s Economic Freedom Index in 2000 and 2013 for all, AEs, and EMDEs, with 25th and 75th percentile error bars.
C. Median and interquartile range of share of workers covered by collective bargaining in 2008 and 2013. For 2008, data are only available for four advanced economies and five EMDEs.
D. Low union membership indicates the bottom third (below 17 percent) of the sample, high union membership indicates the top third (above 30 percent) of the sample. The sample includes 75 economies for 2000-13.
5.8. Other factors
In some countries, disinflation has been attributed to population aging and the growing digitalization of services.
0
10
20
30
40
50
2008 2013 2008 2013 2008 2013
World AEs EMDEs
Interquartile range MedianPercent
0
2
4
6
8
10
2000 2013 2000 2013 2000 2013
World AEs EMDEs
Interquartile range MedianPercent
0
10
20
30
40
2008 2013 2008 2013 2008 2013
All AEs EMDEs
Interquartile range MedianPercent
0
2
4
6
8
All AEs EMDEs All AEs EMDEs
Inflation level Inflation volatility
PercentHigh union membershipLow union membership

35
Population aging. In Japan, population aging may have contributed to chronically low inflation, as the burden of rising pension bills weighed on consumption of the working-age population; asset sales of older households depressed asset prices; and shifts toward lower-risk household assets (especially household holdings of government bonds) by older households reduced the funding envelope for fixed investment.12 Studies based on broader groups of countries have been less conclusive.13
Digitalization of services. In some advanced economies, disinflation has been attributed partly to the growing digitalization of services, including e-commerce or sharing services (Goolsbee and Klenow 2018). Although electronic sales by enterprises may still be modest, they have grown rapidly (Ciccarelli and Osbat 2017). By introducing cheaper distribution channels and increasing price transparency, these services may increase competitive pressures and, by increasing efficiency, generate cost savings (Dong, Fudurich, and Suchanek 2017). However, digitalized services may foster market concentration and the emergence of “superstar firms” that reduce competitive pressures in the long run (Autor et al. 2017).14 Empirical studies have found little evidence of significant deflationary pressures from such digitalization (Charbonneau et al. 2017). For example, using big data techniques, Cavallo and Rigobon (2016) and Cavallo (2017) find that inflation in online retail prices closely matches official U.S. price indexes. In eight other G20 countries, the evolution of online prices has also been similar to that of offline prices, although possibly with more frequent but smaller price changes.15
6. Conclusion
The paper documents the widespread (across countries) and broad-based (across components) decline in global inflation over the past four to five decades. Global inflation fell from a peak of 16.6 percent (annual average) in 1974 to 2.6 percent in 2017 and further to 2.3 percent in the second half of 2018. In advanced economies, it has fallen steadily since the mid-1980s and in EMDEs since the mid-1990s. In EMDEs, inflation declined from a peak of 17.3 percent (annual average) in 1974 to 3.5 percent in 2017 and, in LICs, from 24.9 percent (annual average) in 1994 to 5.0 percent in 2017. By 2000, global inflation had stabilized at historically low levels before the global financial crisis set off a period of renewed disinflation. Lower inflation has been accompanied by lower inflation volatility, especially in advanced economies.
The global disinflation has been broad-based. It has occurred in most countries, all EMDE regions, all measures of inflation, and all components of inflation. The current low and stable inflation episode resembles that during the Bretton Woods fixed exchange rate system in the post-war period until 1971 and during the gold standard of the early 1900s. When these historical exchange
12 Andersen, Botman, and Hunt (2014); Imam (2013); Katagiri (2018). 13 Although the Japan-specific studies referred to in the preceding footnote agree that population aging has been deflationary, studies based on groups of OECD countries are mixed: Yoon, Kim, and Lee (2014); Bobeica et al. (2017); and Inoue et al. (2016) find a negative relationship between the population share of elderly and inflation, and Juselius and Tákáts (2015) find the opposite. 14 Rapid technological change has also raised concerns that inherent quality improvements are underestimated and, hence, price levels and inflation are overestimated. Empirical studies have found little evidence to support this hypothesis (Cavallo 2017). 15 Cavallo (2017); Gorodnichenko, Sheremirov and Talavera (2016); Gorodnichenko and Talavera (2017).

36
rate systems faltered, inflation surged. In today’s context also, there are reasons to believe that structural factors that have supported disinflation over the past five decades may be fading.
Global disinflation has been supported by a confluence of structural, cyclical, and policy-related factors. A major structural change has been the unprecedented international trade and financial integration along with rapid technological progress. In the median EMDE, like in the median advanced economy, trade has increased by half since 1970, to 75 percent of GDP in 2017, and international assets and liabilities have more than tripled, to 166 percent of GDP in 2016 (although still only half the level in advanced economies).
On the policy front, the adoption of stronger monetary, exchange rate, and fiscal policy frameworks has changed policy makers’ approach to price stability. Twenty-three EMDEs have followed in the footsteps of Poland, the first EMDE to introduce an inflation targeting monetary policy framework, in 1998. Reforms of labor and product markets have made EMDEs more flexible by improving competition and reducing price rigidities. Technological changes have been transforming production processes in ways that also affect the formation of prices. In addition to these long-term structural changes, severe global and country-specific shocks have depressed inflation for an extended period.
The gains of the past four to five decades in terms of inflation are by no means guaranteed. Inflation can easily make a comeback if the fundamental structural and policy changes that have compressed inflation over the past five decades lose momentum or even reverse. However, as long as strong monetary policy frameworks are supported by sound fiscal policies and institutional structures, it would be possible to keep in check the inflationary implications of fluctuations in business and financial cycles, and movements in commodity prices.
EMDEs are particularly vulnerable to rising external inflation pressures. Their inflation expectations are less well anchored than in advanced economies. In the absence of strong monetary policy frameworks, exchange rate movements can amplify inflation pressures. Hence, a temporary, externally driven inflation surge can translate into an increase in inflation that EMDE central banks would struggle to rein in. If that happens, little support for macroeconomic stabilization may be forthcoming from fiscal policy, since EMDE fiscal positions are vulnerable to rising borrowing costs when investors reassess risks.
Future research could take two directions. First, the relative contributions of long-term structural changes to global disinflation over recent decades could be more formally quantified. This could be done in a general equilibrium framework, since most regression models are poorly suited to uncovering the relationships between such slow-moving variables. Second, future work could examine more formally the degree of comovement in long-term inflation trends. This could be set in the context of a more refined measure of trend inflation, such as trends of different lengths that could be identified in frequency domain analysis.

37
TABLE 1 Correlates of change in CPI inflation: Full sample Panel A
Variables
Net food imports (percent of GDP) 0.3077**
[0.160]
Net energy imports (percent of GDP) -0.0672***
[0.024]
Change to inflation targeting regime -6.5383***
[2.285] Change to pegged exchange rate regime -3.3842*
[2.235] Change in central bank transparency index (point increase)
Constant -3.5727***
[0.714] -3.8800***
[0.802] -2.8199***
[0.724] -3.5029***
[0.812] Observations 79 79 81 81 R-squared 0.068 0.036 0.129 0.048
Panel B
Variables Change in central bank transparency index (point increase)
-0.9784***
[0.370]
Change in trade openness (percentage points of GDP) -0.0182
[0.026] Change in capital account openness index (point increase)
-9.3815***
[2.199]
Change in international assets and liabilities (percentage points of GDP)
-0.0003
[0.001]
Initial government debt (percent of GDP) -0.0005
[0.023]
Constant -2.1583***
[0.976] -3.4944***
[0.830] -2.6809***
[0.656] -3.6822***[0.867]
-4.0227***
[1.466] Observations 77 80 80 81 77 R-squared 0.092 0.007 0.219 0.001 0.000
Note: Standard errors are in square brackets. The dependent variable is the change between the average inflation rate during 2010-17 and the average inflation rate during 1980-89. All changes are between averages for 2010-17 and 1980-89. Inflation targeting regime and pegged exchange rate regime (as defined by Shambaugh [2016]) are dummy variables. Euro Area economies are considered floating rate regimes. The central bank transparency index (0 = least, 15 = most) is from Dincer and Eichengreen (2014). The capital account openness index (0 = closed, 1 = open) is from Chinn and Ito (2008). The dummy variable for high participation in global value chains is defined in Ha, Kose and Ohnsorge (2019). CPI = consumer price index; GDP = gross domestic product. *** indicates statistical significance at the 1 percent confidence level, ** at the 5 percent level, and * at the 10 percent level.

38
TABLE 2 Correlates of change in CPI inflation: Full sample Panel A
Variables Net food imports (percent
of GDP) 0.3891***
[0.164]
Net energy imports (percent of GDP) -0.0748**
[0.039]
Change to inflation targeting regime -9.1011***
[3.001]
Change to pegged exchange rate regime -2.8823
[2.921] Constant -3.8778***
[1.044] -4.0871***
[1.170] -3.0054***
[1.105] -4.1452***
[1.160]
Observations 46 46 47 47 R-squared 0.125 0.027 0.176 0.030
Panel B
Variables Change in central bank
transparency index (point increase)
-1.2126**
[0.589]
Change in trade openness (percentage points of GDP) -0.0101
[0.037]
Change in capital account openness index (point increase)
-8.9658**
*
[3.332]
Change in international assets and liabilities (percentage points of
GDP) -0.0050**
[0.003]
Initial government debt (percent of GDP) 0.0122
[0.032]
Constant -2.5910***
[1.326] -
4.4366***
[1.238]
-3.6367**
*
[1.017]
-4.1563***
[1.150]
-5.2233***
[2.334] Observations 45 46 47 47 46
R-squared 0.092 0.002 0.149 0.033 0.003 Note: Standard errors are in square brackets. The dependent variable is the change between the average inflation rate during 2010-17 and the average inflation rate during 1980-89. All changes are between averages for 2010-17 and 1980-89. Inflation targeting regime and pegged exchange rate regime (as defined by Shambaugh [2016]) are dummy variables. Euro Area economies are considered floating rate regimes. The central bank transparency index (0 = least, 15 = most) is from Dincer and Eichengreen (2014). The capital account openness index (0 = closed, 1 = open) is from Chinn and Ito (2006). The dummy variable for high participation in global value chains is defined in Ha, Kose and Ohnsorge (2019). CPI = consumer price index; EMDEs = emerging market and developing economies; GDP = gross domestic product. *** indicates statistical significance at the 1 percent confidence level, ** at the 5 percent level, and * at the 10 percent level.

39
Annex 1. Effects of inflation on inequality and poverty
Poorer households may suffer greater welfare losses from inflation than wealthier households. In general, poorer households are less able to protect the real value of their income and assets from the impact of inflation. Although the evidence of a positive correlation between inflation and inequality or poverty is mixed at the aggregate level, the links are more established at the household level. The adoption of a credible monetary policy regime that maintains low and stable inflation may help reduce poverty and inequality. In addition, targeted pro-poor fiscal interventions and structural reforms to improve access to financial services for the poor could further mitigate any adverse effects of inflation on inequality and poverty.
Inflation can have adverse economic effects on households and other sectors of the economy through direct and indirect channels.1 Its effects can also differ among different groups of households. For example, poorer households tend to be less able than wealthier households to protect the real value of their income and assets from the impact of anticipated inflation, as poorer households are more reliant on wage income, have less access to interest-bearing accounts, and are unlikely to have significant holdings of other financial or real assets apart from cash. They may also face a higher or more volatile rate of inflation than wealthier households, due to differences in the composition of their consumption baskets—for instance, poorer households may be relatively more exposed to food price volatility. Less directly, there are close links between inflation, monetary policy, and growth. If high inflation results in tighter monetary policy or lower economic growth, it can thereby indirectly affect poverty and inequality.
If the negative effects of inflation fall disproportionately on the poor, it could worsen poverty rates, inequality, or both. Furthermore, because inflation has typically been higher in emerging market and developing economies (EMDEs) than in advanced economies over the past half-century, any negative effects arising from inflation on inequality and poverty may be larger in EMDEs. Although the empirical evidence at the aggregate level is somewhat mixed, the negative effects at the household level are more established. Policy measures to control inflation or mitigate its regressive effects, such as the adoption of a credible monetary policy regime, and targeted pro-poor fiscal interventions have the potential to attenuate inequality and poverty. For EMDEs that are implementing structural reforms and macroeconomic stabilization policies, the potentially beneficial effects of controlling inflation may offset some of the negative effects associated with such policies.
Against this background, this annex addresses the following questions:
What are the direct channels through which inflation affects inequality and poverty at the household level?
What are the indirect channels through which inflation affects inequality and poverty?
What is the impact of inflation on overall inequality and poverty?
1 Fischer and Modigliani (1978) document 25 direct and 25 indirect channels through which inflation can affect different sectors of the economy.

40
What are the major policy implications?
Direct channels from inflation to inequality and poverty
Inflation can have different effects on different groups of households. In a survey of almost 32,000 households in 38 countries, Easterly and Fischer (2001) found that the poor were much more likely than the rich to state that inflation was a problem. The composition of income, assets, and consumption baskets tends to be such that poorer households suffer greater losses in the real value of their income and wealth as a result of inflation than wealthier households, so that inflation leads to increases in inequality. However, the very poor—households living below the global poverty line of $1.90 per day—may be less vulnerable to inflation as they have minimal wage income or assets. Inflation is also closely linked to monetary policy and economic growth and can indirectly affect poverty and inequality.
Composition of income. In advanced economies, the poor tend to rely more heavily on wage income, transfers, and pensions, and less on income from capital than higher-income households (Erosa and Ventura 2002) (Figure A1.1). As wages tend to lag price inflation, inflation can reduce the real value of nominal wages, reducing the incomes of the poorest households relative to those of the richest. This also shifts income away from labor income toward profits, which, given the distribution of income between rich and poor, will also tend to worsen inequality (Laidler and Parkin 1975; Fischer and Modigliani 1978). Poorer households may also be less likely to benefit from indexed wages (for example, through unions) or through inflation-proof benefits such as health insurance (Bulir 2001). The impact of inflation on pensions and transfers depends on their prevalence in society, as well as on the level of indexation. Welfare payments in most developed countries have some form of indexation, although adjustments tend to lag inflation, which can result in erosion of real incomes for some income groups in the short run (Minarik 1979; Burdick and Fisher 2007).
Although the channels outlined above also apply to EMDEs, households in EMDEs often rely heavily on nonmonetary income, such as subsistence farming or barter. For example, in Brazil, nonmonetary income accounts for more than a quarter of total income among the poorest fifth of households. Being nonmonetary, this source of income is less vulnerable to inflation than is wage income. For households living below the poverty line of $1.90 a day per head, nonmonetary income may form most of their income, reducing their vulnerability to inflation.
Composition of assets during sustained high inflation. The poor tend to hold most of their assets in cash and have less access to financial products that can protect them against inflation, as these products typically have some entry cost associated with their use (Kahn 1997; Mulligan and Sala-i-Martin 2000; Erosa and Ventura 2002). For example, in the United States, most households have a transaction or current account at a financial institution, with 94 percent of the poorest 20 percent of households holding one. However, many fewer households have savings products, and the distribution is very skewed: the wealthiest 20 percent of households are four times as likely as the poorest to hold certificates of deposit and six times as likely to hold savings bonds. The very richest households (top 10 percent) are 12 times as likely as the poorest 20 percent to hold equities and 23 times as likely to hold pooled investment funds. New financial technologies are beginning to broaden access to financial services for poorer households (Demirgüç-Kunt et al. 2018). The differences are even more stark when considering differences in wealth. Although an inability to protect against inflation is unlikely to affect the very poor, because their holdings of cash will be

41
minimal, episodes of high inflation and especially hyperinflation could tip some households into poverty by eroding the value of their savings and lead to greater inequality (Cysne, Maldonado, and Monteiro 2005; Areosa and Areosa 2016).
FIGURE A1.1 Composition of household income, wealth, and consumption The composition of household income, wealth, and consumption varies significantly by income bracket and country. In the United States, the poorest households rely more heavily on wages and transfers, while the richest derive more income from capital. In EMDEs, such as Brazil, nonmonetary income is more important for poorer households. In EMDEs, the poorest households spend a greater share of their income on necessities such as food than the wealthy. EMDEs also spend more on food than higher-income countries such as the United States. A. Sources of U.S. household income, by income percentile
B. Sources of Brazilian household income, by income percentile
C. Inflation, by government debt
D. Correlation between disinflation and changes in government debt (1980s-2010s)
Source: Eurostat; Federal Reserve Board Survey of Consumer Finances; World Bank.
Note: EMDEs = emerging market and developing economies.
A.B Investment income includes interest income, dividends, and capital gains.
B. Income percentiles in Brazil imputed from published income levels to be broadly comparable with U.S. brackets. Data are not published in standard income quintiles. Aggregate data on EMDEs for source of income by income group were not available.
C.D. “Housing” includes utilities such as electricity and gas. “Transport” includes purchases of new vehicles as well as motor fuel. “Other” includes furnishings, personal care, and finance and insurance services.
C. Sample of 90 EMDEs, including 24 low-income countries.
0
20
40
60
80
100
0-25 25-50 50-75 75-90 90-100
Wages Self-employmentTransfers/other RetirementInvestment income
Percent
0
20
40
60
80
100
0-22 22-39 39-66 66-80 80-100
Wages Self-employmentNon-monetary income Transfers/otherRetirement Investment income
Percent
0
20
40
60
80
100
Bottom quintile Top quintile
Food & alcohol Housing ClothingHealth Transport Other
Percent of total consumption
0
20
40
60
80
100
Bottom quintile Top quintile
Food & alcohol Housing ClothingHealth Transport Other
Percent of total consumption
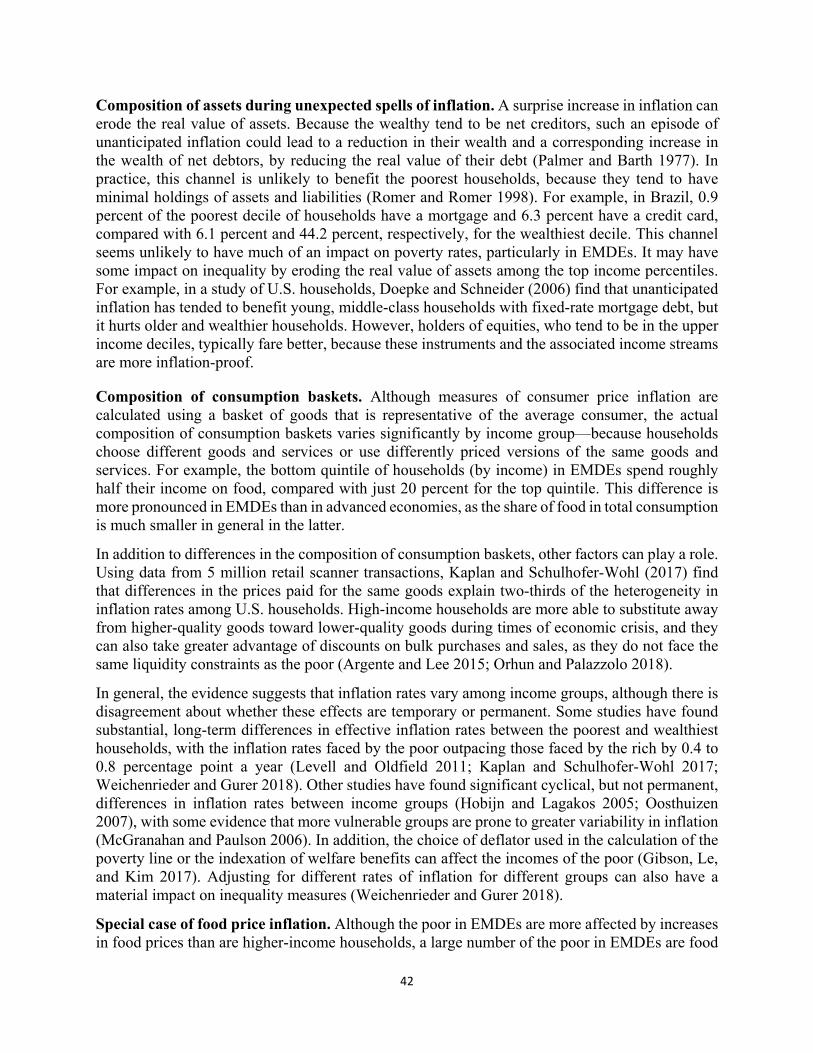
42
Composition of assets during unexpected spells of inflation. A surprise increase in inflation can erode the real value of assets. Because the wealthy tend to be net creditors, such an episode of unanticipated inflation could lead to a reduction in their wealth and a corresponding increase in the wealth of net debtors, by reducing the real value of their debt (Palmer and Barth 1977). In practice, this channel is unlikely to benefit the poorest households, because they tend to have minimal holdings of assets and liabilities (Romer and Romer 1998). For example, in Brazil, 0.9 percent of the poorest decile of households have a mortgage and 6.3 percent have a credit card, compared with 6.1 percent and 44.2 percent, respectively, for the wealthiest decile. This channel seems unlikely to have much of an impact on poverty rates, particularly in EMDEs. It may have some impact on inequality by eroding the real value of assets among the top income percentiles. For example, in a study of U.S. households, Doepke and Schneider (2006) find that unanticipated inflation has tended to benefit young, middle-class households with fixed-rate mortgage debt, but it hurts older and wealthier households. However, holders of equities, who tend to be in the upper income deciles, typically fare better, because these instruments and the associated income streams are more inflation-proof.
Composition of consumption baskets. Although measures of consumer price inflation are calculated using a basket of goods that is representative of the average consumer, the actual composition of consumption baskets varies significantly by income group—because households choose different goods and services or use differently priced versions of the same goods and services. For example, the bottom quintile of households (by income) in EMDEs spend roughly half their income on food, compared with just 20 percent for the top quintile. This difference is more pronounced in EMDEs than in advanced economies, as the share of food in total consumption is much smaller in general in the latter.
In addition to differences in the composition of consumption baskets, other factors can play a role. Using data from 5 million retail scanner transactions, Kaplan and Schulhofer-Wohl (2017) find that differences in the prices paid for the same goods explain two-thirds of the heterogeneity in inflation rates among U.S. households. High-income households are more able to substitute away from higher-quality goods toward lower-quality goods during times of economic crisis, and they can also take greater advantage of discounts on bulk purchases and sales, as they do not face the same liquidity constraints as the poor (Argente and Lee 2015; Orhun and Palazzolo 2018).
In general, the evidence suggests that inflation rates vary among income groups, although there is disagreement about whether these effects are temporary or permanent. Some studies have found substantial, long-term differences in effective inflation rates between the poorest and wealthiest households, with the inflation rates faced by the poor outpacing those faced by the rich by 0.4 to 0.8 percentage point a year (Levell and Oldfield 2011; Kaplan and Schulhofer-Wohl 2017; Weichenrieder and Gurer 2018). Other studies have found significant cyclical, but not permanent, differences in inflation rates between income groups (Hobijn and Lagakos 2005; Oosthuizen 2007), with some evidence that more vulnerable groups are prone to greater variability in inflation (McGranahan and Paulson 2006). In addition, the choice of deflator used in the calculation of the poverty line or the indexation of welfare benefits can affect the incomes of the poor (Gibson, Le, and Kim 2017). Adjusting for different rates of inflation for different groups can also have a material impact on inequality measures (Weichenrieder and Gurer 2018).
Special case of food price inflation. Although the poor in EMDEs are more affected by increases in food prices than are higher-income households, a large number of the poor in EMDEs are food

43
producers as well as consumers. A rise in food prices could therefore raise the incomes of these households. More than one-fifth of households around and below the poverty line are net food sellers in the average EMDE and would therefore benefit from higher food prices.
However, in the aggregate, the majority of the poor in EMDEs and low-income countries (LICs) are net buyers of food and, as a result, food price spikes tend to increase poverty overall. For example, the rise in food prices between 2006 and 2008 is estimated to have increased the number of poor by 105 million (Ivanic and Martin 2008).
Indirect channels from inflation to inequality and poverty
Economic growth. Inflation can indirectly affect poverty and inequality through its impact on economic growth. Historically, low and stable inflation, combined with well-anchored inflation expectations, has been associated with greater short- term stability of output and employment growth and higher long-term economic growth (Bruno and Easterly 1998; Eggoh and Khan 2014) (Figure A1.2). These effects seem to be nonlinear, with several studies finding a negative relationship between inflation and growth if inflation is higher than a certain threshold, but they find no relationship when inflation is below that threshold (Barro 1996; Khan and Senhadji 2001). Several channels account for the beneficial effects of low and stable inflation on economic activity, including reduced uncertainty for investors and households, greater pricing transparency, and greater financial stability (Annex 2). In turn, higher economic growth typically reduces poverty.
Stronger economic growth has generally been found to be beneficial for the poor and has been associated with steeper declines in poverty rates (Dollar and Kraay 2004; Dollar, Kleineberg, and Kraay 2016). The relationship has been highly nonlinear, with poverty responding less to growth when the initial poverty rate is high (Ravallion 2012; World Bank 2010). The relationship between economic development and inequality has been hypothesized by the so-called Kuznets curve, which proposes an inverse U-shape relationship (Kuznets 1955). At low levels of economic development, inequality is low, with little differentiation between households. As economies develop, inequality tends to rise amid increasing differentials in productivity and pay between workers. Finally, inequality starts to fall beyond a certain level of development, as societies choose to reduce inequality through taxes and transfer payments (Milanovic 1994). However, there is limited empirical evidence to support this theory, with many studies showing no evidence of such a relationship (Gallup 2012). Piketty (2014) finds that growth in the recent episode of globalization has been accompanied by greater inequality in high-income countries.
Conventional monetary policy. Inflation can also have indirect effects on inequality and poverty through its close links with unemployment, growth, and monetary policy. It is well established that monetary policy has redistributive effects, although these may be temporary. Romer and Romer (1998) distinguish between short-run and long-run effects. In the short run, expansionary monetary policy raises output, lowers unemployment, and reduces poverty. However, the effects are only temporary, as a persistent expansion is inflationary, which requires monetary policy tightening, which in turn increases unemployment, causing poverty to rise again (a mechanism modeled in a dynamic stochastic general equilibrium framework by Areosa and Areosa 2016). The empirical results are somewhat mixed: Furceri, Loungani, and Zdzienicka (2018) find that a contractionary monetary policy shock increases inequality in the short run, while Ballabriga and Davtyan (2017) find that it can lead to a decline in inequality. In the long run, however, credible monetary policy that results in low and stable inflation can improve outcomes for the poor, by providing favorable

44
conditions for economic growth.
FIGURE A1.2 Inflation, inequality, and poverty The relationship between inflation, growth, inequality, and poverty varies across countries. Low and stable inflation has been associated with higher rates of economic growth, although the relationships can be nonlinear. In turn, higher economic growth has been associated with declines in poverty rates. A. GDP growth under different inflation environments
B. Growth and change in the poverty rate
Source: World Bank.
Note: GDP = gross domestic product.
A. Average real GDP growth from 1980 to 2016 for countries with average inflation or standard deviation of inflation in the top quartile (“High”) and in the bottom quartile (“Low”).
B. Inflation and GDP data are averaged over 1980-2016.
Unconventional monetary policy. More recently, unconventional monetary policy tools have been utilized by central banks in advanced economies amid concerns about persistently low inflation or deflation and short-term interest rates that are close to their zero lower bound. Although the channels through which these tools operate are similar to those used by conventional tools, the strength of these channels may vary (Bank of England 2012). Empirical evidence thus far suggests that, using unconventional tools, the impact of monetary expansion on inequality is fairly neutral to negative (lowers inequality). The poor benefit from an increase in labor income via a reduction in unemployment and increase in wages and, for savers, the decrease in returns on assets is offset by increased capital gains (Casiraghi et al. 2018; Ampudia et al. 2018).
Effects of inflation on overall inequality and poverty
Although the evidence on the effects via individual links suggests that poorer households are generally more adversely affected by inflation than wealthier ones, the empirical results for the overall link between inflation and inequality are inconclusive. Much of the literature was produced in the late 1990s, and there are relatively few recent studies. Inflation trends have evolved substantially over the past 20 years, with a generalized downward trend globally. The results vary between single-country studies and cross-country studies, and between advanced economies and EMDEs. Although correlations between the variables have been found, there is less evidence of clear causation from inflation to inequality and poverty, with some studies suggesting the causality
2
3
4
5
Inflation level Inflation volatility
Low HighPercent
-80
-60
-40
-20
0
20
40
0 2 4 6 8 10GDP growth rate
Cha
nge
in p
over
ty r
ate,
19
80-2
016
Percent
45
goes in the opposite direction.2 In general, the literature suggests that slightly higher inflation is associated with mildly lower inequality in countries where inflation is already low (typically, advanced economies), but that high inflation is associated with higher inequality in countries where inflation is already high (typically, EMDEs).
Single-country studies. Parker (1998) surveys the early literature, based on 12 single-country studies, and finds that all but three show that higher inflation is associated with lower inequality (for example, Ashworth 1994; Balke and Slottje 1993). However, almost all these studies focus on advanced economies (mainly the United States), so the results may be less applicable to EMDEs. Other studies focusing on single advanced economies come to a similar conclusion (Doepke and Schneider 2006; Maestri and Roventini 2012), except for Jantti and Jenkins (2010), who find little evidence of a relationship between inflation and income inequality in the United Kingdom. Single-country studies on EMDEs, such as India (Datt and Ravallion 1998), the Philippines (Blejer and Guerrero 1990), and Brazil (Ferreira and Litchfield 2001), find that higher inflation is associated with a lower share of income held by the poor or higher inequality. Looking at seven single studies of advanced economies and EMDEs together, Bulir and Gulde (1995) find that the impact of inflation on different income groups within countries varies between countries, with a positive correlation between inflation and inequality more likely in LICs that have a less developed financial sector.
Cross-country studies. Galli and van der Hoeven (2001) review single-country and cross-country studies prior to 2000. They find that the time-series studies (the majority of which focus on the United States) almost always find higher inflation to be associated with lower inequality, whereas the cross-country studies find higher inflation to be associated with higher inequality and poverty (Figure A1.2). Several other studies that use cross-country samples also document a positive correlation between inflation and income inequality (Romer and Romer 1998; Easterly and Fischer 2001; Agenor 2002; Albanesi 2007; Thalassinos, Ugurlu, and Muratoğlu 2012). However, even studies that find statistically significant coefficients on inflation typically find little explanatory power of their models, and the relationship between the poverty rate and inflation is less apparent than the relationship with inequality.
Nonlinear relationship between inflation and inequality. These mixed empirical results may reflect nonlinear relationships between inflation and inequality or poverty. Several studies find evidence of a nonlinear relationship, with considerable differences in the correlation between inflation and inequality depending on the initial rate of inflation (Galli and van der Hoeven 2001; Bulir 2001; Monnin 2014; Siami-Namini and Hudson 2017). Bulir (2001) reports that countries in hyperinflation had Gini coefficients that were 8 points higher, on average, than countries with high inflation but not hyperinflation. The benefit of moving from hyperinflation to high inflation was significant, but moving from high inflation to very low inflation (less than 5 percent) had a negligible effect.
Policy implications
Maintain a low-inflation environment. Although it is not definite, the evidence suggests that achieving stable and low inflation is associated with better poverty and inequality outcomes, with 2 In a study of Brazil during 1981-93, a fall in inequality, despite being associated with declining inflation, was attributed to structural and policy changes including convergence of incomes between rural and urban areas, and social transfers to the poor (Ferreira and Litchfield 2001).

46
the benefits being greatest among low-income, high-inflation countries. Lowering income inequality by controlling inflation may be less costly than through other social choices (Bulir 2001). This suggests that the adoption of a credible monetary policy regime by policy makers in EMDEs can lead to improved inequality and poverty outcomes. The results are less clear-cut for advanced economies, where low inflation is already established, with some evidence that the opposite relationship holds, so that slightly higher inflation may reduce inequality.
Improve competition. Policy makers have a range of tools beyond monetary policy to improve income inequality and poverty, but they have few tools to address the effects arising specifically from inflation. Structural reforms to improve competition in the financial sector can lower costs and increase access to savings products that can help poorer households protect the real value of their assets from inflation (Beck, Demirgüç-Kunt, and Levine 2004; Claessens 2006). Such reforms have also been found to increase informal business ownership, employment, and income, with a larger benefit accruing to lower-income households (Bruhn and Love 2014).
Improve granularity in inflation measures and fiscal support. The calculation of alternative indexes of inflation for different income groups would provide greater information on the inflation rates actually experienced by the poor and could be used as an alternative benchmark for indexing welfare payments. This would reduce the erosion of their real value if inflation for poorer households was higher than the economywide inflation rate. Finally, the use of targeted subsidies could help alleviate poverty and inequality if they are focused on products, particularly food items, that are disproportionately consumed by the poor and prone to more volatile inflation.
47
Annex 2 Benefits and costs of inflation: A review
Estimates of the optimal inflation rate lie in a wide range, depending on country characteristics. Excessively high or low inflation can trigger self-perpetuating output losses. Particular policy challenges arise in exiting from high inflation and navigating very low inflation.
A large literature has documented the challenges posed by high inflation for advanced economies and emerging market and developing economies (EMDEs). In the 1970s and 1980s in advanced economies and until the early 1990s in EMDEs, the perils of high inflation were the main macroeconomic policy concern. By the early 2000s, at least for advanced economies, the focus had shifted to the causes and consequences of very low inflation, including deflation (that is, negative inflation). This literature enjoyed a renaissance after the global financial crisis, as fears about deflation mounted.
Against this backdrop, this annex addresses the following questions:
What output losses have been associated with high inflation?
Why is high inflation associated with weak activity?
What policy challenges does excessively low inflation pose?
What output losses have been associated with high inflation?
Adverse effects of high inflation on output have been studied extensively since the 1990s.1 Early studies found that inflation above 40 percent was associated with slower economic growth in large samples of countries from the 1960s to the mid-1990s (Fischer 1993; Bruno and Easterly 1998; Temple 2002). In most (31 of 41) episodes of inflation above 40 percent, output losses were sharp (2.4 percent, on average), but they were not significant at lower inflation levels (Bruno and Easterly 1998). Lower inflation thresholds, typically below 20 percent, for a negative relationship between inflation and growth were also reported by several subsequent studies based on large samples of countries stretching over multiple decades.2
There is growing evidence that the threshold for a negative relationship between inflation and growth depends on country characteristics. Some of the earliest studies in this literature documented that the threshold tends to be lower in advanced economies—below 10 percent, and typically around 2-3 percent—than in EMDEs, where inflation thresholds have been estimated at around 20 percent.3 The range of estimates varies widely, however. Some studies have estimated inflation thresholds at around 5-8 percent for Asian EMDEs and 7-9 percent for Sub-Saharan African EMDEs.4 Country features that have been associated with a more negative link between inflation and growth include greater financial development and trade openness, larger government,
1 The focus here is on the challenges of persistently high inflation. Bohl and Siklos (2018) review hyperinflation episodes, when month-on-month inflation exceeded 50 percent. 2 See Espinoza, Leon, and Prasad (2012) for a literature review of thresholds in the relationship between inflation and growth. Threshold effects are also estimated by Judson and Orphanides (1999), Omay and Öznur Kan (2010), Bick (2010), and Lopez-Villavicencio and Mignon (2011). 3 During the Arab-Israeli War in 1973, global oil prices quadrupled to about $12 per barrel. Around the time of the Iranian Revolution, oil prices more than doubled in 1979-80 to about $36 per barrel. 4 Ndoricimpa (2017); Thanh (2015); Vinayagathasan (2013).

48
weaker institutions, and greater political risk.5
Why is high inflation associated with weak activity?
High inflation is likely to weaken activity by obscuring and distorting relative prices, creating uncertainty that undermines long-term decision making and discourages savings; redistributing incomes and thereby weakening consumption; and eroding financial stability. Activity is also likely to be weakened by the policies needed to reduce inflation from high levels, including tighter monetary policies.6
Transparency of relative price changes. High inflation is likely to require frequent price adjustments by firms to maintain their profitability. If price adjustments for different goods and services are asynchronous (“staggered price setting”), relative price distortions will result (Woodford 2003; Fischer 1993). Even if temporary, these will tend to undermine the efficient allocation of resources and productivity growth. In particular, inflation may encourage investment in property rather than more productive investments (White 2006). If high inflation obscures relative price changes, it also creates a need for costly information search (Aksoy et al. 2017).
Uncertainty. High inflation may make it difficult for households and firms to disentangle relative from absolute price changes (Lucas 1972). High inflation is also typically associated with more volatile inflation (Logue and Willet 1976; Andersen and Gruen 1995; IMF 2001). Finally, high and volatile inflation signals an inability of government policies to ensure macroeconomic stability (Fischer 1993). These factors increase uncertainty about the future value of assets and hence discourage investment that requires solid long-term returns to ensure profitability (Woodford 2003). Such investment can be an important source of productivity growth, especially when it embodies new technologies (Greenwood, Hercowitz, and Krusell 1997).
Erosion of after-tax and real incomes. High inflation may reduce saving through two channels. First, it lifts nominal income growth and, thus, accelerates tax progression when rising nominal incomes are measured against fixed nominal income tax brackets (Greville and Reddell 1990; Feldstein 1997, 1999). This squeezes post-tax incomes, which will tend to depress household saving. Second, high inflation reduces the real value of debt—which serves as an investment vehicle for household savings—and any income derived from it (Briault 1995). The erosion of after-tax incomes and income derived from debt discourages savings and, hence, the funding envelope for productive investment.
Risks to financial sector stability. With high inflation, households will tend to shun financial instruments carrying fixed nominal returns and thus withdraw from bank-intermediated savings. Such disintermediation may force banks to rely on non-deposit liabilities, which will tend to raise
5 In a large sample for 1950-2009 or 1960-2009, Ibarra and Trupkin (2011, 2016) and Eggoh and Khan (2014) find that, on average, inflation above thresholds of 19 and 12 percent, respectively, are associated with lower growth. However, the negative association between inflation and growth is stronger in countries with greater financial depth, broader trade openness, higher investment, and larger government expenditures. The threshold is in the single digits for EMDEs with the highest quality political institutions and most favorable International Country Risk Guide ratings of political risk. 6 See Mishkin (2008b); Camba-Mendez, Garcia, and Rodriguez-Palenzuela (2003); and Briault (1995) for more detailed literature reviews.
49
the (short-term) cost of financing their (long-term) investment portfolios. This will raise the maturity risks inherent in the balance sheets of financial intermediaries that hold long-term assets, often at fixed interest rates, against short-term liabilities (Schwartz 1995). Furthermore, high inflation will raise the term premia and maturity risks embodied in long-term interest rates that compensate investors for long-term inflation risks. The resulting higher borrowing costs increase rollover or default risk and the cost of financing long-term investments (Wright 2011).7
Income redistribution that weakens consumption. Low-income households tend to rely on wages, pensions, and social benefits as their main sources of income and hold a larger share of their savings in cash (Erosa and Ventura 2002). Wages, pensions, and social benefits tend to respond less and with longer lags to inflation than nonwage income, and the real value of cash savings, being unremunerated, is eroded by inflation (Kahn 1997). As a result, poor households’ real incomes tend to decline more than those of higher-income households in high-inflation environments (Romer and Romer 1997; Albanesi 2007).8 Since poor households have a higher marginal propensity to consume—for example, as shown by Dynan, Skinner, and Zeldes (2004) for the United States—this tends to weaken consumption.
Exiting high-inflation episodes. The detrimental effect on growth of high inflation is well established in the literature, although precise thresholds vary. Additional damage to output is done when the necessary measures are taken to exit high inflation. Indexation of wages and other prices can make large output losses necessary to achieve disinflation, especially when central banks lack credibility (Blanchard and Gali 2007). (See Annex 4 for U.S. experience with disinflation.)
What policy challenges does excessively low inflation pose?
The low inflation of the early 2000s raised concerns about the ability of central banks in advanced economies to support demand when policy rates are near the zero lower bound (Reifschneider and Williams 2000; Eggertsson and Woodford 2003). An extended period of low inflation (“lowflation”) can distort resource allocation, present policy challenges in responding to recessions, and undermine the credibility of central banks.9 Once entrenched, deflation can trigger a spiral of self-reinforcing output losses.
Lowflation. When inflation is extremely low—meaning significantly below the target—relative price declines may require negative inflation in categories of goods and services with excess supply. This presents a challenge when rigidities prevent nominal price cuts of goods and services (Taylor 2000). When nominal prices cannot be reduced, low inflation can lead to distorted relative prices and inefficient allocation of resources across the economy.
Low inflation also poses monetary and fiscal policy challenges. Low inflation is typically
7 The long-term interest rates can be decomposed into (i) expected inflation, (ii) expectations about the future path of real short-term interest rates, and (iii) a term premium that reflects changes in the perceived riskiness of longer-term securities and their liquidity. Term premiums on longer-term securities will be higher when investors are more risk-averse and/or the perceived risk of holding those securities is high. Historically, the most important risk for long-term bondholders has been the risk of unexpected inflation. Uncertainty about the near-term outlook for the economy or monetary policy also raises the riskiness of bonds. 8 In addition, poor households often lack access to financial technologies that allow hedging against inflation (Mulligan and Sala-i-Martin 2000). Conversely, those poor households that do have access to credit may benefit from inflation because it erodes the real value of nominal claims such as loans (Doepke and Schneider 2006). 9 Ciccarelli and Osbat (2017); Moghadam, Teja, and Berkmen (2014).

50
associated with low nominal monetary policy rates. In such an environment, monetary policy may be unable to respond with conventional tools to negative shocks that reduce economic activity and inflation, since the interest rate cuts that are needed to support activity would imply negative nominal monetary policy rates. Two decades ago, it was thought that monetary policy rates could not fall below zero—the so-called “zero lower bound”—because of the incentive this would create for moving out of financial instruments into cash (Svensson 2003). The resulting disintermediation could undermine monetary policy effectiveness and capital markets. Since 2010, however, the experiences of Denmark, the Euro Area, Japan, Sweden, and Switzerland indicate that mildly negative interest rates can be sustained for extended periods without causing large-scale financial disintermediation (Arteta et al. 2016; Rogoff 2015).
However, the limited room for monetary policy action amid very low inflation and short-term interest rates implies that fiscal policy has to shoulder more of the responsibility for macroeconomic stabilization (Feldstein 2002). Such proactive fiscal policy may be difficult when government debt is high, because, all else equal, the real burden of debt is likely to remain persistently higher in a lowflation environment than in an inflationary environment where nominal incomes are rising (Contessi, Li, and De Pace 2014).
Deflation. Outright deflation, if sustained over an extended period, can reduce output by dampening investment and consumption and distorting resource allocation (Fisher 1933; Friedman and Schwartz 1963). Deflation increases the real burden of debt and debt service and depresses collateral values, thus straining financial systems (“debt deflation”) (Bernanke and James 1991; End et al. 2015; Baig et al. 2003). It compresses price dispersion and dulls the signals of relative price changes that are critical for an efficient allocation of resources (Benabou 1992). Once deflation becomes entrenched in expectations, it may become self-reinforcing (Branch and Evans 2017; Banerjee and Mehrotra 2018). By raising real interest rates, negative inflation tightens monetary conditions and depresses activity further (Bernanke, Reinhart, and Sack 2004). Although these mechanisms suggest that theoretically deflation could impose heavy costs, empirical evidence suggests that these costs are modest in practice (Borio et al. 2015).
The optimal inflation rate
The jury is still out on the optimal inflation rate. Theoretical models offer a wide range of optimal inflation rates, negative and positive, depending on the assumptions. Diercks (2017) analyzed 100 studies that provided quantitative estimates for optimal inflation. Of these, about 80 recommended inflation targets at or below zero. Negative inflation would ensure that real interest rates are positive even when nominal interest rates are zero, such that there is no cost for holding money. However, these models typically assume perfect price flexibility. Models with sticky prices generate temporary deviations in relative prices and, hence, give rise to allocative inefficiencies and welfare cost from inflation or deflation. These models typically suggest an optimal inflation rate of zero. In models that incorporate additional constraints that arguably add realism—such as sticky wages, a zero lower bound on nominal interest rates, distortionary taxation, financial frictions, and price indexation—a low positive inflation rate becomes optimal.
The empirical literature suggests that optimal inflation rates lie in a wide range, depending on country characteristics (Anand, Prasad, and Zhang 2015; Mankiw and Reis 2002). “Too high” inflation and deflation are associated with output losses, and “too low” inflation carries the risk of slipping into deflation in the next recession. The threshold for considering inflation to be “too high” varies widely with country characteristics, and the threshold for “too low” depends on the

51
size and frequency of adverse shocks, fiscal policy flexibility, and the effectiveness of monetary policy transmission.
Given these trade-offs and risks, some studies (Blanchard, Dell’Arricia, and Mauro 2010; Ball 2014; Krugman 2014; Kiley and Roberts 2017; Andrade et al. 2018) recommend raising central banks’ inflation targets to 4 percent, which is double the median inflation target of advanced economy inflation targeting central banks (2 percent). However, other authors (Coibion and Gorodnichenko 2012; Coibion, Gorodnichenko, and Wieland 2012; Mishkin 2018; Dorich et al. 2018; Schmitt-Grohe and Uribe 2010) caution that raising the inflation target is too blunt a solution for addressing risks around the zero lower bound: a higher inflation target imposes higher economic cost most of the time, but it lowers the cost of hitting the zero lower bound only in rare circumstances.

52
Annex 3 Inflation in low-income countries
Inflation in low-income countries has declined sharply over the past three decades, to a median of 5.0 percent in 2017 from a peak of 24.2 percent in 1994. This decline in inflation was broadly shared. It has been supported by the move to more flexible exchange rate regimes, greater central bank independence, lower government debt, and a more benign external environment.
The number of low-income countries (LICs) has almost halved since 1994. As of 2018, 34 countries were classified as “low income” according to the World Bank definition, down from 64 in 1994, following the graduation of 31 mostly metals-exporting and transition economies to middle-income status.1 Today, LICs are predominantly agriculture-based, small, and fragile, and they tend to have weak institutions (World Bank 2015). All but seven of them are in Sub-Saharan Africa.
Today’s LICs have made large strides in stabilizing their economies over the past five decades, with sharp declines in inflation and inflation volatility. This annex documents the achievements in terms of inflation. Against this backdrop, this annex discusses the following questions:
How has inflation evolved in LICs?
What factors have supported inflation developments in LICs?
Evolution of inflation
Among LICs, median inflation has fallen by two-thirds since 1970, to 5.0 percent in 2017—broadly in line with inflation developments in other emerging market and developing economies (EMDEs). The inflation decline has been broad-based across countries as well as inflation components. As a result, the wide heterogeneity of inflation among LICs in the 1990s has narrowed sharply, to a range of 6-18 percent in 2017.
1970s to 1990s. Throughout these three decades, median inflation among LICs was 9-10 percent. Although this was broadly in line with inflation in other EMDEs, LIC inflation underwent bouts of sharp spikes (to 25 percent), especially in the early 1990s, amid exchange rate crises. In half the years between 1970 and 2000, the majority of LICs had double-digit inflation.
1 Low-income countries (LICs) are defined as those with gross national income (GNI) per capita, calculated using the World Bank Atlas method, of $995 or less in 2017; middle-income countries as those with GNI per capita between $996 and $12,055 in 2017; and high-income countries as those with GNI per capita of $12,056 or more in 2017. These classifications are revised in July every year. As of 2018, LICs include Afghanistan, Benin, Burkina Faso, Burundi, Central African Republic, Chad, the Comoros, the Democratic Republic of Congo, Eritrea, Ethiopia, The Gambia, Guinea, Guinea-Bissau, Haiti, the Democratic People’s Republic of Korea, Liberia, Madagascar, Malawi, Mali, Mozambique, Nepal, Niger, Rwanda, Senegal, Sierra Leone, Somalia, South Sudan, the Syrian Arab Republic, Tajikistan, Tanzania, Togo, Uganda, the Republic of Yemen, and Zimbabwe. Annual inflation data since 1970 are available for 27 LICs (excluding Eritrea, the Democratic People’s Republic of Korea, Somalia, South Sudan, Syria, Tajikistan, and Yemen).In 1987, the first year classifications were published, 49 economies (excluding most economies affiliated with the Soviet Union) were classified as LICs. Of today’s LICs, Senegal, Syria, Yemen, and Zimbabwe were classified as middle-income countries in 1987. In addition to today’s LICs, Bangladesh, Bhutan, Cambodia, China, Equatorial Guinea, Ghana, Guyana, India, Indonesia, Kenya, the Lao People’s Democratic Republic, Lesotho, Maldives, Mauritania, Myanmar, Nigeria, Pakistan, São Tomé and Príncipe, Solomon Islands, Sri Lanka, Sudan, Vietnam, and Zambia were classified as LICs in 1987.

53
2000s. During the 2000s, median inflation in LICs fell rapidly, to 5.0 percent in 2017 from a peak of 24.2 percent in 1994 (Figure A3.1). This decline was broad-based and narrowed some of the wide heterogeneity in inflation among LICs. In one-third of LICs, inflation in 2017 was less than one-third its level in 1970. In an even larger number (58 percent) of LICs, inflation in 2017 was less than one-third of its 1994 level. By 2008, the two hyperinflation episodes in LICs (with inflation in excess of 1,000 percent) had also subsided. In 2017, inflation was in the single digits in more than three-quarters of LICs, compared with less than one-fifth in 1994. Since 1970, core, food price, and energy price inflation have also declined, as has inflation volatility (although it remains well above inflation volatility in other EMDEs).
Factors supporting inflation developments
In every year since 2000, except 2002 and 2017, LIC inflation has exceeded inflation in other EMDEs. This difference has been attributed to several factors, of which three have been particularly closely examined: fiscal policy, supply shocks, and uncertainty about monetary policy transmission.
Fiscal policy. For LIC governments with weak revenue-raising capabilities and an absence of well-functioning capital markets, inflation may become an important source of financing fiscal deficits (Baldacci, Hillman, and Kojo 2004). The presence of large fiscal deficits or high government debt in LICs can cause fiscal dominance—with fiscal policy relying on accommodative monetary policy to ensure fiscal sustainability (Baldini and Poplawski-Ribeiro 2011; Weidmann 2013). In almost every year between 1992 and 2002, two-thirds of LICs had higher debt-to-GDP ratios than the one-third of non-LIC EMDEs with the highest debt levels. In half the years between 1995 and 2017, the median fiscal deficit in LICs was above that in non-LIC EMDEs. Weak institutions (Bleaney, Morozumi, and Mumuni 2016) and political instability (Aisen and Veiga 2006) may reinforce the negative association between budget deficits and inflation.
Supply shocks. LIC economies are particularly vulnerable to frequent supply shocks, especially weather-related ones. Agriculture sectors tend to be large; poor transport links prevent risk sharing; and food forms a larger share of household consumption (Bleaney and Francisco 2018; Cachia 2014). As a result, for example, rainfall appears to have a significant effect on economic growth in EMDEs in Sub-Saharan Africa but not elsewhere (Barrios, Bertinelli, and Strobl 2010).
Since 2000, improvements in LIC policies and a benign global macroeconomic environment have supported the decline in LIC inflation. That said, policy frameworks in the median LIC remain generally weaker than those in other EMDEs.
Improved policies. Inflation has tended to be lower in LICs with lower public debt ratios, fixed exchange rate regimes, and higher degrees of central bank independence and transparency (Figure A3.2). Since 1970, monetary policy frameworks have strengthened in LICs. The index of central bank independence (available for 10 LICs) doubled between 1998, when the series starts, and 2014, when the series ends. In 1970, all but two LICs had pegged exchange rates whereas, in 2017, only half the LICs (14 of 29 with available data) had fixed exchange rate regimes, as defined in Shambaugh (2004). Fiscal pressures on monetary policy also appear to have eased. Government debt has declined from a peak of 123 percent of GDP, on average, in 2003 to 52 percent of GDP, on average, in 2017— broadly in line with the average non-LIC EMDE. In addition, the
54
relationship between fiscal position and inflation appears to be nonlinear: in a low-inflation environment, fiscal deficits tend to be less inflationary (Catao and Terrones 2005; Lin and Chu 2013). As a result, the current low-inflation environment may help further mute the pressures from fiscal dominance on inflation in LICs.
More benign external environment. LIC economies, on average, have become more open to trade and finance since the 1970s, although they remain less open than other EMDEs (IMF 2011a).12 Higher capital account openness, in particular, has been associated with lower inflation, whereas there has been little difference between LICs that have been highly open to trade and those that have not. Despite a growing number of LICs switching to floating exchange rate regimes, exchange rates have been considerably more stable since 1998 than in the preceding two decades. This has helped lower LIC inflation volatility and inflation.
Conclusion
LIC inflation and inflation volatility have fallen sharply during the past three decades, broadly in line with other EMDEs. The decline has been broad-based across countries, as well as across components of inflation. Both better policies—such as greater central bank independence and transparency, a shift away from pegged exchange rate regimes, and lower government debt burdens—and a more benign global macroeconomic environment have supported the inflation decline in LICs.
2 In the average LIC, trade (exports plus imports) has amounted to 58 percent of GDP since 1970, whereas in the average non-LIC EMDE, it has amounted to 83 percent of GDP; international financial assets and liabilities amounted to 114 percent of GDP in the average LIC compared with 256 percent of GDP in the average non-LIC EMDE.

55
FIGURE A3.1 Inflation in low-income countries
Inflation and inflation volatility in LICs have declined since 1970, broadly in line with other EMDEs. The decline has been broad-based across countries and components of inflation.
A. Inflation B. Inflation
C. Number of LICs by inflation bracket D. Inflation volatility
Source: Haver Analytics, International Monetary Fund, World Bank. Note: Data for 29 low-income countries and 83 other EMDEs. Inflation refers to year-on-year inflation. A. Blue lines are cross-country medians of inflation, dashed lines indicate interquartile range across 28 LICs. B. Cross-country medians. C. Number of LICs in which inflation was in the bracket indicated. 2017 data not yet available for some LICs. D. Cross-country medians over rolling standard deviations.
-10
0
10
20
30
40
1970
1975
1980
1985
1990
1995
2000
2005
2010
2017
Percent Median LICs Interquartile range
0
4
8
12
LICs OtherEMDEs
LICs OtherEMDEs
LICs OtherEMDEs
Headline Food Energy
Percent1970-1997 1998-2017
0
5
10
15
20
25
30
1970
1975
1980
1985
1990
1995
2000
2005
2010
2017
Number of LICsBelow 10 percent 10 to 50 percent50 to 100 percent Above 100 percent
0
4
8
12
16
LICs OtherEMDEs
LICs OtherEMDEs
LICs OtherEMDEs
Headline Food Energy
Percent 1970-1997 1998-2017

56
FIGURE A3.2 Factors supporting falling inflation in low-income countries
The decline in LIC inflation has been supported by improved policies, greater openness to trade and finance, and a more benign macroeconomic environment.
A. Central bank transparency index B. Number of LICs, by exchange rate regime
C. Inflation, by government debt
D. Correlation between disinflation and changes in government debt (1980s-2010s)
E. Financial and trade openness F. Inflation, by country characteristics
Source: World Bank; Haver Analytics; International Monetary Fund; Shambaugh 2004. Note: Data for 29 low-income countries and 83 other EMDEs. EMDEs = emerging markets and developing economies; GDP = gross domestic product; LICs = low-income countries. A.C. Unweighted averages. B. Exchange rate regime as defined as in Shambaugh (2004). D. Exchange rate volatility is the cross-country average of the standard deviation of nominal effective appreciation during each time period. F. Median year-on-year inflation in LICs during 1998-2017, by country characteristics. “High” indicates pegged exchange rate regimes (peg) or above-median financial openness, central bank transparency, and government debt. “Low” indicates floating exchange rate regimes (peg) or below-median financial openness, central bank transparency, and government debt.
0
1
2
3
4
5
6
1998
2000
2002
2004
2006
2008
2010
2012
2014
Index LICs Other EMDEs
0
5
10
15
20
25
30
Peg Float
Number 2017 1970
0
30
60
90
120
150
1970
1975
1980
1985
1990
1995
2000
2005
2010
2016
Percent of GDP LICs Other EMDEs
0
2
4
6
8
10
12
1970-1997 1998-2017
Percent
0
50
100
150
200
LICs OtherEMDEs
LICs OtherEMDEs
Financial openness Trade openness
Percent of GDP 1970-1997 1998-2017
0
2
4
6
8
10
Peg Financialopenness
Central banktransparency
Governmentdebt
Percent High Low

57
Annex 4 Lessons from U.S. disinflation in 1979-82
U.S. inflation declined from double-digits in August 1979 to below 4 percent by the end of 1982. This disinflation highlighted the benefits of shifting central banks’ focus to price stability, building credibility, and establishing stabilizing monetary policy rules.
The Great Inflation of 1965-82 has been described as the defining macroeconomic event of the second half of the 20th century (Bryan 2018). Siegel (1994) described it as “the greatest failure of American post-war history.” Meltzer (2005) attributed to the Great Inflation the fall of the Bretton Woods system of fixed exchange rates, the bankruptcy of the thrift industry (U.S. savings banks), heavy capital taxation, and a redistribution of wealth and income. The challenges associated with the subsequent disinflation transformed the understanding of the role of central banks and monetary policy.
Against this backdrop, this annex discusses the following questions:
How did U.S. disinflation evolve during the 1980s?
What was the role of monetary policy in U.S. disinflation?
What lessons have been drawn from U.S. disinflation?
Evolution of disinflation during 1979-82
By August 1979, U.S. inflation had reached 12 percent (Figure A4.1). High inflation reflected multiple one-time jumps in key prices and accommodative demand policies that perpetuated high inflation. Oil prices rose seven-fold between December 1972 and January 1974 and tripled again between November 1978 and November 1979, amid supply disruptions around the Iranian Revolution. From the 1960s, monetary policy was accommodative on the understanding that permanently lower unemployment could be “bought” with higher inflation—the standard understanding of the Phillips curve at the time (Bryan 2018). The resulting accommodative monetary policy stance combined with loose fiscal policy—for example, to finance the Vietnam War, Great Society social spending, or the Kennedy tax cuts—to generate considerable domestic demand pressures.
By the end of 1982, inflation had declined to below 4 percent, in part thanks to an aggressive tightening of monetary policy, including a hike in the federal funds rate from 11 percent in August 1979 to a peak of 19 percent in July 1981.1 In October 1979, the Federal Reserve also overhauled its operations to switch from targeting the federal funds rate to targeting nonborrowed reserves. Over the same period, fiscal policy tightened by about 1 percentage point of gross domestic product (Congressional Budget Office 2017). The disinflation was associated with two recessions, together termed the “Volcker recession,” after the Chairman of the Federal Reserve Board. In 6 of 12 quarters during 1980-82, output contracted. The cumulative output losses during both recessions (peak to trough) amounted to more than 2 percent. Unemployment rates doubled from 6 percent in August 1979 to almost 12 percent at the end of 1982 (Figure A4.1).
1 In parts of advanced-economy Europe, central banks responded more strongly and earlier than in the United States to rising inflation, but disinflation was also accompanied by output losses in the early 1980s (Beyer et al. 2009; Söderström 2005; Miles et al. 2017; Berg et al. 2015; Nguyen et al. 2017).
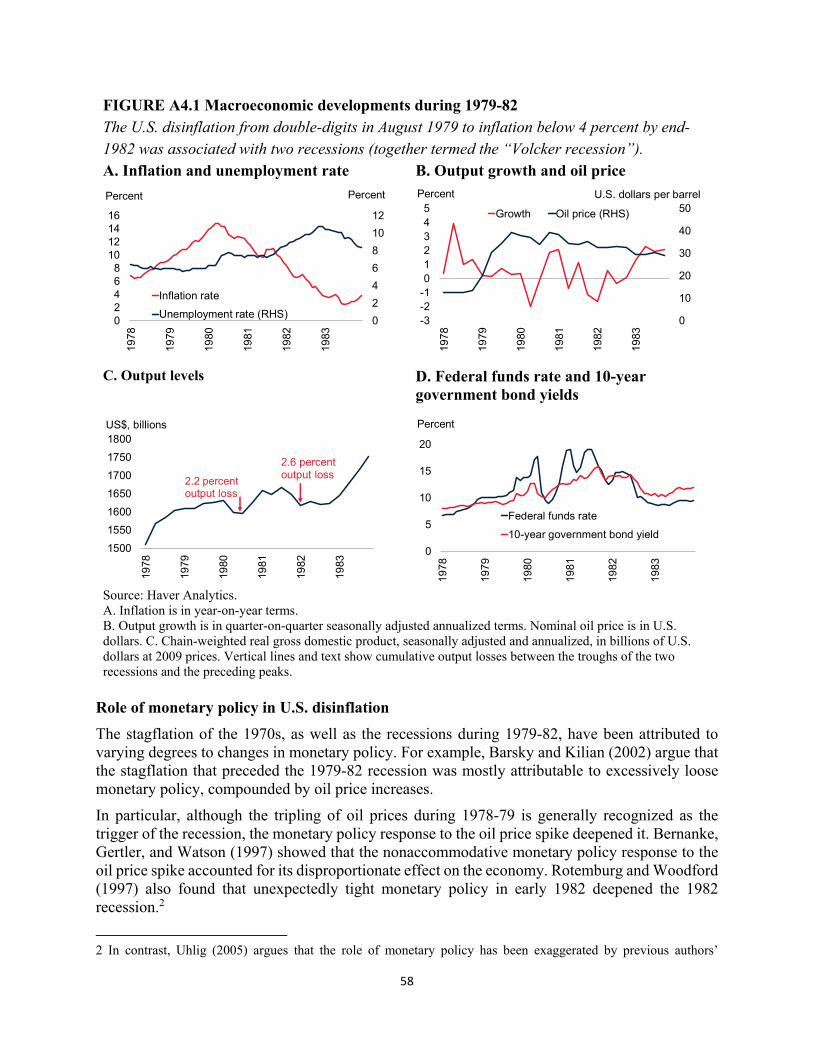
58
FIGURE A4.1 Macroeconomic developments during 1979-82 The U.S. disinflation from double-digits in August 1979 to inflation below 4 percent by end-1982 was associated with two recessions (together termed the “Volcker recession”). A. Inflation and unemployment rate B. Output growth and oil price
C. Output levels
D. Federal funds rate and 10-year government bond yields
Source: Haver Analytics. A. Inflation is in year-on-year terms. B. Output growth is in quarter-on-quarter seasonally adjusted annualized terms. Nominal oil price is in U.S. dollars. C. Chain-weighted real gross domestic product, seasonally adjusted and annualized, in billions of U.S. dollars at 2009 prices. Vertical lines and text show cumulative output losses between the troughs of the two recessions and the preceding peaks.
Role of monetary policy in U.S. disinflation
The stagflation of the 1970s, as well as the recessions during 1979-82, have been attributed to varying degrees to changes in monetary policy. For example, Barsky and Kilian (2002) argue that the stagflation that preceded the 1979-82 recession was mostly attributable to excessively loose monetary policy, compounded by oil price increases.
In particular, although the tripling of oil prices during 1978-79 is generally recognized as the trigger of the recession, the monetary policy response to the oil price spike deepened it. Bernanke, Gertler, and Watson (1997) showed that the nonaccommodative monetary policy response to the oil price spike accounted for its disproportionate effect on the economy. Rotemburg and Woodford (1997) also found that unexpectedly tight monetary policy in early 1982 deepened the 1982 recession.2
2 In contrast, Uhlig (2005) argues that the role of monetary policy has been exaggerated by previous authors’
0
2
4
6
8
10
12
02468
10121416
1978
1979
1980
1981
1982
1983
Percent
Inflation rate
Unemployment rate (RHS)
Percent
0
10
20
30
40
50
-3-2-1012345
1978
1979
1980
1981
1982
1983
Percent
Growth Oil price (RHS)
U.S. dollars per barrel
1500
1550
1600
1650
1700
1750
1800
1978
1979
1980
1981
1982
1983
US$, billions
2.2 percent output loss
2.6 percent output loss
0
5
10
15
2019
78
1979
1980
1981
1982
1983
Percent
Federal funds rate
10-year government bond yield

59
The Federal Reserve’s switch in operational procedures allowed it to meet more effectively its reserve money growth targets.3 The shift was followed by considerable volatility and a sharp rise in the federal funds rate (Goodfriend 1983). It was eventually reversed by 1987 because of the instability of the money demand function (Thornton 2004; Gilbert 1985).
Lessons from U.S. disinflation
The Great Inflation and the output losses during the subsequent disinflation have helped transform the understanding of a central bank’s role. It is now widely recognized that (i) monetary policy can only have short-term effects on real output (that is, the Phillips curve changes over time); (ii) some monetary policy rules are more stabilizing than others; and (iii) central bank credibility that anchors inflation expectations is a critical precondition for effective monetary policy.
Lack of long-term real-economy effects of monetary policy. During the 1970s, monetary policy was guided by the Phillips curve, an empirical inverse relationship between (wage) inflation and unemployment. This relationship suggested that monetary policy could lower unemployment at the cost of higher inflation. However, as central banks sought to exploit this relationship, it became clear that the trade-off existed only in the short term: as inflation expectations adjusted, the Phillips curve shifted, possibly in a nonlinear way (Akerlof et al. 2000). Hence, the inflation-unemployment trade-off disappeared over the long run. This meant that the persistent use of monetary policy to boost employment and output beyond their long-run potential was fruitless and simply raised inflation (Clarida, Gali, and Gertler 1999).
Switch to stabilizing monetary policy rules. The increasing awareness of central banks’ inability to achieve a sustained improvement in output led to an increased focus on monetary policy rules, in particular rules that emphasized the goal of stabilization. Indeed, Dennis (2006) shows that there was large uncertainty around estimated U.S. monetary policy rules before 1979 but, thereafter, U.S. monetary policy could be modeled more precisely. Other studies have also found evidence supporting a measurable change in U.S. monetary policy rules. In a dynamic stochastic general equilibrium model, Bianchi (2013) shows that the U.S. monetary policy regime switched from “dove” (favoring output growth over disinflation) to “hawk” (vice versa) in the second half of 1980. Clarida, Gali, and Gertler (2000) demonstrate that the U.S. monetary policy rule after 1979 responded more strongly to expected inflation than during the preceding period. This new rule ensured greater macroeconomic stability than earlier monetary policy rules. Owyang and Wall (2006) also document a structural change between the pre-Volcker and Volcker-Greenspan eras in the effect of monetary policy across U.S. regions.
Establishing central bank credibility. Bernanke, Gertler, and Watson (1997) note that, by guiding expectations, the choice of a credible monetary policy is key for macroeconomic stabilization. They acknowledge that econometric models typically find a modest role (about 20 percent) for monetary policy shocks—that is, unexpected monetary policy changes—in explaining output movements. Blanchard (1984) demonstrates that a Phillips curve relationship explained
methodology, in particular by imposing timing restrictions or the restriction of a negative relationship between inflation and growth. When such restrictions are lifted, Uhlig (2005) finds that monetary policy did not have a significant effect on growth during the Volcker recession. 3 In the previous operational procedures, money growth targets were achieved within some tolerance bands by guiding the federal funds rate. Under the new procedures, money growth targets were achieved by guiding nonborrowed reserves while maintaining the federal funds rate within a wide tolerance band (Poole 1982).
60
actual disinflation and output losses reasonably well until the end of 1981 but not thereafter. He interprets this as evidence that inflation expectations initially remained unchanged from the Great Inflation, and the Federal Reserve still lacked credibility.4 Research has also shown that the wrong monetary policy rule can undermine central bank credibility. Barro and Gordon (1983a, 1983b) demonstrate that rational households and investors will anticipate the behavior of central banks that systematically attempt to reduce unemployment by surprise monetary stimulus. To reduce unemployment, the central bank needs to engineer ever-greater inflation surprises. Taking this into account, since 1979, the Fed’s monetary policy has arguably been guided by an informal inflation targeting framework, even if its dual mandate was never abolished (Goodfriend 2003).
Conclusion
The experience of the Great Inflation of 1965-82, stagflation in the 1970s, and disinflation during 1979-82 transformed monetary policy in the United States and the understanding of monetary policy more broadly. The Phillips curve is no longer considered a useful policy tool, and instead it is recognized that a credible central bank can reduce inflation with less output loss. As a result, “the concept of credibility has become a central concern of the scholarly literature on monetary policy” (Blinder 2000; Bordo and Orphanides 2013), and inflation has become the “organizing focus of monetary policy” (Clarida, Gali, and Gertler 2000).
4 With the benefit of more years of data, Alogoskoufis and Smith (1991) demonstrate the shift in the Phillips curve during the Volcker recession.

61
References Abbas, S. K., P. S. Bhattacharya, and S. Pasquale. 2016. “The New Keynesian Phillips Curve: An Update on Recent Empirical Advances.” International Review of Economics and Finance 43 (May): 378-403.
Agénor, P. 2002. “Macroeconomic Adjustment and the Poor: Analytical Issues and Cross- Country Evidence.” Policy Research Working Paper 2788, World Bank, Washington, DC.
Aisen, A., and F. J. Veiga. 2006. “Does Political Instability Lead to Higher Inflation? A Panel Data Analysis.” Journal of Money, Credit and Banking 38 (5): 1379-89.
Aizenman, J., M. D. Chinn, and H. Ito. 2008. “Assessing the Emerging Global Financial Architecture: Measuring the Trilemma’s Configurations over Time.” NBER Working Paper 14533, National Bureau of Economic Research, Cambridge, MA.
———. 2010. “The Emerging Global Financial Architecture: Tracing and Evaluating New Patterns of the Trilemma Configuration.” Journal of International Money and Finance 29(4): 615-41.
———. 2011. “Assessing the Emerging Global Financial Architecture: Measuring the Trilemma’s Configurations Over Time.” Working Paper No. 08-14, Santa Cruz Center for International Economics, Santa Cruz, CA.
Akerlof, G. A., W. T. Dickens, G. L. Perry, T. F. Bewley, and A. S. Blinder. 2000. “Near- Rational Wage and Price Setting and the Long-Run Phillips Curve.” Brookings Papers on Economic Activity 2000 (1): 1-60.
Aksoy, G., D. Bredin, D. Corcoran, and S. Fountas. 2017. “Relative Price Dispersion and Inflation: Evidence for the U.K. and the U.S.” Credit and Capital Markets 50 (1): 3-24.
Al Nasser, O. M., A. Sachsida, and M. Mário. 2009. “The Openness-Inflation Puzzle: Panel Data Evidence.” International Research Journal of Finance and Economics 28: 169-81.
Albanesi, S. 2007. “Inflation and Inequality.” Journal of Monetary Economics 54 (4): 1088-1114.
Alogoskoufis, G. S., and R. Smith. 1991. “The Phillips Curve, the Persistence of Inflation, and the Lucas Critique: Evidence from Exchange-Rate Regimes.” American Economic Review 81 (5): 1254-75.
Ampudia, M., D. Georgarakos, J. Slacalek, O. Tristani, P. Vermeulen, and G. Violante. 2018. “Monetary Policy and Household Inequality.” Working Paper Series 2170, European Central Bank, Frankfurt am Main.
Anand, R., E. Prasad, and B. Zhang. 2015. “What Measure of Inflation Should a Developing Country Central Bank Target?” Journal of Monetary Economics 74 (C): 102-16.
Andersen, P., and D. Gruen. 1995. “Macroeconomic Policies and Growth.” In Productivity and Growth, edited by P. Anderson, J. Dwyer, and D. Gruen. Sydney: Reserve Bank of Australia.
Anderson, M. D., D. P. Botman, and M. B. Hunt. 2014. “Is Japan’s Population Aging Deflationary?” IMF Working Paper 14/139, International Monetary Fund, Washington, DC.
Andrade, P., G. Jordi, H. Le Bihan, and J. Matheron. 2018. “The Optimal Inflation Target and the Natural Rate of Interest.” NBER Working Paper 24328, National Bureau of Economic Research, Cambridge, MA.
Areosa, W., and M. Areosa. 2016. “The Inequality Channel of Monetary Transmission.” Journal of Macroeconomics 48 (June): 214–30.
Argente, D., and M. Lee. 2015. “Cost of Living Inequality during the Great Recession.” Meeting Papers 1372, Society for Economic Dynamics.
Arteta, C., M. A. Kose, M. Stocker, and T. Taskin. 2016 “Negative Interest Rate Policies: Sources and
62
Implications.” Policy Research Working Paper 7791, World Bank, Washington, DC.
Ashworth, J. 1994. “An Empirical Estimation of Macroeconomic Activity and Income Distribution in the United States.” Department of Economics Working Paper 130, Durham University, Durham, U.K.
Auer, R. A., C. E. V. Borio, and A. J. Filardo. 2017. “The Globalization of Inflation: The Growing Importance of Global Value Chains.” CESifo Working Paper 6387, Munich.
Autor, D., D. Dorn, L. F. Katz, C. Patterson, and J. Van Reenen. 2017. “The Fall of the Labor Share and the Rise of Superstar Firms.” Discussion Paper 1482, Centre for Economic Performance, London School of Economics.
Badinger, H. 2009. “Globalization, the Output-Inflation Tradeoff and Inflation.” European Economic Review (53) 8: 888-907.
Baig, T., J. Decressin, T. Feyzioglu, M. S. Kumar, and C. Faulkner-MacDonagh. 2003. “Deflation; Determinants, Risks, and Policy Options.” IMF Occasional Paper 221, International Monetary Fund, Washington, DC.
Baldacci, E., A. L. Hillman, and N. C. Kojo. 2004. “Growth, Governance, and Fiscal Policy Transmission Channels in Low-Income Countries.” European Journal of Political Economy 20 (3): 517-49.
Baldini, A., and M. Poplawski-Ribeiro. 2011. “Fiscal and Monetary Determinants of Inflation in Low-Income Countries: Theory and Evidence from Sub-Saharan Africa.” Journal of African Economies 20 (3): 419-62.
Balke, N., and D. Slottje. 1993. “Poverty and Change in the Macroeconomy: A Dynamic Macroeconometric Model.” Review of Economics and Statistics 75 (1): 117-22.
Ball, L. M. 2014. “The Case for a Long-Run Inflation Target of Four Percent.” IMF Working Paper 14/92, International Monetary Fund, Washington, DC.
Ball, L. M., and N. Sheridan. 2005. “Does Inflation Targeting Matter?” In The Inflation-Targeting Debate, edited by B. Bernanke and M. Woodford. Chicago: University of Chicago Press.
Ballabriga, F., and K. Davtyan. 2017. “The Distributive Impact of Monetary Policy: Evidence from the UK.” ESADE Business School Research Paper No. 269, ESADE, Barcelona.
Banerjee, R. N., and A. Mehrotra. 2018. “Deflation Expectations.” BIS Working Paper 699, Bank for International Settlements, Basel.
Bank of England. 2012. “The Distributional Effects of Asset Purchases.” Bank of England Quarterly Bulletin 52 (3): 254-66.
Barrios, S., L. Bertinelli, and E. Strobl. 2010. “Trends in Rainfall and Economic Growth in Africa: A Neglected Cause of the African Growth Tragedy.” Review of Economics and Statistics 92 (2): 350-66.
Barro, R. J. 1996. “Inflation and Growth.” Federal Reserve Bank of St. Louis Review 78 (3): 153-69.
Barro, R. J., and D. B. Gordon. 1983a. “A Positive Theory of Monetary Policy in a Natural Rate Model.” Journal of Political Economy 91 (4): 589-610.
———. 1983b. “Rules, Discretion and Reputation in a Model of Monetary Policy.” Journal of Monetary Economics 12 (1): 101-21.
Barsky, R. B., and L. Kilian. 2002. “Do We Really Know That Oil Caused the Great Stagflation? A Monetary Alternative.” In NBER Macroeconomics Annual 2001, Vol. 16, edited by B. S. Bernanke and K. Rogoff. Cambridge, MA: MIT Press.
63
Batini, N., B. Jackson, and S. Nickell. 2005. “An Open-Economy New Keynesian Phillips Curve for the U.K.” Journal of Monetary Economics 52 (6): 1061-71.
Batini, N., and D. Laxton. 2007. “Under What Conditions Can Inflation Targeting Be Adopted? The Experience of Emerging Markets.” In Monetary Policy under Inflation Targeting, edited by F. S. Mishkin and K. Schmidt-Hebbel. Santiago: Central Bank of Chile.
Bayoumi, T., and J. D. Ostry. 1997. “Macroeconomic Shocks and Trade Flows within Sub- Saharan Africa: Implications for Optimum Currency Arrangements.” Journal of African Economies 6 (3): 412-44.
Beck, T., A. Demirgüç-Kunt, and R. Levine. 2004. “Finance, Inequality and Poverty: Cross- Country Evidence.” Policy Research Working Paper 3338, World Bank, Washington, DC.
Benabou, R. 1992. “Inflation and Markups: Theories and Evidence from the Retail Trade Sector.” European Economic Review 36 (2-3): 566-74.
Benati, L. 2008. “Investigating Inflation Persistence across Monetary Regimes.” Quarterly Journal of Economics 123 (3): 1005-60.
Benigno, P., and E. Faia. 2016. “Globalization, Pass-Through, and Inflation Dynamics.” International Journal of Central Banking 12 (4): 263-306.
Berg, A., S. O’Connell, C. Pattillo, R. Portillo, and F. Unsal. 2015. “Monetary Policy Issues in Sub-Saharan Africa.” In Oxford Handbook of Africa and Economics, Vol. 2, edited by C. Monga and J. Yifu. Oxford: Oxford University Press.
Bernanke, B. S. 2004. “The Great Moderation.” Speech at the meetings of the Eastern Economic Association, Washington, DC. https://www.federalreserve.gov/boarddocs/ speeches/2004/20040220.
Bernanke, B. S., M. Gertler, and M. Watson. 1997. “Systematic Monetary Policy and the Effects of Oil Price Shocks.” Brookings Papers on Economic Activity 1: 91-142.
Bernanke, B. S., and H. James. 1991. “The Gold Standard, Deflation, and Financial Crisis in the Great Depression: An International Comparison.” In Financial Markets and Financial Crises, edited by R. G. Hubbard. Chicago: University of Chicago Press.
Bernanke, B. S., and F. S. Mishkin. 1997. “Inflation Targeting: A New Framework for Monetary Policy?” Journal of Economic Perspectives 11 (2): 97-116.
Bernanke, B. S., T. Laubach, F. S. Mishkin, and A. S. Posen. 2001. Inflation Targeting: Lessons from the International Experience. Princeton University Press.
Bernanke, B. S., V. R. Reinhart, and B. B. Sack. 2004. “Monetary Policy Alternatives at the Zero Bound: An Empirical Assessment.” Brookings Papers on Economic Activity 2: 1-100.
Beyer, A., V. Gaspar, C. Gerberding, and O. Issing. 2009. “Opting Out of the Great Inflation: German Monetary Policy after the Break Down of Bretton Woods.” Working Paper Series 1020, European Central Bank, Frankfurt am Main.
Bhattarai, K. 2016. “Unemployment-Inflation Trade-Offs in OECD Countries.” Economic Modeling 58 (November): 93-103.
Bianchi, F. 2013. “Regime Switches, Agents’ Beliefs, and Post-World War II U.S. Macroeconomic Dynamics.” Review of Economic Studies 80 (2): 463-90.
Bianchi, F., and A. Civelli. 2015. “Globalization and Inflation: Evidence from a Time-Varying VAR.” Review of Economic Dynamics 18 (2): 406-33.
Bick, A. 2010. “Threshold Effects of Inflation on Economic Growth in Developing Countries.” Economic

64
Letters 108 (2): 126-29.
Biroli, P., G. Mourre, and A. Turrini. 2010. “Adjustment in the Euro Area and Regulation of Product and Labour Markets: An Empirical Assessment.” Economic Papers 428, European Commission, Brussels.
Blanchard, O. J. 1984. “The Lucas Critique and the Volcker Effect.” NBER Working Paper 1326, National Bureau of Economic Research, Cambridge, MA.
Blanchard, O. J., G. Dell’Ariccia, and P. Mauro. 2010. “Rethinking Macroeconomic Policy.” Journal of Money, Credit, and Banking 42 (s1): 199-215.
Blanchard, O. J., and J. Galí. 2007. “Real Wage Rigidities and the New Keynesian Model.” Journal of Money, Credit and Banking 39 (s1): 35-65.
———. 2008. “Labor Markets and Monetary Policy: A New-Keynesian Model with Unemployment.” NBER Working Paper 13897, National Bureau of Economic Research, Cambridge, MA.
Bleaney, M. 1999. “Trade Reform, Macroeconomic Performance and Export Growth in Ten Latin American Countries, 1979–95.” Journal of International Trade and Economic Development 8(1): 89-105.
Bleaney, M., and D. Fielding. 2002. “Exchange Rate Regimes, Inflation and Output Volatility in Developing Countries.” Journal of Development Economics 68 (1): 233-45.
Bleaney, M., and M. Francisco. 2018. “Is the Phillips Curve Different in Poor Countries?” Bulletin of Economic Research 70 (1): E17-E28.
Bleaney, M., A. Morozumi, and Z. Mumuni. 2016. “Fiscal Deficits and Inflation: Institutions Matter.” University of Nottingham, U.K.
Blejer, M., and I. Guerrero. 1990. “The Impact of Macroeconomic Policies on Income Distribution: An Empirical Study of the Philippines.” Review of Economics and Statistics 72 (3): 414-23.
Blinder, A. S. 2000. “Central-Bank Credibility: Why Do We Care? How Do We Build It?” American Economic Review 90 (5): 1421-31.
Bobeica, E., C. Nickel, E. Lis, and Y. Sun. 2017. “Demographics and Inflation.” ECB Working Paper 2006, European Central Bank, Frankfurt am Main.
Bohl, M. T., and P. L. Siklos. 2018. “The Anatomy of Inflation: An Economic History Perspective.” CAMA Working Paper 8/2018, Center for Applied Macroeconomic Analysis, Canberra, Australia.
Bordo, M. D., and A. Orphanides. 2013. The Great Inflation: The Rebirth of Modern Central Banking. Chicago: University of Chicago Press.
Borio, C., M. Erdem, A. Filardo, and B. Hofmann. 2015. “The Costs of Deflations: A Historical Perspective.” BIS Quarterly Review 2015 (1): 31-54.
Borio, C. E., and A. J. Filardo. 2007. “Globalisation and Inflation: New Cross-Country Evidence on the Global Determinants of Domestic Inflation.” BIS Working Paper 227, Bank for International Settlements, Basel.
Bowdler, C., and A. Malik. 2005. “Openness and Inflation Volatility: Cross-Country Evidence.” Economics Papers 2005-W14, Economics Group, Nuffield College, University of Oxford.
Branch, W. A., and G. W. Evans. 2017. “Unstable Inflation Targets.” Journal of Money, Credit and Banking 49 (4): 767-806.
Briault, C. 1995. “The Cost of Inflation.” Bank of England Quarterly Bulletin 35 (1): 33-45.
65
Bruhn, M., and I. Love. 2014. “The Real Impact of Improved Access to Finance: Evidence from Mexico.” Journal of Finance 69: 1347-76.
Bruno, M., and W. Easterly. 1998. “Inflation Crises and Long-Run Growth.” Journal of Monetary Economics 41 (1): 3-26.
Bryan, M. F. 1997. “On the Origin and Evolution of the Word Inflation.” Economic Commentary, Federal Reserve Bank of Cleveland, Cleveland, OH.
———. 2002. “Is It More Expensive, or Does It Just Cost More Money?” Economic Commentary, Federal Reserve Bank of Cleveland, Cleveland, OH.
———. 2018. “The Great Inflation.” Federal Reserve History Series, Federal Reserve Bank of Atlanta, Atlanta, GA.
Bulíř, A. 2001. “Income Inequality: Does Inflation Matter?” IMF Staff Papers 48 (1): 139-59.
Bulíř, A., and A. Gulde. 1995. “Inflation and Income Distribution: Further Evidence on Empirical Links.” IMF Working Paper 95/86, International Monetary Fund, Washington, DC.
Burdick, C., and T. Fisher. 2007. “Social Security Cost-of-Living Adjustments and the Consumer Price Index.” Social Security Bulletin 67 (3): 73-88.
Burstein, A., C. Kurz, and L. Tesar. 2008. “Trade, Production Sharing and the International Transmission of Business Cycles.” Journal of Monetary Economics 55 (4): 775-95.
Caceres, C., Y. Carrière-Swallow, and B. Gruss. 2016. “Global Financial Conditions and Monetary Policy Autonomy.” IMF Working Paper 16/108, International Monetary Fund, Washington, DC.
Cachia, F. 2014. “Regional Food Price Inflation Transmission.” Working Paper ESS/14-01, FAO Statistics Division, Food and Agriculture Organization of the United Nations, Rome.
Calvo, G. A. 1983. “Staggered Prices in a Utility-Maximizing Framework.” Journal of Monetary Economics 12 (3): 383-98.
Calvo, G. A., and C. A. Végh. 1994. “Inflation Stabilization and Nominal Anchors.” Contemporary Economic Policy XII (April): 35-45.
Camba-Méndez, G., J. A. García, and D. Rodriguez-Palenzuela. 2003. “Relevant Economic Issues Concerning the Optimal Rate of Inflation.” Working Paper 278, European Central Bank, Frankfurt am Main.
———. 2017. “Inflation Targeting and Inflation Persistence: New Evidence from Fractional Integration and Cointegration.” Journal of Economics and Business 92 (July-August): 45-62.
Canarella, G., and S. M. Miller. 2017. “Inflation Targeting and Inflation Persistence: New Evidence from Fractional Integration and Cointegration.” Journal of Economics and Business 92 (July-August): 45-62.
Casiraghi, M., E. Gaiotti, L. Rodano, and A. Secchi. 2018. “A ‘Reverse Robin Hood’? The Distributional Implications of Non-Standard Monetary Policy for Italian Households.” Journal of International Money and Finance 85 (July): 215-35.
Catão, L., and M. Terrones. 2001. “Fiscal Deficits and Inflation—A New Look at the Emerging Market Evidence.” IMF Working Paper 01/74, International Monetary Fund, Washington, DC.
———. 2005. “Fiscal Deficits and Inflation.” Journal of Monetary Economics 52 (3): 529-54.
Cavallo, A. 2017. “Are Online and Offline Prices Similar? Evidence from Large Multi- Channel Retailers.” American Economic Review 107 (1): 283–303.

66
Cavallo, A., and R. Rigobon. 2016. “The Billion Prices Project: Using Online Prices for Measurement and Research.” Journal of Economic Perspectives 30 (2): 151-78.
Cecchetti, S. G., P. Hooper, B. C. Kasman, K. L. Schoenholtz, and M. Watson. 2007. “Understanding the Evolving Inflation Process.” U.S. Monetary Policy Forum 2007, Washington, DC.
Cecchetti, S. G., and S. Krause. 2002. “Central Bank Structure, Policy Efficiency, and Macroeconomic Performance: Exploring Empirical Relationships.” Federal Reserve Bank of St. Louis Review 84 (4): 47-60.
Charbonneau, K., A. Evans, S. Sarker, and L. Suchanek. 2017. “Digitalization and Inflation: A Review of the Literature.” Staff Analytical Note 2017-20, Bank of Canada, Ottawa.
Chinn, M. D., and H. Ito. 2006. “What Matters for Financial Development? Capital Controls, Institutions, and Interactions.” Journal of Development Economics, 81(1): 163-92.
———. 2017. “The Chinn-Ito Index—A de Jure Measure of Financial Openness.” http://web.pdx.edu/~ito/Chinn-Ito_website.htm.
Chortareas, G., D. Stasavage, and G. Sterne. 2001. “Does It Pay to Be Transparent? International Evidence from Central Bank Forecasts.” Bank of England Working Paper 143, London.
Ciccarelli, M., and B. Mojon. 2010. “Global Inflation.” Review of Economics and Statistics 92 (3): 524-35.
Ciccarelli, M., and C. Osbat. 2017. “Low Inflation in the Euro Area: Causes and Consequences.” Occasional Paper 181, European Central Bank, Frankfurt am Main.
Claessens, S. 2006. “Access to Financial Services: A Review of the Issues and Public Policy Objectives.” World Bank Research Observer 21 (2): 207–40.
Clark, T. 2009. “Is the Great Moderation Over? An Empirical Analysis.” Federal Reserve Bank of Kansas City Economic Review 94 (4): 5-42.
Clarida, R., J. Galí, and M. Gertler. 1999. “The Science of Monetary Policy: A New Keynesian Perspective.” Journal of Economic Literature 37: 1661-1707.
———. 2000. “Monetary Policy Rules and Macroeconomic Stability: Evidence and Some Theory.” Quarterly Journal of Economics 115 (1): 147-80.
Coibion, O., and Y. Gorodnichenko. 2012. “Why Are Target Interest Rate Changes So Persistent?” American Economic Journal: Macroeconomics 4 (4): 126-62.
Coibion, O., Y. Gorodnichenko, and J. F. Wieland. 2012. “The Optimal Inflation Rate in New Keynesian Models: Should Central Banks Raise Their Inflation Targets in Light of the Zero Lower Bound?” Review of Economic Studies 79 (4): 1371-1406.
Congressional Budget Office. 2017. Budget and Economic Data. https:// www.cbo.gov/about/products/budget-economic-data#8.
Contessi, S., L. Li, and P. De Pace. 2014. “An International Perspective on the Recent Behavior of Inflation.” Federal Reserve Bank of St. Louis Review 96 (3): 267-94.
Cysne, R., W. Maldonado, and P. Monteiro. 2005. “Inflation and Income Inequality: A Shopping-Time Approach.” Journal of Development Economics 78 (2): 516-28.
Datt, G., and M. Ravallion. 1998. “Why Have Some Indian States Done Better Than Others at Reducing Rural Poverty?” Economica 65 (257): 17-38.
Demertzis, M., and A. H. Hallett. 2007. “Central Bank Transparency in Theory and Practice.” Journal of

67
Macroeconomics 29 (4): 760-89.
Demirgüç-Kunt, A., L. Klapper, D. Singer, S. Ansar, and J. Hess. 2018. The Global Findex Database 2017: Measuring Financial Inclusion and the Fintech Revolution. Washington, DC: World Bank.
Dennis, R. 2006. “The Policy Preferences of the U.S. Federal Reserve.” Journal of Applied Econometrics 21 (1): 55-77.
Diercks, A. 2017. “The Reader’s Guide to Optimal Monetary Policy.” Board of Governors of the Federal Reserve System, Washington, DC.
Dincer, N., and B. Eichengreen. 2010. “Central Bank Transparency: Causes, Consequences and Updates.” Theoretical Inquiries in Law 11 (1): 75-123.
———. 2014. “Central Bank Transparency and Independence: Updates and New Measures.” International Journal of Central Banking 10 (1): 189-259.
Doepke, M., and M. Schneider. 2006. “Inflation and the Redistribution of Nominal Wealth.” Journal of Political Economy 114 (6): 1069-97.
Dollar, D., T. Kleineberg, and A. Kraay. 2016. “Growth Still Is Good for the Poor.” European Economic Review 81(C): 68-85.
Dollar, D., and A. Kraay. 2004. “Trade, Growth, and Poverty.” Economic Journal 114 (493): 22-49.
Domaç, I., K. Peters, and Y. Yuzefovichî. 2003. “Does the Exchange Rate Regime Matter for Inflation? Evidence from Transition Economies.” Working Paper 0304, Central Bank of Turkey, Ankara.
Dong, W., J. Fudurich, and L. Suchanek. 2017. “Digital Transformation in the Service Sector: Insights from Consultations with Firms in Wholesale, Retail and Logistics.” Staff Analytical Note No. 2017-19, Bank of Canada, Ottawa.
Dorich, J., N. Labelle St-Pierre, V. Lepetyuk, and R. Mendes. 2018. “Could a Higher Inflation Target Enhance Macroeconomic Stability?” BIS Working Paper 720, Bank for International Settlements, Basel.
Dornbusch, R. 1986. “Flexible Exchange Rates and Excess Capital Mobility.“ Brookings Papers on Economic Activity 1986 (1): 209-26.
Draghi, M. 2015. “Global and Domestic Inflation.” Speech by Mario Draghi, President of the European Central Bank, Economic Club of New York.
Drukker, D., P. Gomis-Porqueras, and P. Hernandez-Verme. 2005. “Threshold Effects in the Relationship Between Inflation and Growth: A New Panel-Data Approach.” MPRA Paper 38225, Munich Personal RePEc Archive, Munich.
Dynan, K. E., J. Skinner, and S. P. Zeldes. 2004. “Do the Rich Save More?” Journal of Political Economy 112 (2): 397-444.
Easterly, W., and S. Fischer. 2001. “Inflation and the Poor.” Journal of Money, Credit and Banking 33 (2): 160–78.
Edwards, S. 1989. “Real Exchange Rates in the Developing Countries: Concepts and Measurement.” NBER Working Paper 2950, National Bureau of Economic Research, Cambridge, MA.
Eggertsson, G. B., and M. Woodford. 2003. “The Zero Bound on Interest Rates and Optimal Monetary Policy.” Brookings Papers on Economic Activity 1: 139-233.
Eggoh, J. C., and M. Khan. 2014. “On the Nonlinear Relationship Between Inflation and Economic Growth.” Research in Economics 68 (2): 133-43.
68
Eickmeier, S., and M. Kühnlenz. 2013. “China’s Role in Global Inflation Dynamics.” Deutsche Bundesbank Discussion Paper 07/2013, Frankfurt am Main.
Eickmeier, S., and K. Pijnenburg. 2013. “The Global Dimension of Inflation—Evidence from Factor-Augmented Phillips Curves.” Oxford Bulletin of Economics and Statistics 75 (1): 103-22.
End, M. N., M. S. J. A. Tapsoba, M. G. Terrier, and R. Duplay. 2015. “Deflation and Public Finances: Evidence from the Historical Records.” IMF Working Paper 2015/176, International Monetary Fund, Washington, DC.
Erosa, A., and G. Ventura. 2002. “On Inflation as a Regressive Consumption Tax.” Journal of Monetary Economics 49 (4): 761-95.
Espinoza, R., H. Leon, and A. Prasad. 2012. “When Should We Worry about Inflation?” World Bank Economic Review 26 (1): 100-27.
Fang, W. S., S. Miller, and C. S. Lee. 2012. “Short- and Long-Run Differences in the Treatment Effects of Inflation Targeting on Developed and Developing Countries.” Department of Economics Working Paper 1003, University of Nevada, Las Vegas.
Federal Reserve Bank of San Francisco. 1999. What Is Deflation and How Is It Different from Disinflation? Federal Reserve Bank San Francisco, San Francisco, CA.
Feldstein, M. S. 1997. “The Costs and Benefits of Going from Low Inflation to Price Stability.” NBER Working Paper 5469, National Bureau of Economic Research, Cambridge, MA.
———. 1999. The Costs and Benefits of Price Stability. Chicago: University of Chicago Press.
———. 2002. “The Role for Discretionary Fiscal Policy in a Low Interest Rate Environment.” NBER Working Paper 9203, National Bureau of Economic Research, Cambridge, MA.
Fernández-Villaverde, J., P. A. Guerrón-Quintana, and J. Rubio-Ramírez. 2010. “Reading the Recent Monetary History of the U.S., 1959-2007.” NBER Working Paper 15929, National Bureau of Economic Research, Cambridge, MA.
Ferreira, F., and J. Litchfield. 2001. “Education or Inflation? The Micro and Macroeconomics of the Brazilian Income Distribution during 1981-1995.” Cuadernos de Economía 38 (114): 209-38.
Fischer, S. 1983. “Inflation and Growth.” NBER Working Paper 1235, National Bureau of Economic Research, Cambridge, MA.
———. 1993. “The Role of Macroeconomic Factors in Growth.” Journal of Monetary Economics 32 (3): 485-512.
———. 2001. “Exchange Rate Regimes: Is the Bipolar View Correct?” Journal of Economic Perspectives 15 (2): 3-24.
Fischer, S., and F. Modigliani. 1978. “Towards an Understanding of the Real Effects and Costs of Inflation.” NBER Working Paper 303, National Bureau of Economic Research, Cambridge, MA.
Fischer, S., R. Sahay, and C. A. Végh. 1996. “Stabilization and Growth in Transition Economies: The Early Experience.” Journal of Economic Perspectives 10 (2): 45-66.
———. 2002. “Modern Hyper- and High Inflations.” NBER Working Paper 8930, National Bureau of Economic Research, Cambridge, MA.
Fisher, I. 1933. “The Debt-Deflation Theory of Great Depressions.” Econometrica 1 (4): 337-57.

69
Frankel, J. A. 2007. “The Simple Geometry of Transmission and Stabilization in Closed and Open Economies: Comment.” In NBER International Seminar on Macroeconomics. Cambridge, MA: National Bureau of Economic Research.
Friedman, M., and A. J. Schwartz. 1963. A Monetary History of the United States, 1867-1960. Princeton, NJ: Princeton University Press.
Fuhrer, J. C. 2009. “Inflation Persistence.” FRB Boston Working Paper 09-14, Federal Reserve Bank of Boston, Boston, MA.
Furceri, D., P. Loungani, J. Simon, and S. Wachter. 2015. “Global Food Prices and Domestic Inflation: Some Cross-Country Evidence.” IMF Working Paper 15/133, International Monetary Fund, Washington, DC.
Furceri, D., P. Loungani, and A. Zdzienicka. 2018. “The Effects of Monetary Policy Shocks on Inequality.” Journal of International Money and Finance 85 (C): 168-86.
Galí, J. 2010. “The Return of the Wage Phillips Curve.” NBER Working Paper 15758, National Bureau of Economic Research, Cambridge, MA.
Galli, R., and R. van der Hoeven. 2001. “Is Inflation Bad for Income Inequality: The Importance of the Initial Rate of Inflation.” ILO Employment Paper 29, International Labour Organization, New York.
Gallup, J. L. 2012. “Is There a Kuznets Curve?” Portland State University Working Paper, Portland, OR.
Gamber, E. N., and J. H. Hung. 2001. “Has the Rise in Global Inflation Reduced U.S. Inflation in the 1990s?” Economic Inquiry 39 (1): 58-73.
Gerlach, S., and P. Tillmann. 2012. “Inflation Targeting and Inflation Persistence in Asia.” Journal of Asian Economics 23 (4): 360-73.
Geronikolaou, G., E. Spyromitros, and P. Tsintzos. 2016. “Inflation Persistence: The Path of Labor Market Structural Reforms.” Economic Modelling 58 (C): 317-22.
Ghosh, A. R., A.-M. Gulde, J. D. Ostry, and H. C. Wolf. 1997. “Does the Nominal Exchange Rate Regime Matter?” NBER Working Paper 5874, National Bureau of Economic Research, Cambridge, MA.
Gibson, J., T. Le, and B. Kim. 2017. “Prices, Engel Curves, and Time-Space Deflation: Impacts on Poverty and Inequality in Vietnam.” World Bank Economic Review 31 (2): 504-30.
Gilbert, R. A. 1985. “Operating Procedures for Conducting Monetary Policy.” Federal Reserve Bank of St. Louis Review 67 (2): 13-21.
Gonçalves, C. E. S., and J. M. Salles. 2008. “Inflation Targeting in Emerging Economies: What Do the Data Say?” Journal of Development Economics 85 (1-2): 312-18.
Goodfriend, M. 1983. “Discount Window Borrowing, Monetary Policy, and the Post-October 6, 1979 Federal Reserve Operating Procedure.” Journal of Monetary Economics 12 (3): 343-56.
———. 2003. “The Phases of U.S. Monetary Policy: 1987-2001.” In Central Banking, Monetary Theory and Practice: Essays in Honour of Charles Goodhart, edited by P. Mizen. Cheltenham, U.K.: Edward Elgar Publishing.
Goolsbee, A. D., and P. J. Klenow. 2018. “Internet Rising, Prices Falling: Measuring Inflation in a World of E-Commerce.” AEA Papers and Proceedings 108: 488-92.
Gorodnichenko, Y., V. Sheremirov, and O. Talavera. 2016. “Price Setting in Online Markets: Does It Click?” NBER Working Paper 20819, National Bureau of Economic Research, Cambridge, MA.

70
Gorodnichenko, Y., and O. Talavera. 2017. “Price Setting in Online Markets: Basic Facts, International Comparisons, and Cross-Border Integration.” The American Economic Review 107 (1): 249–82.
Granato, J., M. Lo, and M. C. Sunny Wong. 2006. “Testing Monetary Policy Intentions in Open Economies.” Southern Economic Journal 72 (3): 730-746.
Greenwood, J., Z. Hercowitz, and P. Krusell. 1997. “Long-Run Implications of Investment- Specific Technological Change.” The American Economic Review 87 (3): 342-362.
Greville, R. P., and M. Reddell. 1990. “The Costs of Inflation.” Reserve Bank of New Zealand Bulletin 53 (1): 37-51.
Gruben, W. C., and D. McLeod. 2002. “Capital Account Liberalization and Inflation.” Economics Letters 77 (2): 221-225.
Guerrieri, L., G. Gust, and D. López-Salido, 2010. “International Competition and Inflation: A New Keynesian Perspective.” American Economic Journal: Macroeconomics 2 (4): 247-280.
Ha, J., M. A. Kose and F. Ohnsorge. 2019. Inflation in Emerging and Developing Economies: Evolution, Drivers and Policies, Washington, D.C., World Bank.
Hakkio, C. C. 2013. “The Great Moderation—1982-2007.” Federal Reserve Bank of Kansas City, Kansas City, MO.
Hobijn, B., and D. Lagakos. 2005. “Inflation Inequality in the United States.” Review of Income and Wealth 51: 581-606.
Iakova, D. 2007. “Flattening of the Phillips Curve: Implications for Monetary Policy.” IMF Working Paper 07/76, International Monetary Fund, Washington, DC.
Ibarra, R., and D. Trupkin. 2011. “The Relationship between Inflation and Growth: A Panel Smooth Transition Regression Approach for Developed and Developing Countries.” Banco Central del Uruguay Working Paper 6, Central Bank of Chile, Santiago.
———. 2016. “"Reexamining the Relationship Between Inflation and Growth: Do Institutions Matter in Developing Countries?”" Economic Modelling 52 (PB): 332-51.
Ihrig, J., S. B. Kamin, D. Lindner, and J. Marquez. 2010. “Some Simple Tests of the Globalization and Inflation Hypothesis.” International Finance 13 (3): 343-75.
Imam, P., 2013. “Demographic Shift and the Financial Sector Stability: The Case of Japan.” Journal of Population Ageing 6 (4): 269-303.
IMF (International Monetary Fund). 2001. “The Decline of Inflation in Emerging Markets: Can It Be Maintained?” Chapter in World Economic Outlook. Washington, DC: International Monetary Fund.
———. 2006. “How Has Globalization Affected Inflation?” In World Economic Outlook. Washington, DC: International Monetary Fund.
———. 2011a. New Growth Drivers for Low-Income Countries: The Role of BRICs.” Washington, DC: International Monetary Fund.
———. 2011b. World Economic Outlook: Slowing Growth, Rising Risks. October. Washington, DC: International Monetary Fund.
———. 2015. Evolving Monetary Policy Frameworks in Low-Income and Other Developing Countries. Washington, DC: International Monetary Fund.
———. 2016. “Global Disinflation in an Era of Constrained Monetary Policy.” In World Economic

71
Outlook: Subdued Demand: Symptoms and Remedies. Washington, DC: International Monetary Fund.
Inoue, T., C. Shimizu, K. G. Nishimura, and Y. Deng. 2016. “Aging, Inflation and Property Prices.” Working Paper, University of Tokyo.
Ivanic, M., and W. Martin. 2008. “Implications of Higher Global Food Prices for Poverty in Low-Income Countries.” Policy Research Working Paper 4594, World Bank, Washington, DC.
Jantti, M., and S. Jenkins. 2010. “The Impact of Macroeconomic Conditions on Income Inequality.” Journal of Economic Inequality 8 (2): 221-40.
Jaumotte, F., and H. Morsy. 2012. “Determinants of Inflation in the Euro Area: The Role of Labor and Product Market Institutions.” IMF Working Paper 12/37, International Monetary Fund, Washington, DC.
Judson, R., and A. Orphanides. 1999. “Inflation, Volatility and Growth.” International Finance 2 (1): 117-38.
Juselius, M., and E. Takáts. 2015. “Can Demography Affect Inflation and Monetary Policy?” BIS Working Paper No. 485, Bank for International Settlements, Basel.
Khan, L. M. 1980. “Bargaining Power, Search Theory and the Phillips Curve.” Cambridge Journal of Economics 4 (3): 233-44.
Khan, M., and A. Senhadji. 2001. “Threshold Effects in the Relationship between Inflation and Growth.” IMF Staff Papers 48 (1): 1-21.
Kahn, S. 1997. “Evidence of Nominal Wage Stickiness from Microdata.” American Economic Review 87 (5): 993-1008.
Kaplan, G., and S. Schulhofer-Wohl. 2017. “Inflation at the Household Level.” Journal of Monetary Economics 91 (C): 19-38.
Katagiri, M. 2018. “Economic Consequences of Population Aging in Japan: Effects through Changes in Demand Structure.” Singapore Economic Review: 1-23.
Khan, M., and A. Senhadji. 2001. “Threshold Effects in the Relationship between Inflation and Growth.” IMF Staff Papers 48 (1): 1-21.
Kiley, M., and J. Roberts. 2017. “Monetary Policy in a Low Interest Rate World.” Brookings Papers on Economic Activity 48 (1): 317-96.
Kohn, D. L. 2006. “The Effects of Globalization on Inflation and Their Implications for Monetary Policy.” Remarks at Federal Reserve Bank of Boston’s 51st Economic Conference, Chatham, MA.
Kremer, S., A. Bick, and D. Nautz. 2013. “Inflation and Growth: New Evidence from a Dynamic Panel Threshold Analysis.” Empirical Economics 44 (2): 861-78.
Krugman, P. 2014. “Inflation Targets Reconsidered.” In ECB Forum on Central Banking, Conference Proceedings, 110–122. Frankfurt am Main: European Central Bank.
Kuznets, S. 1955. “Economic Growth and Income Inequality.” American Economic Review 45 (1): 1-28.
Kwon, G., L. McFarlane, and W. Robinson. 2009. “Public Debt, Money Supply, and Inflation: A Cross-Country Study.” IMF Staff Papers 56 (3): 476-515.
Laidler, D., and M. Parkin. 1975. “Inflation: A Survey.” Economic Journal 85 (345): 741-809.
Lane, P. R. 1997. “Inflation in Open Economies.” Journal of International Economics 42 (3-4): 327-47.
Levell, P., and Z. Oldfield. 2011. The Spending Patterns and Inflation Experience of Low-Income

72
Households over the Past Decade. London: Institute for Fiscal Studies.
Levin, A. T., F. M. Natalucci, and J. M. Piger. 2004. “The Macroeconomic Effects of Inflation Targeting.” Federal Reserve Bank of St. Louis Review 86 (4): 51-80.
Levin, A. T., and J. M. Piger. 2006. “Is Inflation Persistence Intrinsic in Industrial Economies?” http://pages.uoregon.edu/jpiger/research/working-papers/levin-and-piger_is-inflatio.pdf.
Lin, H.-Y., and H.-P. Chu. 2013. “Are Fiscal Deficits Inflationary?” Journal of International Money and Finance 32 (C): 214-33.
Lin, S., and H. Ye. 2007. “Does Inflation Targeting Really Make a Difference? Evaluating the Treatment Effect of Inflation Targeting in Seven Industrial Countries.” Journal of Monetary Economics 54 (8): 2521-33.
———. 2009. “Does Inflation Targeting Make a Difference in Developing Countries?” Journal of Development Economics 89 (1): 118-23.
Logue, D. E., and T. D. Willett. 1976. “A Note on the Relation between the Rate and Variability of Inflation.” Economica 43 (17): 151-58.
Lombardo, G., and F. Ravenna. 2014. “Openness and Optimal Monetary Policy.” Journal of International Economics 93 (1): 153-72.
Lopez-Villavicencio, A., and V. Mignon. 2011. “On the Impact of Inflation on Output Growth: Does the Level of Inflation Matter?” Journal of Macroeconomics 33 (3): 455-64.
Lucas, R. E. 1972. “Expectations and the Neutrality of Money.” Journal of Economic Theory 4 (2): 103-24.
Lünnemann, P., and T. Mathä. 2005. “Regulated and Services’ Prices and Inflation Kohn, D. L. 2006. “The Effects of Globalization on Inflation and Their Implications for Monetary Policy.” Remarks at Federal Reserve Bank of Boston’s 51st Economic Conference, Chatham, MA.
Kremer, S., A. Bick, and D. Nautz. 2013. “Inflation and Growth: New Evidence from a Dynamic Panel Threshold Analysis.” Empirical Economics 44 (2): 861-78.
Krugman, P. 2014. “Inflation Targets Reconsidered.” In ECB Forum on Central Banking, Conference Proceedings, 110–122. Frankfurt am Main: European Central Bank.
Kuznets, S. 1955. “Economic Growth and Income Inequality.” American Economic Review 45 (1): 1-28.
Kwon, G., L. McFarlane, and W. Robinson. 2009. “Public Debt, Money Supply, and Inflation: A Cross-Country Study.” IMF Staff Papers 56 (3): 476-515.
Laidler, D., and M. Parkin. 1975. “Inflation: A Survey.” Economic Journal 85 (345): 741–809.
Lane, P. R. 1997. “Inflation in Open Economies.” Journal of International Economics 42 (3-4): 327-47.
Levell, P., and Z. Oldfield. 2011. The Spending Patterns and Inflation Experience of Low-Income Households over the Past Decade. London: Institute for Fiscal Studies.
Levin, A. T., F. M. Natalucci, and J. M. Piger. 2004. “The Macroeconomic Effects of Inflation Targeting.” Federal Reserve Bank of St. Louis Review 86 (4): 51-80.
Levin, A. T., and J. M. Piger. 2006. “Is Inflation Persistence Intrinsic in Industrial Economies?” http://pages.uoregon.edu/jpiger/research/working-papers/levin-and-piger_is-inflatio.pdf.
Lin, H.-Y., and H.-P. Chu. 2013. “Are Fiscal Deficits Inflationary?” Journal of International Money and Finance 32 (C): 214-33.

73
Lin, S., and H. Ye. 2007. “Does Inflation Targeting Really Make a Difference? Evaluating the Treatment Effect of Inflation Targeting in Seven Industrial Countries.” Journal of Monetary Economics 54 (8): 2521-33.
———. 2009. “Does Inflation Targeting Make a Difference in Developing Countries?” Journal of Development Economics 89 (1): 118-23.
Logue, D. E., and T. D. Willett. 1976. “A Note on the Relation between the Rate and Variability of Inflation.” Economica 43 (17): 151-58.
Lombardo, G., and F. Ravenna. 2014. “Openness and Optimal Monetary Policy.” Journal of International Economics 93 (1): 153-72.
Lopez-Villavicencio, A., and V. Mignon. 2011. “On the Impact of Inflation on Output Growth: Does the Level of Inflation Matter?” Journal of Macroeconomics 33 (3): 455-64.
Lucas, R. E. 1972. “Expectations and the Neutrality of Money.” Journal of Economic Theory 4 (2): 103-24.
Lünnemann, P., and T. Mathä. 2005. "Regulated and Services' Prices and Inflation Persistence." Working Paper 466, European Central Bank, Frankfurt am Main.
Maestri, V., and A. Roventini. 2012. “Inequality and Macroeconomic Factors: A Timeseries Analysis for a Set of OECD Countries.” University of Verona Working Paper 34, Verona, Italy.
Mankiw, N. G., and R. Reis. 2002. “Sticky Information versus Sticky Prices: A Proposal to Replace the New Keynesian Phillips Curve.” Quarterly Journal of Economics 117 (4): 1295-1328.
Matsuoka, H, M. A. Kose, U. Panizza, and D. Vorisek. 2019. “Inflation Expectations: Review and Evidence,” in Ha, J., M. A. Kose and F. Ohnsorge (eds). 2019. Inflation in Emerging and Developing Economies: Evolution, Drivers and Policies, Washington, D.C., World Bank.
McGranahan, L., and A. Paulson. 2006. “Constructing the Chicago Fed Income Based Economic Index–Consumer Price Index: Inflation Experiences by Demographic Group: 1983-2005.” Working Paper 2005-20, Federal Reserve Bank of Chicago, Chicago, IL.
Meltzer, A. H. 2005. “Origins of the Great Inflation.” Federal Reserve Bank of St. Louis Review (March/April): 145-76.
Milani, F. 2012. “Has Globalization Transformed U.S. Macroeconomic Dynamics?” Macroeconomic Dynamics 16 (2): 204-29.
Milanovic, B. 1994. “Determinants of Cross-Country Income Inequality: An Augmented Kuznets Hypothesis.” Policy Research Working Paper 1246, World Bank, Washington, DC.
Miles, D., U. Panizza, R. Reis, and Á. Ubide. 2017. And Yet It Moves: Inflation and the Great Recession. Geneva: International Center for Monetary and Banking Studies.
Minarik, J. 1979. “The Size Distribution of Income during Inflation.” Review of Income and Wealth 25 (4): 377-92.
Mishkin, F. S. 2000. “Inflation Targeting in Emerging-Market Countries.” American Economic Review 90 (2): 105-09.
———. 2007. “Inflation Dynamics.” International Finance 10 (3): 317-34.
———. 2008a. “Can Inflation Targeting Work in Emerging Market Countries?” In Money, Crises, and Transition: Essays in Honor of Guillermo A. Calvo, edited by C. M. Reinhart, C. A. Vegh, and A. Velasco. MIT Press: Cambridge, MA.
74
———. 2008b. “Does Stabilizing Inflation Contribute to Stabilizing Economic Activity?” NBER Working Paper 13970, National Bureau of Economic Research, Cambridge, MA.
———. 2018. “Rethinking the Inflation Target.” Presentation at Brookings Conference, “Should the Fed Stick with the 2 Percent Inflation Target or Rethink It?” Brookings Institution, Washington, DC.
Mishkin, F., and K. Schmidt-Hebbel. 2007. “Does Inflation Targeting Make a Difference?” NBER Working Paper 12876, National Bureau of Economic Research, Cambridge, MA.
Mishra, P., and P. Montiel. 2013. “How Effective Is Monetary Transmission in Low-Income Countries? A Survey of the Empirical Evidence.” Economic Systems 37 (2): 187-216.
Mishra, P., P. J. Montiel, and A. Spilimbergo. 2012. “Monetary Transmission in Low-Income Countries: Effectiveness and Policy Implications.” IMF Economic Review 60 (2): 270-302.
Moghadam, R., R. Teja, and P. Berkmen. 2014. “Euro Area—‘Deflation’ Versus ‘Lowflation.’” https://blogs.imf.org/2014/03/04/euro-area-deflation-versus- lowflation/.
Monnin, P. 2014. “Inflation and Income Inequality in Developed Economies.” Working Paper 1, Centre for Economic Performance, London School of Economics.
Moreno, R. 2001. “Pegging and Stabilization Policy in Developing Countries.” Economic Review of the Federal Reserve Bank of San Francisco 12 (99): 17-29.
Mulligan, C., and X. Sala-i-Martin. 2000. “Measuring Aggregate Human Capital.” Journal of Economic Growth 5 (3): 215-52.
Mussa, M., P. Masson, A. Swoboda, E. Jadresic, P. Mauro, and A. Berg. 2000. “Exchange Rate Regimes in an Increasingly Integrated World Economy.” IMF Occasional Paper 193, International Monetary Fund, Washington, DC.
Ndoricimpa, A. 2017. “Threshold Effects of Inflation on Economic Growth in Africa: Evidence from a Dynamic Panel Threshold Regression.” Working Paper 249, African Development Bank, Abidjan, Côte d’Ivoire.
Nguyen, A. D. M., J. Dridi, F. Unsal, and O. H. Williams. 2017. “On the Drivers of Inflation in Sub-Saharan Africa.” International Economics 151 (October): 71-84.
Omay, T., and E. Öznur Kan. 2010. “Re-examining the Threshold Effects in the Inflation- Growth Nexus with Cross-Sectionally Dependent Non-Linear Panel: Evidence from Six Industrialized Economies.” Economic Modelling 27 (5): 996-1005.
Oosthuizen, M. 2007. “Consumer Price Inflation across the Income Distribution in South Africa.” DPRU Working Paper 07-129, Development Policy Research Unit, University of Cape Town, South Africa.
Orhun, Y., and M. Palazzolo. 2018. “Frugality Is Hard to Afford.” Ross School of Business Paper 1309, Kilts Center for Marketing at Chicago Booth–Nielsen Dataset Paper Series 2- 031.
Osorio, C., and D. F. Unsal. 2013. “Inflation Dynamics in Asia: Causes, Changes, and Spillovers from China.” Journal of Asian Economics 24 (1): 26-40.
Owyang, M.T., J. Piger and H. J. Wall. 2005. “Business Cycle Phases in US States.” Review of Economics and Statistics 87(4): 604-616.
Owyang, M. T., and H. J. Wall. 2006. “Regional VARs and the Channels of Monetary Policy.” Federal Reserve Bank of St. Louis Working Paper 2006-002A, Federal Reserve Bank of St. Louis, St. Louis, MO.
Palmer, J., and M. Barth. 1977. “The Distributional Effects of Inflation and Higher Unemployment.” In Improving Measures of Economic Well-Being, edited by M. Moon and E. Smolensky. New York: Academic
75
Press.
Parker, S. 1998. “Income Inequality and the Business Cycle: A Survey of Evidence and Some New Results.” Journal of Post Keynesian Economics 21 (2): 201-25.
Phillips, A. W. 1958. “The Relationship between Unemployment and the Rate of Change of Money Wages in the United Kingdom, 1861-1957.” Economica 25 (100): 283-99.
Piketty, T. 2014. Capital in the Twenty-First Century. Cambridge, MA: Harvard University Press.
Poole, W. 1982. “Federal Reserve Operating Procedures: A Survey and Evaluation of the Historical Record Since October 1979.” Journal of Money, Credit and Banking 14 (4): 575-96.
Ravallion, M. 2012. “Why Don’t We See Poverty Convergence?” American Economic Review 102 (1): 504-23.
Razîn, A., and A. Binyamini. 2007. “Flattening of the Short-Run Trade-Off between Inflation and Domestic Activity: The Analytics of the Effects of Globalization.” Kiel Working Paper 1363, Kiel Institute for the World Economy, Kiel, Germany.
Reifschneider, D., and J. C. Williams. 2000. “Three Lessons for Monetary Policy in a Low- Inflation Era.” Journal of Money, Credit and Banking 32 (4-2): 936-66.
Roberts, J. M. 2006. “Monetary Policy and Inflation Dynamics.” International Journal of Central Banking 2 (3): 193-23.
Rodrik, D. 1990. “Premature Liberalization, Incomplete Stabilization: The Ozal Decade in Turkey.” NBER Working Paper 3300, National Bureau of Economic Research, Cambridge, MA.
Rogoff, K. 2003. “Globalization and Global Disinflation.” Federal Reserve Bank of Kansas City Economic Review 88 (4): 45-78.
———. 2015. “Costs and Benefits of Phasing Out Paper Currency.” In NBER Macroeconomics Annual 2014, edited by J. A. Parker and M. Woodford. Chicago: University of Chicago Press.
Romer, C. D., and D. H. Romer. 1997. “Institutions for Monetary Stability.” In Reducing Inflation: Motivation and Strategy, edited by C. D. Romer and D. H. Romer. Chicago: University of Chicago Press.
———. 1998. “Monetary Policy and the Well-Being of the Poor.” NBER Working Paper 6793, National Bureau of Economic Research, Cambridge, MA.
Romer, D. 1993. “Openness and Inflation: Theory and Evidence.” Quarterly Journal of Economics 108 (4): 869-903.
Roncaglia de Carvalho, A. 2014. “Structural Change, De-Industrialization and Inflation Inertia in Brazil.” https://ssrn.com/abstract=2509254.
Rose, A. K. 2007. “A Stable International Monetary System Emerges: Inflation Targeting Is Bretton Woods, Reversed.” Journal of International Money and Finance 26 (5): 663-81.
———. 2011. “Exchange Rate Regimes in the Modern Era: Fixed, Floating, and Flaky.” Journal of Economic Literature 49 (3): 652-72.
Rotemberg, J. J. 1982. “Sticky Prices in the United States.” Journal of Political Economy 90 (6): 1187-1211.
Rotemberg, J. J., and M. Woodford. 1997. “An Optimization-Based Econometric Framework for the Evaluation of Monetary Policy.” In NBER Macroeconomics Annual 1997, Vol. 12, edited by B. S. Bernanke and J. Rotemberg. Cambridge, MA: MIT Press.

76
Rumler, F. 2007. “Estimates of the Open Economy New Keynesian Phillips Curve for Euro Area Countries.” Open Economies Review 18 (4): 427-51.
Sargent, T., and N. Wallace. 1981. “Some Unpleasant Monetarist Arithmetic.” Federal Reserve Bank of Minneapolis Quarterly Review 5 (3): 1-17.
Sbordone, A. M. 2007. “Globalization and Inflation Dynamics: The Impact of Increased Competition.” NBER Working Paper 13556, National Bureau of Economic Research, Cambridge, MA.
Schembri, L. 2017. “Getting to the Core of Inflation.” Remarks at the Department of Economics, Western University, London, Ontario, February 9.
Schmitt-Grohé, S., and M. Uribe. 2010. “The Optimal Rate of Inflation.” In Handbook of Monetary Economics 1 (3): 653-722.
Schwartz, A. J. 1995. “Why Financial Stability Depends on Price Stability.” Economic Affairs 15 (4): 21-25.
Shambaugh, J. C. 2004. “The Effect of Fixed Exchange Rates on Monetary Policy.” Quarterly Journal of Economics 119 (1): 301-52.
———. 2016. China’s Future. Malden, MA: Polity Press.
Siami-Namini, S., and D. Hudson. 2017. “Inflation and Income Inequality in Developed and Developing Countries.” Unpublished, Texas Tech University, Lubbock, Texas.
Siegel, J. J. 1994. Stocks for the Long Run: A Guide to Selecting Markets for Long-term Growth. Burr Ridge, IL: Irwin Professional Publishing.
Siklos, P. L. 2003. “Assessing the Impact of Changes in Transparency and Accountability at the Bank of Canada.” Canadian Public Policy / Analyse de Politiques 29 (3): 279-99.
Sims, C. A., and T. Zha. 1998. “Does Monetary Policy Generate Recessions?” Federal Reserve Bank of Atlanta Working Paper 98-12, Federal Reserve Bank of Atlanta, Atlanta, GA.
Söderström, U. 2005. “Targeting Inflation with a Role for Money.” Economica 72 (288): 577-96.
Stock, J. H., and M. W. Watson. 2003. “Has the Business Cycle Changed and Why?” In NBER Macroeconomics Annual 2002, Vol. 17, edited by M. Gertler and K. Rogoff. Cambridge, MA: MIT Press.
———. 2007. “Why Has U.S. Inflation Become Harder to Forecast?” Journal of Money, Credit and Banking 39 (1): 3-33.
———. 2010. “Modeling Inflation after the Crisis.” NBER Working Paper 16488, National Bureau of Economic Research, Cambridge, MA.
———. 2016. “Core Inflation and Trend Inflation.” Review of Economics and Statistics 98 (4): 770-84.
Svensson, L. E. O. 2003. “Escaping from a Liquidity Trap and Deflation: The Foolproof Way and Others.” Journal of Economic Perspectives 17 (4): 145-66.
Szafranek, K. 2017. “Flattening of the New Keynesian Phillips Curve: Evidence for an Emerging, Small Open Economy.” Economic Modelling 63 (C): 334-48.
Taylor, J. B. 1979. “Staggered Wage Setting in the Macro Model.” American Economic Review 69 (2): 108-13.
———. 1980. “Aggregate Dynamics and Staggered Contracts.” Journal of Political Economy 88 (1): 1-23.

77
———. 2000. “Low Inflation, Pass-Through, and the Pricing Power of Firms.” European Economic Review 44 (7): 1389-1408.
———. 2014. “Inflation Targeting in Emerging Markets: The Global Experience.” Speech at the Conference on Fourteen Years of Inflation Targeting in South Africa and the Challenge of a Changing Mandate, South African Reserve Bank, Pretoria.
Temple, J. 2002. “Inflation and Growth: Stories Short and Tall.” Journal of Economic Surveys 14 (4): 395-426.
Terra, C. T. 1998. “Openness and Inflation: A New Assessment.” Quarterly Journal of Economics 113 (2): 641-48.
Thalassinos, E., E. Ugurlu, and Y. Muratoğlu. 2012. “Income Inequality and Inflation in the EU.” European Research Studies XV (1): 127-40.
Thanh, S. D. 2015. “Threshold Effects of Inflation on Growth in the ASEAN-5 Countries: A Panel Smooth Transition Regression Approach.” Journal of Economics, Finance and Administrative Science 20 (38): 41-48.
Thornton, D. L. 2004. “When Did the FOMC Begin Targeting the Federal Funds Rate? What the Verbatim Transcripts Tell Us.” Working Paper 2004-015B, Federal Reserve Bank of St. Louis, St. Louis, MO.
Uhlig, H. 2005. “What Are the Effects of Monetary Policy on Output? Results from an Agnostic Identification Procedure.” Journal of Monetary Economics 52 (2): 381-419.
van der Cruijsen, C., and M. Demertzis. 2007. “The Impact of Central Bank Transparency on Inflation Expectations.” European Journal of Political Economy 23 (1): 51-66.
Vaona, A., and S. Schiavo. 2007. “Nonparametric and Semiparametric Evidence on the Long-Run Effects of Inflation on Growth.” Economics Letters 94 (3): 452-58.
Vinayagathasan, T. 2013. “Inflation and Economic Growth: A Dynamic Panel Threshold Analysis for Asian Economies.” Journal of Asian Economics 26 (June): 31-41.
Vuletin, G., and L. Zhu. 2011. “Replacing a ‘Disobedient’ Central Bank Governor with a ‘Docile’ One: A Novel Measure of Central Bank Independence and Its Effect on Inflation.” Journal of Money, Credit and Banking 43 (6): 1185-1215.
Weber, C. S. 2016. “Central Bank Transparency and Inflation (Volatility)—New Evidence.” International Economics and Economic Policy 15: 21-67.
Weichenrieder, A., and E. Gürer. 2018. “Pro-Rich Inflation in Europe: Implications for the Measurement of Inequality.” SAFE Working Paper 209, Sustainable Architecture for Finance in Europe, Frankfurt.
Weidmann, J. 2013. “Who Calls the Shots? The Problem of Fiscal Dominance.” Speech at the BdF-BBk Macroeconomics and Finance Conference. Deutsche Bundesbank Eurosystem, Paris.
White, W. R. 2006. “Is Price Stability Enough?” BIS Working Paper 205, Bank for International Settlements, Basel.
Woodford, M. 2003. Interest and Prices: Foundations of a Theory of Monetary Policy. Princeton, NJ: Princeton University Press.
World Bank. 2010. Global Monitoring Report 2010: The MDGs after the Crisis. Washington, DC: World Bank.
———. 2015. Global Economic Prospects: Having Fiscal Space and Using It. January. Washington, DC: World Bank.

78
———. 2016. Global Economic Prospects: Spillovers Amid Weak Growth. January. Washington, DC: World Bank.
———. 2017a. World Development Indicators 2017. Washington, DC: World Bank.
———. 2017b. “World Integrated Trade Solution.” https://wits.worldbank.org/.
Wright, J. 2011. “Term Premia and Inflation Uncertainty: Empirical Evidence from an International Panel Dataset.” American Economic Review 101 (4): 1514-34.
Yellen, J. 2006. “Monetary Policy in a Global Environment.” FRBSF Economic Letter. June. Speech at the Euro and the Dollar in a Globalized Economy Conference, U.C. Santa Cruz, Santa Cruz, CA.
Yoon, J. W., J. Kim, and J. Lee. 2014. “Impact of Demographic Changes on Inflation and the Macroeconomy.” IMF Working Paper 14/210, International Monetary Fund, Washington, DC.
Zhang, C. 2015. “The Effect of Globalization on Inflation in New Emerging Markets.” Emerging Markets Finance and Trade 51 (5): 1021-33.