wp3: fixing res-h/c targets lukas kranzl, andreas müller res-h policy meeting, march 2009
TRANSCRIPT
WP3: Fixing RES-H/C targets
Lukas Kranzl, Andreas Müller
RES-H Policy Meeting, March 2009

2
Structure of the discussion
• Objectives, time table, task structure and methodology of this WP
• Structure of the target report• Preliminary results
– AT (AT, Upper Austria, Styria?)– GR– LT– NL– PL– UK
• Discussion and next steps
3
• Determine options for 2020/2030 RES-H/C targets and their trajectories in the seven target countries/regions.
• Involve national stakeholder and in particular policy makers in that process
• Split up the target into different energy sources, technologies and sectors
• Assist member states in setting up sector-specific targets in the national action plans.
WP3 - objective

4
Methodology
Data basis and scientific ground for target setting
RES H/C targets
Stakeholder policy processtarget setting
Exi
stin
g sc
enar
ios
Top
-dow
nap
proa
ch
Bot
tom
-up
appr
oach
Pol
icy
asse
ssm
ent
Economic modeling
results
Revised targets
Policy workshops
WP 3 WP 4
5
• 3.1. Analysis of existing RES-H/C scenarios and potentials
• 3.2. Top-down assessment of RES-H/C targets
• 3.3. Bottom-up approach to determine RES-H/C targets
• 3.4. Production of target reports
• 3.5. Stakeholder dialogue
Task overview
6
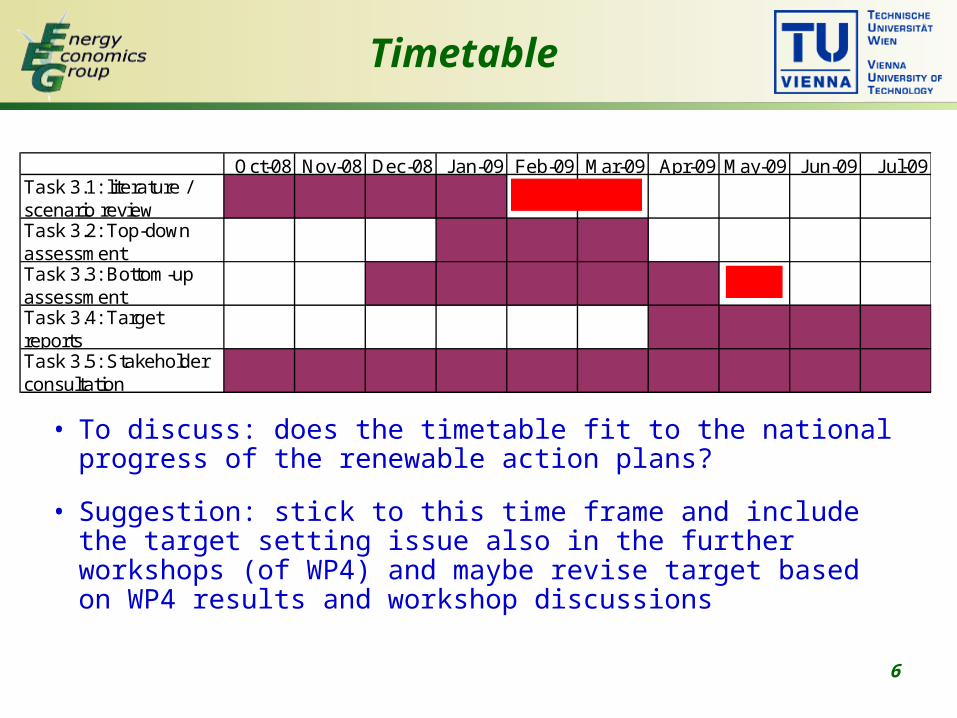
Timetable
Oct-08 Nov-08 Dec-08 Jan-09 Feb-09 Mar-09 Apr-09 May-09 Jun-09 Jul-09Task 3.1: literature / scenario reviewTask 3.2: Top-down assessmentTask 3.3: Bottom-up assessmentTask 3.4: Target reportsTask 3.5: Stakeholder consultation
• To discuss: does the timetable fit to the national progress of the renewable action plans?
• Suggestion: stick to this time frame and include the target setting issue also in the further workshops (of WP4) and maybe revise target based on WP4 results and workshop discussions
7
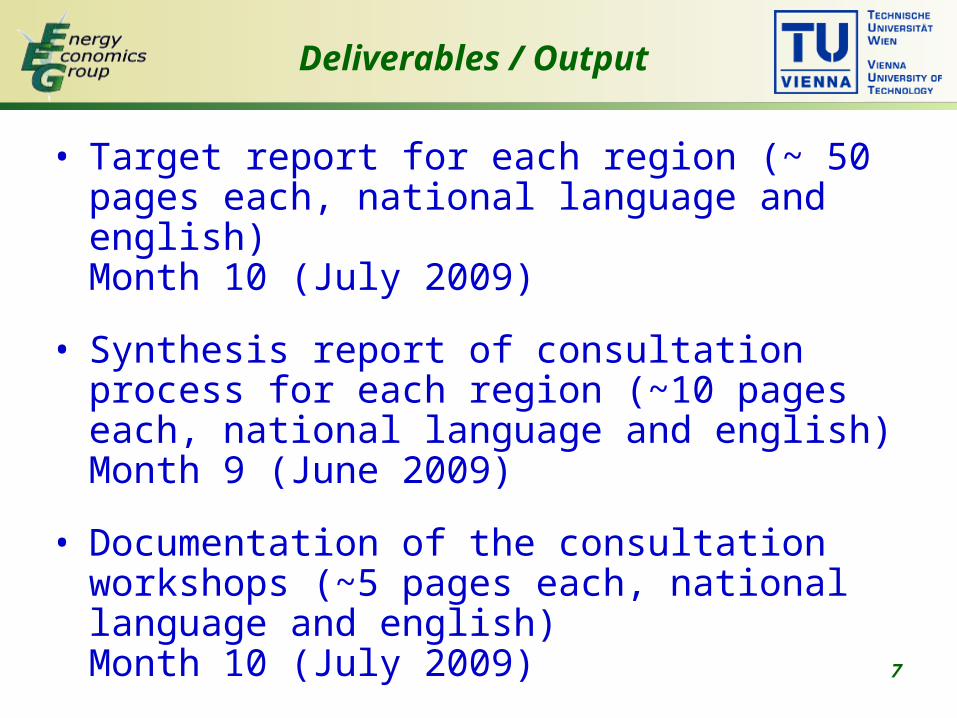
• Target report for each region (~ 50 pages each, national language and english)Month 10 (July 2009)
• Synthesis report of consultation process for each region (~10 pages each, national language and english)Month 9 (June 2009)
• Documentation of the consultation workshops (~5 pages each, national language and english)Month 10 (July 2009)
Deliverables / Output
8
• Review of regional / national / European studies
• Output: Dataset to assess possible RES-H/C market developments (BAU/policy scenarios?)
Task 3.1 existing scenarios and potentials
9
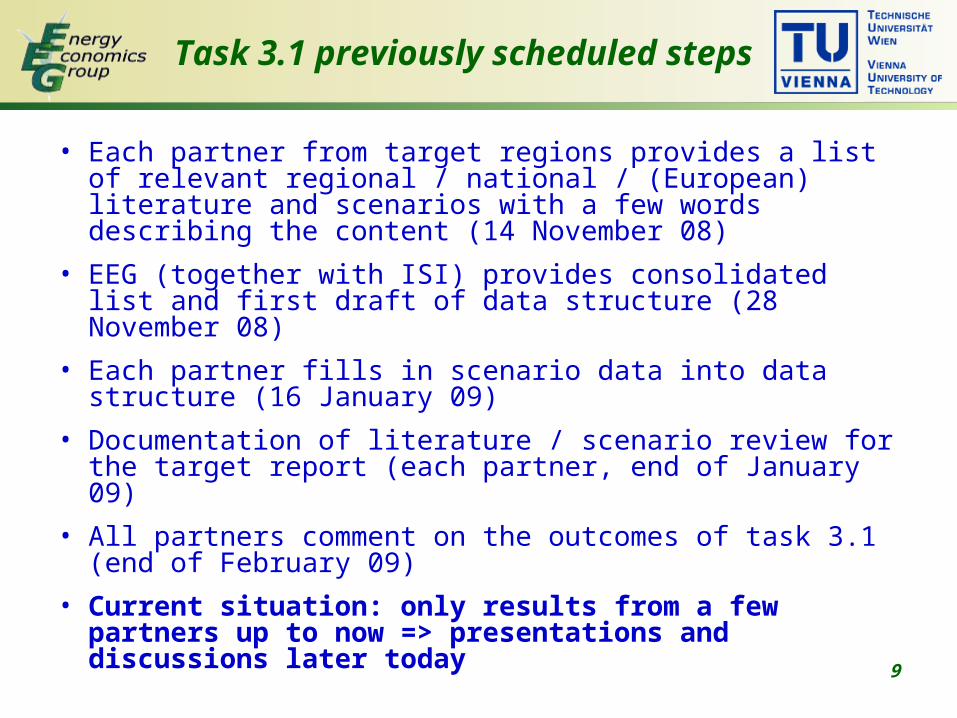
Task 3.1 previously scheduled steps
• Each partner from target regions provides a list of relevant regional / national / (European) literature and scenarios with a few words describing the content (14 November 08)
• EEG (together with ISI) provides consolidated list and first draft of data structure (28 November 08)
• Each partner fills in scenario data into data structure (16 January 09)
• Documentation of literature / scenario review for the target report (each partner, end of January 09)
• All partners comment on the outcomes of task 3.1 (end of February 09)
• Current situation: only results from a few partners up to now => presentations and discussions later today
10
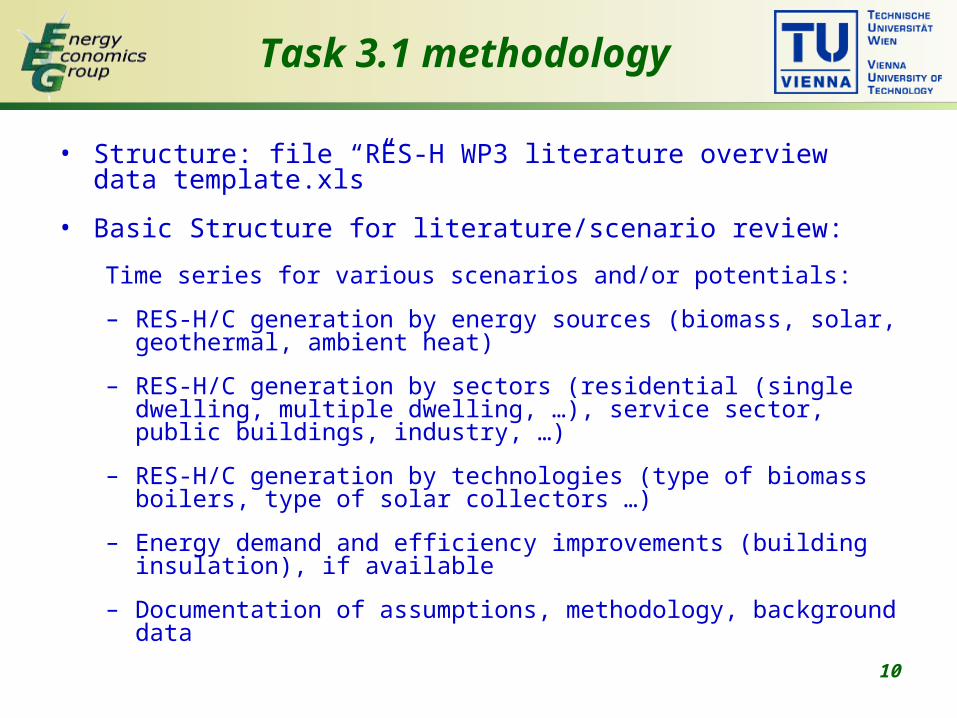
Task 3.1 methodology
• Structure: file “RES-H WP3 literature overview data template.xls”
• Basic Structure for literature/scenario review:
Time series for various scenarios and/or potentials:
– RES-H/C generation by energy sources (biomass, solar, geothermal, ambient heat)
– RES-H/C generation by sectors (residential (single dwelling, multiple dwelling, …), service sector, public buildings, industry, …)
– RES-H/C generation by technologies (type of biomass boilers, type of solar collectors …)
– Energy demand and efficiency improvements (building insulation), if available
– Documentation of assumptions, methodology, background data

11
Task 3.2 top-down
• Idea: in Task 3.1. different studies with different methodologies are the basis for the analysis. In this task: common methodology from a single model.
• Green-X model runs include scenarios for RES-H/C in each member state until 2020.
• Use previous model runs of Green-X to get reference scenarios for RES-H/C development.
12
Task 3.2 Working progress / next steps
• Presentation of Green-X results (EEG, ISI, later today)
• Document Green-X results in the target report (first draft March 09, final version for the meeting in May 09)
• Discussion with partners (March, April 09)
13
Task 3.2 Top-down
Exemplary Green-X results for EU-27
Source: Green-X Simulations, Futures-E,
Scenario: „strengthened policies“ (~20% 2020 target scenario)
(in this way results will be presented for each target region)

The The Green-Green-XX approach: approach:
DynamicDynamic cost-resource cost-resource
curves curves
&&
a detaileda detailed energy policy energy policy representationrepresentation
Task 3.2 methodology
Mid-term (up to 2020) realisable potentials in year n & corresponding costs for RES at country level by RES technology (subdivided into several bands)
Realisable yearly potentials in year n
Deployment in year nand corresponding costs & benefits
band 1
costs
potential
band 2 band 3…
costs
potential
costs
potential
Technology diffusion (‘S-curve’)(non-economic barriers by technology/country)
Technological change((global) learning curves by technology)
Po
ten
tia
lC
os
t (e
ffic
ien
cy)
Energy policy(energy prices, RES support)
e.g. Feed-in tariffs, Investment incentives,Tendering schemes, Quotas with tradable green certificates
PFIT
n+1
15
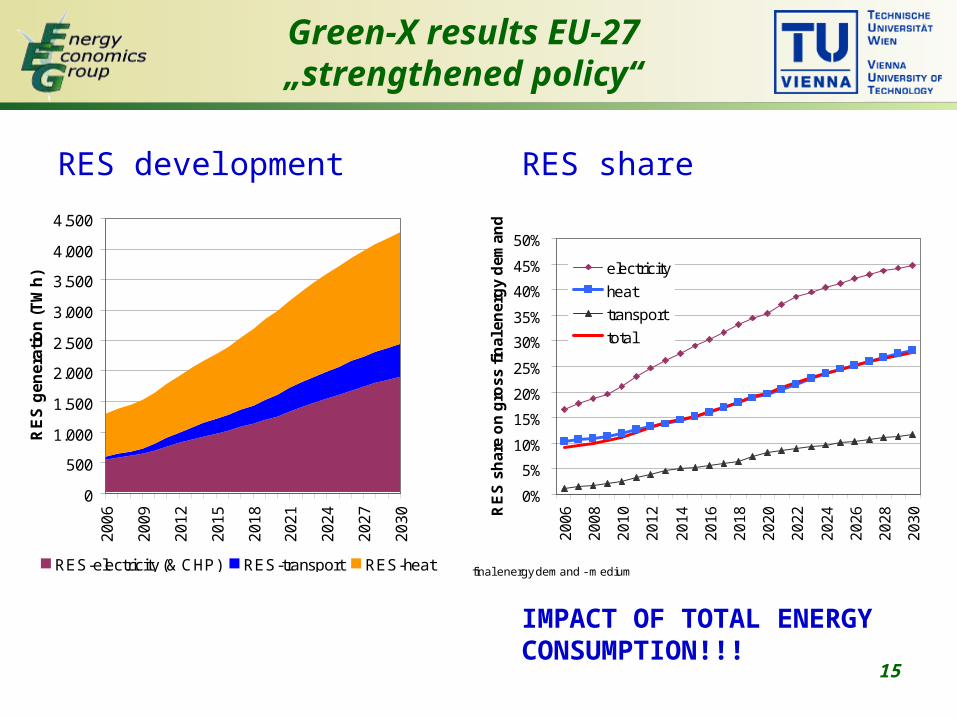
Green-X results EU-27„strengthened policy“
RES development RES share
IMPACT OF TOTAL ENERGY CONSUMPTION!!!
0
500
1.000
1.500
2.000
2.500
3.000
3.500
4.000
4.500
20
06
20
09
20
12
20
15
20
18
20
21
20
24
20
27
20
30
RE
S g
en
era
tio
n (
TW
h)
RES-electricity (& CHP) RES-transport RES-heat final energy demand - medium
0%
5%
10%
15%
20%
25%
30%
35%
40%
45%
50%
20
06
20
08
20
10
20
12
20
14
20
16
20
18
20
20
20
22
20
24
20
26
20
28
20
30R
ES
sh
are
on
gro
ss
fin
al e
ne
rgy
de
ma
nd
electricity
heat
transport
total
16
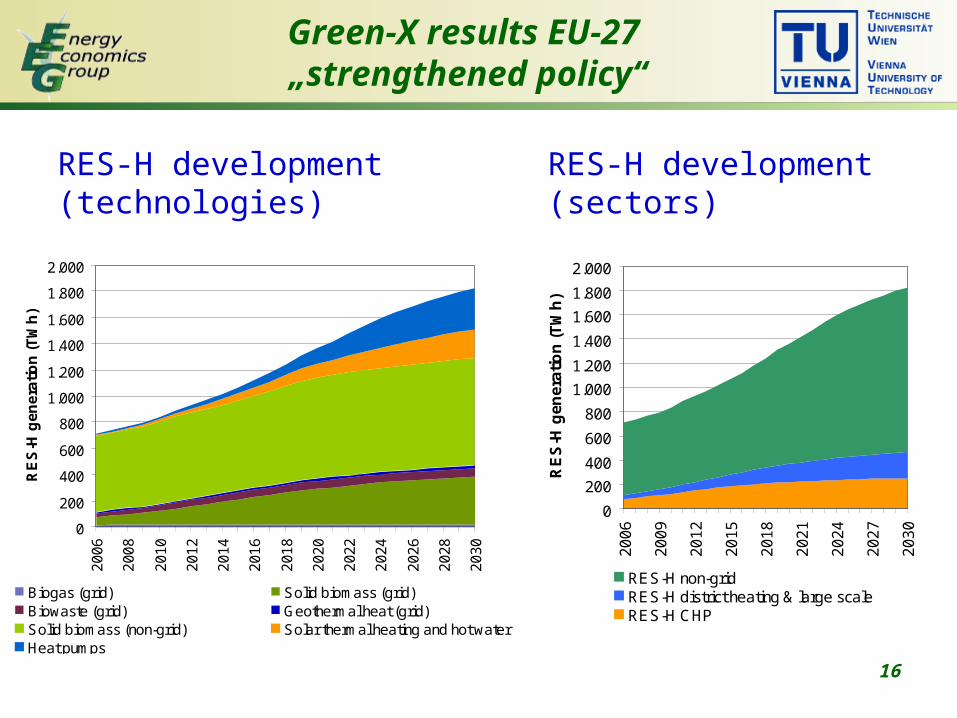
Green-X results EU-27 „strengthened policy“
RES-H development (technologies)
RES-H development (sectors)
0
200
400
600
800
1.000
1.200
1.400
1.600
1.800
2.000
20
06
20
08
20
10
20
12
20
14
20
16
20
18
20
20
20
22
20
24
20
26
20
28
20
30
RE
S-H
ge
ne
rati
on
(T
Wh
)
Biogas (grid) Solid biomass (grid)Biowaste (grid) Geothermal heat (grid)Solid biomass (non-grid) Solar thermal heating and hot waterHeat pumps
0
200
400
600
800
1.000
1.200
1.400
1.600
1.800
2.000
20
06
20
09
20
12
20
15
20
18
20
21
20
24
20
27
20
30
RE
S-H
ge
ne
rati
on
(T
Wh
)
RES-H non-gridRES-H district heating & large scaleRES-H CHP
17
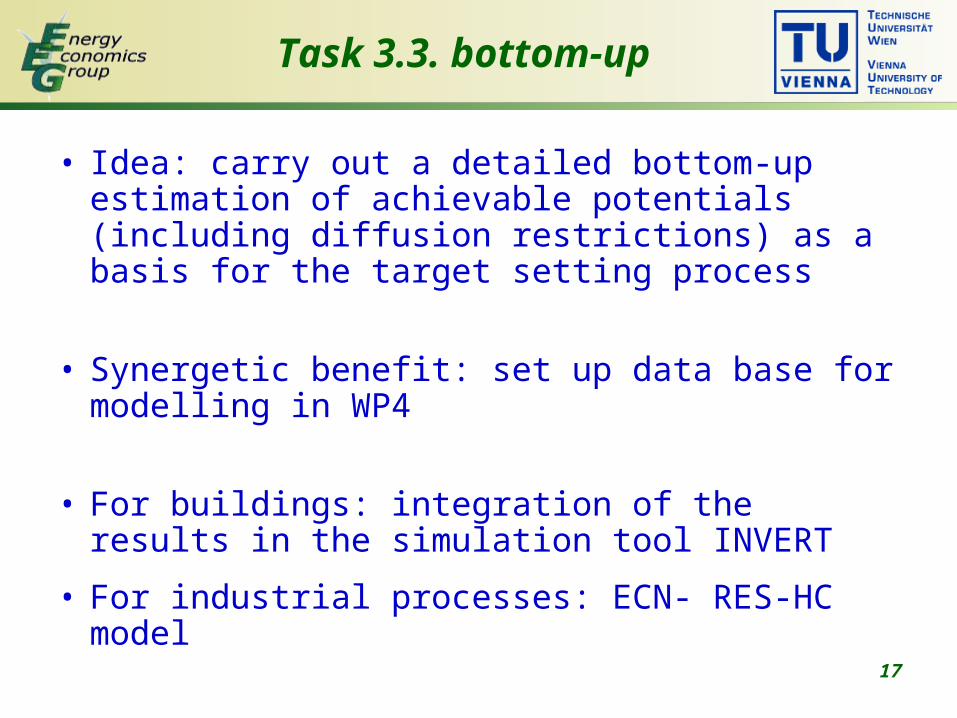
Task 3.3. bottom-up
• Idea: carry out a detailed bottom-up estimation of achievable potentials (including diffusion restrictions) as a basis for the target setting process
• Synergetic benefit: set up data base for modelling in WP4
• For buildings: integration of the results in the simulation tool INVERT
• For industrial processes: ECN- RES-HC model

18
Task 3.3 Working progress
Structure for regional/national data requirement (EEG, (ISI), 28 November 08) (ECN???)
• Data collection (each target region partner, January 09)(partly completed, partly not yet started?!)
• Suggestion for default data (investment costs, energy prices etc) by EEG, ECN, ISI April 09; to be discussed until meeting in May
• Previous schedule: Integration of regional data into models INVERT and RES-HC model (EEG, ISI, ECN, March 09)
Revised schedule: Structured data base of bottom up data and detailed analysis results until meeting in May (EEG, ISI, ECN together with partners)
• Result documentation (EEG, (ISI), ECN, May / June 09)
19
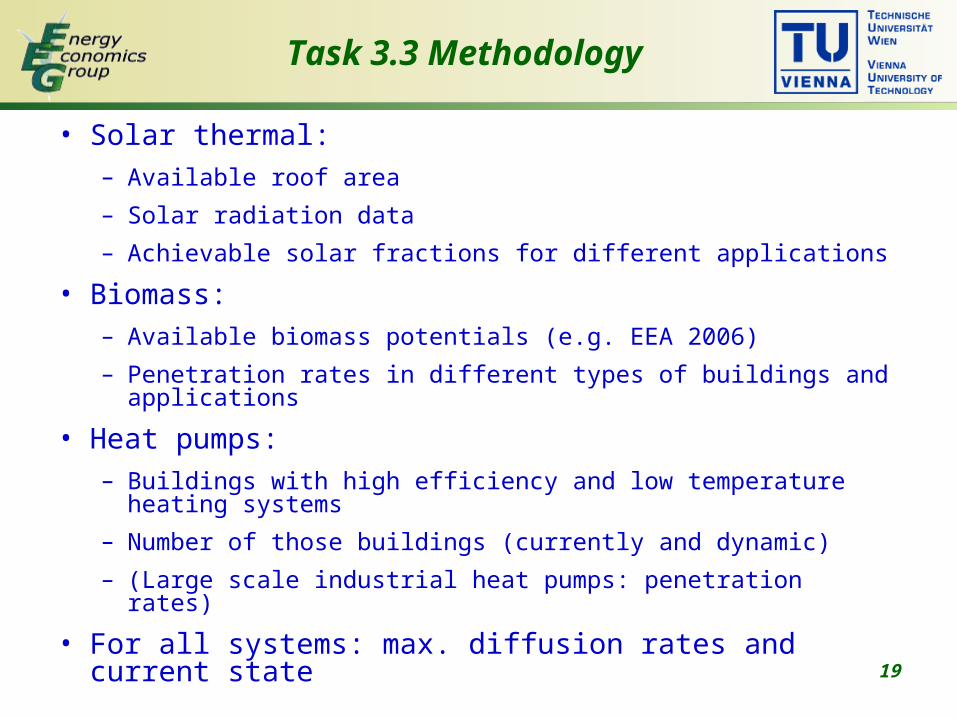
Task 3.3 Methodology
• Solar thermal:– Available roof area
– Solar radiation data
– Achievable solar fractions for different applications
• Biomass:– Available biomass potentials (e.g. EEA 2006)
– Penetration rates in different types of buildings and applications
• Heat pumps:– Buildings with high efficiency and low temperature heating
systems
– Number of those buildings (currently and dynamic)
– (Large scale industrial heat pumps: penetration rates)
• For all systems: max. diffusion rates and current state

20
Task 3.3 Data requirement
Detailed data requirement in the files:
• RES-H bottom-up data requirement.doc
• RES-H bottom-up data template.xls (building data)
26
Task 3.3 Data requirement
Industry
27
Task 3.4 target reports
• Draft report: Synthesis of literature/scenario review (3.1), top-down (3.2) and bottom-up (3.3)
• Final report include outcomes of the stakeholder dialogue
• Target reports include technology and sector specific targets

28
Task 3.4 working progress
Draft target report structure (EEG, November 08)
• Literature review chapter (each target country partner, March 09)
• Green-X results (EEG/ISI: draft in March, final in May 09)
• Draft target report (all target country / region partners, April 09)
• Comments of all partners on draft target reports (May 09)
• Final target reports (all target country / region partners, July 09)
29
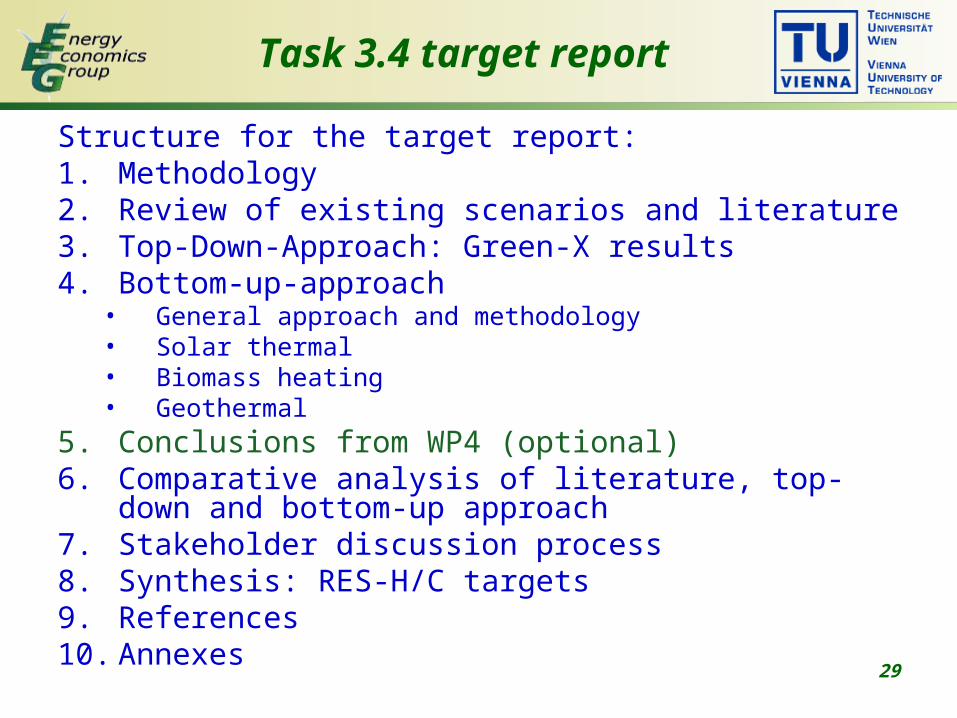
Task 3.4 target report
Structure for the target report:1. Methodology2. Review of existing scenarios and literature3. Top-Down-Approach: Green-X results4. Bottom-up-approach
• General approach and methodology• Solar thermal• Biomass heating• Geothermal
5. Conclusions from WP4 (optional)6. Comparative analysis of literature, top-down and
bottom-up approach7. Stakeholder discussion process8. Synthesis: RES-H/C targets9. References10. Annexes
30
Target report structure: Do you agree?
We are all supposed to use these country-target reports in the stakeholder consultation and the workshop(s)!
31
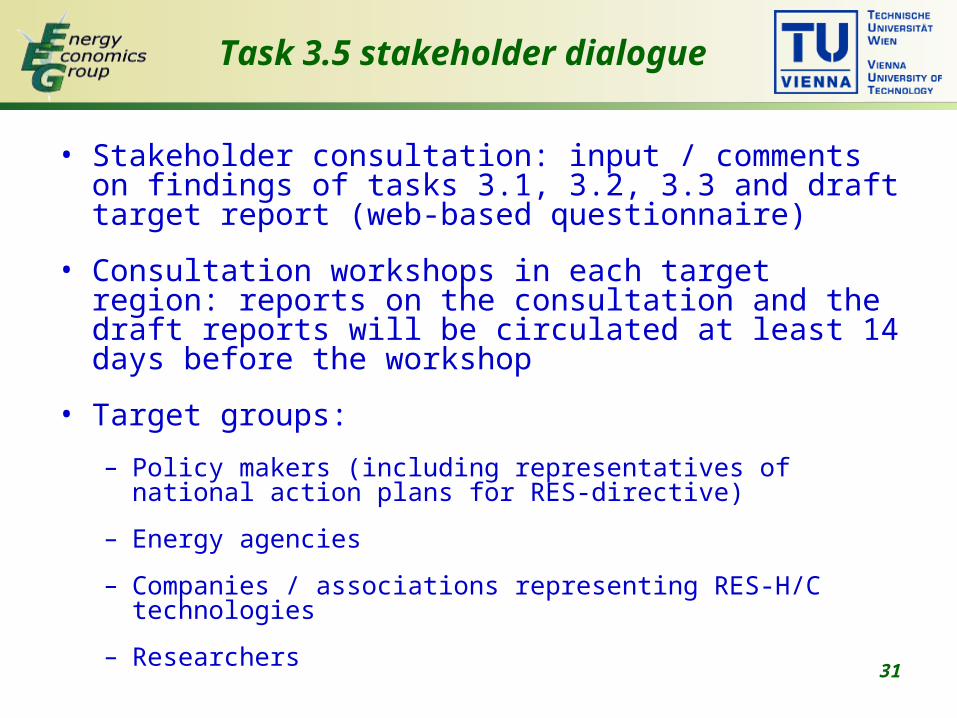
Task 3.5 stakeholder dialogue
• Stakeholder consultation: input / comments on findings of tasks 3.1, 3.2, 3.3 and draft target report (web-based questionnaire)
• Consultation workshops in each target region: reports on the consultation and the draft reports will be circulated at least 14 days before the workshop
• Target groups:
– Policy makers (including representatives of national action plans for RES-directive)
– Energy agencies
– Companies / associations representing RES-H/C technologies
– Researchers
32
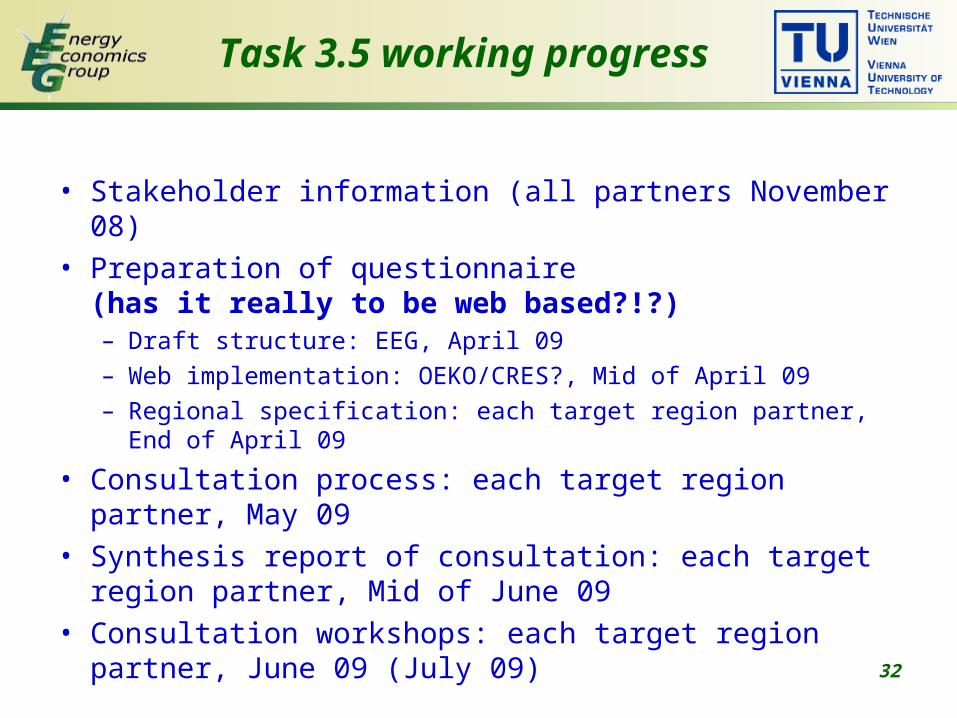
Task 3.5 working progress
• Stakeholder information (all partners November 08)• Preparation of questionnaire
(has it really to be web based?!?)– Draft structure: EEG, April 09– Web implementation: OEKO/CRES?, Mid of April 09– Regional specification: each target region partner, End of April
09
• Consultation process: each target region partner, May 09• Synthesis report of consultation: each target region
partner, Mid of June 09• Consultation workshops: each target region partner,
June 09 (July 09)
33
Preliminary results: AT (Styria???)

34
AT – Styria (- Upper Austria)
Clarification of the role of the different regional levels: • Stakeholder consultation: Austrian level considering in particular
Styrian stakeholders, too• Target Workshop June 09: national level• Workshop end of 09 / beginning 10 in Styria: target setting +
qualitative policy analysis• Workshop June 10 national level: combining qualitative and
quantitative analyses of policy instruments
• WP 2 country reports: national with Styrian specific parts• WP 3 target report: national level (because renewable action plan is
on the national level), maybe short discussion regarding Styria• WP 4 working document qualitative analysis of instruments: national
or regional level, depending on the type of instrument (difference to Upper Austria??? => common report for whole Austria on the national and regional level?)
• WP4 summary quantitative assessment policy options: focused on the national level with some discussions regarding Styria
35
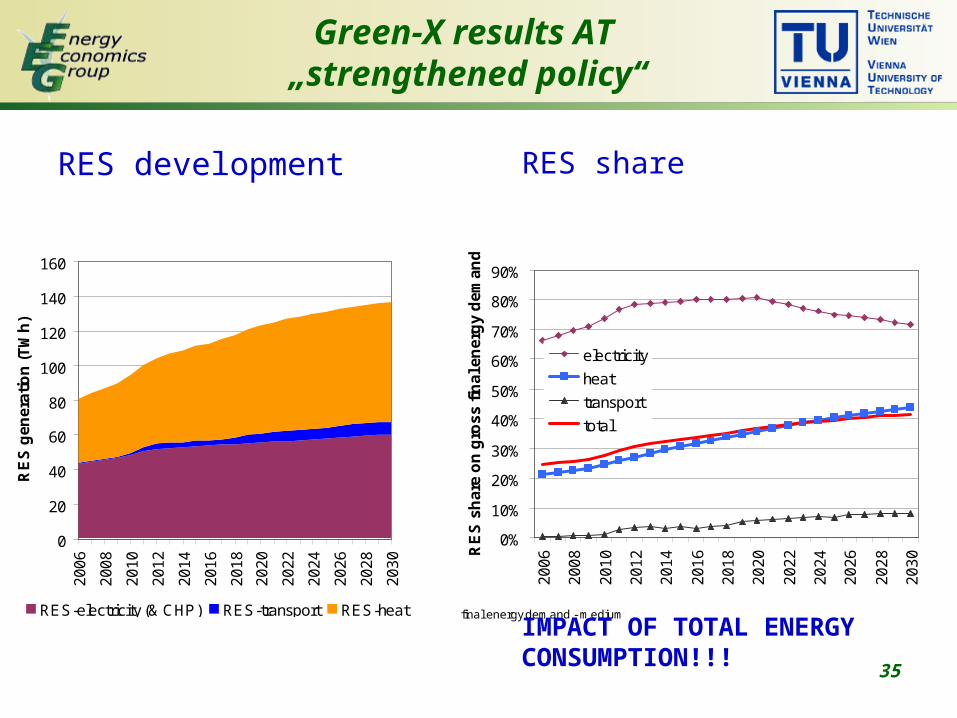
Green-X results AT „strengthened policy“
0
20
40
60
80
100
120
140
160
20
06
20
08
20
10
20
12
20
14
20
16
20
18
20
20
20
22
20
24
20
26
20
28
20
30
RE
S g
en
era
tio
n (
TW
h)
RES-electricity (& CHP) RES-transport RES-heat final energy demand - medium
0%
10%
20%
30%
40%
50%
60%
70%
80%
90%
20
06
20
08
20
10
20
12
20
14
20
16
20
18
20
20
20
22
20
24
20
26
20
28
20
30R
ES
sh
are
on
gro
ss
fin
al e
ne
rgy
de
ma
nd
electricity
heat
transport
total
RES development RES share
IMPACT OF TOTAL ENERGY CONSUMPTION!!!

36
Green-X results AT „strengthened policy“
RES-H development (technologies)
RES-H development (sectors)
0
10
20
30
40
50
60
70
80
20
06
20
08
20
10
20
12
20
14
20
16
20
18
20
20
20
22
20
24
20
26
20
28
20
30
RE
S-H
ge
ne
rati
on
(T
Wh
)
Biogas (grid) Solid biomass (grid)Biowaste (grid) Geothermal heat (grid)Solid biomass (non-grid) Solar thermal heating and hot waterHeat pumps
0
10
20
30
40
50
60
70
80
200
6
200
8
201
0
201
2
201
4
201
6
201
8
202
0
202
2
202
4
202
6
202
8
203
0
RE
S-H
gen
era
tio
n (
TW
h)
RES-H non-gridRES-H district heating & large scaleRES-H CHP
37
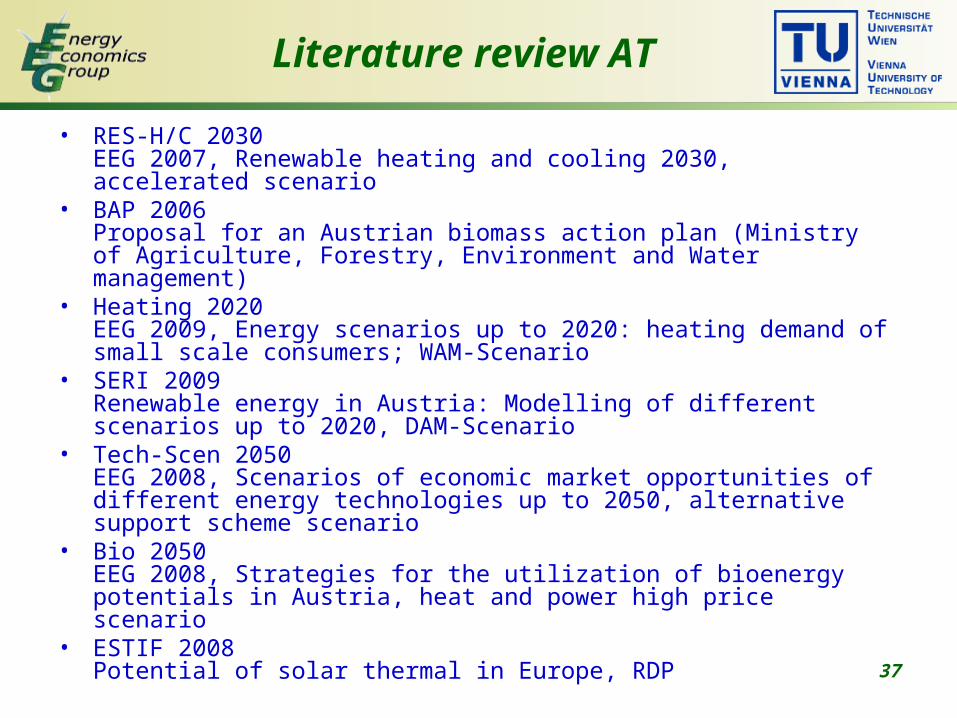
Literature review AT
• RES-H/C 2030EEG 2007, Renewable heating and cooling 2030, accelerated scenario
• BAP 2006Proposal for an Austrian biomass action plan (Ministry of Agriculture, Forestry, Environment and Water management)
• Heating 2020EEG 2009, Energy scenarios up to 2020: heating demand of small scale consumers; WAM-Scenario
• SERI 2009Renewable energy in Austria: Modelling of different scenarios up to 2020, DAM-Scenario
• Tech-Scen 2050EEG 2008, Scenarios of economic market opportunities of different energy technologies up to 2050, alternative support scheme scenario
• Bio 2050EEG 2008, Strategies for the utilization of bioenergy potentials in Austria, heat and power high price scenario
• ESTIF 2008Potential of solar thermal in Europe, RDP
38
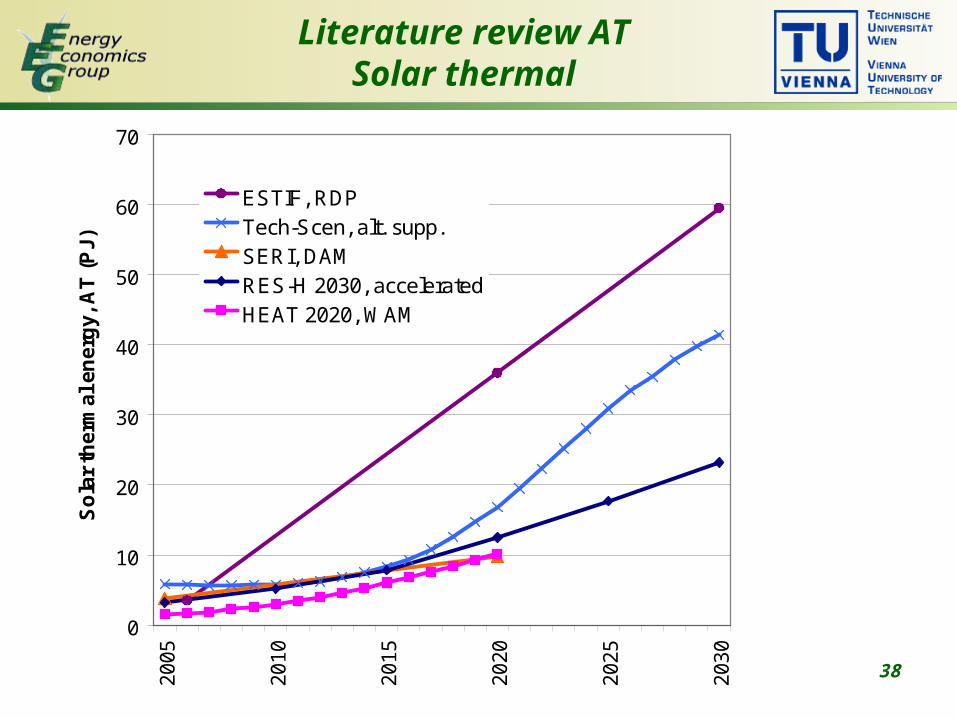
Literature review ATSolar thermal
0
10
20
30
40
50
60
70
200
5
201
0
201
5
202
0
202
5
203
0
So
lar
the
rma
l en
erg
y, A
T (
PJ
)
ESTIF, RDPTech-Scen, alt. supp.SERI, DAMRES-H 2030, acceleratedHEAT 2020, WAM
39
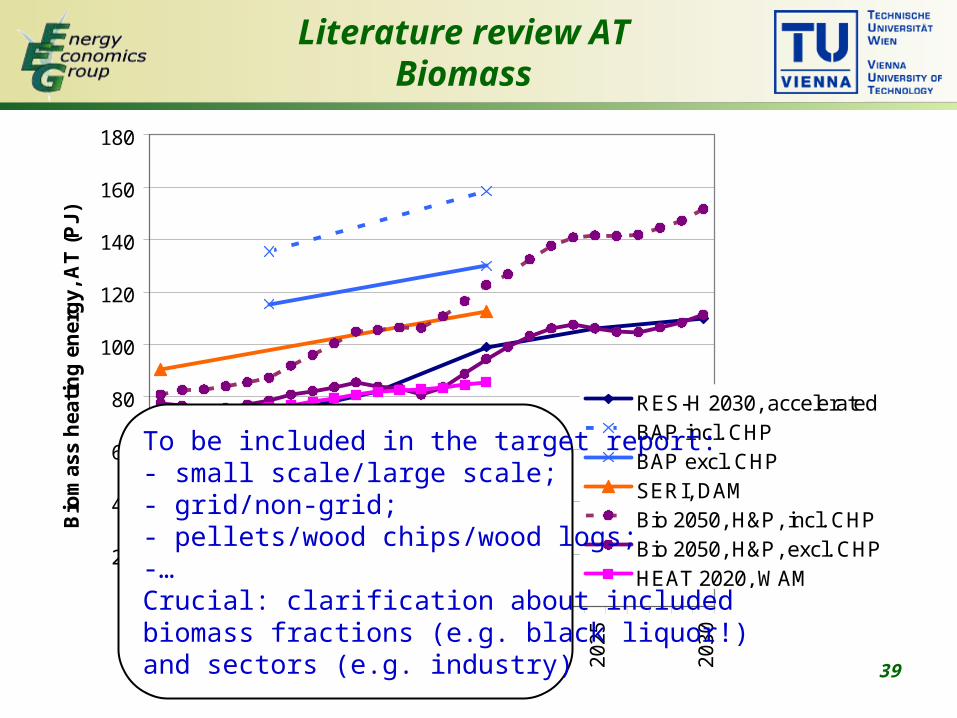
0
20
40
60
80
100
120
140
160
1802
005
201
0
201
5
202
0
202
5
203
0
Bio
ma
ss h
eat
ing
en
erg
y, A
T (
PJ
)
RES-H 2030, acceleratedBAP incl. CHPBAP excl. CHPSERI, DAMBio 2050, H&P, incl. CHPBio 2050, H&P, excl. CHPHEAT 2020, WAM
Literature review ATBiomass
To be included in the target report: - small scale/large scale; - grid/non-grid; - pellets/wood chips/wood logs; -…Crucial: clarification about included biomass fractions (e.g. black liquor!)and sectors (e.g. industry)

40
Literature review ATAmbient heat (Heat pumps)
0
5
10
15
20
25
30
35
200
5
201
0
201
5
202
0
202
5
203
0
Am
bie
nt
hea
t (H
eat
pu
mp
s),
AT
(P
J)
RES-H 2030, acceleratedSERI, DAMHEAT 2020, WAM

41
Literature review AT, total, sectors
0
50
100
150
200
250
3002
00
5
20
10
20
15
20
20
20
25
20
30
Re
ne
wa
ble
en
erg
y,
AT
(P
J)
RES-H 2030, accelerated,incl. Industry
RES-H 2030, accelerated,households & service
CAPROS, 2020 targetscenario, households &service
WIFO, incl. industry
WIFO, households & service
HEAT 2020, WAM,households & service
Bottom-up data and analysis: Building stock

43
• Number of buildings (with space heating)
Austria and the target regions: Upper Austria and Styria
Buildings in 2005Expected buildings
in 2020
Austria Upper Austria Styria Austria
1000 Buildings (urban share)
Small residential buildings 1408 (34%) 280 (17%) 260 (15%) 1548
Apartment buildings 176 (70%) 31 (55%) 28 (50%) 192
Private and public service sector 208 (40%) 35 (35%) 36 (25%) 230
Bottom-up data and analysis: Austrian building stock
44
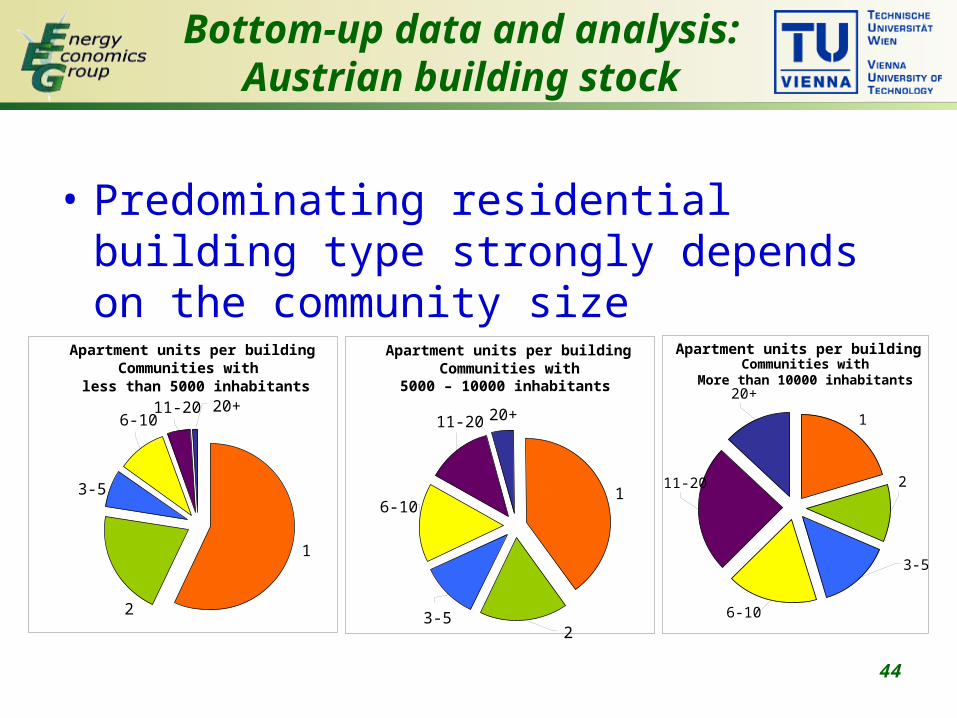
Bottom-up data and analysis: Austrian building stock
Apartment units per building Communities with
More than 10000 inhabitants
1
2
3-5
11-20
6-10
20+
Apartment units per building Communities with
5000 – 10000 inhabitants
1
23-5
11-20
6-10
20+
Apartment units per building Communities with
less than 5000 inhabitants
1
2
3-5
11-206-10
20+
• Predominating residential building type strongly depends on the community size
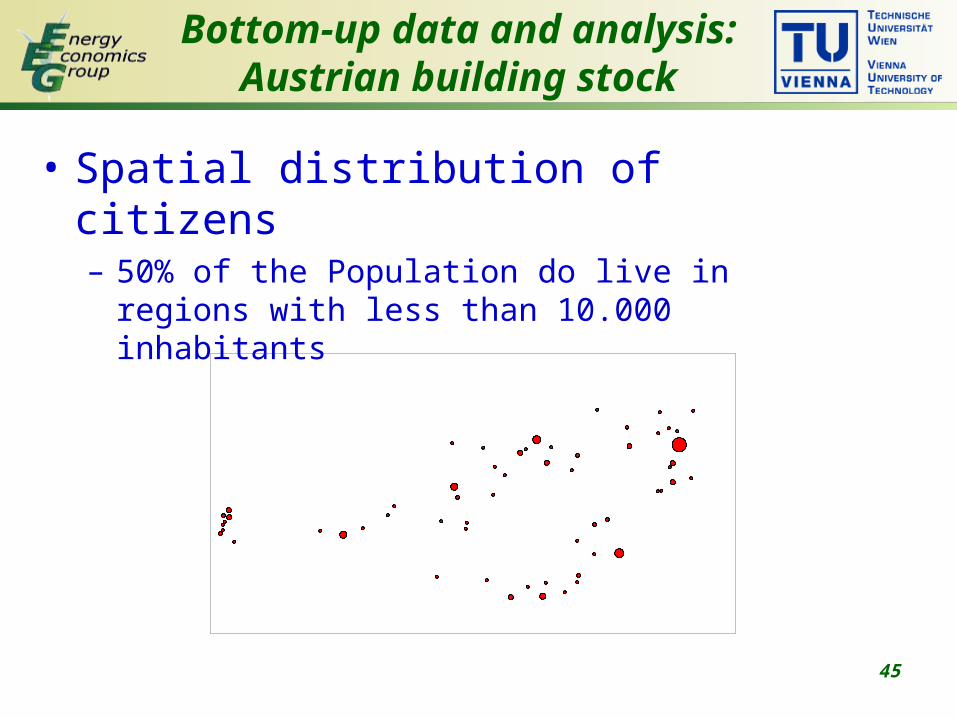
45
• Spatial distribution of citizens– 50% of the Population do live in regions with less than
10.000 inhabitants
Bottom-up data and analysis: Austrian building stock
46
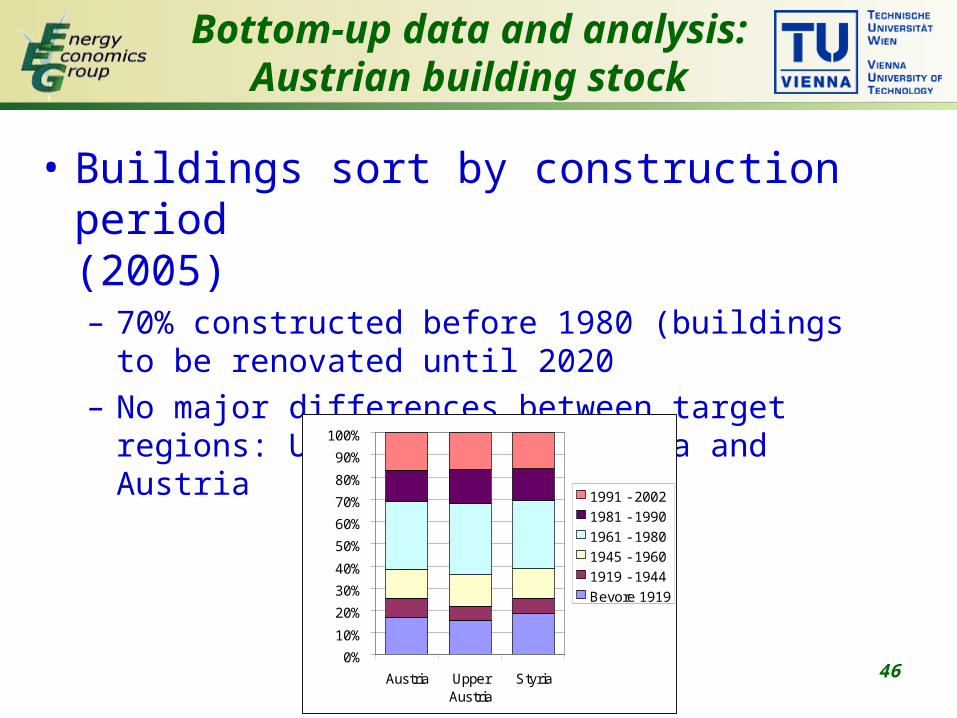
Bottom-up data and analysis: Austrian building stock
• Buildings sort by construction period(2005)– 70% constructed before 1980 (buildings to be
renovated until 2020– No major differences between target regions: Upper
Austria, Styria and Austria
0%
10%
20%
30%
40%
50%
60%
70%
80%
90%
100%
Austria UpperAustria
Styria
1991 - 2002
1981 - 1990
1961 - 1980
1945 - 1960
1919 - 1944
Bevore 1919
Bottom-up data and analysis: Solar thermal heat
48
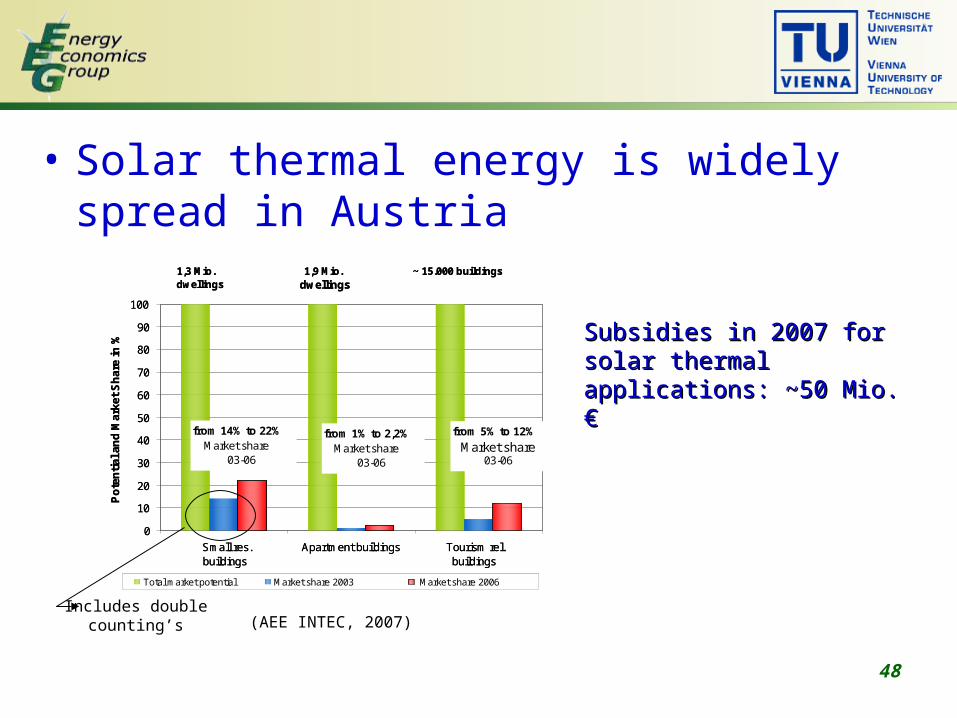
• Solar thermal energy is widely spread in Austria
(AEE INTEC, 2007)
from 14% to 22%Market share
03-06
from 1% to 2,2%Market share
03-06
from 5% to 12%
Market share03-06
0
10
20
30
40
50
60
70
80
90
100
Small res.buildings
Apartment buildings Tourism rel.buildings
Po
ten
tial
an
d M
arke
t S
har
e in
%
Total market potential Market share 2003 Market share 2006
1,3 Mio.dwellings
~ 15.000 buildings1,9 Mio.dwellings
Includes double counting’s
Subsidies in 2007 for solar Subsidies in 2007 for solar thermal applications: ~50 Mio. €thermal applications: ~50 Mio. €
49
Bottom-up data and analysis: Solar thermal heat
• Available roof area:– Novak et al. (2000) IEA PVPS programme Task
7: • 159 km² roof area in areas with sufficient solar
radiation and suitable direction
– EEG: Bottom up analysis based on buildings with low temperature demand:
• 83 km² (2005), 90 km² (2020)
• Solar radiation:
• less than 1100 kWh/m² in most populated regions

50
Bottom-up data and analysis: Solar thermal heat
• Achievable solar fractions for different applications
Solar coverage
Spec. yield
Small resid. buildingsSmall resid. buildings
Water heating (~6 m²) 50%–60% 350 kWh/m²
„Combi Systems“,
existing buildings, renovated (20 m²)
20%–30% 270 kWh/m²
New buildings (20 m²) 25%–30% 270 kWh/m²
Apartment buildingsApartment buildings
„Combi Systems“ (3-6 m²/ apartment) 15%–25% 300 kWh/m²
51
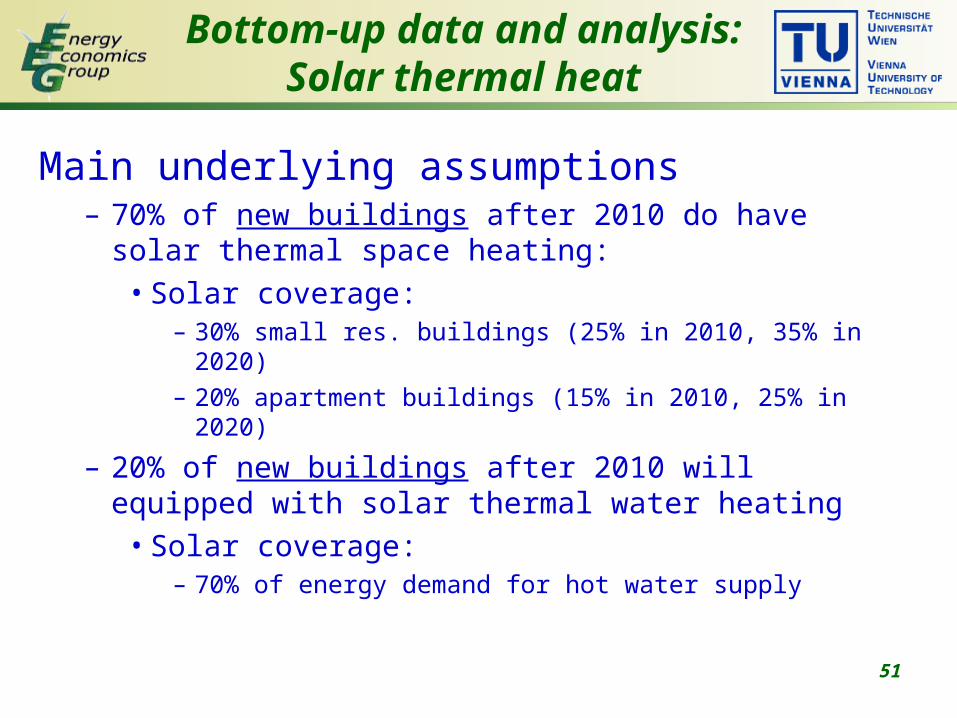
Bottom-up data and analysis: Solar thermal heat
Main underlying assumptions– 70% of new buildings after 2010 do have solar
thermal space heating:• Solar coverage:
– 30% small res. buildings (25% in 2010, 35% in 2020)– 20% apartment buildings (15% in 2010, 25% in 2020)
– 20% of new buildings after 2010 will equipped with solar thermal water heating
• Solar coverage:– 70% of energy demand for hot water supply
52
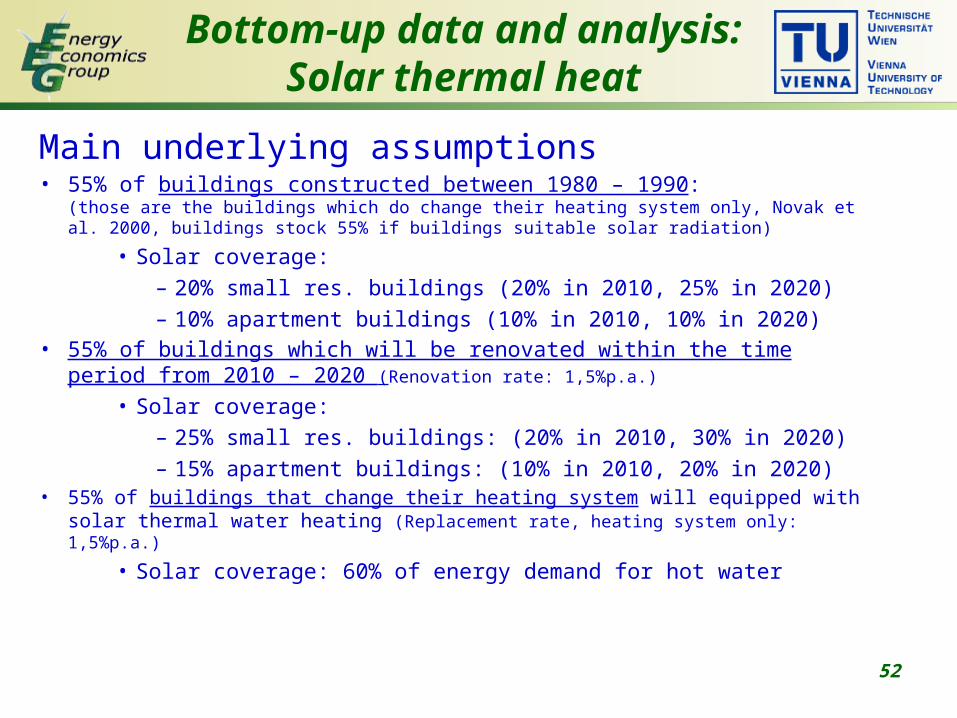
Bottom-up data and analysis: Solar thermal heat
Main underlying assumptions• 55% of buildings constructed between 1980 – 1990:
(those are the buildings which do change their heating system only, Novak et al. 2000, buildings stock 55% if buildings suitable solar radiation)
• Solar coverage:
– 20% small res. buildings (20% in 2010, 25% in 2020)
– 10% apartment buildings (10% in 2010, 10% in 2020)• 55% of buildings which will be renovated within the time period from 2010 –
2020 (Renovation rate: 1,5%p.a.)
• Solar coverage:
– 25% small res. buildings: (20% in 2010, 30% in 2020)
– 15% apartment buildings: (10% in 2010, 20% in 2020)• 55% of buildings that change their heating system will equipped with solar thermal
water heating (Replacement rate, heating system only: 1,5%p.a.)
• Solar coverage: 60% of energy demand for hot water
53
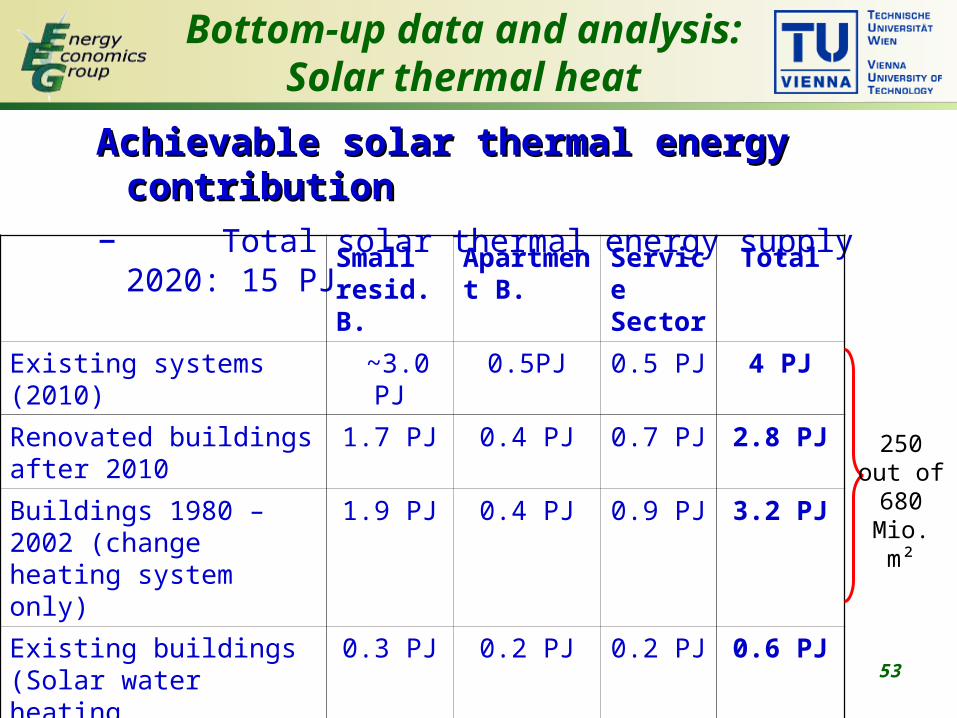
Bottom-up data and analysis: Solar thermal heat
Achievable solar thermal energy contributionAchievable solar thermal energy contribution– Total solar thermal energy supply 2020: 15 PJ
Small resid. B.
Apartment B.
Service Sector
Total
Existing systems (2010) ~3.0 PJ 0.5PJ 0.5 PJ 4 PJ
Renovated buildings after 2010
1.7 PJ 0.4 PJ 0.7 PJ 2.8 PJ
Buildings 1980 – 2002 (change heating system only)
1.9 PJ 0.4 PJ 0.9 PJ 3.2 PJ
Existing buildings (Solar water heating
0.3 PJ 0.2 PJ 0.2 PJ 0.6 PJ
New buildings after 2010 1.9 PJ 0.6 PJ 2.0 PJ 4.5 PJ
All buildings 8.8 PJ 2.1 PJ 4.3 PJ 15.2 PJ
250 out of 680
Mio. m²

Bottom-up data and analysis: Heat pumps

55
Bottom-up data and analysis: Heat pumps
• Current market situation
• Sales increased significantly within the last year
• 80.000 HP for DHW
50.000 for space heating 0
2000
4000
6000
8000
10000
12000
14000
16000
1978
1980
1982
1984
1986
1988
1990
1992
1994
1996
1998
2000
2002
2004
2006
Ne
w in
sta
llati
on
s (
#)
Space heating
Domestic hot water
Historical installation
56
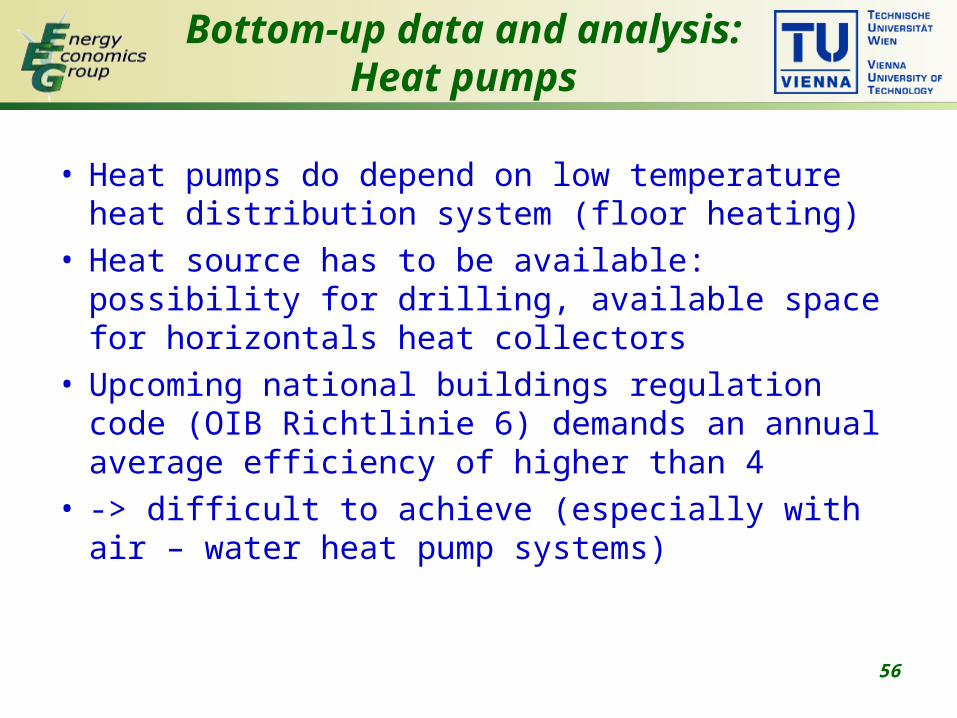
Bottom-up data and analysis: Heat pumps
• Heat pumps do depend on low temperature heat distribution system (floor heating)
• Heat source has to be available: possibility for drilling, available space for horizontals heat collectors
• Upcoming national buildings regulation code (OIB Richtlinie 6) demands an annual average efficiency of higher than 4
• -> difficult to achieve (especially with air – water heat pump systems)

57
Bottom-up data and analysis: Heat pumps
• Achievable COP for different applications
– Hot water production: 2.4 – 2.7 (60°C)
– Space heating only:
• Air-Water: 3.5 – 3.9 (35°C), 2.3 – 2.7 (55°C)
• Sole-Water: 5.2 – 5.6 (35°C), 2.8 – 3.3 (55°C)
– Combined systems:
• Air-Water: 3.1 – 3.5 (35°C), 2.1 – 2.5 (55°C)
• Sole-Water: 3.4 – 3.9 (35°C), 2.6 – 3.1 (55°C)

58
Bottom-up data and analysis: Heat pumps
• Main underlying assumptions– Floor heating, low temp. heat distribution system:
• 30% of buildings constructed between 1992 and 2002 • 25% of retrofitted buildings after 2010 • 80% of new constructed buildings after 2010
– Availability of ambient heat source:• 75% in rural areas (70% existing buildings)• 25% in urban areas (5% existing buildings)
– Annual average efficiency of heat pumps 4 (3.5 existing buildings)
59
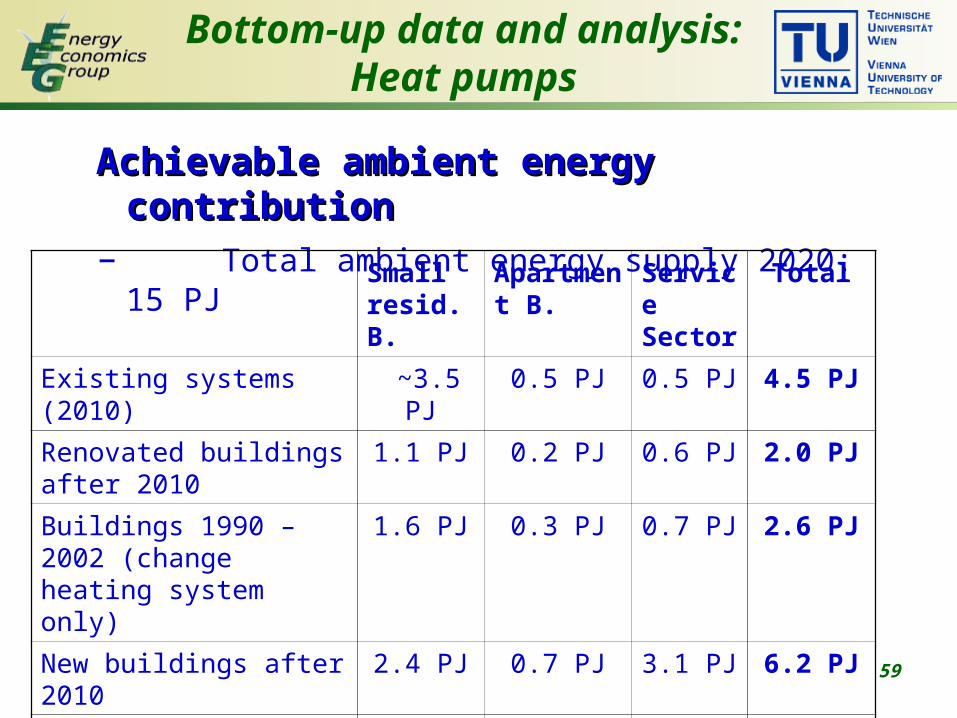
Bottom-up data and analysis: Heat pumps
Achievable ambient energy contributionAchievable ambient energy contribution– Total ambient energy supply 2020: 15 PJ
Small resid. B.
Apartment B.
Service Sector
Total
Existing systems (2010) ~3.5 PJ 0.5 PJ 0.5 PJ 4.5 PJ
Renovated buildings after 2010
1.1 PJ 0.2 PJ 0.6 PJ 2.0 PJ
Buildings 1990 – 2002 (change heating system only)
1.6 PJ 0.3 PJ 0.7 PJ 2.6 PJ
New buildings after 2010 2.4 PJ 0.7 PJ 3.1 PJ 6.2 PJ
All buildings 8.6 PJ 1.7 PJ 4.9 PJ 15.3 PJ

Bottom-up data and analysis: Biomass heating
61
0
50
100
150
200
2005
2010
2020
2030
2040
2050
2005
2010
2020
2030
2040
2050
2005
2010
2020
2030
2040
2050
2005
2010
2020
2030
2040
2050
Forestry biomass Inustrialbiomass
Agriculturalbiomass
Waste wood
PJ
/a
0
10.000
20.000
30.000
40.000
50.000
60.000
GW
h/a
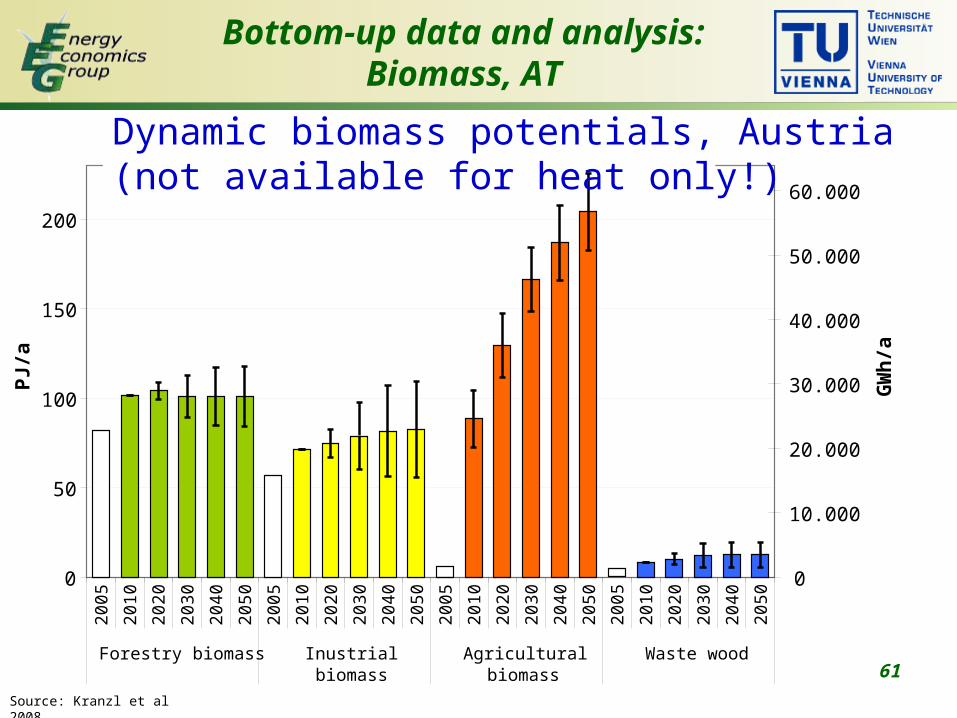
Bottom-up data and analysis: Biomass, AT
Dynamic biomass potentials, Austria(not available for heat only!)
Source: Kranzl et al 2008
62
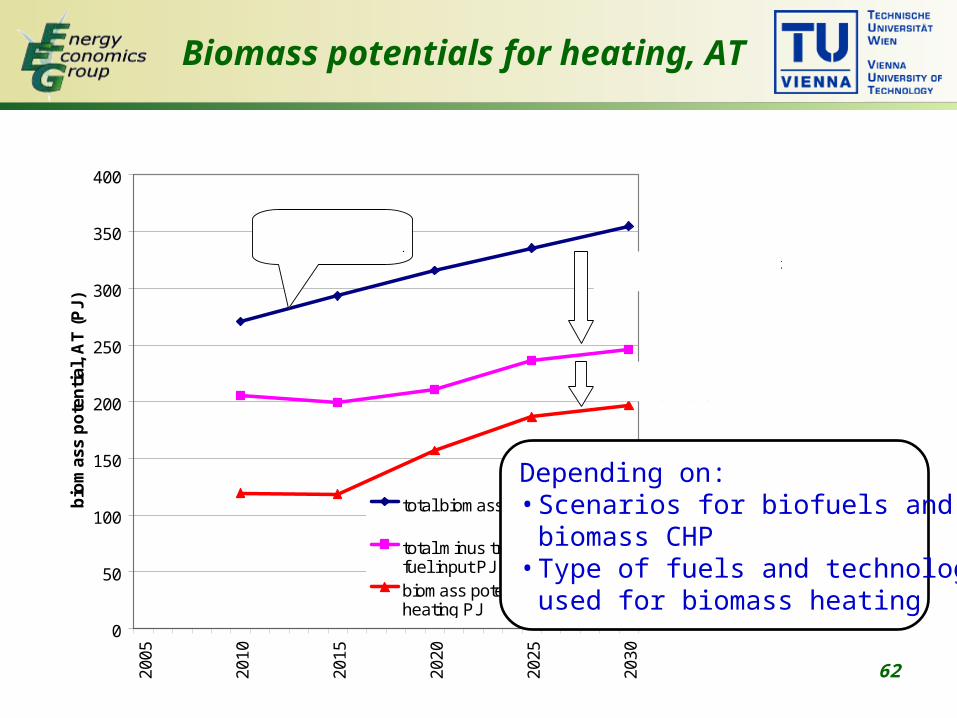
Biomass potentials for heating, AT
0
50
100
150
200
250
300
350
400
2005
2010
2015
2020
2025
2030
bio
mas
s p
ote
nti
al,
AT
(P
J)
total biomass potential PJ
total minus transport and CHPfuel input PJbiomass potential available forheating PJ
total primary biomass potential
minus biomass energy input for biofuels and CHP
minus agricultural potential not available for heating (e.g. grass, manure …)
Depending on: • Scenarios for biofuels and
biomass CHP• Type of fuels and technologies
used for biomass heating

63
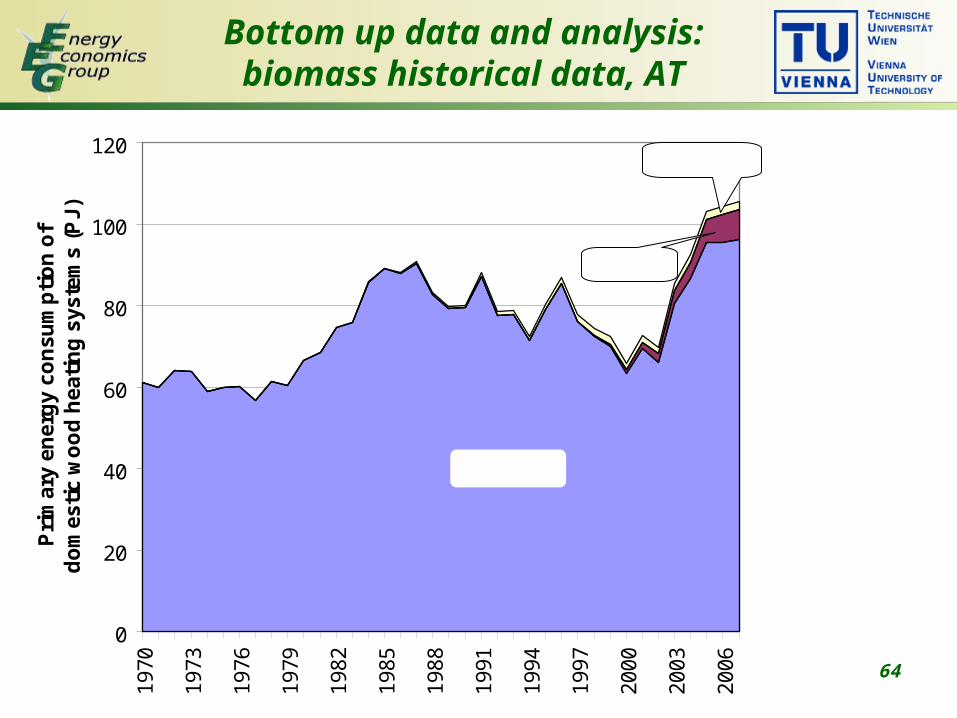
Bottom up data and analysis: biomass historical data, AT
0
50
100
150
200
25019
80
1982
1984
1986
1988
1990
1992
1994
1996
1998
2000
2002
2004
2006
2008
2010
Pri
mar
y en
erg
y co
nsu
mp
tio
n b
iom
ass
in
Au
stri
a (P
J)
0%
2%
4%
6%
8%
10%
12%
14%
16%
18%
shar
e o
f b
iom
ass
on
to
tal
gro
ss e
ner
gy
con
sum
pti
on
residential heating
district heating
transport
paper and pulp industry
other industry
electricity
share of biomass on total gross energy consumption
64
Bottom up data and analysis: biomass historical data, AT
0
20
40
60
80
100
1201
97
0
19
73
19
76
19
79
19
82
19
85
19
88
19
91
19
94
19
97
20
00
20
03
20
06
Pri
ma
ry e
ne
rgy
co
ns
um
pti
on
of
do
mes
tic
wo
od
hea
tin
g s
ys
tem
s (P
J)
Wood log
Pellets
Wood chips
66
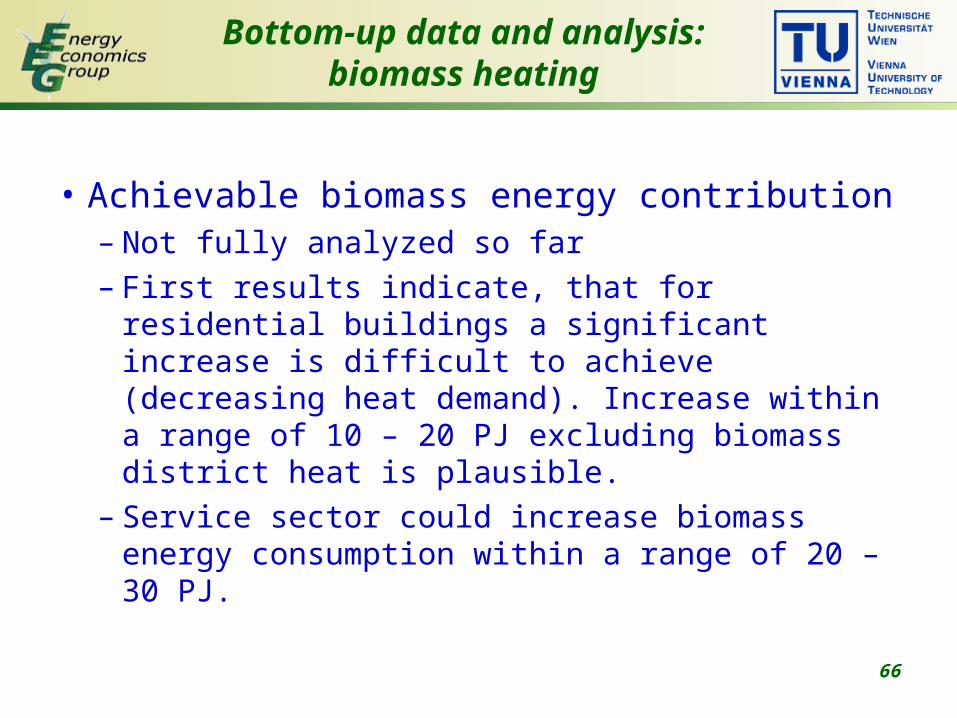
Bottom-up data and analysis: biomass heating
• Achievable biomass energy contribution– Not fully analyzed so far– First results indicate, that for residential
buildings a significant increase is difficult to achieve (decreasing heat demand). Increase within a range of 10 – 20 PJ excluding biomass district heat is plausible.
– Service sector could increase biomass energy consumption within a range of 20 – 30 PJ.

67

68
WP3 progress: AT
• What is the state of progress regarding the literature overview? – Mostly completed– Open: Documentation in target report
• What is your state of progress regarding the bottom-up-data? – Preliminary results ready– Open: partly more detailed analyses; documentation in target report
• What is the status of stakeholder consultation and workshop preparation? – First communication and discussions – Workshop not yet scheduled
• What is the time schedule for the next steps to be taken with respect to: literature review, bottom-up-data collection, stakeholder consultation, workshop preparation and the target report?– Documentation of literature review and bottom-up data April 09– Planning of workshop: April 09– Stakeholder consultation: May / June 09
69
Preliminary results: Upper Austria

70
081396enESV-Design

71
WP3 progress: AT Upper Austria
• What is the state of progress regarding the literature overview?
• What is your state of progress regarding the bottom-up-data?
• What is the status of stakeholder consultation and workshop preparation?
• What is the time schedule for the next steps to be taken with respect to: literature review, bottom-up-data collection, stakeholder consultation, workshop preparation and the target report?
• What are open questions regarding WP3?
72
Preliminary results: GR
73
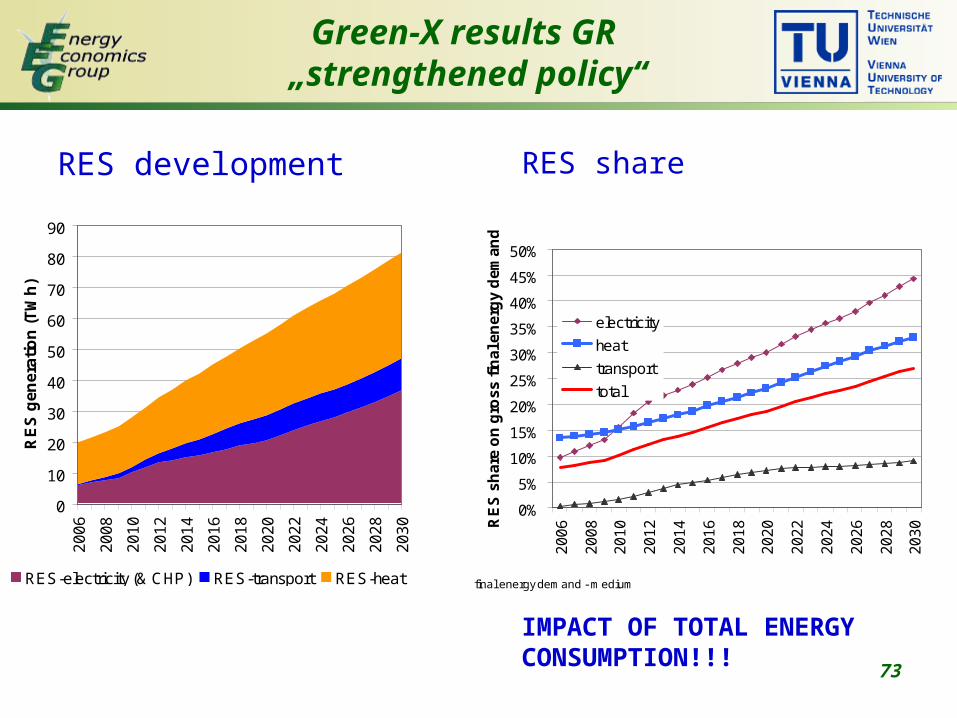
Green-X results GR „strengthened policy“
RES development RES share
IMPACT OF TOTAL ENERGY CONSUMPTION!!!
0
10
20
30
40
50
60
70
80
90
20
06
20
08
20
10
20
12
20
14
20
16
20
18
20
20
20
22
20
24
20
26
20
28
20
30
RE
S g
en
era
tio
n (
TW
h)
RES-electricity (& CHP) RES-transport RES-heat final energy demand - medium
0%
5%
10%
15%
20%
25%
30%
35%
40%
45%
50%
20
06
20
08
20
10
20
12
20
14
20
16
20
18
20
20
20
22
20
24
20
26
20
28
20
30R
ES
sh
are
on
gro
ss
fin
al e
ne
rgy
de
ma
nd
electricity
heat
transport
total
74
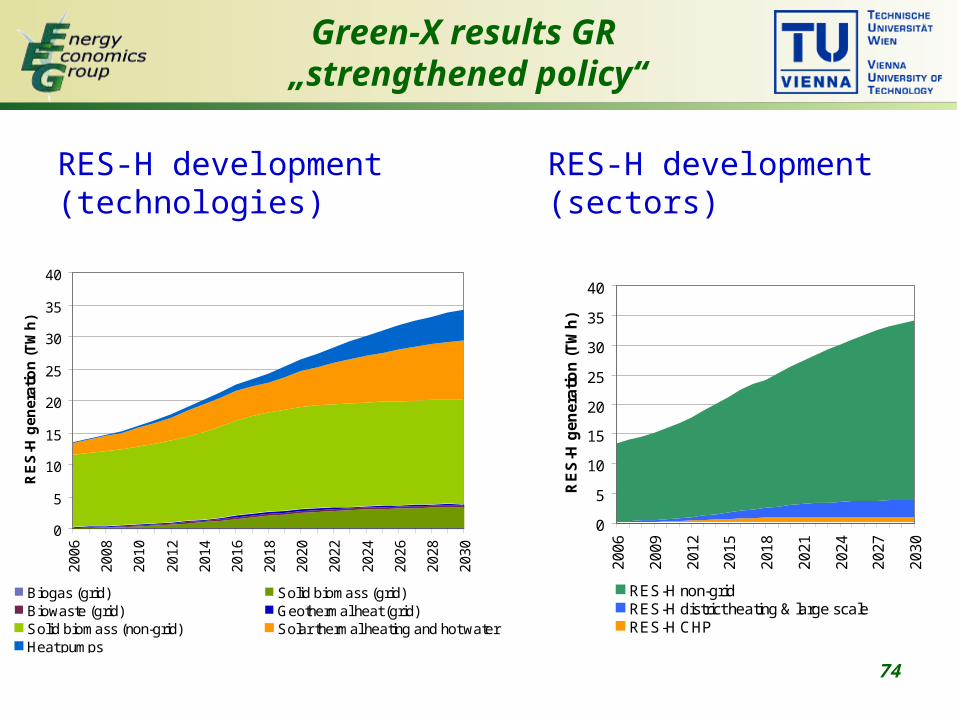
Green-X results GR „strengthened policy“
RES-H development (technologies)
RES-H development (sectors)
0
5
10
15
20
25
30
35
40
20
06
20
08
20
10
20
12
20
14
20
16
20
18
20
20
20
22
20
24
20
26
20
28
20
30
RE
S-H
ge
ne
rati
on
(T
Wh
)
Biogas (grid) Solid biomass (grid)Biowaste (grid) Geothermal heat (grid)Solid biomass (non-grid) Solar thermal heating and hot waterHeat pumps
0
5
10
15
20
25
30
35
40
20
06
20
09
20
12
20
15
20
18
20
21
20
24
20
27
20
30
RE
S-H
ge
ne
rati
on
(T
Wh
)RES-H non-gridRES-H district heating & large scaleRES-H CHP
75
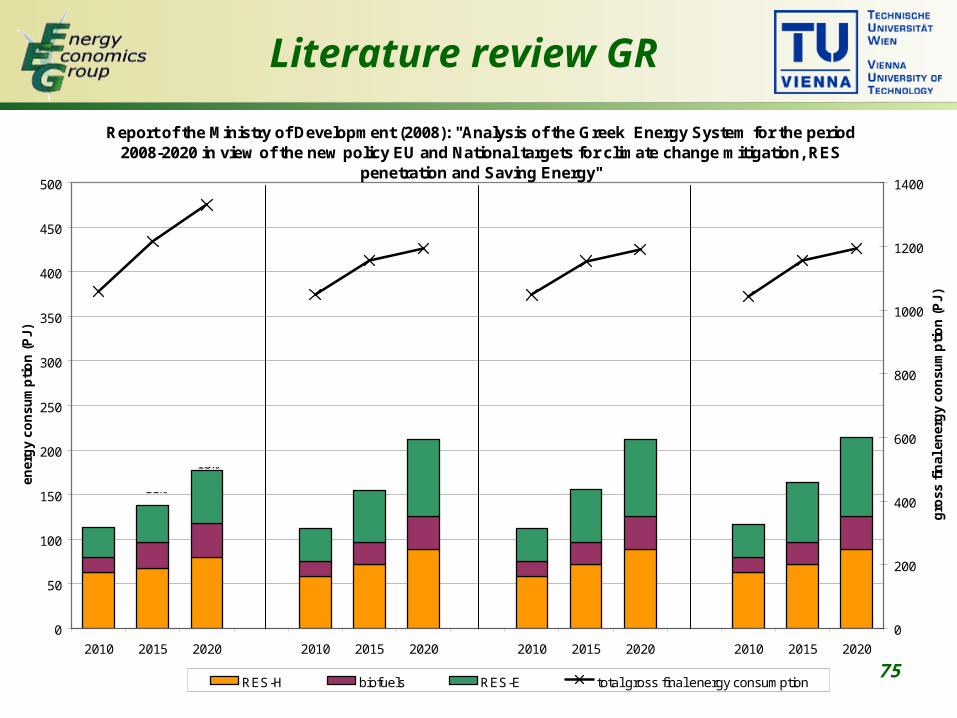
Literature review GR
Report of the Ministry of Development (2008): "Analysis of the Greek Energy System for the period 2008-2020 in view of the new policy EU and National targets for climate change mitigation, RES
penetration and Saving Energy"
0
50
100
150
200
250
300
350
400
450
500
2010 2015 2020 2010 2015 2020 2010 2015 2020 2010 2015 2020
ener
gy
con
sum
pti
on
(P
J)
0
200
400
600
800
1000
1200
1400
gro
ss f
inal
en
erg
y co
nsu
mp
tio
n (
PJ)
RES-H biofuels RES-E total gross final energy consumption
scenario 0 scenario 1 scenario 2 scenario 3
11%11%
13%
11%
13%
18%
11%
13%
18%
11%
15%
18%
76
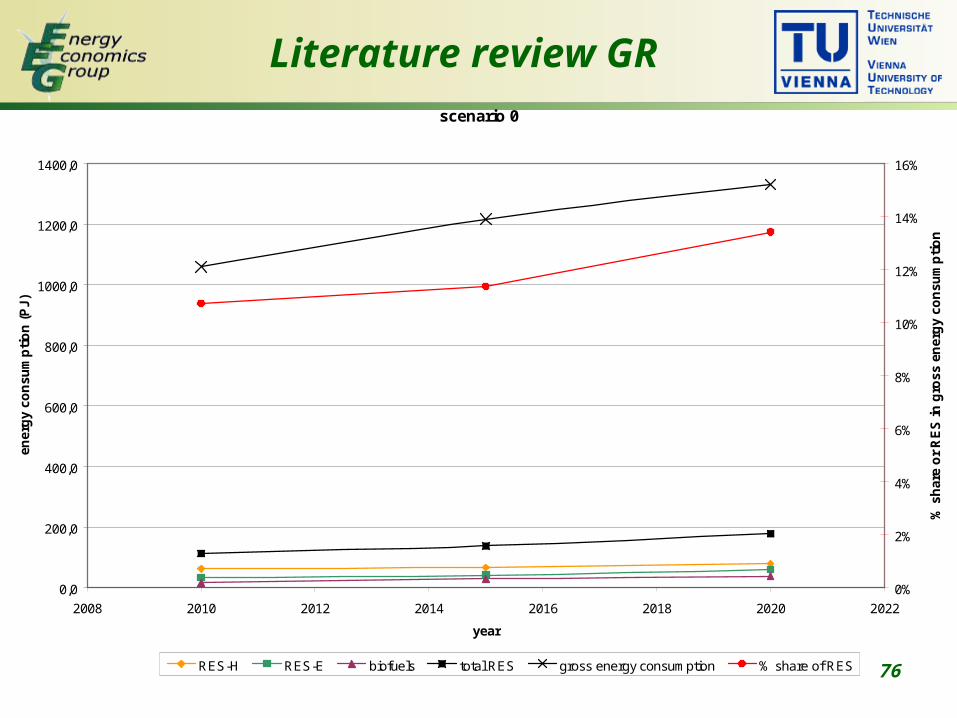
Literature review GRscenario 0
0,0
200,0
400,0
600,0
800,0
1000,0
1200,0
1400,0
2008 2010 2012 2014 2016 2018 2020 2022
year
ener
gy
con
sum
pti
on
(P
J)
0%
2%
4%
6%
8%
10%
12%
14%
16%
% s
har
e o
r R
ES
in g
ross
en
erg
y co
nsu
mp
tio
n
RES-H RES-E biofuels total RES gross energy consumption % share of RES
77
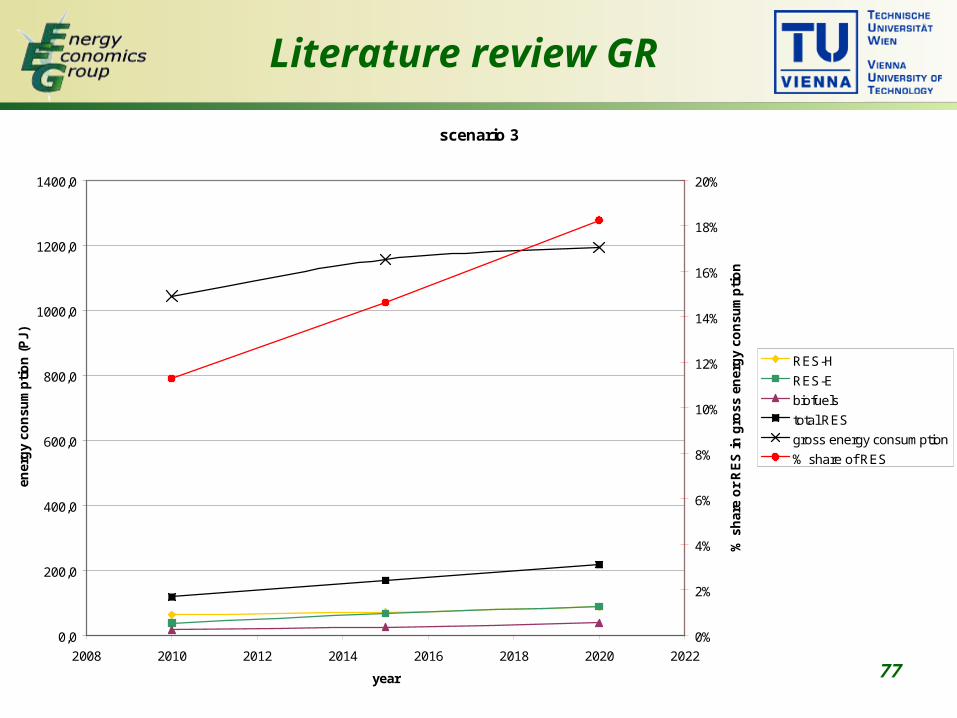
Literature review GR
scenario 3
0,0
200,0
400,0
600,0
800,0
1000,0
1200,0
1400,0
2008 2010 2012 2014 2016 2018 2020 2022
year
ener
gy
con
sum
pti
on
(P
J)
0%
2%
4%
6%
8%
10%
12%
14%
16%
18%
20%
% s
har
e o
r R
ES
in g
ross
en
erg
y co
nsu
mp
tio
n
RES-H
RES-E
biofuels
total RES
gross energy consumption
% share of RES
78
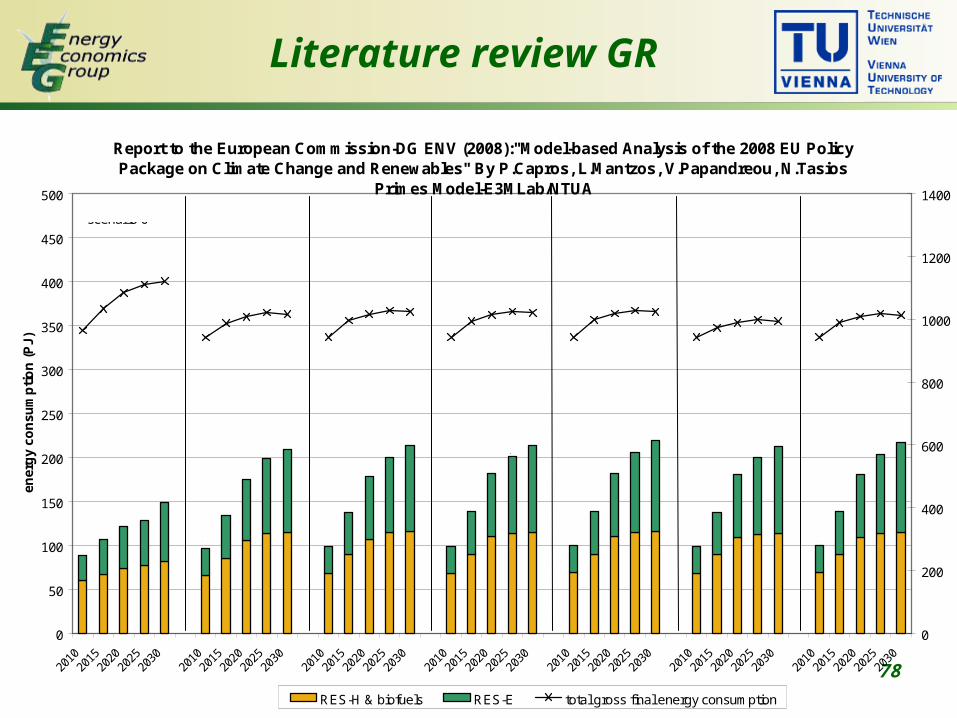
Literature review GR
Report to the European Commission-DG ENV (2008):"Model-based Analysis of the 2008 EU Policy Package on Climate Change and Renewables" By P.Capros, L.Mantzos, V.Papandreou, N.Tasios
Primes Model-E3MLab/NTUA
0
50
100
150
200
250
300
350
400
450
500
2010
2015
2020
2025
2030
2010
2015
2020
2025
2030
2010
2015
2020
2025
2030
2010
2015
2020
2025
2030
2010
2015
2020
2025
2030
2010
2015
2020
2025
2030
2010
2015
2020
2025
2030
ener
gy
con
sum
pti
on
(P
J)
0
200
400
600
800
1000
1200
1400
RES-H & biofuels RES-E total gross final energy consumption
scenario 0 scenario 1 scenario 2 scenario 3 scenario 4 scenario 5 scenario 6
9%
10%11%11,6%
13,3%
10,1%
14,1%
18,2%
19,7%21,2%
10,3%
14,3%
18,2%
20,1%
21,6%
10,3%
14,4%
18,6%
20,3%
21,7%
10,5%
14,5%
18,4%
20,8%
22,2%
10,3%
14,7%
18,9%
20,8%
22,1%
10,5%
14,6%
18,5%
20,7%
22,2%
79
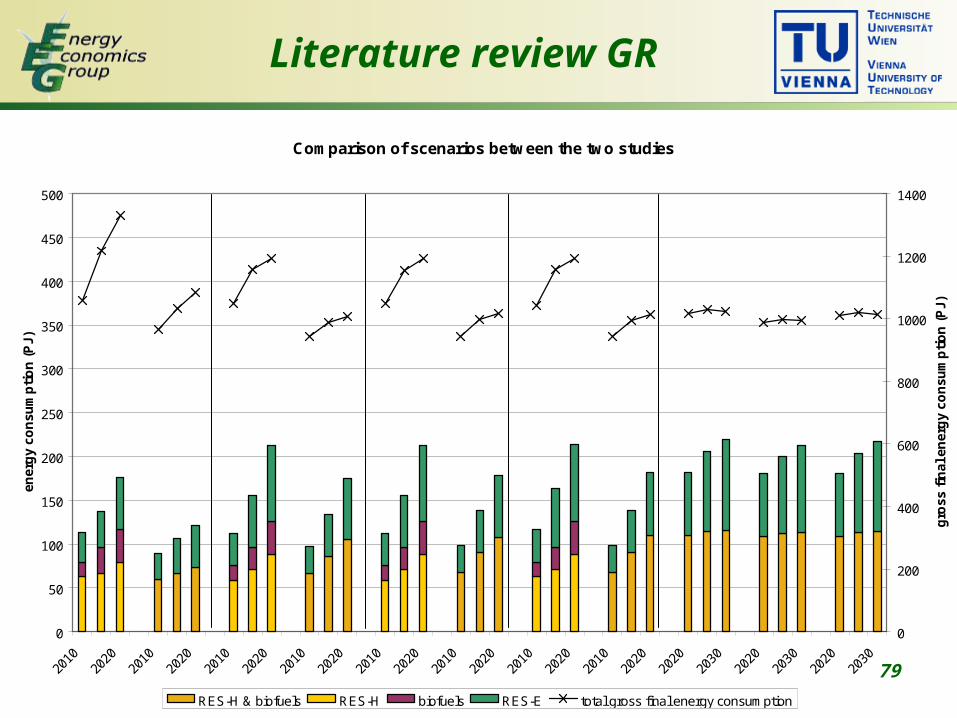
Literature review GR
Comparison of scenarios between the two studies
0
50
100
150
200
250
300
350
400
450
500
2010
2020
2010
2020
2010
2020
2010
2020
2010
2020
2010
2020
2010
2020
2010
2020
2020
2030
2020
2030
2020
2030
ener
gy
con
sum
pti
on
(P
J)
0
200
400
600
800
1000
1200
1400
gro
ss f
inal
en
erg
y co
nsu
mp
tio
n (
PJ)
RES-H & biofuels RES-H biofuels RES-E total gross final energy consumption
primes 08 primes 08primes 08
primes 08
energy planning
energy olanning
energy planning
energy planning
scenario 0 scenario 1 scenario 2 scenario 3
primes 08
scenario 4 scenario 5 scenario 6
80
WP3 progress: GR
• What is the state of progress regarding the literature overview?
• What is your state of progress regarding the bottom-up-data? – Missing: Heating systems by buildings type
• What is the status of stakeholder consultation and workshop preparation?
• What is the time schedule for the next steps to be taken with respect to: literature review, bottom-up-data collection, stakeholder consultation, workshop preparation and the target report?
• What are open questions regarding WP3?

81
Preliminary results: LT
82
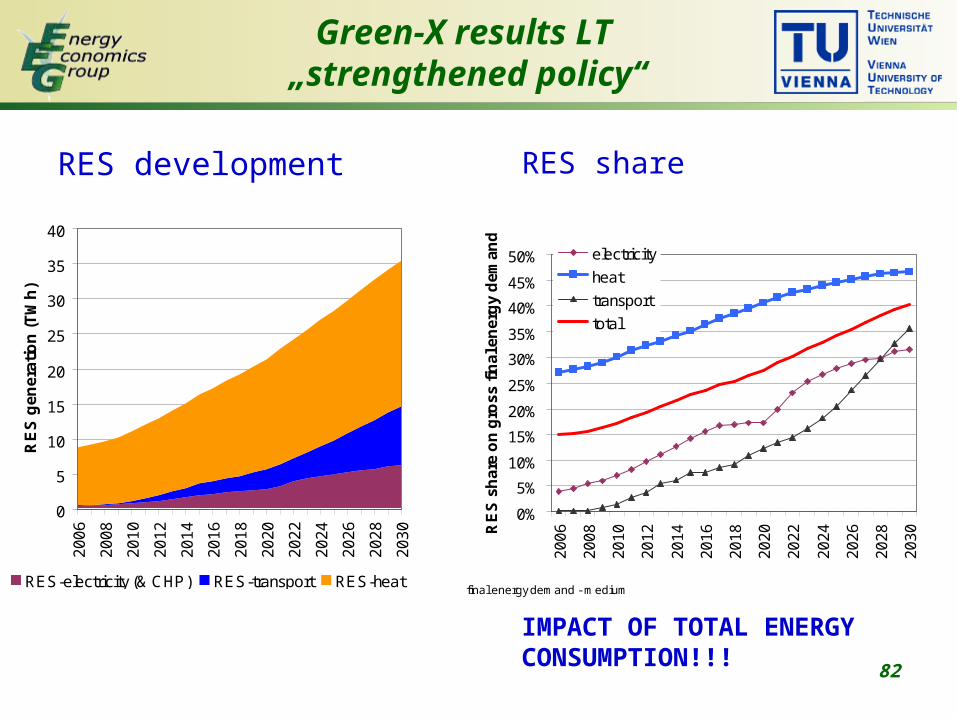
Green-X results LT „strengthened policy“
RES development RES share
IMPACT OF TOTAL ENERGY CONSUMPTION!!!
0
5
10
15
20
25
30
35
40
20
06
20
08
20
10
20
12
20
14
20
16
20
18
20
20
20
22
20
24
20
26
20
28
20
30
RE
S g
en
era
tio
n (
TW
h)
RES-electricity (& CHP) RES-transport RES-heatfinal energy demand - medium
0%
5%
10%
15%
20%
25%
30%
35%
40%
45%
50%
200
6
200
8
201
0
201
2
201
4
201
6
201
8
202
0
202
2
202
4
202
6
202
8
203
0RE
S s
ha
re o
n g
ross
fin
al e
ner
gy
de
man
d
electricity
heat
transport
total
83
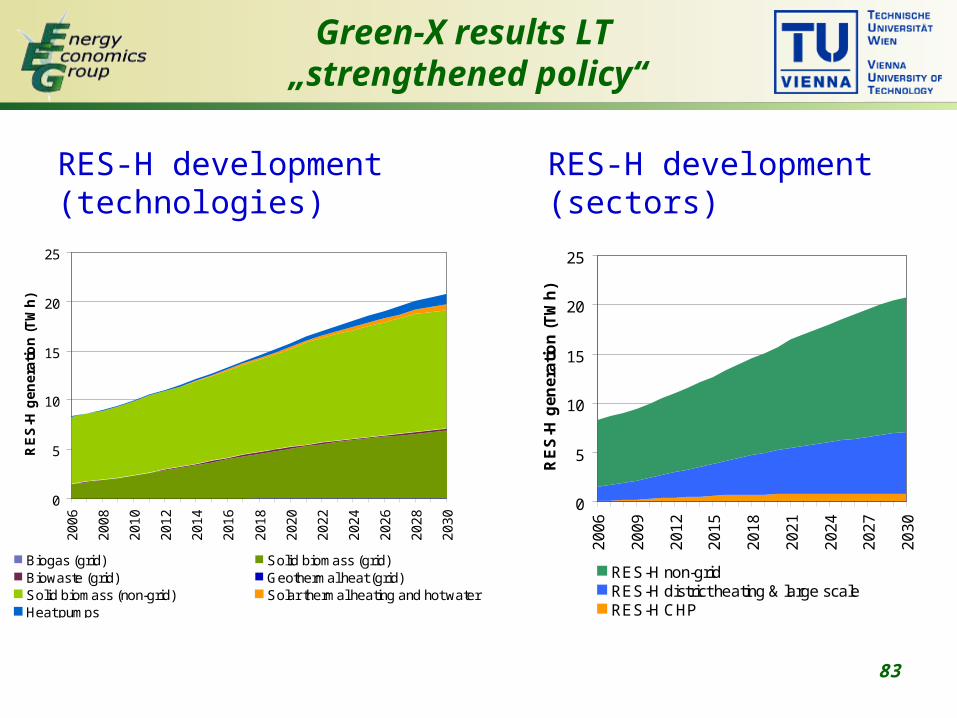
Green-X results LT „strengthened policy“
RES-H development (technologies)
RES-H development (sectors)
0
5
10
15
20
25
20
06
20
08
20
10
20
12
20
14
20
16
20
18
20
20
20
22
20
24
20
26
20
28
20
30
RE
S-H
ge
ne
rati
on
(T
Wh
)
Biogas (grid) Solid biomass (grid)Biowaste (grid) Geothermal heat (grid)Solid biomass (non-grid) Solar thermal heating and hot waterHeat pumps
0
5
10
15
20
25
20
06
20
09
20
12
20
15
20
18
20
21
20
24
20
27
20
30
RE
S-H
ge
ne
rati
on
(T
Wh
)
RES-H non-gridRES-H district heating & large scaleRES-H CHP

84
WP3 progress: LT
• What is the state of progress regarding the literature overview?
• What is your state of progress regarding the bottom-up-data? – Missing: Penetration of renewables, climate data
• What is the status of stakeholder consultation and workshop preparation?
• What is the time schedule for the next steps to be taken with respect to: literature review, bottom-up-data collection, stakeholder consultation, workshop preparation and the target report?
• What are open questions regarding WP3?

85
Preliminary results: NL
86
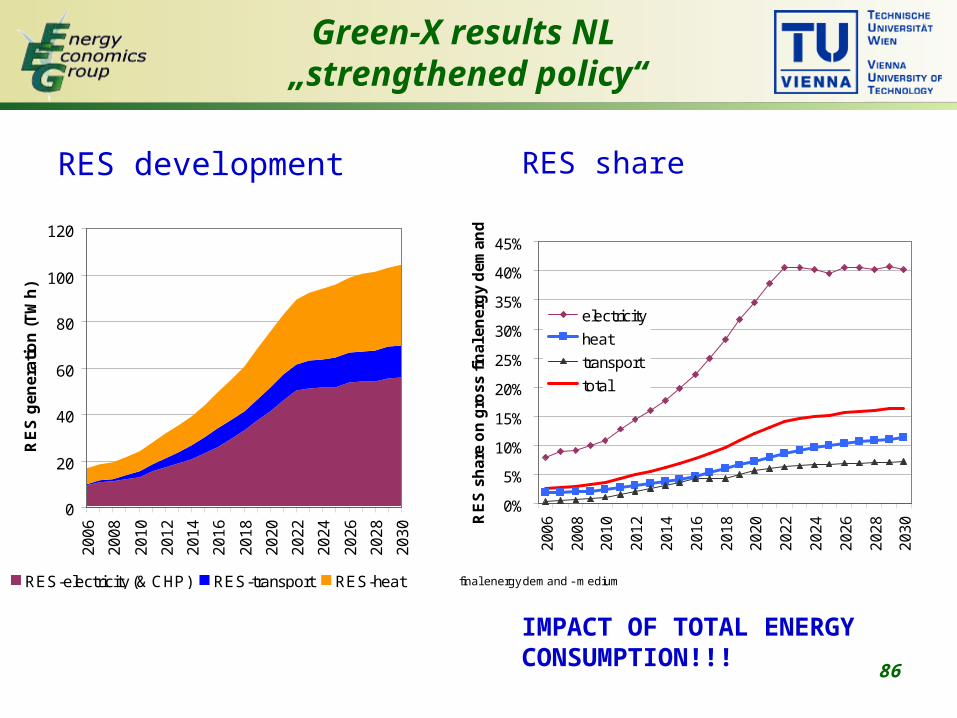
Green-X results NL „strengthened policy“
RES development RES share
IMPACT OF TOTAL ENERGY CONSUMPTION!!!
0
20
40
60
80
100
120
20
06
20
08
20
10
20
12
20
14
20
16
20
18
20
20
20
22
20
24
20
26
20
28
20
30
RE
S g
en
era
tio
n (
TW
h)
RES-electricity (& CHP) RES-transport RES-heat final energy demand - medium
0%
5%
10%
15%
20%
25%
30%
35%
40%
45%
20
06
20
08
20
10
20
12
20
14
20
16
20
18
20
20
20
22
20
24
20
26
20
28
20
30R
ES
sh
are
on
gro
ss
fin
al e
ne
rgy
de
ma
nd
electricity
heat
transport
total
87
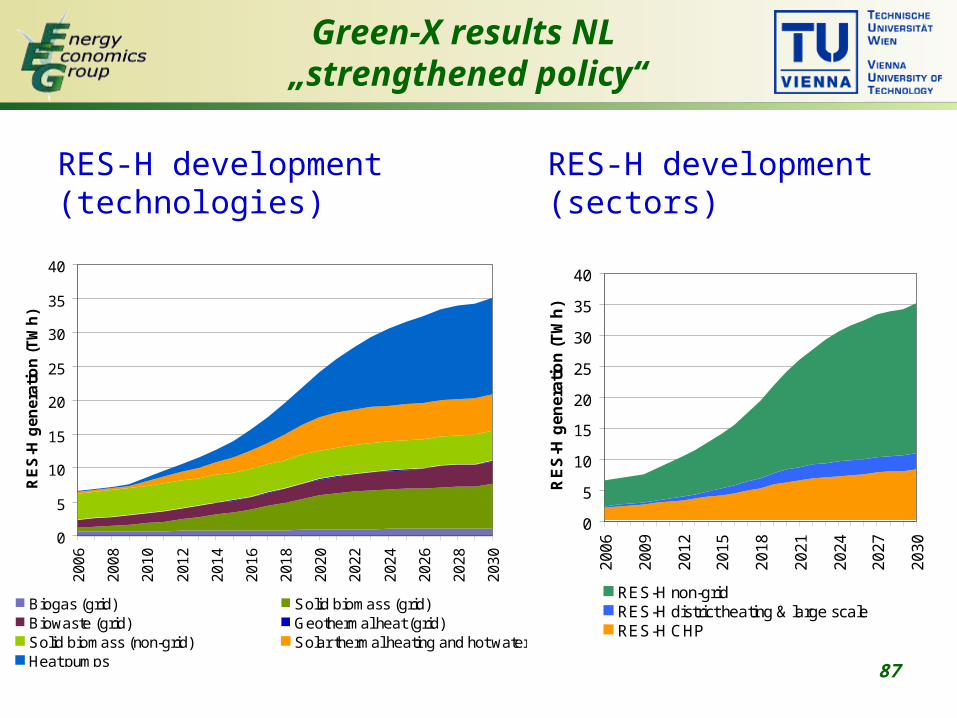
Green-X results NL „strengthened policy“
RES-H development (technologies)
RES-H development (sectors)
0
5
10
15
20
25
30
35
40
20
06
20
08
20
10
20
12
20
14
20
16
20
18
20
20
20
22
20
24
20
26
20
28
20
30
RE
S-H
ge
ne
rati
on
(T
Wh
)
Biogas (grid) Solid biomass (grid)Biowaste (grid) Geothermal heat (grid)Solid biomass (non-grid) Solar thermal heating and hot waterHeat pumps
0
5
10
15
20
25
30
35
40
20
06
20
09
20
12
20
15
20
18
20
21
20
24
20
27
20
30
RE
S-H
gen
era
tion
(T
Wh
)
RES-H non-gridRES-H district heating & large scaleRES-H CHP

88
WP3 progress: NL
• What is the state of progress regarding the literature overview?
• What is your state of progress regarding the bottom-up-data? – Missing: expected development of the stock/ new buildings, climate data,
penetration of renewables
• What is the status of stakeholder consultation and workshop preparation?
• What is the time schedule for the next steps to be taken with respect to: literature review, bottom-up-data collection, stakeholder consultation, workshop preparation and the target report?
• What are open questions regarding WP3?

89
Preliminary results: PL

90
Green-X results PL „strengthened policy“
RES development RES share
IMPACT OF TOTAL ENERGY CONSUMPTION!!!
0
50
100
150
200
250
300
20
06
20
08
20
10
20
12
20
14
20
16
20
18
20
20
20
22
20
24
20
26
20
28
20
30
RE
S g
en
era
tio
n (
TW
h)
RES-electricity (& CHP) RES-transport RES-heat final energy demand - medium
0%
5%
10%
15%
20%
25%
30%
35%
40%
20
06
20
08
20
10
20
12
20
14
20
16
20
18
20
20
20
22
20
24
20
26
20
28
20
30R
ES
sh
are
on
gro
ss
fin
al e
ne
rgy
de
ma
nd
electricity
heat
transport
total

91
Green-X results PL „strengthened policy“
RES-H development (technologies)
RES-H development (sectors)
0
20
40
60
80
100
120
140
20
06
20
08
20
10
20
12
20
14
20
16
20
18
20
20
20
22
20
24
20
26
20
28
20
30
RE
S-H
gen
era
tio
n (
TW
h)
Biogas (grid) Solid biomass (grid)Biowaste (grid) Geothermal heat (grid)Solid biomass (non-grid) Solar thermal heating and hot waterHeat pumps
0
20
40
60
80
100
120
140
20
06
20
09
20
12
20
15
20
18
20
21
20
24
20
27
20
30
RE
S-H
ge
ne
rati
on
(T
Wh
)
RES-H non-gridRES-H district heating & large scaleRES-H CHP
92
WP3 progress: PL
• What is the state of progress regarding the literature overview?
• What is your state of progress regarding the bottom-up-data? – Missing: …
• What is the status of stakeholder consultation and workshop preparation?
• What is the time schedule for the next steps to be taken with respect to: literature review, bottom-up-data collection, stakeholder consultation, workshop preparation and the target report?
• What are open questions regarding WP3?
93
Preliminary results: UK
94
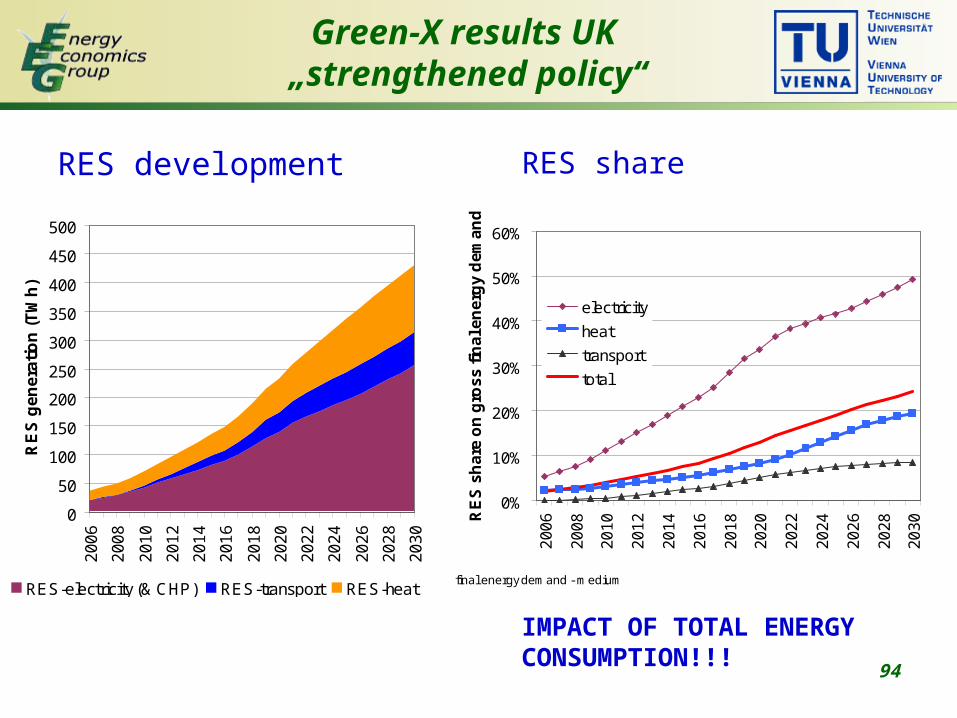
Green-X results UK „strengthened policy“
RES development RES share
IMPACT OF TOTAL ENERGY CONSUMPTION!!!
0
50
100
150
200
250
300
350
400
450
500
20
06
20
08
20
10
20
12
20
14
20
16
20
18
20
20
20
22
20
24
20
26
20
28
20
30
RE
S g
en
era
tio
n (
TW
h)
RES-electricity (& CHP) RES-transport RES-heatfinal energy demand - medium
0%
10%
20%
30%
40%
50%
60%
20
06
20
08
20
10
20
12
20
14
20
16
20
18
20
20
20
22
20
24
20
26
20
28
20
30R
ES
sh
are
on
gro
ss
fin
al e
ne
rgy
de
ma
nd
electricity
heat
transport
total

95
Green-X results UK „strengthened policy“
RES-H development (technologies)
RES-H development (sectors)
0
20
40
60
80
100
120
140
20
06
20
08
20
10
20
12
20
14
20
16
20
18
20
20
20
22
20
24
20
26
20
28
20
30
RE
S-H
ge
ne
rati
on
(T
Wh
)
Biogas (grid) Solid biomass (grid)Biowaste (grid) Geothermal heat (grid)Solid biomass (non-grid) Solar thermal heating and hot waterHeat pumps
0
20
40
60
80
100
120
140
20
06
20
09
20
12
20
15
20
18
20
21
20
24
20
27
20
30
RE
S-H
ge
ne
rati
on
(T
Wh
)
RES-H non-gridRES-H district heating & large scaleRES-H CHP

96
WP3 progress: UK
• What is the state of progress regarding the literature overview?
• What is your state of progress regarding the bottom-up-data? – Missing: ???
• What is the status of stakeholder consultation and workshop preparation?
• What is the time schedule for the next steps to be taken with respect to: literature review, bottom-up-data collection, stakeholder consultation, workshop preparation and the target report?
• What are open questions regarding WP3?
97
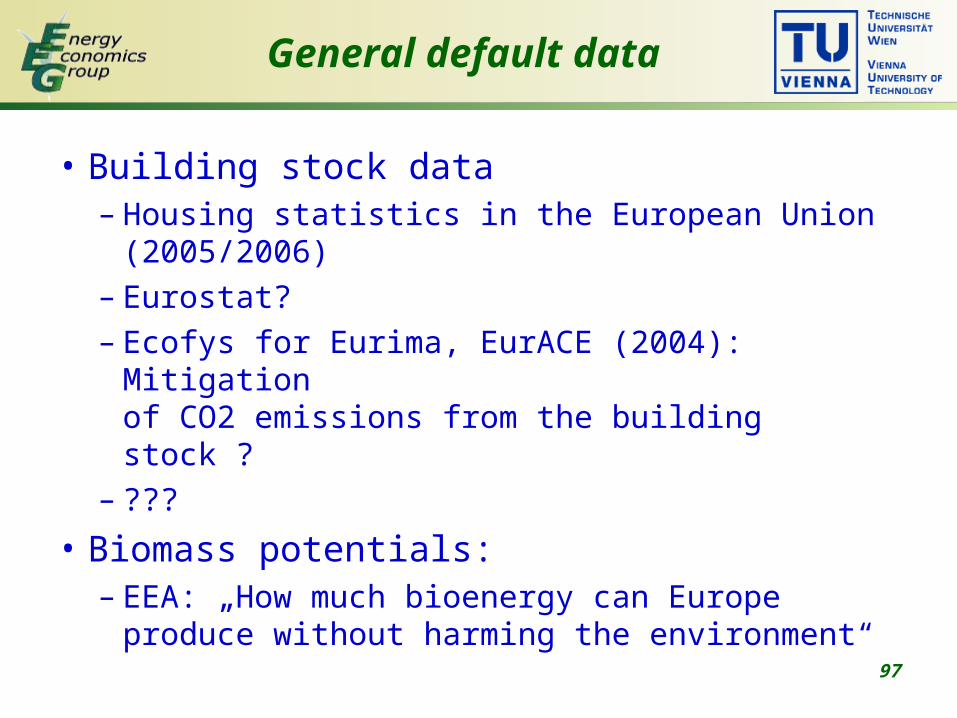
General default data
• Building stock data– Housing statistics in the European Union
(2005/2006)– Eurostat?– Ecofys for Eurima, EurACE (2004): Mitigation
of CO2 emissions from the building stock ?– ???
• Biomass potentials:– EEA: „How much bioenergy can Europe
produce without harming the environment“