wri chapter 1
DESCRIPTION
Ecosystems and Ecosystem ServicesTRANSCRIPT
N A T U R E ’ S B E N E F I T S I N K E N Y A : A N A T L A S O F E C O S Y S T E M S A N D H U M A N W E L L - B E I N G
p
q
t u2
In Chapter 1CONTENTS
u The Importance of Natural Resources in the Economy of Kenya ..................... 3
u Understanding Ecosystem Services and Processes ..................................... 4
u Major Ecosystem Components: A National View of Kenya ..................... 5
LIST OF MAPSMap 1.1 Physical Geography, Water Bodies, and Major Drainage AreasMap 1.2 Average Annual RainfallMap 1.3 Major Ecosystem Types, 2000Map 1.4 Wildlife Density in the Rangelands, 1994-96Map 1.5 Livestock Density in the Rangelands, 1994-96Map 1.6 Human Population Density, 1999
AUTHORS AND CONTRIBUTORSNorbert Henninger (WRI)Dan Tunstall (WRI)Mohammed Said (ILRI)Greg Mock (consultant)Karen Holmes (consultant)Florence Landsberg (WRI)Janet Nackoney (WRI)Carolina de Rosas (WRI)Jo Tunstall (consultant)Hyacinth Billings (WRI)Jamie Worms (WRI)
WHAT THIS CHAPTER SHOWSAfter highlighting the relevance of nature to people’s livelihoods and the importance of natural resources in Kenya’s economy, this chapter introduces the concept of
ecosystems and ecosystem services. It describes various categories of ecosystem services, briefly explains some underlying ecosystem processes, and emphasizes
that understanding the processes that affect the flow of ecosystem services is essential for effective ecosystem management. Six maps showing the physical geogra-
phy; rainfall patterns; major ecosystem types; and densities of wildlife, livestock, and people provide a synoptic view of Kenya as a context for the subsequent chapters
on poverty and selected ecosystem services.
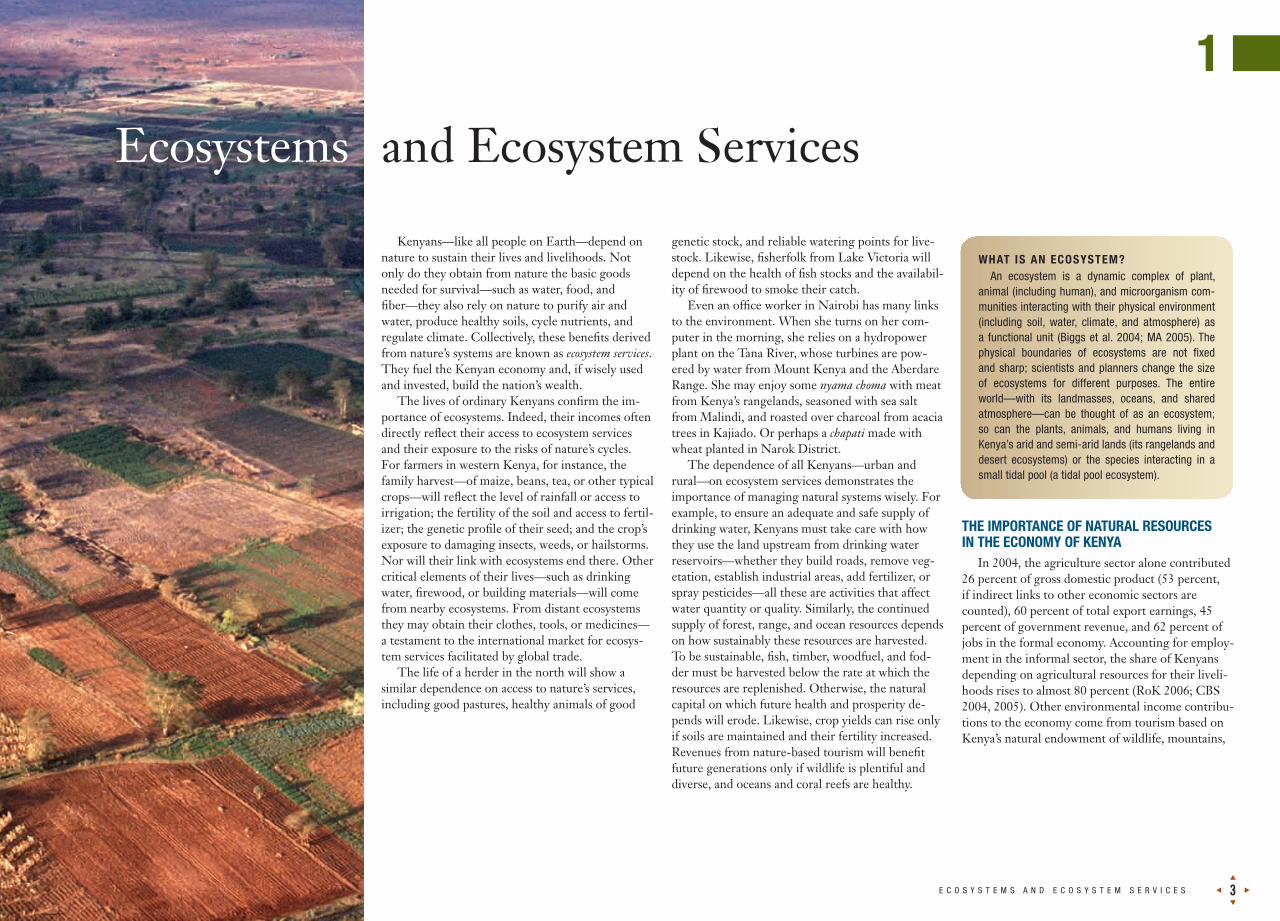
Kenyans—like all people on Earth—depend on nature to sustain their lives and livelihoods. Not only do they obtain from nature the basic goods needed for survival—such as water, food, and fiber—they also rely on nature to purify air and water, produce healthy soils, cycle nutrients, and regulate climate. Collectively, these benefits derived from nature’s systems are known as ecosystem services. They fuel the Kenyan economy and, if wisely used and invested, build the nation’s wealth.
The lives of ordinary Kenyans confirm the im-portance of ecosystems. Indeed, their incomes often directly reflect their access to ecosystem services and their exposure to the risks of nature’s cycles. For farmers in western Kenya, for instance, the family harvest—of maize, beans, tea, or other typical crops—will reflect the level of rainfall or access to irrigation; the fertility of the soil and access to fertil-izer; the genetic profile of their seed; and the crop’s exposure to damaging insects, weeds, or hailstorms. Nor will their link with ecosystems end there. Other critical elements of their lives—such as drinking water, firewood, or building materials—will come from nearby ecosystems. From distant ecosystems they may obtain their clothes, tools, or medicines—a testament to the international market for ecosys-tem services facilitated by global trade.
The life of a herder in the north will show a similar dependence on access to nature’s services, including good pastures, healthy animals of good
genetic stock, and reliable watering points for live-stock. Likewise, fisherfolk from Lake Victoria will depend on the health of fish stocks and the availabil-ity of firewood to smoke their catch.
Even an office worker in Nairobi has many links to the environment. When she turns on her com-puter in the morning, she relies on a hydropower plant on the Tana River, whose turbines are pow-ered by water from Mount Kenya and the Aberdare Range. She may enjoy some nyama choma with meat from Kenya’s rangelands, seasoned with sea salt from Malindi, and roasted over charcoal from acacia trees in Kajiado. Or perhaps a chapati made with wheat planted in Narok District.
The dependence of all Kenyans—urban and rural—on ecosystem services demonstrates the importance of managing natural systems wisely. For example, to ensure an adequate and safe supply of drinking water, Kenyans must take care with how they use the land upstream from drinking water reservoirs—whether they build roads, remove veg-etation, establish industrial areas, add fertilizer, or spray pesticides—all these are activities that affect water quantity or quality. Similarly, the continued supply of forest, range, and ocean resources depends on how sustainably these resources are harvested. To be sustainable, fish, timber, woodfuel, and fod-der must be harvested below the rate at which the resources are replenished. Otherwise, the natural capital on which future health and prosperity de-pends will erode. Likewise, crop yields can rise only if soils are maintained and their fertility increased. Revenues from nature-based tourism will benefit future generations only if wildlife is plentiful and diverse, and oceans and coral reefs are healthy.
THE IMPORTANCE OF NATURAL RESOURCES IN THE ECONOMY OF KENYA
In 2004, the agriculture sector alone contributed 26 percent of gross domestic product (53 percent, if indirect links to other economic sectors are counted), 60 percent of total export earnings, 45 percent of government revenue, and 62 percent of jobs in the formal economy. Accounting for employ-ment in the informal sector, the share of Kenyans depending on agricultural resources for their liveli-hoods rises to almost 80 percent (RoK 2006; CBS 2004, 2005). Other environmental income contribu-tions to the economy come from tourism based on Kenya’s natural endowment of wildlife, mountains,
and Ecosystem ServicesEcosystems
WHAT IS AN ECOSYSTEM?An ecosystem is a dynamic complex of plant,
animal (including human), and microorganism com-munities interacting with their physical environment (including soil, water, climate, and atmosphere) as a functional unit (Biggs et al. 2004; MA 2005). The physical boundaries of ecosystems are not fixed and sharp; scientists and planners change the size of ecosystems for different purposes. The entire world—with its landmasses, oceans, and shared atmosphere—can be thought of as an ecosystem; so can the plants, animals, and humans living in Kenya’s arid and semi-arid lands (its rangelands and desert ecosystems) or the species interacting in a small tidal pool (a tidal pool ecosystem).
1
p
q
E C O S Y S T E M S A N D E C O S Y S T E M S E R V I C E S t u3
N A T U R E ’ S B E N E F I T S I N K E N Y A : A N A T L A S O F E C O S Y S T E M S A N D H U M A N W E L L - B E I N G
p
q
t u4
rangelands, beaches, and coral reefs, as well as tim-ber production from forests and fish catches from lakes, rivers, and the Indian Ocean.
Improving the health and prosperity of Kenya’s people, while also safeguarding the natural envi-ronment and the many important economic and spiritual benefits it provides, are identified as top priorities in national development plans (GoK 2003; MoPND et al. 2005). Attaining these multiple development goals means that policymakers and civil society groups need to have access to informa-tion and analysis that will make clear the numerous interconnections among environmental resources, human well-being, and economic expansion.
UNDERSTANDING ECOSYSTEM SERVICES AND PROCESSES
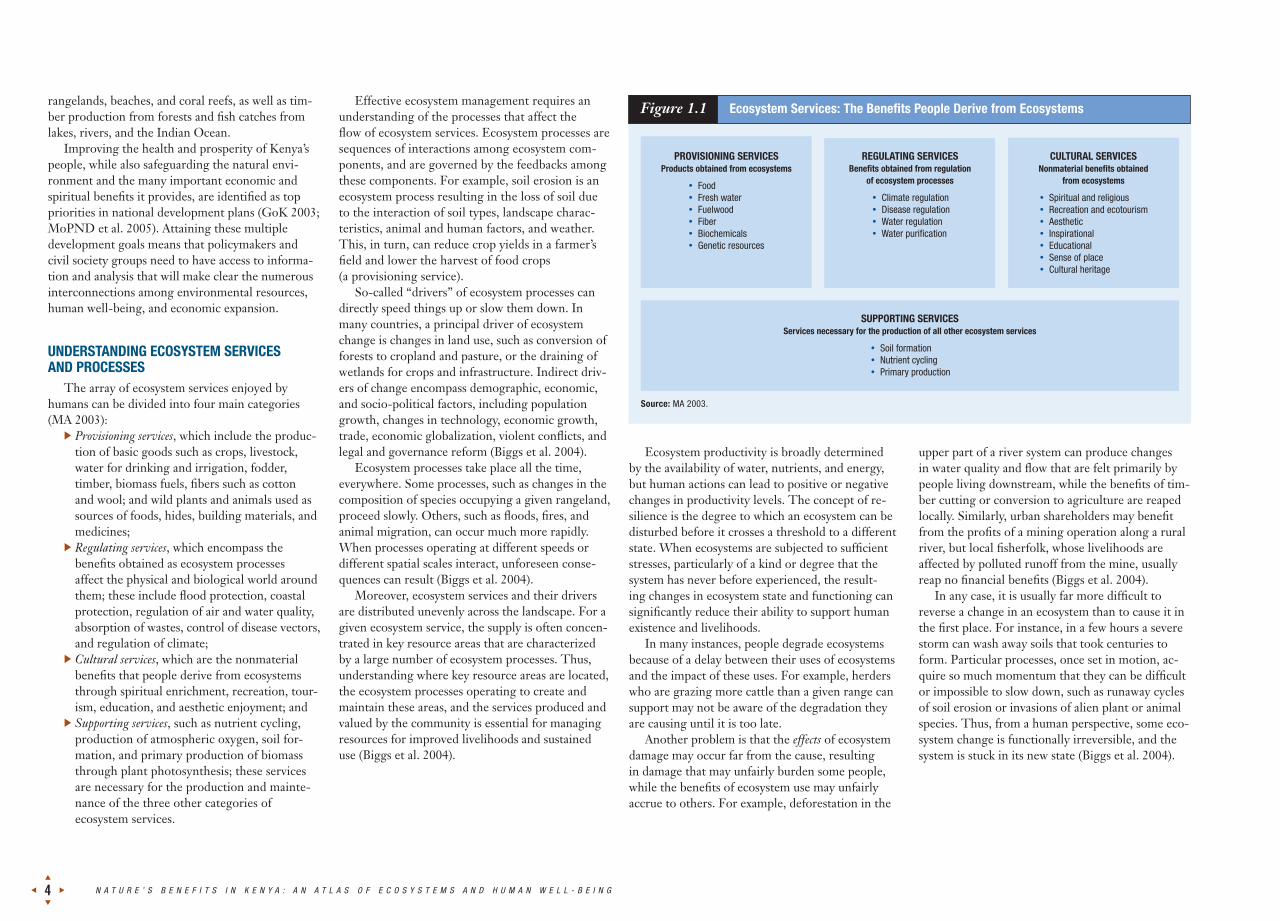
The array of ecosystem services enjoyed by humans can be divided into four main categories (MA 2003):u Provisioning services, which include the produc-
tion of basic goods such as crops, livestock, water for drinking and irrigation, fodder, timber, biomass fuels, fibers such as cotton and wool; and wild plants and animals used as sources of foods, hides, building materials, and medicines;
u Regulating services, which encompass the benefits obtained as ecosystem processes affect the physical and biological world around them; these include flood protection, coastal protection, regulation of air and water quality, absorption of wastes, control of disease vectors, and regulation of climate;
u Cultural services, which are the nonmaterial benefits that people derive from ecosystems through spiritual enrichment, recreation, tour-ism, education, and aesthetic enjoyment; and
u Supporting services, such as nutrient cycling, production of atmospheric oxygen, soil for-mation, and primary production of biomass through plant photosynthesis; these services are necessary for the production and mainte-nance of the three other categories of ecosystem services.
Figure 1.1 Ecosystem Services: The Benefits People Derive from Ecosystems
Source: MA 2003.
PROVISIONING SERVICESProducts obtained from ecosystems
FoodFresh waterFuelwoodFiberBiochemicalsGenetic resources
üüüüüü
REGULATING SERVICESBenefits obtained from regulation
of ecosystem processes
Climate regulationDisease regulationWater regulationWater purification
üüüü
CULTURAL SERVICESNonmaterial benefits obtained
from ecosystems
Spiritual and religiousRecreation and ecotourismAestheticInspirationalEducationalSense of placeCultural heritage
üüüüüüü
SUPPORTING SERVICESServices necessary for the production of all other ecosystem services
Soil formationNutrient cyclingPrimary production
üüü
Effective ecosystem management requires an understanding of the processes that affect the flow of ecosystem services. Ecosystem processes are sequences of interactions among ecosystem com-ponents, and are governed by the feedbacks among these components. For example, soil erosion is an ecosystem process resulting in the loss of soil due to the interaction of soil types, landscape charac-teristics, animal and human factors, and weather. This, in turn, can reduce crop yields in a farmer’s field and lower the harvest of food crops (a provisioning service).
So-called “drivers” of ecosystem processes can directly speed things up or slow them down. In many countries, a principal driver of ecosystem change is changes in land use, such as conversion of forests to cropland and pasture, or the draining of wetlands for crops and infrastructure. Indirect driv-ers of change encompass demographic, economic, and socio-political factors, including population growth, changes in technology, economic growth, trade, economic globalization, violent conflicts, and legal and governance reform (Biggs et al. 2004).
Ecosystem processes take place all the time, everywhere. Some processes, such as changes in the composition of species occupying a given rangeland, proceed slowly. Others, such as floods, fires, and animal migration, can occur much more rapidly. When processes operating at different speeds or different spatial scales interact, unforeseen conse-quences can result (Biggs et al. 2004).
Moreover, ecosystem services and their drivers are distributed unevenly across the landscape. For a given ecosystem service, the supply is often concen-trated in key resource areas that are characterized by a large number of ecosystem processes. Thus, understanding where key resource areas are located, the ecosystem processes operating to create and maintain these areas, and the services produced and valued by the community is essential for managing resources for improved livelihoods and sustained use (Biggs et al. 2004).
Ecosystem productivity is broadly determined by the availability of water, nutrients, and energy, but human actions can lead to positive or negative changes in productivity levels. The concept of re-silience is the degree to which an ecosystem can be disturbed before it crosses a threshold to a different state. When ecosystems are subjected to sufficient stresses, particularly of a kind or degree that the system has never before experienced, the result-ing changes in ecosystem state and functioning can significantly reduce their ability to support human existence and livelihoods.
In many instances, people degrade ecosystems because of a delay between their uses of ecosystems and the impact of these uses. For example, herders who are grazing more cattle than a given range can support may not be aware of the degradation they are causing until it is too late.
Another problem is that the effects of ecosystem damage may occur far from the cause, resulting in damage that may unfairly burden some people, while the benefits of ecosystem use may unfairly accrue to others. For example, deforestation in the
upper part of a river system can produce changes in water quality and flow that are felt primarily by people living downstream, while the benefits of tim-ber cutting or conversion to agriculture are reaped locally. Similarly, urban shareholders may benefit from the profits of a mining operation along a rural river, but local fisherfolk, whose livelihoods are affected by polluted runoff from the mine, usually reap no financial benefits (Biggs et al. 2004).
In any case, it is usually far more difficult to reverse a change in an ecosystem than to cause it in the first place. For instance, in a few hours a severe storm can wash away soils that took centuries to form. Particular processes, once set in motion, ac-quire so much momentum that they can be difficult or impossible to slow down, such as runaway cycles of soil erosion or invasions of alien plant or animal species. Thus, from a human perspective, some eco-system change is functionally irreversible, and the system is stuck in its new state (Biggs et al. 2004).
MAJOR ECOSYSTEM COMPONENTS: A NATIONAL VIEW OF KENYA
Ecosystems provide humans with water, food, fiber, building materials, and spiritual enrichment. They may be relatively undisturbed systems, such as a natural forest or nature reserve, or they may be extensively modified by human activities, such as ag-ricultural land and urban areas. Different ecosystem processes can determine the distribution of floods, pollutants, and disease vectors, such as mosquitoes or cholera organisms. People’s livelihoods and economies therefore depend on a reliable flow of multiple ecosystem services, all of which are the result of complex interactions among the physical, biological, and chemical environments. To describe and analyze these relationships, scientists and plan-ners first delineate different ecosystem types and then inventory their components and processes. This publication translates some of this information into a spatial representation.
Maps can show the location of major ecosystem elements such as rivers and lakes, mountains and plains, the clustering of certain plant communities, the home areas of wild and domesticated animals, or the densities of human populations. Moreover, maps can display where people are obtaining certain eco-system services, for example, important production and harvest areas for food, fiber, or animal products. They can pinpoint locations affected by the con-struction of roads, canals, pipelines, or dams; by the expansion of settlements and croplands; or by the introduction of new species—each of these activities can influence the availability and flow of multiple ecosystem services. Maps can also highlight impor-tant areas that supply other ecosystem services, such as flood protection provided by mangrove forests, or sediment and pollutant removal provided by certain wetlands.
The following six maps, each representing major ecosystem components, give a brief national overview of Kenya. They also provide some general context for the subsequent chapters on poverty and selected ecosystem services.
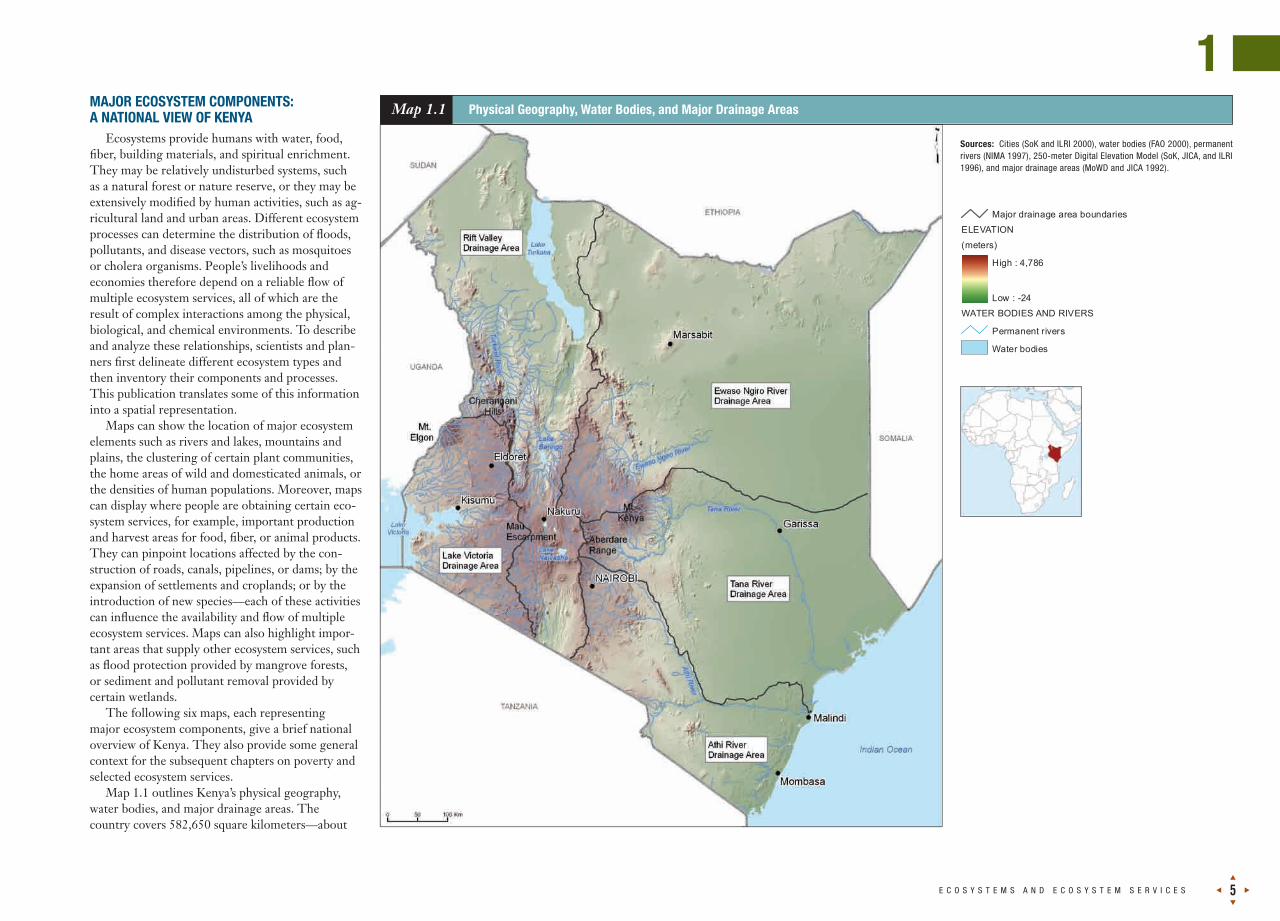
Map 1.1 outlines Kenya’s physical geography, water bodies, and major drainage areas. The country covers 582,650 square kilometers—about
Photo
1
p
q
E C O S Y S T E M S A N D E C O S Y S T E M S E R V I C E S t u5
Map 1.1 Physical Geography, Water Bodies, and Major Drainage Areas
Sources: Cities (SoK and ILRI 2000), water bodies (FAO 2000), permanent rivers (NIMA 1997), 250-meter Digital Elevation Model (SoK, JICA, and ILRI 1996), and major drainage areas (MoWD and JICA 1992).
Major drainage area boundariesELEVATION
(meters)
High : 4,786
Low : -24WATER BODIES AND RIVERS
Permanent rivers
Water bodies
N A T U R E ’ S B E N E F I T S I N K E N Y A : A N A T L A S O F E C O S Y S T E M S A N D H U M A N W E L L - B E I N G
p
q
t u6
twice the size of the state of Arizona or slightly larger than France or Thailand. About 67 percent of Kenya lies at an elevation below 900 meters, shown in the map as green lowlands. The areas above 1,200 meters—the highlands—are depicted in darker browns, covering about 23 percent of the country. They include five major mountain ranges (Mount Kenya, Mount Elgon, Aberdare Range, Mau Escarpement, and Cherangani Hills), which are surrounded by high-elevation plateaus and foothills shown in lighter browns. The Great Rift Valley, stretching north-south from the Ethiopian border at Lake Turkana, to Lake Baringo and Lake Naivasha, and then to the Tanzanian border, splits the highlands into a western and eastern part.
About 1.9 percent (SoK 2003) of Kenya is covered by water with Lake Victoria, Lake Turkana, Lake Naivasha, and Lake Baringo being the four largest inland water bodies. The highlands are the source of the major permanent rivers traversing the drier lowlands, such as the Tana River—Kenya’s longest river. To facilitate water management, plan-ners have grouped the drainage pattern of surface water into five major drainage areas (MoWD and JICA 1992). The rivers draining into Lake Victoria (extending over 8 percent of Kenya’s land area) pro-vide the largest share of internal renewable surface water supply (65 percent), while the Athi River drainage area (11 percent of Kenya’s land area) provides 7 percent, the lowest share among the five major drainage areas (SoK 2003).
Nairobi and Mombasa are Kenya’s two largest urban areas with a projected 2006 population of 2.8 million and 0.8 million, respectively. For the same year, Nakuru’s inhabitants are projected at 260,000, and Eldoret’s and Kisumu’s at 220,000 each (World Gazetteer 2006).
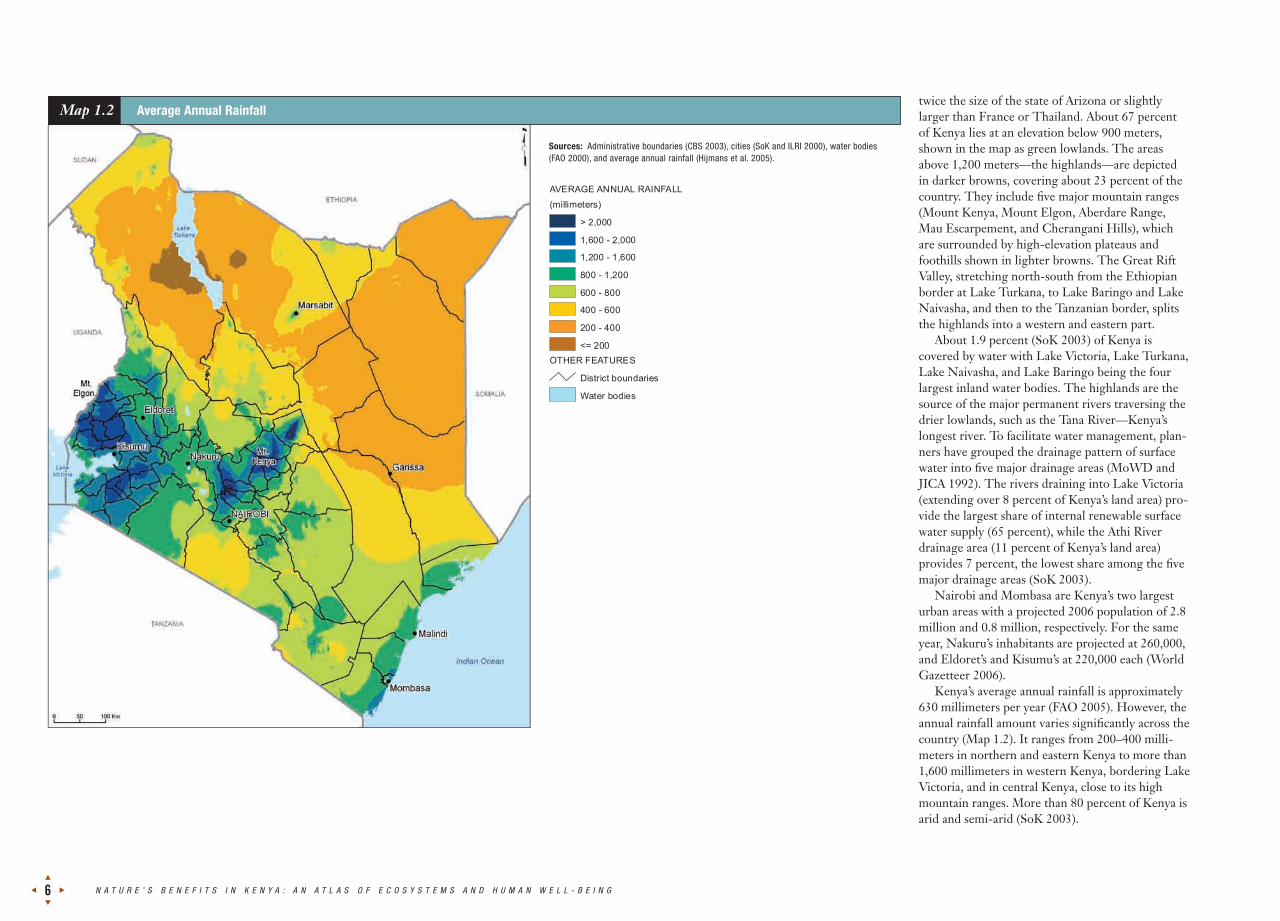
Kenya’s average annual rainfall is approximately 630 millimeters per year (FAO 2005). However, the annual rainfall amount varies significantly across the country (Map 1.2). It ranges from 200–400 milli-meters in northern and eastern Kenya to more than 1,600 millimeters in western Kenya, bordering Lake Victoria, and in central Kenya, close to its high mountain ranges. More than 80 percent of Kenya is arid and semi-arid (SoK 2003).
Map 1.2 Average Annual Rainfall
Sources: Administrative boundaries (CBS 2003), cities (SoK and ILRI 2000), water bodies (FAO 2000), and average annual rainfall (Hijmans et al. 2005).
AVERAGE ANNUAL RAINFALL
(millimeters)
> 2,000
1,600 - 2,000
1,200 - 1,600
800 - 1,200
600 - 800
400 - 600
200 - 400
<= 200OTHER FEATURES
District boundaries
Water bodies
The annual rainfall amounts in Map 1.2 hide the distinct patterns of rainy and dry seasons (see Maps 3.2 to 3.5 in Chapter 3) in a year, as well as the great variance of rainfall amounts between years. The high variability of rainfall throughout the seasons, be-tween years, and across space has influenced the dis-tribution of plants, animals, and humans. It is posing significant challenges for Kenya’s natural-resource based economy and the livelihood of its citizens.
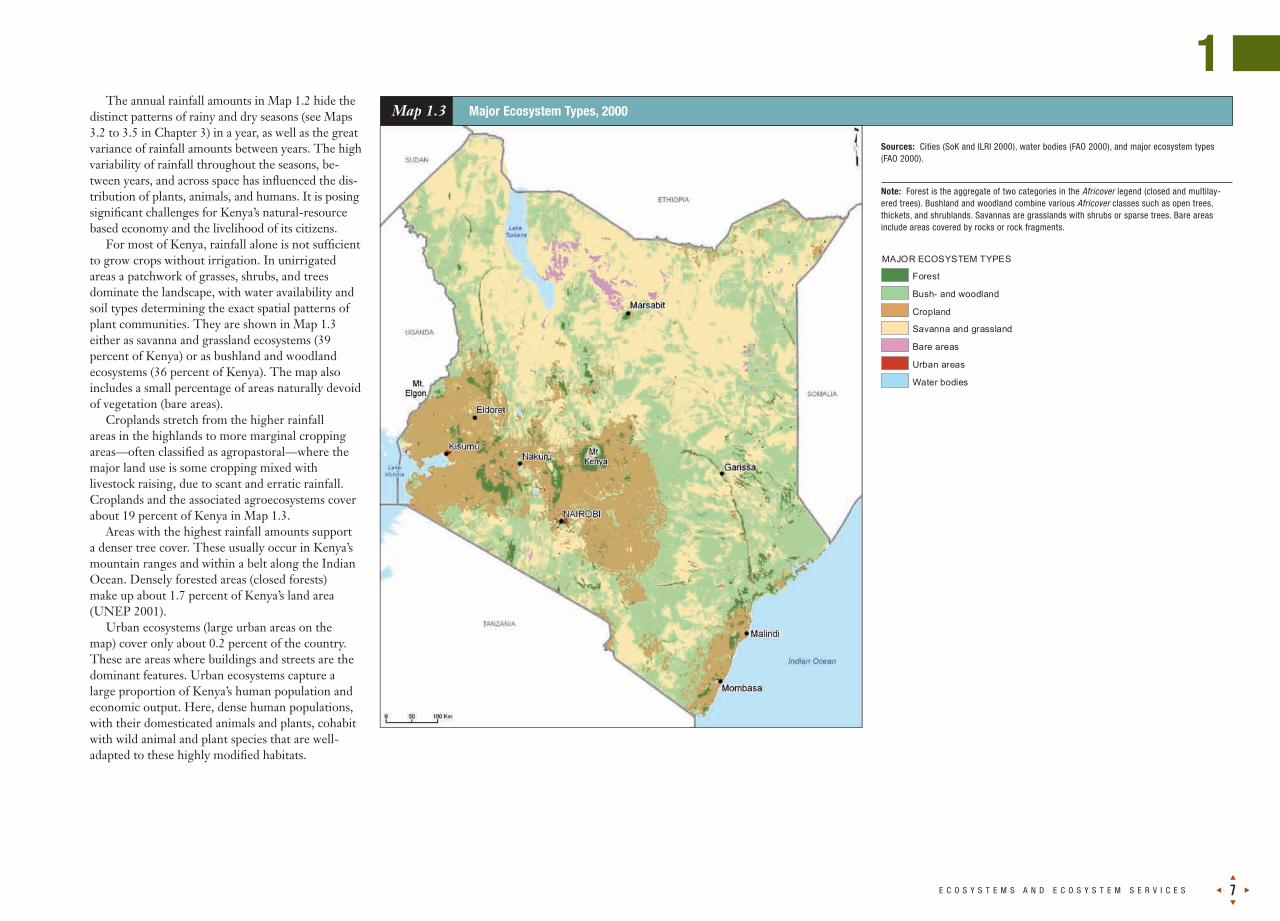
For most of Kenya, rainfall alone is not sufficient to grow crops without irrigation. In unirrigated areas a patchwork of grasses, shrubs, and trees dominate the landscape, with water availability and soil types determining the exact spatial patterns of plant communities. They are shown in Map 1.3 either as savanna and grassland ecosystems (39 percent of Kenya) or as bushland and woodland ecosystems (36 percent of Kenya). The map also includes a small percentage of areas naturally devoid of vegetation (bare areas).
Croplands stretch from the higher rainfall areas in the highlands to more marginal cropping areas—often classified as agropastoral—where the major land use is some cropping mixed with livestock raising, due to scant and erratic rainfall. Croplands and the associated agroecosystems cover about 19 percent of Kenya in Map 1.3.
Areas with the highest rainfall amounts support a denser tree cover. These usually occur in Kenya’s mountain ranges and within a belt along the Indian Ocean. Densely forested areas (closed forests) make up about 1.7 percent of Kenya’s land area (UNEP 2001).
Urban ecosystems (large urban areas on the map) cover only about 0.2 percent of the country. These are areas where buildings and streets are the dominant features. Urban ecosystems capture a large proportion of Kenya’s human population and economic output. Here, dense human populations, with their domesticated animals and plants, cohabit with wild animal and plant species that are well-adapted to these highly modified habitats.
1
p
q
E C O S Y S T E M S A N D E C O S Y S T E M S E R V I C E S t u7
Map 1.3 Major Ecosystem Types, 2000
Sources: Cities (SoK and ILRI 2000), water bodies (FAO 2000), and major ecosystem types (FAO 2000).
Note: Forest is the aggregate of two categories in the Africover legend (closed and multilay-ered trees). Bushland and woodland combine various Africover classes such as open trees, thickets, and shrublands. Savannas are grasslands with shrubs or sparse trees. Bare areas include areas covered by rocks or rock fragments.
MAJOR ECOSYSTEM TYPES
Forest
Bush- and woodland
Cropland
Savanna and grassland
Bare areas
Urban areas
Water bodies
N A T U R E ’ S B E N E F I T S I N K E N Y A : A N A T L A S O F E C O S Y S T E M S A N D H U M A N W E L L - B E I N G
p
q
t u8
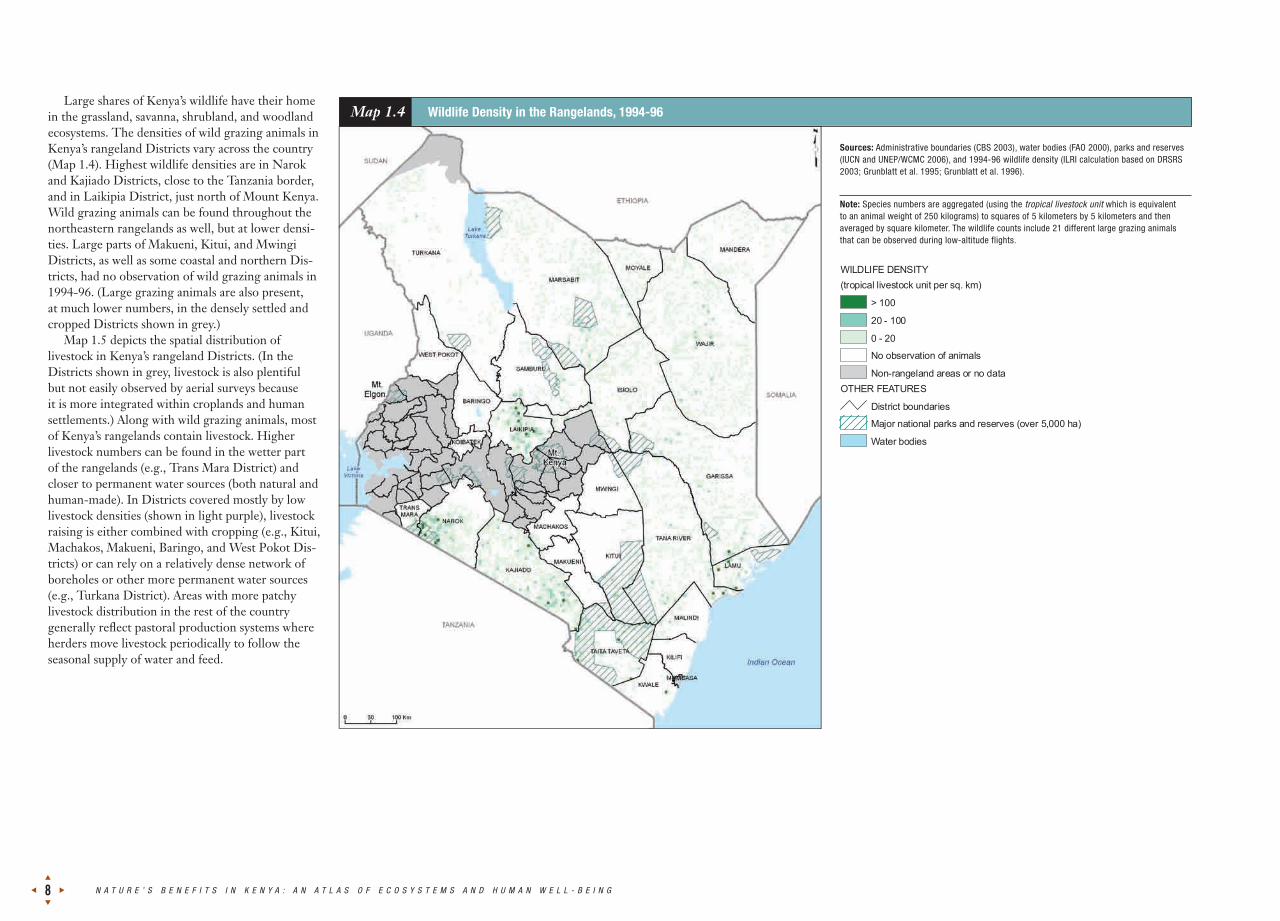
Large shares of Kenya’s wildlife have their home in the grassland, savanna, shrubland, and woodland ecosystems. The densities of wild grazing animals in Kenya’s rangeland Districts vary across the country (Map 1.4). Highest wildlife densities are in Narok and Kajiado Districts, close to the Tanzania border, and in Laikipia District, just north of Mount Kenya. Wild grazing animals can be found throughout the northeastern rangelands as well, but at lower densi-ties. Large parts of Makueni, Kitui, and Mwingi Districts, as well as some coastal and northern Dis-tricts, had no observation of wild grazing animals in 1994-96. (Large grazing animals are also present, at much lower numbers, in the densely settled and cropped Districts shown in grey.)
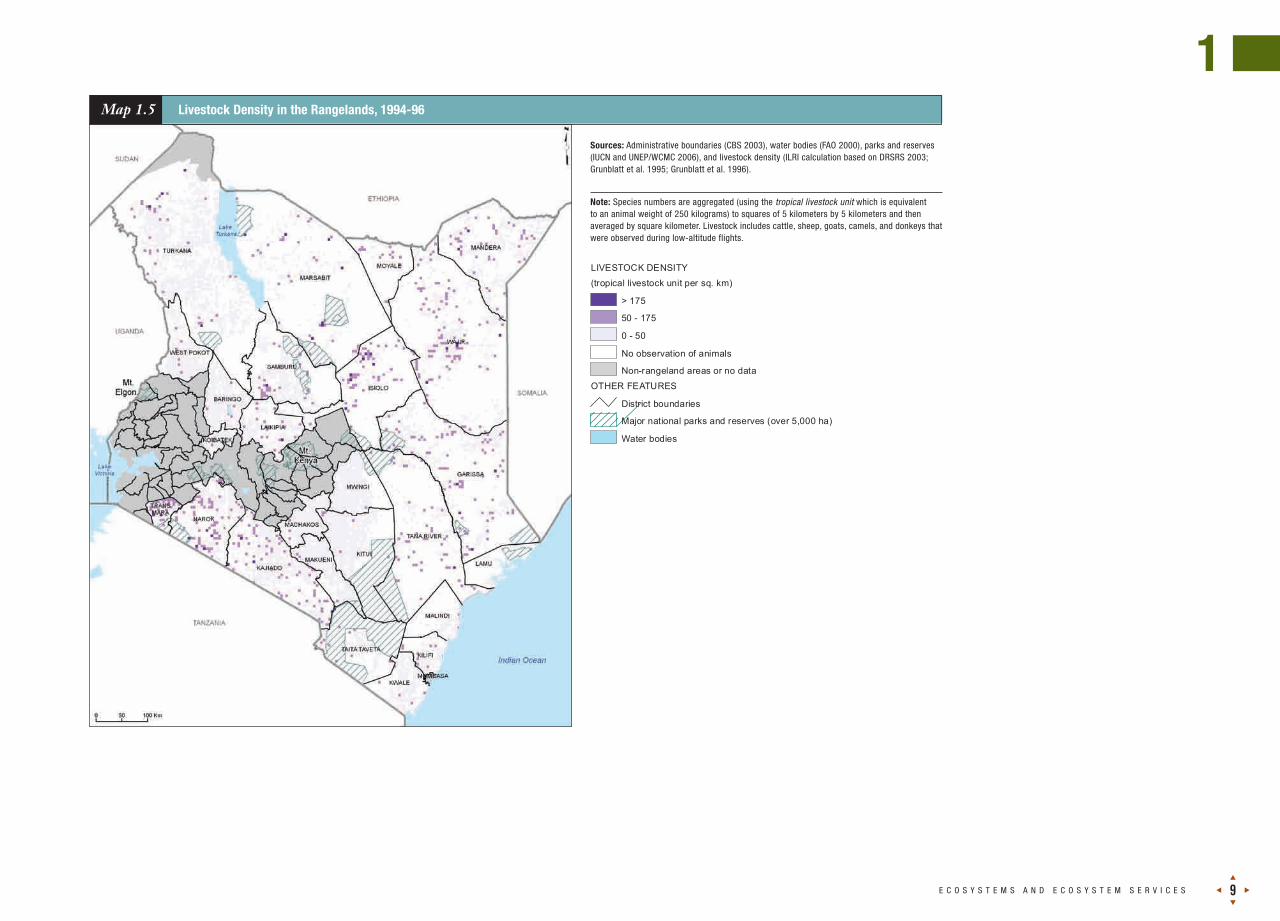
Map 1.5 depicts the spatial distribution of livestock in Kenya’s rangeland Districts. (In the Districts shown in grey, livestock is also plentiful but not easily observed by aerial surveys because it is more integrated within croplands and human settlements.) Along with wild grazing animals, most of Kenya’s rangelands contain livestock. Higher livestock numbers can be found in the wetter part of the rangelands (e.g., Trans Mara District) and closer to permanent water sources (both natural and human-made). In Districts covered mostly by low livestock densities (shown in light purple), livestock raising is either combined with cropping (e.g., Kitui, Machakos, Makueni, Baringo, and West Pokot Dis-tricts) or can rely on a relatively dense network of boreholes or other more permanent water sources (e.g., Turkana District). Areas with more patchy livestock distribution in the rest of the country generally reflect pastoral production systems where herders move livestock periodically to follow the seasonal supply of water and feed.
Map 1.4 Wildlife Density in the Rangelands, 1994-96
Sources: Administrative boundaries (CBS 2003), water bodies (FAO 2000), parks and reserves (IUCN and UNEP/WCMC 2006), and 1994-96 wildlife density (ILRI calculation based on DRSRS 2003; Grunblatt et al. 1995; Grunblatt et al. 1996).
Note: Species numbers are aggregated (using the tropical livestock unit which is equivalent to an animal weight of 250 kilograms) to squares of 5 kilometers by 5 kilometers and then averaged by square kilometer. The wildlife counts include 21 different large grazing animals that can be observed during low-altitude flights.
WILDLIFE DENSITY(tropical livestock unit per sq. km)
> 100
20 - 100
0 - 20
No observation of animals
Non-rangeland areas or no dataOTHER FEATURES
District boundaries
Major national parks and reserves (over 5,000 ha)
Water bodies
1
p
q
E C O S Y S T E M S A N D E C O S Y S T E M S E R V I C E S t u9
Map 1.5 Livestock Density in the Rangelands, 1994-96
Sources: Administrative boundaries (CBS 2003), water bodies (FAO 2000), parks and reserves (IUCN and UNEP/WCMC 2006), and livestock density (ILRI calculation based on DRSRS 2003; Grunblatt et al. 1995; Grunblatt et al. 1996).
Note: Species numbers are aggregated (using the tropical livestock unit which is equivalent to an animal weight of 250 kilograms) to squares of 5 kilometers by 5 kilometers and then averaged by square kilometer. Livestock includes cattle, sheep, goats, camels, and donkeys that were observed during low-altitude flights.
LIVESTOCK DENSITY
(tropical livestock unit per sq. km)
> 175
50 - 175
0 - 50
No observation of animals
Non-rangeland areas or no data
OTHER FEATURES
District boundaries
Major national parks and reserves (over 5,000 ha)
Water bodies
N A T U R E ’ S B E N E F I T S I N K E N Y A : A N A T L A S O F E C O S Y S T E M S A N D H U M A N W E L L - B E I N G
p
q
t u10
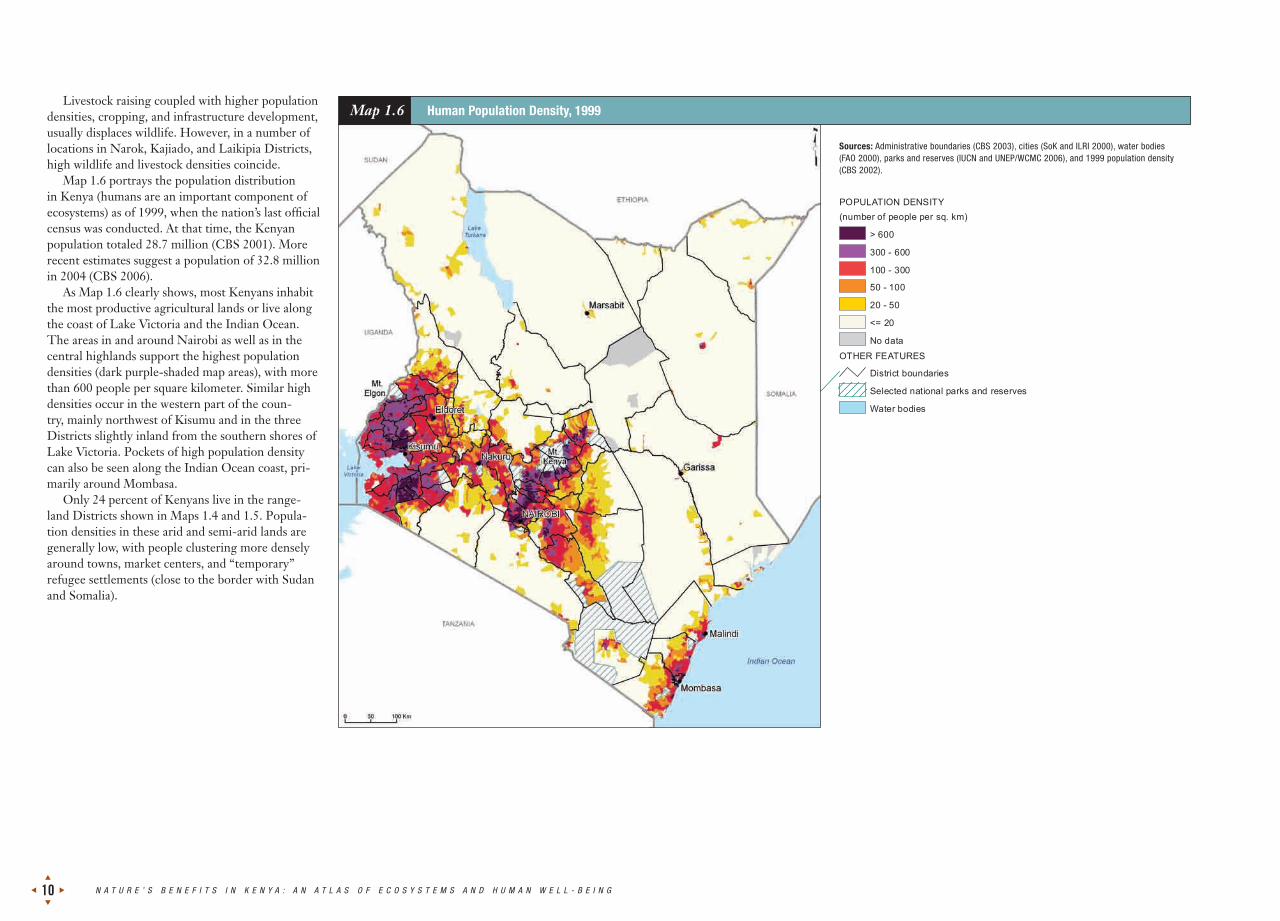
Map 1.6 Human Population Density, 1999
Sources: Administrative boundaries (CBS 2003), cities (SoK and ILRI 2000), water bodies (FAO 2000), parks and reserves (IUCN and UNEP/WCMC 2006), and 1999 population density (CBS 2002).
POPULATION DENSITY(number of people per sq. km)
> 600
300 - 600
100 - 300
50 - 100
20 - 50
<= 20
No data
OTHER FEATURES
District boundaries
Selected national parks and reserves
Water bodies
Livestock raising coupled with higher population densities, cropping, and infrastructure development, usually displaces wildlife. However, in a number of locations in Narok, Kajiado, and Laikipia Districts, high wildlife and livestock densities coincide.
Map 1.6 portrays the population distribution in Kenya (humans are an important component of ecosystems) as of 1999, when the nation’s last official census was conducted. At that time, the Kenyan population totaled 28.7 million (CBS 2001). More recent estimates suggest a population of 32.8 million in 2004 (CBS 2006).
As Map 1.6 clearly shows, most Kenyans inhabit the most productive agricultural lands or live along the coast of Lake Victoria and the Indian Ocean. The areas in and around Nairobi as well as in the central highlands support the highest population densities (dark purple-shaded map areas), with more than 600 people per square kilometer. Similar high densities occur in the western part of the coun-try, mainly northwest of Kisumu and in the three Districts slightly inland from the southern shores of Lake Victoria. Pockets of high population density can also be seen along the Indian Ocean coast, pri-marily around Mombasa.
Only 24 percent of Kenyans live in the range-land Districts shown in Maps 1.4 and 1.5. Popula-tion densities in these arid and semi-arid lands are generally low, with people clustering more densely around towns, market centers, and “temporary” refugee settlements (close to the border with Sudan and Somalia).
1
p
q
E C O S Y S T E M S A N D E C O S Y S T E M S E R V I C E S t u11
SUMMING UP
u An ecosystem is a dynamic complex of plant, animal (in-cluding human), and microorganism communities interact-ing with their physical environment (including soil, water, climate, and atmosphere) as a functional unit.
u The benefits derived from nature’s systems are known as ecosystem services.
u The array of ecosystem services enjoyed by humans can be divided into four main categories: provisioning services (food, water, timber, biomass fuels, fibers, medicines, etc.), regulating services (flood protection, coastal protection, regulation of air and water quality, etc.), cultural services (tourism, education, aesthetic enjoyment, etc.), and sup-porting services (nutrient cycling, soil formation, etc.).
u Ecosystems and ecosystem services play a significant role in Kenya’s economy and people’s livelihoods: About 80 percent of Kenyans derive their livelihoods from agricul-tural activities; agriculture contributes, directly and indi-rectly, about 53 percent to the economy; and nature-based tourism, fishing, and timber production are other important sources of environmental income.
u For a given ecosystem service, the supply is often con-centrated in key resource areas. Understanding where key resource areas are located, the ecosystem processes operating to create and maintain these areas, and the ser-vices produced and valued by the community is essential for managing resources for improved livelihoods and sus-tained use.
u The areas above 1,200 meters—the highlands—cover about 23 percent of the country.
u The annual rainfall amount varies significantly across the country. It ranges from 200–400 millimeters in northern and eastern Kenya to more than 1,600 millimeters in western and central Kenya. More than 80 percent of Kenya is arid and semi-arid.
u The high variability of rainfall throughout the seasons, be-tween years, and across space has influenced the distri-bution of plants, animals, and humans. It poses significant challenges for Kenya’s natural-resource based economy and the livelihood of its citizens.
u Savanna and grassland ecosystems and bushland and woodland ecosystems cover 39 and 36 percent of Kenya, respectively. Agroecosystems extend over another 19 percent and closed forests make up about 1.7 percent of Kenya’s land area. Urban ecosystems cover only about 0.2 percent of the country.
u The highest densities of wild grazing animals are in Narok, Kajiado, and Laikipia Districts.
u Most of Kenya’s rangelands contain livestock. Higher livestock numbers can be found in the wetter part of the rangelands and closer to permanent water sources. Live-stock densities in large parts of the northeastern range-lands reflect pastoral production systems where herders move livestock periodically to follow the seasonal sup-ply of water and feed. In a number of locations in Narok, Kajiado, and Laikipia Districts, high wildlife and livestock densities coincide.
u The areas close to Nairobi in the central highlands sup-port the highest population densities, with more than 600 people per square kilometer. Similar high densities occur in the western part of the country, slightly inland from Lake Victoria. Only 24 percent of Kenyans live in Kenya’s range-land Districts.