writer’s workshop vs. writing prompts: the effect on first ... · pdf file2 abstract: in...
TRANSCRIPT

1
Writer’s Workshop vs. Writing Prompts:
The Effect on First Graders’ Writing Ability and Attitude towards Writing
Stacy Carroll
Jay Feng
Spring 2010
Paper presented at the 2010 Annual Conference of Georgia Educational Research Association, Savannah, Georgia.

2
Abstract:
In the county schools, students are assessed every nine weeks based on a writing prompt using a rubric
supplied by the county, but the students are often taught using Writer’s Workshop. This action research attempted
to determine if Writer’s Workshop and the use of writing prompts have different effects on first graders’ writing
ability and attitudes. Eighteen students (N=18) in a first grade class were randomly split into two groups, and
during a 5-week period each group was taught writing in a different method. One group received instruction on
writing a persuasive paper using a prompt, and another received instruction on writing a persuasive paper with a
free-choice of topic. The students were then assessed on their writing ability and attitude towards writing at the end
of instruction. A series of t-tests and item analysis was conducted to compare writing ability and attitude between
the two groups. The results showed that both Group A (prompted) and Group B (free-choice) experienced a decline
in overall attitude about writing over the course of the study. Group A (prompted), however, experienced more of a
decline than Group B (free-choice). It appears that students get slightly more enjoyment out of choosing their topic
than being told what to write. The overall scores on the final persuasive writing showed that students taught using a
prompt scored better than those with free-choice (11.56 > 9.78). The only subcategory where Group B (free-choice)
scored higher than Group A (prompted) was in conventions. (Ideas: 4.89>3.56; Organization 2.56 > 2.11; Style
2.22 > 2.00; Conventions: 1.89 < 2.11). It also shows that students who write better enjoy the writing process more.
Overall, the scores on the Writing Assessment were better from those students receiving a prompt. When students
are given the freedom to write what they choose, they have a more positive attitude towards writing. This study
indicates that free choice writing and prompted writing both have a place in the classroom. In order to teach a
specific type of writing (i.e. persuasive, narrative, informational) students need prompts and clear instructions.
However, if we are to foster a life-long love of writing, classroom teachers need to set aside time for students to
write what they want to write about and share with others.

3
Introduction and Problem Statement
“Writer’s Workshop is an interactive approach to teaching writing in which students
learn and practice the importance of rehearsal, drafting/revising, and editing their own work”
(Jasmine, J., & Weiner, W., 2007, p. 131). In Writer’s Workshop, students learn creative
writing through mini-lessons and conferences. Teachers begin each Workshop with a mini-
lesson on topics such as expressive sentences or adjectives. In the Writer’s Workshop program,
students are not given writing prompts but choose their own topic that is meaningful to them.
They brainstorm, draft, and revise work that is personal to them. In addition, the teacher’s
responsibility in Writer’s Workshop is to meet with students individually to help them with the
mechanics of writing based on what each student needs at the moment. This could be
capitalization, punctuation, or subject/verb agreement. Finally, students are able to share a piece
of work with the class in the Author’s Chair.
In a study by Jasmine & Weiner (2007), Writer’s Workshop was found to increase
enjoyment of writing in first graders. “The Writing Workshop model has proven to be an
effective instructional method to support first graders in learning the writing process by choosing
a topic, revising and editing drafts, and sharing their work” (Jasmine, J., & Weiner, W., 2007,
p.138).
In stark contrast to the Writer’s Workshop, public schools in this region still require
writing assessments to be given using writing prompts. Prompts can be as vague as “My first
time__________” to something specific such as “If I was invisible for a day I would_________.”
County benchmark writing assessments and state writing assessments all require students to
write from a prompt. “During written expression instruction with young children, teachers often
use writing prompts to produce a facilitative priming effect on children’s writing” (Hudson,

4
H.B., & Mercer, 2005, p. 473). These activities are often separate from Writer’s Workshop and
are used to gauge learning. “It is thought that writing about a topic helps people to understand it
better, and writing is the primary way students are asked to display their knowledge in school”
(Hudson, H.B., & Mercer, 2005, p. 473).
So the question arises, does the use of Free Choice/Writer’s Workshop or writing from a
prompt have different, if any, effect on first graders’ attitude towards writing? Also, does the
writing process, free choice or writing from prompt, have different, if any, effect on students’
writing ability? The purpose of this study was to determine if students perform better on prompt-
based writing assessments when they have experience with prompts, or if they perform better
when writing from the free choice writing experience that Writer’s Workshop offers. Also, does
writing from prompts and Writer’s Workshop have different effect on students’ attitude towards
writing?
Review of the Literature
Writer’s Workshop has become a respected and much touted method for teaching writing
to all age groups. It incorporates not only the freedom to choose what you write, but it provides
the length of time students need in order to get ideas down on paper (Eitelgeorge, J.S., & Barrett,
R. 2004).
In the study conducted by Jasmine and Weiner (2007), it was determined that the
Writer’s Workshop program fosters independence and confidence in elementary students. In the
study, similar in sample size to my research study, focused on one classroom comprised of 12
boys and 9 girls. “Due to the nature of the study, generalizations were difficult to achieve since
[the] researcher was the teacher and the study was limited to 19 children” (Jasmine and Weiner,
2007, p. 136). Similar to my research study, Jasmine and Weiner (2007) used a Likert scale

5
that consisted of 12 closed-ended questions to determine the students’ attitudes towards writing.
The survey was given both pre- and post-study.
In a year long ethnographic study, Rowe, Fitch, and Bass (2001) stress the importance of
student identity in Writer’s Workshop. They determined that students find voice and power
when given the opportunity to write what they choose and read it to the class. “Children and
teachers draw from the resources provided by their multiple affiliations (e.g. family, religious,
professional, gender, and age-related communities) as they participate in what [is called] the
official classroom culture which is the set of events that is planned and approved by the teacher
for the purpose of ‘doing school’.” (Rowe, Fitch, and Bass, 2001, p.427). In order for writing to
be meaningful to a student, he has to decide what he wants to share of his life, affiliation, and
community.
Unfortunately, regardless of current research, Georgia continues to assess student writing
ability using writing assessments where students write from prompts. “During written
expression instruction with young children, teachers often use writing prompts to produce a
facilitative priming effect on children’s writing” (Hudson, Lane, and Mercer, 2005, p.474).
Hudson, Lane, and Mercer (2005) found that writing prompts have some slight effect on writing
fluency. The study they conducted, however, had considerable limitations. It was “ unclear
whether the differences seen in writing fluency due to occasion are a result of the occasion they
were written on or due to how well the students liked the story topic” (Hudson, Lane, and Mercer
(2005, p.491). It is possible that prompts are only helpful if the topic appeals to the students
who have to write.
McMaster, Xiaoqing, and Petursdottir (2009), however, took prompts a step further with
students with learning disabilities. They provided pictures and photos in addition to story

6
prompts to determine if students that were struggling might benefit from these visual aids. They
found that in students with disabilities, some had an easier time when provided the different
prompts.
Countless studies have been conducted on the utilization of both Writer’s Workshops and
writing prompts, but studies comparing the two are limited. The purpose of this study was to
determine if one type of writing instruction is superior to the other, and if it has any affect on
student enjoyment of writing.
Research Method
Overview of the Project
This was an action research project that was conducted primarily by the classroom
teacher. Prior to the study, all nineteen students in a general education first grade class were
given a survey that asked them to gauge their attitudes towards writing. The survey was a Likert
scale similar to the scale used to determine attitudes towards reading in the study conducted by
McKenna, M.C. & Kear, D.J. (1990).
Next, the students were randomly placed into two groups. The selection was conducted
so that students served in the Early Intervention Program (E.I.P.) and those served in Special
Education were randomly selected to form two groups. Then the remaining students were placed
randomly into the two separate groups. The groups were separated before randomly placing
them to ensure the number of struggling students in either group was proportionate to the number
of typically developing students. The purpose of this study was to determine if writing prompts
or free choice has any different effect on writing ability or attitude towards writing.

7
All students were instructed how to write a persuasive letter. The initial prompt was used
to instruct the students how to write a persuasive paper. The prompt was “You should really
visit…”
With Group A, the traditional writing process was used, teaching writing using writing
prompts, graphic organizers, and the traditional writing process: prewriting, drafting, revising,
editing, evaluating, and publishing. Both groups received conferencing time with the teacher,
and both had the same amount or writing time. Once the study was complete, the students were
asked to complete another survey to determine if their attitudes towards writing had changed.
For Group B, the structured Writer’s Workshop was implemented, as seen in Figure 1.
Figure 1 shows the daily schedule for first-grade Writer’s Workshop recommended by Wagner,
L., Nott, J.G. & Agnew, A.T. (2001).
Figure 1.
Typical time allotted Activity Teacher Responsibility Student Responsibility
5-15 Minutes Mini-lesson Direct instructions in
whole group about
strategies and skills.
Children participate in
whole group instruction.
5 Minutes Group rehearsal for
writing
Brainstorming and topic
discussion
Children suggest writing
topics.
10 Minutes Individual rehearsal for
writing
Teacher models
brainstorming her/his
selected topic
Children draw a picture
of selected topic.
15-45 Minutes Individual writing and
informal peer discussion
Teacher writes and then
circulates as children
write
Children begin new
writings or continue
with past work.
5-15 Minutes Sharing of writing by
one fifth of the students
Students are allowed to
share.
Children share in a
predetermined rotation.
Research Questions
1. Do the Writer’s Workshop and writing from a prompt have different effect on first
graders’ attitude towards writing?

8
2. Do the Writer’s Workshop and writing from a prompt have different effect on first
graders’ writing ability?
Hypotheses
1. Writing from a prompt will have a more positive effect on first graders’ writing
ability;
2. The Writer’s Workshop will have a more positive effect on first graders’ attitude
towards writing.
Description of the Sample
The participants are part of a general education, first-grade classroom. The group
consists of eight girls and ten boys (n=18). Seven students are served through the Early
Intervention Program (E.I.P.). Two students are served in the Special Education Program. One
student has been diagnosed with Asperger’s Syndrome. One student has Cerebral Palsy which
affects her fine motor skills. One student is served through the school’s gifted program. The
class consists of 10 white students, 5 multiracial students, 2 black students, and 1 Hispanic
student. The school is a Title 1 school which met AYP in the previous school year. In the
participating class, six of the students receive free or reduced lunch.
Data Collection
Data on attitudes toward writing and writing ability of participants was collected at
beginning and end of the program implementation. The study took place over the course of two
months from February 9, 2010 to March 25, 2010.
On February 9, 2010 the students were given the Elementary Writing Attitude Survey.
This was done to pilot the survey and to test for validity, reliability and ease of use. Students

9
were given the survey. I read the survey questions to them as they answered. They were asked
not to look at each other’s papers and were provided generic coversheets.
To collect the data on the students’ attitude towards writing, a Likert scale (Appendix
Figure 2.) similar to the one used by McKenna, M.C. & Kear, D.J. (1990) was used. Students
were asked to answer questions about their attitude towards writing. The answers were leveled
from Wonderful (worth 4 points) to Bad (worth 1 point). The students were asked to circle their
feelings about a specific aspect of writing. On March 25, 2010, the students retook the survey to
determine if their attitudes had changed overall.
Wonderful 4
Good 3
Okay 2
Bad 1
At the end of the study, a word of persuasive writing from each student was assessed
using the Carroll County Persuasive Writing Rubric for Grade 1 (Appendix Figure 3).
Data Analysis and Results
A total of 18 students participated in the study. To collect the data on the
students’ attitude towards writing, a survey using a Likert scale (Appendix Figure 2.) similar to
the one by McKenna, M.C. & Kear, D.J. (1990), was administered to students at both beginning
and end of the study. Students were asked to answer questions about their attitude towards
writing. The answers are leveled from Wonderful (worth 4 points) to Bad (worth 1point). The
students were asked to circle their feelings about a specific aspect of writing.
Attitudes
A paired t-test was conducted comparing the pre and post-study attitude of Group A, the
group that received the writing prompts. The two-tailed P value equals 0.4230. By conventional
criteria, the difference is considered to be not statistically significant. The mean of Group A’s
Attitude Pre Study minus Group A’s Attitude Post Study equals 1.67. 95% confidence interval

10
of this difference: From -2.63 to 5.96. Of the intermediate values used in the calculations the t
value = 0.8223. The degree of freedom (df) = 16. The standard error of difference equaled
2.027.
Though not significant, Group A (prompted) had a decline in attitude over the course of
the study (16.44>14.78). It could be that the students were not fond of the style of writing. In
order to get more significant data, the students’ attitude should be measured at the beginning of
the school year and then at the end. This way, the research would show how students feel about
writing overall. It is quite possible that Group A (prompted) did not enjoy persuasive writing,
but would have had a more positive outcome had the assignment been narrative or response to
literature. Traditionally, persuasive writing is the most difficulty writing assignment for first
graders. At this age, the ego of the child is still very self-centered. It is difficult for children of
this age to see someone else’s point of view with is a crucial component of persuasive writing.
This fact can be frustrating for a young child, which can affect the students’ attitude.
Table 1: Group A Writing Attitude
Group A Attitude Pre Study Attitude Post Study
Mean 16.44 14.78
SD 4.33 4.27
SEM 1.44 1.42
N 9 9
A paired t-test was conducted that compared the pre and post-study attitude of Group B,
the group that was allowed free choice of topic. The two-tailed P value equals 0.7499. By
conventional criteria, this difference is considered to be not statistically significant. The mean of
Group B’s Attitude Pre Study minus Group B’s Attitude Post Study equals 0.67. 95%

11
confidence interval of this difference: From -3.99 to 5.33. Of the intermediate values used in the
calculations the t value = 0.3299. The degree of freedom (df) = 8. The standard error of
difference equaled 2.021.
The Pre- and Post Study Attitude of Group B (free-choice) showed only a very slight
decline (17.89 > 17.22). As with Group A (prompted), this could be from the students not
responding well to the persuasive style of writing. Unlike Group A, Group B was allowed to
choose who they were trying to persuade and ask for what they wanted. This could be why, even
though their attitudes declined due to the difficulty of the assignment, they found more
enjoyment that Group A because they were able to personalize their topics.
Table 2: Group B Writing Attitude
Group B Attitude Pre Study Attitude Post Study
Mean 17.89 17.22
SD 3.41 3.60
SEM 1.14 1.20
N 9 9
An un-paired t-test was conducted that compared the pre-study attitude of Group A, the
group that was given the prompt, and Group B, the students that were allowed free choice of
topic. The two-tailed P value equals 0.4433. By conventional criteria, this difference is
considered to be not statistically significant. The mean of Group A’s Attitude Pre-Study minus
Group B’s Attitude Pre-Study equals -1.44. 95% confidence interval of this difference: -5.34 to
2.45. Of the intermediate values used in the calculations the t value = 0.7861. The degree of
freedom (df) = 16. The standard error of difference equaled 1.838.
Although not significant, the pre-study Attitude survey showed that Group B (free-
choice) began the study with a more positive attitude towards writing (16.44 < 17.89). This

12
could mean that Group B were more successful writers and thus were more confident and found
more enjoyment in writing before the study began. This would, in turn, affect the outcome of the
post study attitude survey.
Table 3: Comparison of Pre-Study Writing Attitude
Group Group A’s Attitude Pre Study Group B’s Attitude Pre Study
Mean 16.44 17.89
SD 4.33 3.41
SEM 1.44 1.14
N 9 9
An un-paired t-test was conducted that compared the post-study attitude of Group A, the
group that was given the prompt, and Group B, the students that were allowed free choice of
topic. The two-tailed P value equals 0.2073. By conventional criteria, this difference is
considered to be not statistically significant. The mean of Group A’s Attitude Post-Study minus
Group B’s Attitude Post-Study equals -2.44. 95% confidence interval of this difference: From -
6.39 to 1.50. Of the intermediate values used in the calculations the t value = 1.3142. The
degree of freedom (df) = 16. The standard error of difference equaled 1.860.
The study showed that both Group A (prompted) and Group B (free-choice) experienced
a decline in overall attitude about writing over the course of the study (14.78 < 17.22). Group A
(prompted), however, experienced more of a decline than Group B (free-choice). This can be
some indication that students get slightly more enjoyment out of choosing their topic than being
told what to write. The hypothesis, that free-choice Writer’s Workshop would have a more
positive effect on first graders’ attitude towards writing, was supported but, due to the overall
decline in Group A and Group B, only when compared to the prompted writing.

13
Table 4: Comparison of Post Study Writing Attitude
Group Group A Attitude Post Study Group B Attitude Post Study
Mean 14.78 17.22
SD 4.27 3.60
SEM 1.42 1.20
N 9 9
The results show that prior to the study, Group B (free-choice) had a more positive
attitude towards writing. After the study, both groups had a less positive attitude towards
writing. Group A received the writing prompts whereas Group B was allowed free choice of
topic. Group B’s attitude towards writing had showed less of a change that Group A. The study
shows that students have a more favorable attitude towards writing when they are allowed to
choose their own topic. Both groups, however, showed a decrease in their attitudes towards
writing. The mean attitude of Group A, the prompted group, changed from 16.44 pre-study to
14.78 post-study. Group B, the free choice group, went from 17.89 pre-study to 17.22 post-
study. Even though Group B was allowed free choice of topic, they were still expected to write
a persuasive paper. It is possible, that the decline in the students’ overall attitude reflected the
students’ attitude towards writing a persuasive paper. A clearer picture of how free choice and
prompted writing affects attitude would be gained from conducting a longer study using different
writing concepts such as narrative, persuasive, response to literature, informational, and
instructional. It is important to note, however, that the students that were allowed free choice of
topic had a less significant drop than those that were prompted. This indicates that students
enjoy picking their own topics rather than having to write what they are told.

14
Overall Writing Results
Writing samples were collected at the end of the study. The students’ final writing
samples were assessed using the Carroll County Persuasive Writing Rubric for Grade 1
(Appendix Figure 3). All students were given the prompt, “Convince your parents to let you go
to bed when you want.”
An un-paired t-test was conducted that compared writing sample of Group A, the group
that was given the prompt, and Group B, the students that were allowed free choice of topic. The
two-tailed P value equals 0.3578. By conventional criteria, this difference is considered to be not
statistically significant. The mean of Group A’s writing score and Group B’s writing score
equals 1.78. 95% confidence interval of this difference: From -2.20 to 5.76. Of the intermediate
values used in the calculations the t value = 0.9469. The degree of freedom (df) = 16. The
standard error of difference equaled 1.877.
Based on the overall writing score, Group A (prompted) were more successful than
Group B (free-choice) based on the Carroll County Schools Persuasive Writing Rubric.
Although not significant, the hypotheses that writing from a prompt will have a more positive
effect on first graders’ writing ability was supported. The study indicates that first graders need
to be given prompts in order to perform well on assessments geared towards a specific type of
writing (i.e. persuasive writing). Group A (prompted) were provided with quality prompts that
were more geared towards a persuasive paper. For example, students were told to convince the
principal to let them wear anything to school. Another example was for the student to convince
their teacher to let them chew gum in class. There are valid reasons for each point of view so the
papers came more easily. The students that chose their own topics, however, had to spend a
great deal of time trying to come up with an argument. For example, one student wanted to
15
convince her mother to let her eat lunch. The student did not understand that she would not have
to persuade her mother to let her eat lunch because there were no valid reasons against it. So,
Group A (prompted) were able to spend more time formulating a position while Group B (free-
choice) were busy trying to decide on a topic.
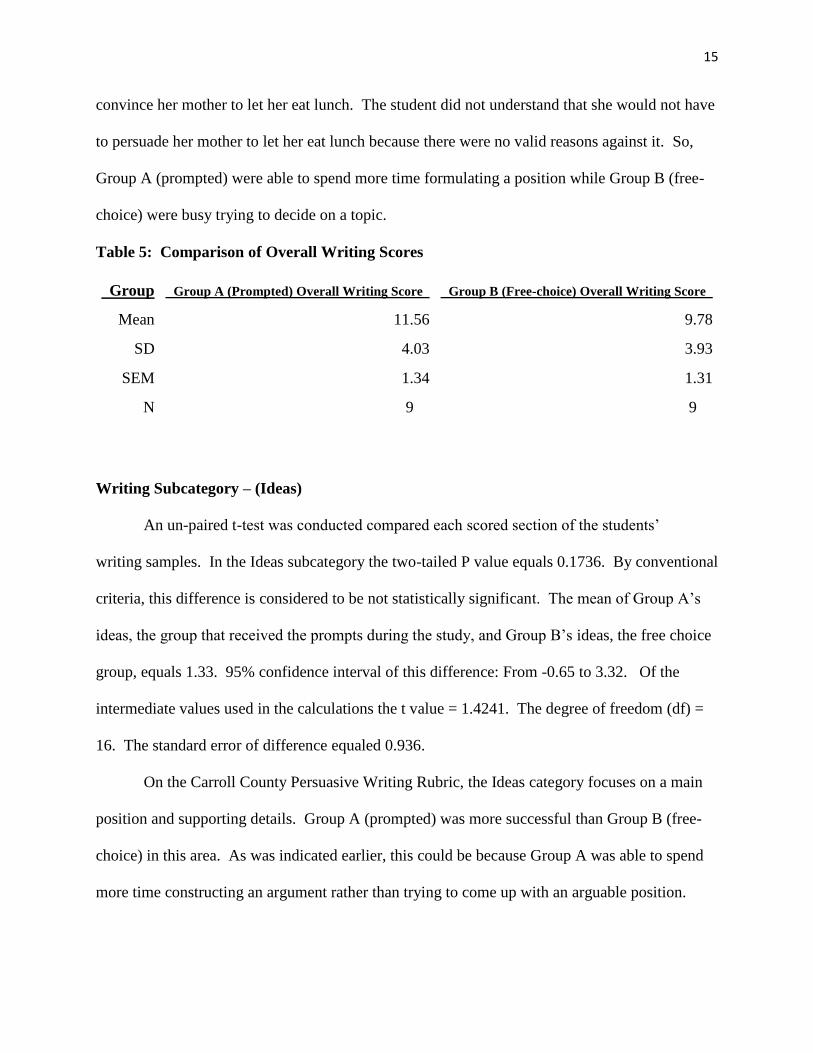
Table 5: Comparison of Overall Writing Scores
Group Group A (Prompted) Overall Writing Score Group B (Free-choice) Overall Writing Score
Mean 11.56 9.78
SD 4.03 3.93
SEM 1.34 1.31
N 9 9
Writing Subcategory – (Ideas)
An un-paired t-test was conducted compared each scored section of the students’
writing samples. In the Ideas subcategory the two-tailed P value equals 0.1736. By conventional
criteria, this difference is considered to be not statistically significant. The mean of Group A’s
ideas, the group that received the prompts during the study, and Group B’s ideas, the free choice
group, equals 1.33. 95% confidence interval of this difference: From -0.65 to 3.32. Of the
intermediate values used in the calculations the t value = 1.4241. The degree of freedom (df) =
16. The standard error of difference equaled 0.936.
On the Carroll County Persuasive Writing Rubric, the Ideas category focuses on a main
position and supporting details. Group A (prompted) was more successful than Group B (free-
choice) in this area. As was indicated earlier, this could be because Group A was able to spend
more time constructing an argument rather than trying to come up with an arguable position.
16
Students in Group A were able to spend more time formulating supporting ideas for their
position.
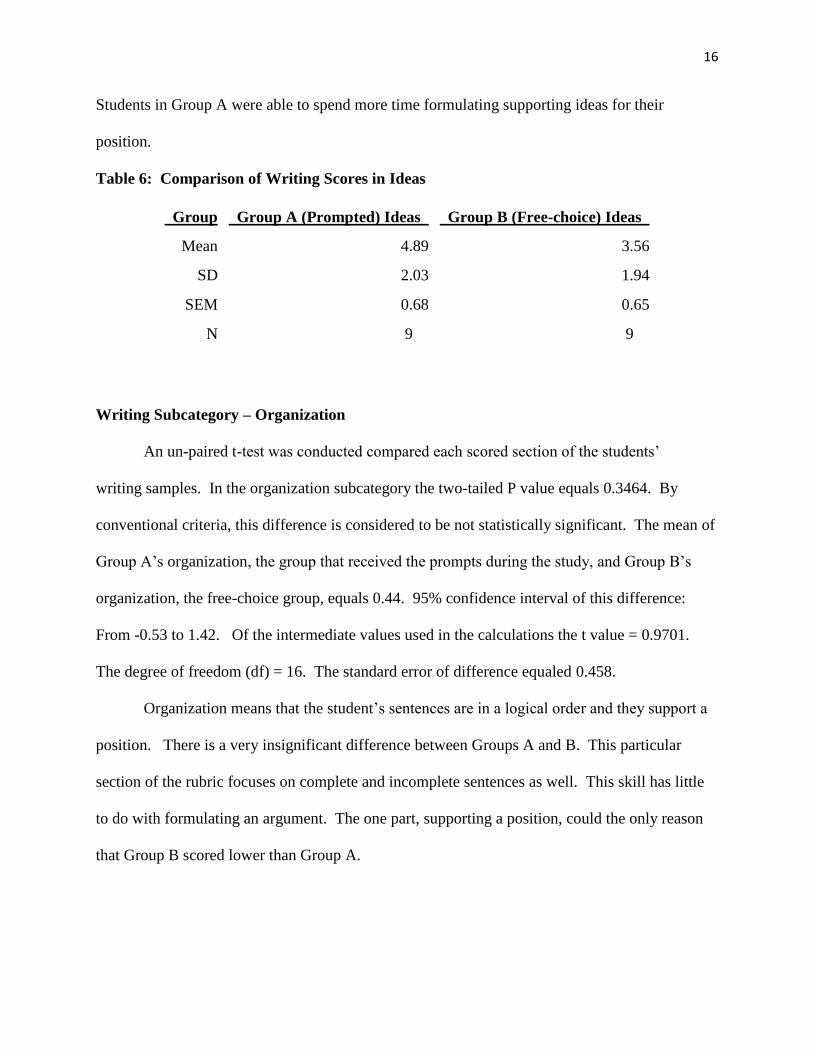
Table 6: Comparison of Writing Scores in Ideas
Group Group A (Prompted) Ideas Group B (Free-choice) Ideas
Mean 4.89 3.56
SD 2.03 1.94
SEM 0.68 0.65
N 9 9
Writing Subcategory – Organization
An un-paired t-test was conducted compared each scored section of the students’
writing samples. In the organization subcategory the two-tailed P value equals 0.3464. By
conventional criteria, this difference is considered to be not statistically significant. The mean of
Group A’s organization, the group that received the prompts during the study, and Group B’s
organization, the free-choice group, equals 0.44. 95% confidence interval of this difference:
From -0.53 to 1.42. Of the intermediate values used in the calculations the t value = 0.9701.
The degree of freedom (df) = 16. The standard error of difference equaled 0.458.
Organization means that the student’s sentences are in a logical order and they support a
position. There is a very insignificant difference between Groups A and B. This particular
section of the rubric focuses on complete and incomplete sentences as well. This skill has little
to do with formulating an argument. The one part, supporting a position, could the only reason
that Group B scored lower than Group A.

17
Table 7: Comparison of Writing Scores in Organization
Group Group A (prompted) Organization Group B (free-choice) Organization
Mean 2.56 2.11
SD 1.01 0.93
SEM 0.34 0.31
N 9 9
Writing Subcategory – (Style)
An un-paired t-test was conducted compared each scored section of the students’
writing samples. In the style subcategory the two-tailed P value equals 0.5025. By conventional
criteria, this difference is considered to be not statistically significant. The mean of Group A’s
style, the group that received the prompts during the study, and Group B’s style, the free choice
group, equals 0.22. 95% confidence interval of this difference: From -0.46 to 0.91. Of the
intermediate values used in the calculations the t value = 0.6860. The degree of freedom (df) =
16. The standard error of difference equaled 0.324.
The style of the paper means how well effectively the lead in states the point of view, the
successful use of transitions, and the use of a conclusion. This particular subcategory was one of
two where the two groups scored the closest (2.22 > 2.00). The reason they were so close is
because this is an area that focuses less on persuasive writing as a specific style of writing and
focuses more on how to write a paragraph. Up until this study began, the students in Group A
were taught how to write a paragraph exactly the same way as Group B.
18
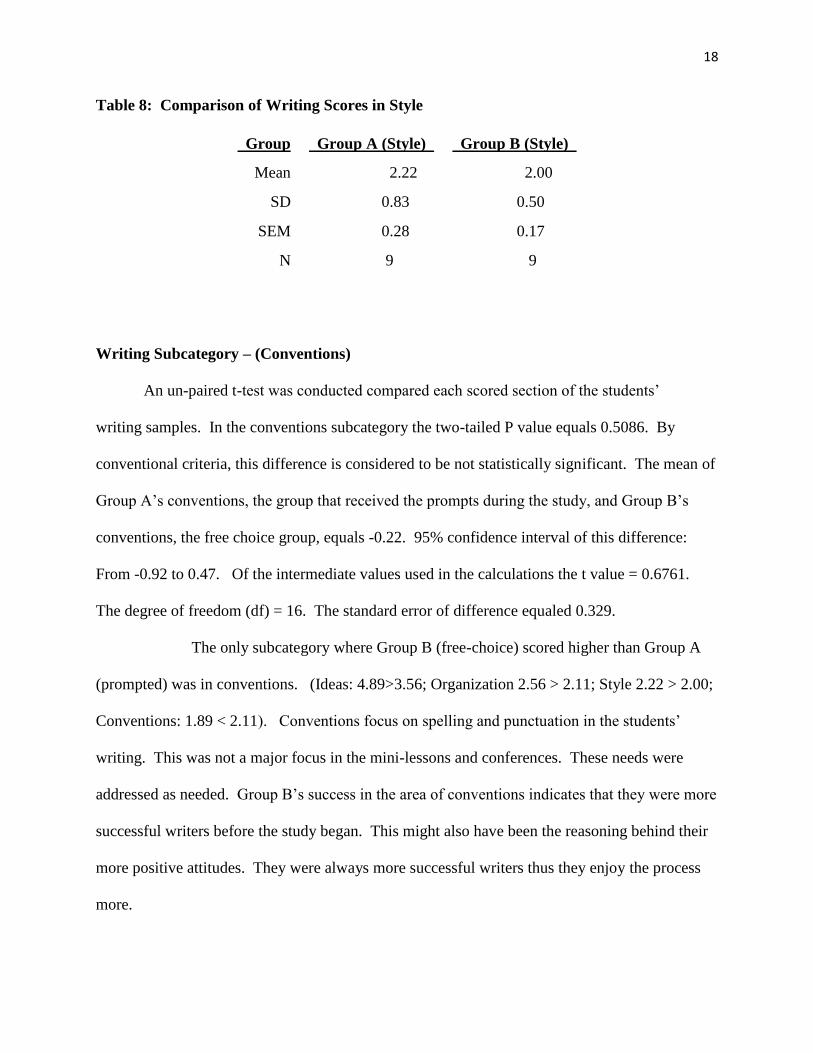
Table 8: Comparison of Writing Scores in Style
Group Group A (Style) Group B (Style)
Mean 2.22 2.00
SD 0.83 0.50
SEM 0.28 0.17
N 9 9
Writing Subcategory – (Conventions)
An un-paired t-test was conducted compared each scored section of the students’
writing samples. In the conventions subcategory the two-tailed P value equals 0.5086. By
conventional criteria, this difference is considered to be not statistically significant. The mean of
Group A’s conventions, the group that received the prompts during the study, and Group B’s
conventions, the free choice group, equals -0.22. 95% confidence interval of this difference:
From -0.92 to 0.47. Of the intermediate values used in the calculations the t value = 0.6761.
The degree of freedom (df) = 16. The standard error of difference equaled 0.329.
The only subcategory where Group B (free-choice) scored higher than Group A
(prompted) was in conventions. (Ideas: 4.89>3.56; Organization 2.56 > 2.11; Style 2.22 > 2.00;
Conventions: 1.89 < 2.11). Conventions focus on spelling and punctuation in the students’
writing. This was not a major focus in the mini-lessons and conferences. These needs were
addressed as needed. Group B’s success in the area of conventions indicates that they were more
successful writers before the study began. This might also have been the reasoning behind their
more positive attitudes. They were always more successful writers thus they enjoy the process
more.

19
Table 9: Comparison of Writing Scores in Conventions
Group Group A (prompted) Conventions Group B (free-choice) Conventions
Mean 1.89 2.11
SD 0.60 0.78
SEM 0.20 0.26
N 9 9
Discussion
The first hypothesis was that writing from a prompt would have a more positive effect on
first graders’ writing ability was proven true, but only by an insignificant margin. The p value
was 0.3578 which means that there was a possibility that these results happened through chance.
Although not significant, the hypotheses that writing from a prompt will have a more positive
effect on first graders’ writing ability was supported. The study indicates that first graders need
to be given prompts in order to perform well on assessments geared towards a specific type of
writing (i.e. persuasive writing). Group A (prompted) were provided with quality prompts that
were more geared towards a persuasive paper. The students that chose their own topics, had to
spend a great deal of time trying to come up with an argument. Group A (prompted) were able
to spend more time formulating a position while Group B (free-choice) were busy trying to
decide on an arguable topic. Due to the small number of students, the duration of the study, and
the limited writing style, these findings may not carry over into other writing scenarios.
The second hypothesis was that Writer’s Workshop would have a more positive effect on
first graders’ attitude towards writing. While the attitudes of both groups declined after the
study, the group that received free choice declined significantly less that the group that received
the prompt (Group A 16.44>14.78 versus Group B 17.89>17.22). The results show that prior to
the study, Group B (free-choice) had a more positive attitude towards writing. After the study,
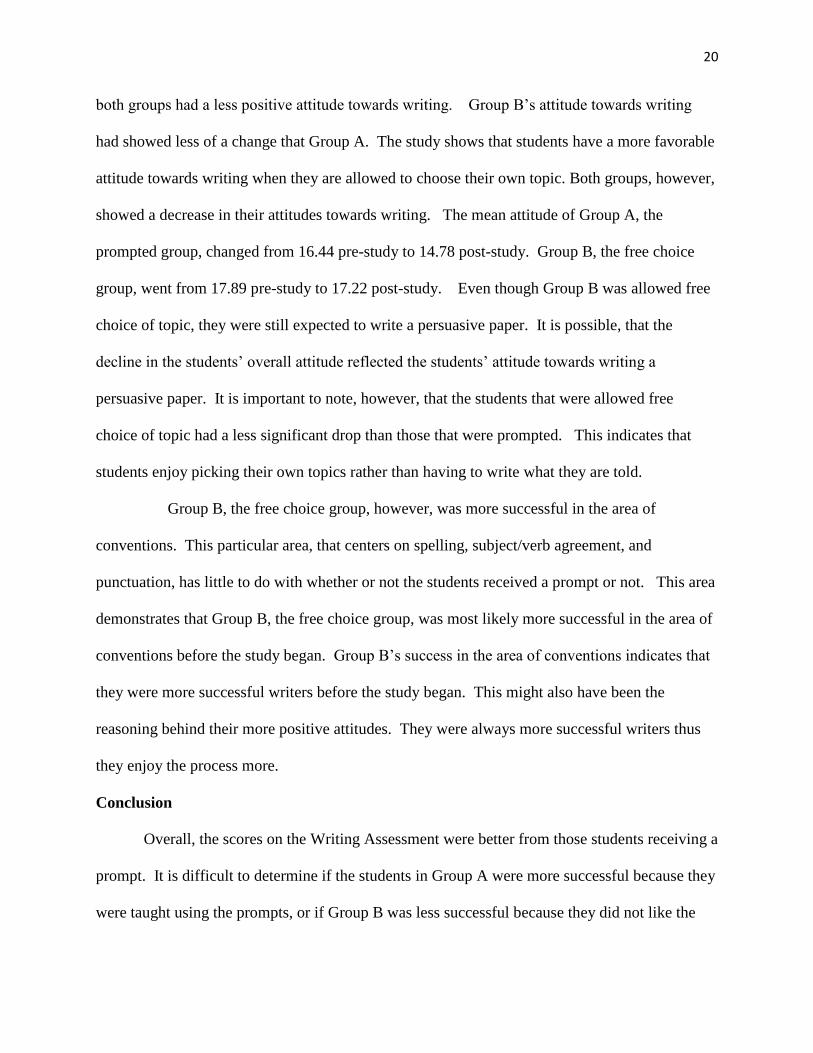
20
both groups had a less positive attitude towards writing. Group B’s attitude towards writing
had showed less of a change that Group A. The study shows that students have a more favorable
attitude towards writing when they are allowed to choose their own topic. Both groups, however,
showed a decrease in their attitudes towards writing. The mean attitude of Group A, the
prompted group, changed from 16.44 pre-study to 14.78 post-study. Group B, the free choice
group, went from 17.89 pre-study to 17.22 post-study. Even though Group B was allowed free
choice of topic, they were still expected to write a persuasive paper. It is possible, that the
decline in the students’ overall attitude reflected the students’ attitude towards writing a
persuasive paper. It is important to note, however, that the students that were allowed free
choice of topic had a less significant drop than those that were prompted. This indicates that
students enjoy picking their own topics rather than having to write what they are told.
Group B, the free choice group, however, was more successful in the area of
conventions. This particular area, that centers on spelling, subject/verb agreement, and
punctuation, has little to do with whether or not the students received a prompt or not. This area
demonstrates that Group B, the free choice group, was most likely more successful in the area of
conventions before the study began. Group B’s success in the area of conventions indicates that
they were more successful writers before the study began. This might also have been the
reasoning behind their more positive attitudes. They were always more successful writers thus
they enjoy the process more.
Conclusion
Overall, the scores on the Writing Assessment were better from those students receiving a
prompt. It is difficult to determine if the students in Group A were more successful because they
were taught using the prompts, or if Group B was less successful because they did not like the

21
prompt they were tested on (Hudson, Lane, and Mercer, 2005). It is clear, however, that when
students are given the freedom to write what they choose, they have a more positive attitude
towards writing.
The goal is to help students to become lifelong readers and writers. It is important that
they have a positive attitude towards writing in order for them to become successful. I often feel
we are teaching for the test but forgetting that we are supposed to be teaching them for life.
This study indicates that free choice writing and prompted writing both have a place in
the classroom. In order to teach a specific type of writing (i.e. persuasive, narrative,
informational) students need prompts and clear instructions. However, if we are to foster a life-
long love of writing, classroom teachers need to set aside time for students to write what they
want to write about and share with others.
Due to the small number of students participating in the study, generalizations were
difficult to determine. Also, the study was conducted in a relatively short amount of time. Had
the study taken place over the course of the entire school year more data could be collected, thus
the outcome might yield more concrete results. There is also an inherent threat in the study
because the person conducting the study was also the classroom teacher. This means that there is
the possibility of bias throughout the study. There is also a threat due to the young age of the
participants. It is difficult to get an accurate reading of attitude because of their lack of
understanding in regards to confidentiality. It is possible that the students mark what they think I
want to hear on the attitude survey. This is apparent on the few surveys that were marked with
all “Wonderful.” Plus, the survey itself was created by the classroom teacher who was also the
researcher. The survey, although piloted, was not studied independently before it was used as a
tool in this study.

22
References: Asaro, K., & Saddler, B.. (2009). Effects of Planning Instruction on a Young Writer With
Asperger Syndrome. Intervention in School and Clinic, 44(5), 268-275. Retrieved October
13, 2009, from Research Library. (Document ID: 1683529571).
Carroll County Persuasive Writing Rubric Grade 1. (2009). Retrieved November 9, 2009, from
www.carrollcountyschools.com:
http://www.carrollcountyschools.com/Portals/0/docs/CC%201st%20Grade%20Persuasive
%20Writing%20Rubric.pdf
Eitelgeorge, J.S., & Barrett, R. (2004). Multiple Continua of Writing Development in a First
Grade Classroom. Reading Research and Instruction, 43(2), 17-64. Retrieved September
19, 2009, from Research Library. (Document ID: 771893021).
Hudson, R. F., Lane, H. B., & Mercer, C. D. (2005). Writing prompts: The role of various
priming conditions on the compositional fluency of developing writers. Reading and
Writing, 18(6), 473-495. Retrieved from PDF:
http://vnweb.hwwilsonweb.com/hww/jumpstart.jhtml?recid=0bc05f7a67b1790ebc54cbffa6
11b2554dcf87ccd74e7d4f4deda691ffc5710c8fb6fcb4b2edb4db&fmt=P
Jasmine, J., & Weiner, W. (2007). The effects of writing workshop on abilities of first grade
students to become confident and independent writers. Early Childhood Education Journal,
35(2), 131-139. Retrieved from
http://search.ebscohost.com/login.aspx?direct=true&db=eric&AN=EJ775798&site=ehost-
live; http://dx.doi.org/10.1007/s10643-007-0186-3
Lin, S. C., Monroe, B. W., & Troia, G. A. (2007). Development of writing knowledge in grades
2-8: A comparison of typically developing writers and their struggling peers. Reading &
Writing Quarterly, 23(3), 207-230. Retrieved from
http://search.ebscohost.com/login.aspx?direct=true&db=eric&AN=EJ763802&site=ehost-
live; http://www.informaworld.com/openurl?genre=article&id=doi:10.1080/
10573560701277542
McKenna, M.C. & Kear, D.J. (1990). Measuring attitude toward reading: A new tool for
teachers. The Reading Teacher, 43 (9), 626-639.
Martin, L. E., Segraves, R., Thacker, S., & Young, L. (2005). The writing process: Three first
grade teachers and their students reflect on what was learned. Reading Psychology an
International Quarterly, 26(3), 235-249. Retrieved from
http://search.ebscohost.com/login.aspx?direct=true&db=eric&AN=EJ692262&site=ehost-
live; http://taylorandfrancis.metapress.com/link.asp?target=contribution&id=
U02084J66073N173
McMaster, K., Xiaoqing Du, , & Petursdottir, A.. (2009). Technical Features of Curriculum-
Based Measures for Beginning Writers. Journal of Learning Disabilities, 42(1), 41-60.
Retrieved October 13, 2009, from Research Library. (Document ID: 1670971901).
Nolen, S. B. (2007). Young children's motivation to read and write: Development in social
contexts. Cognition and Instruction, 25, 219-270. Retrieved from
http://search.ebscohost.com/login.aspx?direct=true&db=eric&AN=EJ772157&site=ehost-
live; http://www.leaonline.com/doi/abs/10.1080/07370000701301174
Rasinski, T., & Padak, N. (2009). Write Soon!. Reading Teacher, 62(7), 618-620.
http://search.ebscohost.com.
23
Rowe, D. W., Fitch, J. M., & Bass, A. S. (2001). Power, identity, and instructional stance in
writers' workshop. Language Arts, 78(5), 426. Retrieved from
http://search.ebscohost.com/login.aspx?direct=true&db=tfh&AN=4433952&site=ehost-live
Short, R. (2008). Through Their Eyes: Children's Perspectives on Writing. Journal of Reading
Education, 33(3), 15-20. Retrieved September 19, 2009, from Education Full Text
Database.
Wagner, L. , Nott J.G., & Agnew, A. T.. (2001). Teaching ideas: The nuts and bolts of teaching
first-grade writing through a journal workshop. The Reading Teacher, 55(2), 120-125.
Retrieved September 19, 2009, from Research Library. (Document ID: 84069562).

24
Elementary Writing Attitude Survey
1. How do you feel when you write a letter to a friend?
Wonderful 4
Good 3
Okay 2
Bad 1
2. How do you feel about writing at home for fun?
Wonderful 4
Good 3
Okay 2
Bad 1
3. How do you feel about getting a new notebook, journal, or diary as a gift?
Wonderful 4
Good 3
Okay 2
Bad 1
4. How do you feel about writing in your free time at school?
Wonderful 4
Good 3
Okay 2
Bad 1
5. How do you feel when it is time for writing in school?
Wonderful 4
Good 3
Okay 2
Bad 1
6. How do you feel when you have to write about what you just learned?
Wonderful 4
Good 3
Okay 2
Okay 1
.

25
Persuasive Writing Rubric
Grade 1