writing skills for level 3 statisticsnew.censusatschool.org.nz/.../uploads/2013/12/ama-rep… ·...
TRANSCRIPT
Writing skills for Level 3 Statistics Why am I teaching report writing? I'm a Maths teacher!Because you have to! Report writing is a style of writing not commonly taught by the English Department in schools. The responsibility for teaching this particular style of writing is placed with the Mathematics department. There are also other skills, such as research and word formatting which cannot be assumed as common knowledge. Traditional teaching styles which are suitable for Mathematics are generally ineffective. Some initial points:
Report writing is prescriptive. It is structured and has a distinct style separate from other types of essay-style writing.
Students must learn to be brief and to the point by using shorter sentences. The reports must be written in passive form, they should avoid the use of “I” and use
impersonal verbs. The report should be written in present tense. “The statistical analysis shows
that…”. Past tense should only be used for events in the past “These data were collected from Statistics New Zealand…”
Technical words should be thoroughly understood, for example, words such as ‘tendency’ and ‘trend’ appear interchangeable in common English but have very different interpretations in Statistics. This is also the case with ‘significant”(Adapted from Statistical Report Writing, School of Mathematics, The University of Manchester.)
The shift in teaching practiceThe change from Mathematics teaching to Statistics teaching has been profound. The traditional approach to teaching mathematics:
To the teaching of statistics:
1
Word Problem OR
Diagram Symbols Logic Rules Solution
Word Problem OR Data
Graphs Interpretation Conclusion

Statistical GraphsThe understanding and the description of statistical graphs is critical for students.
There are three commonly used statistical graphs Level 3.
Scatterplots describe RELATIONSHIPS
Comparative box and whisker plots are used to COMPARE
Time Series plots describe variables over TIME
Dots plots are used to SUMMARISE features and for bootstrapping and re-randomisation
The language used in statistics is not self-evident to students; it needs to be taught explicitly. (Francis, G. 2005 An approach to report writing in Statistics courses. IASE Satellite)
Standards requiring students to write and evaluate statistical reports at Level 3
Statistical report writing is required for; o 3.8 (Time Series)
o 3.9 (Bivariate Data)o 3.10 (Inference)
o 3.11 (Experimental Design)
The ability to write coherent statistical reports is an essential skill which has a cumulative effect for the analysis and evaluation skills for 3.12 (Statistical Reports).
ESOL students ESOL students are at both an advantage and disadvantage. They may not have the automaticity of fluent English and may also struggle with the vocabulary. They are aware of grammatical terms such as verbs, adverbs and transitions and can usually assimilate
2

new vocabulary quickly being bilingual. They also appreciate the structure and schematic nature of report writing.
You’re a language teacher now….teaching Statistical Report WritingReport writing is much like having a conversation with another person. There are structures and procedures to follow. For example when you meet someone, a typical conversation is;
Oliver: Hello!Alex: Hello! How are you! Oliver: I’m great, how are you? Alex: I’m fine thank youOliver: Cool, see you laterAlex: Will do, see ya
The same applies with report writing. There is a distinctive exposition style which should be followed. By giving the students a highly structured writing style, this relieves the pressure of wondering how to write and allows the student to focus on what they are writing.
Start by giving them an overview of the report.
Then follow on with a specific sentence-by-sentence breakdown of the paragraphs of the analysis section of the report.
Pay special attention to the introduction and conclusion, these paragraphs tie the report together.
You can put the writing frame together as a single diagram, however I found having the students construct their own frame independently was more successful.
3

Overview of the statistical reports for Level 3
Both the introduction and conclusions are the most important parts of the report. Time should be taken when teaching these particular components of the report.
4
Writing an introduction for a statistical reportAn introduction could contain the following sentences.
The introduction of a statistical report is the most important part of the report.
Being pedantic about the structure of the introduction and the report itself will save you much time in marking but will also lessen the anxiety students have about writing so they can concentrate on the interpretation and analysis of the report.
5

Writing a paragraph in a statistical reportWhile this method appears restrictive, after the student has more confidence writing reports, they can then be more flexible terms of their writing style.
Each paragraph should make specific reference to either a graph or summary statistics. This writing frame uses the SOLO taxonomy to peg the student’s discussion of the statistical graph.
The students should take the approach they are describing and explaining the statistics to a lay person with no understanding of the technical language.
Overview of a paragraph within a statistical report 10
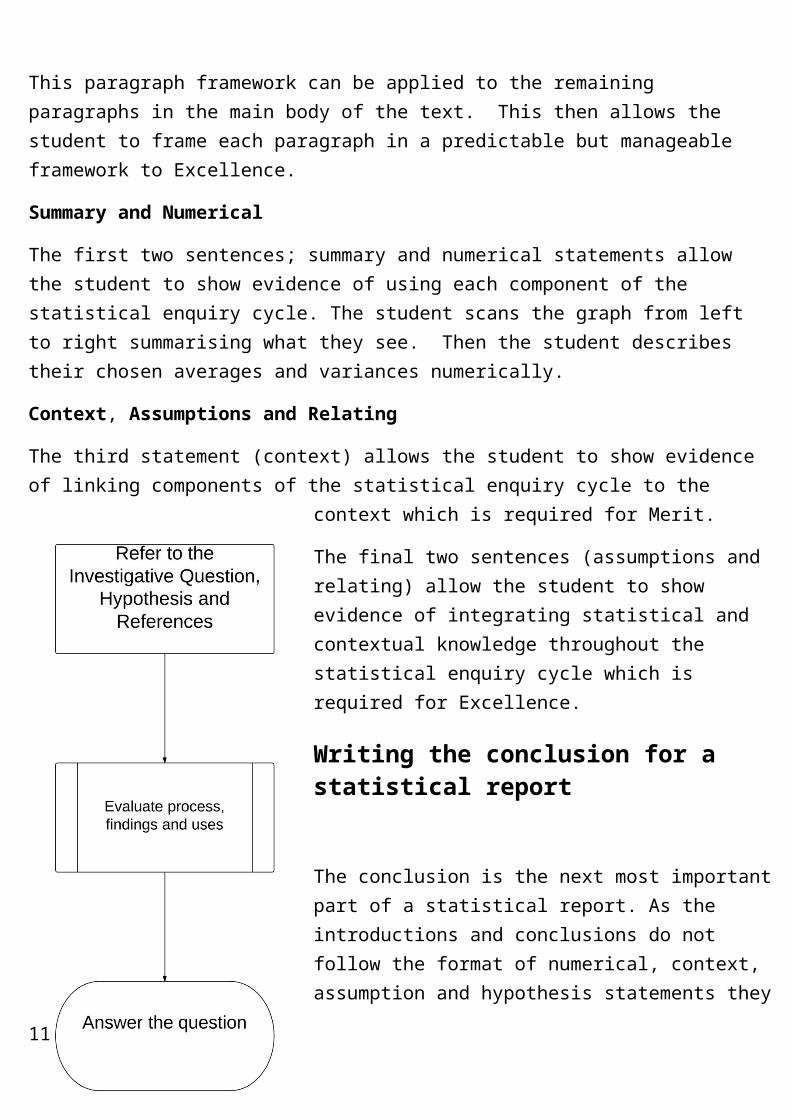
This paragraph framework can be applied to the remaining paragraphs in the main body of the text. This then allows the student to frame each paragraph in a predictable but manageable framework to Excellence.
6

Summary and Numerical
The first two sentences; summary and numerical statements allow the student to show evidence of using each component of the statistical enquiry cycle. The student scans the graph from left to right summarising what they see. Then the student describes their chosen averages and variances numerically.
Context, Assumptions and Relating
The third statement (context) allows the student to show evidence of linking components of the statistical enquiry cycle to the context which is required for Merit.
The final two sentences (assumptions and relating) allow the student to show evidence of integrating statistical and contextual knowledge throughout the statistical enquiry cycle which is required for Excellence.
Writing the conclusion for a statistical report
The conclusion is the next most important part of a statistical report. As the introductions and conclusions do not follow the format of numerical, context, assumption and hypothesis statements they will be more challenging to the students. So it may pay to spend some more time on them.
Tip. In an assessment, it is a good idea to announce during the final 15 minutes of the
assessment that the students should be concentrating on their conclusions. It is
imperative that students write a conclusion as it is an integral part showing evidence of using each part of the statistical cycle (PPDAC).
7

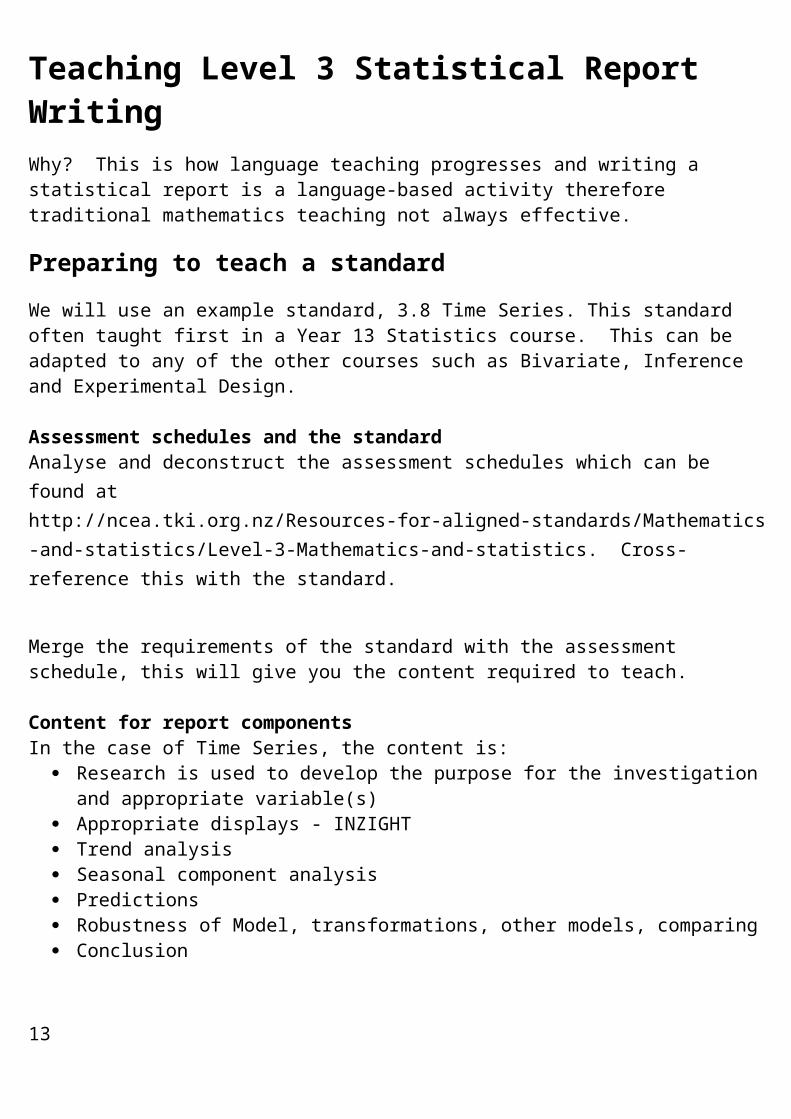
Teaching Level 3 Statistical Report WritingWhy? This is how language teaching progresses and writing a statistical report is a language-based activity therefore traditional mathematics teaching not always effective.
Preparing to teach a standardWe will use an example standard, 3.8 Time Series. This standard often taught first in a Year 13 Statistics course. This can be adapted to any of the other courses such as Bivariate, Inference and Experimental Design.
Assessment schedules and the standardAnalyse and deconstruct the assessment schedules which can be found at http://ncea.tki.org.nz/Resources-for-aligned-standards/Mathematics-and-statistics/Level-3-Mathematics-and-statistics. Cross-reference this with the standard.
Merge the requirements of the standard with the assessment schedule, this will give you the content required to teach.
Content for report componentsIn the case of Time Series, the content is:
Research is used to develop the purpose for the investigation and appropriate variable(s)
Appropriate displays - INZIGHT Trend analysis Seasonal component analysis Predictions Robustness of Model, transformations, other models, comparing Conclusion
Apply these portions of the teaching to the separate components of the report. This then leads onto a writing frame.
Report writing frame for Time Series Introduction/Abstract Discussion of the Trend component Discussion of the Seasonal component Predictions Analysis of the robustness of the model Conclusion
(Adapted from Teaching students to write about statistics, 2005, Forster, M. et al. The University of Auckland)
Examples of these can be found in the back of this booklet in pages 23, 24 and 25.
8
Report writing frame to weekly assignmentsSplit your teaching into weeks based on the report components. This must be shared with the students. An example of this is below.
Week and data sets
Topic Written Assignments
All assignments are due on Sunday before 5pm. No exceptions.
Suggested cases for reference.
1 Introduction and Research Skills
16/2/13 Sunspot Activity, 1916 -1955 Deviation in the average global
temperature (in ±C) Quarterly data for % full-time
unemployment.
2 Trend analysis 23/2/13 Monthly rainfall data for Auckland Quarterly data for % part-time
unemployment. Annual rainfall data for Auckland.
3 Seasonal Effects analysis
2/3/13 US Tobacco Consumption in Cigarette Equivalents per Adult per Year
Consumption and Price of Cigarettes Part-time Unemployment Rates Quarterly Arrivals in New Zealand (in
'000)
4 Model Predictions
9/3/13 Annual Retail Prices for Selected Items Household Data for Constructing Food
Price Marriage rates and birth rates (per 1,000
of population) for each of 3 countries from 1974 to
1993.
5 Other Models/ Conclusion
16/3/13 CPI for 5 Countries Monthly Pamphlet Sales ($)
6 ASSESSMENT
Data sets from Chance Encounters (Wild & Seber, 2000)
9

Getting organised and using ITCreate folders using Google docs, your email or traditional folders.
Google docs
Google docs are ideal and can easily be managed. Your students may be required to set up their own Google accounts but this takes seconds.
Set up folders for written reports according to the week scheduled.
Students can create documents in Google docs which can be shared with yourself for feedback.
10
I found it easier have two folders (in and out) to manage the feedback process. Once some writing had been checked, it can be moved into the other folder and the student can access the document.
A similar folder structure can be set up in your email. Below is an example of earlier folders.
Giving Feedback Giving student feedback without printing examples of their work.
Using the shortcut key Control-Alt-M allows you to insert comments on highlighted sentences.
An example of this is below.
The same shortcut key works for word documents. In Google docs the students can add their own comments and give feedback on your comments.
11

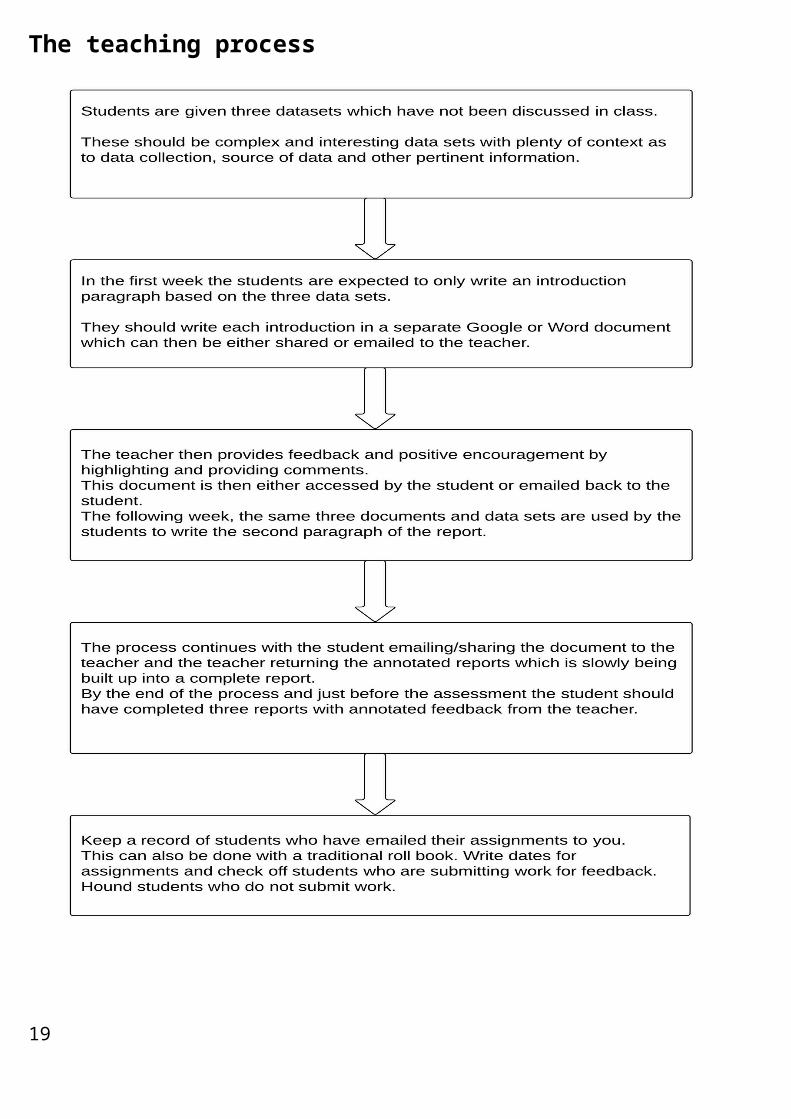
The teaching process
12
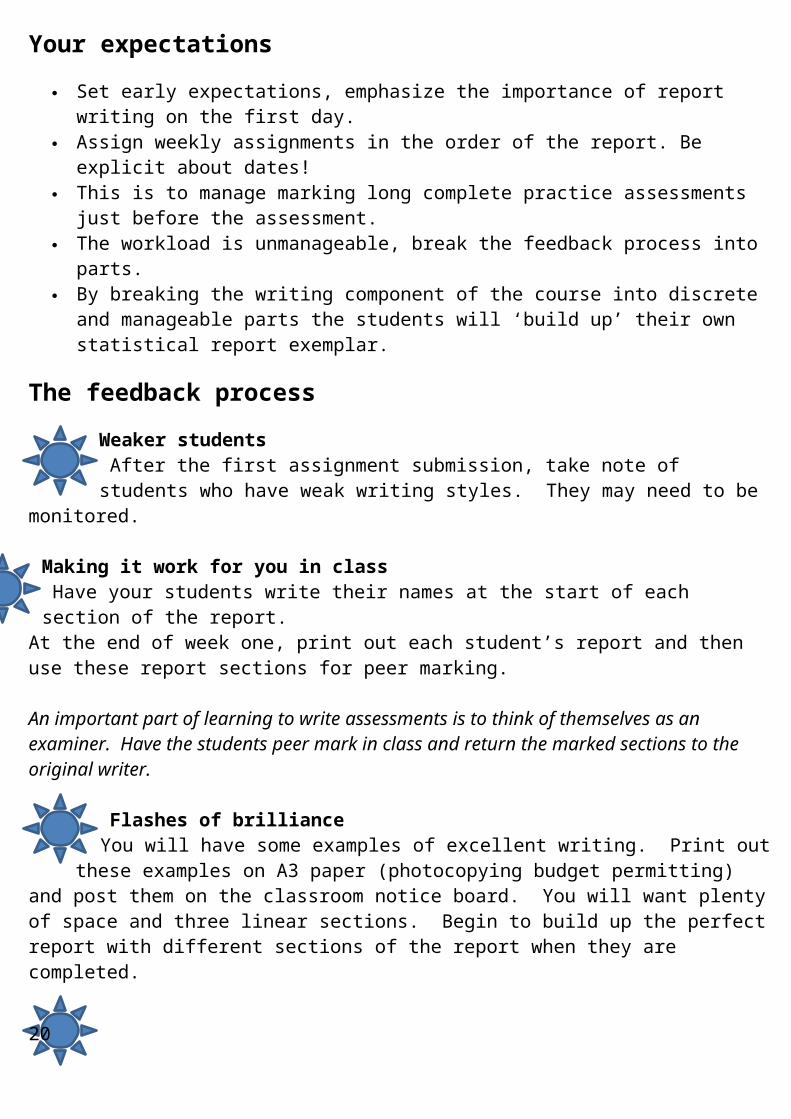
Your expectations Set early expectations, emphasize the importance of report writing on the first day. Assign weekly assignments in the order of the report. Be explicit about dates! This is to manage marking long complete practice assessments just before the
assessment. The workload is unmanageable, break the feedback process into parts. By breaking the writing component of the course into discrete and manageable parts
the students will ‘build up’ their own statistical report exemplar.
The feedback processWeaker students
After the first assignment submission, take note of students who have weak writing styles. They may need to be monitored.
Making it work for you in classHave your students write their names at the start of each section of the report.
At the end of week one, print out each student’s report and then use these report sections for peer marking.
An important part of learning to write assessments is to think of themselves as an examiner. Have the students peer mark in class and return the marked sections to the original writer.
Flashes of brillianceYou will have some examples of excellent writing. Print out these examples on
A3 paper (photocopying budget permitting) and post them on the classroom notice board. You will want plenty of space and three linear sections. Begin to build up the perfect report with different sections of the report when they are completed.
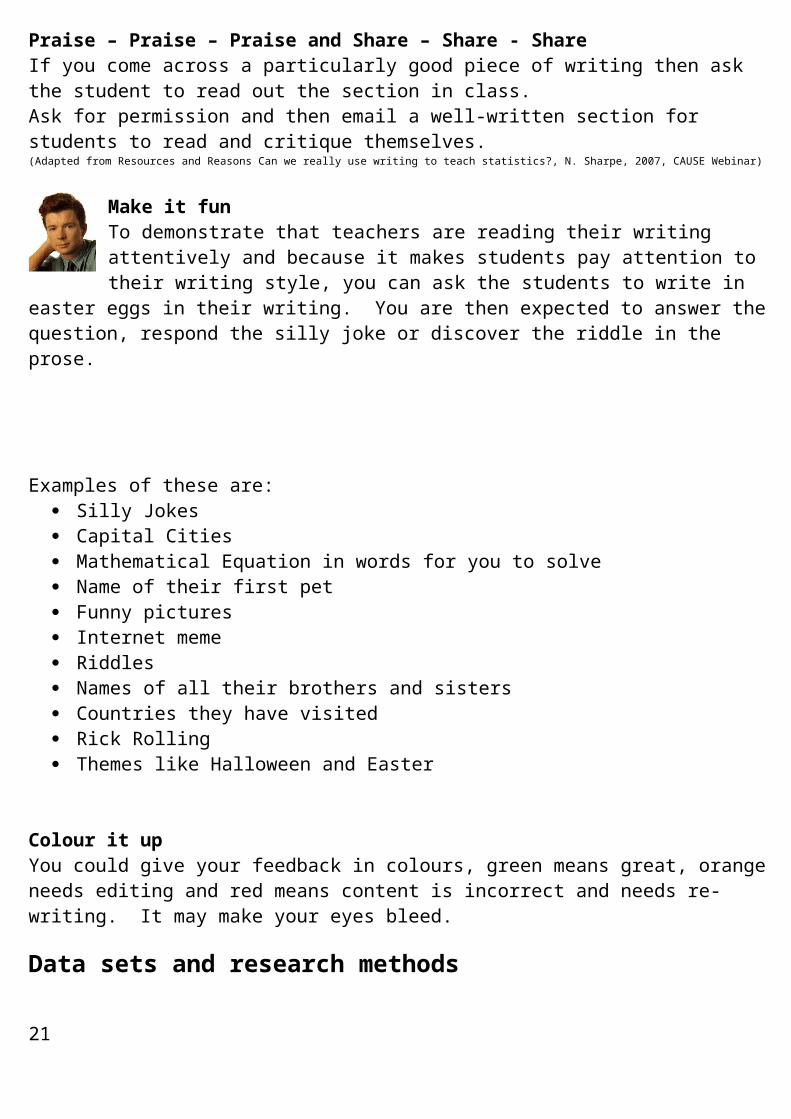
Praise – Praise – Praise and Share – Share - ShareIf you come across a particularly good piece of writing then ask the student to
read out the section in class. Ask for permission and then email a well-written section for students to read and critique themselves.(Adapted from Resources and Reasons Can we really use writing to teach statistics?, N. Sharpe, 2007, CAUSE Webinar)
Make it funTo demonstrate that teachers are reading their writing attentively and because it makes students pay attention to their writing style, you can ask the students to write in easter eggs in their writing. You are then expected to answer the
question, respond the silly joke or discover the riddle in the prose.
13

Examples of these are: Silly Jokes Capital Cities Mathematical Equation in words for you to solve Name of their first pet Funny pictures Internet meme Riddles Names of all their brothers and sisters Countries they have visited Rick Rolling Themes like Halloween and Easter
Colour it upYou could give your feedback in colours, green means great, orange needs editing and red means content is incorrect and needs re-writing. It may make your eyes bleed.
Data sets and research methodsHave a multitude of interesting data sets for teaching. There are now a plethora of data sets for the four standards. Here are a variety of web resources:
Join the New Zealand Statistics teachers Facebook group.https://www.facebook.com/groups/statsteachers/
Priscilla Allen has an excellent wiki.http://2012maths.wikispaces.com/
Team Solutions has excellent resources at the mathstatsfacilitators website.https://sites.google.com/site/mathstatsfacilitators/home
Max Riley’s brilliant website at Nayland Mathematics should be bookmarked for every Maths and Statistics teacher.http://maths.nayland.school.nz/
Rory Barrett has an excellent website, particularly for end of year revision.http://www.nceax.co.nz/
Census at Schools is the one-stop-shop for all Statistics resources, another bookmark.http://new.censusatschool.org.nz/resources/
Asking other teachers in the nzmaths professional learning forums will always get a response, you will have to sign up but is a great way to keep up-to-date.http://nzmaths.co.nz/plc
14

Statistical report writing style and notation for students
Computer outputComputer output needs some thought. The output should be edited appropriately or attached in an appendix at the end of the document. The most appropriate font to use is courier font size 10 as this allows the numbers to line up.
Figures, Plots, diagrams and tables Figures, plots, diagrams and tables should be titled and numbered, preferably given
a caption. Sections should have headings and pages should be numbered. Headings should be stand out by being underlined but should never appear as the
last line of a page. As far as possible, tables and graphs should be placed in the text near to the passage referring to them.
Level 3 ReferencingFor Year 13, it is acceptable for students to use the footnote referencing used in word documents.
APA style would be required for students at tertiary level. Examples of good referencing style but bad reference source are information quoted from here1 and another example is information from this website2.
1 http://en.wikipedia.org/wiki/Main_Page2 http://www.reddit.com/15

Expert Research skillsTeaching research skills is an integral part of the teaching process, particularly for students who are aiming for an Excellence. These skills are taught superficially in other subjects such as History and Geography.
Students will need the following skills:
1.Research Skills2.Using Google 3.Correct Referencing
Research skillsStart with Google. The most common, consistent inclination of students in general is to Google the topic, and Googling the topic is actually an acceptable starting point; however, it’s not likely to be the best place to get their information. Instead of telling students that Google is not a great way to research, tell them Google is an excellent starting point for finding overview information that you can
rely upon to be mostly correct.
Other search engines like Yahoo, Bing and Ask will produce different results than Google. You may want to explain that web-searching is based on algorithms. Each search engine has its own developed algorithm to determine the ranking of the search results.
Books are also an excellent starting point. If you have books in your school library on the research subjects, they are the best place to start. A great deal of effort was exerted to create that book in a polished, professional form that doesn’t contain factual errors. Errors in published books do happen on occasion, but the frequency of errors is significantly less than in other forms that are published quickly.
16

Magazines are the next best print publication. Even though magazines are published periodically and in a form that’s eventually discarded, they employ fact-checkers to check every statement of fact in an article. They have time before a publication goes to print, so they carefully check every detail to ensure they are correct.
Newspapers are the weakest print publication. If you are interested in current events or the unfolding of an event as it occurred, day by day, then newspapers can be useful; however, it must be understood that because they publish information so quickly, errors are made more frequently that you would maybe expect. Students
should realize this fact as they use newspapers especially for information on world events.
(Abridged with permission from www.cheekylit.com)
Watch this video: http://www.youtube.com/watch?v=BNHR6IQJGZs
Using Google to research (Or how to Google like a Boss)First of all you need to use the tabs.
1. Use the tabs
Usually you’ll see Web, Image, News, and More. Using these tabs, you can help define what kind of search you need to do.
17

2. Speelling, CapitaLisaTion and Grammer doesn’t matter
This trick is great if you happen to forget how to spell something or are not altogether sure how something is spelled. It can also be helpful when searching for obscure words. This applies to capitalization and grammar as well.
3. Use “quotation marks”
When searching for something specific, try using quotes to minimize the guesswork for Google search. When you put your search parameters in quotes, it tells the search engine to search for the whole phrase.
4. Use a hyphen - to exclude words
Sometimes you may find yourself searching for a word with an ambiguous meaning. It can be wildly helpful when finding information about something without getting information about something else.
5. Use a tilde ~ to include synonyms
Sometimes you may need to expand your search with similar terms. This is helpful when you are stuck or looking for explanations or descriptions for terms
and variables.
6. Search for multiple words at once using OR
Google search is flexible. It knows you may not find what you want by searching only a single word or phrase. By using this trick, you can search for one word or phrase along with a second word or phrase.
7. Use the asterisk wildcard
The asterisk wildcard is one of the most useful ones on the list. When you use an asterisk in a search term on Google search, it will leave a placeholder that
may be automatically filled by the search engine later.
7. Search a range of numbers with two full stops
Using two dots and a number to let Google search know you’re looking for a specific range of numbers.
8. Find a specific file with filetype.pdf/.doc/.ppt
Use the filetype command and enter the extension of any file type you can think of.
9. Maths, money and unit conversions 18
Google search can quickly and accurately convert both measurement units and currency value.
10. Use a colon to search specific sites
There may be an instance where you need to Google search for articles or content on a certain website.
11. Find sites that are similar to other sites using related:
On the other hand, you may want to examine a range of websites that are linked to your original starting point website.
12. Google search has a sense of humour too
Type into the Google Search bar the followingtilt
do a barrel roll atari breakout (in Google images) anagram
define anagram recursion binary askew zerg rush google gravity
You can also find in search settings translations for Swedish Chef (Bork Bork Bork), Elmer Fudd, Pirate and Klingon. Have fun.
You should also try clicking on ‘I’m Feeling Lucky’ randomly.
Press CTRL – ALT – A in Google Earth, also really fun.
19
Using better Websites than just Google
Referencing a statistical report.Entering references for Level 3 Statistics report writing can be done using footnotes or appendices. While APA referencing is not required, it will distinguish your report from other reports.
What to say to a student who asks “Why do you have to reference? “
It is an academic requirement. It shows the teachers that you have researched your variables and provides evidence of individual research outside the required readings. It is also unethical (and possibly illegal) to pass off the intellectual property of others as your own. Referencing is how you acknowledge the work of other people and avoid plagiarism. (University of Auckland, 2012, APA Referencing, Sixth edition, Retrieved from http://www.library.auckland.ac.nz/subject-guides/edu/docs/APAbooklet.pdf, pg3)
20
APA referencing for electronic media:
Web Pages
Felder, R. M., & Solomon, B. A. (1996). Learning styles and strategies. Retrieved from http://www2.nscu.edu/unity/lockers/users/felder/public/ILSpage.htm
Ministry of Education. (2003). Te whatu pōkeka: Kaupapa Māori assessment for learning: Early childhood exemplars. Retrieved from http://www.educate.ece.govt.nz/~/media/Educate/Files/Reference%20Downloads/TeWhatuPokeka.pdf
Nunley, K. F. (n.d.). Working with styles. Retrieved from http://www.help4teachers.com/learningstyles.htm
Wiki
Toko School. (2010). Writing [Wiki]. Retrieved June 10, 2010, from http://tokoschool.wetpaint.com/page/writing
(ibid, pg8)
21

Bivariate writing frame
22

Inference writing frame
23
Time Series writing frame
24