www.bea.gov cyclical indicators for the united states carol moylan third international seminar on...
TRANSCRIPT
www.bea.gov
Cyclical Indicators for the United States
Carol Moylan
Third International Seminar on
Early Warning and Business Cycle Indicators
Moscow, Russian Federation
November 17-19, 2010
2www.bea.gov
Introduction
The recent global financial crisis has highlighted the need for statistical agencies around the world to provide and feature up-to-date indicators that can help identify potentially harmful trends in the economy.
For the most recent global financial crisis, the U.S. national accounts did a good job of providing a timely and accurate general picture of the current state of the economy, but they did not perform as well in providing indicators of unsustainable trends in the economy.
Worked with FRB in compiling integrated economic accounts; began releasing annual estimates in 2006 and quarterly in 2010.

3www.bea.gov
Introduction
▪ In the United States, the Bureau of Economic Analysis (BEA) and other statistical organizations like Bureau of Labor Statistics, the Census Bureau, the Federal Reserve Board and The Conference Board produce a broad set of indicators to be used by U.S. policy makers
▪ Were the analytical indicators available to warn policymakers that this recession was imminent? This presentation looks at major U.S. cyclical indicators and their performance

4www.bea.gov
Cyclical indicators
▪ Prior to the development of the national accounts in the 1930’s, there was only fragmentary and sometimes conflicting data on the state of the economy.
▪ In response to this critical gap in data, the Department of Commerce worked to develop a comprehensive and consistent measure of economic activity in the United States.
▪ On November 30, the U.S. Department of Commerce will be celebrating the 75th anniversary of the beginning of U.S. national accounts statistics
5www.bea.gov
Cyclical Indicators
▪ First formal list (leading, lagging, and coincident) published in 1938 by National Bureau of Economic Research
▪ Published and maintained by: BEA, 1975-95 The Conference Board, beginning in 1996
▪ Composite indicators: Offer both strengths and weaknesses Widely monitored, but subject to skepticism As early as 1947, CI were criticized for their reliance on
trend without the understanding of underlying macroeconomic relationships and on “measurement without theory”

6www.bea.gov
Cyclical indicators
▪ Leading indicators, a few examples weekly hours in manufacturing (BLS) weekly initial claims for unemployment
insurance (DOL) monthly real manufacturers' new orders of
consumer goods and materials (CF) quarterly real residential fixed investment
(BEA from national accounts) monthly real money supply (M2) (CF)

7www.bea.gov
Example of a Leading Indicator
37
38
39
40
41
42
43
60 65 70 75 80 85 90 95 00 05 10
Average Weekly Hours - ManufacturingH
ou
rs
Source: Bureau of Labor Statistics

8www.bea.gov
Cyclical indicators
▪ US coincidence indicators real GDP real personal income less transfer payments real manufacturing and trade sales industrial production index employees on non-agricultural payrolls
▪ US lagging indicators ratio of real manufacturing and trade inventories to
real sales average duration of unemployment (in weeks) average prime rate charged by banks ratio of consumer installment credit outstanding to
personal income Change in the consumer price index for services
9www.bea.gov
Composite indicator
▪ Leading, lagging and coincident cycle indicators
▪ To trace business cycle, turning points and economic growth
▪ composite indicator is diversified in component data included with minimum duplication
▪ more reliable than individual analytical indicators
10www.bea.gov
Performance Leading up to Last Recession
▪ Traditional leading indicators did point to signs of coming recession in 2007 one year before the overall economy peaked in December 2007
▪ Information not as precise as desirable No information on:
severity beginning point
▪ Trigger points different from recent previous recessions
11www.bea.gov
New developments
▪ New integrated national accounts could provide improved understanding, household, non-financial, financial, government and external sector
▪ New groupings of cyclical indicators could provide an enhanced “message” or “story” the statistics deliver
▪ E.g. housing sector and financial sector.
12www.bea.gov
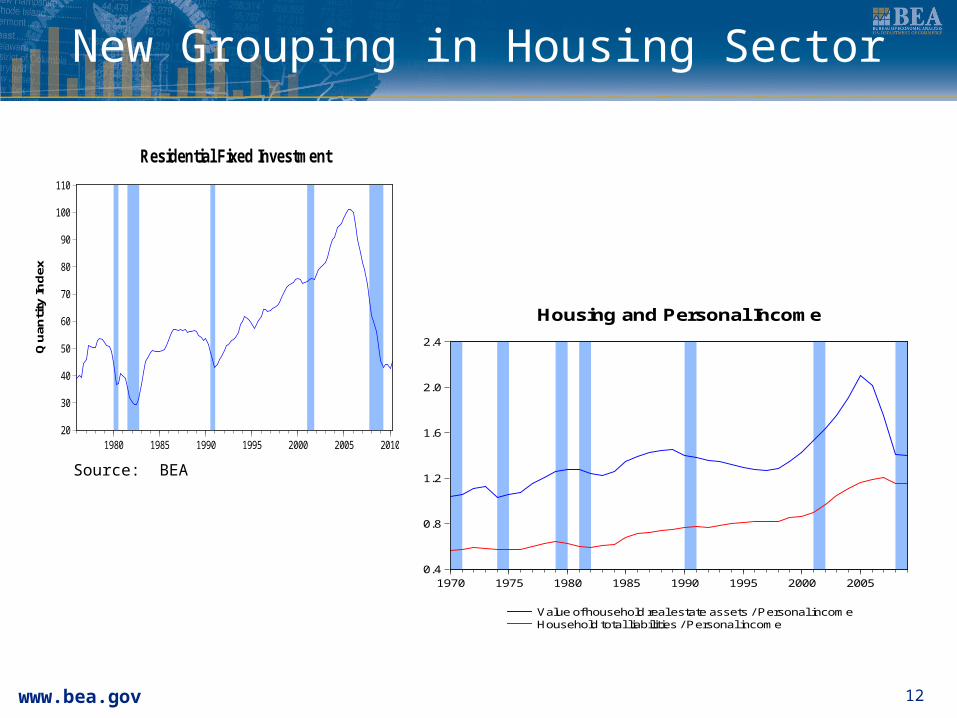
New Grouping in Housing Sector
20
30
40
50
60
70
80
90
100
110
1980 1985 1990 1995 2000 2005 2010
Residential Fixed Investment
Qu
anti
ty In
dex
0.4
0.8
1.2
1.6
2.0
2.4
1970 1975 1980 1985 1990 1995 2000 2005
Value of household real estate assets / Personal incomeHousehold total liabilities / Personal income
Housing and Personal Income
Source: BEA
13www.bea.gov
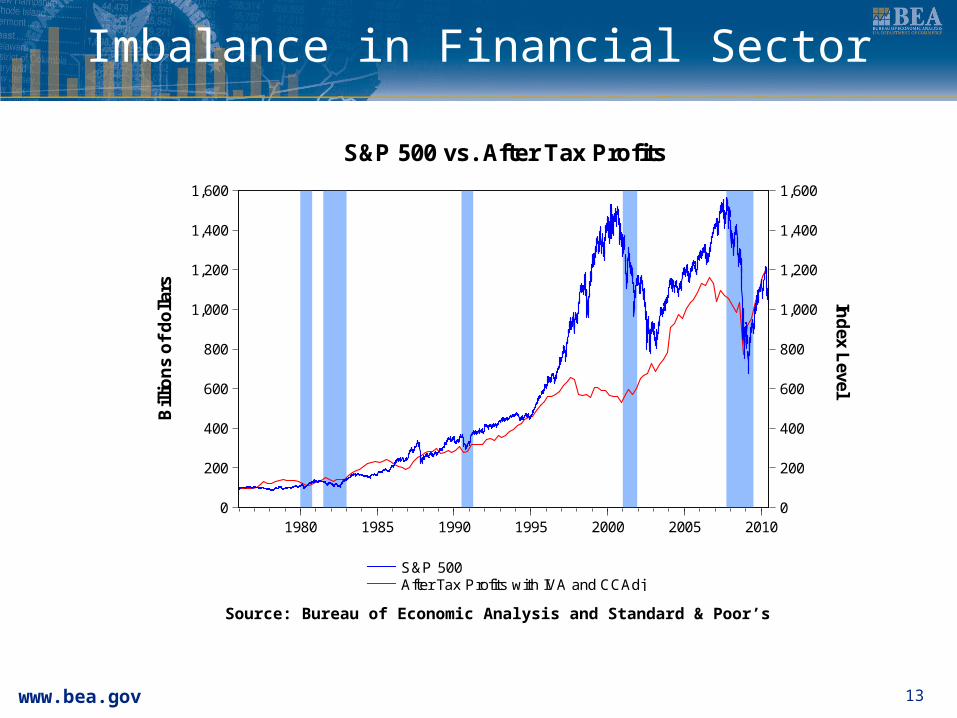
Imbalance in Financial Sector
0
200
400
600
800
1,000
1,200
1,400
1,600
0
200
400
600
800
1,000
1,200
1,400
1,600
1980 1985 1990 1995 2000 2005 2010
S&P 500After Tax Profits with IVA and CCAdj
Bill
ion
s o
f d
olla
rs
Ind
ex Level
S&P 500 vs. After Tax Profits
Source: Bureau of Economic Analysis and Standard & Poor’s

14www.bea.gov
Conclusions
▪ the United States prepares some of the most useful and detailed analytical indicators in the world.
▪ the evaluation of certain key subsectors of the economy could be improved if BEA prepared and disseminated a suite of additional cyclical indicators using the leading, lagging and coincidence properties of the indicators.