science/jc revision/7... · web viewto test water for hardness. hard water requires a lot of soap...
TRANSCRIPT

Name:
Science:Revision Booklet
1
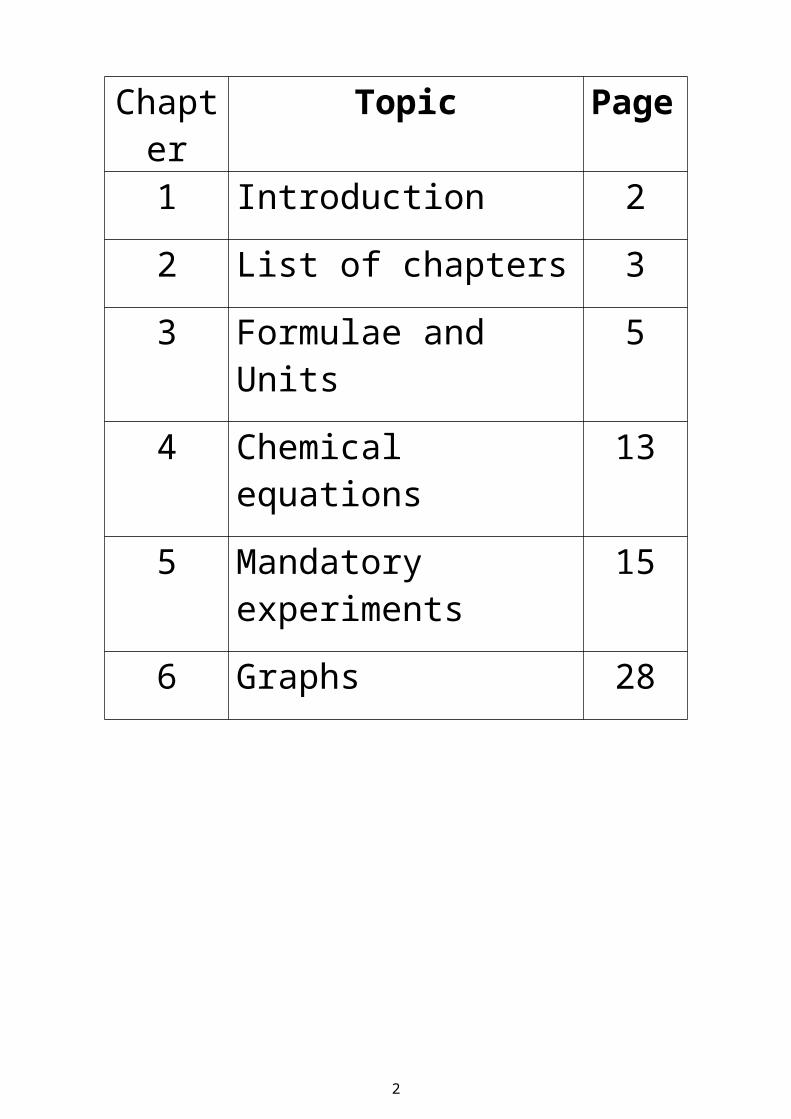
Chapter Topic Page1 Introduction 2
2 List of chapters 3
3 Formulae and Units 5
4 Chemical equations 13
5 Mandatory experiments 15
6 Graphs 28
1. Introduction
A big problem with students who wish to do well in their exams is that they simply don’t know how much they have to know!It’s a perfectly understandable complaint, and hopefully this will help.
Remember that for each chapter you will have to know:1. All definitions2. All experiments (whether mandatory or not)3. All maths problems (see separate guide to answering maths problems).4. Graph questions (see separate guide to answering graph questions).5. Any other theory
Get your friend/Mom/Dad/brother/sister to ask you the exam questions from the questions at the end of each chapter in my notes – all the solutions are there to check with.
For the experiment questions, don’t waste time writing them out fully. Sketch a quick diagram labelling all the main parts, and then write down one or two sentences summarising what you did. You can go into more detail in the exam itself – this is just to check whether or not you can remember the experiment.
Get into the habit of marking/highlighting what you don’t understand, and then either ask a friend to explain it to you, or ask me. Make sure you don’t leave it and hope that it won’t come up in the exam!Most students who get A-grades in the Leaving Cert do this a lot. I don’t think it’s just a coincidence!
Try to revise one chapter of science per night.
BTW, this took time to put together so don’t be afraid to say thank you; you would be surprised how much a few small words could be appreciated (by all teachers, not just me!).
Good luck!
2

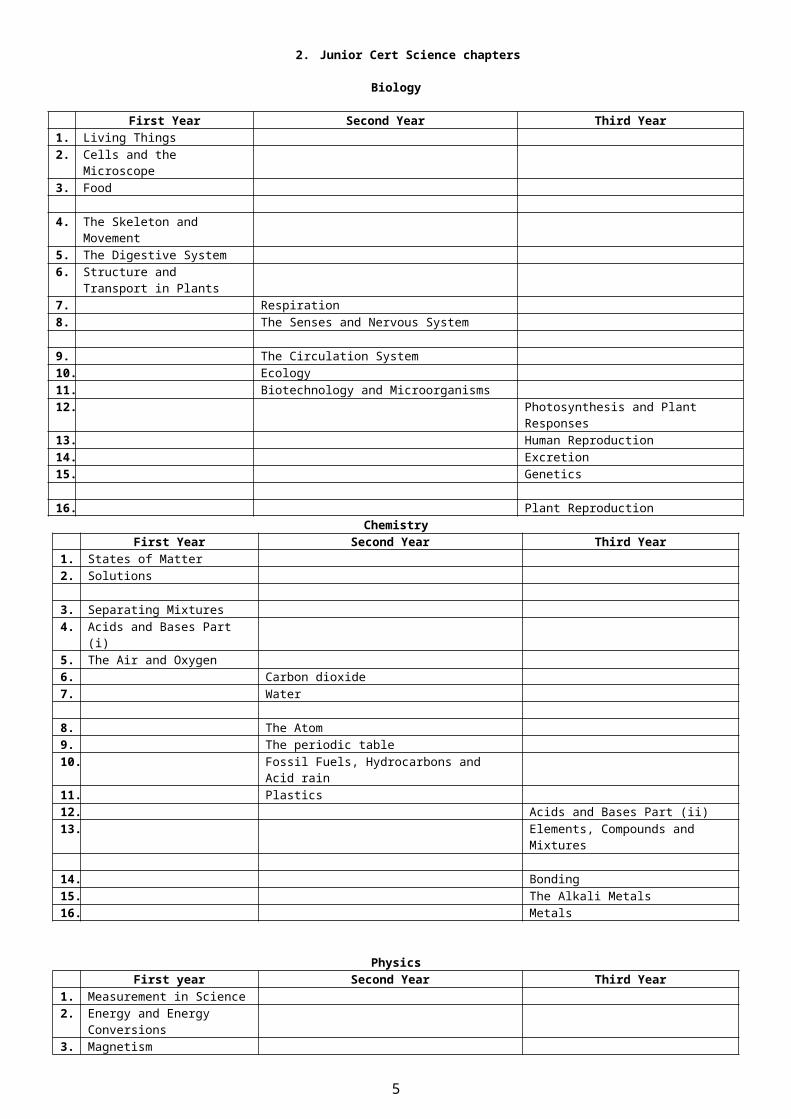
2. Junior Cert Science chapters
Biology
ChemistryFirst Year Second Year Third Year
1. States of Matter2. Solutions
3. Separating Mixtures4. Acids and Bases Part (i)5. The Air and Oxygen6. Carbon dioxide7. Water
8. The Atom9. The periodic table10. Fossil Fuels, Hydrocarbons and Acid rain11. Plastics12. Acids and Bases Part (ii)13. Elements, Compounds and Mixtures
14. Bonding15. The Alkali Metals16. Metals
PhysicsFirst year Second Year Third Year
1. Measurement in Science2. Energy and Energy Conversions3. Magnetism
4. Light5. Pressure6. Heat 7. Sound
8. Density and Flotation9. Force, Work and Power10. Centre of Gravity11. Moments12. Static Electricity13. Current Electricity14. Electricity in the Home15.16. Electronics17. Velocity and Acceleration
3
First Year Second Year Third Year1. Living Things2. Cells and the Microscope3. Food
4. The Skeleton and Movement5. The Digestive System6. Structure and Transport in Plants7. Respiration8. The Senses and Nervous System
9. The Circulation System10. Ecology11. Biotechnology and Microorganisms12. Photosynthesis and Plant Responses13. Human Reproduction14. Excretion15. Genetics
16. Plant Reproduction

4
3. Formulae and Units
Many students are turned off Physics because of the maths involved, yet you only need to be able to do ordinary level maths in order to answer all questions which will appear on the Junior Cert paper.
Some of these are in the new log-tables, but others are not so you should really try to remember all of them because it not always easy to identify the formula you need from the list in the log-tables. Practice looking for them in pages 51 – 56 (see the table at the bottom of page 2 for help).
The following are all the formulae which you need to know. The good news is that the question is very easy once you know which formula to use.
1. Area of a regular object = length × width
2. Volume of a regular object = length × width × height
3. p.57 of log tables ( = m/V)
4.
5.
6. Weight (in newtons) = Mass (in kilograms) × 10
7. p.54 of log tables (M = Fd) The Moment of a force = the force × distance (between the force and the fulcrum).
8. p.57 of log tables ( = F/A)
9. p.55 of log tables (W = Fs) Work done = Force × distance
10. p.55 of log tables (P = W/t) or
11. p.61of log tables (R = V/I) Voltage = Resistance × Current
12. The number of kilowatt-hours equals the number of kilowatts multiplied by the number of hours
kWh = kW × hours
13. p.18 of log tables
5

UnitsYou must know the units of each of the quantities listed below
Time seconds sDistance metres mVelocity / speed metres per second m/sAcceleration metres per second
squaredm/s2
Mass kilograms kgVolume metres cubed m3
Density grams per centimetre cubed
g/cm3
Weight newtons NForce newtons NPressure pascals PaWork joules JEnergy joules JPower watts WCurrent amps AVoltage volts VResistance ohms
Test yourself –what formula connects the following variables?
Page in log tablesmass volume density density =
mass/volume57
velocity time distance
change in velocity
acceleration time taken
× 10 mass weight
force moment of a force
distance
pressure force area 57
distance force work done 55
time work power 55
voltage resistance current 61
kW hrs kWhrs
Area = Volume =
Slope of a line =
6
Test yourself – complete the table below
Quantity Unit SymbolTime seconds sDistanceVelocity / speedAccelerationMassVolumeDensityWeightForcePressureWorkEnergyPowerCurrentVoltageResistance
Units Crossword
Across2. Units of work or energy. (6)4. Units of mass. (9)6. Units of power. (5)8. Units of current. (4)9. Units of area (6, 7). 11. Units of distance. (6)12. Units of potential difference (or volts). (5)Down1. Units of speed (6, 3,6). 3. Units of pressure. (7)5. Units of force. (7)7. Units of resistance. (4)10. Units of time. (7)
7

Junior Cert Science Maths Questions – some of the questions have been altered slightly from the original context.
Mass, Volume and Density1. [2008 OL] If the mass of a stone is 20 g and the volume of the stone is 10 cm3, find the density of the stone.
2. [2007 OL] A block of metal has the measurements shown on the right.The mass of the metal block is 21 g.(i) What is the volume of the block?(ii) What is the density of the block?
3. [2009 OL]The mass of a metal block is 14.7 g. It has a volume of 7 cm3.Calculate the density of the block.Give the units of density with your answer.
4. [2009]A pupil measured the volume of a potato using the items of laboratory equipment, labelled A and B as shown in the diagram.The potato had mass 175 g and volume 125 cm3.Calculate the density of the potato.Give the units of density with your answer.
Solutions1.(i) Density = Mass ÷ Volume = 20 ÷ 10= 2 g/cm3
2. (i) Volume = 2 ×1 × 5 = 10 cm3 (ii) Density = Mass ÷ Volume = 21 ÷ 10: 2.1 g/cm3
3. Density = 14.7÷7 = 2.1 g/cm3
4. Density = 175÷ 125 = 1.4 g/cm3
Velocity and Acceleration1. [2007 OL]The speed of a car is 15 m/s. What distance will the car will travel in 5 seconds?
2. [2009 OL](i) A cyclist moves 20 metres along a track in 4 seconds.Calculate the speed of the cyclist.(ii) Calculate the distance the cyclist will travel in 2 seconds.
Solutions1. Distance = speed × time = 15 × 5 = 75 m2. Speed = distance ÷ time = 20 ÷ 4 = 5 m/sDistance = speed × time = 5 × 2 = 10 m
Force1. [2009]A stone has a mass of 2 kg. What is the weight of the stone on earth? Give the unit.
Solution1. Weight = mass × 10 = 2 × 10 = 20 Newtons.
8

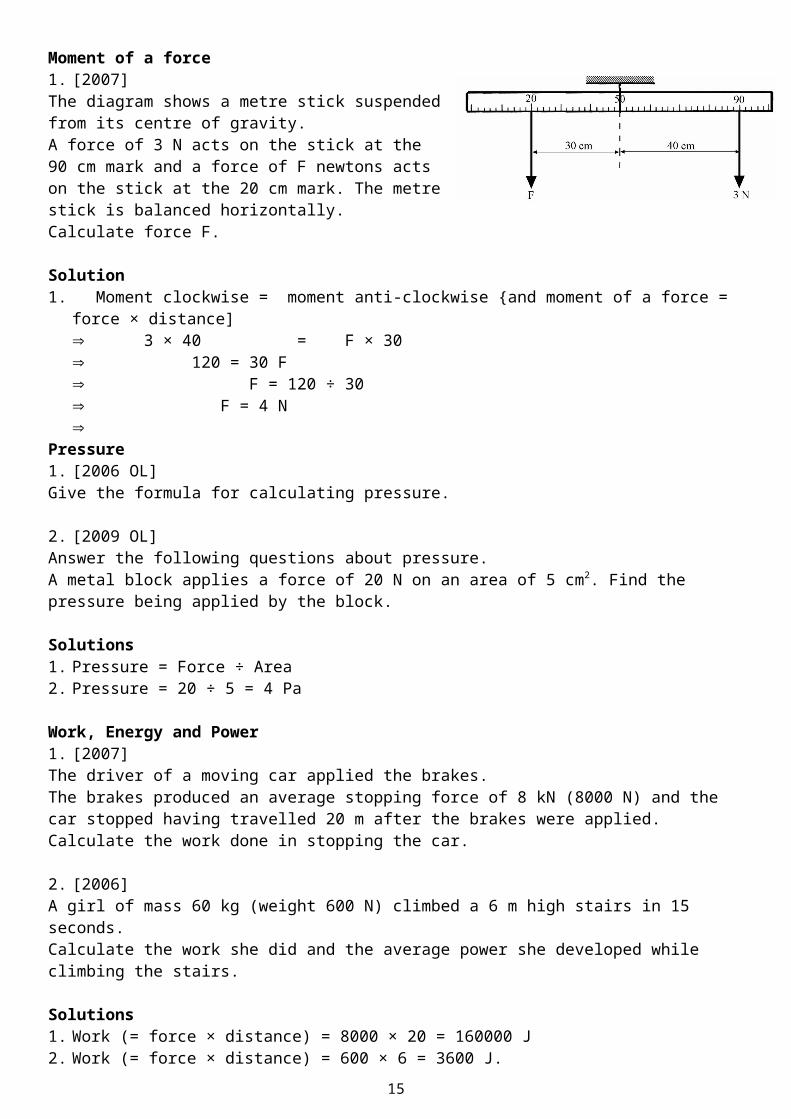
Moment of a force1. [2007]The diagram shows a metre stick suspended from its centre of gravity.A force of 3 N acts on the stick at the 90 cm mark and a force of F newtons acts on the stick at the 20 cm mark. The metre stick is balanced horizontally.Calculate force F.
Solution1. Moment clockwise = moment anti-clockwise {and moment of a force = force × distance]
3 × 40 = F × 30 120 = 30 F F = 120 ÷ 30 F = 4 N
Pressure1. [2006 OL]Give the formula for calculating pressure.
2. [2009 OL]Answer the following questions about pressure.A metal block applies a force of 20 N on an area of 5 cm2. Find the pressure being applied by the block.
Solutions1. Pressure = Force ÷ Area2. Pressure = 20 ÷ 5 = 4 Pa
Work, Energy and Power1. [2007]The driver of a moving car applied the brakes. The brakes produced an average stopping force of 8 kN (8000 N) and the car stopped having travelled 20 m after the brakes were applied. Calculate the work done in stopping the car.
2. [2006]A girl of mass 60 kg (weight 600 N) climbed a 6 m high stairs in 15 seconds.Calculate the work she did and the average power she developed while climbing the stairs.
Solutions1. Work (= force × distance) = 8000 × 20 = 160000 J2. Work (= force × distance) = 600 × 6 = 3600 J.Power (= work ÷ time) = 3600/15 = 240 W.
Electricity1. [2006]Calculate the resistance of the filament of a car headlamp when 12 V produces a current of 5 A in it.In what unit is resistance measured?
2. [2007 OL]An electric cooker has four hot plates.The total power rating of the four hot plates is 7 kW.All four are used for a total of 2 hours each day.(i) How many units of electricity (kWh) are used in 1 week?(ii) If electricity costs 11 cent per unit how much does this cost?
9

3. [2006 OL]The ESB charges for electricity at a rate of 12 cent per kW h.A tumble drier of power rating 2.5 kW is used for 2 hours each week for 4 weeks.(i) How many units of electricity are used?(ii) What is the cost, in cent, of using the tumble drier?
Solutions1. R = V ÷ I = 12÷ 5 = 2.4 Ohms (2.4 Ω)2.(i) 7 × 2 × 7 = 98 units(ii) 98 × 11 = €10.78 3.(i) 2.5 × 2 × 4 = 20 units.(ii) 20 × 12 = 240 cent
10

Practice Questions
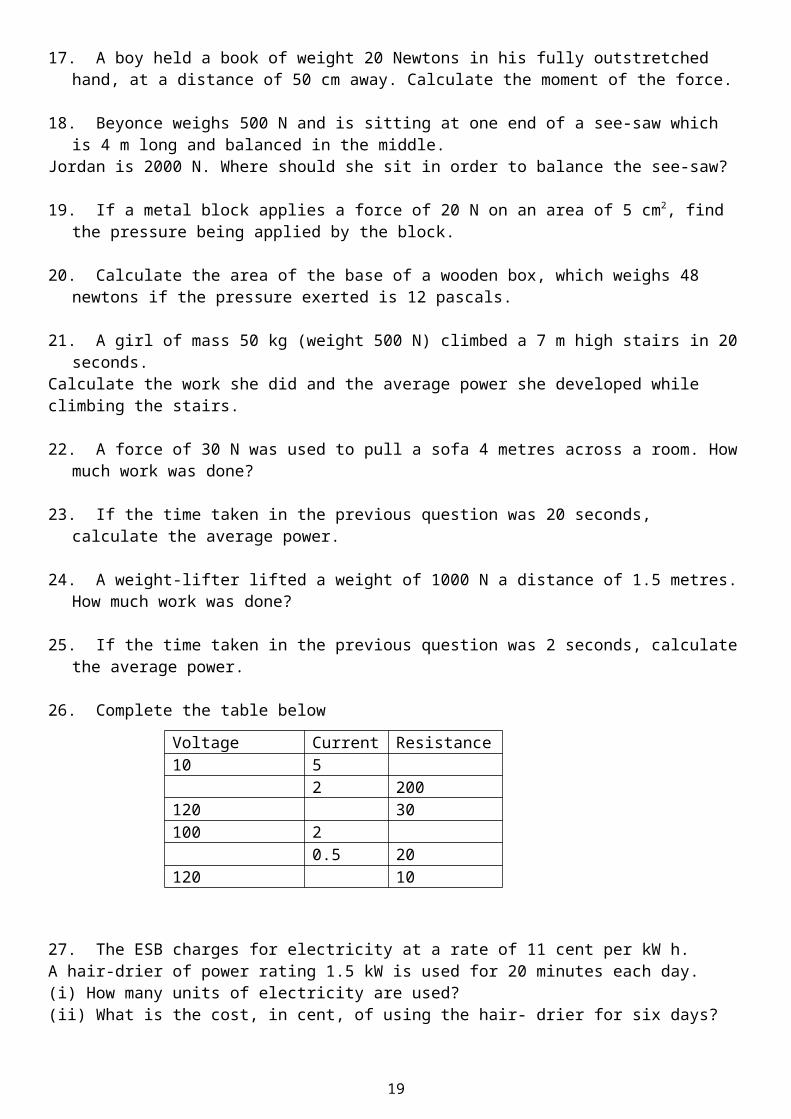
1. A stone has a mass of 120 g and a volume of 20 cm3, what is the density of the stone?
2. The density of Iron is 8 g/cm3. Calculate the mass of 6 cm3 of Iron.
3. What is the volume of an object which has a mass of 20 g and a density of 4 g/cm3?
4. Calculate the velocity of a swimmer who swims 100 m in 20 seconds.
5. Calculate the distance travelled by a teacher who runs at a speed of 5 m/s in for 3 s.
6. How long does it take a girl to travel 1000 m, if her speed is 2 m/s?
7. When a girl was a certain distance from a high cliff she shouted loudly. One and a half seconds later the echo returned from the cliff. How far was the girl from the cliff? (take the speed of sound to be 340 m/s).
8. What are the units of velocity?
9. One car can go from 0 to 100 m/s in 10 seconds while another car which can go from 100 m/s to 150 m/s in 3 seconds. Which car has the greater acceleration?
10. What are the units of acceleration?
11. Calculate the weight (in Newtons) of a bag of sugar, which has a mass of 5 kg.
12. A man has a mass of 100 kg. What is his weight?
13. Would the man weigh less or more on the moon?
14. Why does the man have a different weight on the moon?
15. A force of 75 N is used to turn the spanner in the diagram. If the distance between the force and the nut is 10 cm calculate the moment of the force.
16. A wrench 50 cm long is used by a mechanic to turn a nut. If the force he exerts on the end is 4 Newtons, calculate the moment of the force.
17. A boy held a book of weight 20 Newtons in his fully outstretched hand, at a distance of 50 cm away. Calculate the moment of the force.
18. Beyonce weighs 500 N and is sitting at one end of a see-saw which is 4 m long and balanced in the middle.
Jordan is 2000 N. Where should she sit in order to balance the see-saw?
19. If a metal block applies a force of 20 N on an area of 5 cm2, find the pressure being applied by the block.
20. Calculate the area of the base of a wooden box, which weighs 48 newtons if the pressure exerted is 12 pascals.
21. A girl of mass 50 kg (weight 500 N) climbed a 7 m high stairs in 20 seconds.Calculate the work she did and the average power she developed while climbing the stairs.
22. A force of 30 N was used to pull a sofa 4 metres across a room. How much work was done?
11

23. If the time taken in the previous question was 20 seconds, calculate the average power.
24. A weight-lifter lifted a weight of 1000 N a distance of 1.5 metres. How much work was done?
25. If the time taken in the previous question was 2 seconds, calculate the average power.
26. Complete the table below
27. The ESB charges for electricity at a rate of 11 cent per kW h.A hair-drier of power rating 1.5 kW is used for 20 minutes each day.(i) How many units of electricity are used?(ii) What is the cost, in cent, of using the hair- drier for six days?
12
Voltage Current Resistance10 5
2 200120 30100 2
0.5 20120 10
Watts(W)
kilowatts(kW)
Hours(Hr)
kWhr Cost(12 cent per unit)
50 0.05 60 3 2420 51000 1 day500 10 minutes60 1 week

4. Chemical Equations
Reactions of the alkali metals with air
Alkali metals react with air and quickly lose their shine to form a metal oxide.
Reactions of the alkali metals with water(Word equation only is necessary)
Alkali metals react vigorously with water.
Reaction between zinc and HCl
Zn + 2HCl → ZnCl2 + H2
13
metal + oxygen → metal oxide
metal + water → metal hydroxide + hydrogen
Zinc + hydrochloric acid → zinc chloride + hydrogen
lithiumlithium + oxygen → lithium oxide
4Li + O2 → 2Li2O
sodiumsodium + oxygen → sodium oxide
4Na + O2 → 2Na2O
lithiumlithium + water → lithium hydroxide + hydrogen
sodiumsodium + water → sodium hydroxide + hydrogen

NeutralisationThe properties of an acid are counteracted or neutralised by a base; this type of reaction is called a neutralisation reaction.
Sodium and calcium are examples of metals
General formula to represent neutralisation reaction:
Example 1hydrochloric acid + sodium hydroxide → sodium chloride + WaterHCL + NaOH → NaCl + H2O
Example 2hydrochloric acid + calcium carbonate → calcium chloride + CO2 + Water2HCl + CaCO3 → CaCl2 + CO2 + H2O
Preparation of oxygen
H2O2 O2 + H2OManganese dioxide (MnO2) is added in as a catalyst (to speed up the reaction)
Preparation of carbon dioxide
CaCO3 + 2HCl → CaCl2 + H2O + CO2
Limewater and carbon dioxide
Ca(OH)2 + CO2 → CaCO3 + H2O
Aerobic respiration
Photosynthesis
14
When an acid reacts with a base the hydrogen in the acid is replaced by a metal and a salt is formed
Acid + Base → Salt + Water
Hydrogen peroxide oxygen + water
Calcium carbonate + Hydrochloric acid à Calcium Chloride + Water + Carbon Dioxide (Marble chips)
Limewater + carbon dioxide → calcium carbonate + water
Glucose + oxygen → Energy + carbon dioxide + water
Carbon dioxide + water (+ sunlight and chlorophyll) → glucose + oxygen
Junior Cert Mandatory Experiments
The best way to revise this section is to test yourself on your ability to draw a diagram for each experiment, then state what the result should be in each case.
Biology: pages 15 - 17OB3 Qualitative food tests for starch, reducing sugar, protein and fat. OB5 Investigate the conversion of chemical energy in food to heat energy.OB8 Investigate the action of amylase on starch; identify the substrate, product and enzyme.OB11 Carry out qualitative tests to compare the carbon dioxide levels of inhaled and exhaled air.OB39 Investigate the variety of living things by direct observation of animals and plants in their environment;
classify living organisms as plants or animals, and animals as vertebrates or invertebrates.OB44 Prepare a slide from plant tissue and sketch the cells under magnification.OB49 Show that starch is produced by a photo-synthesising plant.OB58 Investigate the conditions necessary for germinationOB59 Study a local habitat, using appropriate instruments and simple keys to show the variety and distribution
of named organisms.OB65 Investigate the presence of micro-organisms in air and soil.
Chemistry: Pages 18 - 21OC2 Separate mixtures using a variety of techniques: filtration, evaporation, distillation and paper
chromatography. OC17 Grow crystals using alum or copper sulphate.OC19 Investigate the pH of a variety of materials using the pH scaleOC22 Show that approximately one fifth of the air is oxygen;
Show that there is CO2 and water vapour in air. OC24 Prepare a sample of oxygen by decomposing H2O2 using MnO2 as a catalyst. OC27 Prepare carbon dioxide and show that it does not support combustion. OC30 Conduct a qualitative experiment to detect the presence of dissolved solids in water samples, and test
water for hardness (soap test). OC38 Titrate HCl against NaOH, and prepare a sample of NaCl. OC46 Carry out an experiment to demonstrate that oxygen and water are necessary for rusting. OC51 Investigate the reaction between zinc and HCl, and test for hydrogen.
Physics: 22 - 26OP2 Measure the mass and volume of a variety of solids and liquids and hence determine their densities. OP6 Investigate the relationship between the extension of a spring and the applied force. OP20
Identify different forms of energy and carry out simple experiments to show the following energy conversions: (a) chemical to electrical to heat energy (b) electrical to magnetic to kinetic energy (c) light to electric to kinetic energy.
OP23
Investigate and describe the expansion of solids, liquids and gases when heated, and contraction when cooled.
OP31
Carry out simple experiments to show the transfer of heat energy by conduction, convection and radiation; investigate conduction and convection in water.
OP34
Show that light travels in straight lines.
OP38
Investigate the reflection of light by plane mirrors, and illustrate this using ray diagrams; demonstrate and explain the operation of a simple periscope.
OP46
Plot the magnetic field of a bar magnet.
OP49
Test electrical conduction in a variety of materials, and classify each material as a conductor or insulator.
OP5 Set up a simple electric circuit; use appropriate instruments to measure current, potential difference
15

0 (voltage) and resistance, and establish the relationship between them.
16

Biology ExperimentsOB3 Qualitative food tests for starch, reducing sugar, protein and fat.
Food Tested Procedure / Chemicals Used Positive ResultStarch Add iodine Turns blue-black
Reducing sugar e.g. glucose Add Benedict’s solution and heat Turns brick-red
Fat Rub food on brown paper Translucent Stain
Protein Add sodium hydroxide and then copper sulfate
Turns purple
OB5 Investigate the conversion of chemical energy in food to heat energy.
Procedure1. Pour water into a test-tube and note the temperature.2. Place a burning cream-cracker or peanut under the test-tube.3. Leave for a minute.4. Take the temperature of the water again.ResultThe temperature of the water rises as a result of gaining energy from the burning peanut.
OB8 Investigate the action of amylase on starch; identify the substrate, product and enzyme.
Procedure:1. Add some saliva (which contains the amylase enzyme) to a starch solution which is in a test tube.2. Confirm beforehand that the substrate is starch by adding iodine to it – it should turn blue/black.3. Heat in a water bath at 37 0C for 10 minutes. 4. The starch should now be converted to a simple sugar product called maltose so we need to test for this.Add some Benedict’s solution and place in boiling water for a few minutes.ResultThe contents of the test-tube should turn red, indicating that sugar is present.
17

OB11 Carry out qualitative tests to compare the carbon dioxide levels of inhaled and exhaled air.Procedure1. Suck air in through position A in Test tube A.Result: it takes a long time for the limewater to go milky.2. Replace the limewater and this time exhale air through the
top of the tube as shown in Test tube BResult: the limewater goes milky quickly.ConclusionThere is more carbon dioxide in exhaled air.
OB39 Investigate the variety of living things by direct observation of animals and plants in their environment; classify living organisms as plants or animals, and animals as vertebrates or invertebrates.
Procedure1. Pick a habitat (e.g. a hedge) and identify as many plants and animals as you can.2. Record your results in a table – have separate columns for plants, vertebrate animals and invertebrate
animals.
OB44 Prepare a slide from plant tissue and sketch the cells under magnification.
Procedure1. Place a drop of iodine onto a clean glass slide (iodine is used to ‘stain’ a cell and make it easier to see).2. Cut an onion and remove a thin layer of inner cells (called the ‘tissue’). 3. Place it on the slide and place a cover slip on top. 4. Place the glass slide on the stage and secure with clips.5. Watch from the side and turn the coarse focus wheel so that the objective lens is as close to the stage as
possible.6. Put your eye to the eyepiece and gently turn the fine focus wheel the opposite way to sharpen the image.
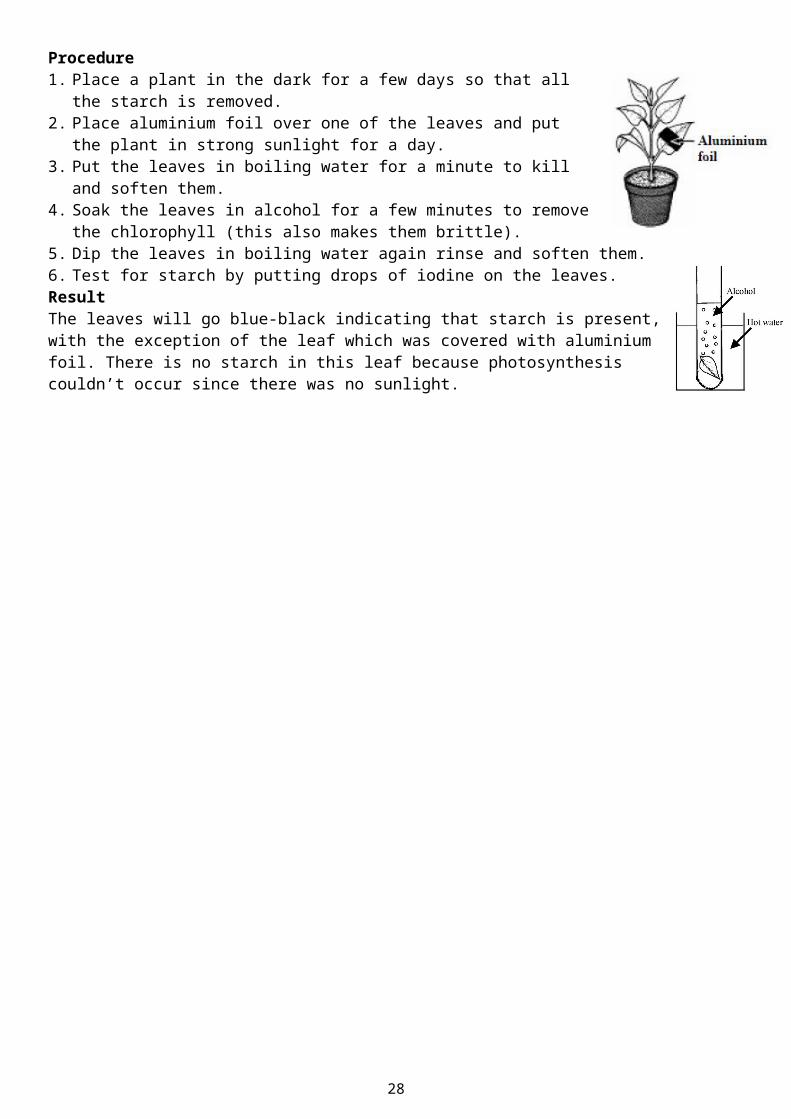
OB49 Show that starch is produced by a photo-synthesising plant.
Procedure1. Place a plant in the dark for a few days so that all the starch is removed.2. Place aluminium foil over one of the leaves and put the plant in strong sunlight
for a day.3. Put the leaves in boiling water for a minute to kill and soften them.4. Soak the leaves in alcohol for a few minutes to remove the chlorophyll (this also
makes them brittle).5. Dip the leaves in boiling water again rinse and soften them.6. Test for starch by putting drops of iodine on the leaves.ResultThe leaves will go blue-black indicating that starch is present, with the exception of the leaf which was covered with aluminium foil. There is no starch in this leaf because photosynthesis couldn’t occur since there was no sunlight.
18
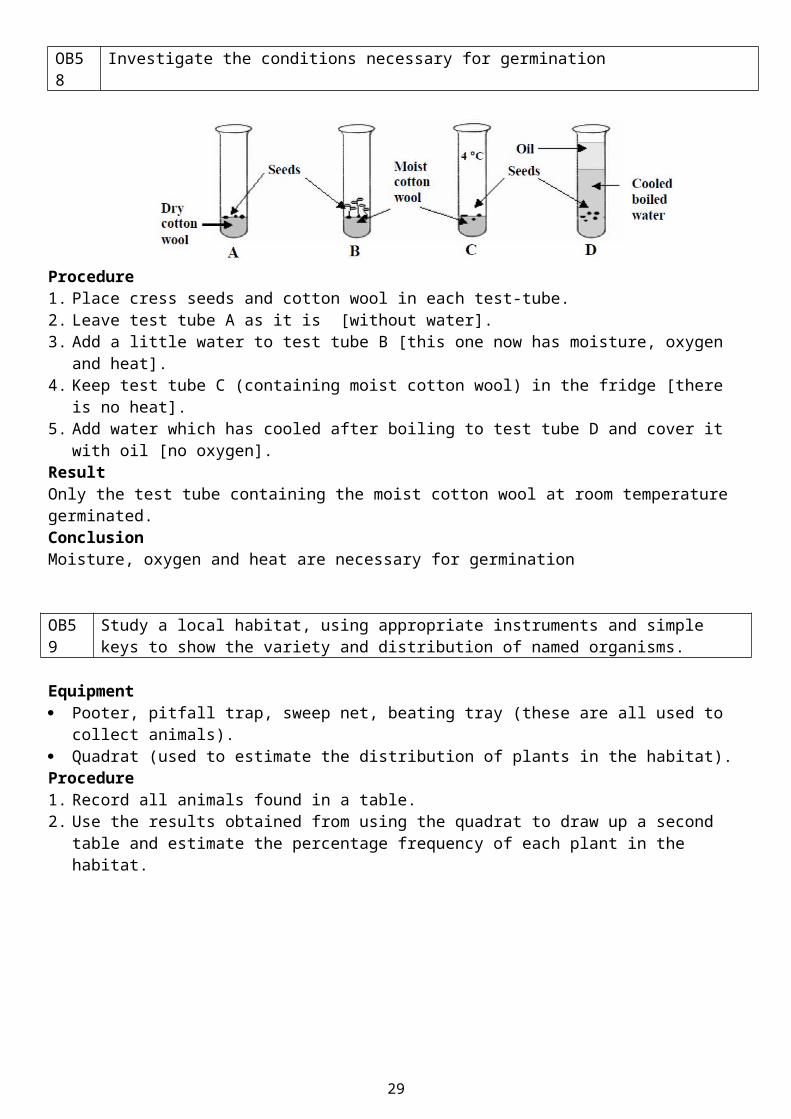
OB58 Investigate the conditions necessary for germination
Procedure1. Place cress seeds
and cotton wool in each test-tube.2. Leave test tube A as it is [without water].3. Add a little water to test tube B [this one now has moisture, oxygen and heat].4. Keep test tube C (containing moist cotton wool) in the fridge [there is no heat].5. Add water which has cooled after boiling to test tube D and cover it with oil [no oxygen].ResultOnly the test tube containing the moist cotton wool at room temperature germinated.ConclusionMoisture, oxygen and heat are necessary for germination
OB59 Study a local habitat, using appropriate instruments and simple keys to show the variety and distribution of named organisms.
Equipment Pooter, pitfall trap, sweep net, beating tray (these are all used to collect animals). Quadrat (used to estimate the distribution of plants in the habitat).Procedure1. Record all animals found in a table.2. Use the results obtained from using the quadrat to draw up a second table and estimate the percentage
frequency of each plant in the habitat.
OB65 Investigate the presence of micro-organisms in air and soil.
Equipment: Petri dishes containing a layer of sterile (uncontaminated) nutrient called agar (the agar acts as a food source). Procedure1. Add some soil to one of the petri dishes and leave another sterile as
a control.2. Leave both for a few days in a warm environment.Result:After a few days bacteria colonies can be seen in the petri dish which had soil but not in the sterile dish. Shiny dots correspond to bacterial colonies while fluffy growth corresponds to fungi.
19

Chemistry Experiments
OC2 Separate mixtures using a variety of techniques: filtration, evaporation, distillation and paper chromatography.
FiltrationEquipmentA solution of soil and water, filter paper, filter funnel, conical flask and beaker.Procedure:Carefully pour the solution into the conical flask – the water will flow through, leaving just the soil behind.Note that the disadvantage with this method is that you don’t get to keep the liquid – see the distillation experiment for a solution to this.
EvaporationEquipment:Evaporating dish, salt solutionProcedure: Simply heat the water and salt solution – the water will evaporate, leaving just the salt behind. The problem with simple evaporation is that you lose the liquid.
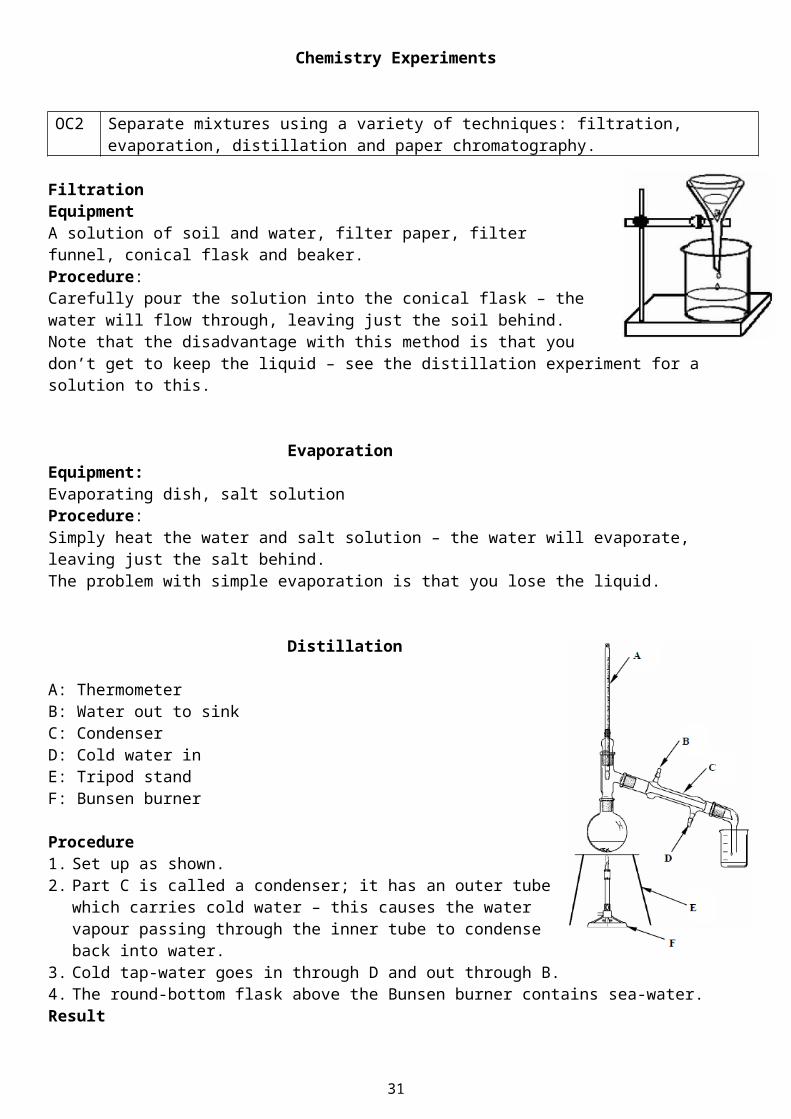
Distillation
A: Thermometer B: Water out to sink C: Condenser D: Cold water in E: Tripod stand F: Bunsen burner
Procedure1. Set up as shown.2. Part C is called a condenser; it has an outer tube which carries cold water –
this causes the water vapour passing through the inner tube to condense back into water.
3. Cold tap-water goes in through D and out through B.4. The round-bottom flask above the Bunsen burner contains sea-water.ResultThe water evaporates from the round-bottom flask, travels through the condenser where it condenses and flows into flask B as pure water.
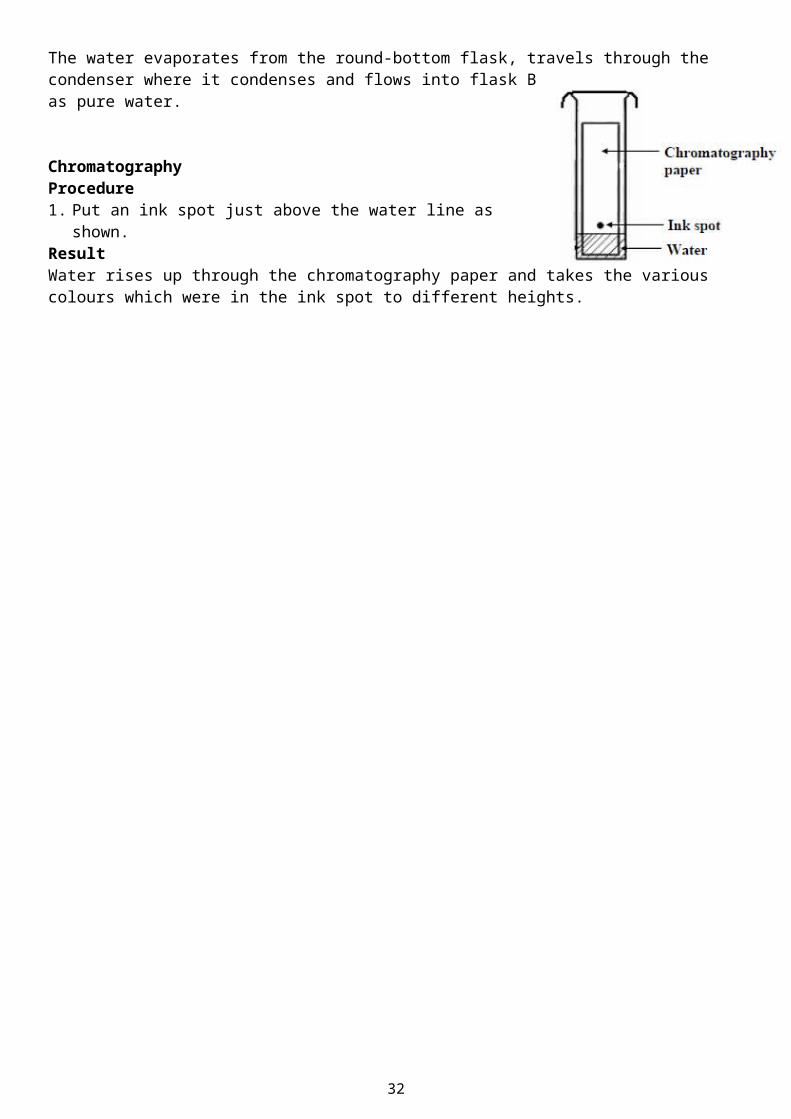
ChromatographyProcedure1. Put an ink spot just above the water line as shown.ResultWater rises up through the chromatography paper and takes the various colours which were in the ink spot to different heights.
20

OC17 Grow crystals using alum or copper sulphate.Procedure:1. Keep adding copper to hot water until no more will dissolve2. Filter the mixture (see the filtration experiment) and pour the liquid (called the filtrate) into an
evaporating dish.3. Allow to cool slowly.Result:Crystals begin to grow
OC19 Investigate the pH of a variety of materials using the pH scale
Apparatus: Rack of test tubes, everyday acids and bases.Acidic: citric acid (e.g. lemon juice, orange juice) apples, sour milk, vinegar, fizzy drinks and tea. Basic: tooth paste, lime water, bread soda, toothpaste, window cleaner and caustic soda.Procedure:1. Put substances in test tubes (they must be dissolved in water if
they are not a liquid).2. Pour in a few drops of universal indicator and shake well (the
colour will change according to how acidic or basic the substance is).3. Use the pH scale to write up results.
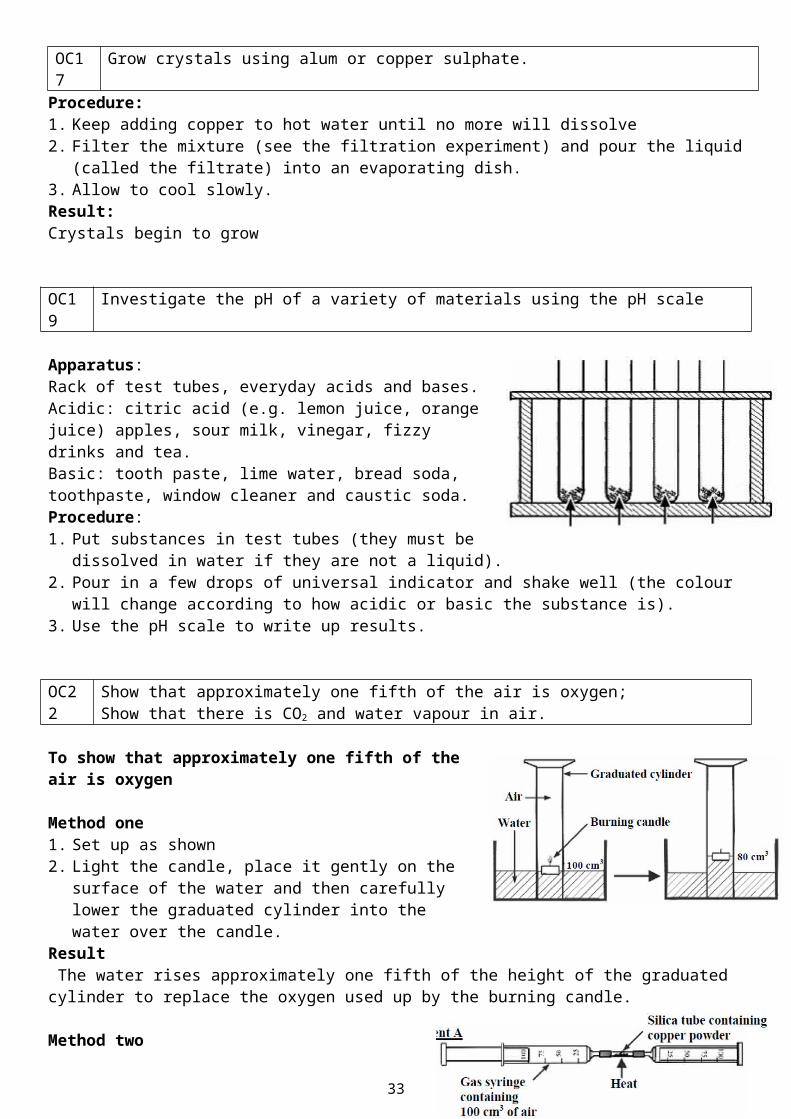
OC22 Show that approximately one fifth of the air is oxygen;Show that there is CO2 and water vapour in air.
To show that approximately one fifth of the air is oxygen
Method one1. Set up as shown2. Light the candle, place it gently on the surface of the water
and then carefully lower the graduated cylinder into the water over the candle.
Result The water rises approximately one fifth of the height of the graduated cylinder to replace the oxygen used up by the burning candle.
Method two1. Set up as shown - use a Bunsen burner as the heat
source.2. Note the total volume of air in both syringes.3. Gently push the air over and back in the syringes until
all the copper powder has become oxidised.ResultVolume of air before heating = 100cm3
Volume of air after heating the copper = 79cm3
Volume of oxygen present in 100cm3 = 21 cm3
Percentage of air = 21/100 = 21%
To show that there is carbon dioxide in airProcedure: Use a ball pump or bicycle pump to pump air through a beaker of limewater.Result: After a minute or two the limewater turns milky proving that there is carbon dioxide in air.
21

To show that there is water vapour in airProcedure: 1. Fill a test-tube with ice and water and leave it for a few minutes; a liquid will form on the outside of the
test-tube.2. Test the liquid using blue cobalt-chloride paper.Result: The blue cobalt-chloride paper turns pink showing that the liquid which condensed was water.OC24 Prepare a sample of oxygen by decomposing H2O2 using MnO2 as a catalyst.
Manganese dioxide (MnO2) is added in as a catalyst (to speed up the reaction)
Procedure1. Set up as shown (X in the diagram is hydrogen peroxide and Y is
manganese dioxide).2. Slowly release the hydrogen peroxide into the flask underneath.ResultOxygen bubbles through the water in the trough.Test for oxygen – it relights a glowing splint.
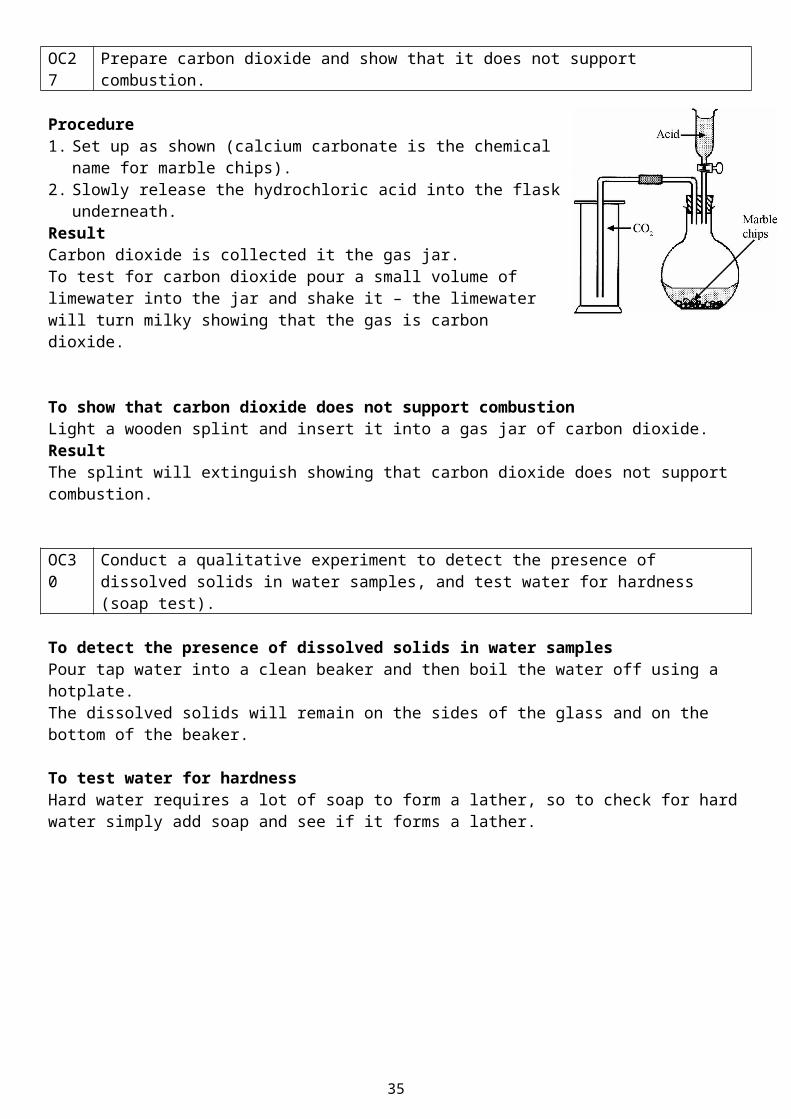
OC27 Prepare carbon dioxide and show that it does not support combustion.
Procedure1. Set up as shown (calcium carbonate is the chemical name for marble chips).2. Slowly release the hydrochloric acid into the flask underneath.ResultCarbon dioxide is collected it the gas jar.To test for carbon dioxide pour a small volume of limewater into the jar and shake it – the limewater will turn milky showing that the gas is carbon dioxide.
To show that carbon dioxide does not support combustionLight a wooden splint and insert it into a gas jar of carbon dioxide.ResultThe splint will extinguish showing that carbon dioxide does not support combustion.
OC30 Conduct a qualitative experiment to detect the presence of dissolved solids in water samples, and test water for hardness (soap test).
To detect the presence of dissolved solids in water samplesPour tap water into a clean beaker and then boil the water off using a hotplate.The dissolved solids will remain on the sides of the glass and on the bottom of the beaker.
To test water for hardnessHard water requires a lot of soap to form a lather, so to check for hard water simply add soap and see if it forms a lather.
OC38 Titrate HCl against NaOH, and prepare a sample of NaCl.
22
Hydrogen peroxide oxygen + waterH2O2 O2 + H2O
Apparatus: A is a burette, B is a pipette, conical flask, retorts stand, , hotplate, white tile, evaporating dish, dropper, beakers.Chemicals: dilute hydrochloric acid, dilute sodium hydroxide, methyl orange indicator.
Method: 1. Set up apparatus as shown in diagram. 2. Using the pipette for accurate measurement, put 25cm3 of dilute sodium
hydroxide into the conical flask. 3. Fill the burette above the 0 mark with dilute hydrochloric acid. 4. Fill the part of the burette below the tap by letting some of the acid pour out
(into an empty beaker) until the level of the liquid is at the 0 mark. 5. Add around 3 drops of the indicator to the base in the conical flask. 6. Place the flask on a white tile under the burette.7. Slowly add the acid into the conical flask until the liquid in the conical flask
remains pink.8. The new reading on the burette is the amount of acid required to neutralise
the base.
9. Pour the contents in the conical flask into the evaporating dish and evaporate it to almost dryness. 10. Let solution cool - white crystals of NaCl will form in the dish.NoteYou could use a variety of pH indicators instead of methyl orange; the neutralisation colour might change accordingly. Alternatively you could use pH indicator strips or a digital pH meter.
OC46 Carry out an experiment to demonstrate that oxygen and water are necessary for rusting.
Procedure1. Get three separate test tubes.2. In the first test tube put in water and
nails.3. In the second test tube put in water and
then boil it to remove any dissolved oxygen.
Then put in the nails and pour in some oil on top to prevent further oxygen entering.4. In the third test tube put in nails with
some calcium chloride to absorb any moisture and cover to prevent further water entering.5. Leave for a week.ResultOnly the nails in test-tube A will rust, demonstrating that both air and water are necessary for rusting.
OC51 Investigate the reaction between zinc and HCl, and test for hydrogen.
1. Drop some zinc metal into a test-tube containing hydrochloric acid and collect the gas given off in a gas jar.
2. Test the gas; it burns with a ‘pop’ showing that the gas is hydrogen.
23
zinc + hydrochloric acid → zinc chloride + hydrogen
Physics Experiments
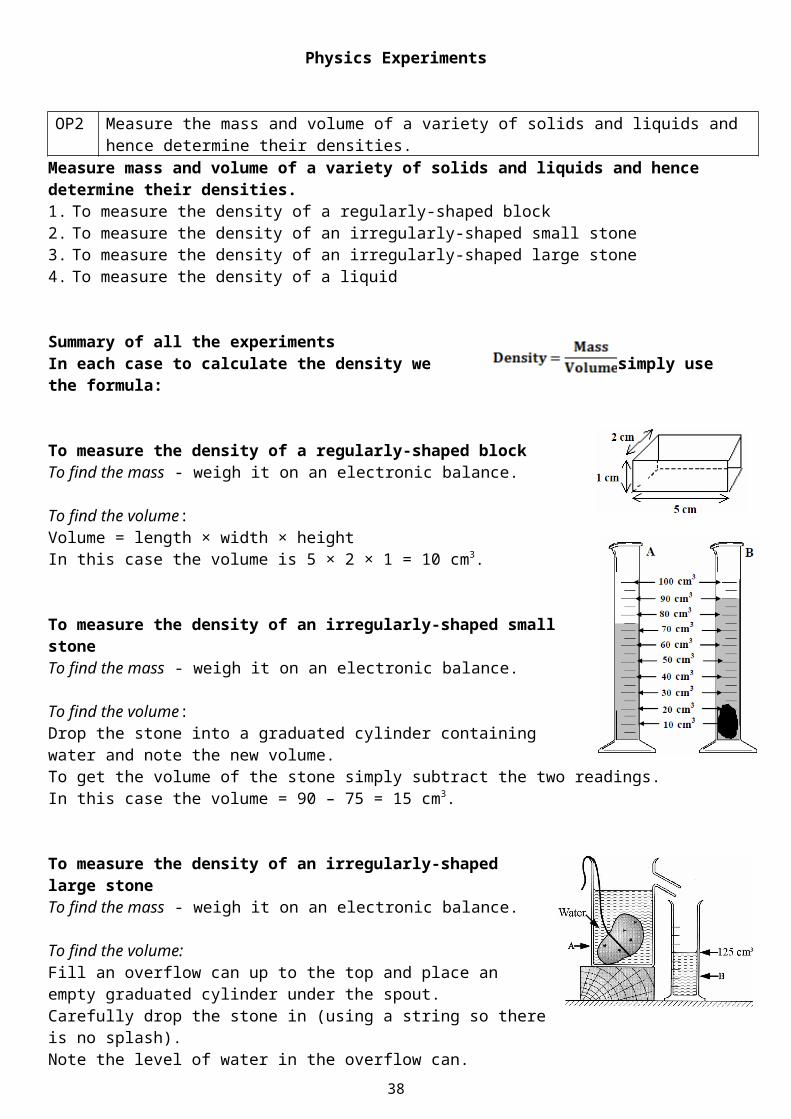
OP2 Measure the mass and volume of a variety of solids and liquids and hence determine their densities. Measure mass and volume of a variety of solids and liquids and hence determine their densities.1. To measure the density of a regularly-shaped block2. To measure the density of an irregularly-shaped small stone3. To measure the density of an irregularly-shaped large stone4. To measure the density of a liquid
Summary of all the experimentsIn each case to calculate the density we simply use the formula:
To measure the density of a regularly-shaped blockTo find the mass - weigh it on an electronic balance.
To find the volume: Volume = length × width × heightIn this case the volume is 5 × 2 × 1 = 10 cm3.
To measure the density of an irregularly-shaped small stoneTo find the mass - weigh it on an electronic balance.
To find the volume:Drop the stone into a graduated cylinder containing water and note the new volume.To get the volume of the stone simply subtract the two readings. In this case the volume = 90 – 75 = 15 cm3.
To measure the density of an irregularly-shaped large stoneTo find the mass - weigh it on an electronic balance.
To find the volume:Fill an overflow can up to the top and place an empty graduated cylinder under the spout.Carefully drop the stone in (using a string so there is no splash).Note the level of water in the overflow can.
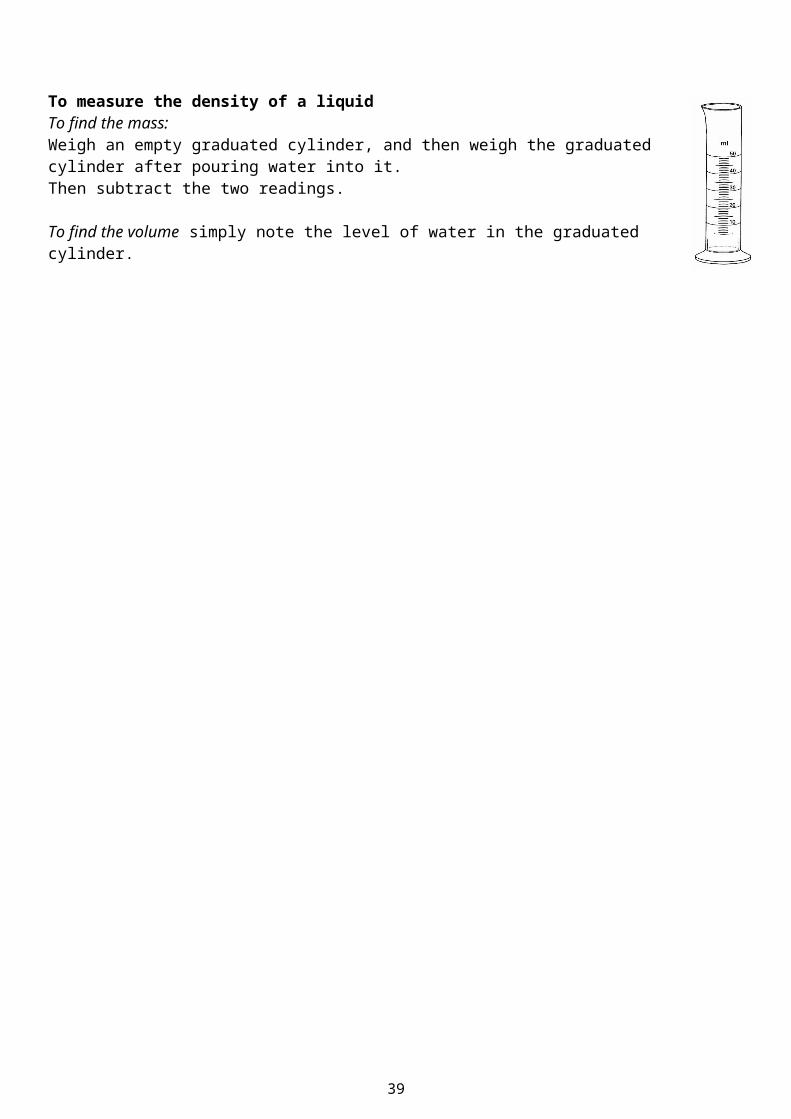
To measure the density of a liquidTo find the mass:Weigh an empty graduated cylinder, and then weigh the graduated cylinder after pouring water into it.Then subtract the two readings.
To find the volume simply note the level of water in the graduated cylinder.
24

OP6 Investigate the relationship between the extension of a spring and the applied force.
Procedure1. Use a newton-meter to stretch a spring (or hand weights from the spring as shown).2. Note the extension and the force used and record the results in a table.3. Repeat for lot of different forces.4. Plot a graph of force used against extension.Result: You should get the graph on a straight line.
Conclusion: The graph is a straight line through the origin which shows that the extension is directly proportional to the applied force.
This may well be the first time that you have come across the phrase ‘directly proportional’ – it means that the force and the extension change at the same rate; if the force on the string doubles so will the extension; if the force triples then the extension will triple also etc.
You must remember this term because it often gets asked in exams (even if it doesn’t appear in textbooks).
OP20
Identify different forms of energy and carry out simple experiments to show the following energy conversions: (a) chemical to electrical to heat energy (b) electrical to magnetic to kinetic energy (c) light to electric to kinetic energy.
a) Chemical energy to electrical energy to heat energyAn electric circuit consisting of a battery connected to a light-bulb or heater.Switch on the circuit and note the temperature rising using a thermometer.
b) Electrical energy to magnetic energy to kinetic energyUse an electromagnet (a coil of wire wrapped around a nail, connected to a battery) to pick up some nails.
c) Light energy to electrical energy to kinetic energyConnect a solar panel to an electric motor which turns the wheels in a car when light shines on the solar panel.
Solids expand when heated and contract when cooledProcedureHeat the brass ball.Result: the ball fits through the ring when the ball is cold but doesn’t fit through when it is hot.
25
OP23
Investigate and describe the expansion of solids, liquids and gases when heated, and contraction when cooled.

Liquids expand when heated and contract when cooledProcedure 1. Connect a glass tube to the top of a beaker of water (use dye to make the water more
visible).2. Use a Bunsen burner or hair-dryer to heat the beaker of water.Result: the water rises up the tube as it gets heated and drops back down as it cools.
Gases expand when heated and contract when cooledProcedure1. Gently heat the flask of air (much better to use a hair dryer in case the flask
breaks).Result: that bubbles come out of the tube when the flask is heated and as it cools water from the trough rises back up the tube because of the partial vacuum which has formed.
OP31
Carry out simple experiments to show the transfer of heat energy by conduction, convection and radiation; investigate conduction and convection in water.
ConductionTo compare the ability of different metals to conduct heatProcedure1. Use the apparatus shown which consists of a piece of timber with four different strips of
metal.2. Place some candle wax at the end of each metal and stand a match in the wax at the end.3. Light the Bunsen (or candle) under the middle and note the order in which the matches fall.Result: the match which falls first was standing in the best conductor.
To show that water is a poor conductor of heatProcedure1. Half fill a boiling tube with water and use piece of metal gauze to hold down the ice.2. Holding the boiling tube at an angle with a tongs, heat it at the top using the Bunsen
burner for a short period of time.Result: the water at the top boils while the ice at the bottom stays frozen.
ConvectionTo demonstrate convection currents in water1. Use the apparatus shown and drop in some copper sulphate or potassium permanganate to
act as a dye.2. Place the Bunsen under one of the corners and note the movement of the water around the
apparatus.Result: the water over the Bunsen will rise and set in motion a convection current which travels around the tube.
26

radiator
To demonstrate convection currents in air
Procedure1. Cut tissue paper into narrow strips; 2. Tie the strips together at one end using the piece of thread and hang them from a retort stand as shown
over a hot-plate.Result: the tissue paper will begin to move as a result of the convection current generated by the hot-plate.
RadiationDark materials are better radiators of heat than shiny materials.Demonstration1. Take two identical metal containers and paint one with one black and the other silver.2. Fill both with hot water.3. Using a thermometer and stop-watch note which container cools the quickest.Result: The dark container cooled more quickly because it is a better radiator of heat.
OP34
Show that light travels in straight lines.
Procedure1. Set up as shown.2. Line up the three cards (with a hole in the middle of each) in a straight line
using a piece of cord to keep them straight.Result: you can only see light from the lamp when the holes in the card are lined up.
OP38
Investigate the reflection of light by plane mirrors, and illustrate this using ray diagrams; demonstrate and explain the operation of a simple periscope.
ProcedureUse a ray box to shine a ray of light off a mirror.Result: the light ray comes back out (reflects) at the same angle as it goes in.Complete the diagram on the right.
How a periscope worksProcedure Set up as shown.Result: Some of the light coming from the card hits the first mirror, then gets reflected from this onto the second mirror where it gets reflected again and travels out to the eye of the observer.
27
OP46 Plot the magnetic field of a bar magnet.Equipment: Magnet, sheet of paper, compasses Procedure: 1. Place the plotting compass beside the magnet and mark the position of the north
end. 2. Move the position of the compass and repeat a number of times on both sides of
the magnet.3. Join the dots. Result: a pattern is formed on the paper representing the magnetic field of the magnet.
OP49
Test electrical conduction in a variety of materials, and classify each material as a conductor or insulator.
Procedure1. Set up the circuit as shown.
2. Place various different materials between points X and Y in the circuit and turn on the switch.
3. If the bulb lights then the material is a conductor and if it doesn’t then the material is an insulator.
4. Record the result in a table.
OP50
Set up a simple electric circuit; use appropriate instruments to measure current, potential difference (voltage) and resistance, and establish the relationship between them.
Procedure1. Set up the circuit as shown.2. Note the current (I) and potential difference (V).3. Adjust the variable resistor (rheostat) to get a new set of
values.4. Repeat about 6 times and then plot a graph of potential
difference against current.5. Record the results in a table and then draw a graph of
potential difference against current.ResultThe fact that we get a straight line through the origin shows that the potential difference is directly proportional to the current (this means that if we double the potential difference, the current will double also).
Note that the slope of the graph corresponds to the resistance of the component.
28
Label Circuit component
A SwitchB Power supplyC ResistorD Bulb
Graphs
Since this science course was first examined in 2006 graph questions have become quite common.There are different types of graph questions, and we will look at each of these different types in turn. There is nothing scary here, and you have probably covered them all in maths anyway. It’s just that the science textbooks don’t seem to do a very good job of telling us why we have them in the first place, or why there are different types.
Why do we have graphs? You won’t get asked this so you don’t have to learn it off by heart – I just thought you deserved to know.
There are many different reasons, but we’ll just look at two here.Reason 1: To see what the relationship is between two variables, e.g. between the extension of a string and the force which caused it.Now assuming that a bigger force causes a bigger extension, the question is; are the two quantities directly proportional? i.e. if the size of the force doubles then the extension should be twice as much, if the force triples the extension will be three times as much etc.Another way of saying this is that the two quantities increase at the same rate (as force is increased the extension increases at the same rate).Or finally the scientific way of saying this is to say that the two quantities are directly proportional to each other (you must learn the phrase in italics off by heart because it gets asked a lot as you will see below).
To investigate this you would plot the results on a graph, and if the two quantities are directly proportional then you will find that if you draw a line through the points you will end up with a straight line through the origin (the origin is the (0,0) mark).
Reason 2: In some graphs the slope of the line gives us some extra information (and you must know what this is).There are only three graphs which fall into this category so make sure that you know each of them.1. The slope of a distance-time graph corresponds to the speed (or velocity) of the moving object 2. The slope of a velocity-time graph corresponds to the acceleration of the moving object 3. The slope of a voltage-current graph corresponds to the resistance of the resistor under investigation.
Note that for each of these graphs you will also get a straight line going through the origin, which verifies that the two quantities are directly proportional to each other.
Which brings us to our next problem – how do we calculate the slope of a line?
To calculate the slope of a linePick any two points (from the graph) and label one point (x1y1) and the second point (x2y2).Make life easy for yourself by picking (0,0) as one of the points (assuming the line goes through the origin).
You must then use the formula:
Note that you can also find this formula on page 18 of the new log tables
Yo - Which axis is the y-axis?Remember the yo-yo? It goes up and down right? Well so does the y axis (and it begins at zero) so y-zero = yoNow that’s just freaky.
29

Plotting data on a graphExample: Plot the following data on a graph. Put velocity on the y-axis and time on the x-axis.
The six points are written as follows: (0, 0) (1, 10) (2, 20), (3, 30) (4, 40) (5, 50)The first number in each set of brackets corresponds to the how far over you go on the x-axis, and the second number corresponds to high up you go on the y-axis.
In Junior Cert exam papers all the points will lie on a straight line, so make sure that you don’t join the dots by hand; you must use a ruler and draw one line going up through all points.
However when you carry out experiments in the lab it is almost impossible to do the experiment perfectly and the equipment itself may not work exactly as it should, so the points won’t form a perfect line. Your job then is to guess where the line should be if the experiment was carried out perfectly.See for example HL 2007 Question 5 (a), page 14
To calculate the slope of a graph
Remember the formula:
We can pick any two points, so we will pick (0, 0) and (5, 50) as our values for (x1, y1) and (x2, y2).This means x1 = 0, x2 = 5, y1 = 0, y2 = 50.Substituting this into our formula we get
Check that you get the same answer by using the following two points: (2, 20) and (4, 40).
Reading the graphExample: Using the graph, estimate the time when the velocity was 37 m/s.Here you must show that you are using the graph, so don’t just look at the graph and guess (or even worse, try to figure it out from the table). Find out where 37 m/s is on the velocity axis and then draw a line in pencil over to the graph and then straight down to the second axis to get a value in this case of 3.7 seconds.
30
Velocity (m/s)
0 10 20 30 40 50
Time (s) 0 1 2 3 4 5
Distance - Time graph
OL 2008 Question 9 (c) A cyclist moved along a track.The distance travelled by the cyclist was measured every 2 seconds.The data collected is presented in the table below.
(i) Use this data to draw a graph of distance travelled (y-axis) against time (x-axis) using the grid provided below.
(ii) Use the graph to estimate the distance travelled by the cyclist in 5 seconds.
(iii) Calculate the speed of the cyclist in m s–1 (m/s).
Answer(i) Correct line going through the origin (ii) 25 m (iii) The speed corresponds to the slope of the graph so take any two points and use the slope formula to get slope = 5 m/s
31
Remember that the slope of a distance-time graph corresponds to the speed (or velocity) of the moving object
Distance travelled (m) 0 10
20 30 40
Time (s) 0 2 4 6 8
Velocity - Time graph
HL 2009 Question 9 (c)A stone was dropped from the top of a tall cliff. The stones approximate velocity was measured each second as it fell. The data collected during this experiment is given in the graph.(i) Define velocity. (ii) Use data from the graph to estimate the acceleration of the stone as it fell. Give the units of acceleration with your answer.
Answer:(i) Velocity is defined as speed divided by distance travelled in a given direction(ii) The acceleration corresponds to the slope of the graph so take any two points and use the slope formula
to get slope = 10 m/s/s or 10 m s-2 or10 m/s2
32
Remember that the slope of a velocity-time graph corresponds to the acceleration of the moving object
Voltage – Current Graphs: example 1
Note that this graph seems to come up a lot!!!
HL 2007 Question 9 (b)Note that you did have to know about the experiment to answer the first two parts of this question but for now we will just concentrate on the graph parts.
A pupil used this circuit to get a set of readings from both meters for different values and then plotted this data in the graph shown.Use this graph to calculate the resistance of resistor R shown in the diagram.
Give the unit of resistance with your answer.
Answer
The resistance corresponds to the slope of the graph.Pick two points from the graph and use the formula to get slope = 12 Ω or 12 Ohms
33
Remember that the slope of a voltage-current graph corresponds to the resistance of the resistor under investigation.

Voltage – Current Graphs: example 2
Note that you don’t need to know anything about electricity (other than the slope of the graph corresponds to the resistance) to answer the question.
OL 2007 Question 9 (b) Draw a graph of the voltage (y-axis) against the current (x-axis) in the grid provided on the right. What conclusion can you draw from the graph about the relationship between the potential difference (voltage) and the current passing through the wire conductor?
Answer:(i) The graph should go through all 4 points and should be a straight line going through the origin.
(ii)Potential difference is directly proportional to current.
34
Voltage (V) 0 2 4 6 8Current (A) 0 0.5 1.0 1.5 2.0
Voltage – Current Graphs: example 3HL 2009 Question 8 (c)A pupil performed an experiment on a resistor to investigate the relationship between potential difference
(voltage) applied to the resistor and the current flowing through the resistor. The data from this experiment is in the table.
(i) Draw a graph of potential difference (voltage) on the y-axis against current on the x-axis in the grid below. (ii) Calculate the resistance of the resistor used in this experiment. (iii) What is the evidence from the graph that potential difference (voltage) is directly proportional to current in this case?
Answer:(i) See graph(ii) The resistance corresponds to the slope of the graph = 20
(iii) The graph resulted in a straight line through the
origin
35
Potential difference (Volts)
0 1 2 3 4 5
Current (Amperes) 0.00 0.05 0.10 0.15 0.20 0.25

The relationship between the extension of a spring and the force applied to it: example 1
This also comes up a lot
OL 2009Question 8 (a)
Again we are only interested in the graph part of the question, which in this case is part (iii), but we include the rest of the question for completeness).
A student investigated the relationship between the extension of a spring and the force applied to it.The equipment shown in the diagram was used.The data collected is shown in the table.
The student then drew the graph shown below.Answer the questions that follow about this investigation. (i) Name an instrument used to measure the
force in this investigation.(ii) Describe how the student could have
measured the extension of the spring.(iii) What conclusion would you draw from
this investigation?Answer(i) Spring balance / Newton meter (ii) Using a ruler / metre stick to measure the
distance between the original length and the new length each time an extra weight is added.
(iii) Extension is proportional to force applied.
36
Force (N) 0 2 4 6 8Extension (cm) 0 4 8 12 16

The relationship between the extension of a spring and the force applied to it: example 2
OL 2006 Question 9 (b)A student carried out an investigation to examine the relationship between the extension (increase in length) of a spring and the force applied to it.The diagram shows the apparatus used.The table shows the data collected by the student.
(i) Describe how the student could have taken any one of these measurements. (ii) Draw a graph of the extension (y-axis) against the force in the grid provided on the right.(iii) What force results in a 6 cm extension of the spring?
Answer(i) Weights: Add (or hang) weights onto the string one at a time and note the size of the weights each time. Extension: Use a metre stick to measure the distance between the original length and the new length each time an extra weight is added.(ii) All points plotted and a straight line drawn which passes through the origin.(iii) 3 N
37
Force (N) 0 2 4 6 8Extension (cm) 0 4 8 12 16
The relationship between the extension of a spring and the force applied to it: example 3
HL 2006 Question 9 (a) Robert Hooke (1635-1703) made a number of discoveries including the effect of force on elastic bodies now known as Hooke’s law. (i) State Hooke’s law [this is not on the syllabus and should not have been asked].
A student was given a box of identical springs and asked to analyse them so that they could be used as newton meters. The student performed an experiment, using the apparatus shown in the diagram, on one of the springs.In the experiment the student measured the increase in length of the spring caused by a number of weights. The spring was tested to destruction (that is weights were added until the spring was damaged).The data from the experiment is given in the table.
(ii) Plot a graph of extension (increase in length – y-axis) against weight (x-axis) in the grid provided.
(iii) Use the graph to find the weight that would produce an extension of 5 cm in the spring.
(iv) Study your graph carefully.The spring obeys Hooke’s law for the earlier extensions and then when the spring becomes damaged it does not appear to do so.Estimate, from your graph, the weight after the addition of which the law seems no longer to apply.
Answer(i) The extension of a stretched string is directly proportional to the force applied to it.(ii) See graph underneath(iii) Weight = 1.0 N (accept range 0.9 to 1.1) (iv)1.6 N (accept range 1.6 to 2.0)
38
Weight (N) 0.0 0.4 0.8 1.2 1.6 2.0 2.4Extension (cm) 0.0 2.0 4.0 6.0 8.0 8.5 8.6
The cooling curve: example 1
The cooling curve represents what happens to a material when it cools and changes state. To interpret the graph correctly you must remember that the horizontal section (‘the flat bit’) corresponds to the substance changing state. The theory for this is in your notes so I won’t go into it here.
HL 2006 Question 8 (c) The graph is a cooling curve. The substance used in this experiment was naphthalene. Naphthalene has a melting point of 80 0C.The rate of heat loss was constant throughout the experiment.
(i) What is happening to the naphthalene between points A and B on the graph? (A and B should have been indicated here – they correspond to the beginning and end of the horizontal section).(ii) What is the heat loss, between points A and B, on the curve called?
Answers(i) It is changing from a liquid to a solid (ii) Latent heat of fusion
39

The cooling curve: example 2HL 2008 Questions 9 (a)A pupil heated some lauric acid, which is a solid at room temperature, until it turned into a liquid. The lauric acid was then allowed to cool at a uniform rate. The temperature of the lauric acid was taken every minute.The data from this experiment is given in the table.
Temperature (0C) 75 64 54 43 43 43 43 43 32 22 10Time (minutes) 0 1 2 3 4 5 6 7 8 9 10
(i) Draw a graph, using this data, of temperature against time (x-axis) in the grid provided below.(ii) Explain the shape of the graph that you obtain.(iii) Use the graph to estimate the melting point of lauric acid.
Answers:(i) See graph(ii) Initially the temperature of the liquid falls until it reaches 43 0C.Here it changes state from a liquid to a solid.Then the solid cools down.(iii) 43 0C
40

Solubility of salt in water: example 1OL 2009Question 6 (b)
In a school laboratory, a student investigated the solubility of a salt in water.The amount of salt which dissolved in water at different temperatures was measured. The data collected is presented in the table below.
(i) Use this data to draw a graph of solubility (y-axis) against temperature (x-axis) using the grid provided below.
(ii) Use the graph to estimate the solubility at 60 °C.
(iii) What can you conclude about the solubility of the salt in water from the graph?
Answer(i) Plot the points correctly
and draw a straight line passing through all the points.
(ii) 50 ± 2 (iii) Solubility increases
with temperature
41
Temperature (°C) 20 30 40 70 90Solubility (g per 100 cm3 of water) 10 20 30 60 80

Solubility of salt in water – example twoHL 2007 Question 5 (a) [This graph is more realistic than the others because the line does not go through many of the points due to small errors associated with doing the experiment. Your job then is to guess where the line should be if the experiment was carried out perfectly. Try to imagine an invisible line which the points you have drawn are scattered around. It’s best to use a transparent ruler for this so that when you put the ruler down on the page you can still see the points underneath.]
A pupil investigated the effect of temperature on the solubility of the salt ammonium chloride in water. She determined the maximum mass, in grams, of the salt that would dissolve in 100 g of water at various temperatures.The data from this experiment are given in the table.
(ii) Plot a graph of solubility against temperature. (iii) Use the graph to estimate the solubility of ammonium chloride at 70 oC.(iv) What conclusion about the solubility of ammonium chloride can be drawn from analysis of the graph?
Answer:(ii) See graph(iii) 61 (58 to 64 is acceptable) (iv) Solubility increases with temperature
Note that because the line does not go through the origin you cannot say that the solubility is directly proportional to temperature.
42
Solubility (g / 100 g water) 29 37 46 55 66 77Temperature (0C) 0 20 40 60 80 100

Miscellaneous Graph QuestionsHL 2008 Question 5 (a)[This question was nasty because it is not an experiment that you would have done in class. After you had plotted all the points it still wasn’t obvious whether you needed to draw a straight line (like in the last question) or simple join up the dots in a curve. As it turns out a straight line would be too far away from most of the points so a curve is the only alternative. Still, sometimes the people who set these questions are just plonkers.]
The limit of solubility (maximum solubility) of oxygen gas (O2) in water was measured, in mg of oxygen per 100 g of water, at a number of different temperatures. These measurements are given in the table.
(i) Draw a graph of solubility (y-axis) against temperature (x-axis) in the grid provided below.(ii) Use the graph to estimate the solubility of oxygen at 30 °C. (iii) What effect has temperature on the solubility of oxygen in water? (iv) Global warming has many implications. What implication, which could be inferred (concluded) from the information in the graph, might global warming have for animals that live in water e.g. fish?
Answer:(i) See graph(ii) 3.6(iii) Solubility decreases as temperature increases.(iv) As the temperature of the water increases there will be less oxygen left in the water for respiration (breathing)/ fish (animals) die
43
Solubility (mg / 100 g water)
7.0 4.3
3.0 2.3 1.4
0.0
Temperature (0C) 0 20 40 60 80 100