x-ray cluster cosmology - icrrred: x-rays blue: lensing galaxy clusters: the largest objects in the...
TRANSCRIPT

XX--ray Cluster Cosmologyray Cluster Cosmology
Steve Allen (Stanford/SLAC) Steve Allen (Stanford/SLAC)
In collaboration with:
Adam Mantz (Chicago) David Rapetti (Copenhagen) R. Glenn Morris (SLAC) Harald Ebeling (Hawaii) Andy Fabian (Cambridge) Robert Schmidt (Heidelberg) Anja von der Linden (Stanford) Aurora Simionescu (Stanford) Norbert Werner (Stanford) Yoh Takei (ISAS)
MACSJ0025.4-1222 (z=0.59)
(+ many others)
Red: X-rays Blue: lensing

Galaxy clusters: the Galaxy clusters: the llargest argest oobjects bjects in the in the UniverseUniverse
By comparing the observed distribution, evolution and structure of galaxy clusters with cosmological model predictions, we can constrain the nature of dark energy, gravity, dark matter, neutrino properties, inflation …
Wu, Hahn & Wechsler 2011 Visualization: R. Kaehler

The importance of XThe importance of X--ray observationsray observations
Most baryons in clusters (like Universe) are in form of gas, not stars (6-10x ). In clusters, gravity squeezes gas, heating it to X-ray temperatures (107-108 K)
Clusters are easy to identify using X-ray observations clean, complete cluster catalogues (critical for cosmology with cluster counts).
X-ray observables (brightness, temperature) relate to the total mass (dark plus baryonic) via relatively simple physics that can be well modelled by simulations.
Virgo Cluster

Outline of talk:Outline of talk:
1) Cosmological constraints from measurements of the baryonic mass fraction in the largest dynamically relaxed clusters (aka the fgas test).
(Cosmology with `cherry picked’ cluster samples, as with SNIa)
constraints on m, de, w.
2) Cosmological constraints from cluster counts.
constraints on m, de, w, 8, gravity (and m).
(Cosmology with complete, statistical cluster samples)
For further reading: see Allen, Evrard & Mantz 2011, Annual Review of Astronomy and Astrophysics, 49, 409.

XX--ray Cluster ray Cluster CosmologyCosmology
1. The 1. The baryonic mass fractionbaryonic mass fraction
Featured work: Allen et al. 2008, MNRAS, 383, 879
See also e.g. White & Frenk ’91; Fabian ’91; Briel et al. ’92; White et al ’93;
David et al. ’95; White & Fabian ’95; Evrard ’97; Mohr et al ’99; Ettori & Fabian
’99; Roussel et al. ’00; Grego et al ’00; Allen et al. ’02, ’04; Ettori et al. ’03, ‘09;
Sanderson et al. ’03; Lin et al. ’03; LaRoque et al. ’06 …

BASIC IDEA (White & Frenk 1991): galaxy clusters are so large that their
matter content should provide a ~ fair sample of matter content of Universe.
masscluster total
mass gasray -Xfgas Define: and
)s(1f f f f gas gasstarbaryon
m
bgas
s)(1
b f
Then:
Since clusters provide ~ fair sample of Universe:
Constraining Constraining cosmologycosmology with with ffgasgas measurementsmeasurements
m
bbaryon f
b
BBNS/CMB
Simulations
Measure
masscluster total
massstellar fstar

Constraining dark energy with Constraining dark energy with ffgasgas measurementsmeasurements
The measured fgas values depend upon the assumed distances to clusters as
fgas d 1.5, which brings sensitivity to dark energy through the d(z) relation (for
clusters at z>0.2). To use this information, we need to know the expected fgas(z).
What do we expect to observe?
Simulations: (non-radiative)
For large (kT>5keV) clusters, we
expect b(z) and therefore fgas(z) to
be approximately constant with z.
The precise prediction of b(z) is a
key task for hydro. simulations.
pre
dic
ted b
(z)
(0.5
r vir)
Eke et al. 98

1.6Ms of Chandra data for 42 hot (kT>5keV), dynamically relaxed clusters
spanning redshift range 0<z<1.1.
The observationsThe observations
Selected on X-ray morphology: sharp central X-ray surface brightness peaks, minimal X-ray isophote centroid variations and high overall symmetry.
Restriction to hot, relaxed clusters minimizes all systematic effects.

Chandra results on Chandra results on ffgasgas(z) at r(z) at r25002500
SCDM (Ωm=1.0, ΩΛ=0.0) ΛCDM (Ωm=0.3, ΩΛ=0.7)
Inspection clearly favours ΛCDM over SCDM cosmology.
Brute-force determination of fgas(z) for two reference cosmologies:
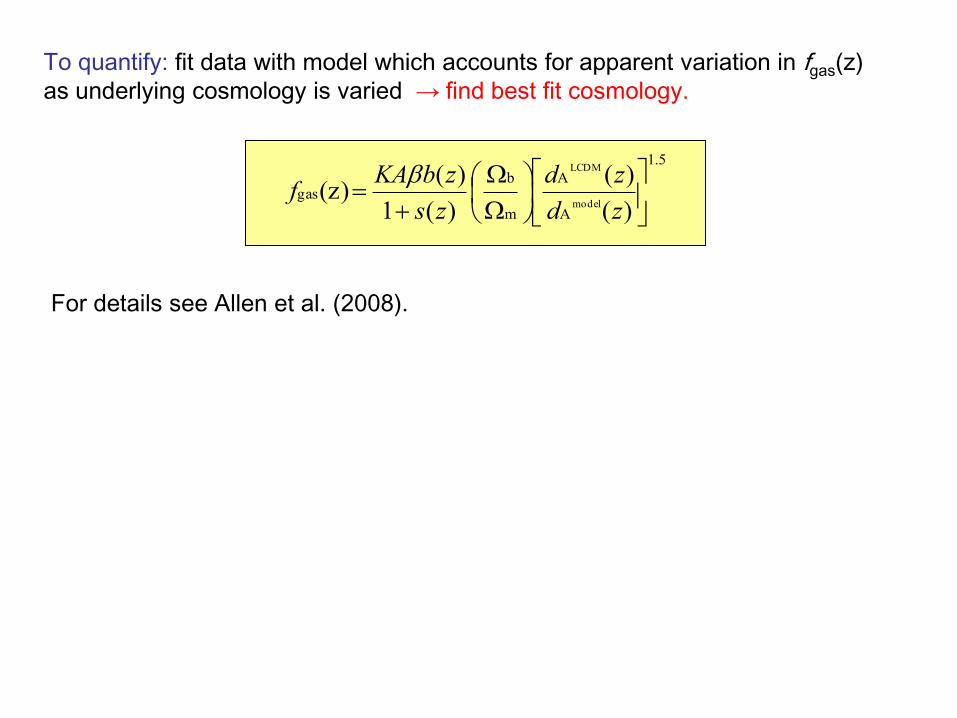
To quantify: fit data with model which accounts for apparent variation in fgas(z)
as underlying cosmology is varied → find best fit cosmology.
5.1
A
A
m
b gas
)(
)(
)(1
)( (z)
model
LCDM
zd
zd
zs
zbKAf
For details see Allen et al. (2008).

Allowances for systematic uncertaintiesAllowances for systematic uncertainties
Our analysis includes a comprehensive and conservative treatment of potential
sources of systematic uncertainty (marginalized over in analysis).
1) The depletion factor (simulation physics, feedback processes etc.)
b(z)=b0(1+bz) ± 20% uniform prior on b0 (simulation physics)
±10% uniform prior on b (simulation physics)
2) Non-thermal pressure support in gas: (primarily bulk motions)
= Mtrue/MX-ray 10% (standard) or 20% (weak) uniform prior [1<<1.2]
3) Baryonic mass in stars: define s= fstar/fgas =0.16h700.5
s(z)=s0(1+sz) ± 30% Gaussian uncertainty in s0 (observational uncertainty)
± 20% uniform prior on s (observational uncertainty)
4) Instrument calibration, X-ray modelling
K ± 10% Gaussian uncertainty

Results (ΛCDM)
Including all systematics + standard priors:
(Ωbh2=0.0214±0.0020, h=0.72±0.08)
Best-fit parameters (ΛCDM):
Ωm=0.27±0.06, ΩΛ=0.86±0.19
(Note also good fit: 2=41.5/40)
With these (conservative) allowances for systematicsWith these (conservative) allowances for systematics
5.1
A
A
m
b gas
)(
)(
)(1
)( (z)
model
LCDM
zd
zd
zs
zbKAf
Model:
Important Result limited by
b(z),K priors

The low systematic scatter in the The low systematic scatter in the ffgasgas(z) data(z) data
2 for best fit acceptable.
Intrinsic scatter is undetected.
(Consistent with expectations
from hydro. simulations)
68% upper limit on fgas scatter
fgas~10% (7% in distance).
fgas precise tracer of expansion history (individually, better than SNIa).
Mgas excellent mass proxy for hot, massive clusters.
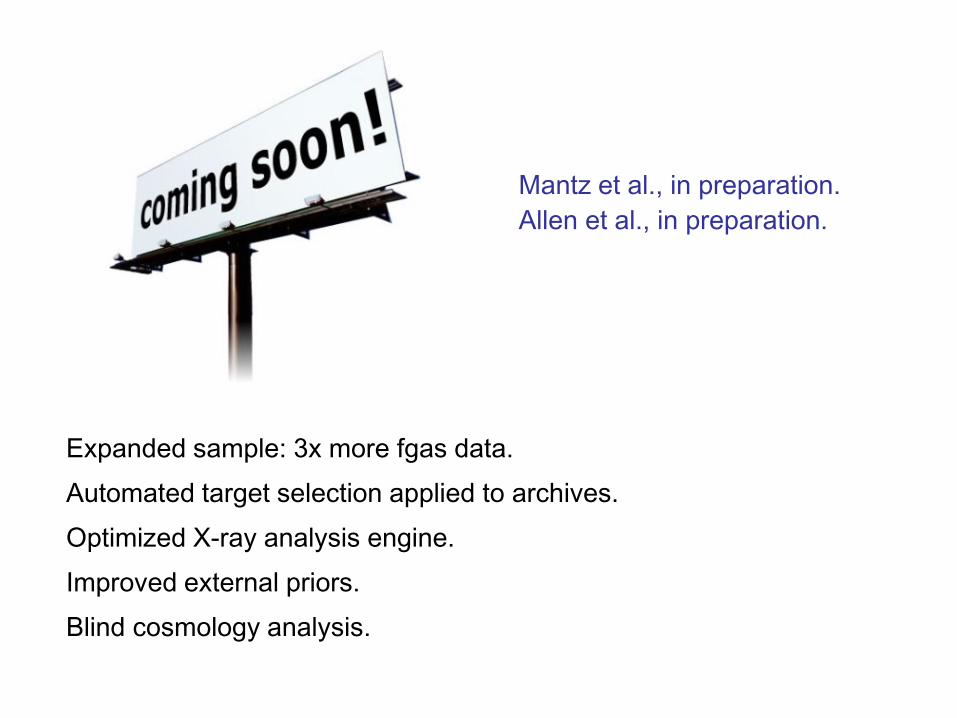
Expanded sample: 3x more fgas data.
Automated target selection applied to archives.
Optimized X-ray analysis engine.
Improved external priors.
Blind cosmology analysis.
Mantz et al., in preparation.
Allen et al., in preparation.
.
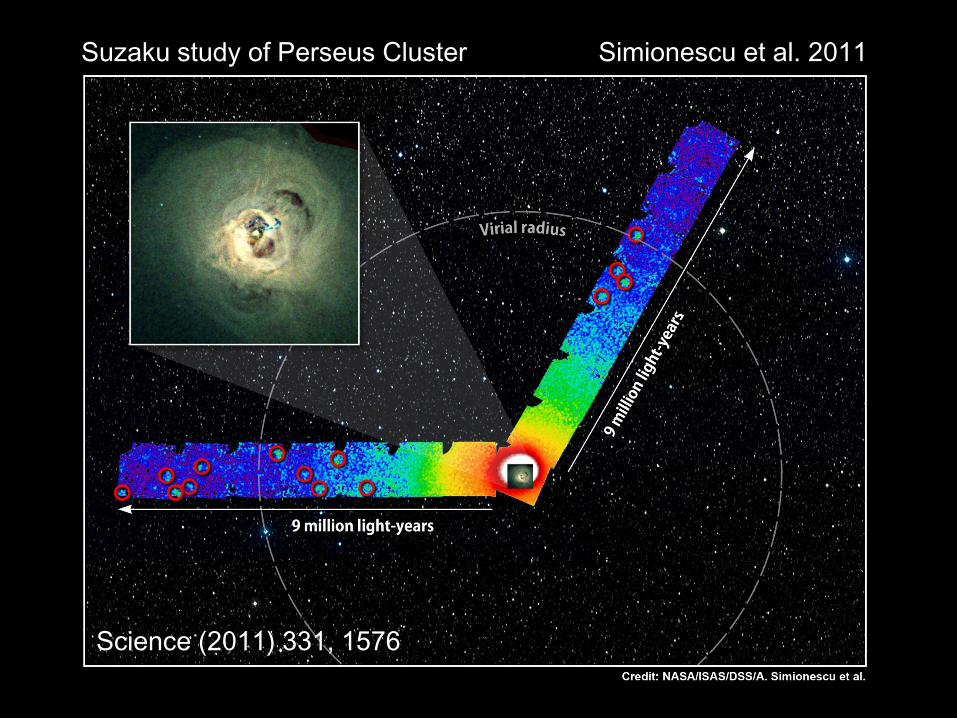
Suzaku study of Perseus Cluster Simionescu et al. 2011
Science (2011) 331, 1576

Suzaku Key Project data for Perseus Cluster
1Ms exposure
Simionescu et al., arXiv:1208.2990
Urban et al., in prep.
1 degree

See also e.g. Borgani et al. ’01; Reiprich & Bohringer ’02; Seljak ’02; Viana et
al. ’02; Allen et al. ’03; Pierpaoli et al. ’03; Schuecker et al. ’03; Voevodkin &
Vikhlinin ’04; Henry ’04; Dahle ’06; Mantz et al. ’08; Henry et al. ’09; Vikhlinin et
al. ‘09; Rozo et al. ’10 ...
XX--ray Cluster ray Cluster CosmologyCosmology
2. Cluster c2. Cluster countsounts
Featured work: Mantz et al. 2010, MNRAS, 406, 1759.
Rapetti et al. 2012, arXiv:1205.4697

Cluster growth and cosmologyCluster growth and cosmology
Moore et al. Borgani ‘06
Measurements of the number counts of massive galaxy clusters, and especially their evolution with redshift, provides powerful, complementary constraints on cosmological parameters.

Ingredients for cluster count experiments 1Ingredients for cluster count experiments 1
[THEORY] The predicted mass function of clusters, n(M,z), as a
function of cosmological parameters (8,m,w etc).
[CLUSTER SURVEY] A large, clean, complete cluster survey with a
well defined selection function.
Current leading work based on ROSAT X-ray surveys and the Sloan
Digital Sky Survey (optical) + new SZ surveys.
[SCALING RELATION(S)] Tight, well-determined scaling relation(s)
linking survey observable (e.g. Lx) and mass.

Ingredients for cluster count experiments 2Ingredients for cluster count experiments 2
[THEORY] The predicted mass function of clusters, n(M,z), as a
function of cosmological parameters (8,m,w etc).
[CLUSTER SURVEY] A large, clean, complete cluster survey with a
well defined selection function.
Current leading work based on ROSAT X-ray surveys and the Sloan
Digital Sky Survey (optical) + new SZ surveys.
[SCALING RELATION(S)] Tight, well-determined scaling relation(s)
linking survey observable (e.g. Lx) and mass.

Cluster surveys based on RASSCluster surveys based on RASS
BCS (Ebeling et al. ’98, ’00).
z<0.3, Fx>4.4×10⁻¹² ergcm-2s-1
[northern sky: 201 clusters]
REFLEX (Bohringer et al ’04).
z<0.3, Fx>3.0×10⁻¹² ergcm-2s-1
[southern sky: 447 clusters]
Bright MACS (Ebeling et al. ’09)
z>0.3, Fx>2.0×10⁻¹² ergcm-2s-1.
[all-sky: 34 clusters]
All three surveys based on ROSAT All-Sky Survey (RASS) (0.1-2.4keV). To
minimize systematics (associated with scaling relations) analysis limited to most
luminous systems with Lx > 2.5x1044 h70
-2 erg s-1 (238 clusters total).
Mantz et al. 2010

Ingredients for cluster count experiments 3Ingredients for cluster count experiments 3
[THEORY] The predicted mass function of clusters, n(M,z), as a
function of cosmological parameters (8,m,w etc).
[SCALING RELATION(S)] Tight, well-determined scaling relation(s)
linking survey observable (e.g. Lx) and mass.
[CLUSTER SURVEY] A large, clean, complete cluster survey with a
well defined selection function.
Current leading work based on ROSAT X-ray surveys and the Sloan
Digital Sky Survey (optical) + new SZ surveys.

Data used to measure scaling relationsData used to measure scaling relations
3.4Ms of pointed Chandra and ROSAT observations for 94/238 survey clusters
measure Mgas, Tx, Yx at r500 (10-15% mass proxies) and re-measure Lx.
ROSAT
Chandra
Mgas (measured at r500) is our primary mass proxy: easy to measure + small
(<10%) intrinsic scatter for clusters with kT>5keV (M=Mgas/fgas).

AnalysisAnalysis
To determine robust cosmological constraints one should solve simultaneously
for the cosmology+scaling relations, accounting fully for survey biases and
covariance, and marginalizing over systematic uncertainties.
This is best done using likelihood function that encompasses the entire
theoretical model (mass function, cosmology, scaling relations) .
Such analyses can be carried out efficiently using Markov Chain Monte Carlo
(MCMC) methods.
For details see Mantz et al. (2010a).

Parameters, priors and allowances for systematicsParameters, priors and allowances for systematics
Our analysis includes the following parameters and priors with conservative
allowances for systematic uncertainties:
Dominant systematic: 15% uncertainty in absolute cluster mass calibration.

Cosmology: results on Cosmology: results on 88, , m m
Ωm = 0.23 ± 0.04
8 = 0.82 ± 0.05
Good agreement between results from 3 RASS surveys, as well as independent
X-ray (e.g. Vikhlinin et al. ’09) and optical (Rozo et al. ’10) cluster surveys.
Results marginalized over
all systematic uncertainties.
Flat CDM model:
Combined constraints (68%)
Mantz et al. 2010

Results on Results on dark energy dark energy
Flat, constant w model:
Ωm = 0.23 ± 0.04
8 = 0.82 ± 0.05
w = -1.01 ± 0.20
Results marginalized over
all systematic uncertainties.
Mantz et al. 2010
Clear detection of the effects of dark energy on cluster growth (suppression).
See also Vikhlinin et al. ’09 (comparable constraints).

Comparison with independent technqiuesComparison with independent technqiues
Flat, constant w model:
Cluster growth (Mantz 2010)
Cluster fgas (Allen et al ’08)
CMB (WMAP-5yr)
SNIa (Kowalski et al. ’08)
BAO (Percival et al. 2010)
Allen et al. 2011
All 5 independent techniques consistent with cosmological constant (w = -1)

Neutrino MassesNeutrino Masses

Neutrinos free-stream on the scales of galaxy clusters, suppressing the growth
of structure on these (and smaller) scales. The larger the contribution of
neutrinos to the total matter density, the stronger the effect.
Constraining the neutrino massConstraining the neutrino mass
Elgaroy & Lahav ‘05
M=0.3eV
By comparing the amplitude
of matter fluctuations on large
scales at early times (CMB)
and small scales at late times
(cluster counts), we can
constrain the species-
summed neutrino mass,
M=mi
M=0.9eV
M=6eV
M=1.5eV

Constraints on the speciesConstraints on the species--summed neutrino masssummed neutrino mass
(CMB+BAO+
SNIa+fgas)
+cluster count
The inclusion of cluster count data leads to robust constraints on the species-
summed neutrino mass (Mantz et al. 2010).
General cosmology Basic cosmology
For basic (flat CDM) cosmology with no tensors: (95%) eV33.0i
imM
(includes tensors,
curvature, w)

The Origin of Cosmic AccelerationThe Origin of Cosmic Acceleration

The best current constraints on the growth history come from clusters (CL), galaxy redshift surveys (GRS) and the CMB.
Rapetti et al. 2012
GRS (BOSS +Wigglez+6dF) CL+GRS+CMB
Clusters
CMB (ISW) (WMAP)
Growth index parameterization:
For General Relativity, = 0.55 (dashed curve)
Dark energy vs. modified gravityDark energy vs. modified gravity
Distinguishing between dark energy and modified gravity models for cosmic
acceleration requires measurements of both the expansion and growth histories.
)(
ln
lnm a
a

Rapetti et al. 2012 Gold: CL+GRS+CMB.
Grey: (above)+SNIa+BAO+H0
w = -0.968 0.049
= 0.546 0.072
Results marginalized over
all systematic uncertainties.
Testing the standard Testing the standard CDM+GR CDM+GR cosmological modelcosmological model
Rapetti et al. 2012
The best current data are simultaneously consistent with General Relativity
+ dark energy in the form of a cosmological constant.
Flat geometry:

Incorporation of Subaru weak
gravitational lensing mass
measurements into cluster
cosmology experiments.
factor 2 improvement in
absolute mass calibration.
improved constraints on
cosmology (and neutrino mass).
von der Linden et al. 2012 (arXiv:1208.0597)
Kelly et al. 2012 (arXiv:1208.0602)
Applegate et al. 2012 (arXiv:1208.0605)
For methods see:

Measurements of galaxy clusters provide powerful and robust constraints
on cosmological models, competitive with and complementary to those
from other leading techniques.
The combination of galaxy cluster data and other techniques is already
providing strict tests of the standard CDM+GR paradigm.
Conclusions Conclusions
w = -0.968 0.049, = 0.546 0.072
The prospects for near- and mid-term improvements are strong, with
powerful, new surveys (e.g. eROSITA, LSST, Euclid) and targeted,
follow-up facilities (e.g. ASTRO-H) on the way.
A coordinated, multi-wavelength approach to exploiting these data will
be essential. However, X-ray observations will remain central.

Bonus SlidesBonus Slides
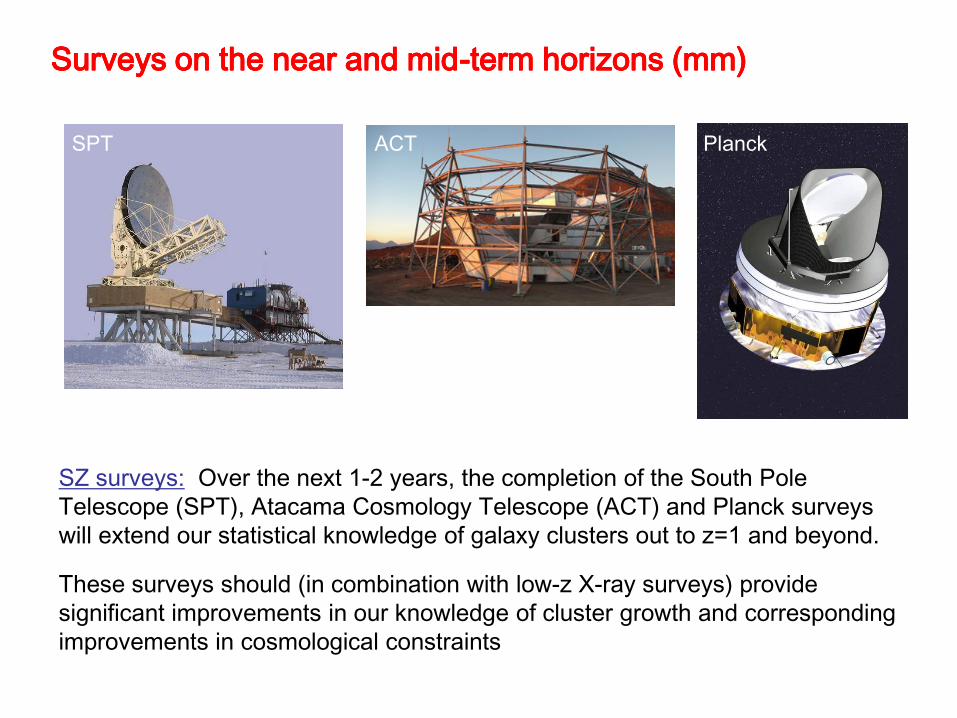
Surveys on the near and midSurveys on the near and mid--term horizons (mm)term horizons (mm)
SPT ACT Planck
SZ surveys: Over the next 1-2 years, the completion of the South Pole
Telescope (SPT), Atacama Cosmology Telescope (ACT) and Planck surveys
will extend our statistical knowledge of galaxy clusters out to z=1 and beyond.
These surveys should (in combination with low-z X-ray surveys) provide
significant improvements in our knowledge of cluster growth and corresponding
improvements in cosmological constraints
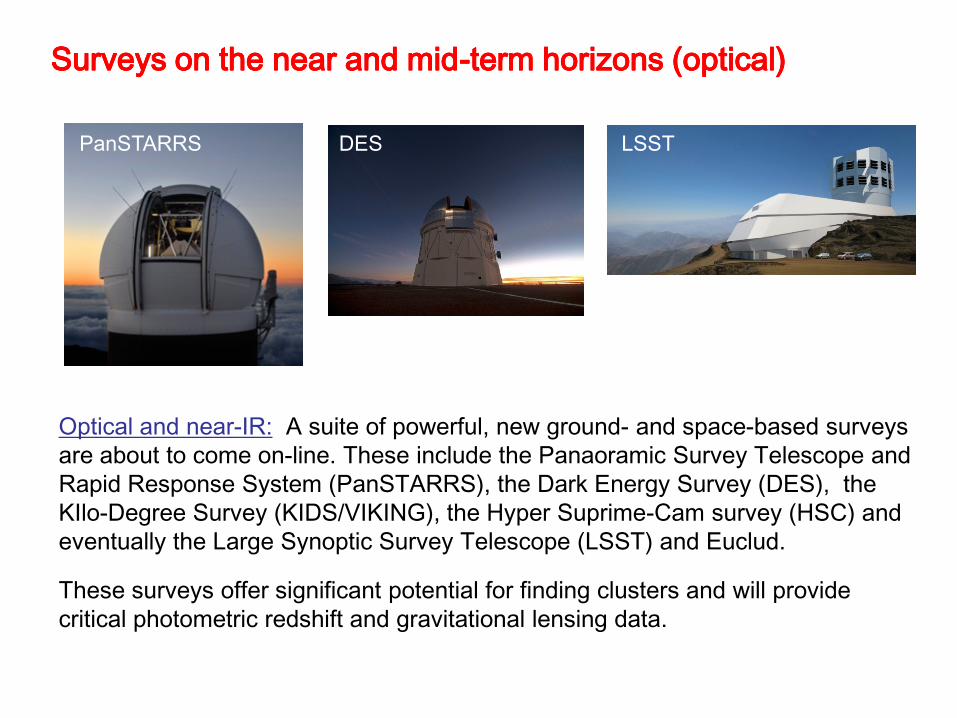
Surveys on the near and midSurveys on the near and mid--term horizons (optical)term horizons (optical)
SPT ACT Planck
Optical and near-IR: A suite of powerful, new ground- and space-based surveys
are about to come on-line. These include the Panaoramic Survey Telescope and
Rapid Response System (PanSTARRS), the Dark Energy Survey (DES), the
KIlo-Degree Survey (KIDS/VIKING), the Hyper Suprime-Cam survey (HSC) and
eventually the Large Synoptic Survey Telescope (LSST) and Euclud.
These surveys offer significant potential for finding clusters and will provide
critical photometric redshift and gravitational lensing data.
PanSTARRS DES LSST
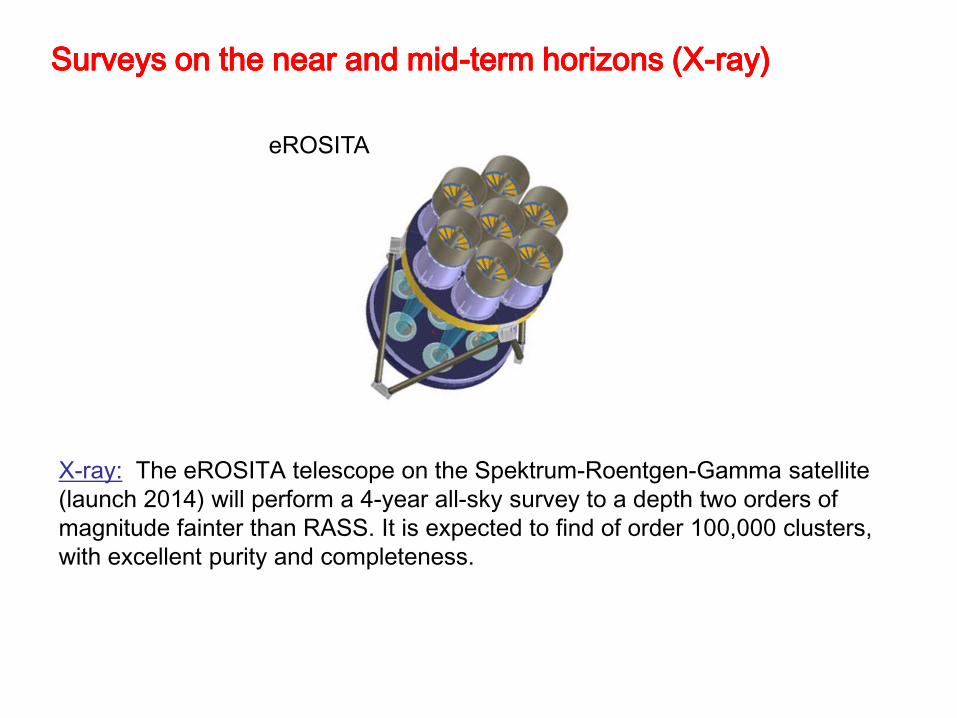
Surveys on the near and midSurveys on the near and mid--term horizons (Xterm horizons (X--ray)ray)
X-ray: The eROSITA telescope on the Spektrum-Roentgen-Gamma satellite
(launch 2014) will perform a 4-year all-sky survey to a depth two orders of
magnitude fainter than RASS. It is expected to find of order 100,000 clusters,
with excellent purity and completeness.
eROSITA

A coordinated, multiwavelength approach will be essentialA coordinated, multiwavelength approach will be essential
Follow-up observations with X-ray observatories such as Chandra, XMM-Newton
and the new ASTRO-H (launch 2014) will be critical in providing low-scatter
mass proxy measurements for individual clusters (Tx, Mgas, Yx), as well as
new astrophysical information.
Likewise, the photometric redshift and gravitational lensing data from optical
surveys will provide a cornerstone for all cluster cosmology work.
Chandra ASTRO-H

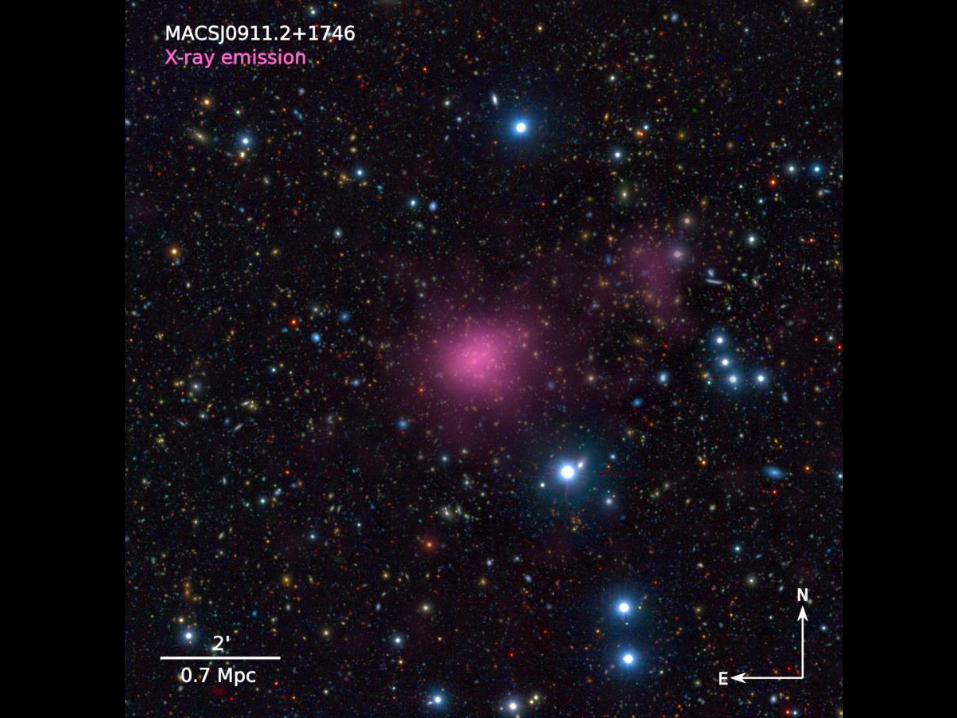
Example of Subaru weak Example of Subaru weak lensinglensing data data
(color image and overlays) (color image and overlays)


Glossary of relevant cosmological parametersGlossary of relevant cosmological parameters
is the mean matter density in units of
the critical density. critmm /
is the dark energy density in units of the critical density.
critdede /
is the amplitude of matter fluctuations
(in 8h-1Mpc spheres, linear theory)
dede/w p is the dark energy equation of state.
w = -1 for cosmological constant
8
is the gravitational growth index.
≈ 0.55 for General Relativity
Note: in the absence of dark energy, m>1 would eventually cause the
Universe to re-collapse.