x rays and-protostars_in_the_trifid_nebula
TRANSCRIPT

THE ASTROPHYSICAL JOURNAL, 562 :446È455, 2001 November 20( 2001. The American Astronomical Society. All rights reserved. Printed in U.S.A.
X-RAYS AND PROTOSTARS IN THE TRIFID NEBULA
JEONGHEE RHO
Infrared Processing and Analysis Center, California Institute of Technology, MS 100-22, Pasadena, CA 91125 ; rho=ipac.caltech.edu
MICHAEL F. CORCORAN
NASA Goddard Space Flight Center, Code 662, Greenbelt, MD 20742
YOU-HUA CHU
Department of Astronomy, University of Illinois, 1002 West Green Street, Urbana, IL 61801
AND
WILLIAM T. REACH
Space Infrared Telescope Facility Center, California Institute of Technology, MS 100-22, Pasadena, CA 91125Received 2001 February 19 ; accepted 2001 June 28
ABSTRACTThe TriÐd Nebula is a young H II region, recently rediscovered as a ““ pre-Orion ÏÏ star-forming region,
containing protostars undergoing violent mass ejections visible in optical jets as seen in images from theInfrared Space Observatory and the Hubble Space Telescope. We report the Ðrst X-ray observations ofthe TriÐd Nebula using ROSAT and ASCA. The ROSAT image shows a dozen X-ray sources, with thebrightest X-ray source being the O7 star, HD 164492, which provides most of the ionization in thenebula. We also identify 85 T Tauri star and young, massive star candidates from near-infrared colorsusing the color-color diagram from the Two-Micron All-Sky Survey (2MASS). Ten X-ray sourcesJHK
shave counterpart near-infrared sources. The 2MASS stars and X-ray sources suggest there are potentiallynumerous protostars in the young H II region of the TriÐd. ASCA moderate-resolution spectroscopy ofthe brightest source shows hard emission up to 10 keV with a clearly detected Fe K line. The best modelÐt is a two-temperature (T \ 1.2] 106 K and 39 ] 106 K) thermal model with additional warm absorb-ing media. The hotter component has an unusually high temperature for either an O star or an H II
region ; a typical Galactic H II region could not be the primary source for such hot temperature plasmaand the Fe XXV line emission. We suggest that the hotter component originates in either the interactionof the wind with another object (a companion star or a dense region of the nebula) or from Ñares fromdeeply embedded young stars.Subject headings : H II regions È infrared : stars È stars : formation È X-rays : individual (TriÐd Nebula)
1. INTRODUCTION
H II regions contain various types of X-rayÈemittingsources, such as high- and low-mass stars, binaries, andprotostars. Single massive O and B stars emit soft X-raysfrom shocks in their radiatively unstable, outwardly movingouter atmospheres. X-ray emission from late-type stars isattributed to magnetically heated stellar coronae and mag-netically driven stellar Ñares. Protostars produce X-rays viamagnetic heating and perhaps from accretion or excretiondisks and/or interaction of stellar jets with the circumnebu-lar gas. Massive binaries can produce X-ray emission fromcolliding stellar winds ; close low-mass binaries can produceX-rays via mass exchange and enhanced dynamo action.X-ray emission provides a sensitive tracer of these di†erentstellar populations and, along with infrared colors, is one ofthe main probes for identifying protostars and preÈmain-sequence (PMS) stars.
Studies of X-ray emission from H II/star-forming regionshave made signiÐcant advances because of ROSAT(Casanova et al. 1995), ASCA (e.g., Koyama et al. 1996),and, most recently, Chandra observations (Garmire et al.2000). For example, in the o Oph core region, 70% of thenear-infrared (NIR) sources associated with protostars andmolecular cores have X-ray counterparts (Casanova et al.1995), and a large number of X-ray sources have been foundto be low-mass PMS stars in other star-forming regionssuch as Orion et al. 1996), Chamaeleon et al.(Alcala� (Alcala�
1995 ; Feigelson et al. 1993), Lupus (Krautter et al. 1997),and Taurus-Auriga et al. 1995 ; Wichmann et al.(Neuhu� ser1997). Flarelike X-ray events have been detected from TTauri stars (Kamata et al. 1997 ; Koyama et al. 1992). TheX-rayÈemitting sources in the Monoceros and Rosettemolecular clouds are also mostly T Tauri and Herbig Ae/Bestars and they typically show luminosities of L X D1030È1032 ergs s~1 (Gregorio-Hetem et al. 1998). RecentChandra observation of the Orion Nebula resolved a thou-sand X-rayÈemitting PMS stars with a mass range of 0.05 to50 and a combined infrared and X-ray study suggestedM
_,
that the X-ray luminosity depends on stellar mass, rotation-al history, and magnetic Ðeld (Garmire et al. 2000).
At a distance of 1.67 kpc (Lynds & OÏNeil 1985), theTriÐd Nebula, M20, is one of the best-known astrophysicalobjects and one of the prettiest : it glows brightly in red lightand is trisected by obscuring dust lanes. At an age ofD 3 ] 105 yr, the TriÐd is one of the youngest known H II
regions. Observations with the Infrared Space Observatory(ISO) and the Hubble Space Telescope (HST ) show theTriÐd as a dynamic, ““ pre-Orion ÏÏ star-forming region con-taining young stars undergoing episodes of violent massejections, and protostars (like HH 399) losing mass andenergy to the nebula in optically bright jets (Cernicharo etal. 1998, hereafter CLC98 ; LeÑoch & Cernicharo 2000 ;Hester et al. 1999). The ionization of the nebular gas isdominated by the O7.5 star HD 164492. HD 164492 is a
446

X-RAYS AND PROTOSTARS IN THE TRIFID NEBULA 447
luminosity class V (Levato 1975) or III (Conti & Alschuler1971) star with a bolometric luminosity of L bolD 0.5È1.6] 1039 ergs s~1 and an X-ray luminosity of 6 ] 1032 ergss~1 (Chlebowski et al. 1989). The mass-loss rate of this Ostar is yr~1 (Howarth & Prinja 1989)M0 \ 2 ] 10~6 M
_and the wind terminal velocity is km s~1 (Prinja,V=\ 1580Barlow, & Howarth 1990).
X-ray observations of the TriÐd o†er a uniqueopportunity to study the inÑuence of a massive star on starformation in an exceptionally young star-forming region.Initially, X-ray emission from the TriÐd was reported onlyfrom the O star in the Einstein IPC catalog (Chlebowski &Harnden 1989). We serendipitously discovered a complex ofX-ray emission from the TriÐd Nebula in a PSPC obser-vation of the nearby supernova remnant W28 (Rho et al.1995). Subsequently, we started an extensive investigationof the X-ray emission from the TriÐd Nebula. This paperpresents the Ðrst detection of a dozen X-ray sources in theTriÐd Nebula, and we correlate these with protostar candi-dates identiÐed using the Two-Micron All-Sky Survey(2MASS) data. The ROSAT images show multiple pointsources, including HD 164492 and several T Tauri stars,and the ASCA spectra show hard X-ray emission, includingdetection of an Fe K line. We discuss identiÐcations of theX-rayÈemitting sources and the origin of the unusually hardX-ray emission from the TriÐd.
2. X-RAY SOURCES IN THE TRIFID
2.1. X-Ray ObservationsThe TriÐd Nebula was observed using the X-ray tele-
scope on ROSAT 1993) with the Position Sensi-(Tru� mpertive Proportional Counter (PSPC) as the imaging detector.The PSPC on-axis angular resolution is 25A (FWHM, at 1keV), and the PSPC covers a 2¡ Ðeld of view in the 0.1È2.4keV energy band. Two PSPC observations were analyzedfor this paper : rp900375 centered on HD 164492 andobserved on 1993 September 8 for an exposure of 9365 s(PI : S. Snowden), and rp500236 centered on the supernovaremnant W28 and observed on 1993 April 1 for an exposureof 10,476 s (PI : R. Pisarski ; Rho et al. 1995).
We also performed an ASCA observation (PI : J. Rho ;sequence number 26051000) toward the center of the TriÐdNebula. The observation took place on 1998 September 30to October 2. ASCA (TI & H94) has two detector pairs : GasImaging Spectrometers (GIS2 and GIS3) and Solid-StateImaging Spectrometers (SIS0 and SIS1). The SIS covers anenergy band of 0.5È10 keV and the GIS 0.6È10 keV. Theon-axis angular resolution of the GIS and SIS is about 1@È[email protected] GIS counter has a circular Ðeld of view of 35@ diameterwhile the Ðeld of view of each SIS CCD is an 11@ square ;thus, both GIS and SIS detectors sufficiently cover theentire TriÐd Nebula. We Ðltered the data using a few cri-teria such as cuto† rigidity (COR) and earth elevation(based on Revison 2 processing). After Ðltering, the expo-sure time was 57 ks for the GIS and 53.5 ks for the SIS. Theentire TriÐd Nebula region after background subtractionhas count rates of 0.050 ^ 0.001 counts s~1 for SIS0,0.040^ 0.001 counts s~1 for SIS1, 0.030 ^ 0.008 counts s~1for GIS2, 0.039^ 0.009 counts s~1 for GIS3, and0.086^ 0.004 counts s~1 for the ROSAT PSPC, in theirrespective energy bands (integrated over all channels).
2.2. X-Ray Source IdentiÐcationThe ROSAT PSPC image of the TriÐd Nebula is shown
in Figure 1. This image reveals for the Ðrst time that theTriÐd Nebula contains numerous X-ray sources. We haveidentiÐed X-ray sources in the PSPC image using theFTOOLS task SRCDETECT and estimated the count ratesand uncertainties. The detected point sources are presented,in order of increasing right ascension, in Table 1 andmarked in Figure 1. Table 1 lists the position, count rate,and p of detection for 10 sources detected at greater than 3p and two possible sources (sources 11 and 12) detected withsomewhat lower conÐdence. We deÐne here new X-raysources detected in the ROSAT PSPC image, as ROSATX-ray source in the TriÐd (RXT). Since the count rate is verysmall except for the O star HD 164492, we estimated theluminosity by assuming an absorption column density
see ° 4 for details), and aNH \ 3 ] 1021cm~2 (AV
D 1.5m,thermal spectrum with kT \ 1 keV. The X-ray emission ofPMS stars is understood to be thermal emission from gasrapidly heated to a temperature of D1 keV by violent mag-netohydrodynamic reconnection events (Feigelson &Montmerle 1999). The correspondence between the PSPCcount rate and the X-ray unabsorbed Ñux is 1 ] 10~3PSPC counts s~1 D2.95] 10~14 ergs s~1 cm~2. Using thisconversion, the luminosities of the X-ray sources are com-puted and given in Table 1.
We have examined the source list database usingSIMBAD, identiÐed counterparts to the X-ray sources atother wavelengths, and marked them in Figure 1. To visual-ize the correspondence of X-ray sources with either opticalor radio sources, we have plotted the X-ray contours overan Ha image (F. Winkler, 2001, private communication) inFigure 2. Twenty-four sources from the Guide Star Catalog(GSC) are visible in the Ha image in Figure 2. The brightestX-ray point source, RXT8 in Table 1, corresponds to the Ostar HD 164492. The possible X-ray source RXT11 coin-cides with the B8 star HD 313596 (R.A. 18h02m35s and decl.[22¡59@54A), and the possible X-ray source RXT12 with the
FIG. 1.ÈPSPC X-ray image and detected sources (RXT) are markedwith numbers. Count rates for each source are listed in Table 1. Knownsources are also marked with the labels.

448 RHO ET AL. Vol. 562
TABLE 1
X-RAY SOURCES DETECTED IN THE PSPC IMAGE OF THE TRIFID NEBULA
Name R.A. (2000) Decl. (2000) Count Rate Detection (p) log (L X)
RXT1 . . . . . . . 18 02 52.8 [23 02 18.1 0.0014 ^ 0.0005 5 31.12RXT2 . . . . . . . 18 02 39.3 [22 58 34.3 0.0011 ^ 0.0004 3.5 31.02RXT3 . . . . . . . 18 02 41.18 [23 03 51.8 0.0014 ^ 0.0006 3.5 31.12RXT4 . . . . . . . 18 02 36.0 [23 01 36.3 0.0019 ^ 0.0006 4 31.05RXT5 . . . . . . . 18 02 35.0 [23 01 29.4 0.0021 ^ 0.0006 4.5 31.29RXT6 . . . . . . . 18 02 27.9 [22 59 47.9 0.0016 ^ 0.0006 4 31.17RXT7 . . . . . . . 18 02 25.4 [22 59 51.4 0.0010 ^ 0.0005 3 30.97RXT8 . . . . . . . 18 02 23.35 [23 01 47.0 0.0131 ^ 0.0013 8 (see Table 4)RXT9 . . . . . . . 18 02 21.1 [23 03 21.5 0.0010 ^ 0.0004 4 30.97RXT10 . . . . . . 18 02 12.38 [22 55 37.0 0.0012 ^ 0.0004 4.5 31.05RXT11 . . . . . . 18 02 34.92 [22 59 55.6 0.0006 ^ 0.0003 2.5 30.75RXT12 . . . . . . 18 02 31.67 [23 02 25.6 0.0007 ^ 0.0003 2.5 30.82
NOTE.ÈUnits of right ascension are hours, minutes, and seconds, and units of declination are degrees, arcmin-utes, and arcseconds.
optical star GSC–06842–00001 (R.A. and decl.18h02m34s.8None of the other GSC stars coincide with[23¡[email protected]).
X-ray peaks. A radio source, GPSR5 6.980[0.286 (R.A.and decl. Becker et al. 1994), is18h02m28s.1 [23¡[email protected] ;
close to the X-rayÈemitting area but does not have a corre-sponding X-ray peak. Four protostars (TC0, TC1, TC3, andTC4 sources1 in CLC98) have been reported in the TriÐdNebula (CLC98), which are marked in Figure 1, but onlyone is close to the X-ray peak at HD 164492. In thenext section, we correlate the PSPC X-ray sources with
1 The source designation TC0, TC1, etc. was assigned by CLC98. Sincethis designation was already in use, for indexing purposes these sourcesshould be referred to as [CLC98] 0, etc.
FIG. 2.ÈPSPC X-ray contours superimposed on an Ha image of theTriÐd Nebula (courtesy of Frank Winkler). The optical image wasobtained on 1994 July 4 (UT) from the Burrell Schmidt telescope of CaseWestern Reserve University through a 25 bandpass Ha Ðlter. TotalA�exposure time is 1800 s, and the scale is pixel~1. The strongest X-ray2A.0peak is at the O star, HD 164492.
sources showing NIR color excesses and present candidateprotostars.
3. NEAR-INFRARED SOURCES FROM 2MASS : YOUNG
STELLAR OBJECTS
We have identiÐed young stellar objects (YSOs) using the2MASS data (Skrutskie et al. 1997). Using identical tele-scopes in the northern and southern hemispheres, 2MASS ismapping the entire sky in the J (1.11È1.36 km), H (1.5È1.8km), and (2È2.32 km) bands to a limiting point-sourceK
ssensitivity of approximately 16.5, 16.0, and 15.5 mag,respectively (Cutri et al. 2000).2 The data toward the TriÐdNebula were taken on 1998 June 14 using the southerntelescope, and most of these data were included in the2MASS Second Incremental Release, but a small portion ofarea was in the 2MASS Working Database because of largephotometric uncertainties at the time of the IncrementalRelease. The photometry is typically better than 5% (Cutriet al. 2000Èsee fn. 2).
We used the 2MASS point-source catalog to extractsources within an 8@ radius centered on R.A. 18h02m30s anddecl. [23¡02@00A. We have selected sources with the follow-ing criteria. First, we selected the sources that were detectedin all three J, H, and bands. We then selected sourcesK
swith a signal-to-noise ratio greater than 10 (i.e., the J, H,and magnitudes are brighter than 15.8, 15.1, and 14.3K
smag, respectively). These selections produced D1100 suchsources. We then accepted sources with photometric uncer-tainties p \ 0.25 mag, for which the Ðt to the point-spreadfunction produced reduced This last criterionsl2\ 2.excluded blended sources that caused higher uncertaintiesin the photometry. This is important in the Galactic planewhere NIR sources are crowded and the 2MASS has alimited spatial resolution This criterion removed inac-(3A.5).curate blue points that appeared in the color-colorJHK
sdiagram (as described below). The criteria we have used areconservative for the magnitude limit and photometricuncertainties of the 2MASS survey.
We plotted the sources in the color-color diagram,JHKsas shown in Figure 3a, in order to identify YSOs with infra-
red color excess. Figure 3b shows versus magni-H[Ks
Kstude for the selected sample. The interstellar reddening
2 See R. M. Cutri et al. 2000, at http ://www.ipac.caltech.edu/2mass/releases/ Ðrst/doc/explsup.html.

No. 1, 2001 X-RAYS AND PROTOSTARS IN THE TRIFID NEBULA 449
FIG. 3a FIG. 3b
FIG. 3c
FIG. 3.È(a) Near-infrared color-color diagram: location in color-color diagram is used to determine T Tauri stars and massive YSOs. Normal starsJHKs(dots), T Tauri stars (Ðlled circles), and massive YSOs (diamonds) are shown with di†erent symbols. The 2MASS counterparts of X-ray sources are marked
with crosses ; the sources above the extinction curve have high photometric uncertainties. They are 2MASS-red stars in Table 3 (see text for details).Extinction vector is shown for 5 mag as the thick line labeled Thick curves are intrinsic colors of giant and dwarf stars. (b) Diagram of vs. TA
v. H [ K
sK
s.
Tauri stars and young massive protostars fall below (younger age) the PMS stars in this diagram. Symbols are the same as in (a). (c) T Tauri stars (circles) andmassive YSOs (diamonds), X-ray sources (crosses), and known embedded YSOs (triangles : from Cernicharo et al. 1998) are marked on optical image. (d)2MASS three-color image (blue, green, and red for J, H, and respectively). Symbols are the same as in (c). The di†use, blue emission is probably Pab (inK
s,
the J band) from the H II region.
vector from Rieke & Lebofsky (1985) is also plotted. Adopt-ing the intrinsic colors of giant and dwarf stars from Bessell& Brett (1988), we Ðnd the visual extinction toward thisdirection is as high as mag for stars on the backA
V\ 30
side of the TriÐd Nebula. The observed colorsJHKsof YSOs can be explained by circumstellar disk models
(Lada & Adams 1992). We identiÐed the T Tauri stars with(J[H)CTTS \ 0.58^ 0.11] (H[K
s)CTTS ] 0.52^ 0.06
(Meyer, Calvet, & Hillenbrand 1997) and mag,H[Ks[ 0.6
where CTTS is classical T Tauri stars. These T Tauri starsfall between the two solid lines in Figure 3a. The stars below
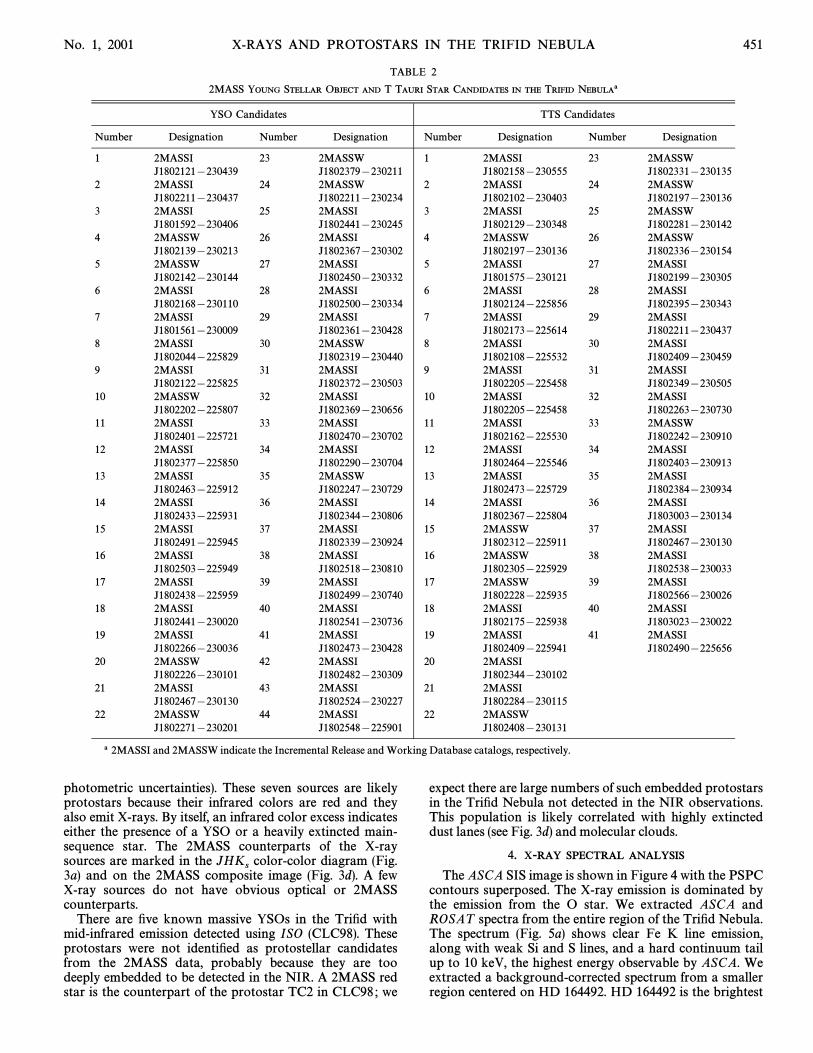
the extinction curve (dashed line in Fig. 3a) and above the TTauri star lines (solid line in Fig. 3a) are massive YSOs(Lada & Adams 1992) ; these stars are plotted as diamondsin Figure 3a. In total, we found 41 T Tauri star candidatesand 44 massive YSO candidates from the 2MASS sourcesthat are listed in Table 2. The T Tauri stars and YSOs aregenerally located along the ionization front. Figure 3cshows optical images, and T Tauri stars, massive YSOs, andX-ray sources are marked. Figure 3d shows a color compos-ite of the J, H, and images, with the J image in blue, HK
simage in green, and image in red. T Tauri stars, massiveKs

450 RHO ET AL. Vol. 562
FIG. 3d
YSOs, and X-ray sources are marked. The image also showsa number of protostars at the ionization front along thedust lane.
These protostar candidates were cross-correlated withthe X-ray sources. Taking into account the resolution of thePSPC, we identify a possible coincidence if the separationbetween a 2MASS source and an X-ray source is less than15A. Three X-ray sources (RXT1, RXT6, and RXT7) arecoincident with either T Tauri stars or YSOs ; they arenoted in Table 3. Figure 3d shows that many red 2MASSstars within the X-ray source error boxes could be con-sidered coincidences, but they are not included in the list ofsources selected according to the aforementioned conserva-
tive criteria as they are not detected in one or both of the Jand H bands. Therefore, we have relaxed the selection cri-teria and extracted 2MASS sources from the same area,excluding only sources with an artifact Ñag. We made a listof the 2MASS sources that are within 15A from X-raysources. Each X-ray source has D10 2MASS counterpartcandidates ; only the red stars are identiÐed as possiblecounterparts to the X-ray sources. Seven red 2MASS starcounterparts of X-ray sources are identiÐed and listed inTable 3, with J, H, and magnitudes and reasons thatK
sthey were not selected in the earlier list of T Tauri star ormassive YSO candidates (either J \ ““ Ðll ÏÏ or high reduceds2, indicating multiple or extended sources with large
No. 1, 2001 X-RAYS AND PROTOSTARS IN THE TRIFID NEBULA 451
TABLE 2
2MASS YOUNG STELLAR OBJECT AND T TAURI STAR CANDIDATES IN THE TRIFID NEBULAa
YSO Candidates TTS Candidates
Number Designation Number Designation Number Designation Number Designation
1 2MASSI 23 2MASSW 1 2MASSI 23 2MASSWJ1802121[230439 J1802379[230211 J1802158[230555 J1802331[230135
2 2MASSI 24 2MASSW 2 2MASSI 24 2MASSWJ1802211[230437 J1802211[230234 J1802102[230403 J1802197[230136
3 2MASSI 25 2MASSI 3 2MASSI 25 2MASSWJ1801592[230406 J1802441[230245 J1802129[230348 J1802281[230142
4 2MASSW 26 2MASSI 4 2MASSW 26 2MASSWJ1802139[230213 J1802367[230302 J1802197[230136 J1802336[230154
5 2MASSW 27 2MASSI 5 2MASSI 27 2MASSIJ1802142[230144 J1802450[230332 J1801575[230121 J1802199[230305
6 2MASSI 28 2MASSI 6 2MASSI 28 2MASSIJ1802168[230110 J1802500[230334 J1802124[225856 J1802395[230343
7 2MASSI 29 2MASSI 7 2MASSI 29 2MASSIJ1801561[230009 J1802361[230428 J1802173[225614 J1802211[230437
8 2MASSI 30 2MASSW 8 2MASSI 30 2MASSIJ1802044[225829 J1802319[230440 J1802108[225532 J1802409[230459
9 2MASSI 31 2MASSI 9 2MASSI 31 2MASSIJ1802122[225825 J1802372[230503 J1802205[225458 J1802349[230505
10 2MASSW 32 2MASSI 10 2MASSI 32 2MASSIJ1802202[225807 J1802369[230656 J1802205[225458 J1802263[230730
11 2MASSI 33 2MASSI 11 2MASSI 33 2MASSWJ1802401[225721 J1802470[230702 J1802162[225530 J1802242[230910
12 2MASSI 34 2MASSI 12 2MASSI 34 2MASSIJ1802377[225850 J1802290[230704 J1802464[225546 J1802403[230913
13 2MASSI 35 2MASSW 13 2MASSI 35 2MASSIJ1802463[225912 J1802247[230729 J1802473[225729 J1802384[230934
14 2MASSI 36 2MASSI 14 2MASSI 36 2MASSIJ1802433[225931 J1802344[230806 J1802367[225804 J1803003[230134
15 2MASSI 37 2MASSI 15 2MASSW 37 2MASSIJ1802491[225945 J1802339[230924 J1802312[225911 J1802467[230130
16 2MASSI 38 2MASSI 16 2MASSW 38 2MASSIJ1802503[225949 J1802518[230810 J1802305[225929 J1802538[230033
17 2MASSI 39 2MASSI 17 2MASSW 39 2MASSIJ1802438[225959 J1802499[230740 J1802228[225935 J1802566[230026
18 2MASSI 40 2MASSI 18 2MASSI 40 2MASSIJ1802441[230020 J1802541[230736 J1802175[225938 J1803023[230022
19 2MASSI 41 2MASSI 19 2MASSI 41 2MASSIJ1802266[230036 J1802473[230428 J1802409[225941 J1802490[225656
20 2MASSW 42 2MASSI 20 2MASSIJ1802226[230101 J1802482[230309 J1802344[230102
21 2MASSI 43 2MASSI 21 2MASSIJ1802467[230130 J1802524[230227 J1802284[230115
22 2MASSW 44 2MASSI 22 2MASSWJ1802271[230201 J1802548[225901 J1802408[230131
a 2MASSI and 2MASSW indicate the Incremental Release and Working Database catalogs, respectively.
photometric uncertainties). These seven sources are likelyprotostars because their infrared colors are red and theyalso emit X-rays. By itself, an infrared color excess indicateseither the presence of a YSO or a heavily extincted main-sequence star. The 2MASS counterparts of the X-raysources are marked in the color-color diagram (Fig.JHK
s3a) and on the 2MASS composite image (Fig. 3d). A fewX-ray sources do not have obvious optical or 2MASScounterparts.
There are Ðve known massive YSOs in the TriÐd withmid-infrared emission detected using ISO (CLC98). Theseprotostars were not identiÐed as protostellar candidatesfrom the 2MASS data, probably because they are toodeeply embedded to be detected in the NIR. A 2MASS redstar is the counterpart of the protostar TC2 in CLC98 ; we
expect there are large numbers of such embedded protostarsin the TriÐd Nebula not detected in the NIR observations.This population is likely correlated with highly extincteddust lanes (see Fig. 3d) and molecular clouds.
4. X-RAY SPECTRAL ANALYSIS
The ASCA SIS image is shown in Figure 4 with the PSPCcontours superposed. The X-ray emission is dominated bythe emission from the O star. We extracted ASCA andROSAT spectra from the entire region of the TriÐd Nebula.The spectrum (Fig. 5a) shows clear Fe K line emission,along with weak Si and S lines, and a hard continuum tailup to 10 keV, the highest energy observable by ASCA. Weextracted a background-corrected spectrum from a smallerregion centered on HD 164492. HD 164492 is the brightest

452 RHO ET AL. Vol. 562
TABLE 3
INFRARED COUNTERPARTS OF THE X-RAY SOURCES DETECTED IN PSPC IMAGES
2MASSa db Jd Hd Ksd
RXT Counterparts (arcsec) R.A. (2000)c Decl. (2000)c (mag) (mag) (mag) Commentse
RXT1 . . . . . . . . YSO 10 18 02 52.4 [23 02 27.2 15.17 13.93 13.18 . . .RXT2 . . . . . . . . red 8 18 02 39.7 [22 58 29.0 17.72 15.06 13.50 J \ ““ Ðll ÏÏRXT3 . . . . . . . . red 5 18 02 41.4 [23 03 48.2 17.83 14.24 12.42 J \ ““ Ðll ÏÏ
red 13 18 02 40.4 [23 03 58.9 15.58 12.37 10.90 High psf *s2RXT4 . . . . . . . . red 12.8 18 02 36.8 [23 01 43.9 15.85 12.78 11.34 High psf *s2RXT5 . . . . . . . . NONE . . . . . . . . . . . . . . . . . . . . .RXT6 . . . . . . . . TTS 13 18 02 30.5 [22 59 28.7 12.71 11.65 10.91 . . .RXT7 . . . . . . . . YSO 12 18 02 26.6 [23 00 36.0 15.21 12.90 11.34 . . .RXT8f . . . . . . . Multiple . . . . . . . . . . . . . . . . . . . . .RXT9 . . . . . . . . red 6 18 02 21.5 [23 03 19.0 15.04 13.58 11.87 J \ ““ Ðll ÏÏRXT10 . . . . . . NONE . . . . . . . . . . . . . . . . . . . . .RXT11f . . . . . . red 4 18 02 34.7 [22 59 52.1 16.52 12.42 10.58 J \ ““ Ðll ÏÏRXT12 . . . . . . red 9 18 02 31.3 [23 02 18.2 15.12 13.17 11.36 J \ ““ Ðll ÏÏ
NOTE.ÈUnits of right ascension are hours, minutes, and seconds, and units of declination are degrees, arcminutes, andarcseconds.
a Notes for the 2MASS sources : TTS\ T Tauri star ; YSO \ massive young stellar object ; red \ red 2MASS star.b Projected distance between the X-ray and 2MASS sources.c Coordinates of the 2MASS counterparts.d J, H and magnitudes of the 2MASS sources.K
se J \ ““ Ðll ÏÏ means the J-band photometry is measured in band-Ðlled within the aperture, indicating their photometricuncertainties are large. ““ High psf *s2 ÏÏ means the goodness of the Ðt of a point-spread function is high, indicating the sources areeither extended or unresolved double sources.
f RXT8 is HD 164492 (O7 star) and/or YSO (TC1 in CLC98), and RXT11 also coincides with HD 313596 (B8 star).
X-ray source in the TriÐd, and the shape of the spectrum ofthe entire region in the ASCA data is not signiÐcantly di†er-ent from the spectrum of this star alone because of thebroad ASCA point-spread function. We made hard ([3keV) and soft (\3 keV) maps using the ASCA data, but noobvious di†erence was noticeable at the spatial resolution(1@) of ASCA. We also extracted an o†-source ASCA spec-trum in this direction, suspecting a contribution from theGalactic ridge emission. However, the o†-source spectrum
FIG. 4.ÈASCA SIS image (gray scale ranges 0.7È4.5 counts (6A.4pixel~1) superposed on ROSAT contours.
showed that the observed o†-source emission is dominatedby scattered emission from sources within the TriÐdNebula. The detection of hard emission from the TriÐd isunusual because most single O stars have very little emis-sion at energies above 2 keV and rarely show Fe K emission(Corcoran et al. 1993). The only massive stars to show suchhard X-ray spectra are binaries, either high-mass X-raybinaries (HMXBs) with collapsed companions or collidingwind binaries with noncollapsed (O or W-R star) compan-ions that have strong stellar winds and signiÐcant collidingwind X-ray emission.
We simultaneously Ðt the set of Ðve spectraÈtheROSAT /PSPC, ASCA/SIS0, SIS1, GIS2, and GIS3spectraÈusing single- or two-temperature thermal models(Mewe-Kaastra plasma model ; Kaastra 1992) with a singleabsorbing column density The Ðts were unacceptableNH.(reduced s2 of 3). We next attempted a two-temperaturemodel. Following Corcoran et al.Ïs (1994) models of d Oriand j Ori, we also included an additional ionized (““ warm ÏÏ)absorbing medium, as representative of the photoionizedstellar wind material (Waldron 1984 ; Corcoran et al. 1994),and allowed di†erent amounts of absorption for the hot andcold components. The line-of-sight extinction value isknown toward this direction ; mag, i.e.,A
V\ 1.3È1.5
E(B[V ) D 0.3È0.4 mag (Kohoutek, Mayer, & Lorenz 1999 ;Lynds & OÏNeil 1985). Using E(B[V ) of 0.4 mag, we expectan ISM of D3 ] 1021 cm~2, with which we have ÐxedNHthe value in our Ðt (also note that when we allow toNH NHvary, 3 ] 1021 cm~2 falls within the errors). The modelyielded an acceptable Ðt with keV (1.2] 106 K)kT1D 0.14and cm~2, and a hotter component withNH,1\ 5.9] 1021
keV (3.9] 107 K) and cm~2,kT2D 3.3 NH,2 \ 2.7 ] 1021with a line-of-sight ISM cm~2. The abun-NH \ 3 ] 1021dances are Ðxed at solar abundances. The Ðt results aresummarized in Table 4, along with the Fe K line character-istics. The cold component arises from the O star atmo-sphere, but the hot component might arise from a number

No. 1, 2001 X-RAYS AND PROTOSTARS IN THE TRIFID NEBULA 453
FIG. 5a
FIG. 5b
FIG. 5c
FIG. 5.È(a) GIS1 and GIS2 spectra of the TriÐd Nebula with its best Ðtof a two-temperature thermal model with additional warm absorbingmedia. Hard emission and Fe XXV line appear in the spectra. (b) SIS0 andSIS1 and PSPC spectra with the best Ðts. (c) Each of two temperaturecomponents (D1.2] 106 K and 3.9 ] 107 K) is marked on the SIS0spectrum.
of di†erent sources, such as unresolved interacting binaries,active low-mass stars, or PMS stars.
5. THE NATURE OF THE HARD X-RAY COMPONENT
Our simultaneous ASCA/PSPC Ðts yield a total X-rayluminosity of 1.9È2.5] 1034 ergs s~1 (0.3È10 keV) using thetwo-temperature model shown in Table 4. If attributed toHD 164492, then the ratio of X-ray and bolometric lumi-nosities is between [5.0 and [4.5, which is( \ log L X/L bol)much higher than the typical ratios of log forL X/L bol D[7a single O-type star (Chlebowski & Harnden 1989 ;
Schmitt, & Cassinelli 1996). The 3 keV X-rayBergho� fer,component is somewhat of a mystery since winds fromsingle O-type stars are not known to produce such high-temperature emission. Typically the highest temperatureemission observed in O star X-ray spectra has kT \ 1 keV(e.g., Corcoran et al. 1994).
We discuss a few possibilities to explain the hot com-ponent in the TriÐd Nebula. It may be that the hot com-ponent arises in the interaction of the wind from the O7.5star with another object (either a companion star or a denseregion of the nebula) outside the O star atmosphere. Collid-ing winds between an early-type star and an early-typecompanion (another O star or a Wolf-Rayet star) canproduce shock-heated material in the wind interactionregions (Stevens, Blondin, & Pollock 1992), reaching tem-peratures of 107[108 K, and emit X-rays. However, recentphotometric and spectroscopic studies of this region foundno evidence of a companion for HD 164492 (Kohoutek,Mayer, & Lorenz 1999). Unless the collision occurs far fromthe star (d [ 25@@), it will be unresolved to the ROSATPSPC. However, recent radio and NIR observationstoward the central region of the TriÐd detected threesources close to the O star (Yusef-Zadeh et al. 2000), whichmay be either stars or nebular knots photoionized by theUV Ðeld of HD 164492.
Hard emission could also arise in single O stars fromnonthermal emission produced by Fermi acceleration byshocks in the O star wind (Chen & White 1991). The hardcomponent is suggested as a nonthermal tail produced byinverse Comptonization of the photospheric UV Ðeld by apopulation of fast particles accelerated by a distribution ofshocks. Although it is not possible to determine if the hardemission is from a nonthermal tail or the two thermal tem-perature components from goodness of the Ðt to the spectra,the presence of the Fe K line suggests that the second com-ponent is thermal. The sources of the two spectral com-ponents need to be resolved spatially in order to determinetheir origins. Enhanced hard X-ray emission might also beproduced by an oblique magnetic rotator, as is suspected inanother O7 star, h1 Orionis C, the central star of the OrionNebula et al. 1997).(Gagne�
The X-ray properties of the core of the H II region W3share a number of similarities to the TriÐd emission. ForW3, the luminosity is a few 1033 ergs s~1 with a similarlyhigh temperature (Hofner & Churchwell 1997). In W3 (andpossibly in the TriÐd), the high-temperature componentmay be produced by a hot, wind-shocked cavity that resultswhen strong stellar winds interact with a surrounding densemolecular cloud (e.g., Churchwell 1990). The presence of aknown YSO (TC1 in CLC98) is consistent with the presenceof a molecular cloud in the TriÐd. In addition, IRAS obser-vations of HD 164492 (van Buren, Noriega-Crespo, &Dgani 1995) show a bow-shock structure around the star,

454 RHO ET AL. Vol. 562
TABLE 4
SPECTRAL FIT RESULTS FROM SIMULTANEOUS FIT USING ASCA/PSPC
Parameters TriÐd
ISM NH (1021 cm~2) . . . . . . . . . . . . . . . . . . . . . . . . . . 4 3T2 . . . . . . . . . . . . . . . . . . . . . . . . . . . . . . . . . . . . . . . . . . . . . . . . 3.3 ^ 0.6 keV (\ 3.9 ] 107 K)log EM2(cm~3) . . . . . . . . . . . . . . . . . . . . . . . . . . . . . . . . . 55.8Wind NH, hot component (1021 cm~2) . . . . . . 2.7~2.0`2.3T1 . . . . . . . . . . . . . . . . . . . . . . . . . . . . . . . . . . . . . . . . . . . . . . . . 0.14~0.04`0.06 keV (\ 1.2 ] 106 K)log EM1(cm~3) . . . . . . . . . . . . . . . . . . . . . . . . . . . . . . . . . 57.4Wind NH, 1 component (1021 cm~2) . . . . . . . . 5.9~0.9`1.1Flux . . . . . . . . . . . . . . . . . . . . . . . . . . . . . . . . . . . . . . . . . . . . . 2^ 0.5 ] 10~12Unabsorbed Ñux . . . . . . . . . . . . . . . . . . . . . . . . . . . . . . . 8^ 2 ] 10~11Luminosity (ergs s~1) . . . . . . . . . . . . . . . . . . . . . . . . . 2.5] 1034 [d(kpc)/(1.67 kpc)]2Fe K Line central energy (keV) . . . . . . . . . . . . . . 6.65~0.2`0.1Fe K equivalent width (keV) . . . . . . . . . . . . . . . . . 1.7 ^ 0.3Fe K Ñux (photons s~1 cm~2) . . . . . . . . . . . . . . . 6(^ 0.4)] 10~4
perhaps indicative of a wind-cloud collision that mightproduce the high-temperature X-ray emission. The stellarwind outÑow at a speed of 1600 km s~1 should produce apostshock temperature of D30 million degrees, though theobserved temperature may be lower since radiative coolingis rapid. CLC98 suggested that the HCO` molecular clouds(likely the dust lanes) are fragmented shell around thenebula. In other words, the clouds and dust lanes we see inthe optical image are located at the surface of the ionizedsphere. If this is the case, the 1600 km s~1 wind will beinteracting with the lower density, ionized medium, and theshocked stellar wind can emit at high temperatures whilethe photoionized materials of the edge of clouds couldsupply sufficient density to emit strong X-rays.
The other possibility is that the hot component arisesfrom deeply embedded young stars, especially since at leastone embedded T Tauri star (TC1 in CLC98, which ismarked in Fig. 1) exists near the O star. The TC1 source inCLC98 shows a large shift in the spectral energy distribu-tion and violent ejections of high-velocity material (CLC98).Other ASCA observations showed bright X-ray sourceswith temperatures of 2È5 keV caused by Ñares of protostarsin the o Ophiuchi dark cloud (Koyama et al. 1992), theOrion Nebula (Yamauchi & Koyama 1993), and the RCoronae Australis molecular cloud (Koyama et al. 1996).The hard emission was attributed to Ñares from individualPMS stars with typical X-ray luminosities in the range1030È1032 ergs s~1, and the peak luminosity of Ñares isshown to be as large as 1033È1035 ergs s~1 and a tem-perature as high as 108 K (Feigelson & Montmerle 1999 ;Grosso et al. 1997). The hard emission from W3 may be of asimilar origin. Signs of active star formation in the TriÐdhave been reported recently (LeÑoch et al. 2001) : there is adust cocoon or circumstellar disk around several membersin the center of the TriÐd, and one young stellar sourceshows a silicate feature in the circumstellar disk. Neither theo Ophiuchi dark cloud nor the R Coronae Australis molec-ular cloud is as bright in hard X-rays as the TriÐd Nebula,which may imply there are a higher number of protostarspresent in the TriÐd. A large number of protostars unre-solved to ASCA would dilute any Ñux variability producedby Ñares.
In summary, one of two scenarios is likely responsible forthe hard emission : The emission may arise from HD 169942by the interaction of the wind from the O star with anotherobject (a companion star or a dense region of the nebula) or
from unresolved emission from active PMS stars. With ourcurrent data, we cannot determine if one is more favoredthan the other. To conclusively identify the hot component,a high-resolution image is needed to locate the emittingobject to determine whether the observed emission is pro-duced near the O star or whether a distributed group ofactive PMS stars dominates the observed emission. Alongwith the images, time-resolved spectra could allow us todistinguish whether the hard emission is Ñarelike (timevariable).
6. IDENTIFICATION OF X-RAY AND INFRARED SOURCES
WITHIN THE TRIFID
The detected X-ray sources and their counterparts arelisted in Table 3. Most of X-ray sources are likely protostarsor PMS stars ; one source is a T Tauri star, two are massiveprotostars, and the others are unclassiÐed protostars. The
color-color diagram using the 2MASS data suggestsJHKsthat there are D80 protostars present in this nebula. It has
been shown already (CLC98 ; LeÑoch & Cernicharo 2000)that massive protostars (17È60 are forming in theM
_)
TriÐd ; they are associated with molecular gas conden-sations at the edges of clouds and their dynamical ages areless than 104 yr. Whether low-mass protostars and T Tauristars can be formed in a young (3 ] 105 yr) region such asthe TriÐd is still an open question. Low-mass PMS stars ofsimilarly young age were found in the Orion Nebula usingnew Chandra observations (Hillenbrand et al. 1998 ;Garmire et al. 2000). The Chandra observation also showedthe presence of young, low-mass (0.1È3 PMS stars asM
_)
X-ray sources (Garmire et al. 2000). The populations oflow-mass and massive protostars are similar in the TriÐd,while we expect higher populations of low-mass protostarsbased on the initial mass function. This is consistent withthe fact that the TriÐd is a very young H II region ; T Tauristars have yet to form there. The distribution of T Tauristars and massive YSOs is not obviously correlated with themolecular cloud distribution. It is possible that they arehighly embedded in the molecular clouds, and their NIRcolors cannot be fully obtained to identify protostarsbecause either J and/or H Ñux is unavailable. This is consis-tent with the fact that 2MASS images show a higher popu-lation of red stars in the southern part of the TriÐd. TheHST images covering the southern part suggested the pres-ence of embedded stars at the head of the evaporatingglobules (Hester et al. 1999). Deep NIR images and spec-

No. 1, 2001 X-RAYS AND PROTOSTARS IN THE TRIFID NEBULA 455
troscopy will likely reveal hundreds of young protostars inthe TriÐd as suggested by 2MASS and HST data.
Whether di†use X-ray emission exists within the TriÐdNebula is currently unknown because of the limited spatialresolution of the PSPC images. For the unidentiÐed X-raysources 5 and 10, we cannot determine whether they are apart of di†use emission or real point sources. They are verylikely normal stars, but the possibility that they are knots ofdi†use emission cannot be ruled out. Di†use X-ray emissionfrom H II regions has been detected, although it is rare. Afew examples have been found, such as in the CarinaNebula (Seward & Chlebowski 1982), RCW 49 (Goldwurm,Caraveo, & Bignami 1987 ; Belloni & Mereghetti 1994), andthe Cygnus Superbubble (Bochkarev & Sitnik 1985), andrecently Wang (1999) reported di†use X-ray emission fromthe giant H II region 30 Dor in the Large Magellanic Cloud.ROSAT and Broadband X-Ray T elescope observations ofthe Carina Nebula show large-scale di†use emission over atleast 40@, as well as discrete X-ray sources and hot gas sur-rounding g Car (Corcoran et al. 1995). The nature of di†useemission is unclear in H II regions. Seward & Chlebowski(1982) suggested that stellar winds from the OB associationadequately heat the plasma. Wang (1999) suggested that theX-ray thermal di†use emission arises in blister-shapedregion by loops of ionized gas and the structure is explainedby the mass loading of the hot gas produced by the centralOB association.
We compare the TriÐd Nebula with 30 Dor to determinewhether stellar winds in the TriÐd may produce observabledi†use X-rays. The stellar wind luminosity in 30 Dor is afew ] 1039 ergs s~1, and the X-ray luminosity of 30 Dor isD1038 ergs s~1 (Wang 1999). The stellar wind luminosity ofHD 146692 is yr~1)(V /L
w\ 1.7 ] 1036(M0 /2 ] 10~6 M
_1580 km s~1)2 ergs s~1. If the TriÐd emits di†use X-rays
similarly to 30 Dor, we would expect D1035 ergs s~1 di†useX-ray emission from the TriÐd. This is higher than the totalX-ray luminosity of the TriÐd. It is likely that supernovaheating contributes signiÐcantly to the bright X-ray emis-sion from 30 Dor. The TriÐd Nebula is too young to havehosted supernova explosions, so its di†use X-ray emissionshould be much fainter than that of 30 Dor.
Future high-resolution X-ray observations by new tele-scopes such as Chandra and XMM should be able toresolve the O star from its immediate environment and dis-crete X-ray sources, such as T Tauri stars, numerous pro-tostars, young and old normal stars, and to resolve thesource of the high-temperature emission. A deep NIR imagewith other wavelength observations can identify the PMSstars and protostars and their mass populations. The TriÐdNebula is an exciting laboratory to understand the earlystage of star-forming activities in H II region.
We thank Lynne Hillenbrand for helpful discussion onnear-infrared colors of protostars and protostar diskmodels and for useful comments on the manuscript andJohn Carpenter for helpful discussion on 2MASS data. Wethank Frank Winkler for allowing us to reproduce hisoptical image. For J. R., this work is partially supported byNASA/ADP grant, NASA-1407. This publication makesuse of data products from the Two-Micron All-Sky Survey,which is a joint project of the University of Massachusettsand the Infrared Processing and Analysis Center, funded bythe National Aeronautics and Space Administration andthe National Science Foundation. J. R. and W. T. R.acknowledge the support of the Jet Propulsion Laboratory,California Institute of Technology, which is operated undercontract with NASA.
REFERENCESJ. M., et al. 1995, A&AS, 114, 109Alcala� ,
ÈÈÈ. 1996, A&AS, 119, 7Becker, R. H., White, R. L., Helfand, D. J., & Zoonematkermani, S. 1994,
ApJS, 91, 347Belloni, R., & Mereghetti, S. 1994, A&A, 286, 935
T. W., Schmitt, J. H. M. M., & Cassinelli, J. P. 1996, A&AS, 118,Bergho� fer,481
Bessell, M. S., & Brett, J. M. 1988, PASP, 100, 1134Bochkarev, N. G., & Sitnik, T. G. 1985, Ap&SS, 108, 237Casanova, S., Montmerle, T., Feigelson, E. D., & Andre, P. 1995, ApJ, 439,
752Cernicharo, J., et al. 1998, Science, 282, 462 (CLC98)Chen, W., & White, R. L. 1991, ApJ, 366, 512Chlebowski, T., Harnden, F. R., Jr., & Sciortino, S. 1989, ApJ, 341, 427Churchwell, E. 1990, A&A Rev., 2, 79Conti, P. S., & Alschuler, W. R. 1971, ApJ, 170, 325Corcoran, M. F., Swank, J., Rawley, G., Petre, R., Schmitt, J., & Day, C.
1995, Rev. Mexicana Astron. AstroÐs. Ser. de Conf., 2, 97Corcoran, M., et al. 1993, ApJ, 412, 792ÈÈÈ. 1994, ApJ, 436, L95Feigelson, E. D., Casanova, S., Montmerle, T., & Guibert, J. 1993, ApJ,
416, 623Feigelson, E. D., & Montmerle, T. 1999, ARA&A, 37, 363
M., Caillault, J.-P., Stau†er, J. R., & Linsky, J. L. 1997, ApJ, 478,Gagne� ,L87
Garmire, G., Feigelson, E. D., Broos, P., Hillenbrand, L. A., Pravdo, S. H.,Townsley, L., & Tsuboi, Y. 2000, AJ, 120, 1426
Goldwurm, A., Caraveo, P. A., & Bignami, G. F. 1987, ApJ, 322, 349Gregorio-Hetem, J., Montmerle, T., Casanova, S., & Feigelson, E. D. 1998,
A&A, 331, 193Grosso, N., et al. 1997, Nature, 387, 56Hester, J. J., et al. 1999, BAAS, 194.681Hillenbrand, L. A., et al. 1998, AJ, 116, 1816Hofner, P., & Churchwell, E. 1997, ApJ, 486, L39Howarth, I. D., & Prinja, R. K. 1989, ApJS, 69, 527
Kaastra, J. S. 1992, An X-Ray Spectral Code for Optically Thin Plasmas,SRON-Leiden Rept. (Leiden, Netherlands : SRON)
Kamata, Y., Koyama, K., Tsuboi, Y., & Yamauchi, S. 1997, PASJ, 49, 461Kohoutek, L., Mayer, P., & Lorenz, R. 1999, A&AS, 134, 129Koyama, K., Asaoka, I., Kuriyama, T., & Tawara, Y. 1992, PASJ, 44, L255Koyama, K., Ueno, S., Kobayashi, N., & Feigelson, E. D. 1996, PASJ, 48,
L87Krautter, J., et al. 1997, A&AS, 123, 329Lada, C. J., & Adams F. C. 1992, ApJ, 393, 278LeÑoch, B., & Cernicharo, J. 2000, ApJ, 545, 340LeÑoch, B., et al. 2001, A&A, 368, L13 (erratum 372, L65)Levato, A. 1975, A&AS, 19, 91Lynds, B. T., & OÏNeil, E. J., Jr. 1985, ApJ, 294, 578Meyer, M. R., Calvet, N., & Hillenbrand, L. 1997, AJ, 114, 288
R., Sterzik, M. F., Schmitt, J. H. M. M, Wichmann, R., &Neuha� user,Krautter, J. 1995, A&A, 297, 391
Prinja, R. K., Barlow, M. J., & Howarth, I. D. 1990, ApJ, 361, 607Rho, J.-H., Petre, R., Pisarski, R., & Jones, L. R. 1995, in Ro� ntgenstrahlung
from the Universe, ed. H.-U. Zimmermann et al. (Garching : MPE), 273Rieke, G. H., & Lebofsky, M. J. 1985, ApJ, 288, 618Seward, F. D., & Chlebowski, T. 1982, ApJ, 256, 530Skrutskie, M. F., et al. 1997, in The Impact of Large-Scale Near-IR Sky
Surveys, ed. F. Garzon, N. Epchtein, A. Omont, B. Burton, & P. Persi(Dordrecht : Kluwer), 25
Stevens, I. R., Blondin, J. M., & Pollock, A. M. 1992, ApJ, 386, 265Tanaka, Y., Inoue, H., & Holt, S. S. 1994, PASJ, 46, L37 (TI of H94)
J. 1993, Science, 260, 1769Tru� mper,van Buren, D., Noriega-Crespo, A., & Dgani, R. 1995, AJ, 110, 2914Waldron, W. L. 1984, ApJ, 282, 256Wang, Q. D. 1999, ApJ, 510, L139Wichmann, R., Sterzik, M., Krautter, J., Metanomski, A., & Voges, W.
1997, A&A, 326, 211Yamauchi, S., & Koyama, K. 1993, ApJ, 405, 268Yusef-Zadeh, F., Shure, M., Wardle, M., & Kassim, N. 2000, ApJ, 540,
842