xbrl and quantrix-1 - unitn.italeasrv.cs.unitn.it/smefin.nsf/79ae7b7381746aa4c1256d04004b5c40... ·...
TRANSCRIPT

XBRL and Quantrix Modeler Luca Erzegovesi http://smefin.net
1
Using XBRL and Quantrix Modeler to Analyze Financial Statements – Part 1
by
Luca Erzegovesi
Department of Computer and Management Sciences, University of Trento
This version: December 23, 2006
Abstract
XBRL (eXtensible Business Reporting Language) is a language based on XML for the
electronic communication of business and financial data. This paper is intended to: (1) give a
brief presentation of the XBRL language and its applicability to financial analysis; (2) define
the requirements of a software application supporting financial analysis and planning capable of
processing financial data in the XBRL format; (3) appreciate the potential of Quantrix Modeler,
a multi-dimensional spreadsheet software, as a platform for implementing XBRL-enabled
financial models. The audience for this document is end-users interested in adopting XBRL as a
language for preparing, analyzing and communicating financial information.
Copyright (C) December 2006, by Luca Erzegovesi. Permission to distribute or duplicate this
document, in whole or part, is granted provided reference is made to the source and this
copyright is included in whole copies. Registered trademarks quoted in the paper are property of
their respective owners.
XBRL and Quantrix Modeler Luca Erzegovesi http://smefin.net
2
Summary
1 - Introduction.................................................................................... 3
2 - XBRL and its use in financial analysis............................................. 4
2.1 Main benefits of using XBRL...............................................................................4
2.2 The main components of the XBRL 2.1 specification .........................................5
2.3 XBRL taxonomies................................................................................................5 2.3.1 The schema document..................................................................................................................6 2.3.2 Unique identifiers used in schemata, instances and linkbases ....................................................8 2.3.3 The label linkbase........................................................................................................................9 2.3.4 The reference linkbase...............................................................................................................10 2.3.5 Presentation linkbases and the structure of reports ..................................................................11 2.3.6 Calculation linkbases and the mathematical dependencies among reported items...................13 2.3.7 Definition linkbases ...................................................................................................................17
2.4 XBRL document instances ................................................................................17
2.5 Use of XBRL taxonomy and data documents in financial analysis ...................19 2.5.1 Information contained in financial statements ..........................................................................20 2.5.2 Information contained in disclosures ........................................................................................20
3 - Software tools for financial analysis and Quantrix Modeler ......... 21
3.1 Software tools for financial modeling ..............................................................21
3.2 About multi-dimensional spreadsheets and Quantrix Modeler ........................22 3.2.1 Quantrix Modeler: an end-user’s view......................................................................................23 3.2.2 Quantrix multidimensional model .............................................................................................23
4 - XBRL and two-dimensional spreadsheets..................................... 25
4.1 Spreadsheet add-ins for importing and manipulating XBRL data....................25
4.2 Analyzing imported data in spreadsheets ........................................................26
5 - Managing XBRL in Quantrix.......................................................... 26
5.1 Configuring the DTS..........................................................................................27
5.2 Dictionary matrices...........................................................................................28
5.3 Report matrices ................................................................................................30
5.4 Representing layout and calculations of a report in the taxo matrix...............32
5.5 Document instance information .......................................................................35
5.6 Normalizing and extending context information..............................................37
5.7 Showing a report in the data matrix ................................................................38
5.8 Adding a forecast scenario ...............................................................................40
5.9 Exporting a new version of the document instance with forecasts .................42
6 - Conclusions and directions for future research ............................ 43
7 - References .................................................................................... 44

XBRL and Quantrix Modeler Luca Erzegovesi http://smefin.net
3
1 - Introduction
XBRL (eXtensible Business Reporting Language) is a language for the electronic
communication of business and financial data, which is expected to revolutionize business
reporting. Based on XML, XBRL provides a framework for defining a shared data dictionary of
data items used in financial statements, and reporting templates used for presenting such data. A
financial document expressed in XBRL is a collection of XML elements representing individual
data items identified by tags referring to financial concepts.
This paper is intended to:
− give a brief presentation of the XBRL language and its applicability to financial analysis;
− define the requirements of a software application supporting financial analysis and planning
capable of processing financial data in the XBRL format
− appreciate the potential of Quantrix Modeler, a multi-dimensional spreadsheet software, as a
platform for implementing XBRL-enabled financial models.
The audience for this document is end-users interested in adopting XBRL as a language for
preparing, analyzing and communicating financial information. XBRL is a complex technology,
needing effective tools in order to be exploited in its full potential. I make a case for multi-
dimensional spreadsheet being the right tool for the job.
A thorough treatment of the technical aspects of the XBRL standards is beyond the scope of this
paper. Basic knowledge by the reader of XML, XBRL and financial analysis is presumed.
Readers new to XBRL are pointed to the recent, comprehensive book by Hoffman (see [4]). A
more formal treatment is given in XBRL International official documents (see [7-11]). For
discussion of specific issues, see the XBRL Australia FAQ in [12]. Italian speaking readers will
find a clear introduction to XBRL in our paper by Aste e Panizzolo (see [1]). For additional
information please refer to the XBRL web site http://xbrl.org.
I shall refer to the XBRL 2.1 standard. Exposure to the inner workings of the standard is limited
to what is relevant for end-users of XBRL data. Most of the examples are based on the ifrs-gp
taxonomy, based on the International Financial Reporting Standards issued by the IASB (see [2]
for a clear explanation of the ifrs-gp taxonomy).
The research behind this paper has been carried out at the University of Trento within the
Smefin research project (see http://smefin.net), financed by the Italian Ministry of University
and Research. The Smefin project is aimed at supporting the effective transfer of financial
knowledge into actual decision processes by small and medium enterprises (Sme’s).
Information systems and software solutions making use of XBRL as a language for
communicating financial data play a strategic role in pursuing this goal..
This is the first in a series of papers, where a general introduction to the subject is given.
Section 2 summarizes the reasons behind XBRL and the main components of the standard that
an end-user must understand. In Section 3 a brief survey of software environments for financial
analysis and modeling is presented. In this context, the main features of Quantrix Modeler are
introduced. Section 4 illustrates some of the approaches to using of XBRL in financial analysis
with traditional spreadsheet applications, pointing to their limitations. Section 5 shows how I
tried to reproduce the XBRL object model in Quantrix Modeler, with the aid of a

XBRL and Quantrix Modeler Luca Erzegovesi http://smefin.net
4
straightforward example1. I demonstrate the automatic creation of a report layout taken from the
ifrs-gp taxonomy, and its use for a simple financial analysis task, ending with the export of the
results in XBRL format. Future developments are sketched in the concluding section.
2 - XBRL and its use in financial analysis
XBRL is being developed by an international non-profit consortium of major companies,
organizations and government agencies. It is an open standard, free of license fees. The
fundamental concepts of XBRL are summarized hereafter.
2.1 Main benefits of using XBRL
An excerpt from the XBRL web site, presented in the following box provides a comprehensive
and clear view of the main advantages of using XBRL.
All types of organizations can use XBRL to save costs and improve efficiency in
handling business and financial information. Because XBRL is extensible and
flexible, it can be adapted to a wide variety of different requirements. All
participants in the financial information supply chain can benefit, whether they
are preparers, transmitters or users of business data.
Data Collection and Reporting - By using XBRL, companies and other
producers of financial data and business reports can automate the processes of
data collection. For example, data from different company divisions with
different accounting systems can be assembled quickly, cheaply and efficiently if
the sources of information have been upgraded to using XBRL. Once data is
gathered in XBRL, different types of reports using varying subsets of the data
can be produced with minimum effort. A company finance division, for
example, could quickly and reliably generate internal management reports,
financial statements for publication, tax and other regulatory filings, as well as
credit reports for lenders. Not only can data handling be automated, removing
time-consuming, error-prone processes, but the data can be checked by
software for accuracy. Small businesses can benefit alongside large ones by
standardizing and simplifying their assembly and filing of information to the
authorities.
Data Consumption and Analysis - Users of data which is received
electronically in XBRL can automate its handling, cutting out time-consuming
and costly collation and re-entry of information. Software can also immediately
validate the data, highlighting errors and gaps which can immediately be
addressed. It can also help in analyzing, selecting, and processing the data for
re-use. Human effort can switch to higher, more value-added aspects of
analysis, review, reporting and decision-making. In this way, investment
analysts can save effort, greatly simplify the selection and comparison of data,
and deepen their company analysis. Lenders can save costs and speed up their
dealings with borrowers. Regulators and government departments can
assemble, validate and review data much more efficiently and usefully than they
have hitherto been able to do.
1 The Quantrix model developed for the example, named XBRL and Quantrix Modeler–1.model is available
upon request.

XBRL and Quantrix Modeler Luca Erzegovesi http://smefin.net
5
Source: http://xbrl.org
The applications that we aim to develop or promote in the Smefin project should provide many
of the benefits listed before. The problem is how to implement those functionality in a cost-
effective way that is sustainable by a Sme.
2.2 The main components of the XBRL 2.1 specification
The main components of the XBRL specification used in our analysis are the following:
− XBRL taxonomies, a set of XML schemata and documents defining the structure of
financial information managed by the taxonomy; a taxonomy is composed of the following
documents:
− a schema document, containing the dictionary of concepts used in financial reports;
− a label linkbase, containing descriptive labels for accounting concepts in several
languages and formats;
− a reference linkbase, containing references to law, regulations, accounting standards or
authoritative literature;
− one or more presentation linkbases, defining the layout of reports;
− one or more calculation linkbases, defining the mathematical dependencies among
reported items;
− a definition linkbase, defining equivalence and logical relationships between concepts.
− XBRL instance documents, which contain the information for specific reports, e.g.
financial statements for entity Alfa in year 2004, conformant to a given set of taxonomy
documents.
The domain for an XBRL application is defined by means of a set of coordinated taxonomy
documents, the Discoverable Taxonomy Set (DTS), produced by one or more authorities or
entities. The DTS consists of files that are related together. Both taxonomies and instance
documents can refer to or import other taxonomies so as to re-use concepts that have been
defined elsewhere. A DTS can include user-specific extensions to official taxonomies.
2.3 XBRL taxonomies
As explained in [2], an XBRL taxonomy for accounting applications can be conceived as a set
of templates representing financial statements and accompanying documents which contains all
presentation and disclosure required by a given normative context (defined by business law
and/or generally accepted accounting principles) and related common practice. The taxonomy is
a collection of concepts and relationships among those concepts. The taxonomy does not define
the concepts, which are taken from pre-existing accounting standards. The connection between
the taxonomy and the standards is limited to the taxonomy being based on the presentation and
disclosure requirements of the standards.
A taxonomy consists of several components. I will not delve into the technical implementation
adopted in the XBRL language. XBRL adopts the Xlink standard for describing logical
relationships among concepts together with the physical location of data linked together. I will
consider a simplified XBRL logical model, clear of the overhead imposed by Xlink constructs,
assuming that our application avails of specific tools (processors, parsers, validators and data
interfaces) for importing and exporting XBRL taxonomies and documents, taking care of
converting between the physical XBRL model and the lightweight logical model I adopt here.
XBRL and Quantrix Modeler Luca Erzegovesi http://smefin.net
6
Nonetheless, I will use as far as possible the correct XBRL terminology for defining concepts
and their attributes or properties.
2.3.1 The schema document
The schema document is the core of an XBRL taxonomy. It is an XML schema document,
stored in a file with an .xsd extension, containing the definition of the concepts of the
taxonomy (serving as a data dictionary). It is integrated by a set of auxiliary information, such
as custom data types and roles used in the taxonomy, used, for example, for enumerating
admissible values for a given concept or attribute, (e.g. the set of reports, or label types).
There are two kinds of XBRL concepts:
− items, containing single, atomic values; standard XBRL types are monetary, string, decimal,
shares, fraction, pure numbers.
− tuples, containing a structured set of concepts related to each other; the concepts belonging
to a tuple may be items and / or other tuples;
Items are typically used for values reported in main financial statements (e.g. revenues in the
Income statement). They belong to closed sets of item types. For a given entity and period an
item can occur only once in an instance document representing a set of mandatory reports.
Inserting two distinct values for Revenues of company Alfa in year 2004 is obviously a
redundancy, or an inconsistency, and is illegal in XBRL, unless one defines more than one
context for the same period (see below, Section 2.4, for a definition of contexts).
The essential information defined in a taxonomy is in the form of monetary items corresponding
to accounting items listed in the chart of accounts implied by the taxonomy, that is a high level
view of the real-life charts of accounts used by software systems compliant with the standard
referred by the taxonomy:
− following accounting conventions, items may have an optional balance attribute,
indicating the section (debit or credit) where an item of that kind has to be reported
when a positive value is provided for it;
− items have also a period attribute, which may be instant (a single point in time, as
appropriate for balance sheet values), duration (a time interval between a start date and an
end date, used for income, income components, cash flows and changes in balance sheet
values) or forever (for concepts lacking a time dimension, such as the company’s original
name).
Legitimate XBRL items other than accounting values may contain textual information, such as
the reporting entity name or address, descriptive sections, financial ratios, dates, and so on.
Items of type abstract play an important role in the definition of a report’s layout: they have
no value in instance documents, being containers for “constant” literal data, e.g. placeholders
used for section titles and similar purposes.
Here is an example of an element definition for an XRBL concept named
RevenueTotalByNature of type item in a taxonomy schema:
XBRL and Quantrix Modeler Luca Erzegovesi http://smefin.net
7
<element id="ifrs-gp_RevenueTotalByNature"
name="RevenueTotalByNature"
type="xbrli:monetaryItemType"
substitutionGroup="xbrli:item"
xbrli:periodType="duration"
xbrli:balance="credit"
nillable="true" />
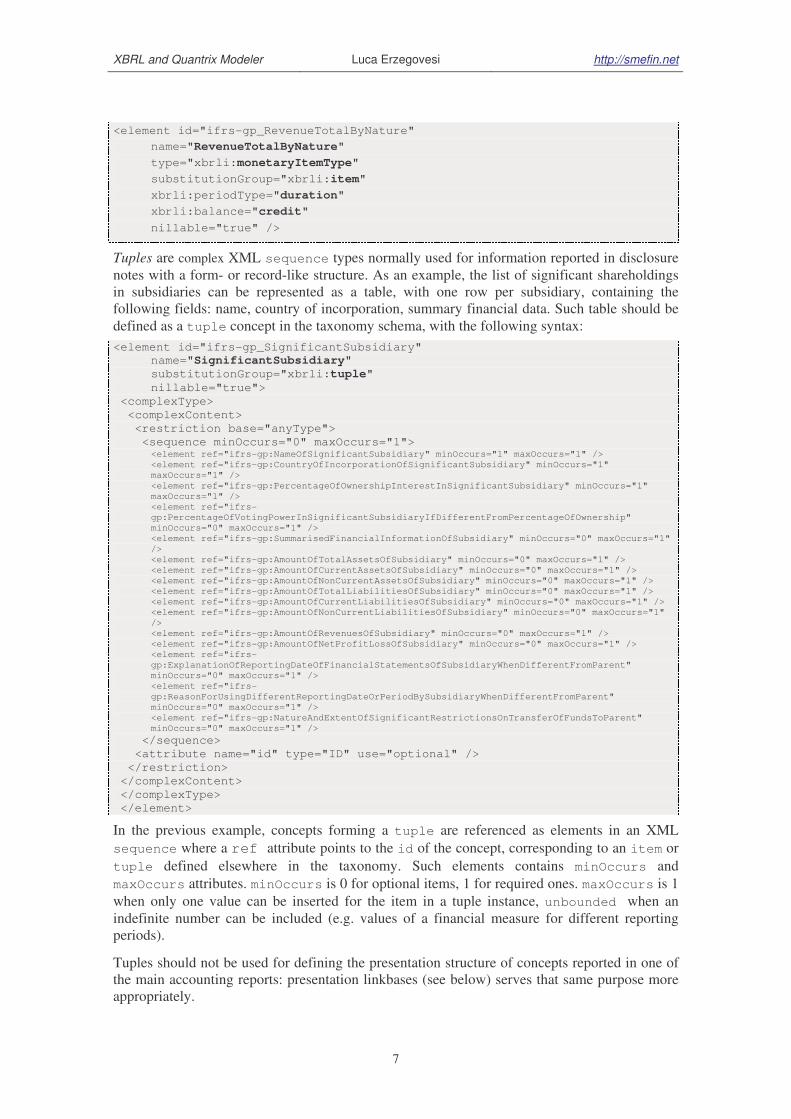
Tuples are complex XML sequence types normally used for information reported in disclosure
notes with a form- or record-like structure. As an example, the list of significant shareholdings
in subsidiaries can be represented as a table, with one row per subsidiary, containing the
following fields: name, country of incorporation, summary financial data. Such table should be
defined as a tuple concept in the taxonomy schema, with the following syntax:
<element id="ifrs-gp_SignificantSubsidiary"
name="SignificantSubsidiary"
substitutionGroup="xbrli:tuple"
nillable="true">
<complexType>
<complexContent>
<restriction base="anyType">
<sequence minOccurs="0" maxOccurs="1"> <element ref="ifrs-gp:NameOfSignificantSubsidiary" minOccurs="1" maxOccurs="1" />
<element ref="ifrs-gp:CountryOfIncorporationOfSignificantSubsidiary" minOccurs="1"
maxOccurs="1" />
<element ref="ifrs-gp:PercentageOfOwnershipInterestInSignificantSubsidiary" minOccurs="1"
maxOccurs="1" />
<element ref="ifrs-
gp:PercentageOfVotingPowerInSignificantSubsidiaryIfDifferentFromPercentageOfOwnership"
minOccurs="0" maxOccurs="1" />
<element ref="ifrs-gp:SummarisedFinancialInformationOfSubsidiary" minOccurs="0" maxOccurs="1"
/>
<element ref="ifrs-gp:AmountOfTotalAssetsOfSubsidiary" minOccurs="0" maxOccurs="1" />
<element ref="ifrs-gp:AmountOfCurrentAssetsOfSubsidiary" minOccurs="0" maxOccurs="1" />
<element ref="ifrs-gp:AmountOfNonCurrentAssetsOfSubsidiary" minOccurs="0" maxOccurs="1" />
<element ref="ifrs-gp:AmountOfTotalLiabilitiesOfSubsidiary" minOccurs="0" maxOccurs="1" />
<element ref="ifrs-gp:AmountOfCurrentLiabilitiesOfSubsidiary" minOccurs="0" maxOccurs="1" />
<element ref="ifrs-gp:AmountOfNonCurrentLiabilitiesOfSubsidiary" minOccurs="0" maxOccurs="1"
/>
<element ref="ifrs-gp:AmountOfRevenuesOfSubsidiary" minOccurs="0" maxOccurs="1" />
<element ref="ifrs-gp:AmountOfNetProfitLossOfSubsidiary" minOccurs="0" maxOccurs="1" />
<element ref="ifrs-
gp:ExplanationOfReportingDateOfFinancialStatementsOfSubsidiaryWhenDifferentFromParent"
minOccurs="0" maxOccurs="1" />
<element ref="ifrs-
gp:ReasonForUsingDifferentReportingDateOrPeriodBySubsidiaryWhenDifferentFromParent"
minOccurs="0" maxOccurs="1" />
<element ref="ifrs-gp:NatureAndExtentOfSignificantRestrictionsOnTransferOfFundsToParent"
minOccurs="0" maxOccurs="1" />
</sequence>
<attribute name="id" type="ID" use="optional" />
</restriction>
</complexContent>
</complexType>
</element>
In the previous example, concepts forming a tuple are referenced as elements in an XML
sequence where a ref attribute points to the id of the concept, corresponding to an item or
tuple defined elsewhere in the taxonomy. Such elements contains minOccurs and
maxOccurs attributes. minOccurs is 0 for optional items, 1 for required ones. maxOccurs is 1
when only one value can be inserted for the item in a tuple instance, unbounded when an
indefinite number can be included (e.g. values of a financial measure for different reporting
periods).
Tuples should not be used for defining the presentation structure of concepts reported in one of
the main accounting reports: presentation linkbases (see below) serves that same purpose more
appropriately.
XBRL and Quantrix Modeler Luca Erzegovesi http://smefin.net
8
An accounting concept should be defined only once in a taxonomy schema, despite the fact that
it may be exposed in several reports: for example, the “Profit (Loss) from Operations” item
could be defined once and referred twice, in “Income statement by function” and in “Cash flow
statement – Indirect method”. This principle can be bypassed for convenience reasons, e.g. if
one wishes to use presentation reports as a sort of data dictionary, and consequently has to
duplicate the items for the same accounting concept exposed in different reports. This practice is
discouraged.
It is important to point out that XBRL schemata, and consequently the XBRL instances
assuming them, do not contain information about relationships among taxonomy concepts, apart
from the structural relationship between tuples and their components (items or tuples).
Information about relationships of the various kinds is contained in linkbases.
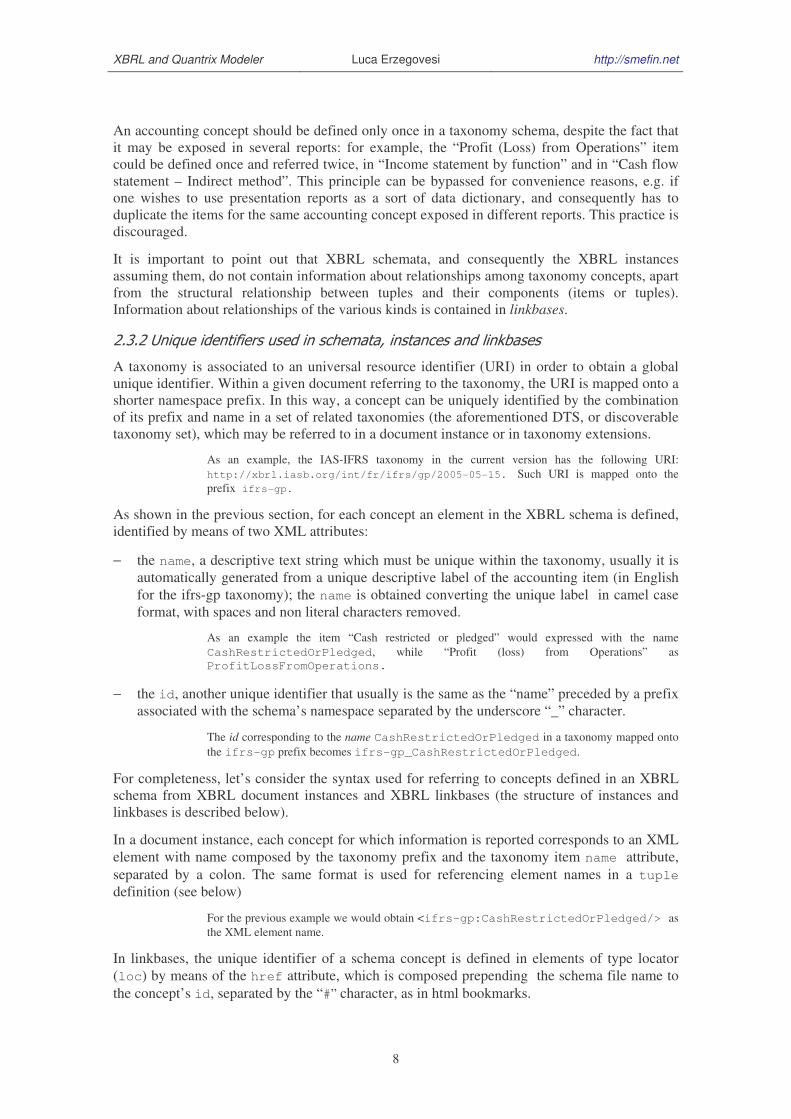
2.3.2 Unique identifiers used in schemata, instances and linkbases
A taxonomy is associated to an universal resource identifier (URI) in order to obtain a global
unique identifier. Within a given document referring to the taxonomy, the URI is mapped onto a
shorter namespace prefix. In this way, a concept can be uniquely identified by the combination
of its prefix and name in a set of related taxonomies (the aforementioned DTS, or discoverable
taxonomy set), which may be referred to in a document instance or in taxonomy extensions.
As an example, the IAS-IFRS taxonomy in the current version has the following URI:
http://xbrl.iasb.org/int/fr/ifrs/gp/2005-05-15. Such URI is mapped onto the
prefix ifrs-gp.
As shown in the previous section, for each concept an element in the XBRL schema is defined,
identified by means of two XML attributes:
− the name, a descriptive text string which must be unique within the taxonomy, usually it is
automatically generated from a unique descriptive label of the accounting item (in English
for the ifrs-gp taxonomy); the name is obtained converting the unique label in camel case
format, with spaces and non literal characters removed.
As an example the item “Cash restricted or pledged” would expressed with the name
CashRestrictedOrPledged, while “Profit (loss) from Operations” as ProfitLossFromOperations.
− the id, another unique identifier that usually is the same as the “name” preceded by a prefix
associated with the schema’s namespace separated by the underscore “_” character.
The id corresponding to the name CashRestrictedOrPledged in a taxonomy mapped onto
the ifrs-gp prefix becomes ifrs-gp_CashRestrictedOrPledged.
For completeness, let’s consider the syntax used for referring to concepts defined in an XBRL
schema from XBRL document instances and XBRL linkbases (the structure of instances and
linkbases is described below).
In a document instance, each concept for which information is reported corresponds to an XML
element with name composed by the taxonomy prefix and the taxonomy item name attribute,
separated by a colon. The same format is used for referencing element names in a tuple
definition (see below)
For the previous example we would obtain <ifrs-gp:CashRestrictedOrPledged/> as
the XML element name.
In linkbases, the unique identifier of a schema concept is defined in elements of type locator
(loc) by means of the href attribute, which is composed prepending the schema file name to
the concept’s id, separated by the “#” character, as in html bookmarks.

XBRL and Quantrix Modeler Luca Erzegovesi http://smefin.net
9
If the schema is defined in a file named ifrs-gp-2005-05-15.xsd, in a linkbase the href
attribute containing the reference to the item named CashRestrictedOrPledged would
become:
ifrs-gp-2005-05-15.xsd#ifrs-gp_CashRestrictedOrPledged.
The locator maps the identifier in href to a more concise identifier string for the concept used
locally to define the relationships between linked concepts and between concepts and resources
(the so called arcs, which perform functions which are different depending on the linkbase type,
as explained below).
Apparently, the coexistence of several formats for expressing the same XBRL concept across
the various components of a taxonomy may be confusing. For the sake of simplicity, I will
assume that such heterogeneity, together with the physical location of document files, is made
transparent to our application, thanks to appropriately configured data interfaces. For our
purposes:
− I refer to a namespace prefix in order to uniquely identify a taxonomy or a taxonomy
extension; such prefix should be enough for resolving the URI and physical location of the
taxonomy files;
− I shall refer to the id attribute of schema elements, composed as [prefix]_[name], in
order to uniquely identify an XBRL concept to our purposes;
This should be enough in order to process XBRL information conformant to a consistent
taxonomy set, which is the typical case in a planning or reporting application.
2.3.3 The label linkbase
A label linkbase provides a caption or label for each concept, in one or more languages. Labels
for specific “roles” can be defined in this file by assigning a labelRole atttribute to the label.
Label roles express different features of a label used at a specific point in a report:
− they can express the format of the label (e.g. standard, terse , verbose);
− they can be differentiated according to the concept’s value (e.g. for a NetProfitLoss
concept, we may define a label “Net Profit” for labelRole=positiveValue and “Net
Loss” for labelRole=negativeValue;
− they can be differentiated following the context of the concept value, i.e. the period or
nature of the data; so different labels can be defined for roles periodStartLabel,
periodEndLabel, restatedValueLabel.
Each label linkbase entry includes the following information:
− the reference to the schema concept described by the label;
− the label text in a given language;
− the language code, stored in the xml:lang attribute as an ISO 639 two or three letter code;
− optionally, the role of the label, stored in the xlink:role attribute.
The following example shows three different label elements defined in the ifrs-gp label
linkbase for the concept ConstructionInProgressNet¸a class of Non Current Assets in the
Balance Sheet.

XBRL and Quantrix Modeler Luca Erzegovesi http://smefin.net
10
<label xlink:type="resource" xlink:role="http://www.xbrl.org/2003/role/periodEndLabel"
xlink:label="ifrs-gp_ConstructionInProgressNet_lbl" xml:lang="en">
Construction in Progress, Net, Ending Balance</label>
<label xlink:type="resource"
xlink:role="http://www.xbrl.org/2003/role/periodStartLabel" xlink:label="ifrs-
gp_ConstructionInProgressNet_lbl" xml:lang="en">
Construction in Progress, Net, Beginning Balance</label>
<label xlink:type="resource" xlink:role="http://www.xbrl.org/2003/role/label"
xlink:label="ifrs-gp_ConstructionInProgressNet_lbl" xml:lang="en">
Construction in Progress, Net</label>
The xlink syntax of such relations, using elements of type locator, resource and
labelArc, is not detailed here.
In the code excerpt the word “label” is used in three places: (1) <label/> is the name of the XML
element of type resource; (2) http://www.xbrl.org/2003/role/label is the role for the
standard label (the last one); (3) the attribute named label contains a unique identifier of the
containing element in the linkbase, constructed as the concept schema id with the suffix _lbl.
This is a source of confusion for the novice user of XBRL.
Standard labels in a default language are normally used for presenting the content of a
taxonomy in tabular format, as a more readable substitute for the concept’s id attribute.
2.3.4 The reference linkbase
The reference linkbase provides a link from a concept to authoritative literature that defines it,
such as a law, an accounting standard or a regulation.
Each reference linkbase entry includes the following information:
− a locator, which is a pointer to a given schema concept for which the reference is defined;
− the reference, an XML element of complex type composed of sub-elements identifying with
precision the accounting rules which apply to the referenced concept;
For example, in the ifrs-gp taxonomy the following elements are specified:
Name: the name of the standards body (e.g. IAS)
Number: the number of the relevant standard (e.g. 39 for IAS, Financial instruments)
Paragraph: the paragraph number in the relevant standard
Subparagraph: the subparagraph number in the relevant standard.
Another structure may be used for different normative sources, e.g. an article and comma in a
business law, or a regulation of different nature.
An example of reference element is the following.
<reference xlink:type="resource"
xlink:role="http://www.xbrl.org/2003/role/presentationRef"
xlink:label="ifrs-gp_ConstructionInProgressNet_ref">
<ref:Name>IAS</ref:Name>
<ref:Number>16</ref:Number>
<ref:Paragraph>73</ref:Paragraph>
<ref:Subparagraph>e</ref:Subparagraph>
</reference>
As in the case of labels, several references with different xlink:role(s) can be defined for a
given concept.

XBRL and Quantrix Modeler Luca Erzegovesi http://smefin.net
11
The reference linkbase can be very useful in combination with on-line electronic versions of
normative documents in XML format, which could be accessed from XBRL documents as a
context-sensitive help system.
2.3.5 Presentation linkbases and the structure of reports
The layout of reports produced with the taxonomy concepts is defined in presentation linkbases.
This taxonomy document is usually the starting point for browsing a taxonomy’s content, since
it is very similar to the format in which accounting information is presented. Reports may be
different by type (Balance sheet, Income Statement, Cash flow statement, Statement of the
change in equity, Explanatory Disclosures, Accounting Policies) and, for a given type, by type
of entity (General purpose or Financial institution), or by format (e.g. Income statement by
function vis-à-vis Income statement by nature). In the ifrs-gp taxonomy, a distinct linkbase is
defined for each one of the main reports in order to make the definition of alternative formats
more flexible. The choice of the most appropriate format for each type of report is left to the
user.
A presentation linkbase document is organized into the following main parts:
− the listing of extended links is defined; an extended link is an element with name
presentationLink, which simply groups XBRL concepts organized in an ordered
hierarchical structure matching the logical structure of the report (the order an expert
accountant would like to follow), which is usually coincident, or very similar, with its
printed format; if a different file is used for each report, there should be one
presentationLink per linkbase, but more than one can be found in more complex
reports in order to structure the report in sections2.
− the structure of each section is configured in a distinct extended link as list of parent-child
relationships among XBRL concepts, defined as presentationArc(s).
− The top level or root item in the report has no parent. It is usually an abstract item
containing the report’s title.
− For other items the id of the parent concept is referred to in the attribute xlink:from
of the arc, while the id of the child item is assigned to the attribute xlink:to;
− the concepts referring to the same parent have an order attribute, i.e. an integer value
on which they are sorted; in this way a hierarchical structure with an arbitrary number
of levels can be defined;
− the use and priority attributes are relevant in taxonomy extensions; when use is
optional, the arc may be used (i.e. the child concept may be shown) in the report; if
we want to define an alternative format with minor variations, a taxonomy extension
can be defined where some child concepts are “switched off” and substituted by others3;
in order to switch off a child item we must define in the extension an arc for the same
pair of from and to ids, with use="prohibited" and priority greater than the
default value of 0.
2 The creation of additional presentationLink’s may also reflect the structure of the corresponding calculation
linkbase, where more than one calculationLink is needed to define alternative aggregation formulas for the same
summary item (see below page 13). 3 As an example, in the extension an alternative list of items for breaking down the value of a summary item can be
defined, that overrides the breakdown of the original taxonomy.

XBRL and Quantrix Modeler Luca Erzegovesi http://smefin.net
12
For a child item, a preferredLabel attribute may be defined, indicating the type of label
(defined in the same terms as the attribute labelRole in the label linkbase, see above) to be
shown for the reported concept at that point of the report, when it is different from the standard
type. In a report, the preferredLabel sometimes plays a more important role, for example
when is used to indicate the type of value to be placed at that point. In the ifrs-gp taxonomy, this
is that case for periodStartLabel and periodEndLabel roles, as in the following excerpt,
regarding the movement analysis for the ConstructionInProgressNet item, as reported in
the presentation linkbase for explanatory disclosures. For completeness, the complete hierarchy
starting from the root item of the report is included.
<presentationArc xlink:type="arc" xlink:arcrole="http://www.xbrl.org/2003/arcrole/parent-child"
xlink:from="ifrs-gp_ExplanatoryDisclosuresPresentation" <!-- root item -->
xlink:to="ifrs-gp_AssetsDisclosuresPresentation"
order="1" use="optional"/>
<presentationArc xlink:type="arc" xlink:arcrole="http://www.xbrl.org/2003/arcrole/parent-child"
xlink:from="ifrs-gp_AssetsDisclosuresPresentation"
xlink:to="ifrs-gp_PropertyPlantAndEquipmentDisclosures"
order="1" use="optional"/>
<presentationArc xlink:type="arc" xlink:arcrole="http://www.xbrl.org/2003/arcrole/parent-child"
xlink:from="ifrs-gp_PropertyPlantAndEquipmentDisclosures"
xlink:to="ifrs-gp_MovementsInPropertyPlantAndEquipmentPresentation"
order="1" use="optional"/>
<presentationArc xlink:type="arc" xlink:arcrole="http://www.xbrl.org/2003/arcrole/parent-child"
xlink:from="ifrs-gp_MovementsInPropertyPlantAndEquipmentPresentation" xlink:to="ifrs-
gp_MovementsInConstructionInProgress" order="1" use="optional"/>
<presentationArc xlink:type="arc" xlink:arcrole="http://www.xbrl.org/2003/arcrole/parent-child"
preferredLabel="http://www.xbrl.org/2003/role/periodStartLabel"
xlink:from="ifrs-gp_MovementsInConstructionInProgress"
xlink:to="ifrs-gp_ConstructionInProgressNet"
order="1" use="optional"/>
<presentationArc xlink:type="arc" xlink:arcrole="http://www.xbrl.org/2003/arcrole/parent-child"
xlink:from="ifrs-gp_MovementsInConstructionInProgress"
xlink:to="ifrs-gp_ChangesInConstructionInProgressPresentation"
order="2" use="optional"/>
<presentationArc xlink:type="arc" xlink:arcrole="http://www.xbrl.org/2003/arcrole/parent-child"
xlink:from="ifrs-gp_ChangesInConstructionInProgressPresentation"
xlink:to="ifrs-gp_AdditionsConstructionInProgress"
order="1" use="optional"/>
<presentationArc xlink:type="arc" xlink:arcrole="http://www.xbrl.org/2003/arcrole/parent-child"
xlink:from="ifrs-gp_ChangesInConstructionInProgressPresentation"
xlink:to="ifrs-gp_AcquisitionsThroughBusinessCombinationsConstructionInProgress"
order="2" use="optional"/>
<presentationArc xlink:type="arc" xlink:arcrole="http://www.xbrl.org/2003/arcrole/parent-child"
xlink:from="ifrs-gp_ChangesInConstructionInProgressPresentation"
xlink:to="ifrs-gp_DisposalsConstructionInProgress"
order="3" use="optional"/>
<presentationArc xlink:type="arc" xlink:arcrole="http://www.xbrl.org/2003/arcrole/parent-child"
xlink:from="ifrs-gp_ChangesInConstructionInProgressPresentation"
xlink:to="ifrs-
gp_TransfersToFromNonCurrentAssetsAndDisposalGroupsHeldForSaleConstructionInProgress"
order="4" use="optional"/>
<presentationArc xlink:type="arc" xlink:arcrole="http://www.xbrl.org/2003/arcrole/parent-child"
xlink:from="ifrs-gp_ChangesInConstructionInProgressPresentation"
xlink:to="ifrs-gp_DisposalsThroughBusinessDivestitureConstructionInProgress"
order="5" use="optional"/>
<presentationArc xlink:type="arc" xlink:arcrole="http://www.xbrl.org/2003/arcrole/parent-child"
xlink:from="ifrs-gp_ChangesInConstructionInProgressPresentation"
xlink:to="ifrs-gp_ImpairmentLossRecognisedInIncomeStatementConstructionInProgress"
order="6" use="optional"/>
<presentationArc xlink:type="arc" xlink:arcrole="http://www.xbrl.org/2003/arcrole/parent-child"
xlink:from="ifrs-gp_ChangesInConstructionInProgressPresentation"
xlink:to="ifrs-gp_ImpairmentReversalRecognisedInIncomeStatementConstructionInProgress"
order="7" use="optional"/>
<presentationArc xlink:type="arc" xlink:arcrole="http://www.xbrl.org/2003/arcrole/parent-child"
xlink:from="ifrs-gp_ChangesInConstructionInProgressPresentation"
xlink:to="ifrs-gp_ForeignCurrencyExchangeIncreaseDecreaseConstructionInProgress"
order="8" use="optional"/>
<presentationArc xlink:type="arc" xlink:arcrole="http://www.xbrl.org/2003/arcrole/parent-child"
xlink:from="ifrs-gp_ChangesInConstructionInProgressPresentation"
xlink:to="ifrs-gp_OtherIncreaseDecreaseConstructionInProgress"
order="9" use="optional"/>

XBRL and Quantrix Modeler Luca Erzegovesi http://smefin.net
13
<presentationArc xlink:type="arc" xlink:arcrole="http://www.xbrl.org/2003/arcrole/parent-child"
xlink:from="ifrs-gp_ChangesInConstructionInProgressPresentation"
xlink:to="ifrs-gp_ChangesInConstructionInProgressNetTotal"
order="10" use="optional"/>
<!—- the following element is defined in a distinct extended link (its definition is omitted) -->
<presentationArc xlink:type="arc" xlink:arcrole="http://www.xbrl.org/2003/arcrole/parent-child"
preferredLabel="http://www.xbrl.org/2003/role/periodEndLabel"
xlink:from="ifrs-gp_MovementsInConstructionInProgress"
xlink:to="ifrs-gp_ConstructionInProgressNet"
order="3" use="optional"/>
The last arc belongs to a distinct extended link in order to avoid an illegal duplicate link definition
between the same pair of parent and child items (MovementsInConstructionInProgress and
ConstructionInProgressNet). To be exact, the child items are not identical, since they
reference the same concept at the start and at the end of the reporting period, as is made clear by
the different preferred label assigned. This case shows the XBRL language stretched to its limits.
The following figure shows a possible representation of the items contained in the previous
code snippet in a printed report.
Browsing the presentationArc elements in the linkbase, we find most of the information
needed to reproduce the layout and to identify the data to be reported: the report must show in
sequence the concepts referred to in the xlink:to attribute of the arcs; the corresponding
xlink:from attribute defines the nesting level of the child item in the presentation tree
hierarchy4, which can be determined recursively assigning level 0 to root elements, and adding 1
to the parent’s nesting level for others. However, the list of xlink:to attributes contained in
presentationArc(s) is not enough for reproducing the complete report: you have to put the
root parent element at the beginning of the tree (it does not appear in xlink:to references, as is
the case for AssetDisclosures in the example); you have also to put together items
connected to the same parent defined in arcs placed in different extended links (as the ending
balance of ConstructionInProgressNet in the example above).
2.3.6 Calculation linkbases and the mathematical dependencies among reported items
An accounting report usually includes items which are computed as the algebraic sum of other
items. In mandatory financial statements, addition and subtraction are enough to do all the math
that is required, so XBRL has defined a parsimonious way to represent such dependencies in a
dedicated taxonomy document, the calculation linkbase.
4 The nesting level of reported concepts is not explicitly defined in XBRL linkbases.

XBRL and Quantrix Modeler Luca Erzegovesi http://smefin.net
14
The calculation and presentation linkbases have a similar structure: in both cases a set of reports
is configured, and for each report a linkbase document defines a hierarchical and ordered tree of
XBRL concepts. Although not strictly required, it is strongly recommended that calculation and
presentation linkbase for a given report have structures mirroring each other.
The main differences between calculation and presentation linkbases are the following:
− calculation linkbases do not include abstract elements, which are not involved in
calculations;
− in calculation linkbases, calculationArc(s) connect the summed items (referenced by the
xlink:to attribute) to a parent item (referenced by the xlink:from attribute) containing
their aggregate value; in presentation linkbases the parent item is usually an abstract item,
and both the summed items and their sum are children of that same parent, and the sum
follows its components at the same presentation level; as an alternative, a compact layout
may be chosen where the summed item is the parent in both linkbases, and is shown before
its children;
− relationships between to and from elements defined in calculationArc(s) have in
addition to the order attribute, a weight attribute, that normally takes either 1 or –1 value;
it commands the algebraic sign to be applied to child items in the summation that returns
their parent, which is a sub-total or total item; summation relationships are nested, and
parent items at a given level in the hierarchy can be child items with respect to a higher
level item.
− the specification of more than one extended link (named calculationLink) is needed
whenever different formulas have to be defined for the same aggregate concept;
As an example, in the consolidated income statement the bottom line, Profit (Loss), may be
defined in two ways:
− as the sum of Profit (Loss) Attributable to Equity Holders of Parent and Profit (Loss)
Attributable to Minority Interest;
− as the difference between Profit (Loss) after Tax from Continuing Operations and Profit
(Loss) from Discontinued Operations Net of Tax.
The two formulas must be implemented as sets of calculationArc(s) assigned to two distinct
calculationLink(s).
With regard to other attributes in the arc (use, priority) and their settings in taxonomy
extensions, the same rules of presentation linkbases apply. Obviously, there is no
preferredLabel attribute.
Values reported in document instances must verify the following equivalence:
1
value of parent item value of child item[ ] weight of child item[ ]=
= ×∑n
j
j j
where n is the number of child elements contributing to the value of a given parent item.
A calculation linkbase allows validation of summary values reported in a document instance, or
even may drive the derivation of calculated values from the aggregation of input values.
In XBRL 2.1, the setting for performing mathematical and logical operations on data is still
affected by relevant limitations:

XBRL and Quantrix Modeler Luca Erzegovesi http://smefin.net
15
− calculations can be defined for items belonging to the same context (i.e. to the same entity
and period) in an instance document (see below); as an example, there is no way to
reference a value in a previous or subsequent period, or to define a difference between
entities;
− you can only add or subtract values, so it is impossible to define a formula even for a simple
accounting ratio using a multiplication or a division (let alone financial or statistical
functions).
As an example of such limitations, let’s see the calculationArcs(s) for the section of
explanatory disclosures shown before.
<calculationArc xlink:type="arc" xlink:arcrole="http://www.xbrl.org/2003/arcrole/summation-item"
xlink:from="ifrs-gp_ChangesInConstructionInProgressNetTotal"
xlink:to="ifrs-gp_AdditionsConstructionInProgress"
order="1" weight="1" use="optional"/>
<calculationArc xlink:type="arc" xlink:arcrole="http://www.xbrl.org/2003/arcrole/summation-item"
xlink:from="ifrs-gp_ChangesInConstructionInProgressNetTotal"
xlink:to="ifrs-gp_AcquisitionsThroughBusinessCombinationsConstructionInProgress"
order="2" weight="1" use="optional"/>
<calculationArc xlink:type="arc" xlink:arcrole="http://www.xbrl.org/2003/arcrole/summation-item"
xlink:from="ifrs-gp_ChangesInConstructionInProgressNetTotal"
xlink:to="ifrs-gp_DisposalsConstructionInProgress"
order="3" weight="-1" use="optional"/>
<calculationArc xlink:type="arc" xlink:arcrole="http://www.xbrl.org/2003/arcrole/summation-item"
xlink:from="ifrs-gp_ChangesInConstructionInProgressNetTotal"
xlink:to="ifrs-
gp_TransfersToFromNonCurrentAssetsAndDisposalGroupsHeldForSaleConstructionInProgress"
order="4" weight="-1" use="optional"/>
<calculationArc xlink:type="arc" xlink:arcrole="http://www.xbrl.org/2003/arcrole/summation-item"
xlink:from="ifrs-gp_ChangesInConstructionInProgressNetTotal"
xlink:to="ifrs-gp_DisposalsThroughBusinessDivestitureConstructionInProgress"
order="5" weight="-1" use="optional"/>
<calculationArc xlink:type="arc" xlink:arcrole="http://www.xbrl.org/2003/arcrole/summation-item"
xlink:from="ifrs-gp_ChangesInConstructionInProgressNetTotal"
xlink:to="ifrs-gp_ImpairmentLossRecognisedInIncomeStatementConstructionInProgress"
order="6" weight="-1" use="optional"/>
<calculationArc xlink:type="arc" xlink:arcrole="http://www.xbrl.org/2003/arcrole/summation-item"
xlink:from="ifrs-gp_ChangesInConstructionInProgressNetTotal"
xlink:to="ifrs-gp_ImpairmentReversalRecognisedInIncomeStatementConstructionInProgress"
order="7" weight="1" use="optional"/>
<calculationArc xlink:type="arc" xlink:arcrole="http://www.xbrl.org/2003/arcrole/summation-item"
xlink:from="ifrs-gp_ChangesInConstructionInProgressNetTotal"
xlink:to="ifrs-gp_ForeignCurrencyExchangeIncreaseDecreaseConstructionInProgress"
order="8" weight="1" use="optional"/>
<calculationArc xlink:type="arc" xlink:arcrole="http://www.xbrl.org/2003/arcrole/summation-item"
xlink:from="ifrs-gp_ChangesInConstructionInProgressNetTotal"
xlink:to="ifrs-gp_OtherIncreaseDecreaseConstructionInProgress"
order="9" weight="1" use="optional"/>
There is no formula defining “Construction in Progress, Net, Ending Balance” as the sum of the
“Construction in Progress, Net, Beginning Balance” and “Changes in Construction in Progress,
Net, Total” because beginning and end balances are items of period type instant, whereas
changes are of type duration. They may not share a common context, and therefore cannot be
summed together.
A forthcoming XBRL specification, the formula linkbase (see [10]) will allow sophisticated
mathematical and logical operations to be carried out on taxonomy concepts along different
dimensions, so as to allow the definition of complex financial models and the creation of
validation and derivation rules5.
5 The XBRL formula language will be dealt with in a forthcoming paper in this series.

XBRL and Quantrix Modeler Luca Erzegovesi http://smefin.net
16
The following table lists the report types defined in the ifrs-gp taxonomy, and their
corresponding calculation and presentation linkbase files. For each report both a presentation
and a calculation linkbase are defined, except for the Code List.
General purpose
Description Type Linkbase File
Balance Sheet, Classified Presentation ifrs-gp-pre-bs-classified-2005-05-15.xml
Calculation ifrs-gp-cal-bs-classified-2005-05-15.xml
Balance Sheet, Order of Liquidity Presentation ifrs-gp-pre-bs-liquidity-2005-05-15.xml
Calculation ifrs-gp-cal-bs-liquidity-2005-05-15.xml
Balance Sheet, Net Assets Presentation ifrs-gp-pre-bs-netAssets-2005-05-15.xml
Calculation ifrs-gp-cal-bs-netAssets-2005-05-15.xml
Income Statement, by Function Presentation ifrs-gp-pre-is-byFunction-2005-05-15.xml
Calculation ifrs-gp-cal-is-byFunction-2005-05-15.xml
Income Statement, by Nature Presentation ifrs-gp-pre-is-byNature-2005-05-15.xml
Calculation ifrs-gp-cal-is-byNature-2005-05-15.xml
Cash Flow, Direct Method Presentation ifrs-gp-pre-cf-direct-2005-05-15.xml
Calculation ifrs-gp-cal-cf-direct-2005-05-15.xml
Cash Flow, Indirect Method Presentation ifrs-gp-pre-cf-indirect-2005-05-15.xml
Calculation ifrs-gp-cal-cf-indirect-2005-05-15.xml
Statement of Changes in Equity, General
Purpose Presentation ifrs-gp-pre-sce-2005-05-15.xml
Calculation ifrs-gp-cal-sce-2005-05-15.xml
Accounting Policies, General Purpose Presentation ifrs-gp-pre-policies-2005-05-15.xml
Calculation ifrs-gp-cal-policies-2005-05-15.xml
Disclosures, General Purpose Presentation ifrs-gp-pre-disclosures-2005-05-15.xml
Calculation ifrs-gp-cal-disclosures-2005-05-15.xml
Disclosures, First Time Adoption of IFRS Presentation ifrs-gp-pre-firstTime-2005-05-15.xml
Calculation ifrs-gp-cal-firstTime-2005-05-15.xml
Classes, General Purpose Presentation ifrs-gp-pre-classes-2005-05-15.xml
Calculation ifrs-gp-cal-classes-2005-05-15.xml
Other, General Purpose Presentation ifrs-gp-pre-other-2005-05-15.xml
Calculation ifrs-gp-cal-other-2005-05-15.xml
Code Lists, General Purpose Presentation ifrs-gp-pre-codes-2005-05-15.xml
Financial Institutions
Description Type Linkbase File
Balance Sheet, Portfolio Basis Presentation ifrs-gp-fi-pre-bs-portfolio-2005-05-15.xml
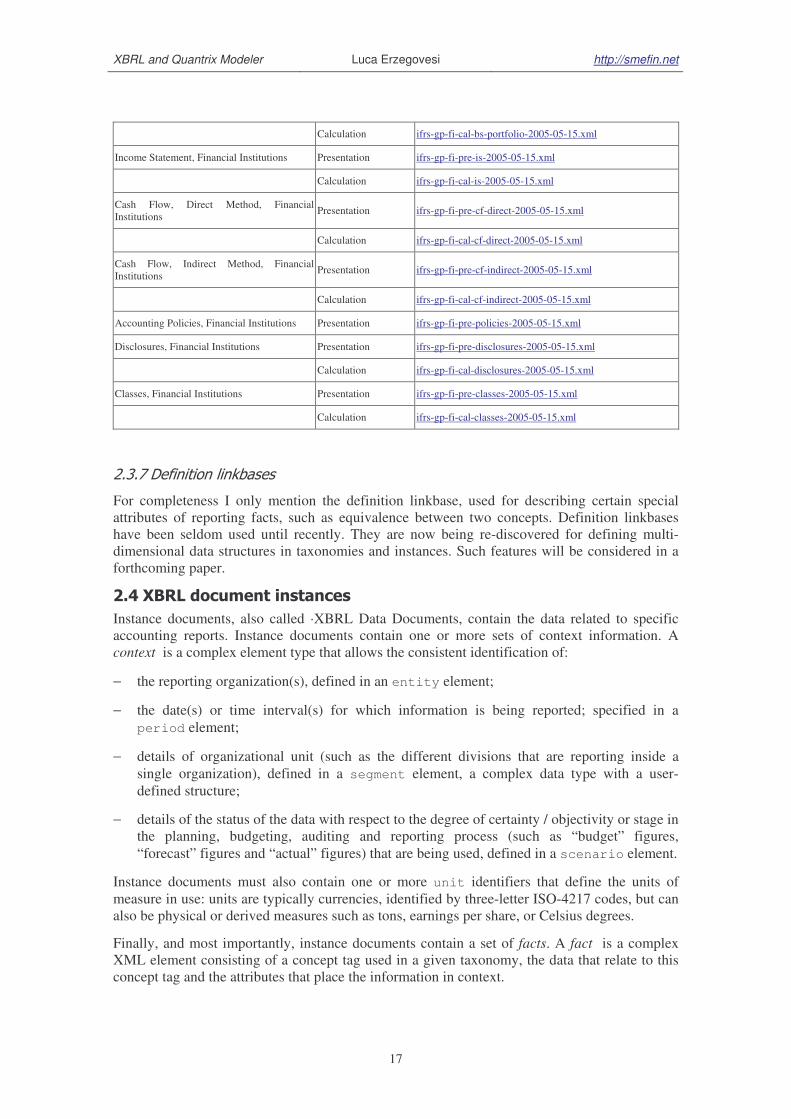
XBRL and Quantrix Modeler Luca Erzegovesi http://smefin.net
17
Calculation ifrs-gp-fi-cal-bs-portfolio-2005-05-15.xml
Income Statement, Financial Institutions Presentation ifrs-gp-fi-pre-is-2005-05-15.xml
Calculation ifrs-gp-fi-cal-is-2005-05-15.xml
Cash Flow, Direct Method, Financial
Institutions Presentation ifrs-gp-fi-pre-cf-direct-2005-05-15.xml
Calculation ifrs-gp-fi-cal-cf-direct-2005-05-15.xml
Cash Flow, Indirect Method, Financial
Institutions Presentation ifrs-gp-fi-pre-cf-indirect-2005-05-15.xml
Calculation ifrs-gp-fi-cal-cf-indirect-2005-05-15.xml
Accounting Policies, Financial Institutions Presentation ifrs-gp-fi-pre-policies-2005-05-15.xml
Disclosures, Financial Institutions Presentation ifrs-gp-fi-pre-disclosures-2005-05-15.xml
Calculation ifrs-gp-fi-cal-disclosures-2005-05-15.xml
Classes, Financial Institutions Presentation ifrs-gp-fi-pre-classes-2005-05-15.xml
Calculation ifrs-gp-fi-cal-classes-2005-05-15.xml
2.3.7 Definition linkbases
For completeness I only mention the definition linkbase, used for describing certain special
attributes of reporting facts, such as equivalence between two concepts. Definition linkbases
have been seldom used until recently. They are now being re-discovered for defining multi-
dimensional data structures in taxonomies and instances. Such features will be considered in a
forthcoming paper.
2.4 XBRL document instances
Instance documents, also called ·XBRL Data Documents, contain the data related to specific
accounting reports. Instance documents contain one or more sets of context information. A
context is a complex element type that allows the consistent identification of:
− the reporting organization(s), defined in an entity element;
− the date(s) or time interval(s) for which information is being reported; specified in a
period element;
− details of organizational unit (such as the different divisions that are reporting inside a
single organization), defined in a segment element, a complex data type with a user-
defined structure;
− details of the status of the data with respect to the degree of certainty / objectivity or stage in
the planning, budgeting, auditing and reporting process (such as “budget” figures,
“forecast” figures and “actual” figures) that are being used, defined in a scenario element.
Instance documents must also contain one or more unit identifiers that define the units of
measure in use: units are typically currencies, identified by three-letter ISO-4217 codes, but can
also be physical or derived measures such as tons, earnings per share, or Celsius degrees.
Finally, and most importantly, instance documents contain a set of facts. A fact is a complex
XML element consisting of a concept tag used in a given taxonomy, the data that relate to this
concept tag and the attributes that place the information in context.

XBRL and Quantrix Modeler Luca Erzegovesi http://smefin.net
18
For each fact entry (i.e. the value of an accounting item for a given context), an XML element
must be inserted in the instance document. Since instance data is the central piece of
information consumed by XBRL-enabled applications, an example is appropriate here, taken
from a fictitious instance document.
First, I define a point-in-time (instant) context. The reporting entity is a fictitious company
identified as Sample Company according to the classification scheme associated to the
http://www.businessregister.org URI, a fictitious authority. The id attribute of such
context is assigned as an attribute to facts representing balance sheet item values as of 31st
December 2003. The optional scenario element is set to actual. The data document only
presents data at the company level, so there is no segment information.
<context id="Current_AsOf">
<entity>
<identifier scheme="http://www.businessregister.org">Sample Company</identifier>
</entity>
<period>
<instant>2003-12-31</instant>
</period>
<scenario>
actual
</scenario>
</context>
In the following example, I define a context for a duration time-interval, which may be
assigned to income and cash flow items for fiscal year 2003.
<context id="Current_ForPeriod">
<entity>
<identifier scheme="http://www.businessregister.org">Sample Company</identifier>
</entity>
<period>
<startDate>2003-01-01</startDate>
<endDate>2003-12-31</endDate>
</period>
<scenario>
actual
</scenario>
</context>
Monetary values are expressed in euros. So we need a unit of measurement “euro”, defined
with the following syntax:
<unit id="U-Euros">
<measure>iso4217:EUR</measure>
</unit>
The contexts and units defined above are assigned to fact elements. The XML element name of
each fact is composed of the taxonomy namespace prefix and the concept name attribute, as
defined in the taxonomy schema, separated by “:”. For example, a value of € 540.000 for the
item “Property, plant and equipment, net” in the Asset section of the Balance Sheet at year end
2003 is expressed in this way:
<ifrs-gp:PropertyPlantEquipmentNet
contextRef="Current_AsOf"
unitRef="U-Euros"
decimals="0">
540000
</ifrs-gp:PropertyPlantEquipmentNet>

XBRL and Quantrix Modeler Luca Erzegovesi http://smefin.net
19
A value of Revenues in the “Income Statement by function” report for 2003 of € 1.300.000 is
described in this way:
<ifrs-gp:RevenueFunction
contextRef="Current_ForPeriod"
unitRef="U-Euros"
decimals="0">
1300000
</ifrs-gp:RevenueFunction>
The value is expressed with “.” as decimal separator and without thousands separator. The
decimals attribute drives the rounding of fact values performed by XBRL parsers. It is an
important aspect for a data consuming application that should produce numbers with the desired
degree of precision. That point is of capital importance in an accounting application where totals
must balance. The reported value for an aggregate item is considered correct if such value
equals the sum of its child item values rounded to the number of decimals defined in the
decimal attribute.
In an instance document, footnotes may be inserted for specific facts. The syntax for specifying
footnotes is analogous to the one used in label linkbases. Notes are contained in a footnote
linkbase that is embedded in the instance document. Here is an example for the element of type
resource where the note text is stored.
<link:footnote xlink:type="resource"
xlink:role="http://www.xbrl.org/2003/role/footnote" xlink:label="ifrs-
gp_ConstructionInProgressNet_note" xml:lang="en">
For 2003, relates to real estate development projects in Southern Italy
</link:footnote>
As for labels, the footnote linkbase requires also locator and arc elements, which are not
detailed here.
As concept definitions in the taxonomy schema, elements describing facts in instance
documents do not follow an order. Order is imposed upon the data when it is processed
according to a report structure as defined in the presentation and/or calculation linkbases.
2.5 Use of XBRL taxonomy and data documents in financial analysis
XBRL provides a rich and consistent framework for defining the data model of an application
for the analysis of financial statements, implementing standard methodologies such as:
− historical analysis of actual financial statements by means of reclassified reports and
financial ratios;
− ex ante business and financial planning by means of pro forma statements.
A conformant XBRL taxonomy provides a powerful setup for defining:
− the data dictionary of items consumed by the financial model as input variables;
− the layout and computation of reclassified reports, as far as the math used in them is limited
to algebraic sums of elementary items.
When the formula linkbase specification (see [10]) will be released, the whole business logic of
the model used for analysis will be manageable in an XBRL taxonomy. Until then, more
sophisticated algorithms must be defined in an application specific setting, e.g. with spreadsheet
formulas, XPath expressions, XQuery statements or with any sort of computer program. In the
following section, I will present an implementation with a multidimensional spreadsheet
program, Quantrix Modeler.
XBRL and Quantrix Modeler Luca Erzegovesi http://smefin.net
20
XBRL document instances may be used as a format for data fed into the analysis module, or for
exporting the data processed in such model to other applications. As an example, we may export
a forecasted income statement to accounting software add-ins for planning and budgeting, or a
cash flow statement on actual data to be included in a web portal for management reporting.
A powerful feature of XBRL in this setting is the extensibility of both taxonomy and instance
data models.
2.5.1 Information contained in financial statements
A state-of-the-art taxonomy, such as the ifrs-gp, already contains most of the data that is
elaborated in financial analysis, with a degree of detail that is adequate for sophisticated ratio or
cash flow analysis at the company level. The degree of detail may be deepened at will by means
of sector- or company-specific extensions to taxonomies. Such extensions should be used for a
finer classification of items by economic nature or function. They should not be used for
breaking down items along dimensions which reflect time, company organization or scenario
hypotheses, for which the use of context elements within instances is more appropriate.
2.5.2 Information contained in disclosures
The taxonomy may also define complex data structures used for exploding or explaining the
information that is summarized in the main statements. Disclosures that are relevant for
financial analysis purposes can be classified in five categories:
− movement analysis, exploding the net change in value of items reported in the balance sheet,
which are aggregations of accounting transactions grouped by classes;
An example of movement analysis has been given above for the item Construction in Progress
(see Section 2.3.5).
− breakdown of values reported in main financial statements, with the optional addition of
extra information explaining the factors behind reported values in order to appreciate
company policies and strategies, and risk exposure; this information is obtained from
specialized modules of the accounting or ERP systems (e.g. inventory, financial
instruments, accounts receivables, depreciable assets, equity investments); this line of
analysis exposes the business and financial model behind a company’s performance, i.e. its
supply chain and key drivers; in this way it provides a link between actual and forecasted
amounts, because future values can be computed from driver variables using the same
model that is good for analyzing the formation of actual values.
A typical example may be a detail of raw material inventories by commodity and age of
origination, with evidence of physical quantity, average carrying cost, current market value,
another example is the breakdown of labor expenses with respect to the composition of
personnel.
− alternative representation of the value of items, coming from criteria different form the ones
used in the reported figures, e.g. a fair value vis-a-vis a value at amortized cost for a
building; these values as well are managed by specialized applications, or are the result of
ad hoc evaluations; this kind of information is strictly related to the qualitative disclosures
on accounting policies and their changes over time;
− non monetary quantitative data provided for informational or statistical purposes,
independently from accounting values (e.g. the number of employees, some data on
physical volumes of production, etc.);
− disclosure of accounting policies and other qualitative information about the reporting firm
which may be useful to interpret the accounting figures.
XBRL and Quantrix Modeler Luca Erzegovesi http://smefin.net
21
If a company discloses information of the types summarized above, any kind of report or
analysis can be produced: cash flow statements (both direct and indirect method), EVATM
reports, liquidation value of assets, economic value of assets, etc.
In our setting, the parts of an XBRL taxonomy that define the structure and content of
disclosures have great importance. With appropriate design, they can serve the needs of ex post
analysis, as well as of ex ante planning and forecasting. The crucial design choice is the
appropriate degree of detail of disclosures. They must support interfaces on three sides:
− first, the breakdown criteria by economic nature and by business or organizational unit must
be compatible with the analytical chart of accounts used by the company in its financial
accounting or ERP system, otherwise one could not fill the reclassification schemes with
actual figures;
− second, the breakdown of changes in values by movement type must be compatible with the
classification of transaction types, and these key types must be usable for selectively
grouping the value of homogenous transactions from the accounting system; in this way the
analyst can reach a high degree of control over the consistency among income, assets
/liability and cash-flow items;
− third, a common business and financial model linking reported values to physical and
economic drivers should be reflected both in the data model used for reporting and in the
computing model used for planning and forecasting, in this way every report used in the
model can be projected forward and backward on the time dimension.
Achieving such consistency is not an easy task. It cannot be imposed as a requirement for a
general purpose XBRL taxonomy for external reporting, but it can be pursued in a closed
environment (a single firm of a group of homogenous firm sharing an application platform)
where the user is in full control of an integrated data warehouse used for financial accounting,
cost accounting, management reporting and business performance management.
3 - Software tools for financial analysis and Quantrix Modeler
3.1 Software tools for financial modeling
In the described setting, our case for using Quantrix is made in view of the shortcomings of
alternative software solutions for financial modeling. For a more articulated analysis of this
issue, please refer to our Smefin internal report (see [3]).
Existing software can be grouped into three main classes:
− enterprise resource planning (ERP) applications, complemented by business intelligence
(BI) and reporting applications
− traditional spreadsheets;
− software platforms for business performance management
ERP and BI/reporting applications do not support free form creation and modeling of data. In
most cases, their functionality supports budgeting rather than true planning according to
changing business dynamics.
Because of the limitations of current accounting and financial systems, financial professionals
turn to the traditional two dimensional spreadsheet for significant modeling tasks - especially

XBRL and Quantrix Modeler Luca Erzegovesi http://smefin.net
22
those involving scenarios. Limitations of spreadsheets make them unsuitable for complex
modeling, as demonstrated in [5]. Such limitations include two-dimensional design, formulas
written with arbitrary coordinates, logic tied to the initial layout of the data, and, as a
consequence, rigidity in the iterative refactoring of the model.
There area also physical constraints affecting spreadsheet models, coming from the maximum
allowed number of rows and columns, and from the huge file size, due to the storage of a
formula in each calculated cell.
Numerous issues arise from the aforementioned limitations: spreadsheet revision is an error-
prone activity, with low and decreasing productivity. Model auditing is a tedious and time
consuming task. Author dependence, lack of portability and limitations on business insight
complete the picture.
In spite of all these problems, business professionals throughout the world use the basic
spreadsheet package to accomplish their modeling tasks because spreadsheets are ubiquitous
and there has been no product alternative to get the job done with existing skills and application
frameworks.
Beyond spreadsheets, we have the more articulate solutions, which combine and extend the
capabilities of the previous categories, i.e. software platforms for business performance
management and strategic finance. On top of accounting or ERP systems, multinational firms
employ additional software components for financial planning and reporting or the so called
“business performance management” (BPM), i.e. distributed systems enabling decision makers
in every department of the company to participate in the planning process, and monitor the
financial performance in real time, fostering immediate reaction to new opportunities and
threats coming from the markets or from inside the firm. BPM software is a very complex (and
expensive) replacement for spreadsheet models developed in-house. BPM can be conceived as a
“super-spreadsheet” software application modeling the value chain of a company, i.e. the
processes linking financial results to key economic drivers (demand, input prices, efficiency,
product prices, etc.). Such a solution avoids the problem and huge cost of converting and
reconciling the data coming from the numerous spreadsheets used in the various departments
into a central repository. The BPM solution makes the planning cycle shorter and more
accurate, and involves actors with the best knowledge in the timely provision of information
that is immediately available to decision makers all over the business. Users of BPM systems
interact with a central application which embodies the business model. Information is stored in a
central database available as a data warehouse with OLAP functionality. Pioneers in the
development and adoption of BPM systems are usually bigger corporations, or firms in the
technology sector with very sophisticated IT solutions for managing their production chain in
real time. Providers of this kind of software are either specialized vendors (Adaytum, Cartesis,
Cognos and Outlooksoft, to name a few), or providers of platforms for OLAP and information
retrieval and multidimensional databases (such as Hyperion). The big players in the ERP
market are also entering these segment with offerings based upon their platform (e.g. the
components for strategic and financial planning by SAP).
The high cost and technological requirements of these solutions makes them unaffordable by
our target users, i.e. small and medium sized firms.
3.2 About multi-dimensional spreadsheets and Quantrix Modeler
In 1986 a team at Lotus conceived the idea of a revolutionary spreadsheet, and translated the
idea into a software development project. A final version of the application, called Improv, was
released in 1991. Lotus Improv was based on three components:

XBRL and Quantrix Modeler Luca Erzegovesi http://smefin.net
23
− a multidimensional data model tightly coupled with a computational engine based on
formulas expressed in a rich textual language;
− a graphical user interface, originally developed for the NextStep operating system, allowing
flexible manipulation of a model’s data in tabular and graphical format;
− a macro programming language for automating complex procedures and personalizing the
user interface.
In 1993 a Windows version appeared. For reasons that I will not consider here, despite acclaim
by users and in the press, the product was subsequently abandoned.
3.2.1 Quantrix Modeler: an end-user’s view
Quantrix Modeler is the only commercial software application available today that builds upon
Improv’s vision on an open Java-based platform, offering a solution targeted to the development
of models for financial analysis and business intelligence. Quantrix Modeler combines an
innovative architectural approach, based on separation of logic, structure and presentation, with
a multidimensional calculation engine to deliver an elegant and powerful modeling tool
designed for financial professionals.
The following screenshot gives an idea of Quantrix user interface.
3.2.2 Quantrix multidimensional model
At the heart of Quantrix there is a multidimensional model used for structuring information and
defining the computational model. This architectural feature presents some analogy with
business intelligence applications supporting OLAP (on-line analytical processing). OLAP
applications are usually built on top of a DBMS, which can be a relational system, such as
Oracle or SQL server, or a dedicated multidimensional environment, such as Hyperion Essbase.
In the first case, data are pre-processed before being queried by the OLAP system, and the same
applies to external data sources that can be accessed via specific data links.

XBRL and Quantrix Modeler Luca Erzegovesi http://smefin.net
24
In OLAP systems, the data warehouse is represented as a multidimensional matrix of data. In
the OLAP jargon, the following concepts apply:
− the matrix, or hypercube, contains data to be analyzed, organized in fields called measures
(e.g. the revenues and costs of a company);
− each data point is qualified by a variable number of key fields; following the matrix
metaphor, they are called dimensions (e.g. geographical areas, business units, products,
periods, customers);
− each dimension may assume several values, which can be organized in hierarchies: for
example, at the finest level of detail revenues can be recorded by the combination of
product, customer, month and province. Each of these dimensions can be organized
hierarchically (e.g. month > quarter > year for a time dimension; product > product line >
business unit for a business entity dimension; province > region > area > country for a
geographical dimension).
Basic query expressions have the form of a function call taking an argument for each of the
dimensions used. The generic shape of query results is also a multidimensional matrix, which
may collapse to a scalar value, a vector, or a familiar two-dimensional table, depending on the
shape and size of the underlying hypercube, and of the parameters, which may be single valued
items, or groups of them corresponding to a higher level in a hierarchy.
The polymorphism of data constructs may be confusing at first, but gives elegance and power to
query languages used in these environments.
OLAP query languages are enhanced by strong computational capabilities. Calculated fields
(measures) can be added. Various kinds of grouping operators (count, sum, average, etc.) can be
applied. A rich set of built-in functions is provided, extensible with user defined functions.
Complex procedures can be programmed for repeated execution of data retrieval and
manipulation processes.
Such concepts and functionality have a correspondence in Quantrix:
− you can create a model containing one or more matrices;
− each matrix has one or usually more than one dimensions, called categories; a given
category may be used only by that matrix, or else shared among two or more matrices; in
the second case they are named linked categories; in linked categories, the list of items as
well is shared among matrices, and modifications to a category’s items in a matrix are
immediately reflected in the linked ones6; linked categories are a powerful tool for cross
referencing information among different matrices
− the values that a category can assume at the finest level of detail are called items;
− the user can create groups of items nested on several levels, corresponding to OLAP
hierarchies;
− measures have not a rigid equivalent, usually fields containing “final data” to be analyzed
are grouped in a category named Item, having “data field” names as item values; a scalar
data point correspond to a cell in the matrix, uniquely identified by a set of coordinates, i.e.
6 Please note that matrices with linked categories share the respective list of items, not the data associated to each
item. Take a model with two matrices; Alfa company income and Beta company income; they share the period and
lineItem categories, so they contain data for the same combinations of periods and income components but obviously
values for a given cell (e.g. Revenues for year 2004) are different.
XBRL and Quantrix Modeler Luca Erzegovesi http://smefin.net
25
a set of item values for “dimension” categories and a “data field” item value from the Item
category;
− for a matrix a set of formulas can be defined in order to obtain calculated values for a subset
of its cells, defined by the left side of the formula; the formula’s right side can reference
data in the same matrix, in other matrices of the same model, or from matrices in external
models.
The similarities between an OLAP system and a multidimensional spreadsheet model end when
one comes to the user experience. In OLAP systems the user navigates across a pre-existing
information base doing data mining and analysis, The structure of the underlying matrix, the
data Hypercube, is defined by a system administrator, as well as computed fields and automated
procedures. The end-user can change the perspective and level of detail of inquiries, following
numerous paths (slicing and dicing, drill-down, design of personalized dash boards, etc.), but
has no control over the underlying information base or the business logic applied. In Quantrix
data and its structured representation can be modified interactively, as is typical in financial
planning where the user changes assumptions and other subjective input data, that is mixed with
actual information, imported from external systems. Computations, too, are in control of the end
user. The model can be flexibly changed, and the effect of the changes is immediately
appreciated.
4 - XBRL and two-dimensional spreadsheets
As can be imagined, spreadsheets have been used as the primary end-user tool for performing
analysis of XBRL data. In this section, I will briefly give some hints on the use of the most
popular commercial spreadsheet application, Microsoft Excel, for analyzing XBRL data.
4.1 Spreadsheet add-ins for importing and manipulating XBRL data
XBRL data services developed by the US SEC (Edgar On Line), the Deutsche Börse and the
Korean Stock exchange7 use Excel as one of the export formats. Special Excel templates or add-
ins are provided as a tools to report or analyze XBRL data.
In 2003 Microsoft announced a set of XBRL tools for the Office Suite, comprising an Excel
add-in capable of tagging ranges of data in a spreadsheet in order to produce valid XBRL
document instances. Such prototype allowed the definition of formulas in terms of XBRL
concepts, addressing the specific problem of analysis of accounting ratios and stock market
indicators. As far as I know, a more refined version of this tool is being developed, but its
release has not been announced yet.
In 2004 Rivet Software released Dragon Tag, an Excel add-in targeted to end-users of XBRL
information. Dragon Tag is capable of reading XBRL taxonomies. The user can also extend
imported taxonomies (a relevant feature of this software). It allows the configuration of context
elements for an XBRL document instance. On the basis of the concept classification taken from
the imported and extended taxonomy set, and of the context coordinates configured in the
spreadsheet, the user can tag data in Excel with XBRL metadata, so as to export valid document
instances. Another advertised feature of Dragon Tag is the ability to “paint” cell ranges, not
only single cells, with taxonomy or context tags, for example assigning a period attribute to a
column of values in a table. This shared settings are called hoppers.
7 See, respectively, http://www.edgar-online.com, http://xbrl.kosdaq.com and http://xbrl.deutsche-boerse.com.

XBRL and Quantrix Modeler Luca Erzegovesi http://smefin.net
26
Other vendors have similar offerings (see the product showcase on http://www.xbrl.org for an
updated list).
The experience so far in the use of spreadsheet-based software in the XBRL arena confirms the
strength and weaknesses of this popular tool that have been summarized above. The spreadsheet
in itself is a clean slate. The bulk of the work needed for specific processing of XBRL
taxonomy and instance data is done by add-in modules. There are not relevant synergies
between XBRL and native spreadsheet functionality, both in representation and in processing of
information. The strength of spreadsheets resides once more in their widespread adoption: one
can bring XBRL data into a spreadsheet and then work on it in the familiar way.
4.2 Analyzing imported data in spreadsheets
Once in a spreadsheet model, the XBRL information can be managed in two ways.
The simpler solution consists of tabular reports displaying decoded XBRL data with any desired
layout The add-in module has to prepare the “landing area” for concept labels, placed in the
rows headings, and context elements, placed in column headings on one or several levels (by
period, entity, segment, scenario); it has then to populate the report skeleton with data, adding
formulas for computed cells implementing the logic in the calculation linkbase; other formulas
may be added manually by the user. Formula expressions may refer to cell coordinates or else
use XBRL concept names; in the second case an extra layer of processing is required
(presumably the creation of range names mapped to concept elements, and the definition of cell
formulas based on those names).
Another solution makes use of pivot tables. Imported information can be stored in a worksheet
as a flat table that is assigned as a data source to a pivot table. Each row of the data source
should contain a data point together with key fields of two kinds:
− metadata from the taxonomy, i.e. a flattened subset of data and attributes from the schema
and the presentation, calculation and label linkbases, such as concept name, report where it
is displayed, descriptive labels, parent concept, calculation weight, etc.;
− metadata from the specific instance (period, entity, segment, scenario).
You can filter the data for a specific report and visualize it in the correct order as a pivot table;
following this approach, you preserve the semantic and the structure of XBRL information
behind reports. The layout can be flexibly restructured changing the type and the order of
context dimensions used for visualization; computed values according to the calculation
linkbase can be reproduced adding some calculated columns to the data source and using
automatic row or column totals in the resulting table. You can also add formulas for creating
calculated fields and calculated items to the pivot table, but this is not an intuitive process. Data
visualized in the pivot report can be further elaborated upon in other sections of the spreadsheet
model, using the GetPivotData() function, which accepts field names and values as arguments,
or pointing and clicking to the pivot report’s data manually. Pivot tables can be a good
environment for visualizing and doing basic computation on imported XBRL data, if one is
satisfied with the formatting options available and can tame their sometimes unexpected
behavior.
5 - Managing XBRL in Quantrix
Quantrix distinctive features can be useful in designing a system for consuming and
manipulating XBRL documents.

XBRL and Quantrix Modeler Luca Erzegovesi http://smefin.net
27
Underlying XBRL there is a multidimensional data model. At present, the best-practice
approach to designing XBRL software applications is based upon specialized processors
(taxonomy parsers and editors, instance creators, data servers), implementing an object model
composed of software classes, written in Java or other programming languages, mapped onto
taxonomy and instance elements. There are several implementation of such application
platform, both commercial (e.g. Ubmatrix, Fujitsu, Decisionsoft) and open source (e.g. ABRA,
XBRLcore, XBRLapi). The line between commercial and free software is blurred, as the major
vendors make available no-charge versions (Fujitsu) or adopt a mixed commercial – open
source business model (UBmatrix). Specialized XBRL repositories for persisting and sharing
XBRL data are the other main component of an XBRL programming platform. Such
repositories are built either with native proprietary solutions, provided by the same specialized
vendors of XBRL libraries mentioned above, or using database management systems (DBMS).
The DBMS of choice for an XBRL project may be a native XML database, ore a familiar
relational DBMS (see [6]).
Quantrix multidimensional matrices can offer an alternative solution for both XBRL processing
and data management. In Quantrix you maintain a one-to-one, transparent mapping between
XBRL concepts and their equivalent in the data consuming application, adding extra
functionality for extending the taxonomy and manipulating the instance data thanks to rich
computation capabilities offered by formulas, with the additional benefit of hiding the
complexity of the underlying XBRL model. I will prove the advantages of using Quantrix by
means of an example, based upon a report (Income Statement, by function) from the ifrs-gp
taxonomy.
5.1 Configuring the DTS
The user of reports written in the XBRL language works in an environment that is defined by a
Discoverable Taxonomy Set (DTS). The DTS is a set of taxonomy documents: schemata,
linkbases, other documents defining data types and domains (roles). The DTS may include
documents from several taxonomies. In a typical case a base taxonomy, such as the ifrs-gp,
forms the backbone, with one or more extension taxonomies. The physical organization of
document files must be managed by a data import interface, configured via appropriate settings
in a Quantrix model8.
In order to make our environment self contained, I will define for each taxonomy or taxonomy
extension a namespace prefix, and suppose that each prefix is unique within the DTS, and that it
is consistently used across the DTS in order to build unique id attributes for a given XBRL
concept. These prefixes also correspond to the ones used in document instances in order to
identify schema concepts taken from different taxonomies9.
In order to configure the environment for data interfaces, a matrix named DTS-taxonomies is
created, containing a category prefix used as the unique identifier of taxonomies. For each
taxonomy, the string composing the namespace of the taxonomy and the file names of the
“dictionary” documents (schema, label and reference linkbases) are inserted as items in an Item
category. The physical location of corresponding files can also be specified in a local dir item.
For file names, an item group named file is created, with children schema, label and reference.
file.label is another item group with as many items as the languages for which labels are
8 We cannot provide a detailed treatment of import procedures here. Additional information can be requested to the
author. 9 If namespace prefixes for the same taxonomy URI are varied by creators of instance documents, a simple mapping
table is needed to change the prefix to the one used in our model, when importing XBRL, and vice versa, when
exporting.

XBRL and Quantrix Modeler Luca Erzegovesi http://smefin.net
28
defined. For languages different from the default (English for the ifrs-gp), the language code is
included in the file name of label linkbases. The following figure shows the DTS-taxonomies
matrix followed by the formulas computing the namespace and file names.
The DTS-taxonomies matrix
A taxonomy may have an indefinite number of reports, configured in their respective
presentation and calculation linkbases. In order to set the list of reports to be imported in our
model, a DTS-Reports matrix is created. Each report is uniquely identified by a prefix category
(linked to DTS-Taxonomies), which refers to a taxonomy, and a prog category (a generic
counter). A short name is assigned to each report. The file names for presentation and
calculation linkbases (file.presentation and file.calculation) are computed from the taxonomy’s
prefix and date, the report’s type (is for Income Statement, bs for Balance Sheet, and cf for
Cash Flow Statement) and qualifier (a short string indicating its specific format), and the
linkbase’s type (pre for presentation and cal for calculation). Here is the result.
The DTS-Reports matrix
5.2 Dictionary matrices
The information needed by our model will be imported from taxonomy files into dedicated
Quantrix matrices. One main category concept will manage the unique identification of

XBRL and Quantrix Modeler Luca Erzegovesi http://smefin.net
29
taxonomy concepts. An XBRL concept is mapped onto an unique identifier composed of its
taxonomy’s prefix (see before) and its name attribute separated by “_”. The same composite
key will be used to identify concept data in matrices created from instance documents (see
below, Section 5.5).
We will have10
:
− a DTS-Schema matrix with prefix and concept as row categories and Item as column
category with columns type (containing basic XBRL types such as monetary, string,
decimal, shares, or taxonomy specific types, prepended by their namespace),
substitutionGroup (item or tuple), period, balance, and abstract, a boolean valued 1 if the
concept is abstract and 0 otherwise;
− a DTS-Label matrix with prefix, concept, language and labelRole as categories; in this way,
each label can be uniquely identified; prefix and concept are linked to the corresponding
categories in DTS-Schema; a label value is assigned to each valid combination of the
categories, together with an id field computed by the import procedure, given by prefix +
concept name + labelRole + language code separated by “_”, which serves as a convenience
primary key for looking up label values to be shown in reports.
The following figure shows a view of the DTS-Label matrix:
A DTS-Reference matrix can also be created, but it will not be considered because it is not used
in our application.
“Dictionary” matrices, and DTS-label in particular, make use of numerous categories. Since the
ifrs-gp taxonomy is a huge one, with 4111 concepts, this has a cost in terms of larger model size
and longer recalculation times. The “hyperdimensionality” of the matrices should not be an
issue because taxonomy information is used only in the stage of configuring matrices used for
reports. Moreover, Quantrix does a good job in managing sparse matrices, provided that the
underlying formulas are few and simple, as is the case for our DTS matrices, which have no
formulas. At any rate, schema and label dictionaries can subsequently be removed from the
model, releasing memory and disk space. On the positive side, with generous use of categories,
importing data into unique rows and looking up attribute values for a given concept id is much
easier.
The process of importing data from the schema and label files into the DTS matrices is
performed through a QAPI11
action developed in a Quantrix plugin, making extensive use of the
10 See above 2.3, page 5 for a brief explanation of taxonomy elements and attributes mentioned here.

XBRL and Quantrix Modeler Luca Erzegovesi http://smefin.net
30
functionalities provided by Quantrix Datalink12
. I have enhanced XML parsing and
transformation by means of two open source Java libraries, dom4j and saxon. Something better
could be done if QAPI provided finer control over the native XML import engine in Quantrix13
.
The import procedure is computationally intensive, because it tries to compact information that
is dispersed in different parts of schema or linkbase files. As an examples, it browses elements
of type locator in order to reconstruct the presentation sequence of a report, but most of the
needed information is taken from presentationArc elements, cross-referenced via xslt and
XPath instructions.
The above mentioned XBRL processing engines from major vendors do a much better job than
our home made import procedures: they maintain in memory the whole network of schema and
linkbase elements, and therefore provide a more powerful and specialized toolkit for parsing
taxonomies, navigating around and sorting out what is really needed. Anyway, our import
procedure, although not designed for speed and efficiency, gets the job done. It can be easily
substituted with one of the XBRL libraries currently available as open source software.
5.3 Report matrices
Importing schema and label dictionaries into Quantrix has been straightforward so far.
Configuring the layout and the computational structure of the reports, on the contrary, is not
trivial task. A lot more functionality has to be implemented, and complex relationships between
taxonomy and instance data must be managed.
A Quantrix matrix representing a report should have at least the following features:
− visualize report items in the correct order and in the right hierarchy;
− expose descriptive labels, for the correct labelRole, in a language of choice;
− show values from document instances for different contexts, exploding context dimensions
into a readable format (e.g. indicating the reporting period) with various layouts (e.g.
current and previous periods side by side, or only current period, or detail by period /
scenario, etc.); we shall assign values taken from a document instance to a valueInput item,
− compute values for aggregate items from the respective component items, according to the
formulas specified in the calculation linkbase; these values are assigned to another item,
named valueCalc;
− compare valueInput and valueCalc for any item, and explain the cause of inconsistencies
between them, which may arise from a calculation error in the instance or else from the lack
of detail in the input data.
Quantrix modeler offers various routes for meeting this list of requisites. I will present what I
have learnt from my personal experience, with no presumption of having found an optimal
approach.
The first challenge is reproducing the presentation hierarchy of reported XBRL concepts. Two
approaches can be followed:
11 QAPI is a Java programming interface available to users of the professional version of Quantrix Modeler. With
QAPI, users can develop plugins extending the functionalities of the program. 12 Quantrix Modeler Datalink, available in the professional version of Quantrix Modeler, is a set of procedures for
importing data into a Quantrix model’s matrix from external data sources such as relational databases (through
JDBC), text files, XML files and web services. 13 Allowing preliminary xslt transformation, or the execution of an XQuery statement, would be a welcome addition
to Quantrix Datalink’s XML module.

XBRL and Quantrix Modeler Luca Erzegovesi http://smefin.net
31
− one is giving structure to the items of the concept category, by means of a hierarchy of item
groups and items corresponding to “leaf” concepts, containing elementary input values;
− the other is maintaining a flat sequence of concepts, without groups, and reflect the
hierarchy in the visual aspect of concept labels.
The first approach may seem promising at first, and actually I started from it. It requires a lot of
programming: a QAPI action must be written, computing the nesting level of concepts in the
hierarchy and creating groups in a bottom-up order, starting from leaf items and ending up with
the report’s root. This way meets serious shortcomings:
− the tree structure is represented in the leftmost category column, containing items related to
the XBRL concepts; you are forced to choose a readable format for item names (not the
concept’s id);
− with the previous solution, you must choose a reporting language, which could be changed
only with a Java procedure browsing the item names and changing them to a different
language;
− the text or aspect of names in a category column cannot be modified neither with formulas,
nor with conditional format settings; it must be set manually or programmatically;
− in theory, formulas from the computation linkbase can be assigned to summary items
inserted for each item group; those formulas might have a simple structure of the sort
[group].valueCalc = sum(summary([group].valueInput*[group].weight)) in
practice, this is awkward, if not unfeasible, because you have to manage the sign of the
weight attribute of child items in a nested structure; higher level sums do not maintain the
sign of leaf items, but you have to consider the weight assigned to the intermediate level
sum;
As an example, Profit is defined as (Revenues × 1 + Expenses × -1), but each item summing up to
Expenses has a positive weight, and their weighted sum is positive, so the weight of detailed items
must be reversed in order to computed Profit directly from their values. It is not easy to manage a
nested product of weights with changing sign in a summary item.
− using summary items, you insert something that has not necessarily an equivalent in the
presentation linkbase; the position of the total must be chosen (before or after the child
items?) and you have also to decide about the display of the group name (yes or no? is it a
placeholder for an abstract XBRL item?); such choices must be hard coded in the Java
action;
− when the XBRL formula specification will be released, weighted sums will no longer be the
only way for defining the computational structure of a report; it is unreasonable to limit
what you do in Quantrix because you cannot do it in XBRL now (but you will be able in the
future).
For these reasons, I have decided to follow an alternative route. After a lot of trial-and-error, I
convinced myself that a solution should meet the following principles:
− the matrix for a given report should self-contain, or easily access in a dedicated helper
matrix, all the taxonomy information needed to present, compute and audit its data content;
− the matrix dimensions (and its size) should be kept as few as possible;
− readable Quantrix formulas should be created by the import procedure from the calculation
linkbases’s dependency trees.

XBRL and Quantrix Modeler Luca Erzegovesi http://smefin.net
32
What I obtained on this grounding is a report design with the following features. The main
dimension of the report is a category called concept_label, whose items are unique ids for
concepts reported; concept_label is a string normally composed of prefix, concept name
separated by “_”, as in the concept category of DTS matrices; only for items linked to special
label roles, such label role value (e.g. periodStartLabel or restatedLabel) is appended,
again separated by “_”.
5.4 Representing layout and calculations of a report in the taxo matrix
I decided to keep all the taxonomy information used for displaying the report and validating the
instance data in a dedicated taxo matrix. The concept-label category provides the main
dimension for a report matrix. Taxo matrices have also a category named Item that contains the
following metadata items taken from the taxonomy:
− prefix, the taxonomy prefix for the concept;
− concept, the concept’s XBRL name;
− presRole and calcRole, respectively the names of the presentationLink and of the
calculationLink containing the concept;
− presFrom and calcFrom, respectively the id of the parent concept, which corresponds to
the attribute xlink:from in the presentation and calculation arcs used in the respective
linkbases; for root elements a fictitious id value [prefix]_root is assigned by the import
routine;
− presOrder, the position in the sequence of children of the same parent (the order attribute
in a presentation arc);
− labelRole, the label type used at this point in the report;
− presLevel, the level in the presentation tree hierarchy, which assumes value 1 for root
concepts and increases for children up to the deepest nesting level; unlike previous columns,
this one is computed in Quantrix using a recursive formula14
;
− orderCode, a computed item that returns a long integer used for sorting the report’s rows in
the correct presentation order15
; an alternative is to sort the rows in the import procedure
and omit this item, which entails computing presLevel as well; the current solution may be
better if one intends to change the report structure in Quantrix, as is done in a taxonomy
extension;
− a labels group named after the language’s code, containing one item per managed language;
in our example we have two items labels.en and labels.it; their values are looked up in the
DTS-Label matrix with a formula16
;
14 The formula is:
presLevel = if(presFrom="","",if(presFrom=prefix &
"_root",1,select(presLevel:concept_label,@concept_label,presFrom)+1)) 15 The formula for orderCode is the following:
orderCode = if(presLevel="","",if(presOrder=0, countif(presOrder:concept_label[FIRST] ..
presOrder:concept_label[THIS],0)*10^((max(presLevel:concept_label)-
1)*2),select(orderCode:concept_label,@concept_label,presFrom)+presOrder*10^((max(pres
Level:concept_label)-presLevel)*2)))
The complexity of the formula arises from the need to manage more than one root element per report, which is never
the case in the report layouts considered here. 16 The formula is:

XBRL and Quantrix Modeler Luca Erzegovesi http://smefin.net
33
More columns may be added to include all the schema attributes for each concept (e.g. balance,
periodType), so as to make the report matrix completely self-contained.
Here is a view of the hidden “metadata” part of the taxo matrix for the report Income Statement,
by Function.
The columns actually displayed in the report are the following:
− label, a computed item17
taking the label text for the current language selected in the
Settings matrix, and prepending to it a number of spaces equal to presLevel × 2; the column
has a conditional format, assigned by the import procedure, depending on presLevel;
− valueInput, a container of instance values for an appropriate context; the assignment
formula is presented below;
− valueCalc, a group of computed items taking valueInput by default, and overridden by
formulas defined in the calculation linkbase in the case of aggregate items; valueCalc has as
many items as the number of calculationLink(s) used in the report (multiple calculation
links allow more than one definition per aggregate item, see above, page 13); formulas for
valueCalc are composed by the import procedure; a readable Quantrix formula seemed to
me a much better alternative than a nested tree showing attributes of
calculationArc(s). A declaration In valueCalc.[calculationLink name], is
prepended to the formula in order to make it more compact. Children items are referenced
via their concept_label item values, which normally are the same as their XBRL id(s).
labels = select('DTS-Label'::Item.label,'DTS-Label'::id,
concept & "_" &labelRole & "_" & @Item) 17 The formula is:
label = if(concept="","",rept(" ",presLevel) & indirect(Settings::lang))

XBRL and Quantrix Modeler Luca Erzegovesi http://smefin.net
34
The following figure shows the columns label, valueInput and valueCalc of Income Statement,
by Function (note the presence of two items in the valueCalc group, one for the main
calculation linkbase (IncomeStatementByFunction) and the other for a second, ancillary
calculation linkbase (other):
The report can be rendered in another supported language by changing the lang value in the
Settings matrix. Here is a portion of the Italian version:
XBRL and Quantrix Modeler Luca Erzegovesi http://smefin.net
35
Behind the scenes, the following formulas, automatically composed by our taxonomy import
procedure, are ready to be computed:
In the formatted report displayed above, some values are displayed. They are taken from a
sample document instance and fed into the valueInput column by means of a formula (see
below, section 5.5, for details). All the values shown in valueInput are from a single instance
context, named CurrentForPeriod, of type period.
The valueCalc column echoes by default valueInput thanks to a general formula valueCalc =
valueInput, except for the concepts having a mathematical definition in the calculation linkbase.
Such definitions are translated into matrix formulas “eclipsing” the general one.
In the displayed data, there are some inconsistencies between inputs and calculated values:
sometimes, as for Gross profit [by function] in the 7th
row, valueCalc is equal to valueInput;
elsewhere, as in the case of Other operating income, Total [by function] in the 14th row,
valueCalc, computed from a formula, is zero-valued, whereas valueInput, coming from the
instance, has a non-zero value. The problem lies in the incompleteness of instance data: the
items that sum up to Other operating income, Total [by function], which are not disclosed in
detail in the given instance, have empty values summing up to zero. We will solve this problem
adding some conditional expressions to the formulas. Before showing how to do that, let’s
analyze the information contained in the instance in order to find a way to display data for more
than one context along several dimensions.
5.5 Document instance information
Data contained in XBRL instances are more dynamic than a taxonomy’s metadata. The crucial
issue is the enumeration of contexts and the “explosion” of their dimensions (period, entity,
segment, and scenario), which are defined in the instance and cannot be known in advance.
Moreover, segment and scenario elements may have an arbitrarily complex structure. I will not
deal with this case here, and assume that segment and scenario are either undefined or take a
simple value (a string identifier).
Our example uses the SampleCompany.xml instance file, which has been made available on
the IASB web site. In order to import instance document files, I have programmed another
QAPI action in Java. Such procedure parses the instance document and creates three matrices:
− Instance-Contexts, a flat representation of contexts used in the instance;
− Instance-Units, a list of units of measure used in the instance;
− Instance-Facts, each one containing data for a combination of concept, context and unit.
XBRL and Quantrix Modeler Luca Erzegovesi http://smefin.net
36
Instance-Contexts has a main category named context, having items corresponding to the names
of contexts used in the instance. For each context the following properties are defined, as items
in the usual Item category:
− child elements and attributes of context elements, namely entity, entityScheme, segment
and scenario;
− periodStartDate, periodEndDate and isInstant, used for capturing period information;
when period is of type instant isInstant has value 1, and periodStartDate equals
periodEndDate, whereas periods of type duration have isInstant = 0, and periodStartDate
< periodEndDate;
− contextValue, a convenience column replicating the context item name.
Hereafter we have the Instance-Contexts matrix created by our import procedure applied to the
sample instance:
As can be seen, segment and scenario take default values noSegment and noScenario
respectively, since they are undefined in the sample instance.
Instance-Units has a very simple structure, with a main unit category and an Item category with
only one item measure (complex measures are not used):
A fictitious nonMonetary unit has been added manually in order to filter facts not relevant for
our analysis.
Once the domain of contexts is configured, importing data is straightforward. One has to create
an Instance-Facts matrix with the following structure:
− a main category concept; this category may be linked to the corresponding category in
DTS-Schema matrix, but I did not link it for two reasons, first to avoid redundancy (the
instance may contain a small subset of a very long list of concepts), and second because we
would lose the physical order of concepts in the instance document;
− two categories context, and unit, linked to the corresponding categories created before in
Instance-Contexts and Instance-Units matrices;
− the usual category Item with items value and decimals, used for storing instance fact
values.
By creating linked categories, we are able to exploit Quantrix multi-dimensional engine for
filtering, displaying and referencing facts related to different contexts and units. However, we
shall see that context references have to be “exploded” and elaborated in order to extract the
dimension that are meaningful to show in a report or a financial analysis document.
The information contained in the fact elements of the document instance is easily imported in
this structure with the QAPI action. Here is a portion of the resulting matrix with fact values:

XBRL and Quantrix Modeler Luca Erzegovesi http://smefin.net
37
This matrix is the source of values displayed in the report shown above (see section 5.4). For
simplicity, values are assigned to valueInput by means of Quantrix indirect() function with
the following formula, taking as argument a string composed of the item names which define
the dimensions of the appropriate cell in the Instance-Facts matrix (references to scenario and
unit are hard-coded into the formula for simplicity):
As an alternative, we could use Quantrix select() function.
5.6 Normalizing and extending context information
In a financial report, one would like to see values displayed by relevant dimensions, such as
period, entity, scenario. In Quantrix Modeler a financial analyst can easily design the structure
of multidimensional reporting templates, and reshape it by simply dragging and dropping
category tiles. In this section I show how this can be done for the reports created from an
XBRL taxonomy.
Reporting dimensions other than financial concepts must be extracted from instance contexts.
Contexts are opaque elements. They just provide a unique identifier for a set of dimensions. For
a typical annual report, you must have at least two contexts for each accounting period, one for
duration data and the other for instant data. You cannot guess from a context’s properties the
relationships with other contexts: for a duration context you cannot identify the instant context
for the same fiscal year, or the context for preceding or following periods, or even the context
for the same period but having a different scenario.
In order to make this information transparent to the model, I have created an Instance-
CategContexts matrix, a multi-dimensional re-mapping of the Instance-Context matrix. In order
to gain insight into the relationships among contexts, I added to Instance-Context three
calculated items:
• period type, which may assume the values instant, monthly, quarterly, yearly, irregular
(for details see the enclosed sample model);
• year, i.e. the year containing the instant date or the end date of the period;
• period Descr, an ancillary string item to be added to year in order to specify the
context’s period with clarity.
valueInput=clearerror( indirect( "'Instance-Facts'::'U-
Euros':Current_ForPeriod:value:'" & @concept_label &"'"))

XBRL and Quantrix Modeler Luca Erzegovesi http://smefin.net
38
The Instance-CategContexts matrix is obtained with a Quantrix Datalink procedure, using
Instance-Context as the data source. In this way we transform some of the properties of contexts
into Quantrix categories. Here is a view of the resulting Instance-CategContexts matrix:
Some of the categories in Instance-CategContexts are for convenience and can be removed in
order to avoid the multiplication of cells in the matrix.
Thanks to the reshaping of contexts, we gained knowledge about context properties. We know
which context belongs to a given entity (there is only one, named SAMP, in the sample
instance). We can match the instant and yearly context referring to the same year. We have
control over the time sequence of contexts of a given period type. Now we are ready to design a
realistic report layout and fill it with instance data.
5.7 Showing a report in the data matrix
We will now put together the hierarchy of financial concepts from the taxo matrix and the
context dimensions extracted from the sample instance. This is done for a given report in a data
matrix , a close sibling of taxo, containing the following categories:
• concept_label, linked to taxo in order to have easy access to the report’s metadata;
• entity, unit, scenario and year, linked to Instance-CategContexts;
• Item, containing input and calculated values (valueInput and valueCalc) and other
convenience variables.
Fact values from the sample instance are assigned to valueInput with a formula that first
resolves the context name in Instance-CategContexts thanks to the categories linked to such
matrix18
, and than refers to a cell in Instance-Facts through the indirect() function, as was done
in taxo:
data improves over the computational capabilities of taxo. In taxo, you could compute values
for a single context, with no control over the presence or consistency of input values. In data, I
have added a boolean variable to the Item category, called hasUndisclosedChildren. This
variable, calculated for every concept, takes value 1 (true) whenever all of the “calculation
children” have empty values. The formula is lengthy and intricate (see the sample model for
details) and should be substituted by a more efficient QAPI function.
18 In the formula I have restricted the lookup of contexts to the ones having period type = yearly and period Descr =
yr, as is appropriate for a report displaying the income statement in an annual report.
valueInput = clearerror(indirect("'Instance-Facts'::'"& 'IncomeStatementByFunction
taxo'::concept & "':'" & 'Instance-CategContexts'::yearly:yr:context & "':'" & @unit
&"':value"))

XBRL and Quantrix Modeler Luca Erzegovesi http://smefin.net
39
When a calculated concept has a value of hasUndisclosedChildren=1, its valueCalc is taken
directly from the corresponding valueInput, by-passing the aggregation formula. Here is an
example for the concept OperatingExpensesTotalByFunction:
Thanks to this conditional expression, one can spot wrong calculations by simply comparing
valueInput and valueCalc.
Another refinement in data is the elimination of multiple valueCalc items that were needed in
taxo when multiple alternative formulas were defined for the same concept in different
calculation links: in such cases a new concept_label item is created by appending the secondary
extended link name (e.g. other) to the item’s name.
Here is the resulting data matrix, with empty rows hidden.
In the data matrix, there is a problem with the display of labels. In the taxo matrix, labels were
displayed in a column item, belonging to the same category as valueInput and valueCalc (the
Item category). The hierarchy was rendered by means of cell formats, made conditional on the
nesting level of each row. In data we have a multiplication of dimensions related to context
properties. If we add a label item to the Item category, it will be repeated for each combination
of entity, unit, scenario and year. One can collapse repeated label columns in order to hide
them, but anyway the output doesn’t look good. Labels are shown under the year item in the
first year. Changing the arrangement of categories can require manual resetting of hide / show
options.
For this and other reasons, the “flat list” approach adopted in the examples shown in this paper
is not fully satisfactory: while it makes easier building a report’s layout automatically from a
presentation linkbase, on the other side it makes unavailable the key features of Quantrix for
giving structure and readability to matrices. The data matrix would be more usable and better
looking if the concept_label category contained a hierarchical tree of labels, instead of a flat
sequence of identifier strings. Creating such structured view while importing a given XBRL
taxonomy isn’t straightforward. Such an approach is easier to follow when you design the
taxonomy in Quantrix, having control over the names of XBRL concepts and their mapping to
XBRL labels. In our Smefin project, we have followed the “structured tree” approach in the
design of the Italian XBRL taxonomy, with good results. I will elaborate on this experience in a
forthcoming paper. For now, we will pretend to be satisfied with the flat list approach.
In valueCalc, 'ifrs-gp_OperatingExpensesTotalByFunction' =
if('ifrs-gp_OperatingExpensesTotalByFunction':hasUndisclosedChildren;
'ifrs-gp_OperatingExpensesTotalByFunction':valueInput;
'ifrs-gp_MarketingAndDistributionCostsByFunction' + 'ifrs-gp_ResearchAndDevelopment'
+ 'ifrs-gp_AdministrativeExpensesByFunction' + 'ifrs-gp_RestructuringCosts' +
'ifrs-gp_MiscellaneousOtherOperatingExpensesByFunction')

XBRL and Quantrix Modeler Luca Erzegovesi http://smefin.net
40
5.8 Adding a forecast scenario
Let’s assume that the sample instance contains actual financial data. We can develop a very
simple pro-forma income statement where forecast values are computed from actual ones under
given assumptions for the two years following the last reporting period (fiscal year 2004). In
order to keep actual values distinct from forecasts, I have created a new scenario named
forecast. For clarity, I have also changed the name of the default scenario created by the import
procedure from noScenario to actual. I have made these changes in the Instance-CategContexts
matrix. In order to show the newly created contexts, we must disable the Hide Empty
Rows/Columns option in the View menu. I have also added two new items to the year category,
for years 2005 and 2006. At this point, we must fill the cells for the new instant contexts in the
columns periodStartDate, periodEndDate and context. Instant contexts are named Next1_AsOf
and Next2_AsOf. We do something similar for period contexts, which are named
Next1_ForPeriod and Next2_ForPeriod. After turning the Hide Empty Rows/Columns option
on, we get the following view:
For a budgeting model, we would have defined actual scenarios also for years 2005 and 2006,
so as to perform analysis of variance as times passes and forecast periods become actual. Here
we want to perform a simple financial planning exercise, and consequently actual is used only
for past periods, whereas forecast is assigned only to current and future periods.
Changes to year and scenario categories are immediately reflected in the data matrix, where
such categories are linked.
I have created a Forecast drivers matrix where assumptions can be set by the user. The main
driver is the sales growth rate. Other drivers are growth rates of other items, incidence ratios of
expenses on revenues, and the income tax rate. This matrix has entity, unit, scenario and year
categories linked to Instance-CategContexts and data matrices. In the forecast scenario, drivers
are set as input values. In the actual scenario, they are computed as ratios on historical values.
For convenience, I have added two calculated columns in the data matrix, containing the
percentage change over the previous period and the incidence on Revenues.

XBRL and Quantrix Modeler Luca Erzegovesi http://smefin.net
41
The following screenshot shows the structure and the formulas of the Forecast drivers matrix.
In forecast scenarios, input values that in actual scenarios were obtained from the XBRL
instance, are substituted by values computed according to a financial model. Formulas for
forecasted values are straightforward. The valueInput column is computed with the following
expressions, which depend on Forecast drivers:

XBRL and Quantrix Modeler Luca Erzegovesi http://smefin.net
42
In forecast scenarios, formulas for calculated values need not being redefined: they are the same
formulas, derived from the calculation linkbase, that were good for actual values. Here is an
example of a report showing actual and reported values, both as euro values and as a percentage
of revenues:
Formulas make use of XBRL concept names, and are consequently understandable, and
reasonably concise. A matrix containing financial ratios could be easily created, provided that
the values required by the ratios are contained in some data matrix. If new periods or scenarios,
or even companies and currency units, are added to the model, formulas need no modification,
and the report layout adjusts with little user intervention. Here the multidimensional structure of
Quantrix Modeler shows its strength. Think of the hard work that would be otherwise required
in a traditional spreadsheet: making room for new columns and sheets, revising the formulas,
checking for errors, adjusting layouts and printing options, etc.
5.9 Exporting a new version of the document instance with forecasts
Now that we have prepared an extended financial statement, let’s export our forecasts, together
with actual values, in a new XBRL instance document. We have already defined the contexts
for forecasts. It’s very easy to compose the XML for the facts reported in the data matrix. To
show how easy it is, I have created an export matrix, using three plain formulas for assembling
the instance fact elements from information contained in the taxo and data matrices. The
following figure is an excerpt from the export matrix.
The root xbrl element of the instance, as well as context and unit elements, can be easily put
together from information already in the model. A QAPI procedure could perform the whole
process efficiently.

XBRL and Quantrix Modeler Luca Erzegovesi http://smefin.net
43
6 - Conclusions and directions for future research
The model used for preparing the example presented in this paper is a proof of concept of the
capabilities of Quantrix as an environment for analyzing and producing financial data in XBRL.
We have shown how the multidimensional data model and calculation engine at the heart of
Quantrix can be successfully adapted to the XBRL object model. Reports defined in a taxonomy
can be translated almost automatically in Quantrix matrices, preserving their layout and
calculations. Financial analysts can expand on standard XBRL reports adding ratio analysis and
forecasting, simply using XBRL-aware Quantrix formulas. New data created in Quantrix
models can be easily expressed in XBRL, and made available to other applications.
In the simple exercise presented before, I have used only native Quantrix functionalities,
without any custom extension to functions used in computations. Using the QAPI Java
programming interface, I have extended the Quantrix Datalink module by adding some
procedures for importing XBRL taxonomy and instance documents. The prototype shown is a
starting point, but has the potential to evolve into a production system. There is great room for
improvements in terms of efficiency, compliance with XBRL rules, and reduction of memory
consumption. As an example, we could substitute our home made methods for document
processing with specialized XBRL Java libraries, or offload the document processing duty to an
external database server, which could provide a simplified view of XBRL constructs.
The results obtained are very promising for another key consideration: Quantrix has the
potential to front run the development of innovative features in the XBRL standard. The
modeling of dimensions in the structure of reports and in instance contexts and the formula
linkbase specification are two key developments of the XBRL standards, currently under way.
Those same functionalities can be easily implemented in Quantrix now. Quantrix can become a
precious tool for designing and testing innovative features, and make them available to end

XBRL and Quantrix Modeler Luca Erzegovesi http://smefin.net
44
users. Most of the work on new features of XBRL assumes a computing platform based on
server-based applications and XML query languages such as XPath or XQuery. Quantrix would
be an ideal complement to the toolset, being a client-oriented environment targeted to a more
interactive use.
As has been said in the introduction, this is the first in a series of papers. In a second
forthcoming paper, more complex issues will be analyzed, and specifically the new XBRL
specification for dimensions and its use in reports with a bi-dimensional table structure (e.g. the
Statement of changes in equity and movement analyses in explanatory notes). Subsequent
papers will tackle advanced issues, such as the implementation of the XBRL formula language,
and the integration of Quantrix with XBRL data repositories.
There is a lot of work to be done. With time, this work will be hopefully shared among a
growing user community, from both the Quantrix and XBRL worlds.
7 - References
[1] Aste, W., D. Panizzolo (2004), “Lo standard XBRL (eXtensible Business Reporting
language) e la comunicazione finanziaria d’impresa”, ALEA - Centro di ricerca sui rischi
finanziari, Università di Trento, Tech Reports, Trento, nr. 20, maggio.
[2] Egan, T., C. Hoffman, C. O hAonghusa, G. Pellizzari, T. Pyman, A. Ugarte (2005),
Hitchhikers Guide to Understanding the IFRS-GP Taxonomy, May 27.
[3] Erzegovesi, L. (2005), Financial Objects. Requirement Analysis, Smefin draft document,
http://aleasrv.cs.unitn.it/smefin.nsf/vistaperid/erzegovesi06 .
[4] Hoffman, C. (2006), Financial Reporting Using XBRL: IFRS and US GAAP Edition,
available on http://www.lulu.com.
[5] Rubash, A.R., M.A. Rubash (2005), Financial Modeling with Quantrix vs. Excel, Academy
of Business Education, Allied Business Education Association, Annual Conference, April 21-
22, http://www.abe.villanova.edu .
[6] XBRL España, White paper, Technology Working Group, 2005,
http://www.xbrl.org.es/downloads/libros/White_Paper.pdf .
[7] XBRL International (2005), Extensible Business Reporting Language (XBRL) 2.1, XBRL
International, RECOMMENDATION - 2003-12-31 + Corrected Errata - 2005-04-25.
[8] XBRL International (2005), XBRL 2.1 Conformance Suite 1.0, XBRL International,
Candidate Recommendation of 2005-04-25.
[9] XBRL International (2005), XBRL Specification and Guidance Stack (SGS) 1.0, XBRL
International, Public Working Draft of 2005-05-17.
[10] XBRL International (2005), XBRL Formula Requirements, XBRL International,
http://www.xbrl.org/technical/requirements/Formula-Req-CR-2005-06-21.htm .
[11] XBRL International (2003), XBRL Software Requirements, XBRL International, AICPA
XBRL Implementation Task Force, May.
[12] Shuetrim, G. (editor), (2002), XBRL FAQ, XBRL Australia, web page,
http://www.xbrl.org.au/faq .