xp investimentos 11° xp latam - imf meetings brazil’s economic
TRANSCRIPT

April 09, 2021
XP Investimentos 11° XP Latam - IMF Meetings
Brazil’s Economic Outlook and Agenda BC#
Roberto Campos NetoGovernor of Banco Central do Brasil

2
COVID-19Covid-19: new cases and new deathsGlobal scenario
Source: Our World in Data. Last data available: Apr 07, 2021.
New cases/million(7-day rolling average)
UK
US
Brazil
Europe ex UK
Lat. Am. ex Brazil
New deaths/million(7-day rolling average)
0
100
200
300
400
500
600
700
800
900
Mar-20 May-20 Jul-20 Sep-20 Nov-20 Jan-21 Mar-21
0
2
4
6
8
10
12
14
16
18
20
0
2
4
6
8
10
12
14
16
18
20
Mar-20 May-20 Jul-20 Sep-20 Nov-20 Jan-21 Mar-21

GLOBAL ECONOMYCovid-19 vaccinationVaccination
The biggest vaccination campaign in history
*UN initiative to support vaccination in low- and middle-income countries.Sources: Airfinity, FT, economic Times. BNP Paribas
3
Millions of administered doses(in millions and in % of population*)
Vaccine doses purchased(per capita)
Note: * The number of administered doses is less than or equal to the number of people vaccinated. In some countries, some people have already taken the second dose. Therefore, the percentage in relation to the population should be understood as “maximum percentage of the vaccinated population”.
709.9 MM (9.1%)
171.5 MM (51.8%)
149.1 MM (10.4%)
90.2 MM (6.5%)
84.9 MM (19.1%)
37.4 MM (55.1%)
24.2 MM (11.4%)
17.7 MM (21%)
13.5 MM (4.9%)
13 MM (8.9%)
108.5 MM (3.2%)
World
United States
China
India
European Union
United Kingdom
Brazil
Turkey
Indonesia
Russia
Rest of the world
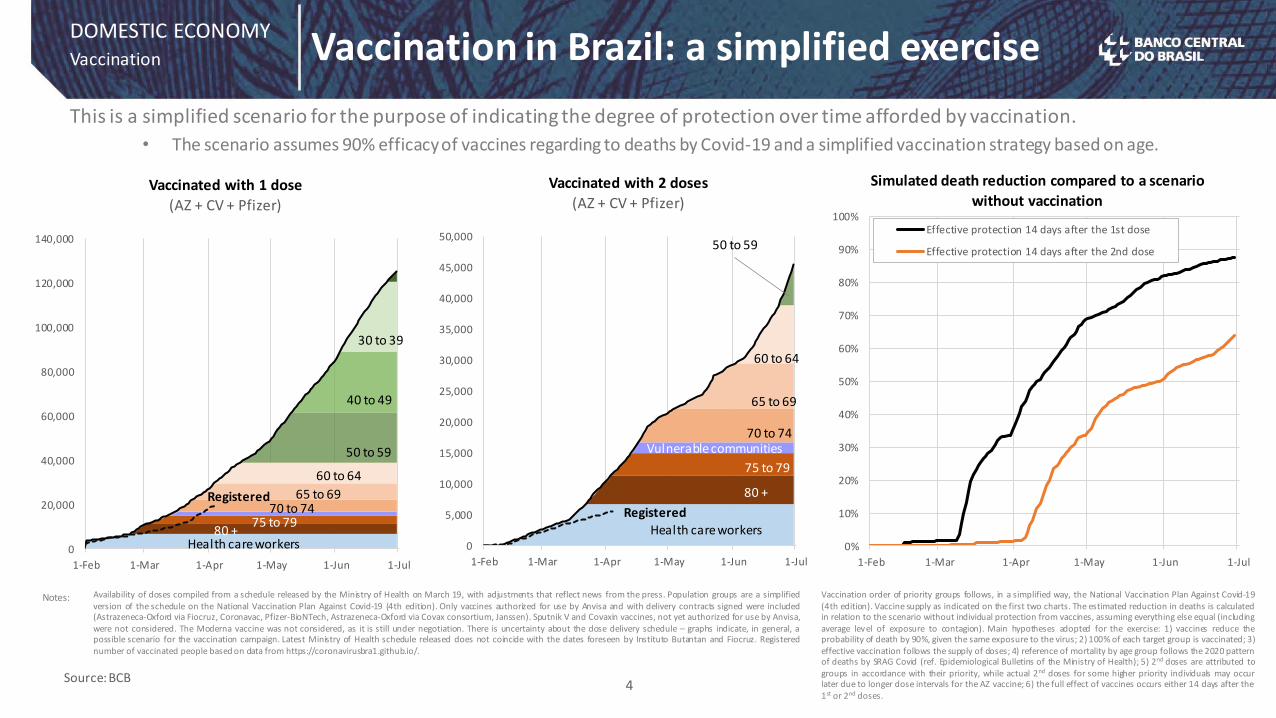
DOMESTIC ECONOMYVaccination in Brazil: a simplified exerciseVaccination
4
Availability of doses compiled from a schedule released by the Ministry of Health on March 19, with adjustments that reflect news from the press. Population groups are a simplifiedversion of the schedule on the National Vaccination Plan Against Covid-19 (4th edition). Only vaccines authorized for use by Anvisa and with delivery contracts signed were included(Astrazeneca-Oxford via Fiocruz, Coronavac, Pfizer-BioNTech, Astrazeneca-Oxford via Covax consortium, Janssen). Sputnik V and Covaxin vaccines, not yet authorized for use by Anvisa,were not considered. The Moderna vaccine was not considered, as it is still under negotiation. There is uncertainty about the dose delivery schedule – graphs indicate, in general, apossible scenario for the vaccination campaign. Latest Ministry of Health schedule released does not coincide with the dates foreseen by Instituto Butantan and Fiocruz. Registerednumber of vaccinated people based on data from https://coronavirusbra1.github.io/.
This is a simplified scenario for the purpose of indicating the degree of protection over time afforded by vaccination.
• The scenario assumes 90% efficacy of vaccines regarding to deaths by Covid-19 and a simplified vaccination strategy based on age.
Notes: Vaccination order of priority groups follows, in a simplified way, the National Vaccination Plan Against Covid-19(4th edition). Vaccine supply as indicated on the first two charts. The estimated reduction in deaths is calculatedin relation to the scenario without individual protection from vaccines, assuming everything else equal (includingaverage level of exposure to contagion). Main hypotheses adopted for the exercise: 1) vaccines reduce theprobability of death by 90%, given the same exposure to the virus; 2) 100% of each target group is vaccinated; 3)effective vaccination follows the supply of doses; 4) reference of mortality by age group follows the 2020 patternof deaths by SRAG Covid (ref. Epidemiological Bulletins of the Ministry of Health); 5) 2nd doses are attributed togroups in accordance with their priority, while actual 2nd doses for some higher priority individuals may occurlater due to longer dose intervals for the AZ vaccine; 6) the full effect of vaccines occurs either 14 days after the1st or 2nd doses.
Source: BCB
0
20,000
40,000
60,000
80,000
100,000
120,000
140,000
1-Feb 1-Mar 1-Apr 1-May 1-Jun 1-Jul
Vaccinated with 1 dose
(AZ + CV + Pfizer)
40 to 49
50 to 59
30 to 39
60 to 64
65 to 6970 to 74
75 to 7980 +
Health care workers
Registered
0
5,000
10,000
15,000
20,000
25,000
30,000
35,000
40,000
45,000
50,000
1-Feb 1-Mar 1-Apr 1-May 1-Jun 1-Jul
Vaccinated with 2 doses
(AZ + CV + Pfizer)
60 to 64
65 to 69
70 to 74
75 to 79
80 +
Health care workers
50 to 59
Registered
Vulnerable communities
0%
10%
20%
30%
40%
50%
60%
70%
80%
90%
100%
1-Feb 1-Mar 1-Apr 1-May 1-Jun 1-Jul
Simulated death reduction compared to a scenario
without vaccination
Effective protection 14 days after the 1st dose
Effective protection 14 days after the 2nd dose
80 +

75
80
85
90
95
100
105
110
T12019
T2 T3 T4 T12020
T2 T3 T4
Ave
rage
201
9 =
100
USA Euro area UK Japan China Asia ex Japan and China
5
GLOBAL ECONOMYGlobal Economic Activity
Global economic recovery continues to be directly linked to the evolution of the pandemic and containment measures.
Source: Bloomberg.
GDP*Average 2019 = 100
* Series at constant prices, seasonally adjusted. The series 'Asia ex. Japan and China' was calculated as a weighted average of Singapore, South Korea, Hong Kong, India, Indonesia, Philippines, Malaysia, Thailand, Taiwan and Turkey. The series of Singapore, India and Indonesia are not seasonally adjusted.
6
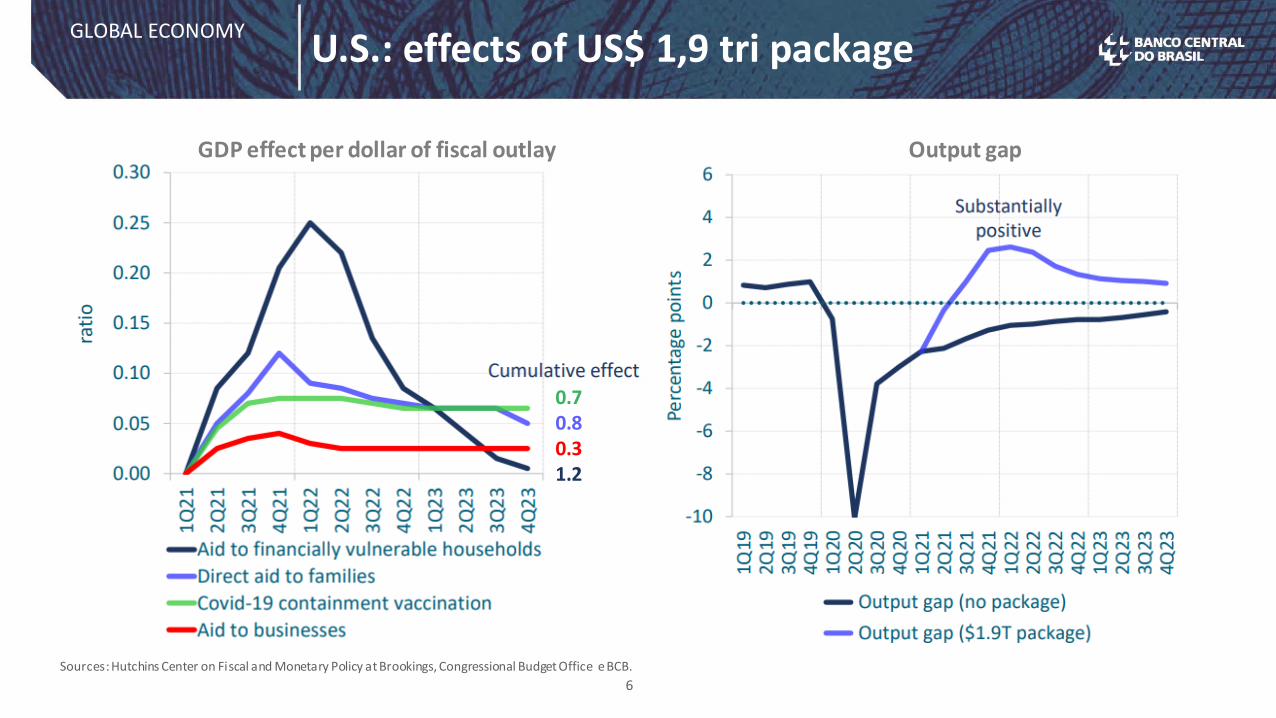
GLOBAL ECONOMYU.S.: effects of US$ 1,9 tri package
Sources: Hutchins Center on Fiscal and Monetary Policy at Brookings, Congressional Budget Office e BCB.
Output gapGDP effect per dollar of fiscal outlay
0.70.80.31.2
-50
-40
-30
-20
-10
0
10
20
30
Feb-20 Apr-20 Jun-20 Aug-20 Oct-20 Dec-20 Feb-21
Brazil Chile Colombia Mexico South Africa Russia
-12 -8 -4 0 4 8 12
Russia
South Africa
Brazil
Mexico
Argentina
Colombia
Chile
Malaysia
Peru
2022
2021
2020
7
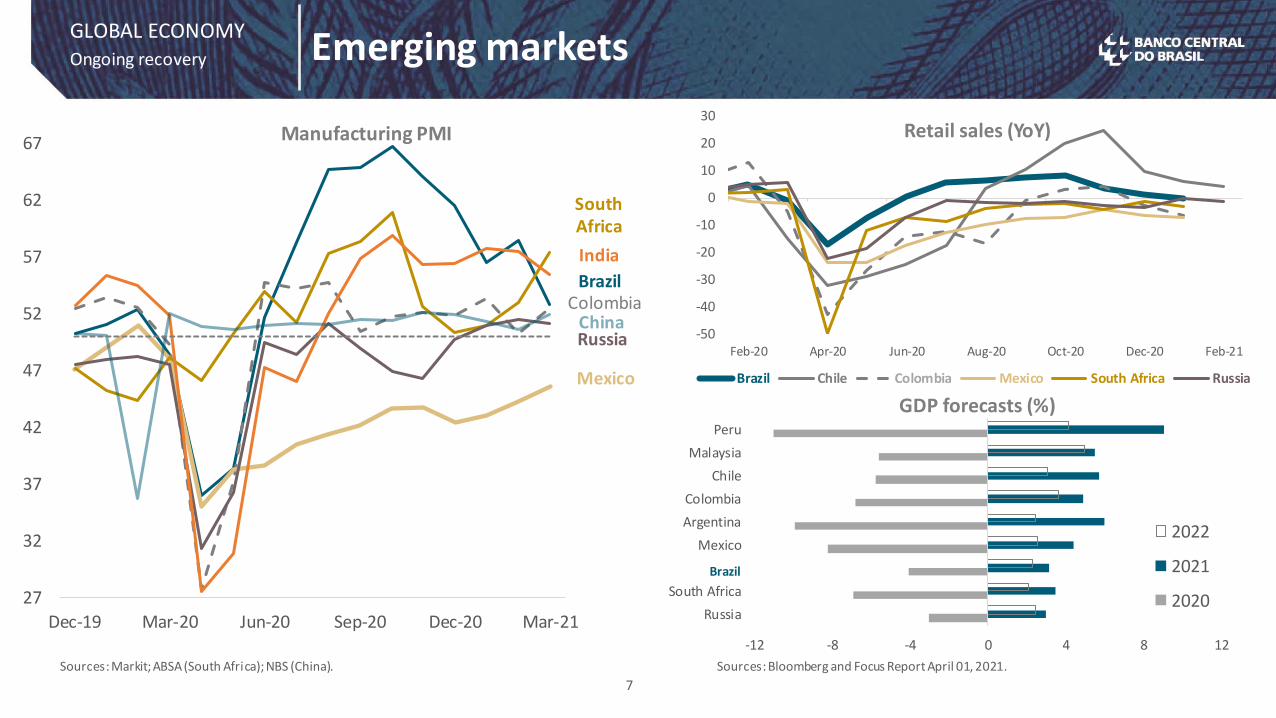
GLOBAL ECONOMYEmerging marketsOngoing recovery
Sources: Markit; ABSA (South Africa); NBS (China). Sources: Bloomberg and Focus Report April 01, 2021.
Retail sales (YoY)
GDP forecasts (%)
Brazil
BrazilColombia
Mexico
South Africa
Russia
India
China
27
32
37
42
47
52
57
62
67
Dec-19 Mar-20 Jun-20 Sep-20 Dec-20 Mar-21
Manufacturing PMI

8
GLOBAL ECONOMYEmerging markets: food pricesInflation
Increasing trend of food prices in international markets create upward pressure on inflation.
Sources: FAO, Bloomberg.
145
129
121
115
109
90
70
80
90
100
110
120
130
140
150D
ec-
19
Jan
-20
Feb
-20
Mar
-20
Ap
r-2
0
May
-20
Jun
-20
Jul-
20
Au
g-2
0
Sep
-20
Oct
-20
No
v-2
0
De
c-20
Jan
-21
Feb
-21
FAO Food Prices(Dec/2019 = 100)
Oils
Cereals
Sugar
Food Price Index
Dairy
Meat
121
120
108107107106106105102
100
95
100
105
110
115
120
125
Jan
-20
Feb
-20
Mar
-20
Ap
r-2
0
May
-20
Jun
-20
Jul-
20
Au
g-2
0
Sep
-20
Oct
-20
No
v-2
0
De
c-20
Jan
-21
Feb
-21
CPI Food (Jan/2020 = 100)
TurkeyBrazilRussiaChileMexicoSouth AfricaColombiaPeruIndiaChina

9
Covid-19 Government Fiscal Responses
Source: Bloomberg, IMF.
GLOBAL ECONOMY
EMMIEs* = emerging market and middle-income economies
Advanced Countries Emerging and Middle-Income Countries
1.8 3.0 3.4 4.1 4.2 4.2 4.5 5.3 5.4 6.8 7.2 7.711.0 12.7
14.6 15.6 16.2 16.3 16.3 16.719.1
2.6
8.8
4.37.0 10.2 14.4 5.3 4.4 8.3 6.0 15.5
35.5 11.9 15.8
27.811.3
4.028.4 1.8
4.7
16.1
2.4
2.7
0
10
20
30
40
50
Den
mar
k
Fin
lan
d
Kore
a
Spai
n
Swed
en
Nor
way
Net
her
lan
ds
Swit
zerl
an
d
Czec
h R
ep
Ital
y
Belg
ium
Fran
ce
Ger
man
y
AEs
Cana
da
Jap
an
Aus
tral
ia
Sin
gap
ore UK
USA
New
Zea
land
% G
DP
0.7 1.1 1.2 1.6 2.0 2.2 2.3 2.4 2.4 2.5 2.5 2.7 2.9 3.1 3.6 3.8 4.1 4.4 4.7 5.4 5.56.4
7.7 8.2 8.3 8.3
0.8
1.39.0 1.7
0.10.0 0.8 3.2 3.1 0.5 0.0 0.9 0.9
1.5 5.12.5 1.9 5.7 3.9 1.3
9.6 4.2
0.0
5.41.8 4.3
6.2
0
3
6
9
12
15
18
Mex
ico
Tu
rke
y
Alb
ania
Egyp
t
Paki
stan
Sau
di
Ara
bia
Rom
ania
Kaza
khst
an
Tuni
sia
UA
E
Ph
ilip
pin
es
Indo
nesi
a
Russ
ia
Indi
a
EM
MIE
s
Arg
enti
na
Colo
mbi
a
Bu
lga
ria
Chin
a
Peru
Sout
h A
fric
a
Ge
org
ia
Pola
nd
Ch
ile
Th
aila
nd
Bra
zil
% G
DP

0
14
28
42
56
70
84
98
112
126
201
1
201
2
201
3
201
4
201
5
201
6
201
7
201
8
201
9
202
0
202
1
Angola
Egypt
South Africa
Morocco
Algeria
Nigeria
India
Pakistan
China
Malaysia
Turkey
Kazakhstan
Azerbaijan
Russia
Thailand
Philippines
Croatia
Hungary
Ukraine
Romania
Belarus
Brazil
Uruguay
Bolivia
Colombia
Ecuador
Peru
Chile
Mexico
Dominican Rep.
Oman
Islamic Re. of Iran
Un. Arab Emirates
Source: IMF WEO oct/20.
GLOBAL ECONOMYFiscal responseFiscal Policy
10
Historical pattern of general government debt(% of GDP)
Advanced Emerging
140
120
100
80
60
40
20
0
Gross Debt – emerging markets(% of GDP)
AFR
ICA
ASI
A E
X M
IDD
LE E
AST
EUR
OP
ELA
TIN
AM
ERIC
AM
IDD
LE E
AST
Brazil
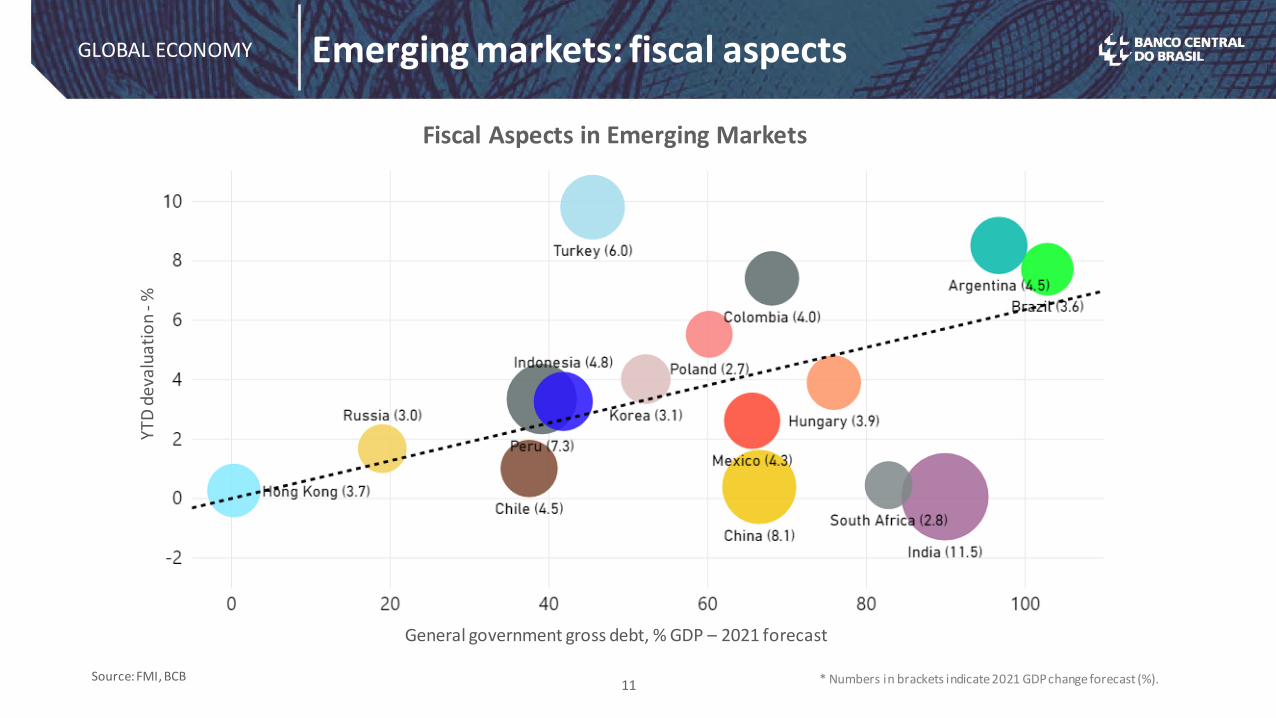
11
Emerging markets: fiscal aspects
Source: FMI, BCB
GLOBAL ECONOMY
* Numbers in brackets indicate 2021 GDP change forecast (%).
Fiscal Aspects in Emerging Markets
General government gross debt, % GDP – 2021 forecast
YT
D d
eval
uat
ion
-%

Differentiation in risk appetite for emerging economies with unfavorable economic fundamentals remains.
12
EME Group 1:Chile, Indonesia, Malaysia and Russia.
Gross Debt/GDP (average 2017-21) = 34.9%
EME Group 2:Brazil, Colombia, India, Mexico, South Africa and Turkey.
Gross Debt/GDP (average 2017-21) = 65%
Risk Appetite
GLOBAL ECONOMYRisk AppetiteMarkets
Sources: BCB, Bloomberg, Refinitiv, IMF, Fed St Louis. Gross Debt: IMF. Data up to March 31st.
-7
-6
-5
-4
-3
-2
-1
0
1
2
2017 2018 2019
stan
dar
d d
evi
atio
ns
to a
vera
ge
0
20
40
60
80
2017 2018 2019 2020F 2021F
% G
DP
Debt/GDPGroup 1 Group 2
-7.0
-6.0
-5.0
-4.0
-3.0
-2.0
-1.0
0.0
1.0
2.0
Jan Mar May Jul Sep Nov Jan Mar
2020
Advanced
EME (Group 1)
EME (Group 2)
0.90
0.55
-1.45
2021

13
GLOBAL ECONOMYFinancial conditions and yieldsMarkets
Financial conditions more stimulative in the US. Increase in long term yields, especially in the US and the UK.
*Accumulated change since January 1st, 2021.
Change in 10-year yield* (YTD b.p.)
98
99
100
101
102
103
Jan-20 Mar-20 May-20 Jul-20 Sep-20 Nov-20 Jan-21 Mar-21
US Euro Area UK Japan
GS Financial Conditions Index
Source: Bloomberg
-5
25
55
85
Jan-21 Feb-21 Mar-21 Apr-21
USA UK Germany Japan

14
Inflation expectations
Source: Bloomberg
Implicit inflation (5-years break-even)
GLOBAL ECONOMYMarkets
-1
0
1
2
3
4
Apr-20 Jul-20 Oct-20 Jan-21 Apr-21
USA UK Germany Japan Australia

15
GLOBAL ECONOMYEmerging markets: yield curves Markets
Source: Bloomberg
Rat
e (%
)Va
riat
ion
(b.p
.)
sinc
e Ja
n 20
th
South Africa
Brazil
Colombia
Indonesia
MexicoRussia
Chile
Tenure
Yield curves Slope for 2 x 5 years (b.p.)

Yields and food inflation
Yields and food CPI – Selected countries
Source: Bloomberg
16
GLOBAL ECONOMY
Food CPI
98
102
106
110
114
118
Jul-20 Aug-20 Sep-20 Oct-20 Nov-20 Dec-20 Jan-21 Feb-21
Chile Brasil Mexico Turkey
Russia South Africa Colombia Indonesia
Brazil
Change in 5-year yield (YTD b.p.)
-35
65
165
265
365
465
565
665
-35
65
165
265
365
Jan-21 Jan-21 Mar-21 Apr-21
Brazil Chile Colombia Indonesia
Mexico Russia South Africa Turkey (right)

17
GLOBAL ECONOMYStock marketsMarkets
Source: Bloomberg
Stock markets performance
50
70
90
110
130
150
Feb-20 Mar-20 Apr-20 May-20 Jun-20 Jul-20 Aug-20 Sep-20 Oct-20 Nov-20 Dec-20 Jan-21 Feb-21 Mar-21
S&P Eurostoxx Mexico Chile Colombia Nikkei
Shanghai Indonesia India Russia South Africa Ibovespa
117.22
100.81
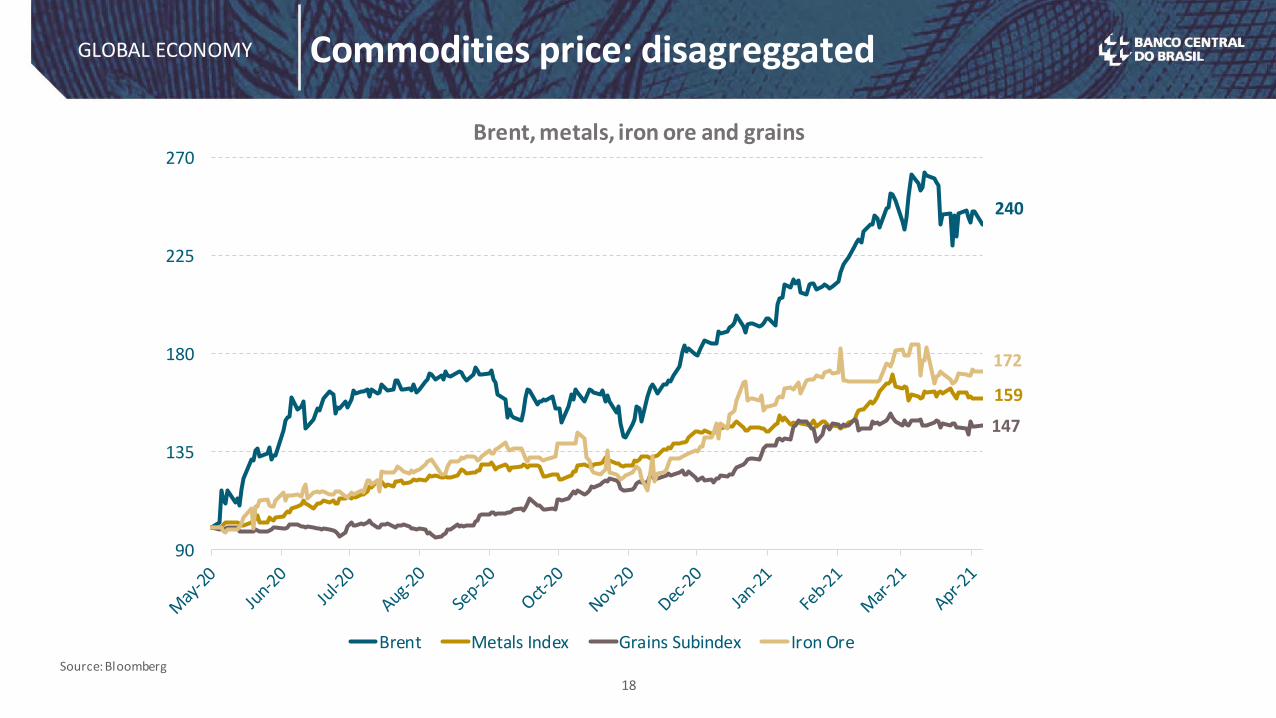
Commodities price: disagreggated
Brent, metals, iron ore and grains
Source: Bloomberg
18
GLOBAL ECONOMY
240
159
147
172
90
135
180
225
270
Brent Metals Index Grains Subindex Iron Ore
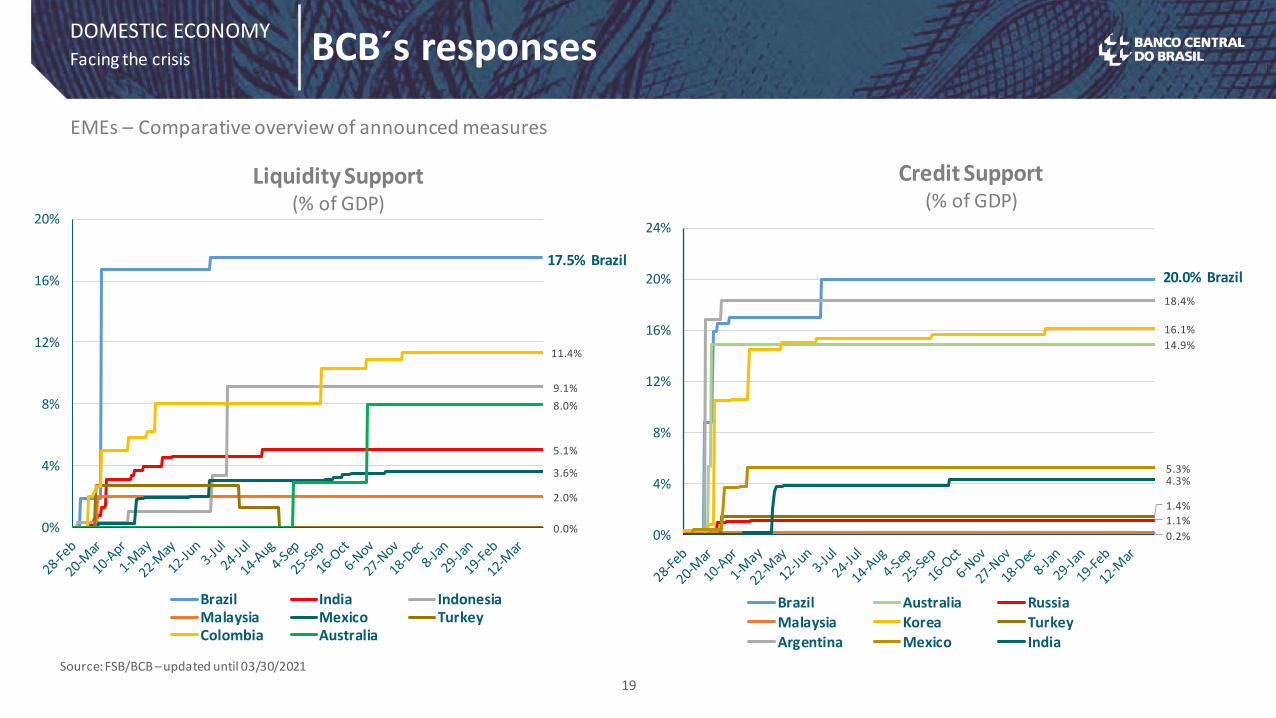
17.5%
5.1%
9.1%
2.0%
3.6%
0.0%
11.4%
8.0%
0%
4%
8%
12%
16%
20%
Brazil India IndonesiaMalaysia Mexico TurkeyColombia Australia
20.0%
14.9%
1.1%
0.2%
16.1%
1.4%
18.4%
5.3%4.3%
0%
4%
8%
12%
16%
20%
24%
Brazil Australia RussiaMalaysia Korea TurkeyArgentina Mexico India
DOMESTIC ECONOMYBCB´s responsesFacing the crisis
EMEs – Comparative overview of announced measures
Source: FSB/BCB – updated until 03/30/2021
Liquidity Support(% of GDP)
Credit Support (% of GDP)
19
20.0% Brazil17.5% Brazil

86
88
90
92
94
96
98
100
102
I II III IV I II III IV I II III IV I II III IV I II III IV I II III IV I II III IV
2014 2015 2016 2017 2018 2019 2020
20
DOMESTIC ECONOMYBrazil: GDPEconomic Growth
Sources: IBGE and Focus Report (Apr 1st, 2021)
Forecast for 2021: +3.17%
(Median of market expectations; Focus report)
GDP(2019=100; s.a.)
2020: -4.1%
21
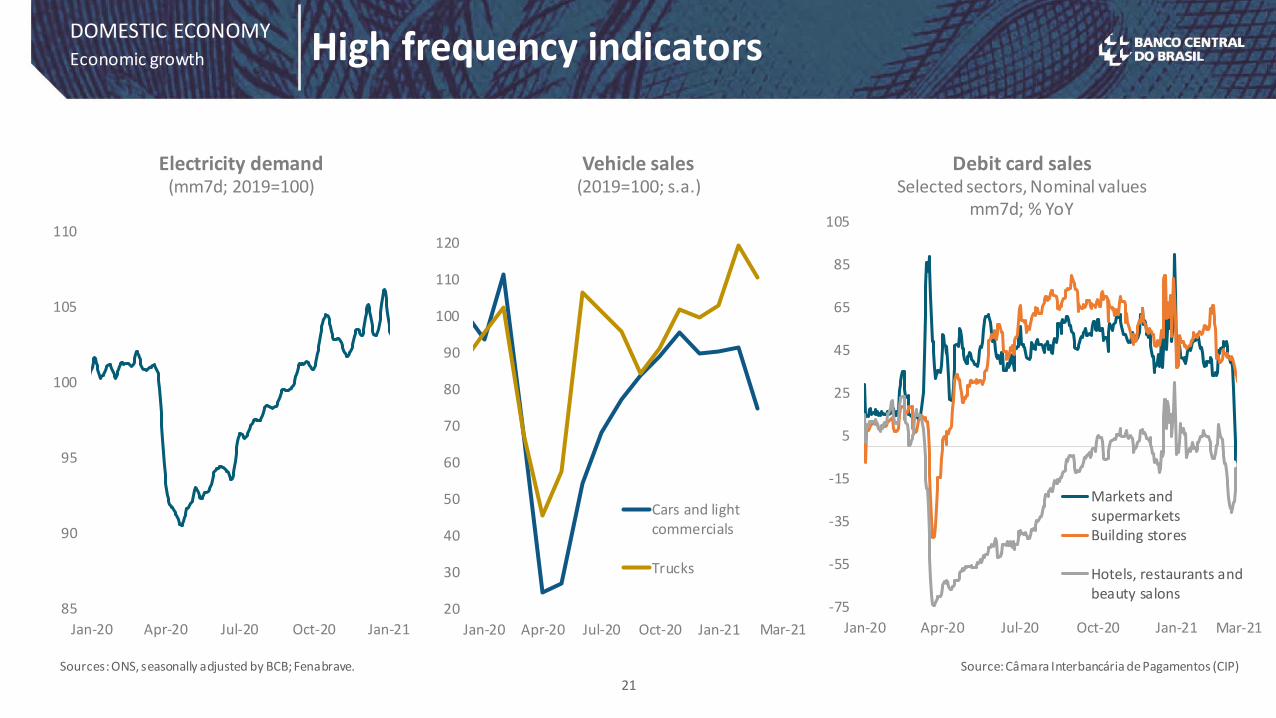
DOMESTIC ECONOMYHigh frequency indicatorsEconomic growth
Sources: ONS, seasonally adjusted by BCB; Fenabrave. Source: Câmara Interbancária de Pagamentos (CIP)
Vehicle sales(2019=100; s.a.)
20
30
40
50
60
70
80
90
100
110
120
Jan-20 Apr-20 Jul-20 Oct-20 Jan-21
Cars and lightcommercials
Trucks
Electricity demand(mm7d; 2019=100)
85
90
95
100
105
110
Jan-20 Apr-20 Jul-20 Oct-20 Jan-21
F -75
-55
-35
-15
5
25
45
65
85
105
Jan-20 Apr-20 Jul-20 Oct-20 Jan-21
Markets andsupermarketsBuilding stores
Hotels, restaurants andbeauty salons
Mar-21 Mar-21
Debit card salesSelected sectors, Nominal values
mm7d; % YoY

DOMESTIC ECONOMYConfidence indicators
Sources: FGV. Seasonally adjusted data.
22
< R$ 2.1 thousand
Business confidence X consumer confidence Consumer confidenceBy income range (in BRL thousand)
55
60
65
70
75
80
85
90
95
100
105
110
115
120
Sep-19 Mar-20 Sep-20 Mar-21
ManufacturingConstruction
Commerce
Services
Average 2018-2019=
100
55
60
65
70
75
80
85
90
95
100
105
110
115
120
Sep-19 Mar-20 Sep-20 Mar-21
Average 2018-2019= 100
> R$ 9.6 thousand
R$ 4.8 to 9.6 thousand
R$ 2.1 to 4.8 thousandConsumer
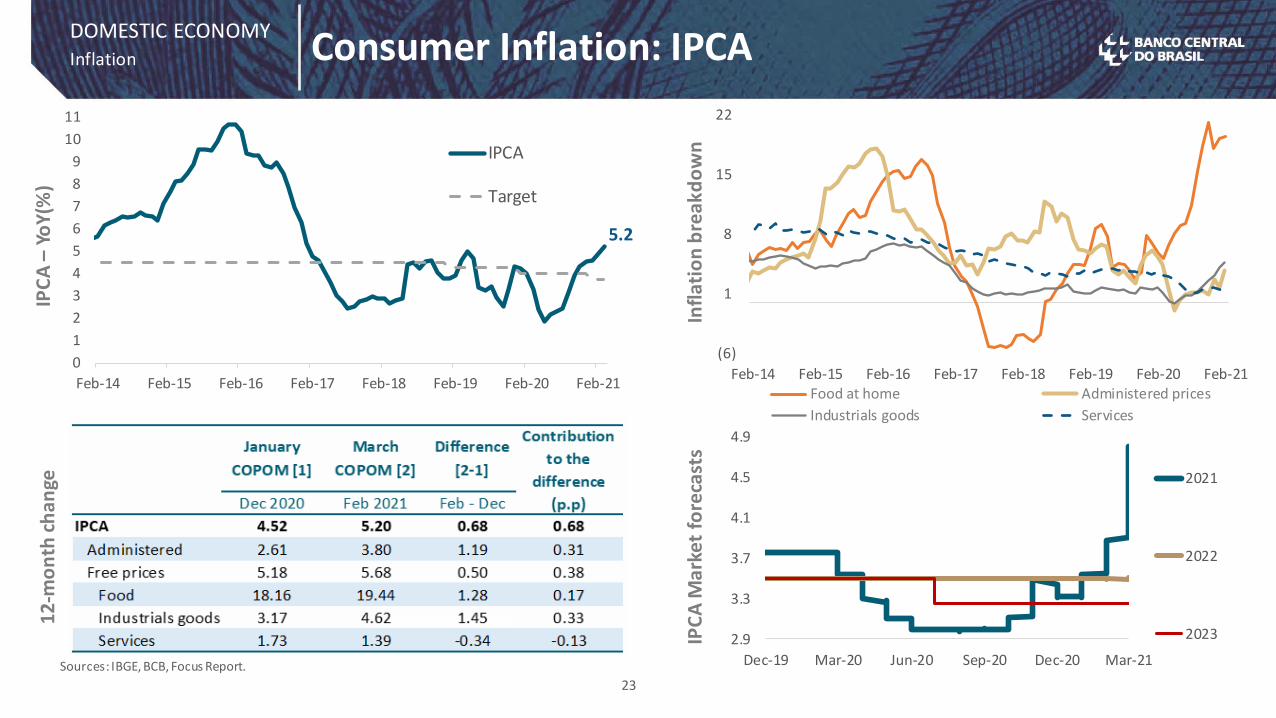
(6)
1
8
15
22
Feb-14 Feb-15 Feb-16 Feb-17 Feb-18 Feb-19 Feb-20 Feb-21Food at home Administered prices
Industrials goods Services
DOMESTIC ECONOMYConsumer Inflation: IPCAInflation
Sources: IBGE, BCB, Focus Report.
23
5.2
0
1
2
3
4
5
6
7
8
9
10
11
Feb-14 Feb-15 Feb-16 Feb-17 Feb-18 Feb-19 Feb-20 Feb-21
IPCA
Target
IPC
A –
YoY
(%)
2.9
3.3
3.7
4.1
4.5
4.9
Dec-19 Mar-20 Jun-20 Sep-20 Dec-20 Mar-21
2021
2022
2023
12-m
on
th c
ha
nge
Infl
ati
on
bre
akd
ow
nIP
CA
Mar
ket
fore
cast
s

24
Implicit inflation
Sources: BCB. Rates estimated from DAP.
Inflation expectations – Brazil
DOMESTIC ECONOMYInflation
3.0%
3.5%
4.0%
4.5%
5.0%
5.5%
6.0%
Break-even 2023 Break-even 2024
2.0%
2.5%
3.0%
3.5%
4.0%
4.5%
5.0%
5.5%
Break-even 2021 Break-even 2022
Implicit Inflation

0%
1%
2%
3%
4%
5%
6%
-100%
-50%
0%
50%
100%
150%
200%
05/0
2/2
0
05/2
3/2
0
06/1
3/2
0
07/0
4/2
0
07/2
5/2
0
08/1
5/2
0
09/0
5/2
0
09/2
6/2
0
10/1
7/2
0
11/0
7/2
0
11/2
8/2
0
12/1
9/2
0
01/0
9/2
1
01/3
0/2
1
02/2
0/2
1
03/1
3/2
1
100%
70%
40%
10%
-20%
-50%
25
Implicit inflation and commodities
Source: Bloomberg.
DOMESTIC ECONOMY
CRB Food and WTI vs. implicit inflation 12 months ahead
WTI (BRL) _% change (y/y) CRB Food (BRL)_% change (y/y) Implicit inflation (right)
Bre
ak-e
ven
infl
atio
n –
12 m
on
ths
ahe
ad (
% y
/y)
CR
B F
oo
d (
BR
L) %
ch
ange
(y/
y)
WTI
(B
RL)
% c
han
ge (
y/y)

30
32
34
36
38
40
Feb-17 Aug-17 Feb-18 Aug-18 Feb-19 Aug-19 Feb-20 Aug-20 Feb-21
Caged PNADC-CC
11.4
14.2
61.9
56.9
54
55
56
57
58
59
60
61
62
63
64
10.0
10.5
11.0
11.5
12.0
12.5
13.0
13.5
14.0
14.5
15.0
jan-17 jul-17 jan-18 jul-18 jan-19 jul-19 jan-20 jul-20 jan-21
Unemployment rate
Participation rate (right axis)
DOMESTIC ECONOMYLabor market: formal vs informalLabor market
Source: IBGE (PNAC-C mensalizada). Data is seasonally adjusted by BCB. Source: Ministry of Economy (CAGED). Data is seasonally adjusted by BCB.
26
-135
-75
-15
45
105
Feb-18 Aug-18 Feb-19 Aug-19 Feb-20 Aug-20 Feb-21
Manufacturing
Building
Commerce
Accommodation and maintenance
Unemployment and participation rate (%)
Net formal job creation by sector(3-month-moving average, in thousands of jobs)
Formal Jobs – Caged vs PnadC(millions of workers)
DOMESTIC ECONOMY
27
• In its 237th meeting, the Copom unanimously decided to increase the Selic rate to 2.75%p.a.
• The Committee judges that this decision reflects its baseline scenario for prospective inflation, a higher-than-usual variance in the balance of risks, and it is consistent with convergence of inflation to its target over therelevant horizon for monetary policy, which includes 2021 and, mainly, 2022.
• The Copom members consider that the current conditions ceased to prescribe an extraordinary stimulus.
• Therefore, the Copom decided to start a process of partial normalization by reducing the extraordinarydegree of monetary stimulus. For all the aforementioned reasons, the Committee considered appropriate anadjustment of 0.75 p.p. in the Selic rate. In the Committee's evaluation, a swifter adjustment has the benefitof reducing the probability of not meeting the inflation target in 2021, as well as of keeping longer horizonexpectations well anchored. Additionally, the broad set of information available to the Committee suggeststhat this strategy is consistent with meeting the 2022 inflation target, even if social distancing increasestemporarily.
• For the next meeting, unless there is a significant change in inflation projections or in the balance of risks,the Committee foresees the continuation of the partial normalization process with another adjustment, ofthe same magnitude, in the degree of monetary stimulus.
Monetary policy
237th Copom meeting – March 2021

Sources: B3, Anbima, Demab.
28
LFT
DOMESTIC ECONOMYFiscal riskFiscal policy
Risk premia in government bonds
LTN
-5
0
5
10
15
20
25
30
35
40
Bas
e p
oin
ts
Jul-21 Oct-21 Oct-22 Jul-23 Jan-24
0
5
10
15
20
25
30
35
40
45
Bas
e po
ints
Sep-21 Mar-22 Mar-23 Mar-24 Mar-25 Mar-26

DOMESTIC ECONOMY
29
Debt and nonresident participationFiscal policy
Federal Domestic Public Debt
Sources: B3, BCB.
0
50
100
150
200
250
300
350
400
450
500
550
0%
2%
4%
6%
8%
10%
12%
14%
16%
18%
20%
22%
R$
bill
ion
% o
f FD
PD
FDPD
NTN-F LTN NTN-B LFT Non resident participants

DOMESTIC ECONOMY
30
Govnt. bonds: cost and maturity structureFiscal policy
Sources: B3, BCB.
Issuance cost - FDPDMaturity structure
Feb
-11
Aug
-11
Feb-
12
Aug
-12
Feb
-13
Aug
-13
Feb
-14
Aug
-14
Feb-
15
Aug
-15
Feb
-16
Aug
-16
Feb
-17
Aug
-17
Feb-
18
Aug
-18
Feb
-19
Aug
-19
Feb-
20
Aug
-20
Feb
-21
14%
17%
20%
23%
26%
29%
32%
35%
% maturity in 12 months % maturity over 5 years
Feb
-11
Aug
-11
Feb
-12
Aug
-12
Feb
-13
Aug
-13
Feb
-14
Aug
-14
Feb
-15
Aug
-15
Feb
-16
Aug
-16
Feb
-17
Aug
-17
Feb
-18
Aug
-18
Feb
-19
Aug
-19
Feb
-20
Aug
-20
Feb
-21
4
6
8
10
12
14
16
Ra
tes
% p
.y.
Issue Cost FDPD in 12 months
Average Cost FDPD acc. 12 months
26.8%
18.6%

31
DOMESTIC ECONOMYStock marketsMarkets
Source: B3
Accumulated flows into the stock market
-100
-80
-60
-40
-20
0
20
40
60
80
100
Jan-20 Mar-20 May-20 Jul-20 Sep-20 Nov-20 Jan-21 Mar-21
Individuals Institutionals Foreigners
BRL billions
BRL -18.4 bi
BRL -31.5 bi
BRL +67.1 bi

62%
47%
53%
31%
43%40%
51%58%
38%
27%29%
0%
10%
20%
30%
40%
50%
60%
70%
80%
2010 2011 2012 2013 2014 2015 2016 2017 2018 2019 2020 2021 2022
IPO/Follow-on - Foreign Investors’ share
32
DOMESTIC ECONOMYStock marketsMarkets
Source: B3, Anbima

33
DOMESTIC ECONOMYForeign exchange derivativesMarkets
Source: B3
Investors’ position change in foreign exchange derivatives at B3
-45
-35
-25
-15
-5
5
15
25
35
45
Mar-20 Jun-20 Sep-20 Dec-20 Mar-21
Institucionals Non-residents Banks Central Bank
USD Bln

External sector
34
Current account12 month accumulated, % of GDP
-6.0%
-5.0%
-4.0%
-3.0%
-2.0%
-1.0%
0.0%
1.0%
2.0%
3.0%
4.0%
Feb-08 Feb-10 Feb-12 Feb-14 Feb-16 Feb-18 Feb-20
Trade balance Services Income Current account
DOMESTIC ECONOMY
Fonte: BCB, Bloomberg.
Effective foreign exchange rate and terms of trade
-15
-10
-5
0
5
10
15
200
1
2
3
4
5
Mar-07 Mar-09 Mar-11 Mar-13 Mar-15 Mar-17 Mar-19 Mar-21

20%
12%
25%
0%
5%
10%
15%
20%
25%
30%
35%
40%
45%
Feb-17 Feb-18 Feb-19 Feb-20 Feb-21
Cen
ten
as35
16.1%
22.9%
11.3%
-11%
-6%
-1%
4%
9%
14%
19%
24%
Feb-17 Feb-18 Feb-19 Feb-20 Feb-21
DOMESTIC ECONOMYCredit in the National Financial SystemCredit Market
Credit increase amid the crisis. Interest rates at historically low levels.
Source: BCB
Households Corporate Total
Interest rates(% per year)
Outstanding credit(YoY)

TechnologyAgenda
36

37
INCLUSION
COMPETITIVENESS
TRANSPARENCY
EDUCATION
InnovationMarket efficiencyInternational reserves
Rural creditHousing creditRelationship with CongressTransparency of Monetary PolicyCommunication plan for BCB actionsRelationship with foreign investors
Financial education
Cooperative creditMicrocreditCurrency convertibilityInitiatives for capital market
SUSTAINABILITYBCB’s S&E responsibilityRegulationSupervisionPartnerships
Random key, 50.5
Phone, 40.1
Companie's ID number,
3.8
Individual's ID number (CPF);
60.6
E-mail, 26.9
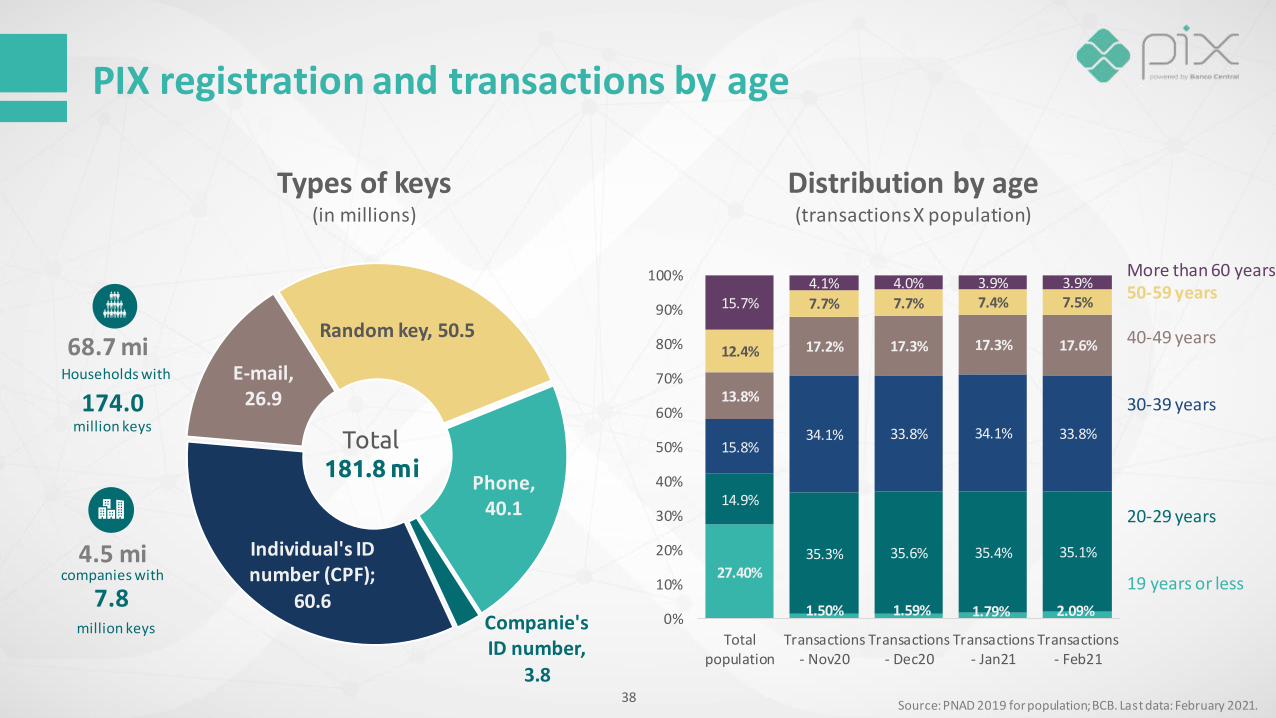
PIX registration and transactions by age
38Source: PNAD 2019 for population; BCB. Last data: February 2021.
Households with
million keysTotal
181.8 mi
Types of keys(in millions)
Distribution by age(transactions X population)
27.40%
1.50% 1.59% 1.79% 2.09%
14.9%
35.3% 35.6% 35.4% 35.1%
15.8%34.1% 33.8% 34.1% 33.8%
13.8%
17.2% 17.3% 17.3% 17.6%12.4%
7.7% 7.7% 7.4% 7.5%15.7%4.1% 4.0% 3.9% 3.9%
0%
10%
20%
30%
40%
50%
60%
70%
80%
90%
100%
Totalpopulation
Transactions- Nov20
Transactions- Dec20
Transactions- Jan21
Transactions- Feb21
68.7 mi
174.0
4.5 mi
7.8companies with
million keys
More than 60 years50-59 years
40-49 years
30-39 years
20-29 years
19 years or less

33.5 mi 144.5 mi 200.3 275.3
R$29.6 bi
R$121.5 bi
R$160.1
R$197.7
0.0
20.0
40.0
60.0
80.0
100.0
120.0
140.0
160.0
180.0
200.0
220.0
- 10.0 20.0 30.0 40.0 50.0 60.0 70.0 80.0 90.0
100.0 110.0 120.0 130.0 140.0 150.0 160.0 170.0 180.0 190.0 200.0 210.0 220.0 230.0 240.0 250.0 260.0 270.0 280.0 290.0
nov-20 dez-20 jan-21 fev-21
Number of transactions (millions) Volume (R$ billions)
Pix transactions
39Fonte: BCB.
PIX average value
Pix versus other instruments(in million of transactions and% of total)
R$ 778.4 /PIX
Number of transactions and volume(in million of transactions and BRL billions)
(19%)
(60%)
(21%)33.5 (22.2%)
144.5 (41.2%)
200.3 (59.4%)
275.3 (71%)
95.1 (63%)
189.3 (54%) 122.7 (36.4%)
104.5 (27%)
22.4 (14.8%)
16.8 (4.8%) 14.5 (4.3%)
7.8 (2%)
-
49
98
147
196
245
294
343
392
16 - 30Nov20
Dec20 Jan21 Feb21
Pix TED DOC
How does it work today?
Open banking
40
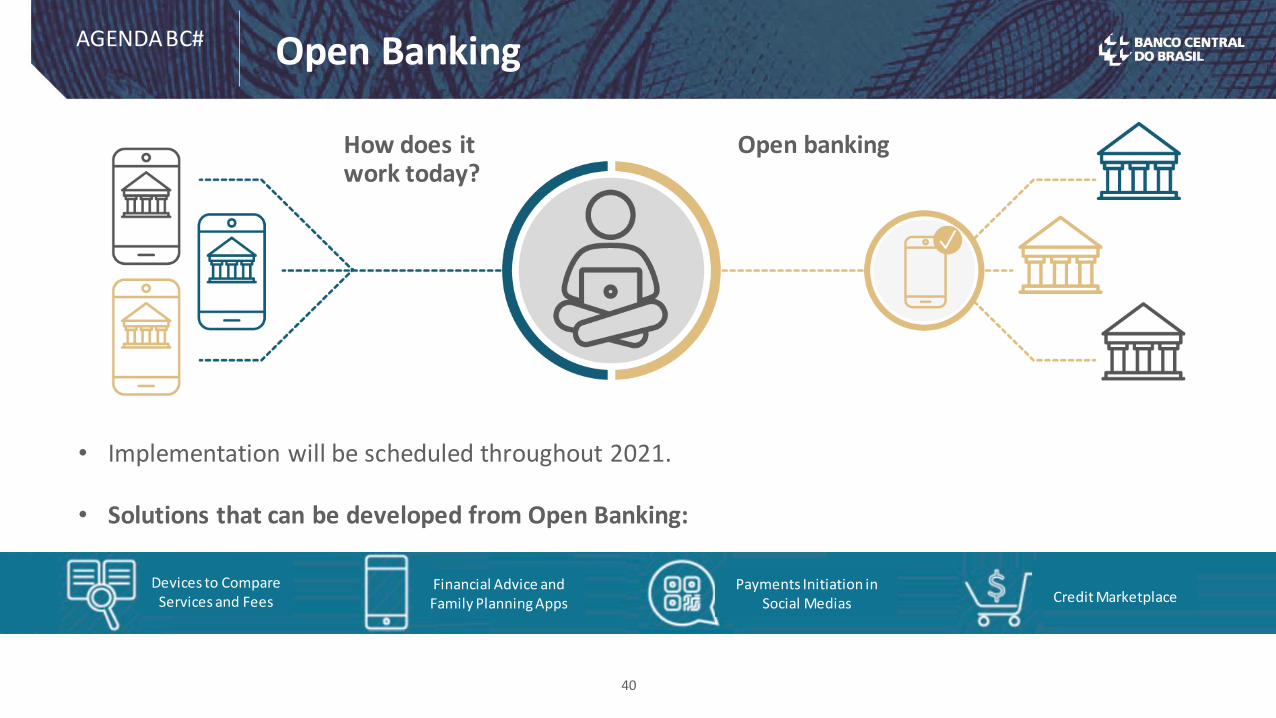
Open BankingAGENDA BC#
Devices to Compare Services and Fees
Financial Advice and Family Planning Apps
Payments Initiation in Social Medias Credit Marketplace
• Implementation will be scheduled throughout 2021.
• Solutions that can be developed from Open Banking:

41
Regulatory SandboxAGENDA BC#
BCB’s Regulatory Sandbox starts in 2021 with the Cycle 1.
During the sandbox licensing process, BCB will assess whether the submitted projects comply with the definition of innovative project and whether their development is under the regulatory scope of BCB and CMN, among other criteria.
Legal persons, notary and registration service providers, public companies, and semi-public companies can participate, even when not yet fully licensed by BCB.
Simplified monitoring procedures will be adopted, considering the complexity and risks associated to each innovative project and, should BCB deems appropriate, additional limits and criteria may be applied.
By the end of cycle 1, participants may obtain a permanent license from BCB to operate. The projects may be a stepping stone for the improvement of the regulation issued by BCB and CMN.
TO UNDERSTAND THE REGULATORY SANDBOX

42
Text
Payments
Content
Financial Innovation
Intensive use of clouding
ConvergenceAGENDA BC#

43
Digital currencyOpen Banking
• Simplification• Internationalization• Convertibility
Innovation in the currency
2021/2022
Innovation in the financial systemAGENDA BC#

Measures:
• BCB’s S&E Responsibility
• Partnerships
• Policies
• Supervision
• Regulation
Sustainability

Common factors in recoveryMore sustainable and more inclusive growth
More technologyThe epidemic has accelerated technological change
in medicine, education, finance, communication
Low interest rates and high liquidity in the world
There are challenges, but also opportunities to reinvent the economy with private resources
Changes in global value chains
World trade
Vision for the future
Impact of possible reflation global conditions on EMEs

Thank you!
Roberto Campos NetoGovernor of Banco Central do Brasil
April 09, 2021