xu, x., wisnom, m., & hallett, s. (2014). predicting the...
TRANSCRIPT

Xu, X., Wisnom, M., & Hallett, S. (2014). Predicting the notched strength oflarge quasiisotropic composite laminates based on small specimen tests.Paper presented at 16th European Conference on Composite Materials,ECCM 2014, Seville, Spain.
Peer reviewed version
Link to publication record in Explore Bristol ResearchPDF-document
University of Bristol - Explore Bristol ResearchGeneral rights
This document is made available in accordance with publisher policies. Please cite only the publishedversion using the reference above. Full terms of use are available:http://www.bristol.ac.uk/pure/about/ebr-terms
ECCM16 - 16TH EUROPEAN CONFERENCE ON COMPOSITE MATERIALS, Seville, Spain, 22-26 June 2014
1
PREDICTING THE NOTCHED STRENGTH OF LARGE QUASI-ISOTROPIC COMPOSITE LAMINATES BASED ON SMALL
SPECIMEN TESTS
X. Xua*, M. R. Wisnoma, S. R. Halletta
aAdvanced Composites Centre for Innovation & Science (ACCIS), University of Bristol, University Walk, Bristol BS8 1TR, UK *[email protected]
Keywords: notch; strength; composite laminates; scaling
Abstract An investigation into the size effects in notched quasi-isotropic carbon/epoxy laminates is carried out. Two scaling laws are used to predict the notched tensile strength. Specifically, a Linear Elastic Fracture Mechanics (LEFM) approach based on Dugdale’s plastic zone model originally for metallic materials is applied to predict the tensile strength of the large composite laminates with sharp notches. A method based on Weibull statistics is used to predict the tensile strength of the large composite laminates with circular holes. These two scaling lines are drawn independently from the experimental notched tensile strengths. A good agreement between the predicted and experimental results of the large notched composite laminates is achieved. 1. Introduction Composite laminates have been widely used in the construction of large structures. The test pyramids for large composite structures include a large amount of small specimen tests to determine the material properties such as notched tensile strength. It is crucial to understand the relation between the notched tensile strength of large composites and that of the small specimens. This involves the study of size effects. A size effect can be defined as the change in strength with specimen dimensions [1]. The present paper focuses on the scaling laws behind the sizes effects in large notched quasi-isotropic composite laminates. The magnitudes of the two scaling effects for sharp and blunt notches are studied respectively. Previously, the size effects in notched quasi-isotropic carbon/epoxy laminates were investigated experimentally [2]. The in-plane dimensions of the [45/90/-45/0]4s laminates were scaled by up to a factor of 16. The damage at the crack tips in the different specimen sizes was studied through interrupted tests and X-ray Computed Tomography (CT) scanning. Specimens with sharp and blunt notches (circular holes) were compared. A similar strength reduction scaling trend was shown for both types of notched laminates at small sizes. As the sizes increase, there is a cross-over point with results approaching different asymptotes. It was found that only when the specimens with different notches are big enough, are they asymptotic to either a fracture mechanics scaling line for sharp notches or a Weibull strength
ECCM16 - 16TH EUROPEAN CONFERENCE ON COMPOSITE MATERIALS, Seville, Spain, 22-26 June 2014
2
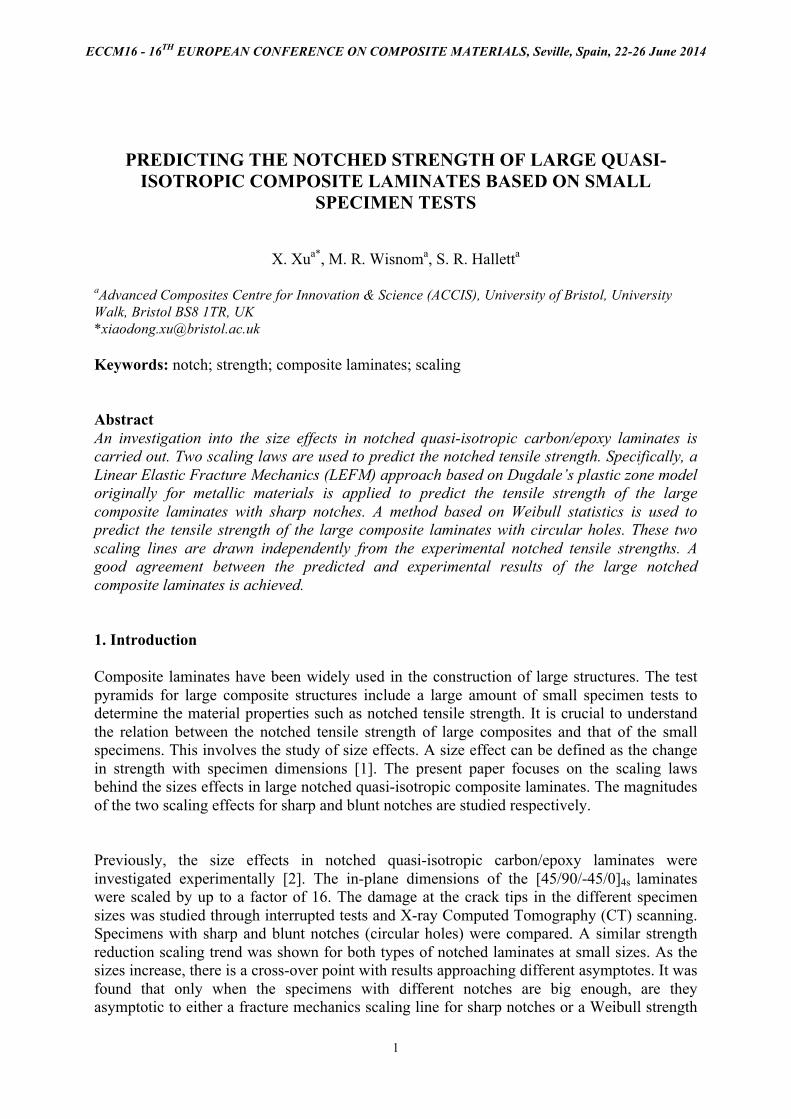
scaling line for circular holes. The implication was that when assessing the notched strength of quasi-isotropic composite structures experimentally, the specimens need to be sufficiently big (at least 25.4 mm notch size for IM7/8552 composite laminates) to get accurate predictions of the scaling behavior at even larger sizes. However, when the data available are more limited, can we still predict the notched tensile strength of large composite laminates based on small coupon tests? To answer the above question, an investigation which focuses on the two scaling laws is carried out. In the present paper, a Linear Elastic Fracture Mechanics (LEFM) approach based on the Dugdale plastic zone model [3] originally developed for metallic materials is applied to the strength scaling of the composite laminates with sharp notches. Once a fully developed damage zone is measured, for example in interrupted tests on centre-notched tests, the tensile strength of large composite laminates with sharp notches can be predicted. A method based on Weibull statistics [4] accounts for the strength scaling of the composite laminates with circular holes where there is no stress singularity. The relation between the equivalent tensile strength of the highly stressed material in the small open-hole specimen and the tensile strength of the large specimen is shown. Once the unnotched tensile strength and the Weibull modulus are determined from unnotched tests of the same material, the tensile strength of the large composite laminates with blunt notches can be predicted. The above two scaling lines are drawn independently from the tensile strengths in the scaled notched tests. A good agreement between predicted strength and the experimental results is achieved, confirming that the proposed methods are applicable. 2. Test setup In-plane dimensions of the specimens are scaled up by up to a factor of 16 as shown in Figure 1 and Table 1. The biggest centre-notched specimens with C = 50.8 mm notch length are referred to as the short variant, as only the width and notch length of the specimen are scaled up, while the gauge length of the specimen is kept the same as the one-size-smaller specimen.
Figure 1. Photos of the in-plane scaled centre-notched specimens [2].

ECCM16 - 16TH EUROPEAN CONFERENCE ON COMPOSITE MATERIALS, Seville, Spain, 22-26 June 2014
3
Specimens Notch length Gauge width Gauge length End tab length
Baseline 3.2 15.9 63.5 50.0 Scale 2 6.4 31.8 127.0 50.0 Scale 4 12.7 63.5 254.0 50.0 Scale 8 25.4 127.0 508.0 100.0
Scale 16 50.8 254.0 508.0 100.0
Table 1. Dimensions of the in-plane scaled centre-notched specimens [mm] [2].
The material used in these tests is Hexcel HexPly® IM7/8552 carbon-epoxy pre-preg with a nominal ply thickness of 0.125 mm. The stacking sequence is quasi-isotropic [45/90/-45/0]4s for all the sizes. The nominal overall thickness is 4 mm, which is very close to the actual thickness. The centre-notches were firstly cut with a 1mm end mill on a computer numerical controlled milling machine. Then the centre-notches were extended to form a sharp crack manually by using 0.25 mm-wide piercing saw blades. Both the length of the initial machined centre-notches and the length of the final extended centre-notches were kept proportional to the specimen widths, but the notch radii were the same. Instron hydraulic-driven test machines were used to test the specimens under displacement control. Loading rates were scaled with regards to the specimen widths, with a loading rate of 0.25 mm/minute for the baseline specimens. Interrupted tests in which the tests were stopped at 95% of the failure load for each sized specimen were carried out. The specimen of each size from the interrupted tests was examined by CT scanning to study the damage at the crack tips. The samples from the interrupted tests were soaked in a bath of zinc iodide penetrant for 3 days. A Nikon XTH225ST CT scanner was used. It has a 1 micron focal spot size and 225 kV, 225 W microfocus X-ray source. Most of the open-hole results which were used to compare with the centre-notched results were from Green et al. [5]. The only set of open-hole specimens tested in the present paper was the biggest short variant because the data were not available in the above reference. The overall dimensions were kept the same with the hole diameter being equal to the sharp notch length of the short variant (C = 50.8 mm). The unnotched test results which were used to predict the tensile strength of the large open-hole specimens were from Wisnom et al. [6]. 3. Experimental results From typical load vs. cross-head displacement curves, the response is fairly linear. Small load drops due to sub-critical damage could be observed in some tests, but they were not obvious. The final failure was catastrophic in all the tests. The highest load level is taken as the failure load from which the average nominal failure stress is calculated using the measured full widths and the nominal thicknesses of the specimens. The centre-notched and open-hole test results are shown in Table 2.

ECCM16 - 16TH EUROPEAN CONFERENCE ON COMPOSITE MATERIALS, Seville, Spain, 22-26 June 2014
4
Notch
length [mm]
Centre-notched tests Open-hole tests
Specimens Strength [MPa] (C.V., %)
Number of specimens
Strength [MPa] (C.V., %)
Number of specimens
Baseline 3.2 582 (3.9) 5 478 (3.1) [5] 6 Scale 2 6.4 519 (2.0) 5 433 (2.0) [5] 6 Scale 4 12.7 456 (0.9) 5 374 (1.0) [5] 6 Scale 8 25.4 349 (2.7) 4 331 (3.0) [5] 6
Scale 16 50.8 261 (2.9) 3 323 (3.7) 3
Table 2. Notched tensile test results [2].
4. Analysis 4.1. Fracture mechanics scaling law An important issue is the determination of the size of the damage zone. The damage zone is defined as the region ahead of the notch tips in which the fibres break in all of the 0 degree plies before unstable failure. When all of the ± 45 degree plies except for the surface plies are also broken, the damage zone is fully developed. Its size can be measured through CT images by averaging the distances between the last split and the crack tip in the broken 0 degree plies. From the baseline specimen to the Scale 4 specimen, the sizes of the damage zones measured at 95% of the failure load scale with the specimen sizes, as the damage zones are still developing. When the specimen sizes are bigger, the measured damage zones grow with specimen size more slowly towards a constant value. This is accompanied by the breakage of ± 45 degree plies. For example, the direct measurement of the damage zone sizes from CT images of 0 degree plies in the Scale 4 centre-notched specimen yields the damage zone size, rd_Scale4 = 2.16 mm. The CT images show all of the 0 degree plies are broken, and the ± 45 degree plies are not broken. In contrast, in the Scale 8 centre-notched specimen, the size of the damage zone is rd_Scale8 = 2.28 mm. The CT images show all of the 0 degree plies are broken, and some of the ± 45 degree plies are also broken. The damage zone is approaching its full size. Therefore, rd_Scale8 is chosen to calculate the fracture energy, because it is closer to the size of a fully developed damage zone, which can represent the intrinsic property of the material. By examining the scaled quasi-isotropic centre-notched specimens after interrupted tests, the damage zone behaves similarly to the plastic zone in notched metallic materials. According to the Dugdale plastic zone model [3] for metallic materials, a similar relation between the size of the damage zone and the Mode I fracture toughness for centre-notched composite laminates with small-scale damage can be represented by Equation 1. So the nominal tensile strength σn of the large centre-notched specimens can be predicted by Equation 2 [7].
2
u
Cd )(
8 σπ Kr = (1)
2
)(nCCfK π
λσ= (2)

ECCM16 - 16TH EUROPEAN CONFERENCE ON COMPOSITE MATERIALS, Seville, Spain, 22-26 June 2014
5
EKG
2C
C = (3)
where rd = 2.28 mm is the size of the damage zone from the Scale 8 specimen, KC is the Mode I fracture toughness, σu = 929 MPa is the unnotched strength of 120 mm × 32 mm × 4 mm quasi-isotropic specimens of the same material and stacking sequence [6], σn is the nominal tensile strength of the centre-notched laminate, πλλ sec)( =f = 1.025 is a geometric parameter to account for the effect of finite width [7], C is the notch length, W is the specimen
width, WC2
=λ = 0.1, GC is the fracture energy and E = 61.6 GPa is the Young’s modulus.
According to Equations 1 and 3, the fracture energy GC = 81.4 kJ/m2. This fracture energy value is used to draw the fracture mechanics scaling line in Figure 2. The C.V. in the notched tests is very low, 1%-4%, and so error bars have not been shown in Figure 2. The fracture mechanics scaling line is not drawn through the data point representing the tensile strength of the Scale 8 specimen, but is independent of the experimental notched tensile strength. Only the damage zone size and unnotched strength are taken from the tests.
Figure 2. Fracture mechanics scaling line.
As shown in Figure 2, the calculated fracture energy can predict the tensile strength of the Scale 8 specimen very well. Furthermore, it can also predict the tensile strength of the larger Scale 16 specimen well, which is not related to the above fracture energy calculation in any way. In fact, because not all of the ± 45 degree plies are broken in the Scale 8 specimen, the damage zone may develop to a larger size in the larger specimen. This may explain the slightly higher tensile strength of the Scale 16 specimen than the predicted value. However, the fracture energy calculated according to the size of the damage zone from the Scale 8 specimen still yields a conservative solution for the larger specimen. 4.2. Strength limit scaling law Larger composite structures are more likely to have bigger defects, leading to lower strength. The weakest link model and Weibull distribution [4] is often used to study this factor in size effects. Wisnom [1] applied a two-parameter Weibull distribution, in which the probability of survival, P(s), of a volume V subject to a stress ơ is: ])/(exp[)( 0
mVsP σσ−= (4)

ECCM16 - 16TH EUROPEAN CONFERENCE ON COMPOSITE MATERIALS, Seville, Spain, 22-26 June 2014
6
where, ơ0 is the characteristic strength of material, and m is the Weibull modulus. The strength scaling in the open-hole specimens is different from the specimens with sharp notches because there is no stress singularity and so it is controlled by defects. The failure of the unnotched specimens is controlled by the interaction of defects distributed along the edges with the free edge effect [6], and the failure of the open-hole specimen is mainly controlled by the same defects distributed along the hole edge where there is the stress concentration. As the size of the specimen scales up, the amount of highly stressed material scales up with it. As a result, the tensile strength of the scaled up open-hole specimen will decrease according to the Weibull strength scaling theory. According to Equation 4, by assuming equal probability of survival between the unnotched specimens with uniform stress [6] and the baseline open-hole specimen with the stress concentration, we have Equation 5: (5) where, ơu = 929 MPa is the tensile strength of the unnotched 120 mm × 32 mm × 4 mm specimen and Vu is the total volume of the zone at the free edges of the unnotched specimen which contributes to its failure, m = 41 is the Weibull modulus [6], σx represents the loading direction stress distribution within the zone along the hole edge contributing to the failure of the baseline 64 mm × 16 mm × 4 mm open-hole specimen which has an overall volume of V. The width of the zone contributing to the failure can be assumed constant, w, and the thickness is also constant, t. Since Vu = Lu × w × t and dv = dl × w × t, w and t can be cancelled out on both sides of Equation 5 which can therefore be degenerated to Equation 6. (6) where, Lu = 240 mm is the total length of free edges in the unnotched specimen, and L is the overall length of the hole edge in the baseline open-hole specimen. An implicit linear elastic FE analysis using shell elements in MSC PATRAN/NASTRAN software is carried out to determine the loading direction stress distribution σx in the baseline open-hole specimen. A quarter of the baseline open-hole specimen is modeled with the minimum mesh size of about 0.02 mm as shown in Figure 3. The gross section stress σf is applied in the X direction to one end of the model. Symmetrical boundary conditions are applied at the symmetry planes in the X and Y directions. The shell elements have homogenized isotropic material properties as shown in Table 3.
])/(exp[])/(exp[ 00uu ∫ −=−L
mx
m dlL σσσσ
])/(exp[])/(exp[ 00uu ∫ −=−V
mx
m dvV σσσσ

ECCM16 - 16TH EUROPEAN CONFERENCE ON COMPOSITE MATERIALS, Seville, Spain, 22-26 June 2014
7
Figure 3. Quarter FE model using shell elements.
E [GPa] G [GPa] υ
61.6 23.4 0.32
Table 3. Material properties for shell elements The contours in Figure 4 show the nodal stress distribution in the loading direction and an enlarged view of the stress concentration factors at the edges of the elements near the hole edge. Also illustrated in Figure 4 is the maximum stress concentration factor of 3.23, within 3%, of the theoretical stress concentration factor of 3.13.
Figure 4. Stress concentration factors at the hole edge
The failure criterion based on Weibull strength scaling theory has been used to predict fibre failure in FE analysis. Starting from Equation 6, the right hand integral can be replaced by a summation over the elements of the FE model to give Equation 7:
(7)
where, ki is average stress concentration factor at the edge of the element i, li is the length of the element i in the loading direction, and σf is the gross section applied stress at failure.
When Equation 7 is satisfied, i.e. the point of fibre failure has been reached, the stress distribution in the baseline open-hole FE model can be determined. The nominal failure stress of the baseline open-hole model is σf = 340 MPa. In Figure 5, the Weibull strength scaling line
])/(exp[])/(exp[Edge Holeat Elements ofNumber Total
100uu ∑
=
−=−i
mfii
m klL σσσσ
ECCM16 - 16TH EUROPEAN CONFERENCE ON COMPOSITE MATERIALS, Seville, Spain, 22-26 June 2014
8
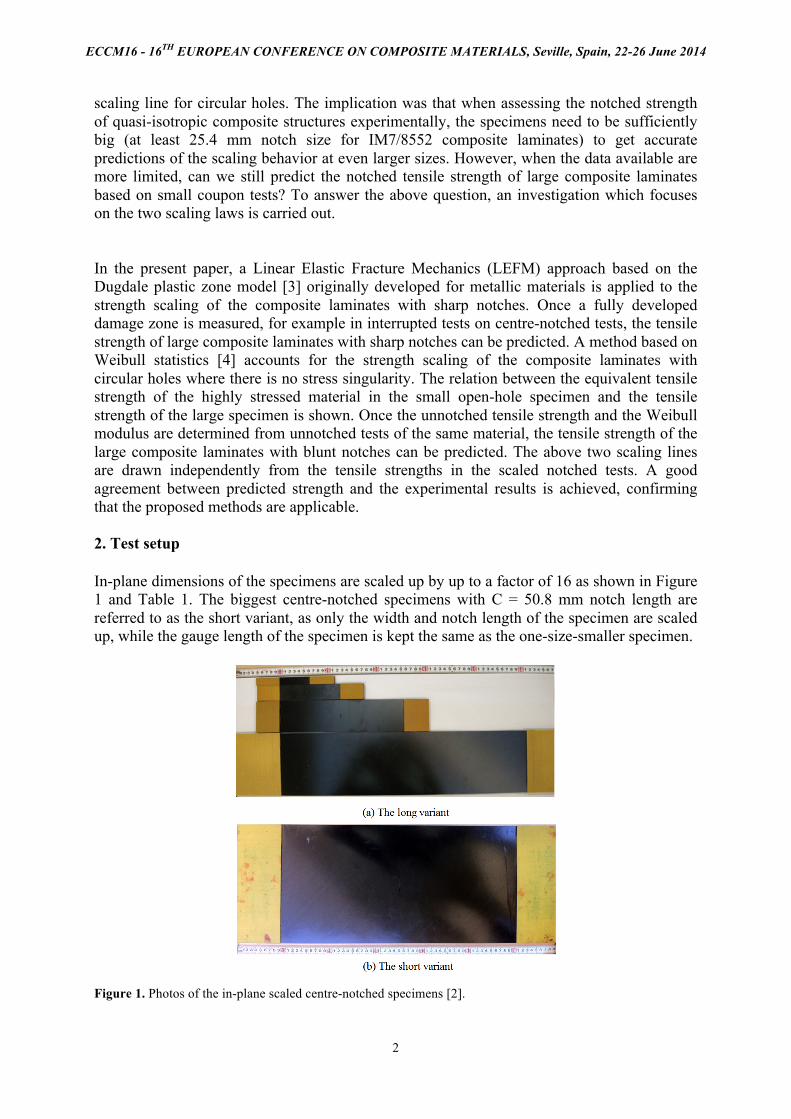
is drawn by using the baseline open-hole tensile strength σf, with its slope determined by the Weibull strength scaling theory and the Weibull modulus m = 41. The C.V. in the notched tests is very low, 1%-4%, and so error bars have not been shown in Figure 5. The Weibull strength scaling line is not drawn through any of the data points from the scaled open-hole tests, i.e. it is independent of the experimental open-hole tensile strength.
Figure 5. Weibull strength scaling line. As shown in Figure 5, the tensile strength of the large open-hole specimens can be quite well predicted by the Weibull strength scaling line.
5. Conclusions
In order to predict the notched tensile strength of large quasi-isotropic composite laminates, the scaling laws behind the problem must be understood. In the present study there is a cross-over point for the two scaling lines when the sizes of the notched IM7/8552 carbon-epoxy [45/90/-45/0]4s specimens increase. The centre-notched strengths are approaching an asymptote based on LEFM, and the open-hole strengths are approaching an asymptote based on Weibull strength scaling theory. Based on the knowledge of the size effects, the tensile strengths of the large quasi-isotropic composite laminates with sharp and blunt notches can be predicted respectively according to two different scaling laws. These scaling laws are determined independently from the notched tensile strengths from the scaled tests, and they yield good predictions which are validated by the experimental results. References [1] M. R. Wisnom. Size effects in the testing of fibre-composite materials, Composites Science and Technology, volume(59): 1937-1957, 1999. [2] X. Xu, M. R. Wisnom, Y. Mahadik, and S. R. Hallett. An experimental investigation into size effects in quasi-isotropic carbon/epoxy laminates with sharp and blunt notches, submitted, 2013. [3] D. S. Dugdale. Yielding of steel sheets containing slits, Journal of the Mechanics and Physics of Solids, volume(8): 100-104, 1960. [4] W. Weibull. A statistical distribution function of wide applicability, Journal of Applied Mechanics, volume(18): 293-297, 1951.

ECCM16 - 16TH EUROPEAN CONFERENCE ON COMPOSITE MATERIALS, Seville, Spain, 22-26 June 2014
9
[5] B. G. Green, M. R. Wisnom, and S. R. Hallett. An experimental investigation into the tensile strength scaling of notched composites, Composites Part A: Applied Science and Manufacturing, volume(38): 867-878, 2007. [6] M. R. Wisnom, B. Khan, and S. R. Hallett. Size effects in unnotched tensile strength of unidirectional and quasi-isotropic carbon/epoxy composites, Composite Structures, volume(84): 21-28, 2008. [7] J. C. Newman. Fracture analysis of various cracked configurations in sheet and plate materials, Properties Related to Fracture Toughness ASTM STP 605: 104-123, 1976.