your first stop for trading s toc s, options, futures, & …
TRANSCRIPT

TD AMERITRADE 1
YOUR FIRST STOP FOR TRADING XEROF & ,SERUTUF ,SNOITPO ,SCOTS
®

2 HOW TO THINKORSWIM
HOW TO
thinkorswimyour first stop for
trading stocks, options, futures, & forex
C O N T R I B U T O R S Editor
Kevin Lund
Assistant EditorJennifer Agee
Creative Director& IllustrationMace Fleeger
Contributing WritersNicole Sherrod
Thomas PrestonLouis PalmaDavid Kier
Chad Cocco
PublisherT3 Custom
TD Ameritrade, Inc., member FINRA/SIPC. TD Ameritrade is a trademark jointly owned by TD Ameritrade IP Company, Inc. and The Toronto-Dominion Bank. © 2017 TD Ameritrade.

4 HOW TO THINKORSWIM TD AMERITRADE 5
CHAPTER 0108 / Quick Start GuideIf you want to skip the brilliant prose and just start trading right away, begin here and have fun.
HIGHLIGHTS Log in, Trade page, order screen
CHAPTER 0212 / Lay of the LandLike a double-decker tour bus inManhattan, we’ll take you on atour of the important hangouts inthinkorswim.
HIGHLIGHTS thinkorswim overview, Support/Chat, left sidebar, Monitor page, Help page
CHAPTER 0322 / Idea GeneratorsGot trader’s block? It happens to the best of us. Use these cool tools to help you figure out your next trade.
HIGHLIGHTS Calendar, Chat Rooms, myTrade, Gadgets, Scan page
GETTING TO KNOW THINKORSWIM
CHAPTER 0786 / Options: The Ultimate PrimerEverything you didn't know youwanted to know about options.
HIGHLIGHTS Calls and puts, volatil-ity, spreads, Analyze page, risk profile, probability analysis
CHAPTER 08122 / Futures: Not Just for Farmers AnymoreStocks are cool, and so are corn,hogs, and logs. But first, the basics.
HIGHLIGHTS Futures Trader, Active Trader, Monkey Bars
CHAPTER 09134 / Forex: All the World’s a TradeHow do you trade the health of an economy? Try its currency. Let's take things down a notch to show you what's up and how to trade it.
HIGHLIGHTS Forex fundamentals, Forex Trader, Q&A
CHAPTER 0436 / Trading StocksYou have to start somewhere. And for most, it’s stocks.
HIGHLIGHTS Stock basics, funda-mental analysis, watchlists, Visualize tool, Trade page, entering orders
CHAPTER 0556 / ChartingStocks move. Sometimes a lot. So if you’re trading short-term movements, it’s worth your time to learn to read a chart.
HIGHLIGHTS Charting basics, Charts page, Flexible Grid, thinkScript
CHAPTER 0676 / Trade ManagementSometimes you need a helpinghand with making decisionsor watching the markets. These are the tools that rock that purpose.
HIGHLIGHTS Beta-weighting, alerts, Trades on Charts
HOW TO TRADE STOCKS (& OTHER IMPORTANT STUFF)
CHAPTER 10146 / Goin’ Mobile: iPhoneIf you’re on your iPhone anyway, you might as well be trading.
HIGHLIGHTS Download & log in, quotes, positions, orders, option chain, trading, settings & customiza-tion, support chat
CHAPTER 11160 / Goin’ Mobile: AndroidNo less amazing, Android makes it just as easy to fall in love with mobile trading.
HIGHLIGHTS Download & log in, account overview, quotes, positions, orders, option chain, trading, settings & customization
FUN WITH MOBILE TRADING
CO
NTE
NTS
CONTACT INFORMATIONClient Services Representative800-669-3900New Accounts800-454-9272
THINKORSWIM SUPPORTDedicated Support [email protected] [email protected] [email protected]
General Mailing AddressPO Box 2209Omaha, NE 68103
Welcome to the club. A trader’s best friend is their trading platform, and you’ve now got a new best friend, so you’re going to want to know how to tame thinkorswim®, the incredible advanced trading platform from TD Ameritrade. It's powerful. It’s fast. It’s fun. (Seriously, it really is.) But we understand that to the new eye, it might strangely resemble the cockpit of an airplane, possibly render-ing you confused at times and asking the question, “Huh?”
So we came up with a cool idea for the user manual of all user manuals, which you hold in your hand. How to thinkorswim isn’t just the definitive how-to-push-the-buttons guide for all things thinkorswim; it’s your user companion.
Going forward, think of this manual as your life coach for all things thinkorswim. Hopefully, it will make your trading life easier before, during, and after your learning curve. If nothing else, when you get stuck or frustrated, it will prevent the paroxysm of rage and ritualistic pillow-screaming that would surely ensue without it.
But before we get into the button-pushing, let’s start with a little education on the difference between trading and investing. You see, trading is a form of investing, but investing isn’t trading. Both demand skill, knowledge, and discipline. But investors generally use long-term strategies that seek to profit if markets move higher,
and they feel the pressure when the markets tank.
On the other hand, trading can involve short-term assump-tions that the market will go up, down, or sideways. Trades can even be made based on how fast or slow the market might move—i.e., momentum. Whether it’s a weekly income-seeking trade or actively hedging a portfolio of stocks, traders try to move with the market.
And although there’s no “right” way to trade, there certainly are plenty of wrong ways. That’s why we’ll pull back the curtain and reveal a functional approach to trading that was built on the backs of professional traders—smart people who helped develop the thinkorswim platform.
A word of caution: Being able to trade the market from any angle might make you feel like you’ve got some kind of superpower. If you’re just start-ing out, try not to get ahead
of yourself in the beginning. No superhero ever leapt a tall building in a single bound with-out practicing first.
It’s far safer (and cheaper) to hone your craft without putting your hard-earned cash on the line.
So, before you put skin in the game, you may want to practice with paperMoney®—the “paper trading” version of the platform. paperMoney is a trading simulator that looks and feels just like thinkorswim (without a few minor bells and whistles you won’t likely miss for now).
Besides the thinkorswim platform, a few other things you’ll need to bring along are:• This manual• Computer and/or digital
device to run your trading platform
• A sense of humor
So with all that said, let’s go swimming.
Hi, Trader!HOW TO TRADE OPTIONS, FUTURES, & FOREX
CONTENTShow to thinkorswim
Introduction

6 HOW TO THINKORSWIM TD AMERITRADE 7
When two dogs meet, that embarrassing reflex could be love at first sight. Likewise, when traders fire up thinkorswim for the first time, other reflexes may be triggered to express joy and love for their trading platform. Whatever your reaction, don’t be afraid to explore and start pushing buttons. Maybe even place a trade. So go ahead, sniff around.
CHAPTER 0108 / Quick Start GuideIf you want to skip the brilliant prose and start trading right away, begin here and have fun.
CHAPTER 02 12 / Lay of the Land Like a double-decker tour bus in Manhattan, we’ll take you on a tour of the important hangouts in thinkorswim.
CHAPTER 0322 / Idea Generators Got trader’s block? It happens to the best of us. Use these cool tools to help you figure out your next trade.
76 HOW TO THINKORSWIM TD AMERITRADE
GETTING TO KNOW THINKORSWIM

8 HOW TO THINKORSWIM TD AMERITRADE 9
User companions like this one are great if you want to know what’s under the hood of thinkorswim. But if you want to just dive right in and trade, here’s how to fire up the software and buy (or sell) stocks and options in just a few quick steps.
Quick Start Guide
STEP 1 Download & Install
STEP 3
Place a Trade
STEP 2
Log In to Your Account
It’s time to open up the box, work through all the foam peanuts, and take out the thinkorswim trading platform. That is, download the thinkorswim software and get ready to rumble.
1—Go to www.thinkorswim.com and click on the Trading tab.2—Scroll down and click Download thinkorswim. Note: if you do not have a TD Ameritrade
account, you can only test-drive the platform for 60 days using paperMoney®. You can register on this page if you need to open an account.
3—Enter your user ID and password, and click Verify Account.4—Once your account is verified, click Download.5—Choose your weapon. Complete download instructions are there for each type of software
installation. Have questions? Call the technical support folks at 800-672-2098.
Now you’re ready to join the party. To get to the login screen, double-click the desktop icon (or find it in your computer’s applications folder). At the login screen:
1—Enter your username and password. 2—Choose Live Trading.3—Click Log in.
Can’t read what’s on your screen? Then change the font size or background color of the software by clicking Configure and adjust until your eyes say “Thank you.”
1
2 3
Here are the basics for buying stocks and options. We’ll cover more advanced trading orders in chapter 3.
BUYING A STOCK Buying a stock in thinkorswim just takes three steps from the Trade page.
1—Enter the order. Type the symbol in the upper left box and press enter on your keyboard. Click on the ask price of the stock you want to buy. That will open up the Order Entry Tools screen, with the information on the trade already populated. 2—Adjust the order. Here you can adjust the number of shares of stock, as well as the price you’re willing to pay, among other things.
for illustrative purposes only
GET
TIN
G T
O K
NO
W T
HIN
KO
RS
WIM01

10 HOW TO THINKORSWIM TD AMERITRADE 11
01Quick Start Guide
ac b
3—Send the order. When you’re set, click Confirm and Send. This brings up your “order ticket,” giving you one last chance to answer the question: Are you doubly sure? From here, you have three options:
a. Click Send if you’re happy. b. Click Edit if you want to change the order. c. Click Delete if you have cold feet and want to cancel the order.
Once your order is filled, you’ll hear a little “ding” that seems to come out of nowhere, and a confirmation box in the upper left-hand corner of your screen will pop up to let you know how many shares were filled and for how much.
BUYING AN OPTIONWithout the rest of the kitchen sink, here’s how to place an option trade in just four steps.
1—Enter the stock symbol. Go to the Trade page. In the upper left, fill in the box with the stock symbol and press enter on your keyboard. With the available calls and puts now in front of you, choose the expiration you want.
3
1
2
for illustrative purposes only
for illustrative purposes only
2—Pick the option. Next, choose which option you want to buy and click the ask price to pop-ulate an order ticket. (Alternatively, you can right-click the ask for a menu of all the strategies available on thinkorswim.)
3—Adjust the order. You’ll see your option order at the bottom of the Order Entry section, below the option chain. From here, you can change the quantity of contracts, the strike, expiration, and so on.
4—Place the order. When you’re happy with the order, click Confirm and Send.
5—The Order Confirmation Dialog box will give you one last chance to check the details. If all’s good, then hit Send and wait for a message to pop up confirming when your order has been filled.
If your trade is a thing of beauty, but you’re not quite ready to send it, you can save your trade and en-ter it later. After clicking Confirm and Send, you’ll see the Save button right next to the Send button.
Once you’ve saved the order, you’ll find it on the Order Entry Tools sub-page tab at the bottom of the Trade page. To send your saved order, simply right-click anywhere on the order and select Confirm and Send.
34
2
1
for illustrative purposes only
5
for illustrative purposes only
GET
TIN
G T
O K
NO
W T
HIN
KO
RS
WIM
12 HOW TO THINKORSWIM TD AMERITRADE 13
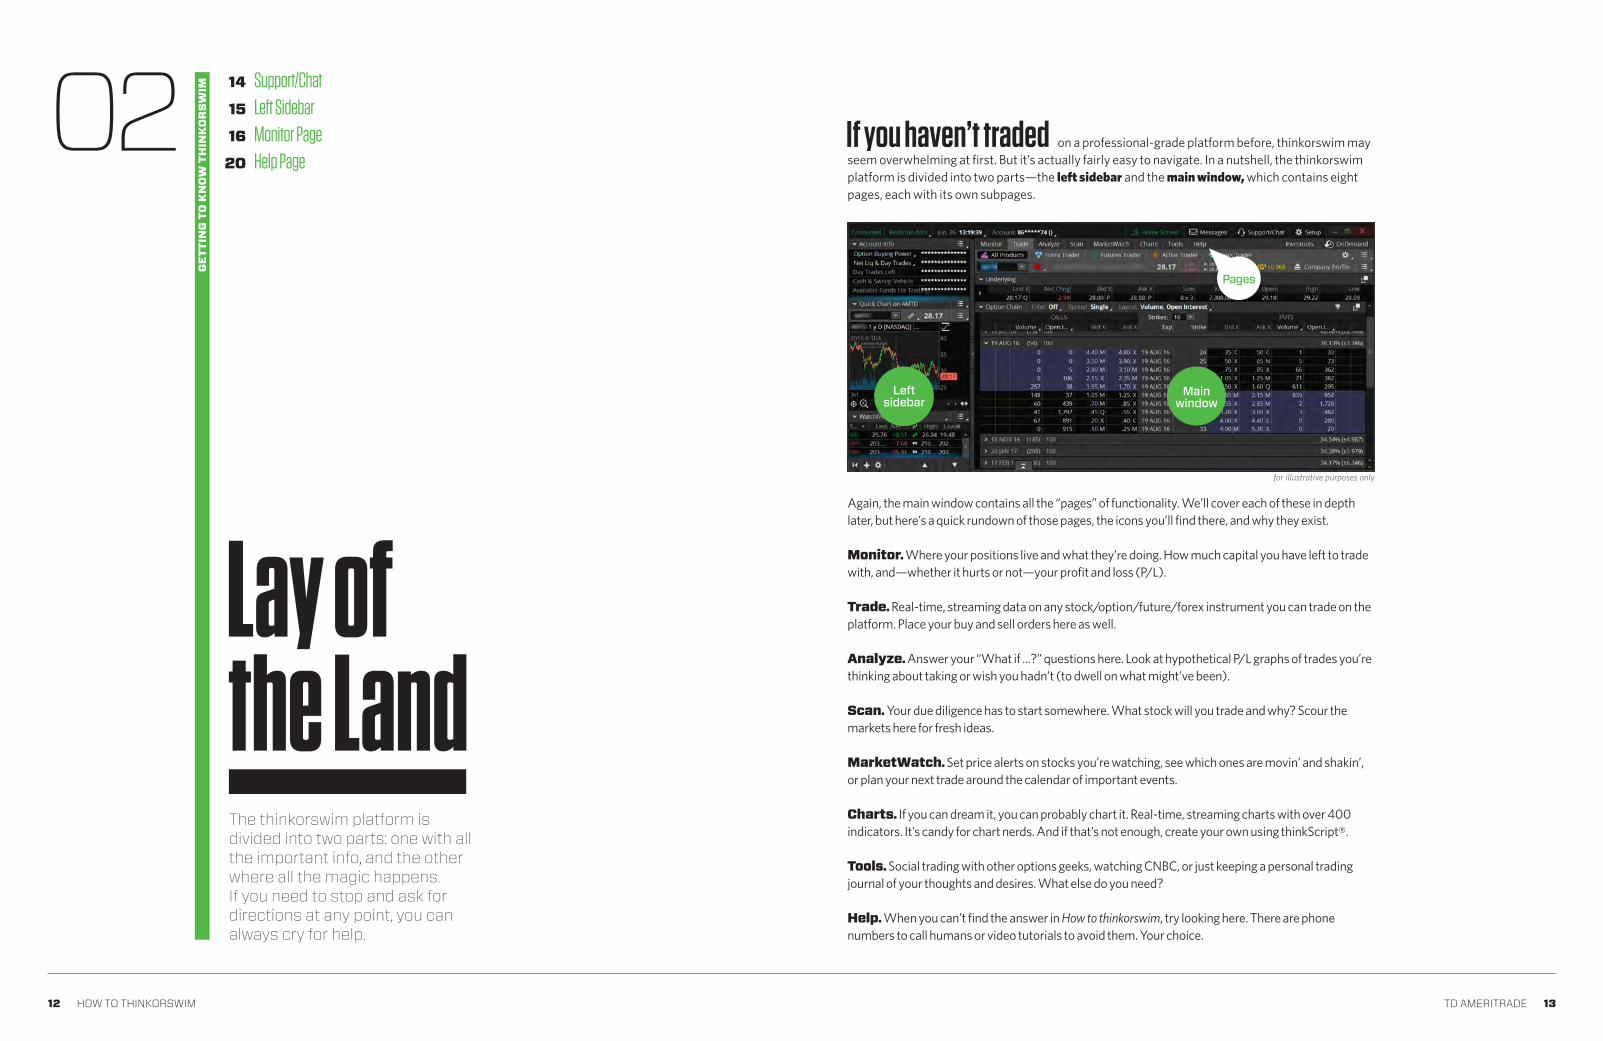
on a professional-grade platform before, thinkorswim may seem overwhelming at first. But it’s actually fairly easy to navigate. In a nutshell, the thinkorswim platform is divided into two parts—the left sidebar and the main window, which contains eight pages, each with its own subpages.
Again, the main window contains all the “pages” of functionality. We’ll cover each of these in depth later, but here’s a quick rundown of those pages, the icons you’ll find there, and why they exist.
Monitor. Where your positions live and what they’re doing. How much capital you have left to trade with, and—whether it hurts or not—your profit and loss (P/L). Trade. Real-time, streaming data on any stock/option/future/forex instrument you can trade on the platform. Place your buy and sell orders here as well.
Analyze. Answer your “What if ...?” questions here. Look at hypothetical P/L graphs of trades you’re thinking about taking or wish you hadn’t (to dwell on what might’ve been).
Scan. Your due diligence has to start somewhere. What stock will you trade and why? Scour the markets here for fresh ideas.
MarketWatch. Set price alerts on stocks you’re watching, see which ones are movin’ and shakin’, or plan your next trade around the calendar of important events.
Charts. If you can dream it, you can probably chart it. Real-time, streaming charts with over 400 indicators. It’s candy for chart nerds. And if that’s not enough, create your own using thinkScript®.
Tools. Social trading with other options geeks, watching CNBC, or just keeping a personal trading journal of your thoughts and desires. What else do you need?
Help. When you can’t find the answer in How to thinkorswim, try looking here. There are phone numbers to call humans or video tutorials to avoid them. Your choice.
Mainwindow
Leftsidebar
Pages
for illustrative purposes only
If you haven’t traded
The thinkorswim platform is divided into two parts: one with all the important info, and the other where all the magic happens. If you need to stop and ask for directions at any point, you can always cry for help.
Lay of the Land
Support/ChatLeft SidebarMonitor PageHelp Page
14
15
16
2002
GET
TIN
G T
O K
NO
W T
HIN
KO
RS
WIM
14 HOW TO THINKORSWIM TD AMERITRADE 15
Support/Chat
Left Sidebar
CUSTOM SETUP Some traders like their eggs scrambled; others like them fried. And they like their trading platform to look and feel a certain way as well. Some functions that may not be important to you are critical for others. You can customize your platform until it’s just the right temperature.
1—Click Setup at the top right of any page in thinkorswim to open the menu. 2—Customize everything from the default data for your positions to how you’d like to receive notifications from us.
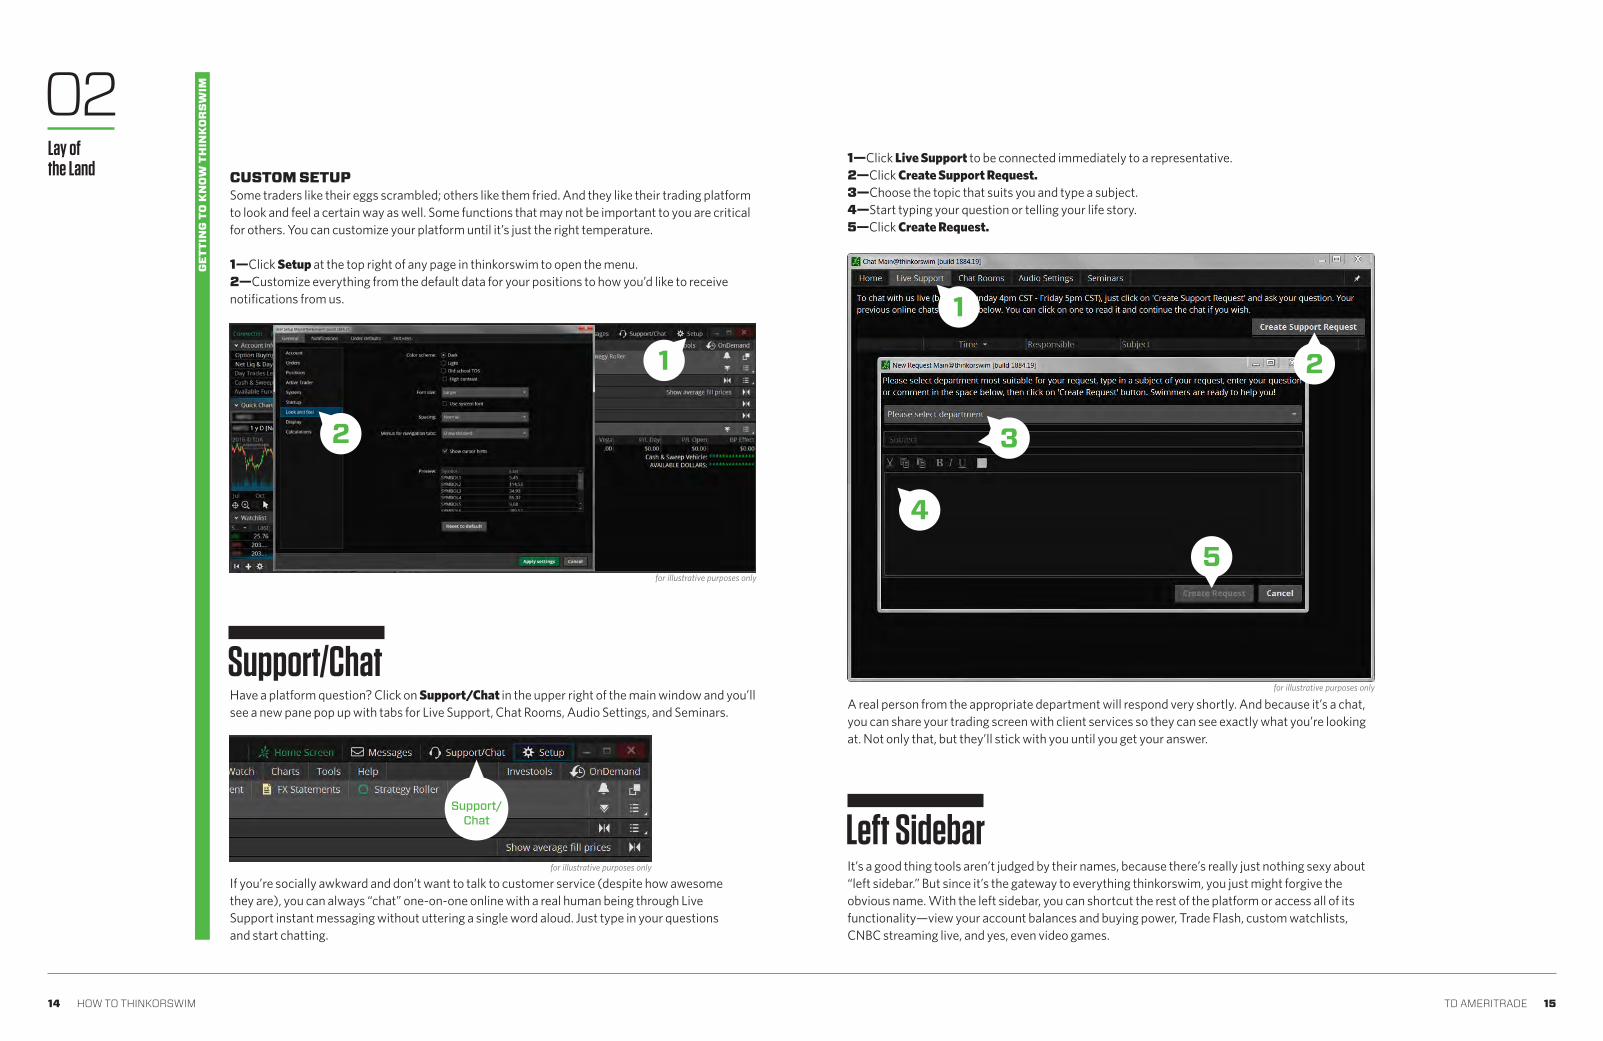
Have a platform question? Click on Support/Chat in the upper right of the main window and you’ll see a new pane pop up with tabs for Live Support, Chat Rooms, Audio Settings, and Seminars.
If you’re socially awkward and don’t want to talk to customer service (despite how awesome they are), you can always “chat” one-on-one online with a real human being through Live Support instant messaging without uttering a single word aloud. Just type in your questions and start chatting.
2
1
1—Click Live Support to be connected immediately to a representative. 2—Click Create Support Request. 3—Choose the topic that suits you and type a subject. 4—Start typing your question or telling your life story. 5—Click Create Request.
A real person from the appropriate department will respond very shortly. And because it’s a chat, you can share your trading screen with client services so they can see exactly what you’re looking at. Not only that, but they’ll stick with you until you get your answer.
It’s a good thing tools aren’t judged by their names, because there’s really just nothing sexy about “left sidebar.” But since it’s the gateway to everything thinkorswim, you just might forgive the obvious name. With the left sidebar, you can shortcut the rest of the platform or access all of its functionality—view your account balances and buying power, Trade Flash, custom watchlists, CNBC streaming live, and yes, even video games.
1
2
5
4
3
for illustrative purposes only
for illustrative purposes only
for illustrative purposes only
02Lay of the Land
GET
TIN
G T
O K
NO
W T
HIN
KO
RS
WIM
Support/Chat

16 HOW TO THINKORSWIM TD AMERITRADE 17
If you log in to thinkorswim and find yourself asking, “How are my positions doing today?” “How much did I make on FAHN this year?” or just, “Where the heck’s my money?” Never fear—it all lives in the Monitor page. It’s kind of like home base.
We’ll split the Monitor page into the following subpages: Activity and Positions and Account Statement.
ACTIVITY AND POSITIONSWatching your account balance move in real time is as fun (or cruel) as watching the markets move in real time. If you’re one of those traders who wants to watch their account balance and position P/L rise and fall with every tick of the market, this is where you’ll want to look.
Today’s Trade Activity tells you what you’ve done as well as what you’ve tried to do today. It includes:
Working Orders. This keeps a detailed account of your open orders. In other words, you’ve placed these orders, but they haven’t been filled yet.
Filled Orders. Once your order has been executed (filled), it moves to the Filled Orders tab. Canceled Orders. If your order doesn’t get filled by the end of the trading day, it gets moved here. Unless, of course, it’s a Good ’Til Canceled (GTC) order—in which case, it stays in Working Orders until you manually cancel it (or a corporate action kills it first).
ACCOUNT STATEMENT Account Statement is a detailed snapshot of what your positions are up to, grouped in alphabeti-cal order by default. However, you can change that default at any time.
ACCOUNT INFOA notable feature of the left side-bar is the bird’s eye view of what your money is doing in real time. Account Info is pretty self- explanatory, but here you can
check your available cash, option buying power, and if you’ve opened a futures or forex account, you’ll see those available balances as well.
Want to shelter your balances from prying eyes? Click on the little white arrow under “Option Buying Power” or “Net Liq and Day Trades” and you’ll see a switch for “Privacy.” Turn it on and your balances change to ********. There are even enough asterisks to cover a seven-figure account.
QTY
DAYS
MARK
MARK CHNG
DELTA, GAMMA, THETA, VEGA
P/L OPEN
P/L DAY
BP EFFECT
COLUMN WHAT IT MEANS
The number of options or shares in your position
The number of remaining days to expiration
The midpoint between the bid and ask for options; uses the bid or ask for equities
The change in the “mark”
The option greeks of your position
How much a particular option’s value has changed since the day it became part of your position
How much a particular option position value has changed today
How much your combined position in a particular underlying reduces your buying power
You can organize the view of your positions in groups by type, capitalization, industry, and account, simply by clicking the dropdown menu next to Group in the upper left of the Position Statement.
Totalloot
Year todate P/L
Filter bysymbol
Currentholdings
Numberof daysto view
Expand/collapse
TIP If organizing by in-dustry, items that can’t be categorized—such as SPX or other broad-based indexes—will fall under “Non-classifiable Establishments.”
for illustrative purposes only
for illustrative purposes only
for illustrative purposes only
for illustrative purposes only
Monitor Page
COOLINFO
02Lay of the Land
GET
TIN
G T
O K
NO
W T
HIN
KO
RS
WIM

18 HOW TO THINKORSWIM TD AMERITRADE 19
To get details on your position, click the little blue arrow to the left of the underlying equity symbol in the list.
You’ll now see all of the position specifics for each entity that you trade, including a full breakdown of the option legs in your position. Here you can track all the default vitals for each leg listed. Don’t like the default data in the columns? No problem. Create your own view:
1—In the Position Statement, far right, click the gear icon to launch the customize feature.2—Add the data you want from the left menu of choices. Remove the data you don’t want from
the right menu. 3—Click OK to see your bold new look.
Arrowdown to view
positions
1
2
3
All of your positions are subtotaled, totaled, and presented to you for review. And of course, while the market’s open, all values are updated live, so you instantly know how your positions are doing and whether you really can buy baby a new pair of shoes.
Finally, at the bottom of the Activity and Positions tab, you’ll see your money—how much cash you have, available dollars to trade with, and your overall profit and loss year-to-date (P/L YTD).
Forex traders: If you opened a forex trading account as well, those numbers will appear below your Account Status. If your account is in good standing, you’ll see the words OK TO TRADE in green letters. If you don’t see OK TO TRADE, you’ve either upset the trading gods or:
1—You’re probably not allowed to trade. 2—Your initial funding hasn’t cleared yet. 3—You forgot to put money in your account.
HOW TO HIDE YOUR MONEYIf you’re trading at work and you don’t want your boss to “acciden-tally” find out that your portfolio is worth more than his, you can hide your balance by simply clicking the little white arrow at the bottom right of “Option Buying Power” or “Net Liq & Day Trades” under ACCOUNT INFO in the left sidebar. Then hit the switch next to PRIVACY and watch your money disappear under the veil of asterisks (*******).
for illustrative purposes only
for illustrative purposes only
for illustrative purposes only
COOLINFO
02Lay of the Land
GET
TIN
G T
O K
NO
W T
HIN
KO
RS
WIM

20 HOW TO THINKORSWIM TD AMERITRADE 21
By the way, when looking at Commissions YTD in the bottom right corner of the screen, no matter what time period you’ve selected for the current year, the year-to-date number will always be current year-to-date.
Numberof daysto view
Currentholdings
Year todate P/L
Totalloot
for illustrative purposes only
The Help page is the last (but certainly not the least!) of the eight tabs on the main window. If you have a question that’s not answered in How to thinkorswim, fear not—click the Help page to access support for thinkorswim.
Under Contact Us at the top, you’ll find the phone number for our support desk (800-672-2098) and email addresses to contact our client support teams.
You can talk to a human, or, for loads of fun, click Launch Learning Center (it opens in your Web browser) where you’ll find an ample supply of video tutorials that will walk you through pretty much every nook and cranny of the thinkorswim platform. You can also read thinkMoney magazine and download as many copies of How to thinkorswim as you like. (Every child should have a copy.)
Navigate farther down the page and you’ll find a bevy of interesting links, including to live audio. Watch, listen, and learn, baby!
LaunchLearning
Center
for illustrative purposes only
Help Page
Now that you’ve gotten an overview of the main sections of the platform, including the main win-dow and the left sidebar, and you know where to go to get help, it’s on to chapter 3, where we’ll take a look at generating trading ideas.
02Lay of the Land
GET
TIN
G T
O K
NO
W T
HIN
KO
RS
WIM
22 HOW TO THINKORSWIM TD AMERITRADE 23
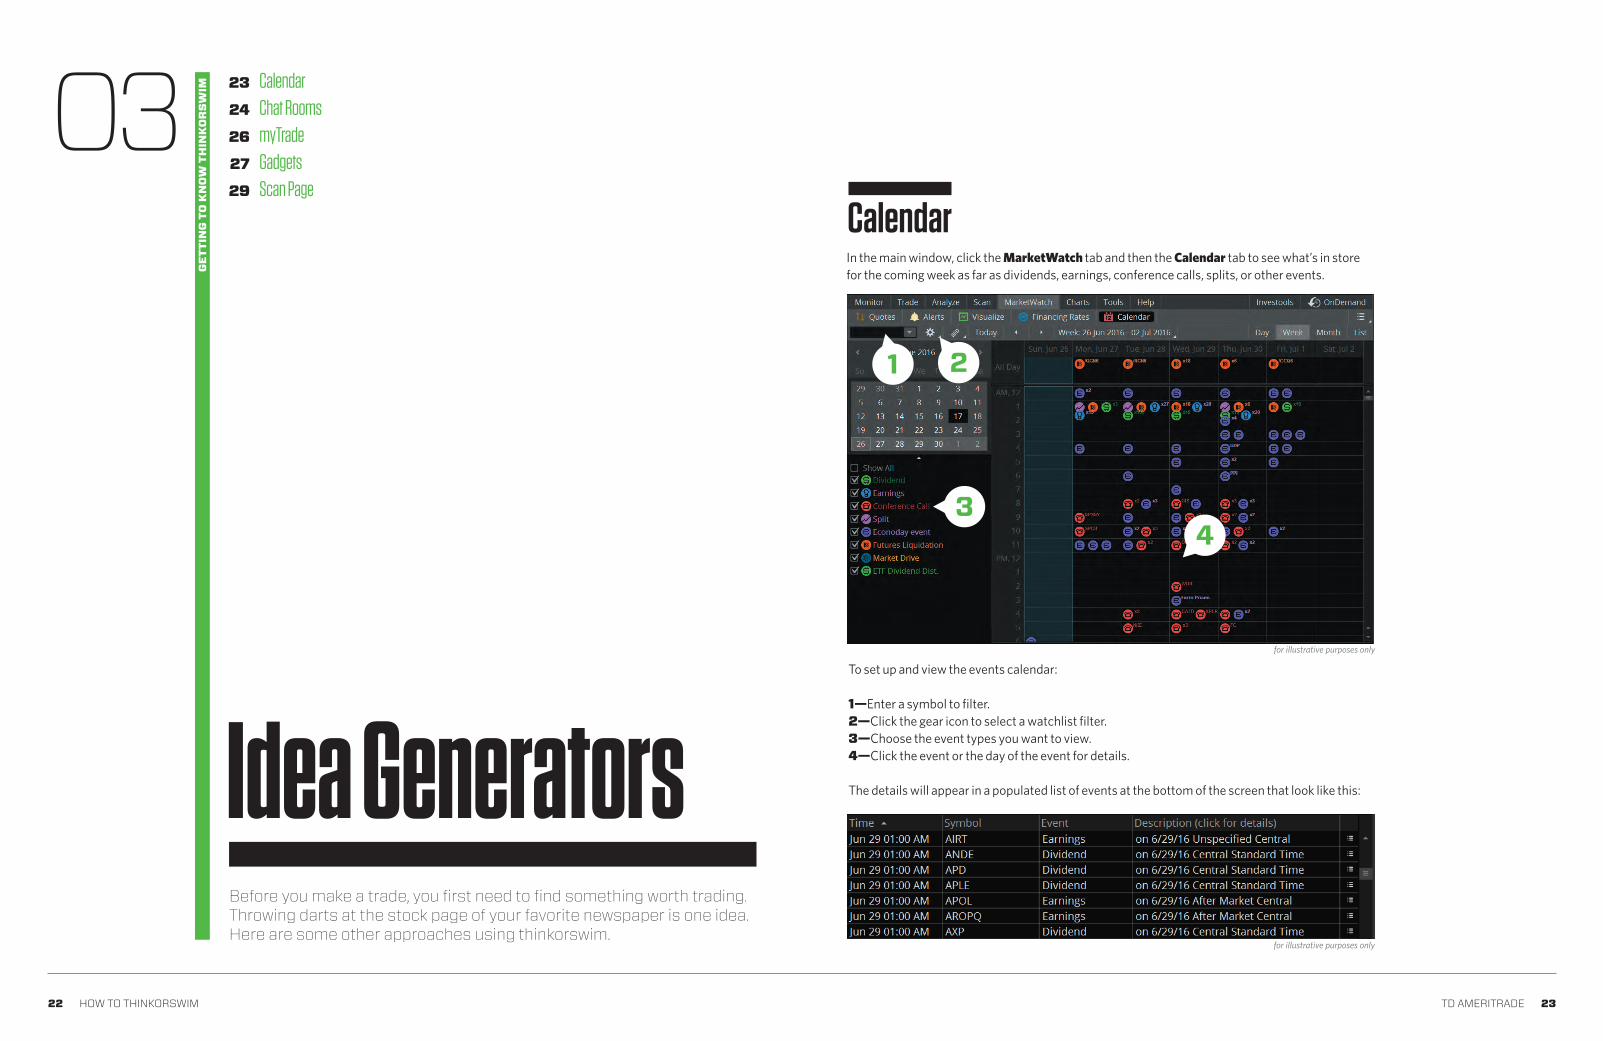
In the main window, click the MarketWatch tab and then the Calendar tab to see what’s in store for the coming week as far as dividends, earnings, conference calls, splits, or other events.
Before you make a trade, you first need to find something worth trading. Throwing darts at the stock page of your favorite newspaper is one idea. Here are some other approaches using thinkorswim.
Idea Generators
CalendarChat Rooms myTradeGadgets Scan Page
23
24
26
27
29
Calendar
for illustrative purposes only
To set up and view the events calendar:
1—Enter a symbol to filter. 2—Click the gear icon to select a watchlist filter. 3—Choose the event types you want to view. 4—Click the event or the day of the event for details.
The details will appear in a populated list of events at the bottom of the screen that look like this:
for illustrative purposes only
GET
TIN
G T
O K
NO
W T
HIN
KO
RS
WIM03
1 2
43
24 HOW TO THINKORSWIM TD AMERITRADE 25
Chat RoomsWant to chat online with other traders? Interact with market gurus? Stop by one of the Chat Rooms.
Click Support/Chat at the top right of the platform and a window with five tabs will pop up. Click the Chat Rooms tab.
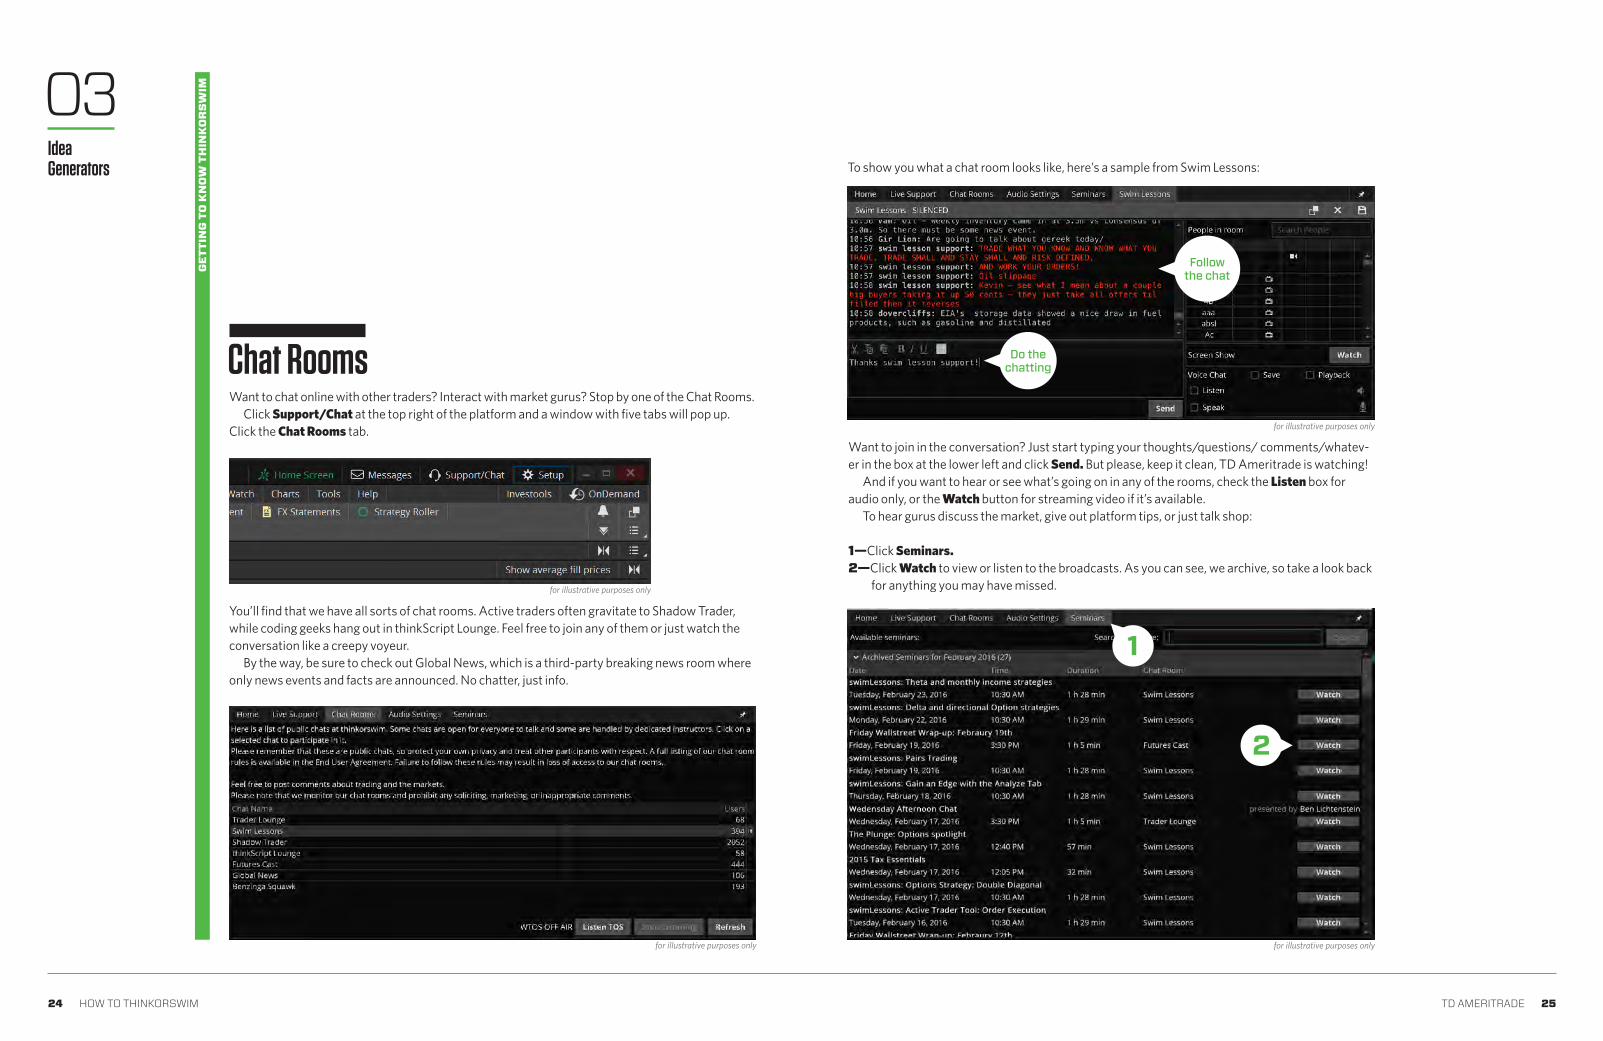
To show you what a chat room looks like, here’s a sample from Swim Lessons:
You’ll find that we have all sorts of chat rooms. Active traders often gravitate to Shadow Trader, while coding geeks hang out in thinkScript Lounge. Feel free to join any of them or just watch the conversation like a creepy voyeur.
By the way, be sure to check out Global News, which is a third-party breaking news room where only news events and facts are announced. No chatter, just info.
Want to join in the conversation? Just start typing your thoughts/questions/ comments/whatev-er in the box at the lower left and click Send. But please, keep it clean, TD Ameritrade is watching!
And if you want to hear or see what’s going on in any of the rooms, check the Listen box for audio only, or the Watch button for streaming video if it’s available.
To hear gurus discuss the market, give out platform tips, or just talk shop:
1—Click Seminars. 2—Click Watch to view or listen to the broadcasts. As you can see, we archive, so take a look back
for anything you may have missed.for illustrative purposes only
for illustrative purposes only
for illustrative purposes only
for illustrative purposes only
Idea Generators
03G
ETTI
NG
TO
KN
OW
TH
INK
OR
SW
IM
Followthe chat
Do thechatting
2
1

26 HOW TO THINKORSWIM TD AMERITRADE 27
myTrade Located under the Tools tab, myTrade** is an online community for traders to share ideas. myTrade allows you to share real trades and even copy the trades of others you follow inside your thinkorswim platform. It’s also a great place to see how other traders are playing stocks you like. And to boot, you can filter by ticker symbol to home in even further. Here’s how to take someone’s cool trading idea and make it your own.
COPYING A TRADE Click the ThinkShare tab in the myTrade window to see real trades other myTrade users are sharing. If you see one you like, and it fits your strategy, you can copy it into your thinkorswim platform to analyze or place it. Here’s how:
1—Click the Copy icon just to the right of the trade. 2—Click the Paste icon at the top right of the screen.The trade will pop up in the trade entry panel
on the Trade page, at which point you can adjust, analyze, or confirm and send it just like any other trade.
SHARING YOUR IDEA To share a trade with others, just place your trade as usual on the thinkorswim platform, and on the order confirmation screen, check the box Share on myTrade. That’s it.
As long as you have a complete myTrade profile, your trade will show up in the ThinkShare feed. (To complete your profile page, just click on the “MY PAGE” tab and go to Settings … it’s easy.) In addition, your trades will also go onto your custom myTrade page (at www.mytrade.com/ yournamehere).
The Trade Feeds feature (top left of window) in myTrade lets you organize your myTrade information. Once you’ve picked your favorites, entered orders, or followed someone else’s orders, these items automatically populate in the fields on Trade Feeds.
GADGETS: LIVE NEWS Live News gives you live streaming headlines from Dow Jones News. And that’s not all; we aug-ment the Dow feed with other third-party feeds like MidnightTrader and Benzinga, which also offer after-hours coverage.
If there’s an important news story in business, around the globe, or on Mars, it’s probably going to show up on the Live News tape. To get the full story, click on the title.
Not every second of the trading day needs to be action-packed, but leav-ing your trading screen at a critical moment could mean missing a great opportunity. Gadgets (located in the left sidebar) are designed to help you stay well-informed and stave off boredom as you watch the markets during those inevitable slow moments. To access the Gadgets:
Gadgets
for illustrative purposes only
for illustrative purposes only
for illustrative purposes only
1—Click the + symbol at the bottom of the left sidebar. 2—Choose any of the items in the menu that pops up.
Here are a few highlights.
03Idea Generators
GET
TIN
G T
O K
NO
W T
HIN
KO
RS
WIM
1
1
2
2
**myTrade is a service provided by myTrade, Inc., a separate but affiliated third-party firm. TD Ameritrade is not responsible for the services of myTrade or content shared through the service.

28 HOW TO THINKORSWIM TD AMERITRADE 29
GADGETS: TRADER TVAs the name implies, with Trader TV (above) you can keep one eye on your trading screens, another on live market news, and gulp your coffee—simultaneously. Not only can you view three different versions of live CNBC business news, but you also get CNBC's Futures Now, a unique way to learn trading strategies and research futures trading concepts.
GADGETS: TRADE FLASH If you want real-time market news as it rolls off the wires, Trade Flash (above, right) continually updates with pertinent trading news from across the board. You’ll see large option trades and the price, along with whether the trade executed on the bid or the ask. You can even click on the under-lying to bring up the stock or index in the Trade page in the main window. Trade Flash also high-lights trading halts, large-delta trades, stocks/indexes nearing key support or resistance levels, and chatter from traders themselves. It’s all the neighborhood gossip in one place.
3—The list categories will now appear in the widget. Simply select one of those lists and a new watchlist appears that you can treat like any other watchlist. You can view, analyze, trade, or just let it sit and look pretty.
GADGETS: USE THE NEWS Not only can you read the news, but you can trade from it, too—right from this little widget. Click-ing on a category such as Pre-Market Movers brings up a watchlist that you can trade from, just like any other watchlist. You can filter stories into various categories to fit your needs.
1—Click the little tag icon at the top right of the Gadget. This opens the Categories menu. 2—Choose as many of the presorted lists of categories from the Category menu as your heart desires.
for illustrative purposes only
for illustrative purposes only
for illustrative purposes only
Scan PageGood trading ideas typically come from someone or something filtering through the riffraff. And since there are tens of thousands of possibilities, the market scanning tools on the Scan page can help you sift through the vast universe of stock, options, futures, and forex markets to bring you some optimal choic-es based on your own criteria, preset criteria, or what the crowd is trading. Here’s how to get started.
IDEAS FOR FINDING YOUR NEXT TRADEOften, too many indicators can lead to indecision and antacids. But there’s another approach to finding a potential trade and plotting a chart using just a few indicators.
for illustrative purposes only
03Idea Generators
GET
TIN
G T
O K
NO
W T
HIN
KO
RS
WIM
1 2
Click foryour favorite
financial channel
3

30 HOW TO THINKORSWIM TD AMERITRADE 31
Okay, maybe not the galactic universe, but you can analyze historical stock prices and trends by charting them in the Charts tab. Just right-click on any symbol in the scan results and choose TOS Charts.
If you’re not familiar with charting stocks, skip to chapter 5. If you understand the basics of reading a chart, then ask yourself three starter questions:1—What’s the trend? 2—How strong is the trend? 3—Where do I get in?
STEP 2
Master the Universe STEP 3
Chart the UniverseFirst, let’s check out Stock Hacker in the Scan page. Here you can scan the world of stocks (or your own lists of stocks) with your own criteria, your filters, and all the price data your heart desires. For example:
1—Choose the subset of stocks you would like to scan from the dropdown next to the words Scan in. There, you can see predefined categories as well as all your personal watchlists and GICS classified industry lists. Choose All Optionable if you only want to see stocks with listed options.
2—Change the default stock filter parameters, or Add Stock Filter below the Scan in dropdown to add a stock filter to the existing set of criteria. Choose Last and enter a minimum and maximum price of the stock.
3—Now click the Add Study Filter button. Use the dropdown to select the Price Performance group and choose Price Direction. The default inputs for this filter are CLOSE and Increased, which we’ll keep. But you might want to increase the number of bars of data to more than three.
4—Sort for the most heavily traded by choosing the sorted by dropdown to the left of the scan button. Select the Basic Price & Quote menu and choose Volume. In the next menu, choose Descending.
5—Click Scan.
The results will appear at the bottom of the screen like orderly soldiers. If you’re not happy with them, you can always edit the filters.
STEP 1
Scan the Universe
for illustrative purposes only
To help with these questions, we’ll add three studies: simple moving average, volume, and the Relative Strength Index, and make a couple of minor adjustments to the parameters. Once you’ve got TOS Charts set up, you can answer the three questions. (Please note that the following is for illustrative purposes only and not a recommendation.)
1—Is the stock clearly trading above the simple moving average (blue line in chart), or has it recently crossed above the line?
2—Does the indicator line in RSIWilder cross from below the 30 line to above it recently? 3—Is the volume increasing or higher than normal (bars are higher than prior bars, indicating
more traders committing to the trade)?
There’s never a guarantee that a trend will continue, but if you’ve answered “yes” to all three of these questions, then there’s a good chance you may have filtered for a stock or two smack dab in the heart of a bullish run.
for illustrative purposes only
1
03Idea Generators
GET
TIN
G T
O K
NO
W T
HIN
KO
RS
WIM
3
2
54
32 HOW TO THINKORSWIM TD AMERITRADE 33
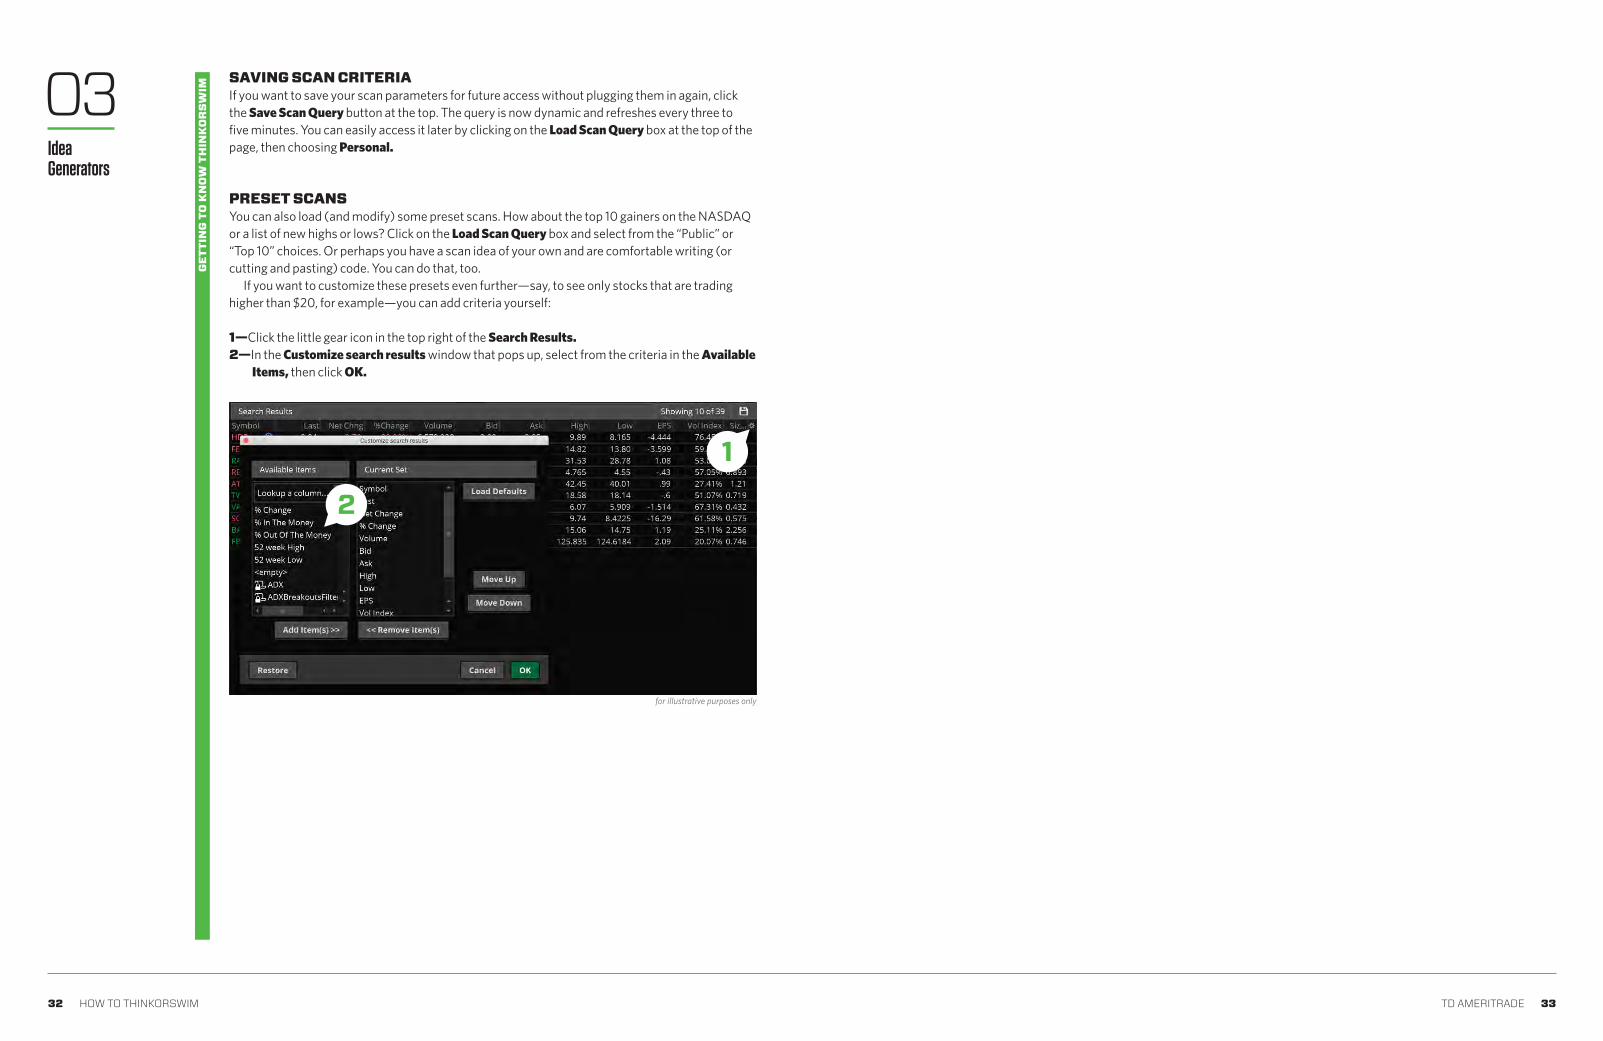
SAVING SCAN CRITERIA If you want to save your scan parameters for future access without plugging them in again, click the Save Scan Query button at the top. The query is now dynamic and refreshes every three to five minutes. You can easily access it later by clicking on the Load Scan Query box at the top of the page, then choosing Personal.
PRESET SCANS You can also load (and modify) some preset scans. How about the top 10 gainers on the NASDAQ or a list of new highs or lows? Click on the Load Scan Query box and select from the “Public” or “Top 10” choices. Or perhaps you have a scan idea of your own and are comfortable writing (or cutting and pasting) code. You can do that, too.
If you want to customize these presets even further—say, to see only stocks that are trading higher than $20, for example—you can add criteria yourself:
1—Click the little gear icon in the top right of the Search Results. 2—In the Customize search results window that pops up, select from the criteria in the Available
Items, then click OK.
for illustrative purposes only
03Idea Generators
GET
TIN
G T
O K
NO
W T
HIN
KO
RS
WIM
1
2

34 HOW TO THINKORSWIM TD AMERITRADE 353534 HOW TO THINKORSWIM TD AMERITRADE
CHAPTER 0436 / Trading StocksYou have to start somewhere. And for most, it’s stocks.
CHAPTER 05 56 / Charting Stocks move. Sometimes a lot. So if you’re trading short-term move-ments, it’s worth your time to learn to read a chart.
CHAPTER 0676 / Trade Management Sometimes you need a helping hand when making decisions or watching the markets. These are the tools that rock that purpose.
HOW TO TRADE STOCKS (AND OTHER IMPORTANT STUFF)Okay, you may have the itch to start trading. But before you dive in, let’s spend a little time learning what makes the stock market bounce.

36 HOW TO THINKORSWIM TD AMERITRADE 37
We get it. You want to start trading. But do you know enough about what makes stocks tick and how to trade them?
Trading Stocks
When companies are “public,” they sell shares of stock. When you own even a single share of a company’s stock, you have a claim on the company’s profitability, income, and assets. The more shares you buy, the bigger the piece of the company you own. And whether you own just one share or a million shares, the return on your investment (ROI) is going to be the same in terms of percentages. So, transaction costs aside, if the stock goes up (or down) 10%, your ROI is also generally up (or down) 10%.
There are two primary ways you can earn money by investing in stocks:
Appreciation. This means a stock you own goes up in value. In this case, when you buy stock, you’re speculating on the direction the stock will take. (Note: you can also potentially profit from a stock that goes down in price through a process called “shorting.”)
Dividend income. Dividends are regularly scheduled payments (typically once per quarter) that some companies make to shareholders. A dividend is a way for a publicly held company to give a portion of its earnings to shareholders as a kind of incentive for investing.
IS IT ALL MAGIC AND SPELLS?Not at all. Suppose Red Flag Cycling makes bikes. Really good bikes. The bikes are so good, in fact, that the company wants to expand so it can sell more bikes to riders around the world. But to do this, the company needs to raise money (or “capital”). There are a number of ways a company can raise capital. Two primary methods are:
Getting a loan. Companies can borrow operating capital, which can mean taking on significant debt.
Issuing stock. By “going public” and issuing stock shares, a company can raise money without going into debt. It sells ownership shares and a claim on profitability, income, and assets to its investors.
So, Red Flag Cycling opts for going public, but what does this have to do with you, the trader? Let’s suppose Mary is looking for a return on her investing capital and is intrigued by trading. She might look to the stock market for opportunities if she is willing to accept the higher risk of losing her investment for the potential of higher gains. In her research, she decides she likes the outlook for Red Flag Cycling and the momentum its stock is having lately. One way to make this trade is for Mary to buy shares of stock through an online broker using an electronic trading platform like the TD Ameritrade platform, thinkorswim (see image, next page).
What the heck’s a stock, anyway?
37
40
43
46
48
50
Stock BasicsTrading with FundamentalsWatchlistsVisualize ToolTrade PageEntering Orders
04H
OW
TO
TR
AD
E S
TOC
KS
( AN
D O
THER
IMP
OR
TAN
T S
TUFF
)
38 HOW TO THINKORSWIM TD AMERITRADE 39
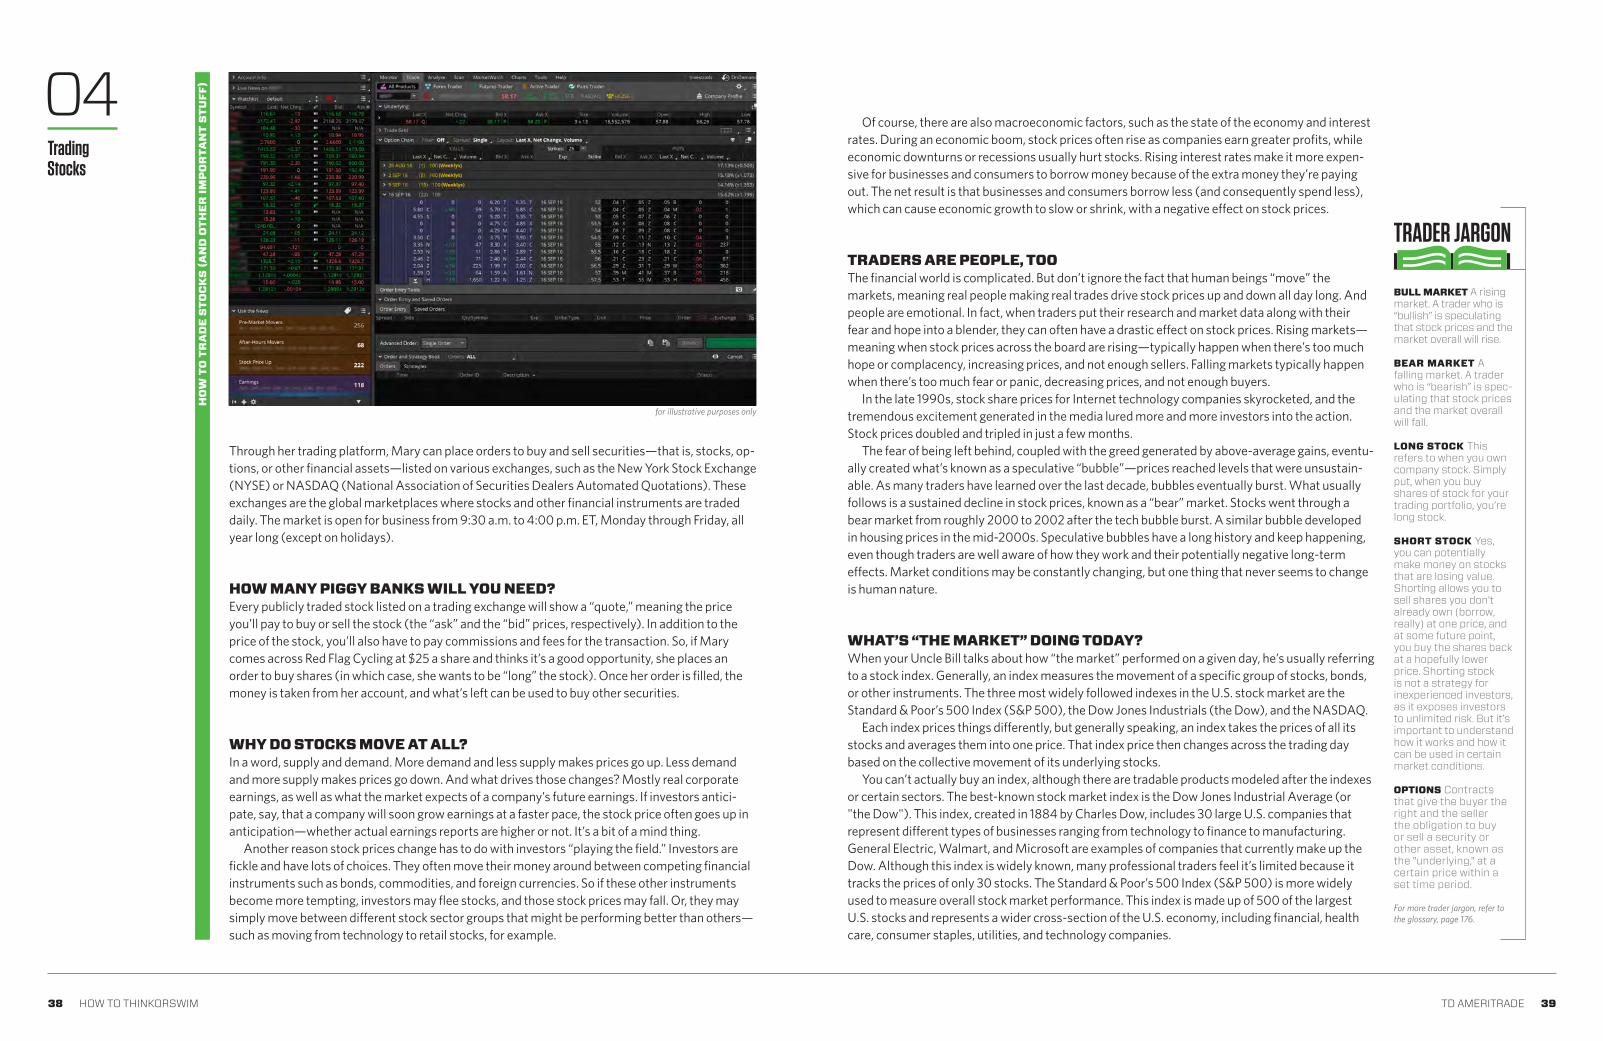
for illustrative purposes only
Through her trading platform, Mary can place orders to buy and sell securities—that is, stocks, op-tions, or other financial assets—listed on various exchanges, such as the New York Stock Exchange (NYSE) or NASDAQ (National Association of Securities Dealers Automated Quotations). These exchanges are the global marketplaces where stocks and other financial instruments are traded daily. The market is open for business from 9:30 a.m. to 4:00 p.m. ET, Monday through Friday, all year long (except on holidays).
HOW MANY PIGGY BANKS WILL YOU NEED? Every publicly traded stock listed on a trading exchange will show a “quote,” meaning the price you’ll pay to buy or sell the stock (the “ask” and the “bid” prices, respectively). In addition to the price of the stock, you’ll also have to pay commissions and fees for the transaction. So, if Mary comes across Red Flag Cycling at $25 a share and thinks it’s a good opportunity, she places an order to buy shares (in which case, she wants to be “long” the stock). Once her order is filled, the money is taken from her account, and what’s left can be used to buy other securities.
WHY DO STOCKS MOVE AT ALL? In a word, supply and demand. More demand and less supply makes prices go up. Less demand and more supply makes prices go down. And what drives those changes? Mostly real corporate earnings, as well as what the market expects of a company’s future earnings. If investors antici-pate, say, that a company will soon grow earnings at a faster pace, the stock price often goes up in anticipation—whether actual earnings reports are higher or not. It’s a bit of a mind thing.
Another reason stock prices change has to do with investors “playing the field.” Investors are fickle and have lots of choices. They often move their money around between competing financial instruments such as bonds, commodities, and foreign currencies. So if these other instruments become more tempting, investors may flee stocks, and those stock prices may fall. Or, they may simply move between different stock sector groups that might be performing better than others—such as moving from technology to retail stocks, for example.
Of course, there are also macroeconomic factors, such as the state of the economy and interest rates. During an economic boom, stock prices often rise as companies earn greater profits, while economic downturns or recessions usually hurt stocks. Rising interest rates make it more expen-sive for businesses and consumers to borrow money because of the extra money they’re paying out. The net result is that businesses and consumers borrow less (and consequently spend less), which can cause economic growth to slow or shrink, with a negative effect on stock prices.
TRADERS ARE PEOPLE, TOOThe financial world is complicated. But don’t ignore the fact that human beings “move” the markets, meaning real people making real trades drive stock prices up and down all day long. And people are emotional. In fact, when traders put their research and market data along with their fear and hope into a blender, they can often have a drastic effect on stock prices. Rising markets—meaning when stock prices across the board are rising—typically happen when there’s too much hope or complacency, increasing prices, and not enough sellers. Falling markets typically happen when there’s too much fear or panic, decreasing prices, and not enough buyers.
In the late 1990s, stock share prices for Internet technology companies skyrocketed, and the tremendous excitement generated in the media lured more and more investors into the action. Stock prices doubled and tripled in just a few months.
The fear of being left behind, coupled with the greed generated by above-average gains, eventu-ally created what’s known as a speculative “bubble”—prices reached levels that were unsustain-able. As many traders have learned over the last decade, bubbles eventually burst. What usually follows is a sustained decline in stock prices, known as a “bear” market. Stocks went through a bear market from roughly 2000 to 2002 after the tech bubble burst. A similar bubble developed in housing prices in the mid-2000s. Speculative bubbles have a long history and keep happening, even though traders are well aware of how they work and their potentially negative long-term effects. Market conditions may be constantly changing, but one thing that never seems to change is human nature.
WHAT’S “THE MARKET” DOING TODAY? When your Uncle Bill talks about how “the market” performed on a given day, he’s usually referring to a stock index. Generally, an index measures the movement of a specific group of stocks, bonds, or other instruments. The three most widely followed indexes in the U.S. stock market are the Standard & Poor’s 500 Index (S&P 500), the Dow Jones Industrials (the Dow), and the NASDAQ.
Each index prices things differently, but generally speaking, an index takes the prices of all its stocks and averages them into one price. That index price then changes across the trading day based on the collective movement of its underlying stocks.
You can’t actually buy an index, although there are tradable products modeled after the indexes or certain sectors. The best-known stock market index is the Dow Jones Industrial Average (or "the Dow"). This index, created in 1884 by Charles Dow, includes 30 large U.S. companies that represent different types of businesses ranging from technology to finance to manufacturing. General Electric, Walmart, and Microsoft are examples of companies that currently make up the Dow. Although this index is widely known, many professional traders feel it’s limited because it tracks the prices of only 30 stocks. The Standard & Poor’s 500 Index (S&P 500) is more widely used to measure overall stock market performance. This index is made up of 500 of the largest U.S. stocks and represents a wider cross-section of the U.S. economy, including financial, health care, consumer staples, utilities, and technology companies.
TRADER JARGON
BULL MARKET A rising market. A trader who is “bullish” is speculating that stock prices and the market overall will rise.
BEAR MARKET A falling market. A trader who is “bearish” is spec-ulating that stock prices and the market overall will fall.
LONG STOCK This refers to when you own company stock. Simply put, when you buy shares of stock for your trading portfolio, you’re long stock.
SHORT STOCK Yes, you can potentially make money on stocks that are losing value. Shorting allows you to sell shares you don’t already own (borrow, really) at one price, and at some future point, you buy the shares back at a hopefully lower price. Shorting stock is not a strategy for inexperienced investors, as it exposes investors to unlimited risk. But it’s important to understand how it works and how it can be used in certain market conditions.
OPTIONS Contracts that give the buyer the right and the seller the obligation to buy or sell a security or other asset, known as the "underlying," at a certain price within a set time period.
For more trader jargon, refer to the glossary, page 176.
04 Trading Stocks
HO
W T
O T
RA
DE
STO
CK
S ( A
ND
OTH
ER IM
PO
RTA
NT
STU
FF)

40 HOW TO THINKORSWIM TD AMERITRADE 41
Trading With FundamentalsStock “research” has traditionally been synonymous with “fundamental analysis”—an approach that tries to determine a company’s financial strength in order to better forecast its stock price. For instance, if the current share price of XYZ company doesn’t reflect the company’s earnings growth potential as modeled by fundamental analysis, and if XYZ is deemed to be financially sound, then shares are said to be “cheap.”
If a company releases earnings and reveals to the world that they’re growing faster than anyone expected, that’s new information that wasn’t priced into the stock the day before. In all likelihood, the stock price will jump a little higher and stabilize at a new price that better reflects its long-term potential. Over time, the stock might continue to rise steadily, trade within a range, or fall from there. For the moment, though, it’s a “tradable event” triggered by a financial number, not a chart.
As a trader, if your goal is to embrace short-term opportunities, why use long-term financial indicators to determine stock selection? Well, you might see why if you look through a new lens. There are a few tools that can help on thinkorswim, which you’ll find in the Fundamentals tab on the Analyze page:
1—Analyst Reports2—Company Profile3—Eonomic Data
ANALYST REPORTSFor many traders, gut feelings and crystal balls are not enough to drive a trading decision. For those looking for some in-depth fundamental analysis, we have added the ability to review several differ-ent analyst reports and ratings sets within the platform. The Fundamentals page now has a section for reports and ratings immediately below the quote.
Equity analysis reports from The Research Team, S&P Capital IQ, Credit Suisse, Ford Equity Research, Jaywalk Consensus, TheStreet, and Market Edge are all available for covered securi-ties. The overall rating from each group appears on the top-level display. A detailed report can be viewed or downloaded from the links on the right-hand side.
COMPANY PROFILE In about 45 seconds, here’s how you can use the company profile tool in thinkorswim to help you zero in on what might look like a good opportunity. To access it, click the Analyze tab, then Funda-mentals in the submenu.
1—Type a stock symbol in the upper left box. If the fundamentals needed by the tool are tracked in thinkorswim, the company profile button will appear in the upper right. Click it. The com- pany’s profile information will appear in a new window labeled “What Drives This Stock.”
2—The company profile with hypothetical price is on the far left side. The Trefis estimate has MNKY at 125.26 and MNKY is currently trading at 115.73. Based on the hypothetical price, MNKY looks undervalued, and you could set a target exit price at 125.26.
3—On the blue vertical bar, click the business division you’d like to analyze.4—Click the various metrics on the right and drag estimates of these forecasts (the “levers”) based
on your own findings. Suppose you believe that increased demand for a specific product or business unit may result in greater market share. By moving that lever up slightly, you can see the impact it would have on the valuation estimate.
for illustrative purposes only
To access the company profile tool in thinkorswim, click the ANALYZE tab, then FUNDAMENTALS in the submenu.
TAKEACTION
TAKE ACTION
for illustrative purposes only
Analystreports
04 Trading Stocks
TRADER JARGON
FUNDAMENTALS Factors that some investors use to analyze a company and its po-tential for success, such as earnings, revenues, cash flow, debt level, fi-nancial ratios, and so on.
For more trader jargon, refer to the glossary, page 176.
HO
W T
O T
RA
DE
STO
CK
S ( A
ND
OTH
ER IM
PO
RTA
NT
STU
FF)
HO
W T
O T
RA
DE
STO
CK
S ( A
ND
OTH
ER IM
PO
RTA
NT
STU
FF)
Company Profile informa-tion/estimates provided by Insight Guru, a separate and unaffiliated firm. Stock prices are impacted by numerous factors and estimates of prices in the future are not guaranteed.
13
2
4

42 HOW TO THINKORSWIM TD AMERITRADE 43
EARNINGS ANALYSIS TOOLAll in one place, the earnings analysis tool gathers two years’ worth of the earnings info you need to analyze the price and volatility of historical earnings events. To pull it up, go to the Analyze tab and in the submenu, select Earnings.
Earnings events are shown side by side along with five days of pricing and volatility data before and after events. For each previous quarter shown, you can compare the price history, historical and implied volatility, and the price of the at-the-money straddle, as well as project-ed and actual earnings.
ECONOMIC DATA The Economic Data interface* enables you to access and use a database of hundreds of thou-sands of economic indicators, or time series, from dozens of sources. Indicators presented in this database cover a great variety of economic areas including, but not limited to: banking, finance, national accounts, exchange rates, population and employment surveys, international data, and much more. In thinkorswim, this interface is available from the Analyze page.
If you know what indicator you are looking for, you can use our powerful search function to save time by eliminating the need to find it manually. Or, on the Economic Data homepage, you’ll see the list of larger categories arranged into eight groups; clicking on any category or group will bring up its list of subcategories. Those can have their own subcategories, too. Generally, it takes up to three clicks through the database tree to reveal a list of corresponding time series. Each time series is assigned a symbol. If you know the one you want, Economic Data’s symbol selector will take you directly to the time series plot.
The left sidebar in thinkorswim contains lists of stocks and indexes to help you keep in touch with the market. The default watchlist you’ll see when you fire up the platform for the first time is called, well, “default.” Go ahead and highlight a symbol in the default list and delete or change it.
To add a new symbol, simply click in the first empty symbol box at the bottom of the list and add the symbol. If you don’t know the stock symbol, type in a question mark (“?”) and hit enter on your keyboard to bring up the Symbol Table.
Watchlists
VIEWING OTHER PREDEFINED WATCHLISTS First off, note that predefined lists are for convenience purposes only and are not recommendations. There are about as many predefined lists in thinkorswim as there are rocks on a beach. So rather than name them all here, just do the following:
1—Click the watchlist name in the header bar (it’ll say “default” if you’ve never changed it) to access the category menu.
2—Select a new watchlist from those listed.
for illustrative purposes only
To customize a watchlist, click on any column header and drag it to a new position in the watchlist. You can change the columns by right-clicking any column header and choosing Customize. The window that opens offers just about everything from A to Z.
You can alphabetize the list by clicking on Symbol. If you prefer to organize it yourself in a way that makes the most sense to you, right-click on the header row and select No Sorting. Don’t worry about losing your work; thinkorswim automatically saves your screen when you log off.
for illustrative purposes only
Arrowdown
watchlist
Type in
symbol
for illustrative purposes onlyfor illustrative purposes only
*This product uses the FRED® API but is not endorsed or certified by the Federal Reserve Bank of St. Louis. FRED is a registered trademark of the Federal Reserve Bank of St. Louis. FRED API and data © Federal Reserve Bank of St. Louis. All rights reserved. By using FRED data, you are agreeing to be bound by the FRED API Terms of Use, available at research.stlouisfed.org/fred_terms.html.
04 Trading Stocks
HO
W T
O T
RA
DE
STO
CK
S ( A
ND
OTH
ER IM
PO
RTA
NT
STU
FF)
HO
W T
O T
RA
DE
STO
CK
S ( A
ND
OTH
ER IM
PO
RTA
NT
STU
FF)
1
2

44 HOW TO THINKORSWIM TD AMERITRADE 45
CREATING YOUR OWN WATCHLIST If you don’t like what you see, make a list of your own. Custom lists will show up in the menu under “Personal.” (The predefined lists are under the “Public” menu.)
1—Click the watchlist name at the top of the watchlist.
2—Then select “Create watchlist…”
This will bring up a New Watchlist box.
3—Give the list a name. 4—Click under “Symbol” and enter a stock
symbol. 5—Click Save.
HOW TO IMPORT A WATCHLISTAnother way to create a watchlist is simply to bring in an existing list of your own from a file on your computer.
1—Note that symbols are case sensitive (ABC is not abc). 2—Create a comma-separated or line-separated list of symbols and save it to a file (.txt), or copy
the list to your clipboard.3—Click the name of the watchlist in the Gadget.4—Click “Import…”. 5—Choose “From File” or “From Clipboard,” depending on step 2. 6—Click OK.7—Name the watchlist. 8—Click Save.
COLOR LINKING: A BETTER WAY TO CUT AND PASTE Hyperlinks serve as a de facto clipboard throughout the platform. You can save up to nine different items on the clipboard, all color-coded so they’re easier to remember. The idea is to let you view the same stock as you toggle from Quote to Chart to Trade without making you type in the same symbol(s) every time. (Have you seen the length of an option symbol lately?) Try linking a quote from the Quote screen in the MarketWatch page to a chart in the Chart page.
1—Near the top left of the Quote screen, click on the link icon.2—Choose Red. 3—Go to the Chart page and do the same at the top of a chart next to the symbol box.
for illustrative purposes only
for illustrative purposes only for illustrative purposes only
04 Trading Stocks
HO
W T
O T
RA
DE
STO
CK
S ( A
ND
OTH
ER IM
PO
RTA
NT
STU
FF)
HO
W T
O T
RA
DE
STO
CK
S ( A
ND
OTH
ER IM
PO
RTA
NT
STU
FF)
1
1
2
2
3
4
5

46 HOW TO THINKORSWIM TD AMERITRADE 47
1—Click the Visualize button in the submenu under the MarketWatch tab.2—Click on any one of the watchlists in the left menu. 3—Look at the pretty colors and shapes.
4—Now head back to the MarketWatch page and click on a stock.
5—Then head back over to Charts and you’ll see a chart of the symbol you highlighted.
It’s that simple. Once you set up your links, you can set link boxes across multiple features on the platform to change simultaneously to the stock you’re researching—including Gadgets, Product Depth, and even CNBC stories.
Visualize
for illustrative purposes only
Redclipboard
for illustrative purposes only
The Visualize feature is like night vision for traders. You get to see which stocks made the biggest price moves in a vast market that would otherwise be difficult to penetrate. As the name implies, Visualize can help you spot opportunities in a visually intuitive format.
Green is up, red is down, and grey is unchanged. Bigger boxes are larger stocks—in terms of market cap—and brighter colors are bigger moves.
1—Hover your cursor over a box to get details on the stock. 2—Left-click on a symbol to bring up the dropdown menu to further analyze the stock in Charts,
the Analyze page, and so on. Right-click on a symbol box to see what watchlists and indexes the stock is in.
for illustrative purposes only
for illustrative purposes only
1
2
04 Trading Stocks
HO
W T
O T
RA
DE
STO
CK
S ( A
ND
OTH
ER IM
PO
RTA
NT
STU
FF)
HO
W T
O T
RA
DE
STO
CK
S ( A
ND
OTH
ER IM
PO
RTA
NT
STU
FF)
4
12
3
5

48 HOW TO THINKORSWIM TD AMERITRADE 49
Ready to trade the markets in real time with the coolest set of tools on the planet? We’ll assume that’s why you’re here.
ALL PRODUCTSIf you’re trading stocks and options, most of the action happens on the All Products page. You can get quotes for literally all products traded through the thinkorswim platform, including stocks, options, futures, and forex. And once you’ve got the quote you’re looking for, you can populate an order ticket 20 ways under the sun.
If you don’t know the actual stock symbol, just start typing the name of the company you’re looking for. Assuming you got the spelling right, it will magically appear on the list that comes up. Click the company’s name when you find it. If you haven’t a clue what to type (perhaps an obscure index), then …
1—Click the down arrow to the right of the symbol box to open the Symbol Table window. 2—Select a category tab. 3—Scroll through the category until you find what you’re looking for, and click on it.
Trade Page
When your quote appears, you’ll see the following data populate just below:
for illustrative purposes only
LASTX
NET CHNG
BIDX
ASKX
SIZE
VOLUME
OPEN
HIGH
LOW
QUOTE JARGON WHAT IT MEANS
The last trade price for the asset (or last calculated value for an index) and the exchange (X) that posted the trade.
The change in last price since the close of the previous day. This value updates only during regular U.S. trading hours, and may be adjusted to reflect dividends or stock splits.
Bid price—the published price and the exchange (X) publishing that price. This shows what someone is willing to pay for the asset.
Ask price—the published price and the exchange (X) publishing that price. This shows the price someone is willing to sell an asset for.
There are two numbers here. The first is the number of shares times 100 that the bid price represents. The second is the number of shares times 100 the ask price represents.
The total number of shares reported traded for the day.
The opening price.
The high price of the day (market hours only).
The low price of the day (market hours only).
If you’re a data geek and want more, click the little arrow to the left of the LASTX, and you’ll see the following:
YIELD
PE
EPS
DIV
DIV. FREQ
DIV. RATE
52HIGH
52LOW
BETA
P/C RATIO
SHARES
MORE JARGON WHAT IT MEANS
The % annual dividend yield for a stock based on the latest announced dividend and the current stock price.
The price/earnings ratio based on the current stock price and the latest reported company earnings per share.
The earnings per share.
The latest announced dividend.
The latest announced dividend frequency for this stock (usually quarterly, but also semiannually and annually, or another frequency).
The latest announced ex-dividend date.
The 52-week high.
The 52-week low.
A calculated value measuring the returns for this stock in relation to the market over time.
Put/call ratio for this particular underlying only.
Shares outstanding.
04 Trading Stocks
HO
W T
O T
RA
DE
STO
CK
S ( A
ND
OTH
ER IM
PO
RTA
NT
STU
FF)
HO
W T
O T
RA
DE
STO
CK
S ( A
ND
OTH
ER IM
PO
RTA
NT
STU
FF)
12
3

50 HOW TO THINKORSWIM TD AMERITRADE 51
TRADER JARGON
Entering OrdersThe order entry functionality of thinkorswim is—how should we put this delicately—freakin’ awesome. Sure, you can just buy or sell a stock or option like any other trader would. But why stop there? Again, if you can dream it, we’ve probably already thought of it. And there’s a good chance you can trade it on thinkorswim. Let’s start with the basics. Despite all the bells and whistles of thinkorswim, the primary logic of the trading platform is simple:
Left-click to create simple buy and sell orders for any equity, option, future, or currency pair. Right-click to bring up complex order types—including multi-leg options orders as well as more advanced orders.*
For example, select Buy Vertical and it will populate a two-legged long vertical spread in the order entry screen at the strike from which you right-clicked. Select Sell Butterfly and a three-legged short butterfly will populate … and so on. From there, you can customize your order.
CUSTOMIZING YOUR ORDERS Although there are a number of ways to bring up an order screen, by far the easiest is to simply click the bid or ask on a stock or option from anywhere that you see a quote on the instrument (option chain, Analyze page, watchlists, and so on). This will populate a trade order in the “Order Entry” screen at the bottom with the default number of shares or contracts. You now have two choices:
1—Submit the order as is.2—Customize the order.
COMMON ORDER TYPESThe table shows the most common orders you’ll find. Access them by clicking the cell just below Order on the Order Entry screen.
for illustrative purposes only
ORDER TYPES WHAT THEY MEAN
Seeks execution at the next available price.
Seeks execution at the price you specify or better.
Indicates you want your stop order to become a market order once a specific activation price has been reached. There is no guarantee that the execution price will be equal to or near the activation price.
Seeks execution at a specific limit price or better once the activa-tion price is reached. With a stop limit order, you risk missing the market altogether. In a fast-moving market, it might be impossible to execute an order at the stop-limit price or better, so you might not have the protection you sought.
An order that is entered with a stop parameter that moves in lock-step ("trails")—either by a dollar amount or percentage—with the price of the instrument. Once the stop (activation) price is reached, the trailing order becomes a market order, or the trailing stop limit order becomes a limit order. Both are accepted only for stocks that trade on NASDAQ, NYSE, and AMEX.
Indicates you want your order to execute as close as possible to the market closing price.
Submits a limit order to buy or sell at a specific price or better at the close of trading that day.
MARKET
LIMIT
STOP
STOP LIMIT
TRAILING/ TRAILING STOP LIMIT
MARKET ONCLOSE
LIMIT ON CLOSE
for illustrative purposes only
Advanced order types
Common order types
Contingent orders
ADVANCED ORDER TYPESHere are the most common advanced orders you’ll find. Access them by clicking the cell on the bottom left of the Order Entry screen.
for illustrative purposes only
MORE ORDERS WHAT THEY MEAN
Submits up to eight orders simultaneously, each independent of the others.
The first order entered in the Order Entry screen triggers a series of up to seven more orders that are not filled until the next order in the queue is filled.
The first order in the Order Entry screen triggers up to seven more orders to be submitted simultaneously, each independent of the others.
The first order in the Order Entry screen triggers an OCO order (“one cancels other”—see below). For example, first buy 100 shares of stock. When the order is filled, it triggers an OCO for your profit stop and stop-loss.
The first order in the Order Entry screen triggers two OCO orders. For example, first buy 200 shares of stock. Then trigger a “bracket” order to sell your shares in two 100-share OCO orders.
The first order in the Order Entry screen triggers three OCO orders. For example, first buy 300 shares of stock. Then trigger a bracket order to sell your shares in three 100-share OCO orders.
Two orders are placed simultaneously; if one order is executed, the other is canceled.
BLAST ALL
1ST TRIGGERS SEQUENCE
1ST TRIGGERS ALL
1ST TRIGGERS OCO
1ST TRIGGERS2 OCO
1ST TRIGGERS3 OCO
OCO (ONE CANCELS OTHER)
04 Trading Stocks
STOP ORDER A type of order that turns into a market order to buy or sell stock or options when and if a specified “stop” price is reached. Stop orders to buy stock or options specify prices that are above their current market prices. Stop orders to sell stock or options specify prices that are below their current market prices. A stop order will not guarantee an execution at or near the activation price. Once activated, they compete with other incoming market orders.
ONE CANCELS OTHER (OCO) Two orders sub-mitted simultaneously by one client, where if one order is filled, the other is canceled immediately. This type of order treats two or more option orders as a package, whereby the execution of any one of the orders causes all the orders to be reduced by the same amount. For example, an investor would enter an OCO order if she wishes to buy 10 May 60 calls or 10 June 60 calls or any combina-tion of the two which, when summed, equal 10 contracts. An OCO order may be either a day order or a GTC order.
For more trader jargon, refer to the glossary, page 176.
HO
W T
O T
RA
DE
STO
CK
S ( A
ND
OTH
ER IM
PO
RTA
NT
STU
FF)
*Options, futures, and forex options trading is speculative, subject to special risks, and is not suitable for all investors. Trading privileges subject to review and approval. Not all clients will qualify. Forex accounts are not available to residents of Ohio or Arizona.
HO
W T
O T
RA
DE
STO
CK
S ( A
ND
OTH
ER IM
PO
RTA
NT
STU
FF)

52 HOW TO THINKORSWIM TD AMERITRADE 53
TRADER JARGON
For each of the advanced order types, the concept is simple, but entering the order may not be quite so intuitive.
Each order (except “Blast All”) starts with a primary trade (“1st,” which is the one you want to enter), while the rest of each advanced order is set up to trigger some other order, such as bracket orders (OCO), sequences, and so on. Here’s how to enter a 1st Triggers OCO:
1—Enter the primary order (single option, stock, spread, etc.) 2—Select 1st trgs OCO in the Advanced Order menu. 3—Next, enter both the target price you want to exit for a profit (limit order) or the stop-loss order,
one at a time. (Doesn’t matter which order is first.) 4—Click Confirm and Send.
CONTINGENCY ORDERS Now, if you’re one of those high-maintenance cappuccino drinkers who likes their foam on the side, half decaf, and temperature at exactly 160°F, chances are you prefer the stars to align before you enter a trade as well. No problem. Not only can you choose up to three separate market condi-tions to occur before the order is submitted to “the floor,” but you can choose the time as well (for example, 30 minutes after the start of trading).
1—After loading up an order in the Order Entry and Saved Orders box, to the far right of your screen, click the little gear sprocket to the right of the Exchange column. This opens up the Order Rules window for your contingency orders.
5—Double-check the order ticket that pops up to be sure that each component of the trade is properly entered.
6—Send it.
for illustrative purposes only
for illustrative purposes only
for illustrative purposes only
2—Click in the cell just below Symbol and type in your symbol. 3—Select your Method, Trigger, and Threshold. Rinse and repeat for up to three contingencies. 4—Click Save.
for illustrative purposes only
04 Trading Stocks
LIMIT ORDER An order that has a limit on either price or time of execution, or both, in contrast to a market order that must be filled at the most favorable price as soon as pos-sible. Limit orders to buy are usually placed below the current ask price. Limit orders to sell are usually placed above the current bid price. Limit orders can be used when trading spreads. In markets with low liquidity or in fast markets, some traders use limits to ensure getting filled by putting in a limit order to buy at or above the ask price or a limit order to sell at or below the bid price.
CONTINGENCY ORDER When you place a stock or option order, you can choose to place contingencies on that order, meaning that the order will be filled only when a specific event has occurred. For example, a contingency order might be “Buy 10 XYZ 80 calls at the mar-ket if XYZ stock trades above 75.”
For more trader jargon, refer to the glossary, page 176.
HO
W T
O T
RA
DE
STO
CK
S ( A
ND
OTH
ER IM
PO
RTA
NT
STU
FF)
HO
W T
O T
RA
DE
STO
CK
S ( A
ND
OTH
ER IM
PO
RTA
NT
STU
FF)
1 1
2 34
2 3 4
5
6
54 HOW TO THINKORSWIM TD AMERITRADE 55
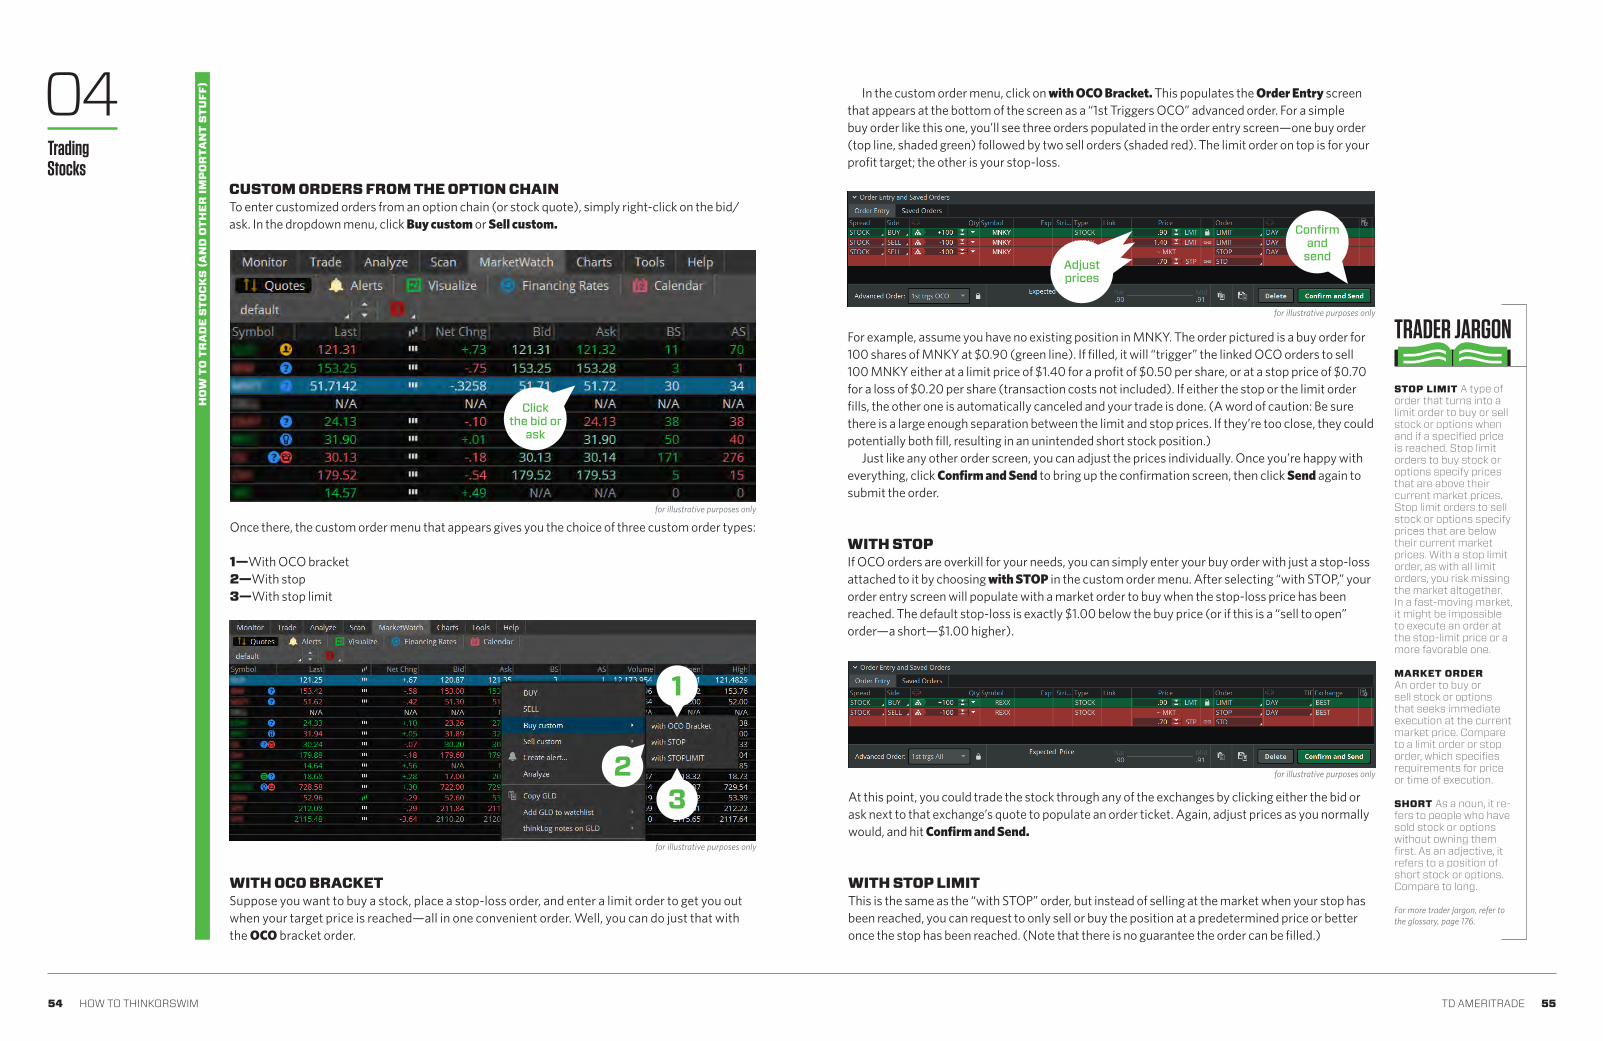
CUSTOM ORDERS FROM THE OPTION CHAIN To enter customized orders from an option chain (or stock quote), simply right-click on the bid/ask. In the dropdown menu, click Buy custom or Sell custom.
Once there, the custom order menu that appears gives you the choice of three custom order types:
1—With OCO bracket 2—With stop 3—With stop limit
for illustrative purposes only
for illustrative purposes only
Click the bid or
ask
for illustrative purposes only
WITH OCO BRACKET Suppose you want to buy a stock, place a stop-loss order, and enter a limit order to get you out when your target price is reached—all in one convenient order. Well, you can do just that with the OCO bracket order.
In the custom order menu, click on with OCO Bracket. This populates the Order Entry screen that appears at the bottom of the screen as a “1st Triggers OCO” advanced order. For a simple buy order like this one, you’ll see three orders populated in the order entry screen—one buy order (top line, shaded green) followed by two sell orders (shaded red). The limit order on top is for your profit target; the other is your stop-loss.
For example, assume you have no existing position in MNKY. The order pictured is a buy order for 100 shares of MNKY at $0.90 (green line). If filled, it will “trigger” the linked OCO orders to sell 100 MNKY either at a limit price of $1.40 for a profit of $0.50 per share, or at a stop price of $0.70 for a loss of $0.20 per share (transaction costs not included). If either the stop or the limit order fills, the other one is automatically canceled and your trade is done. (A word of caution: Be sure there is a large enough separation between the limit and stop prices. If they’re too close, they could potentially both fill, resulting in an unintended short stock position.)
Just like any other order screen, you can adjust the prices individually. Once you’re happy with everything, click Confirm and Send to bring up the confirmation screen, then click Send again to submit the order.
WITH STOP If OCO orders are overkill for your needs, you can simply enter your buy order with just a stop-loss attached to it by choosing with STOP in the custom order menu. After selecting “with STOP,” your order entry screen will populate with a market order to buy when the stop-loss price has been reached. The default stop-loss is exactly $1.00 below the buy price (or if this is a “sell to open” order—a short—$1.00 higher).
for illustrative purposes only
Adjustprices
Confirmand
send
At this point, you could trade the stock through any of the exchanges by clicking either the bid or ask next to that exchange’s quote to populate an order ticket. Again, adjust prices as you normally would, and hit Confirm and Send.
WITH STOP LIMIT This is the same as the “with STOP” order, but instead of selling at the market when your stop has been reached, you can request to only sell or buy the position at a predetermined price or better once the stop has been reached. (Note that there is no guarantee the order can be filled.)
04 Trading Stocks
TRADER JARGON
STOP LIMIT A type of order that turns into a limit order to buy or sell stock or options when and if a specified price is reached. Stop limit orders to buy stock or options specify prices that are above their current market prices. Stop limit orders to sell stock or options specify prices that are below their current market prices. With a stop limit order, as with all limit orders, you risk missing the market altogether. In a fast-moving market, it might be impossible to execute an order at the stop-limit price or a more favorable one.
MARKET ORDER An order to buy or sell stock or options that seeks immediate execution at the current market price. Compare to a limit order or stop order, which specifies requirements for price or time of execution.
SHORT As a noun, it re-fers to people who have sold stock or options without owning them first. As an adjective, it refers to a position of short stock or options. Compare to long.
For more trader jargon, refer to the glossary, page 176.
HO
W T
O T
RA
DE
STO
CK
S ( A
ND
OTH
ER IM
PO
RTA
NT
STU
FF)
HO
W T
O T
RA
DE
STO
CK
S ( A
ND
OTH
ER IM
PO
RTA
NT
STU
FF)
for illustrative purposes only
1
32

56 HOW TO THINKORSWIM TD AMERITRADE 57
Trader 1: “How do you know when a stock will stop going up?” Trader 2: “When it starts going down.”
And so the great trading debate begins. But the answer to the question above is so elusive. A sim-ple guiding precept of technical analysis is “the trend is your friend.” Yet, what constitutes a trend, and who’s trading it? Is it the short-term trader tracking 60-minute trends? Or is it the longer-term trader tracking six-month trends?
Technical analysis—the art of reading a chart—focuses on stock price momentum. It assumes that all the data you’d find in fundamental analysis is already priced into a chart up to that moment. Therefore, historical price patterns, momentum indicators, and charting trends all come into play. In essence, technical analysis uses price charts to gather up the quantitative data of traders’ buy-ing and selling behavior to gauge future price movements.
That said, trends reverse. And although the trend can be your friend, it’s important to recognize when the probability of a trend reversal may hint that it’s time to look for an exit. A true “techni-cian” will attempt to exit losing trades long before they present a serious danger. Weak stock price action compels the technical analyst to close out long positions.
Learning about stock price behavior starts with looking at a price chart. If you’re new to reading charts and technical analysis, it’s easy to become overwhelmed with the many chart types and the bells and whistles that go inside them. Let’s first narrow the choices to the three most common chart types, and then we’ll examine the more popular techniques traders apply to them.
Can charts predict the future? Of course not. But they can give you an idea of a stock’s momentum right now. For traders, that’s good enough.
Charting
Chart TypesCharting BasicsCharts PageFlexible GridthinkScript: Create Your Own Indicators
58
60
63
71
72
05H
OW
TO
TR
AD
E S
TOC
KS
( AN
D O
THER
IMP
OR
TAN
T S
TUFF
)

58 HOW TO THINKORSWIM TD AMERITRADE 59
LINE CHARTS Perhaps the most easily constructed price chart is the line chart, which plots a single line that connects all of a stock’s closing prices for a given time interval.
This chart is simple to follow. And because it only plots a single data point (the closing price for the period), you can more readily spot the overall trend. However, it’s also limiting because you aren’t getting the full picture of the range in prices that occurs during each period, which can give you clues as to what is happening within the trend.
DAILY BAR CHARTAnatomy of a price bar: Typically, each bar on the chart represents the open, high, low, and close price for the period being observed (i.e., day, week, month, etc.). Past performance does not guarantee future results.
for illustrative purposes only
BAR CHARTThe bar chart is another method of charting price activity. These charts help you examine the range from one bar to the next so you can easily see the bars’ size increase or decrease. Notice how the ranges of the bars on the chart below expand and contract between longer periods of high and low volatility. As the market becomes more volatile, the bars become longer, and the price swings are larger. As the markets become quieter, the chart contracts into shorter bars.
for illustrative purposes only for illustrative purposes only
CANDLESTICK CHARTS A variation of the bar chart is the candlestick chart (see below). Candlesticks are unique because they display either bullish or bearish sentiment for the time interval they represent, depending on whether the stock closes higher or lower than the open. The wide body of the candlestick represents the range between the opening and closing prices of the time intervals, while the high and low are called the wick, or shadow. The candlesticks are typically color-coded to mark bullish advances with a white or green body, and declines with a dark or red body.
Notice in the chart below how prices move in a trending market. In a normal bull market, you’ll typically see more clusters of green bars than red bars (e.g., April to May), while the reverse is true for a bear market (e.g., mid-May to June). Such combinations of these bars in succession help to make up patterns that the trader may use as entry or exit signals.
DAILY CANDLESTICK CHART Anatomy of a candlestick chart. Past performance does not guarantee future results.
05Charting
HO
W T
O T
RA
DE
STO
CK
S ( A
ND
OTH
ER IM
PO
RTA
NT
STU
FF)

60 HOW TO THINKORSWIM TD AMERITRADE 61
Charts help visualize trends and mark points of support and resis-tance. As you can see from the arrows, stocks that move higher over a range of time are essentially in uptrends. Stocks that move lower over a period of time are in downtrends.
SEEING TRENDS, SUPPORT, AND RESISTANCE It’s one thing to know what a chart is. It’s another to actually read one.
Support. This is a price level that serves as a “floor” for stock prices, where a downward- trending stock stops and reverses course. At some point, sellers will stop selling, buyers will take control, and the stock will start to rise. At the inflection point, the stock puts in a low price, which is called “support.”
After a rally, should the stock reverse course again and come back down to test the level of support, it will likely require more conviction (i.e., volume) by sellers to penetrate this level. If the stock does not penetrate support, this only strengthens the level and may be used as an indication for short sellers to rethink their positions, if they believe buyers will likely start to take control.
Resistance. The counterpart to support, resistance is a price level that acts as a ceiling for stock prices at a point where a rallying stock stops moving higher and reverses course. At this point, buyers will need more conviction to penetrate this level in future rallies.
It’s important to understand that support and resistance are essentially psychological constructs. But keep track of them, as they can be valuable information for your strategy and trading plans.
Resistance
Downtrend
Uptrend
Resistance
Old resistancebecomes new support.
(Will it hold?)
Support
for illustrative purposes only
for illustrative purposes only
for illustrative purposes only
REVERSALS Within a chart, you’ll find certain patterns that provide clues to help you determine where a poten-tial new trend begins and ends, and thus possible entry and exit points for your trades. Look for at least two confirming stair steps in the opposite direction of a prior trend (see sidebar, next page). If a stock has been trending down, and suddenly changes direction (known as a “reversal”), don’t just label it a new uptrend yet.
Traders traditionally look for confirmation in the chart pattern that exhibits at least one higher high than the first, and one higher low than the lowest price of the previous trend.
BREAKOUT PATTERNS Then there are a few common “breakout” patterns that may provide useful entry and exit points when they surface within the trend. Such patterns typically exhibit a tightening range of price action over time, followed by a breakout in price one way or the other, which resumes the previous trend or begins a new one.
Patterns with names like “flags,” “pennants,” and “triangles” are all common indicators that traders consistently use to generate potential buy and sell signals (see sidebar).
WHERE ARE WE? Is the stock you want to trade moving up or down? Who’s doing the buying or selling? Where in the trend is the stock right now? When is a good time to get into the trade?
These are all questions that traders attempt to answer using chart indicators. Technical traders typically combine multiple indicators, as individual indicators alone can provide false signals that could lead to poor entries and big losses. A powerful strategy combines indicators, signaling potentially harmful trades by giving conflicting signals.
Where to start? Learn how volume and moving averages work together with price action, and add or subtract indicators as you develop your own system.
Below is a daily chart that uses volume and moving averages with price action. It shows how a trader might determine support and resistance levels (dotted lines) and/or breakout patterns. The volume indicator is below the chart, and two moving averages (10-day and 30-day) are drawn over the colored bars inside the chart.
SAMPLE OF A TECHNICIAN’S CHART PALETTE Colored bar chart with marked support and resistance levels, multiple indicators, and familiar breakout patterns.
Volume
Moving average“crossover”
Long-term support level. (Will it hold?)
BEARISH CHART(downtrend)
BULLISH CHART(uptrend)
ASCENDINGTRIANGLE
DESCENDINGTRIANGLE
BEARISH FLAG
BULLISH FLAG
PENNANT
An uptrend often begins with a series of higher highs and higher lows, while a downtrend often begins with a series of lower highs and lower lows.
Some commonbreakout patterns:
Notice that volume started accelerating (diagonal line) before the blue shorter-term moving average crossed below the pink longer-term average. By the time this “crossover” occurred, a new downtrend was in place, providing stronger clues to the likelihood of that trend’s continuation.
for illustrative purposes only
05Charting
HO
W T
O T
RA
DE
STO
CK
S ( A
ND
OTH
ER IM
PO
RTA
NT
STU
FF)
HO
W T
O T
RA
DE
STO
CK
S ( A
ND
OTH
ER IM
PO
RTA
NT
STU
FF)
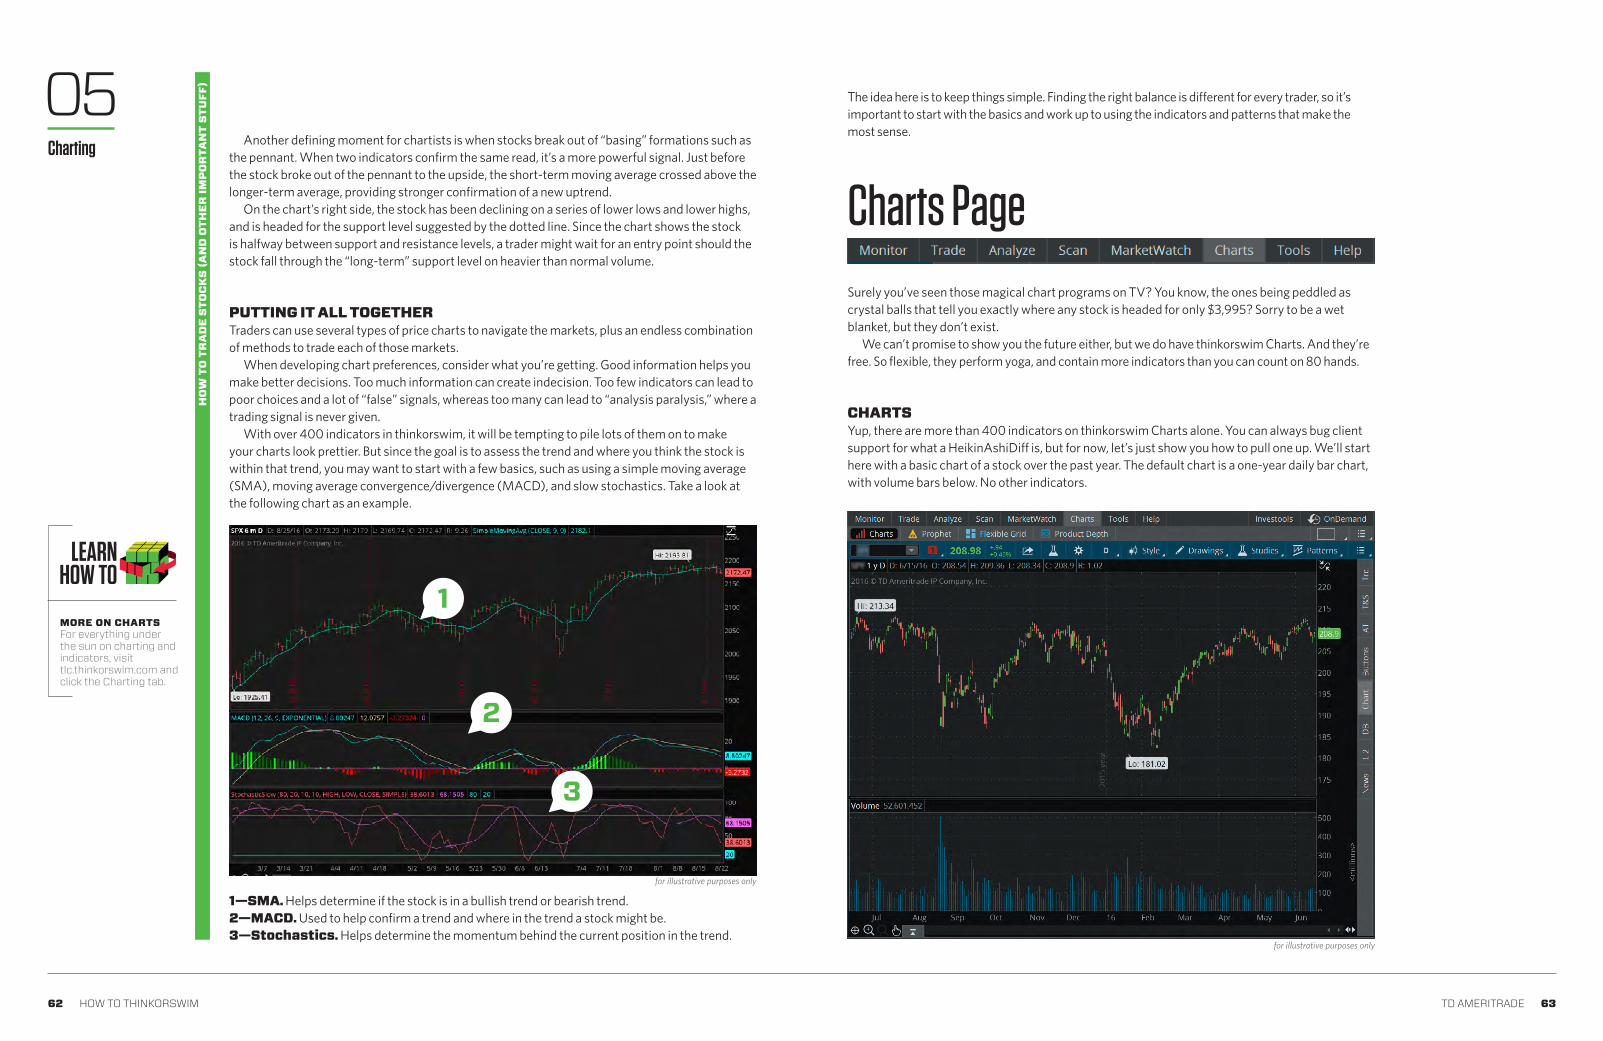
62 HOW TO THINKORSWIM TD AMERITRADE 63
Another defining moment for chartists is when stocks break out of “basing” formations such as the pennant. When two indicators confirm the same read, it’s a more powerful signal. Just before the stock broke out of the pennant to the upside, the short-term moving average crossed above the longer-term average, providing stronger confirmation of a new uptrend.
On the chart’s right side, the stock has been declining on a series of lower lows and lower highs, and is headed for the support level suggested by the dotted line. Since the chart shows the stock is halfway between support and resistance levels, a trader might wait for an entry point should the stock fall through the “long-term” support level on heavier than normal volume.
PUTTING IT ALL TOGETHER Traders can use several types of price charts to navigate the markets, plus an endless combination of methods to trade each of those markets.
When developing chart preferences, consider what you’re getting. Good information helps you make better decisions. Too much information can create indecision. Too few indicators can lead to poor choices and a lot of “false” signals, whereas too many can lead to “analysis paralysis,” where a trading signal is never given.
With over 400 indicators in thinkorswim, it will be tempting to pile lots of them on to make your charts look prettier. But since the goal is to assess the trend and where you think the stock is within that trend, you may want to start with a few basics, such as using a simple moving average (SMA), moving average convergence/divergence (MACD), and slow stochastics. Take a look at the following chart as an example.
1—SMA. Helps determine if the stock is in a bullish trend or bearish trend. 2—MACD. Used to help confirm a trend and where in the trend a stock might be. 3—Stochastics. Helps determine the momentum behind the current position in the trend.
MORE ON CHARTS For everything under the sun on charting and indicators, visit tlc.thinkorswim.com and click the Charting tab.
for illustrative purposes only
1
2
3
Charts PageSurely you’ve seen those magical chart programs on TV? You know, the ones being peddled as crystal balls that tell you exactly where any stock is headed for only $3,995? Sorry to be a wet blanket, but they don’t exist.
We can’t promise to show you the future either, but we do have thinkorswim Charts. And they’re free. So flexible, they perform yoga, and contain more indicators than you can count on 80 hands.
CHARTS Yup, there are more than 400 indicators on thinkorswim Charts alone. You can always bug client support for what a HeikinAshiDiff is, but for now, let’s just show you how to pull one up. We’ll start here with a basic chart of a stock over the past year. The default chart is a one-year daily bar chart, with volume bars below. No other indicators.
for illustrative purposes only
The idea here is to keep things simple. Finding the right balance is different for every trader, so it’s important to start with the basics and work up to using the indicators and patterns that make the most sense.
05Charting
HO
W T
O T
RA
DE
STO
CK
S ( A
ND
OTH
ER IM
PO
RTA
NT
STU
FF)
HO
W T
O T
RA
DE
STO
CK
S ( A
ND
OTH
ER IM
PO
RTA
NT
STU
FF)

64 HOW TO THINKORSWIM TD AMERITRADE 65
CHANGING THE CHART PERIOD 1—Type in a symbol. 2—Click the Style menu at the top right of the chart. 3—Click Daily(1 y D), then 3 Months, then Day.
Voilà! You get a chart that looks like this:
WHAT’S THAT STUDY? If you don’t know what a study does, one way to find out is to click “Edit studies.” To the right of each study in the selection menu is “?”. Click it and, like magic, you’ll have your answer.
COOLINFO
for illustrative purposes only
for illustrative purposes only
CHANGING THE CHART TYPE 1—Click the Style button, top right. 2—Click Chart type. 3—Select your preferred chart style.
for illustrative purposes only
Now you’d like to add some studies to the chart. Fortunately, thinkorswim lets you chart practically every study imaginable. And if a new one comes up at some unspecified date in the future (say, “the Jet Pack Indicator”), thinkorswim will quickly add that too. We tend to keep pace with new, cutting-edge indicators and we’ll update the software accordingly.
TO ADD A STUDY 1—Click the Studies button. 2—Move your cursor down to Add study and view all the available categories. 3—Choose the category of study, then the study itself. The new study will appear on your chart.
for illustrative purposes only
But suppose you want to switch to candles as well as change the duration of the chart to some-thing shorter, like three months instead of one year?
05Charting
HO
W T
O T
RA
DE
STO
CK
S ( A
ND
OTH
ER IM
PO
RTA
NT
STU
FF)
HO
W T
O T
RA
DE
STO
CK
S ( A
ND
OTH
ER IM
PO
RTA
NT
STU
FF)
1
1
1
2
3
23
2
3

66 HOW TO THINKORSWIM TD AMERITRADE 67
TO EDIT A STUDY Click Studies above the chart. Then select Edit study in the submenu.
1—Find the study you want to edit and click on it. 2—Customize and edit the criteria in the Properties box below it. 3—Click OK at the bottom right and you’re done.
for illustrative purposes only
1
2
3
HOW TO DOODLE WITH TRENDLINESYou can annotate and draw trendlines, Fibonacci retracements, or basically anything you want on your charts.
1—Click on the Drawings tab. 2—Pick your poison (e.g., “Trendline”).
3—Click your mouse button once at the point on the graph you would like the drawing to begin. 4—Move the mouse to the next trend point. Click again and your drawing will appear.
for illustrative purposes only
1
2
for illustrative purposes only
34
05Charting
HO
W T
O T
RA
DE
STO
CK
S ( A
ND
OTH
ER IM
PO
RTA
NT
STU
FF)
HO
W T
O T
RA
DE
STO
CK
S ( A
ND
OTH
ER IM
PO
RTA
NT
STU
FF)

68 HOW TO THINKORSWIM TD AMERITRADE 69
If you need to erase the drawing, simply click on it to highlight, and hit delete on your keyboard. To erase all of them, select the Drawings menu again, and at the bottom, choose Remove Drawings.
So go ahead, play around, customize away. And don’t worry if you forget to save before you hang your hat for the day. thinkorswim keeps your last settings as the default until you revise them.
That said, if you’ve come up with an ingenious set of indicators and don’t want to reprogram them every time you pull up a new chart, you can save it by clicking “Save Study Set” under the Studies tab. Just give it a name, and it will be there the next time you look.
CUSTOMIZING YOUR CHARTSClick the Style tab above the chart and select Settings.
From there, you can customize your chart settings to do a number of things, such as toggling the equity options expirations on/off, turning on the afterhours prices, choosing pretty colors for your up bars, and ugly ones for your down bars. Heck, short of integrating a paint-by-numbers feature, you can pretty much customize it any way you want.
Let’s try adjusting the size of your graph. Still in the Settings window, adjust the time period of the chart with the Time axis. Pictured here is a daily, three-month chart.
To change colors and overall appearance, click the Appearance tab and the software defaults to green bars for upticks and red bars for downticks.
for illustrative purposes only
CONTROL PANEL—PUSHING BUTTONS You may notice all sorts of buttons on the thin bar to the right of each chart.
These turn on a few features that let you see the live markets and place trades all without ever having to navigate away from the chart screen. Here's a quick quide:
for illustrative purposes only
05Charting
HO
W T
O T
RA
DE
STO
CK
S ( A
ND
OTH
ER IM
PO
RTA
NT
STU
FF)
HO
W T
O T
RA
DE
STO
CK
S ( A
ND
OTH
ER IM
PO
RTA
NT
STU
FF)
for illustrative purposes only
Trade
Time & Sales
Active Trader
Big Buttons
Charts
Dashboard
Level 2 Quotes
Live News

70 HOW TO THINKORSWIM TD AMERITRADE 71
HO
W T
O T
RA
DE
( AN
D O
THER
IMP
OR
TAN
T S
TUFF
)
N
L2
DB
C
BTNS
AT
TS
TRD
SYMBOL WHAT IT DOES
Pops up the News screen
Gives you the Level 2 quotes
Opens the Dashboard
Pops up a chart with your preferred settings
Adds a set of order buttons between chart and market boxes
Adds another Active Trader tab
Shows Time and Sales for the chosen position
Adds yet another set of order buttons above your chart
The Flexible Grid is essentially a juiced-up version of Charts. You can access all the regular charts features, but the default view of the four charts at once is only the beginning.
What makes it flexible? Not only can you resize all the graphs in the view, but if you want to go beyond the 32 charts available in the Charts tab, you can add as many charts as you want in a, well, flexible grid of charts, neatly put together. To add and remove charts in the grid:
1—Click the grid icon at the top right of the Flexible Grid screen, then choose Customize grid. 2—A small menu appears in the center of each chart. Select one of the three icons in the menu to
add a chart below, add a chart right, or delete a chart, respectively. 3—Click the sidebar to insert the vertical control panel described earlier.
Flexible Grid
VIEWING MULTIPLE CHARTS AT ONCEAs crazy as it sounds, you can view up to 32 charts at once on the Charts page.
1—At the top right of the Charts page, click the grid icon. 2—Highlight as many boxes as you’d like to see charts on the page. Left-click and lo! You have
multiple charts to compare and contrast.
for illustrative purposes only
Once the charts populate, you can input a symbol and adjust any one of their characteristics individually by selecting the icons above each one.
for illustrative purposes only
12
3
Charts not the right size for your tastes? Simply hover the cursor over any borderline of a chart and drag it until it’s the size you like.
05Charting
HO
W T
O T
RA
DE
STO
CK
S ( A
ND
OTH
ER IM
PO
RTA
NT
STU
FF)
HO
W T
O T
RA
DE
STO
CK
S ( A
ND
OTH
ER IM
PO
RTA
NT
STU
FF)

72 HOW TO THINKORSWIM TD AMERITRADE 73
thinkScript: Create Your Own IndicatorsBack in thinkorswim’s early days, traders clamored for more charting tools like technical studies and strategy testing. Originally, the development team wrote these individual tools in the plat-form’s rather complex programming language. That was great for performance, but clunky for simpler ideas like “subtract the 10-day moving average from the 30-day moving average.”
Today, our programmers can still do it. But why not provide you the capability to do it yourself? Enter thinkScript.
No, thinkScript is not an add-on, plug-in, or something to download. And best of all, you don’t need to be a computer geek to learn it. That means ordinary traders like you and me can learn enough about thinkScript to make our daily tasks a little easier.
LET’S GO SCRIPTIN’ thinkScript is most frequently used on the Charts and the MarketWatch tabs. Think of accessing it the same way you’d add a technical study, because the thinkScript editor that lets you write the thinkScript code exists inside the Chart studies and Quotes pages.
To open thinkScript from the Charts page:1—Click the Edit Studies button. 2—In the lower left corner of the new window that opens up, select New. 3—That opens up a thinkScript editor with a default thinkScript code inside it: “plot Data = close;”.
You can delete that code and start typing in your own. 4—Note the menu of thinkScript commands and functions on the right-hand side of the editor
window. That’s a thinkScript library with quick definitions of each of the functions to help you.
To open thinkScript from the Quotes page:1—On the MarketWatch tab, click Quotes in the top menu.2—From the Quotes page, click on the small gear in the upper right-hand corner and select
Customize from the dropdown menu.3—Scroll down the list of “Available Items” and double-click on one of the numbered Custom
columns to open the same thinkScript editor window that’s on Charts.4—Write your script.5—When you’re done, hit “Apply” to display it on a chart or see it as a column on the Quotes page.
for illustrative purposes only
1
3
2
1
3 4
2
5
for illustrative purposes only
As we mentioned, you can script just about anything you want that’s not in the platform (within reason, of course). To get started, let’s look at an example of one you might want to try.
05Charting
4
HO
W T
O T
RA
DE
STO
CK
S ( A
ND
OTH
ER IM
PO
RTA
NT
STU
FF)
HO
W T
O T
RA
DE
STO
CK
S ( A
ND
OTH
ER IM
PO
RTA
NT
STU
FF)
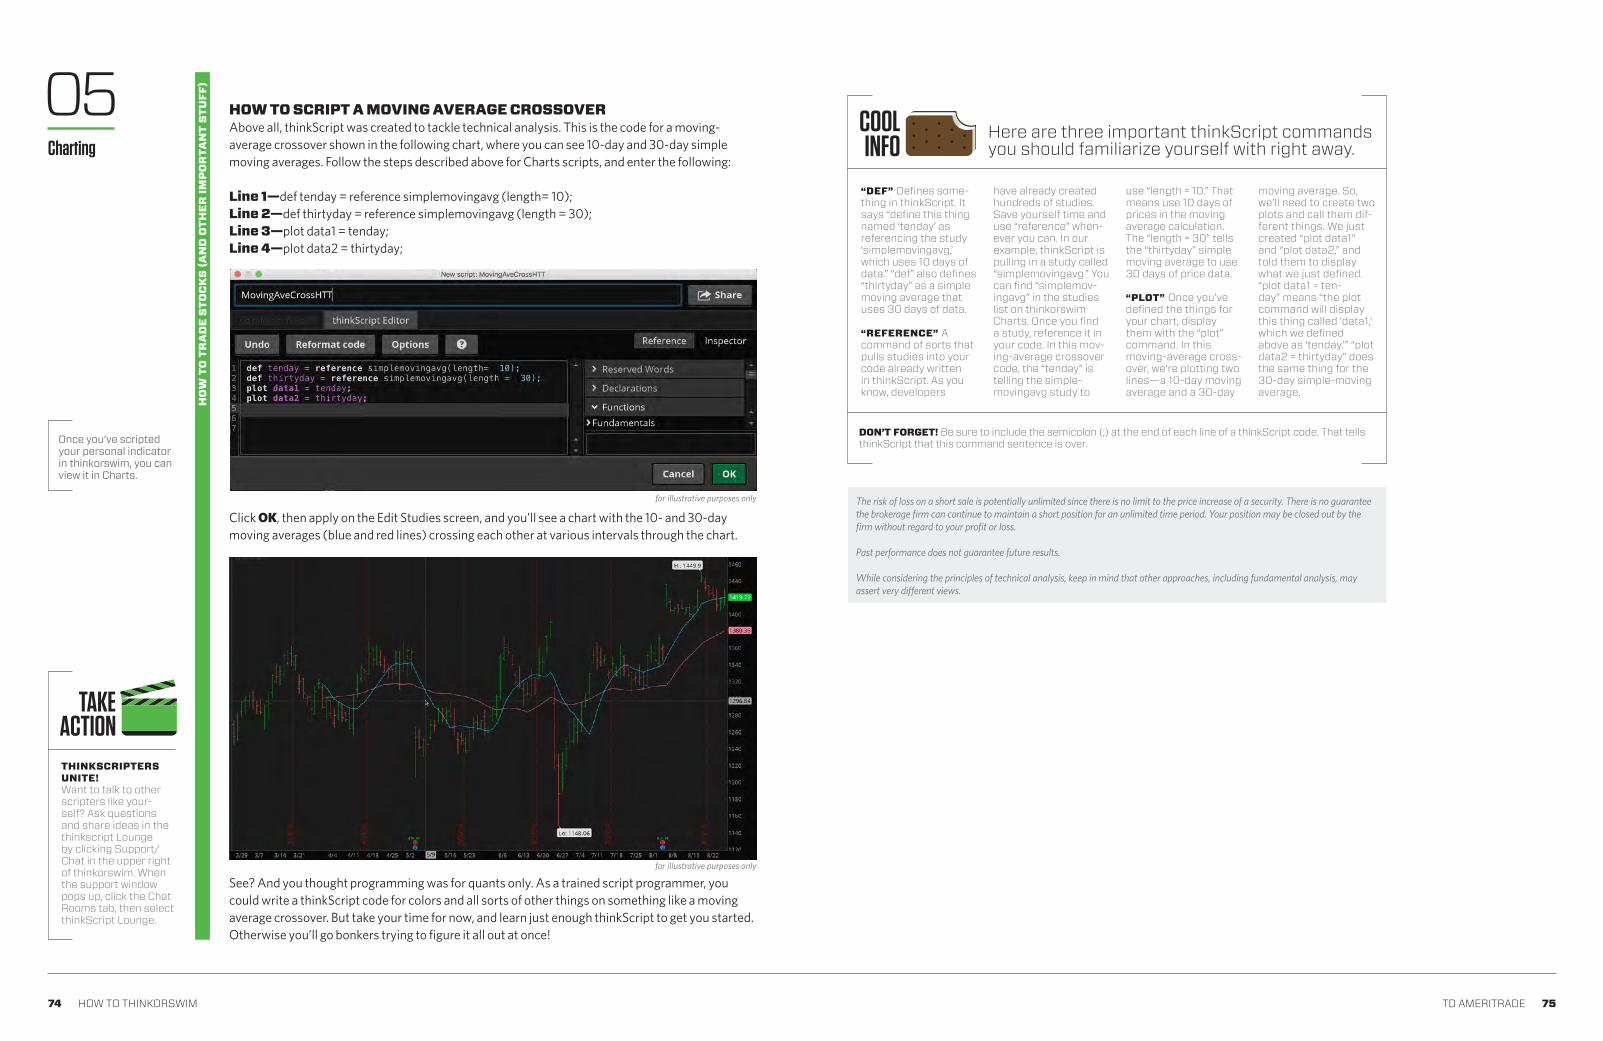
74 HOW TO THINKORSWIM TD AMERITRADE 75
Once you’ve scripted your personal indicator in thinkorswim, you can view it in Charts.
See? And you thought programming was for quants only. As a trained script programmer, you could write a thinkScript code for colors and all sorts of other things on something like a moving average crossover. But take your time for now, and learn just enough thinkScript to get you started. Otherwise you’ll go bonkers trying to figure it all out at once!
for illustrative purposes only
“DEF” Defines some-thing in thinkScript. It says “define this thing named ‘tenday’ as referencing the study ‘simplemovingavg,’ which uses 10 days of data.” “def” also defines “thirtyday” as a simple moving average that uses 30 days of data.
“REFERENCE” A command of sorts that pulls studies into your code already written in thinkScript. As you know, developers
have already created hundreds of studies. Save yourself time and use “reference” when-ever you can. In our example, thinkScript is pulling in a study called “simplemovingavg.” You can find “simplemov-ingavg” in the studies list on thinkorswim Charts. Once you find a study, reference it in your code. In this mov-ing-average crossover code, the “tenday” is telling the simple-movingavg study to
use “length = 10.” That means use 10 days of prices in the moving average calculation. The “length = 30” tells the “thirtyday” simple moving average to use 30 days of price data.
“PLOT” Once you’ve defined the things for your chart, display them with the “plot” command. In this moving-average cross-over, we’re plotting two lines—a 10-day moving average and a 30-day
moving average. So, we’ll need to create two plots and call them dif-ferent things. We just created “plot data1” and “plot data2,” and told them to display what we just defined. “plot data1 = ten-day” means “the plot command will display this thing called ‘data1,’ which we defined above as ‘tenday.’” “plot data2 = thirtyday” does the same thing for the 30-day simple-moving average.
COOLINFO
Here are three important thinkScript commands you should familiarize yourself with right away.
DON’T FORGET! Be sure to include the semicolon (;) at the end of each line of a thinkScript code. That tells thinkScript that this command sentence is over.
HOW TO SCRIPT A MOVING AVERAGE CROSSOVERAbove all, thinkScript was created to tackle technical analysis. This is the code for a moving- average crossover shown in the following chart, where you can see 10-day and 30-day simple moving averages. Follow the steps described above for Charts scripts, and enter the following:
Line 1—def tenday = reference simplemovingavg (length= 10);Line 2—def thirtyday = reference simplemovingavg (length = 30);Line 3—plot data1 = tenday;Line 4—plot data2 = thirtyday;
Click OK, then apply on the Edit Studies screen, and you’ll see a chart with the 10- and 30-day moving averages (blue and red lines) crossing each other at various intervals through the chart.
for illustrative purposes only
05Charting
THINKSCRIPTERS UNITE!Want to talk to other scripters like your-self? Ask questions and share ideas in the thinkscript Lounge by clicking Support/Chat in the upper right of thinkorswim. When the support window pops up, click the Chat Rooms tab, then select thinkScript Lounge.
TAKEACTION
HO
W T
O T
RA
DE
STO
CK
S ( A
ND
OTH
ER IM
PO
RTA
NT
STU
FF)
The risk of loss on a short sale is potentially unlimited since there is no limit to the price increase of a security. There is no guarantee the brokerage firm can continue to maintain a short position for an unlimited time period. Your position may be closed out by the firm without regard to your profit or loss.
Past performance does not guarantee future results.
While considering the principles of technical analysis, keep in mind that other approaches, including fundamental analysis, may assert very different views.
HO
W T
O T
RA
DE
STO
CK
S ( A
ND
OTH
ER IM
PO
RTA
NT
STU
FF)

76 HOW TO THINKORSWIM TD AMERITRADE 77
There’s more to trading than just what’s in front of you. Since you can’t watch everything all the time, thinkorswim has the tools to help you make more informed decisions.
Trade Management
Richard Dennis, a legendary futures trader, talking about rookie traders. He said that new traders are like baby ducks. When a baby duck hatches, it thinks the first thing it sees is its mother. If the first thing it sees is a tugboat, the duckling will follow that tugboat around forever.
Traders can be the same way. The first big market event they experience—whether it’s a market crash and a big loss, or an unending rally and a big profit—they think that’s the way the market al-ways works. And that kind of baby-duck thinking can be lethal to your trading account and portfolio.
If you first start to trade when the market has been rallying for a while, you might think markets just go up all the time. Then when the market crashes, the shock will not only cost you money; it will make you nervous that another crash might happen. This can cripple the way you trade.
The point? As a trader, you learn skills. You gather tools and wisdom and expertise. You study the data. You hone your instincts. You learn to trade what is there, not what you want to be there. You are not at the mercy of the market; you learn to keep your wits about you as you manage risky trades as well as your own expectations so you’ll know what to do should the markets turn. You learn how to plan trades and follow crucial signals before, during, and after a trade.
At the end of the day, it isn’t the direction the stock market is taking that matters, but how you react. Learning to trade is the easy part. Learning to control your anxiety, your fear, your desires, and your hopes is something else entirely.
There are a few tools on thinkorswim to help you remove emotion and trade like a more informed duck: 1—Beta-weighting2—Alerts3—Trades on Charts
There’s a story about
78
79
82
Beta-WeightingAlerts: Automate Your TradingTrades on Charts06
HO
W T
O T
RA
DE
STO
CK
S ( A
ND
OTH
ER IM
PO
RTA
NT
STU
FF)

78 HOW TO THINKORSWIM TD AMERITRADE 79
1
for illustrative purposes only
23
To calculate a potential hedge, if the beta-weighted deltas are positive, you would need to offset those positive deltas with the equivalent number of negative deltas by shorting the stock, buying puts, or some other “short delta” strategy (such as a short vertical options spread, which we will discuss in chapter 7).
You can even create separate groups of stocks, like energy stocks, high-tech stocks, drug stocks, and so on, and beta-weight those separately to their own index symbols. If you right-click on a position in the Position Statement, you can choose to “move to group.” You can create a new group and name it anything you want. Then you can move other stocks to that group.
To get your daily required dose of vitamin D, you might want to be able to step away from your desktop. Of course, you can take thinkorswim Mobile with you. But luckily thinkorswim also makes it easy to set up requests for alerts to notify you of events you deem important. Whether it’s your favorite symbol reaching a certain price level or a corporate action, we’ve got a way to alert you. First, set up the alerting system to notify you when you are away from thinkorswim:
Click on Setup in the top corner of the trading platform, then Application Settings. In the window that pops up, do the following:
1—Select the Notifications tab.2—From here you can enter an email address to receive alerts.3—If you would prefer to get an SMS text message, that option is available, too.4—Once these are set up, in the main area of the window, choose the types of alerts you want to
receive and how you want to receive them.5—Click Apply settings.
Alerts: Automate Your Trading
12
3 4
5for illustrative purposes only
How much risk do you have in your trading portfolio, and how will you hedge it? Don’t know? Find-ing out is the idea behind the beta-weighting tool. Using any optionable stock or index as the common denominator, the beta-weighting tool converts the deltas of your individual posi-tions into stock- or index-equivalent deltas for you. The portfolio delta, then, is the sum of the beta-weighted stock-equivalent deltas. Huh?
For example, when you beta-weight a portfolio against, say, the S&P 500 Index, and it gives you a beta-weighted delta of +1,000 SPXs, theoretically, that portfolio will make or lose $1,000 if the SPX moves up or down one point. So essentially, you would look to offset the +1,000 SPX deltas with 1,000 SPX deltas, using options, futures, or short stock. To see your beta-weighted deltas:
1—In the upper right corner of the Position Statement, check the box next to “Beta Weighting.” A symbol field will open up.
2—Enter your beta-weighting index symbol in that field, such as NDX (NASDAQ 100 Index), and hit enter on your keyboard.
3—You’ll now see the deltas of your positions, as well as the total deltas, converted to the beta-weighted deltas.
Beta-Weighting
06TradeManagement
TRADER JARGON
DELTA A measure of an option’s sensitivity to changes in the price of the underlying asset when all other factors are held constant. Gen-erated by a mathemati-cal model, delta depends on the stock price, strike price, volatility, interest rates, dividends, and time to expiration. Delta also changes as the underlying stock fluctu-ates. See gamma.
For more trader jargon, refer to the glossary, page 176.
HO
W T
O T
RA
DE
STO
CK
S ( A
ND
OTH
ER IM
PO
RTA
NT
STU
FF)
HO
W T
O T
RA
DE
STO
CK
S ( A
ND
OTH
ER IM
PO
RTA
NT
STU
FF)

80 HOW TO THINKORSWIM TD AMERITRADE 81
Now it’s time to set up some alerts.
ALERTS ON PRICE AND OTHER CONDITIONS1—First, click on the MarketWatch tab, then the Alerts subtab. This page will look very similar to
the All Products trading tab. 2—Click on the value in the field you would like to be alerted on. For instance, if the bid reaching a
certain price tickles your fancy, click on the bid. 3—Fill out the alert form that opens with the alert parameters you want. 4—Click Create to set the alert.
ALERTS ON STUDIESPrefer to be alerted on a price crossing over a moving average (or any other study, for that matter)?
1—On the Alerts tab, click on Study Alert on the top right. This will bring up the alert condition wizard.
2—Click on Edit to the far right of the study. 3—Edit the conditions in the new window to your liking, and select Save. 4—To add more conditions, click the big grey Add condition button and configure in the same
manner. 5—Once you have these set up, change the Trigger if section to true.6—Click Create Alert.
1 2
3
4for illustrative purposes only
45 2
31
6for illustrative purposes only
3
1
2
for illustrative purposes only
ALERTS ON EVENTSWant to be alerted on the next corporate action, such as a dividend or upcoming conference call? Mosey on over to the Calendar subtab on the MarketWatch page.
1—You can enter your symbol in the top left, or just click on the day of an event you would like to be reminded about.
2—At the bottom of the page, you should see the event with the description. Clicking anywhere on the description will give you the ability to create an alert.
3—Select how you would like to be notified, then click Create.
06TradeManagement
HO
W T
O T
RA
DE
STO
CK
S ( A
ND
OTH
ER IM
PO
RTA
NT
STU
FF)
HO
W T
O T
RA
DE
STO
CK
S ( A
ND
OTH
ER IM
PO
RTA
NT
STU
FF)

82 HOW TO THINKORSWIM TD AMERITRADE 83
Evaluating your trading should be more detailed than a quick glance at your profit-and-loss num-ber or noting your net liquidation value. These figures are important, but seeing what drove your profits so high is even better information. Once activated, with Trades on Charts, you can see when and where your previous trades took place. To enable this feature, head to the Charts main page.
1—From inside a chart, click on the Style dropdown menu and select Settings. 2—From the Chart Settings window, remain on the General tab and check the Show Trades box.
3—Bubbles will display the price at which the trade was executed, point to the bar when the trade executed, and will follow your defined chart aggregation. So, to see which minute you placed your trade, select a one-minute time interval.
The bubbles will display at the top of the candle for a sell trade and at the bottom of the candle for a buy trade.
The setting is chart-specific, so it will only show the trades for the particular chart and only for the charted product.
Trades on Charts
for illustrative purposes only for illustrative purposes only
06TradeManagement
1
2 3
HO
W T
O T
RA
DE
STO
CK
S ( A
ND
OTH
ER IM
PO
RTA
NT
STU
FF)
HO
W T
O T
RA
DE
STO
CK
S ( A
ND
OTH
ER IM
PO
RTA
NT
STU
FF)

84 HOW TO THINKORSWIM TD AMERITRADE 85
CHAPTER 0786 / Options: The Ultimate PrimerEverything you didn't know you wanted to know about options, but were afraid to ask.
CHAPTER 08 122 / Futures: Not Just for Farmers Anymore Stocks are cool, and so are corn, hogs, and logs. If you don't under-stand futures, you've come to the right place.
CHAPTER 09136 / Forex: All the World's a Trade How do you trade the health of an economy? Try its currency. Let's take things down a notch to show you what's up and how to trade it.
HOW TO TRADE OPTIONS, FUTURES, & FOREXReady to take your trading to the next level? Stocks aren't the only game in town. There's a whole world of asset classes that were untouchable just a few years ago. Today, they're practically a button or two away.
8584 HOW TO THINKORSWIM TD AMERITRADE

86 HOW TO THINKORSWIM TD AMERITRADE 87
TRADER JARGON
Everything you didn’t know you wanted to know about options, but were afraid to ask.
Options: The Ultimate Primer
Introducing Calls and PutsTrade PageVolatility PrimerSpread Trading PrimerVertical SpreadsCalendar SpreadsAnalyze PageAdd Simulated TradesRisk ProfileProbability Analysis
87
94
97
99
101
107
111
112
116
118
an options contract, you may have heard a thing or two about them. After all, as a type of derivative, options can be mysterious and alluring to the average person. It’s true the naysayers are out there; in fact, the stories you may have heard about the risks options can entail are not exaggerated. Options are not for everyone, and options traders who go past their risk tolerance often have the scars to go with their stories. But what they typically don’t understand is that options were designed to function as a tool for transferring risk from one trader to another, not for taking on oodles of risk. In fact, options are primarily used in three ways:
Speculation—Anticipating future price movement. Traders speculate on the future price move of a stock or other asset, or perhaps an index. The goal of traders who speculate with options is to try to gain the highest return possible in the shortest amount of time, using the least amount of capital. Speculation may expose you to greater risk of loss than other investment strategies.
Income—Generating revenue rather than gaining by price appreciation. You may own stock in your portfolio. If so, selling options against your stock is one way to try to generate income.
Temporary protection—Also known as hedging an asset. Buying options contracts may help “protect” your portfolio from a price decline of a specific stock, or maybe even all the stocks in your portfolio, generally for a short period of time. For example, when you purchase a put option, it can provide a form of risk management should the stock’s price decline in the near future.
Whatever your flavor, learning options strategies is one thing. Learning their nuances, and how to manage their risks, is another entirely. So before you trade options, it’s worth getting under the hood to see what makes them purr. Of course, the most important step is to decide if options are for you, and if they are, what risk level is right for you. Even among options traders, who can be a daring bunch, very few choose the highest levels of risk.
Even if you’ve never traded
Introducing Calls and PutsTraders speculate with options because of their leverage. But leverage is a two-way street. Although you could potentially gain more with less capital, on the other hand, with leverage you can also lose more for less because it exposes you to greater risk than other trading strategies. This may not be a big deal when you’re trading one contract. But if you trade a whole bunch more than you should just because you have the capital to do so, or if you trade few contracts but do so frequently, that’s where the trouble starts. So let’s start with the basics.
Calls are option contracts to buy an “underlying” asset like a stock or a future. (In some cases, such as an index, there is no actual underlying asset, in which case the option is “cash-settled.”)
Buy call—The buyer obtains the right (but not the obligation) to purchase the underlying stock or index at a specific price called the “strike price.”
Sell call—The seller of a call assumes the obligation to supply the underlying asset at the strike price if and when the call contract is “exercised” by the buyer. When this happens, the option seller is said to be "assigned."
INTRINSIC VALUE The“real” value of an option,or the amount an optionis in the money.
EXTRINSIC VALUE The “time” value of anoption, based on impliedvolatility and the number of days to expiration. ATM and OTM options consist entirely of time value.
EXERCISE When theowner of an optionexercises the rightsgranted by the optioncontract. In other words,you would buy or sellthe underlying stock theoption controls.
STRIKE PRICE The cost per share at which the holder of an option may buy or sell the underlying security.
ASSIGNED When a trader is forced to buy or sell the underlying because a call or put they sold was exercised, the trader with the obligation to provide or purchase the stock is said to be "assigned."
For more trader jargon, refer to the glossary, page 176.
HO
W T
O T
RA
DE
OP
TIO
NS
, FU
TUR
ES, A
ND
FO
REX07

88 HOW TO THINKORSWIM TD AMERITRADE 89
HO
W T
O T
RA
DE
OP
TIO
NS
, FU
TUR
ES, A
ND
FO
REX
TRADER JARGON
OPTIONS SPEAK Yes, options have their own language, too. Here’s what it all means when placing an order.
ANATOMY OF AN OPTION CHAIN Under the Trade page on thinkorswim, you'll find the option chain, which shows you all the essential information you need in order to choose an option to trade.
“THE MONEY” The strike you buy in relation to where the underlying stock is can make a big difference on a trade’s cost and outcome. Whether to buy an “in-the-money” (ITM), “at-the-money” (ATM), or “out-of-the-money” (OTM) call, for instance, is another important decision because each call or put naturally responds differently to changing conditions. (Note: to help make this as clear as possible, we’ll explain things using stock as the underlying asset.)
An ITM option acts mostly like a stock position (a long stock position for calls; a short stock position for puts), depending on how far ITM it is. Its price will be affected less by time and changes in volatility, and more by the stock price moving up and down. An ITM call may require a smaller rise in the stock price to be profitable, but its percentage gains won’t be as great as those of an ATM or OTM call.
The price of an ATM option is most sensitive to changes in volatility and the passage of time. This can be good or bad depending on how your speculations turn out. And although ATM options are less sensitive than ITM options to stock changes, they’ll change more than OTM options do when the stock moves.
Puts are options to sell a stock, index, or other underlying asset.
Buy put—The buyer obtains the right (but not the obligation) to sell the underlying stock or index at a specific price called the strike price.
Sell put—The seller of a put assumes the obligation to purchase an underlying asset if and when the put contract is “exercised” by the buyer.
Now, if you were to phone in an option order to the Trade Desk, you might say, “I’d like to buy 10 MNKY September 30 160 calls for $2.04.”
ITM & OTM OPTIONS Shaded areas highlight the ITM options, and unshaded show the OTM options. It’s not of-ten that the underlying is exactly the same as a strike price, thus giving you the at-the-money option. For argument’s sake, the strike closest to where the stock is trading can be labeled as the ATM option. Here, that’s the 15 strike.
An OTM option begs for a very large, and quick, move in a stock price. If you get a big enough move in the stock, an OTM call can deliver a much higher percentage profit than an ITM or ATM call. And if the stock price falls dramatically, the loss on the OTM call will be smaller than on an ATM or ITM call in terms of cold, hard dollars. But remember that a big move in price is less likely than a smaller move, and OTM options can expire worthless if the desired move takes place but isn’t big enough.
for illustrative purposes only
Bid price(credit from
sale)Bid
price (cost to buy)
Calls Puts
Expirationmonth
Strike price
Impliedvolatility
ITM calls OTM puts
OTM calls ITM puts
for illustrative purposes only
07Options: The Ultimate Primer
IN THE MONEY (ITM)Calls with a strike price lower than the current stock quote are in the money. Puts with a strike price higher than the current stock quote are in the money.
AT THE MONEY (ATM) An option whose strike is the same as the price of the underlying equity.
OUT OF THE MONEY (OTM) Calls with strike prices higher than the current quote on the underlying are out of the money. Puts with strike prices lower than the current stock or other underlying quote are out of the money.
IMPLIED VOLATILITYThe market’s percep-tion of the futurevolatility of the underly-ing security, directlyreflected in an option’spremium. Impliedvolatility is an annual-ized number expressed as a percentage, is forward-looking, and can change. Volatility typically increases when traders are fear-ful of a decline in stock prices, and typically option premiums rise. When traders are more confident that stock prices will rise, typically option premiums drop.
For more trader jargon, refer to the glossary, page 176.
HO
W T
O T
RA
DE
OP
TIO
NS
, FU
TUR
ES, A
ND
FO
REX
10
MNKY
SEPTEMBER 30
160
CALLS
FOR $2.04
I’d like to buy 10 MNKY September 30 160 calls for $2.04.Number of option contracts.
Stock symbol.
The last day you can trade an option before it expires.
Strike price for the “underlying equity“ (i.e., MNKY); this is the price ($160) at which an option can be excercised.
The type of option (i.e., puts or calls).
Contract price, also known as the premium. Because each con-tract controls 100 shares of stock, you would actually pay $204 per contract to buy this option (plus commissions and fees).
Or you could just place the order online, directly from the thinkorswim Trade page (see below), which features the “option chain” containing all expirations, strikes, and prices of all calls and puts available on the underlying.

90 HOW TO THINKORSWIM TD AMERITRADE 91
THE FOUR PRIMARY OPTION STRATEGIES Each of these strategies is designed to profit from the underlying moving in a particular direction. Your choice depends on a few factors, including stock direction, volatility, and time passing.
The caveat is you have to be confident that the stock price will rise sufficiently before the ex-piration date of the option. Because options expire and stocks don’t, long options traders expose themselves to risks long stock traders never face. You can “sit” on a stock and hope that it will eventually rise in price. You can’t do that with a long option. If the stock price doesn’t rise enough by a certain date, the call option may expire worthless or with a lower price than you originally paid. So, it’s not enough to be bullish on a stock in order to figure out which call to buy.
You may also have to decide, for instance, whether to buy a call with more or fewer days to expira-tion. The effects of volatility and time passing both have a dramatic impact on the price of an option.
Buying a put—The long put is a strategy that profits from a drop in a stock’s price, and like selling stock short, is a “bearish” strategy. To start with, short stock can have high margin re-quirements, meaning you’d have to have a lot of cash or other holdings on hand in your account to put up as collateral to place the trade. And unlike short stock, the risk of a long put is limit-ed to just the premium you paid for the option. Strictly speaking, the potential profit on a long put is the dollar value of its strike price minus the premium of the put, less fees and commis-sions. And, like buying a call, time decay and volatility are two factors that can impact the price (and profitability) of the put.
Selling a call—Shorting a call is a bearish strategy with unlimited risk, in which a call is sold for a credit. The strategy assumes that the stock will stay below the strike sold, in which case, as time passes and/or volatility drops, the option can be bought back cheaper or expire worthless, resulting in a profit. If you’re as-signed on a short call before you have a chance to close out the position, you’re obligated to deliver the underlying shares at the strike price of the option sold.
Shorting a call without holding the underly-ing stock is also referred to as selling “naked.” The position has limited profit potential in exchange for unlimited risk. The most common approach to selling a call may actually be the “covered call,” where the trader owns the stock, and in the event the calls are assigned, the shares already in the account are delivered. In this case the primary risk our trader faces is the risk of the stock being “called away.”
THE BASIC STRATEGIES Let's consider the four basic option positions:
1—Buying a call (long call) 2—Buying a put (long put) 3—Selling a call (short call) 4—Selling a put (short put)
First, note that buying calls or puts doesn’t obligate you to do something, but shorting them (sell-ing options you don’t already own) does. Shorting a call obligates you to sell a stock at the strike price if you’re “assigned” on your option. Shorting a put obligates you to buy a stock at the strike price if assigned.
BUYER (LONG)
SELLER (SHORT)
CALL PUT
Right to buy
Obligation to sell
Right to sell
Obligation to buy
Within all four strategies, you’ll discover trade-offs between your potential risk, the probability of realizing profit, and the size of that potential profit. Generally, the lower the risk or the higher the probability of profit from a given trade, the smaller the potential percentage profit.
As a skilled trader, you’ll learn to balance these trade-offs. For example, an option’s value is contin-uously whittled down with time. There’s a constant battle between the erosion of your option’s value as time passes, and waiting for a favorable move in the stock price or an increase in impliead volatility that will raise the value of the option. Therefore, you need to consider the timing and magnitude of the anticipated change in a stock price. When you trade options, you accept the interplay of these de-cisions as a form of speculation. Now let’s break down each of the four strategies into greater detail.
Buying a call—The long call is the most common and straightforward option position there is because it’s the most like buying a stock, and it’s used to speculate on a bullish move in the underlying. The long call profits from a rise in the stock’s price. Much of what is learned about long calls can be applied else-where. Buying a call usually costs far less than it does to buy an equivalent amount of stock, and the risk is limited to the premium paid for the option.
Many new traders think they are getting a deal by “controlling” 500 shares for the cost of five call contracts, and not having to pay for 500 actual shares of stock. But they miss a larger and critical point: calls decay and ultimately expire; stock does not. If our enthusiastic new options trader buys five at-the-money calls and the stock falls in price 10% at expiration, our new trader has lost 100% and holds nothing, while the trader who bought 500 shares has a 10% loss and still holds 500 shares.
for illustrative purposes only
B R E A K E V E N
Loss
Profit
LONG CALL
STOCK PRICELong 1 XYZ Sep 50 call @ $2.00Total Cost Option premium paid, $200*Maximum Loss Option premium paid, $200*Maximum Profit Unlimited
for illustrative purposes only
B R E A K E V E N
Loss
Profit
LONG PUT
STOCK PRICELong 1 XYZ Sep 40 put @ $1.00Total Cost Option premium paid, $100*Maximum Loss Option premium paid, $100*Maximum Profit Strike price minus premium*
for illustrative purposes only
BREAKEVEN
Loss
Profit
SHORT CALL
STOCK PRICEShort 1 XYZ Sep 50 call @ $2.00Total Credit Received Option premium received, $200*Maximum Loss UnlimitedMaximum Profit Option premium received, $200*
ShortStrike
*Figures do not include commissions and fees.
07Options: The Ultimate Primer
HO
W T
O T
RA
DE
OP
TIO
NS
, FU
TUR
ES, A
ND
FO
REX

92 HOW TO THINKORSWIM TD AMERITRADE 93
TRADER JARGONSelling a put—Shorting a put is a bullish strategy in which a “naked” put is sold for a credit. And although the risk is technically limited to the difference between the strike price and zero, minus the premium, it can still be very high. The strategy assumes that the stock will stay above the strike sold, in which case, as time passes and/or volatility drops, the option can be bought back cheaper or expire worthless, resulting in a profit.
Perhaps the more common approach to put selling is the “cash-secured” put. Here the put seller may not just be okay with the idea of be-ing forced to buy the stock—that may be exact-ly what they want. If the cash is in the account, ready to buy the stock should it be “put to” our trader, then the strategy is not “naked” and is actually a lower-risk approach. Typically the cash-secured put seller is seen less as an adventurous options trader and more as someone attempting to buy the stock. Of course, this has its own risks. Our trader may sell puts and hope to be forced to buy the stock at a lower price, but if the stock goes up, the trader has missed the chance to buy at the prior price. In this example our trader has made a small profit from the premium received from selling puts, but what they really wanted was to acquire the stock at a better price.
Basically, you need to consider the same things as when buying a put, except in reverse. Just remember, a short put has limited profit potential in exchange for relatively high risk.
It’s important to note that short strategies aren’t limited to selling calls and puts. There are different and hedged alternatives to short strategies that we’ll cover later on with vertical spreads.
UNDERSTANDING OPTION PRICING Stocks and options are both priced on a per-share basis, but option contracts control 100 shares of stock (typically, splits can produce options representing an odd number of shares). So, if you see an option that’s listed for $2.50, that’s actually $250. However, since an option derives its price from something else, you may be wondering what that something else is. Yes, part of it is the underlying asset, but what part? Options actually derive their value from seven primary factors:
1 —Price of the underlying 2—Strike price 3—Time to expiration 4—Implied volatility 5—Interest rates 6— Dividends (if any)7—Whether it’s a call or a put
Now although we could fill another book twice this size to explain just how all seven components somehow cobble together to form the price you see, the takeaway is that it’s not one-dimensional like stocks. For example, before expiration, a stock could go up without the value of the call rising, depending on how far out of the money the call is, or what the volatility is doing. Likewise, a put could increase in value without the stock moving at all if volatility rises.
As a rule of thumb, the higher the volatility, the more expensive the option. The more days until expiration, the more expensive the option. (We’ll discuss this further later on.)
For purposes of trading shorter-term options, the impact of interest rates on option prices is minimal. So tuck that in the back of your mind for now.
Just before expiration, an option is worth either nothing, or whatever its intrinsic value is. Gen-erally, option values depend on the stock price, the strike price, the stock price’s implied volatility, the time to expiration, interest rates, and any dividends payable before the option’s expiration.
These days, the markets are pretty efficient, and option prices are actually calculated using an option pricing formula, such as Black-Scholes. Alternative option calculators exist, but who are we kidding? In today’s markets, various option models are all about fractions of a penny and options geekisms that extrapolate beyond where we want to go for today’s lesson.
A BIT ON TIME Shorter-term options (less than 30 days to expiration) have a couple of things going for them. First, they’re cheaper than options with more days to expiration. That means that as a buyer, you’ll have a smaller absolute loss if the stock moves against you (although likely a big-ger loss as a seller). Second, if the stock price moves up, the call will probably have a greater percentage increase in value than one with more days to expiration. So, you might ask, why would you ever consider an option with more days to expiration?
Well, longer-term options (more than 30 days to expiration) have their advantages, too. First, there’s more time for the stock to make a favorable move, particularly if it moves against you at first. You don’t want the stock to make its big move the day after your options expire.
Second, an option with more days to expiration will experience less price erosion as time passes and have a smaller percentage loss if the stock price stays the same or falls.
WASTING TIME As an option approaches its expiration, with each passing day, the value of its decay increases.
for illustrative purposes only
B R E A K E V E N
Loss
Profit
SHORT PUT
STOCK PRICEShort 1 XYZ Sep 40 put @ $1.00Total Credit Received Option premium received, $100*Maximum Loss Strike price minus premium*Maximum Profit Option premium received, $100*
ShortStrike
for illustrative purposes only
TIM
E VA
LUE
PREM
IUM
9 4 1 0
TIME REMAINING UNTIL EXPIRATION(MONTHS)
*Figures do not include commissions and fees.
07Options: The Ultimate Primer
NAKED CALL OR PUT Refers to a short option position that doesn't have an offsetting stock position. For example, a client has a naked call if he sells a call without being long the quantity of stock represented by his short call or long another call spread against it. He has a naked put if he sells a put without being short the quantity of stock represented by his short put or long another put spread against it. Compare to covered call or put.
For more trader jargon, refer to the glossary, page 176.
HO
W T
O T
RA
DE
OP
TIO
NS
, FU
TUR
ES, A
ND
FO
REX

94 HOW TO THINKORSWIM TD AMERITRADE 95
Don't let all the awesomeness of thinkorswim fool you. Yes, there are a lot of buttons you can push, but only a few steps you should know at a minimum to trade options on the platform.
HOW TO VIEW AN OPTION CHAINPull up the Trade tab and select All Products in the top submenu. There, you'll find critical infor-mation about the stock you're trading and its option chain if options are available.
1—Type in the symbol of an optionable stock. 2—Click the arrow to the left of Option Chain to set the chain free. 3—Click the arrow to the left of one of the expiration periods. 4—Set the number of strikes you’d like to see for each expiration (the default is 4). 5—Choose the data view in the dropdown next to Layout to view option greeks, volatility, various
price data, or customize it the way you like. (You can also click on the column header on some-thing other than the Bid or Ask in an existing layout to customize.)
Once you’ve got an option chain up, sit back and admire it. You’ll see all the available expiration periods available, from the front month to the farther months, stacked top to bottom. Each avail-able expiration displays the month or week of the cycle, days to expiration, the number of shares it controls, and the average implied volatility.
When you select the little arrow (>) to the left of any of the expiration periods, you’ll see calls on the left, puts on the right, and strike prices listed down the middle. The shaded region of the options listed indicates in-the-money options, while the unshaded region is—you guessed it—out of the money.
Now that you’ve got the options world at your fingertips, it’s time to learn a few things about placing orders.
HOW TO OPEN AN OPTION TRADEYou won’t find the kitchen sink in thinkorswim, but it really does have everything you need to place an option trade. Here are four steps you need to know.
1—Enter the symbol. Go to the Trade page. In the upper left, fill in the box with the stock symbol and press enter on your keyboard. With the available calls and puts now in front of you, choose the expiration you want.
2—Pick the strategy. Next, click the ask or bid of the option you want to buy or sell. Clicking the asking price creates a long (buy) option order for that strike. Clicking the bid price creates a short (sell) order.
3—Adjust the order. You’ll see your option order at the bottom of the Order Entry section, below the option chain. Select either a market price or a limit price, and if it’s a limit price, adjust the price to what you want. From here, you can also change the quantity of contracts, the strikes, expirations, and so on.
4—Place the order. When you’re happy with the order, click Confirm and Send. The Order Con-firmation Dialog box will give you one last chance to check the details before you click. If all’s good, then hit SEND and wait for a message to pop up confirming when your order has been filled.
EXPLORE YOUR OPTIONS The option chain shown here displays eight strikes of options that expire September 30, 2016.
PUSHING BUTTONS Clicking the ask price of the October 7 expiration 160 call (#2) creates a buy order ticket. From here you can change the order if you want.
for illustrative purposes only
1
2
3
4
5
for illustrative purposes only
1
2
34
07Options: The Ultimate Primer
Trade Page
HO
W T
O T
RA
DE
OP
TIO
NS
, FU
TUR
ES, A
ND
FO
REX

96 HOW TO THINKORSWIM TD AMERITRADE 97
HOW TO CLOSE AN OPTIONS TRADEAs an options trader, you can close out your positions in a number of ways:
1—Let the option expire if it’s out of the money and worthless. 2—Offset the option prior to expiration by buying back options you sold when you opened the
position, or selling long options you bought when you opened the position. Keep in mind there is never a guarantee that an order to close an option position will fill.
3—Exercise the option if it’s in the money. 4—Use an automatic exercise.
If, at expiration, you’re holding an option that is in the money by $0.01 or more, then the Options Clearing Corporation (OCC) will automatically exercise that option on your behalf, unless you tell your broker not to.
If a long call is automatically exercised, then on the next business day after expiration (usually the Monday after expiration Friday) you will have a long stock position. You must pay for the stock at the strike price of the call by the close of the business day. On the other hand, you could elect to sell the stock to help pay for it. You’ll keep any profit, or pay for any loss, to help make up any deficit. Keep in mind that you may incur transaction costs for the assignment and the stock trade that will reduce any profit you may have received.
CALL OPTIONSWHAT CAN HAPPEN AT EXPIRATION PUT OPTIONS
Becomes long stock
Expires worthless
Becomes short stock
Expires worthless
Long option expiring ITM
Long option expiring OTM
Short option expiring ITM
Short option expiring OTM
Becomes short stock
Expires worthless
Becomes long stock
Expires worthless
If you own a put that is being exercised, it will automatically be exercised on the next business day after expiration (usually the Monday after expiration Friday). Unless you already own the shares you’re obligated to sell, you’ll now have a short stock position and will be required to deposit the margin requirement for a short stock position by the close of the business day. Alternatively, to close the short, you could buy the stock back. You’ll keep any profit, or have to pay for any loss. Again, you may incur transaction costs for the assignment and stock trade.
The bottom line? When trading options, you learn to refine your speculation so you incorporate how much you think the stock may move, how much time it will take for the stock to move, and how implied volatility might change. These are all factors in deciding which option strategy you might choose. Ignoring these factors is a major reason why novice option traders can lose money. In the long term, understanding these critical trade-offs will help you understand the overall per-formance of your options positions.
Volatility PrimerSometimes the market moves a little. Sometimes the market moves a lot. Why? It might be po-litical unrest in the Middle East. It might be earnings season. It might be the release of economic data. Or TV’s talking heads may have found a story they can link to the day’s up, down, or stagnant market. In a word, yawn.
Volatility—the magnitude of price change in a stock or index—happens. The change might seem high or low. But no matter what volatility has done, will do, or is doing right now, as a trader, you keep looking for potential opportunities. What you don’t do is scratch your head trying to fig-ure out the cause while waiting around for the perfect volatility scenario to arrive. Why? Because that perfect moment doesn’t exist.
Imagine you’re shooting an arrow at a target in the wind. The wind will push the arrow a little bit to the left or right depending on its direction. But you don’t pack up and go home. You aim the arrow a little bit left or right to account for the wind’s velocity to hit your target. Trading in the context, and presence, of volatility means you may need to adjust your trading strategy like you did with the wind.
The goal here is to flatten your learning curve, get you smarter and more comfortable, and help you be more confident when dealing with volatility—the trading world’s inevitable prevailing winds.
VOLATILITY-SPEAK Since we can’t avoid the big words, first, here are the two most common types of volatility you’ll hear thrown around in options circles.
Implied volatility—In the simplest terms, implied volatility is the market’s overall perception of the future volatility of an underlying security, and is directly reflected in an option’s premium, or price. Implied volatility, expressed as an annualized number, is forward-looking and can change. Implied volatility is available only for options. Stocks don’t have it. Neither do futures. Likewise, implied volatility is based solely on current data. It’s not backward-looking. And traders use it to estimate the potential volatility of an underlying stock or index into the future. How far in the future? Well, an option is only interested in the underlying stock until expiration, even though it’s based on a one-year time frame mathematically.
ROLLING EXITS There’s another way to exit a trade that involves “rolling” your options from one month to the next, which we'll discuss in greater depth in chapter 7.
THE STRATEGY ROLLER makes it easier to automate your rolling strategy. You can find Strategy Roller in the submenu under the Monitor tab.
COOLINFO
07Options: The Ultimate Primer
HO
W T
O T
RA
DE
OP
TIO
NS
, FU
TUR
ES, A
ND
FO
REX

98 HOW TO THINKORSWIM TD AMERITRADE 99
TRADER JARGON
For example, looking at XYZ again, by clicking the dropdown menu “Today's Options Statistics,” you can see the implied volatility and current IV percentile numbers. Because XYZ at 150.71% implied volatility is trading at the top 80% of its 52-week range, you might infer that it’s a bit on the high side. High-volatility scenarios are typically better suited to strategies involving short options that are designed to profit from time decay, such as the short call or put, or the safer alternative, the short vertical spread (later in this chapter). Were its current volatility in the bottom, say, 25% of its 52-week range, you might implement a long option strategy such as buying a call or a long vertical spread.
Bear in mind, too, that if an option has more time to expiration, it’s more sensitive to volatil-ity changes. Specifically, strategies that involve shorting options may generate smaller credits with lower volatility. Because the credit comprises the potential profit for those trades, lower volatility makes the maximum risk higher and potential profit lower, given the same strike prices and days to expiration.
On the other hand, strategies like long calendar spreads can have lower debits with low volatili-ty that decreases their maximum risk. When volatility is lower, a trader may bias her trades toward doing more calendar spreads, say, and fewer short verticals. When volatility is higher, she may put on fewer calendar spreads and more short verticals.
Looking at an option from one expiration to the next, you may see that the implied volatility of an at-the-money option is higher in a near-term expiration than in a further-term expiration (see below) when there’s press—like an earnings or news announcement—creating short-term un-certainty. When the news comes out, the stock might have a lot of large price changes in the short term, but then settles once the news is absorbed in the longer term.
The implied volatility of options in different expirations can reflect these variations. Think of the volatility wind filling up an option’s extrinsic value like a balloon. When there’s lots of uncertainty, the wind picks up and the balloon gets bigger, just like extrinsic value. When the uncertainty dies down, so does the wind, and the balloon deflates, just like extrinsic value.
Historical volatility—Historical volatility is based on the stock or index price over some period of time in the past. It looks at a stock price’s percentage change from one period to the next, whether that period is a year, a day, or a minute. Historical volatility is the standard devia-tion (the dispersion of data from its mean) of those percentage changes. It indicates the mag-nitude of the percentage price changes in the past. The challenge with historical volatility is the amount of past data you might use in your calculation.
VOLATILITY FOR STRATEGY SELECTION Perhaps you feel ready to trade and aim for the bull’s-eye, but despite knowing what direction you think the stock is headed, the volatility wind is blowing. How might you accommodate it in decid-ing which strategy to trade?
In a word, keep it simple as you work to understand how volatility can affect options prices. All things equal, higher volatility means an option’s extrinsic (time) value is higher. Conversely, lower volatility means an option’s time value is lower. How do you know if it’s high or low? You can look at the options statistics data in the Trade page of thinkorswim.
Spread Trading Primerfor illustrative purposes only
As an options trader, your future success is largely based on an ability to create strategies de-signed to not only address specific market concerns, but also exploit identified market conditions. As tools, options spreads can help you develop a customized trading approach.
For instance, if you’re concerned implied volatility is too high, there are spreads designed to help provide some protection. On the other hand, if you’re feeling aggressive, there are spreads designed to attack a high-volatility environment. Regardless of market conditions and whether you’re thinking offense or defense, there’s a spread to fit your style and your goals.
A spread is simply a combination of more than one option in a single position. Vertical spreads and calendar spreads—strategies we’ll cover later in this chapter—tuck up nicely under the um-brella of spreads. Initially, you may think that combining options simply creates more work. After all, why trade spreads when calls and puts are simpler? Well, single-option strategies certainly have their place. But as it turns out, spreads help to mitigate many of the risks inherent in single op-tions—risks like changes in volatility and time decay, as well as margin and capital requirements.
Spreads offer a variety of choices should you want to speculate on trending or range-bound markets, and even for income. Of course, there’s a price to pay for all these wonderful benefits. A spread that lowers your overall cost may also lower your maximum potential reward. One that helps you profit from a large potential move may also have greater time decay. However, spreads can help you stay flexible while creating custom trades. So they may make the trade-offs well worth considering.
IMPLIED VOLATILITY HELP Understanding where current volatility sits compared to its recent range (yellow box, lower left) along with how each expiration’s av-erage implied volatility (yellow boxes, right) is behaving relative to the others, will help you create your strategy.
07Options: The Ultimate Primer
HISTORICAL VOLATILITY The annualized standard deviation of percentage changes in the price of a stock over a specific period. Compare to implied volatility.
For more trader jargon, refer to the glossary, page 176.
HO
W T
O T
RA
DE
OP
TIO
NS
, FU
TUR
ES, A
ND
FO
REX
Arrowdown
watchlist
Average implied
volatility with dollar valueVolatility
stats for current, high, low,
and current percentile
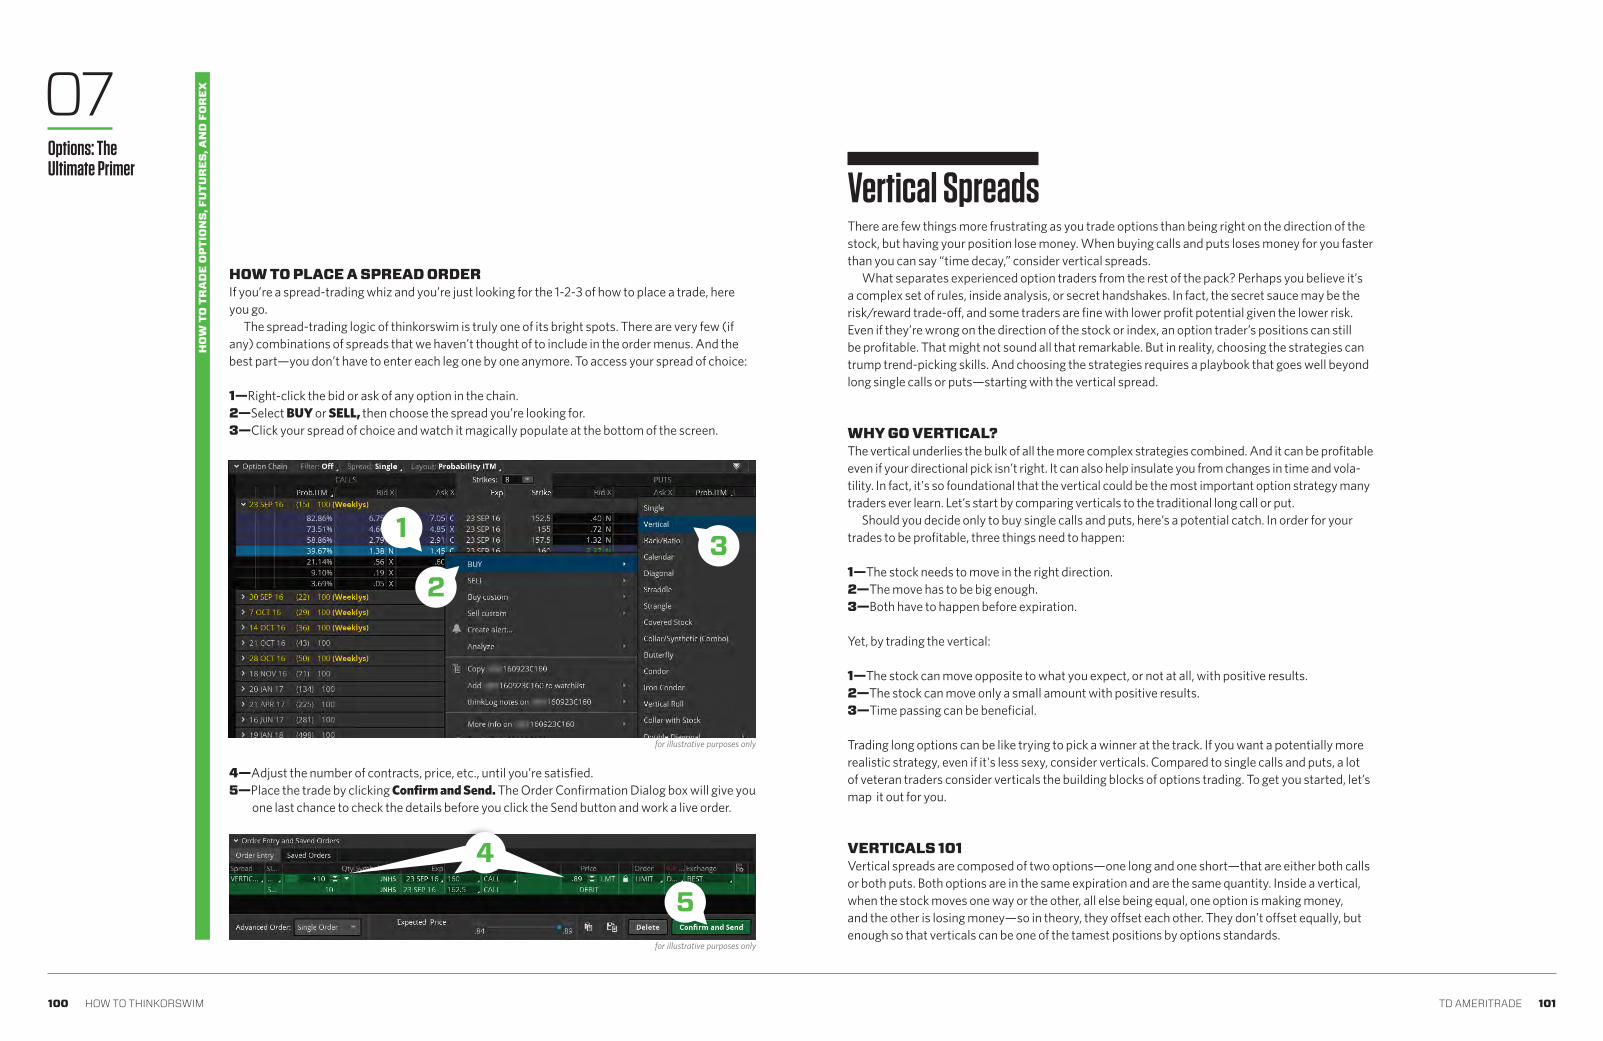
100 HOW TO THINKORSWIM TD AMERITRADE 101
HOW TO PLACE A SPREAD ORDERIf you’re a spread-trading whiz and you’re just looking for the 1-2-3 of how to place a trade, here you go.
The spread-trading logic of thinkorswim is truly one of its bright spots. There are very few (if any) combinations of spreads that we haven’t thought of to include in the order menus. And the best part—you don’t have to enter each leg one by one anymore. To access your spread of choice:
1—Right-click the bid or ask of any option in the chain. 2—Select BUY or SELL, then choose the spread you’re looking for. 3—Click your spread of choice and watch it magically populate at the bottom of the screen.
4—Adjust the number of contracts, price, etc., until you’re satisfied. 5—Place the trade by clicking Confirm and Send. The Order Confirmation Dialog box will give you
one last chance to check the details before you click the Send button and work a live order.
There are few things more frustrating as you trade options than being right on the direction of the stock, but having your position lose money. When buying calls and puts loses money for you faster than you can say “time decay,” consider vertical spreads.
What separates experienced option traders from the rest of the pack? Perhaps you believe it’s a complex set of rules, inside analysis, or secret handshakes. In fact, the secret sauce may be the risk/reward trade-off, and some traders are fine with lower profit potential given the lower risk. Even if they’re wrong on the direction of the stock or index, an option trader’s positions can still be profitable. That might not sound all that remarkable. But in reality, choosing the strategies can trump trend-picking skills. And choosing the strategies requires a playbook that goes well beyond long single calls or puts—starting with the vertical spread.
WHY GO VERTICAL? The vertical underlies the bulk of all the more complex strategies combined. And it can be profitable even if your directional pick isn’t right. It can also help insulate you from changes in time and vola-tility. In fact, it's so foundational that the vertical could be the most important option strategy many traders ever learn. Let’s start by comparing verticals to the traditional long call or put.
Should you decide only to buy single calls and puts, here’s a potential catch. In order for your trades to be profitable, three things need to happen:
1—The stock needs to move in the right direction. 2—The move has to be big enough. 3—Both have to happen before expiration.
Yet, by trading the vertical:
1—The stock can move opposite to what you expect, or not at all, with positive results. 2—The stock can move only a small amount with positive results. 3—Time passing can be beneficial.
Trading long options can be like trying to pick a winner at the track. If you want a potentially more realistic strategy, even if it's less sexy, consider verticals. Compared to single calls and puts, a lot of veteran traders consider verticals the building blocks of options trading. To get you started, let’s map it out for you.
VERTICALS 101 Vertical spreads are composed of two options—one long and one short—that are either both calls or both puts. Both options are in the same expiration and are the same quantity. Inside a vertical, when the stock moves one way or the other, all else being equal, one option is making money, and the other is losing money—so in theory, they offset each other. They don’t offset equally, but enough so that verticals can be one of the tamest positions by options standards.
Vertical Spreads
1
23
for illustrative purposes only
4
5for illustrative purposes only
07Options: The Ultimate Primer
HO
W T
O T
RA
DE
OP
TIO
NS
, FU
TUR
ES, A
ND
FO
REX
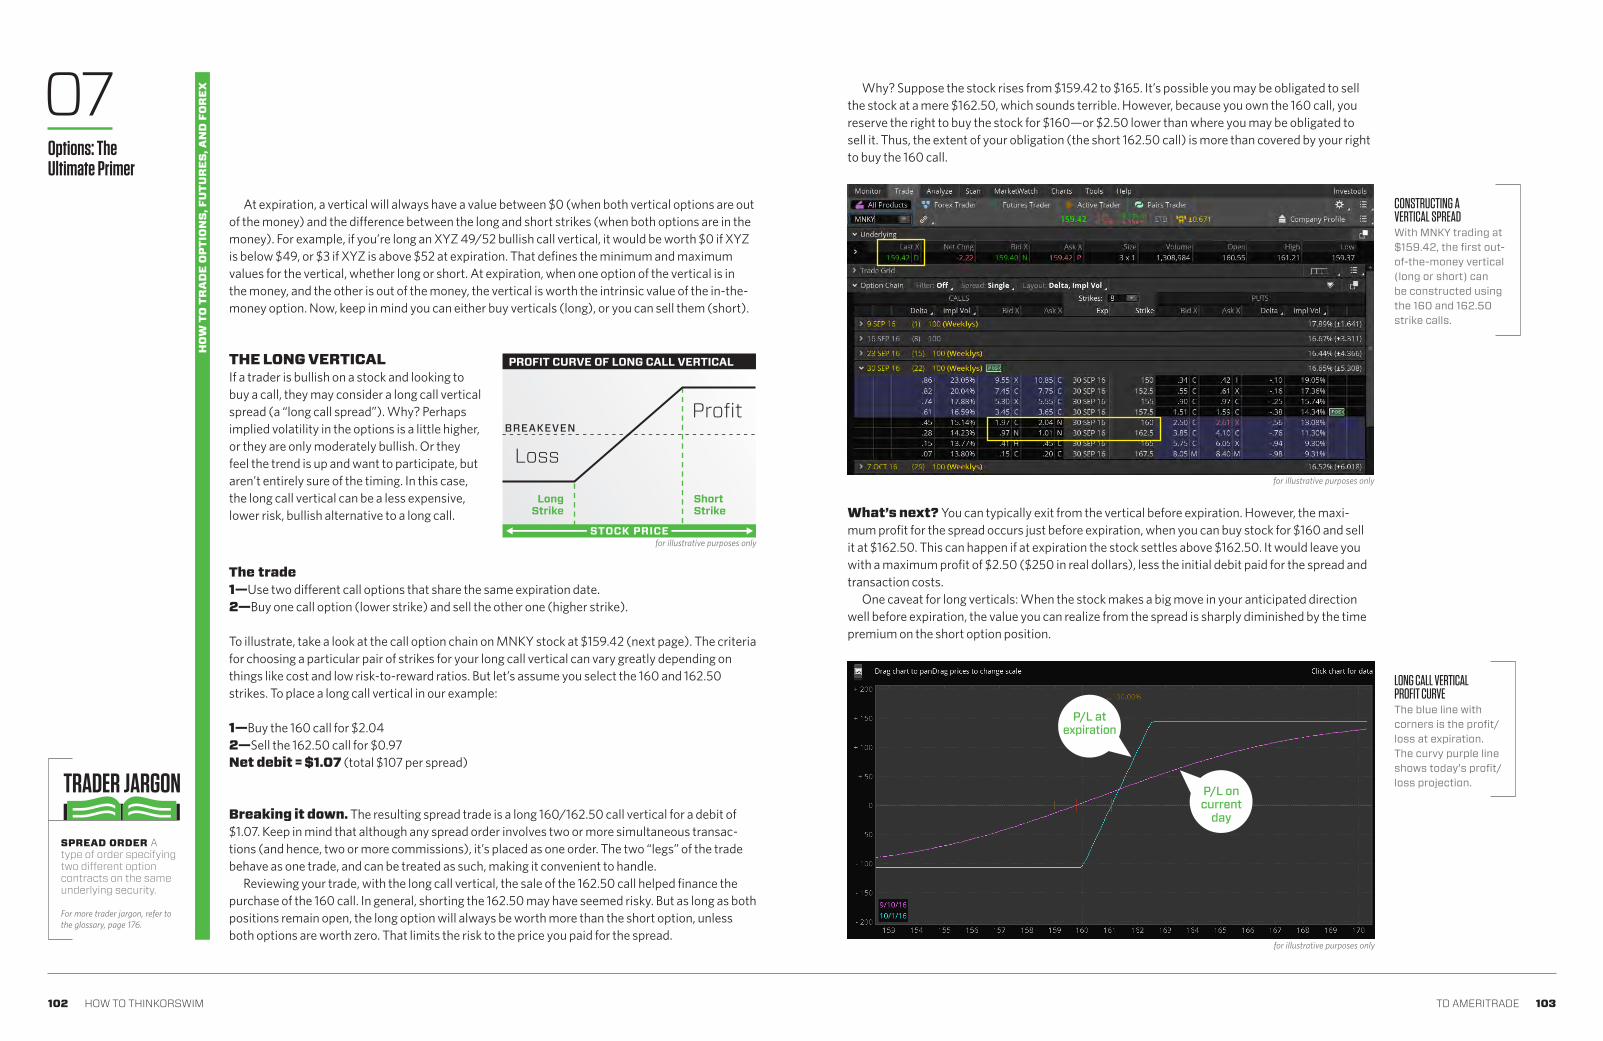
102 HOW TO THINKORSWIM TD AMERITRADE 103
TRADER JARGON
At expiration, a vertical will always have a value between $0 (when both vertical options are out of the money) and the difference between the long and short strikes (when both options are in the money). For example, if you’re long an XYZ 49/52 bullish call vertical, it would be worth $0 if XYZ is below $49, or $3 if XYZ is above $52 at expiration. That defines the minimum and maximum values for the vertical, whether long or short. At expiration, when one option of the vertical is in the money, and the other is out of the money, the vertical is worth the intrinsic value of the in-the-money option. Now, keep in mind you can either buy verticals (long), or you can sell them (short).
THE LONG VERTICALIf a trader is bullish on a stock and looking to buy a call, they may consider a long call vertical spread (a “long call spread”). Why? Perhaps implied volatility in the options is a little higher, or they are only moderately bullish. Or they feel the trend is up and want to participate, but aren’t entirely sure of the timing. In this case, the long call vertical can be a less expensive, lower risk, bullish alternative to a long call.
The trade1—Use two different call options that share the same expiration date. 2—Buy one call option (lower strike) and sell the other one (higher strike).
To illustrate, take a look at the call option chain on MNKY stock at $159.42 (next page). The criteria for choosing a particular pair of strikes for your long call vertical can vary greatly depending on things like cost and low risk-to-reward ratios. But let’s assume you select the 160 and 162.50 strikes. To place a long call vertical in our example:
1—Buy the 160 call for $2.04 2—Sell the 162.50 call for $0.97 Net debit = $1.07 (total $107 per spread)
Breaking it down. The resulting spread trade is a long 160/162.50 call vertical for a debit of $1.07. Keep in mind that although any spread order involves two or more simultaneous transac-tions (and hence, two or more commissions), it’s placed as one order. The two “legs” of the trade behave as one trade, and can be treated as such, making it convenient to handle.
Reviewing your trade, with the long call vertical, the sale of the 162.50 call helped finance the purchase of the 160 call. In general, shorting the 162.50 may have seemed risky. But as long as both positions remain open, the long option will always be worth more than the short option, unless both options are worth zero. That limits the risk to the price you paid for the spread.
What’s next? You can typically exit from the vertical before expiration. However, the maxi-mum profit for the spread occurs just before expiration, when you can buy stock for $160 and sell it at $162.50. This can happen if at expiration the stock settles above $162.50. It would leave you with a maximum profit of $2.50 ($250 in real dollars), less the initial debit paid for the spread and transaction costs.
One caveat for long verticals: When the stock makes a big move in your anticipated direction well before expiration, the value you can realize from the spread is sharply diminished by the time premium on the short option position.
Why? Suppose the stock rises from $159.42 to $165. It’s possible you may be obligated to sell the stock at a mere $162.50, which sounds terrible. However, because you own the 160 call, you reserve the right to buy the stock for $160—or $2.50 lower than where you may be obligated to sell it. Thus, the extent of your obligation (the short 162.50 call) is more than covered by your right to buy the 160 call.
CONSTRUCTING A VERTICAL SPREADWith MNKY trading at $159.42, the first out-of-the-money vertical (long or short) can be constructed using the 160 and 162.50 strike calls.
LONG CALL VERTICAL PROFIT CURVE The blue line with corners is the profit/loss at expiration. The curvy purple line shows today’s profit/loss projection.
for illustrative purposes only
for illustrative purposes only
P/L at expiration
P/L on current
day
PROFIT CURVE OF LONG CALL VERTICAL
Loss
Profit
STOCK PRICE
LongStrike
ShortStrike
BREAKEVEN
for illustrative purposes only
07Options: The Ultimate Primer
SPREAD ORDER A type of order specifying two different option contracts on the same underlying security.
For more trader jargon, refer to the glossary, page 176.
HO
W T
O T
RA
DE
OP
TIO
NS
, FU
TUR
ES, A
ND
FO
REX

104 HOW TO THINKORSWIM TD AMERITRADE 105
TRADER JARGON
THE SHORT VERTICALThe short call vertical (“short call spread”) serves as a bearish, lower-risk alternative to the naked short call, since your risk is defined—particularly when implied volatility on the options is running high. It has similar guide-lines to those for the long call vertical, but with one key difference: the call option you sell has a lower strike than the one you buy. Refer to the short call vertical's risk profile to the right. Notice the position of the strikes.
The trade 1—Use two different call options that share the same expiration date. 2—Sell one call option (lower strike) and buy a higher strike call option as your hedge.
Using the same option chain from before, suppose you wanted to sell a bearish call vertical (i.e., short vertical). You might look to sell the first out-of-the-money vertical from where the stock price sits. In this example, with the stock at $159.42, the short 160/162.50 call vertical sells for $0.96 per spread. To sell this spread, you would:
1—Sell the 160 call for $1.97 2—Buy the 162.50 call for $1.01 Net credit = $0.96 (total $96 per spread)
Breaking it down. Now you’ve constructed the short 160/162.50 call spread for a credit of $0.96. Said another way, you have sold the 160/162.50 call spread at $0.96. Because you’re shorting the 160 call, you have the obligation to sell the stock at $160 (if assigned). Then, by purchasing the 162.50 call, you’ve gained the right to purchase the stock for $162.50. This is your hedge against the short call. Notice that the $2.50 difference in your obligation (short call) is not completely covered by the extent of your right (the long 162.50 call). Therefore, your potential risk in the trade is the difference between the strikes, less the credit received, or $1.54 ($2.50 – $0.96). Keep in mind there will be transaction costs associated with both options trades as well.
What’s next? The maximum profit on a short spread (the net credit) is usually achieved when the spread expires worthless. For the short 160/162.50 call spread, this would occur if at expiration the stock settles at, or below, a price of $160. (See the profit curve, previous page.) A short vertical doesn’t have to be overly bearish for it to potentially work. In fact, since your breakeven on the trade at expiration is $160.96, from the current price of $159.42, MNKY can move lower, remain at $159.42, or even trade a little higher—so there’s “action” in all three directions.
What happens at expiration? If both options are in the money by at least $0.01 at the close of trading on expiration day, and you haven’t closed out your position, the stock shares from the automatic long option exercise will offset the stock shares from the likelihood of the short option assignment. So, you wouldn’t have any stock position after expiration. But if the stock is in between the vertical strikes at expiration, the in-the-money option will deliver either long or short shares to your account, depending on whether it’s a long or short call or put. If you don’t want shares in your account, you’ll have to either close the in-the-money option, or the entire vertical, before the end of trading at expiration. Keep in mind that if you close just one leg, you may have to watch the other all the way though to expiration to avoid any surprises.
A VERTICAL PLAYBOOKThe downside to verticals? They can generate commissions, contract fees, and exercise and assignment fees for both options. Plus, they have limited profit potential and, like all options, they expire—which, as you’ll need to regularly open and close new portfolio positions, can make it difficult to maintain exposure in a particular stock or index.
But if you decide verticals might play a role in your strategy, how do you decide between a long call vertical, short put vertical, long put vertical, or short call vertical? And how do you pick the strikes? It’s not a question of which is “best,” but drilling down on one of two things:
1—What’s your bullish or bearish outlook for the stock? 2—Is volatility relatively high or low?
Consider an elementary verticals playbook. In general, traders tend to short out-of-the-money verticals when volatility is high, and they’re less confident on directional bias. The out-of-the-mon-ey vertical gives more “room” for the stock to move against you and still be potentially profitable.
In general, traders buy at-the-money verticals when volatility is lower and they’re more con-fident on directional bias. The at-the-money vertical responds more directly to a stock’s price change because its delta is higher than an out-of-the money vertical.
Of course, if the trader’s directional bias is wrong, the at-the-money vertical will lose money more quickly if the stock moves against it. Once you choose a long or short, call or put vertical, you can then select the long and short strikes to match how much you think the stock might move, how much risk you’re willing to take on, and how much capital is required.
P/L at expiration
P/L on current
day
for illustrative purposes only
The profit curve on the thinkorswim trading platform.
SHORT CALL VERTICAL
Loss
Profit
STOCK PRICE
LongStrike
ShortStrike
B R E A K E V E N
for illustrative purposes only
07Options: The Ultimate Primer
BREAKEVEN The stock price(s) at which an option position generates neither a profit nor a loss. An option position's breakeven point(s) are generally calculated for the options' expiration date. Option pricing models can be used to calculate a position's breakeven point before the options' expiration date.
For more trader jargon, refer to the glossary, page 176.
HO
W T
O T
RA
DE
OP
TIO
NS
, FU
TUR
ES, A
ND
FO
REX

106 HOW TO THINKORSWIM TD AMERITRADE 107
TRADER JARGON
HOW TO PLACE A VERTICAL ORDEROne of the most important and popular features on the thinkorswim platform is the spread order entry. Creating an order takes but a few seconds and a few clicks.
1—Enter the symbol. Go to the Trade page. In the upper left, fill in the box with the stock sym-bol and press enter. With the available calls and puts now in front of you, choose the expiration you want.
2—Pick the strategy. Next, right-click the ask or bid of the option you want to buy or sell and in the menu that opens up (right), scroll down and choose BUY, then Vertical.
Stocks move up. Stocks move down. But a lot of the time, they’re not doing much of anything. If you’re looking for a way to trade a stock you see as stuck in a range, consider a calendar spread.
Imagine if you could profit when nothing happens. That’s exactly what a calendar spread is de-signed to do. And the nice thing is, you don’t have to hit a bull’s-eye on price. You put on a calendar when you think the stock or index is going to trade in a certain range for a period of time. As long as the stock cooperates and volatility remains stable, the calendar profits from something that, as option traders, we both fear and need—the passage of time.
Calendar Spreads
PITCHING TENTS A long calendar spread is the simultaneous sale of a near-term call or put and the purchase of a far-term call or put of the same strike price. The long and short options in a calendar spread are either both calls or both puts, and are designed to collect the theta decay of the short option in the spread while maximizing the time value of the longer-term option.
Because of the unique nature of the two op-tions, the potential profit zone generally looks like a “tent” in its risk/reward profile.
CALENDAR SPREAD PROFIT CURVE
Profit
STOCK PRICE
B R E A K E V E N
Loss Loss
for illustrative purposes only
1
2
for illustrative purposes only
3
4for illustrative purposes only
3—Adjust the order. You’ll see your vertical order at the bottom of the Order Entry section (see image, next page) below the option chain. From here, you can change the quantity of spreads, the strikes, expirations, and so on.
4—Place the order. When you’re happy with the spread, click Confirm and Send. The Order Confirmation Dialog box will give you one last chance to check the details before you click the Send button and work a live order.
07Options: The Ultimate Primer
CALENDAR SPREAD An option position composed of either only calls or only puts, with the purchase or sale of an option with a nearby expiration offset by the purchase or sale of an option with the same strike price, but a more distant expiration. The options are on the same stock and have the same strike price. The quantity of long options and the quanti-ty of short options net to zero. For example, long the AUG/NOV 65 call calendar spread is short one August 65 call and long one November 65 call.
THETA An approxima-tion of the decrease in the price of an option over a period of time when all other factors are held constant. Theta is generally expressed on a daily basis. For example, if a call has a price of $3 and a theta of 0.10, one day later, with all else unchanged, the call would have a price of $2.90 ($3 – [0.10 x 1]). Generated by a mathematical model, theta depends on the stock price, strike price, volatility, interest rates, dividends, and time to expiration.
For more trader jargon, refer to the glossary, page 176.
HO
W T
O T
RA
DE
OP
TIO
NS
, FU
TUR
ES, A
ND
FO
REX

108 HOW TO THINKORSWIM TD AMERITRADE 109
for illustrative purposes only
Long calendar spreads, also referred to as “time spreads” or “horizontal spreads,” can be posi-tioned as a market-neutral strategy (range-bound trade) that benefits from time decay, or even to speculate on market direction. You simply pick the strike price where you believe the underlying will close at the expiration of the near-term option, and the trade profits if you are right.
Along with verticals, the long calendar spread is one of the basic spread positions that is used by options traders of many experience levels, and is a component of more complex spreads. Long calendars feature low capital requirements, zero margin, defined risk, wide profit ranges, and possible opportunities to collect premium from “rolling” the short front-month options forward (which we will cover in a bit).
To illustrate, take a look at the put option chain below on MNKY stock, trading at $159. If you think MNKY might trade sideways for a while, and stay around $160 by September 30 expi-ration, you might look to trade the September 30/October 14 at-the-money put calendar spread.
1—Buy the October 14 160 put for $3.55 2—Sell the September 30 160 put for $2.73 Total debit = $0.82 (or $82 per spread)
SOMETHING FOR NOTHING How do you profit from the passage of time? In a word, theta—rate of change of an option as each day passes. If, as expected, the shorter-term option decays at a faster rate than the longer-term option, the spread “widens,” and you may be able to close out the spread for a profit.
As the risk profile on the next page shows, all things equal, were MNKY to finish at $160 at the short option’s expiration, your short option would be worth $0, while the long option might have decayed only $1.58, and now have a value of $1.97. Since your original cost of the trade was $0.82, and the long option can now be sold for $1.97, your profit is $1.15 ($115, less commissions and fees). It’s not always this perfect, but you get the idea.
Maximum profit—The calendar spread will be worth the most money when the stock is at the same price as the strike selected (160) at expiration of the front-month option (September 30). This is when the front-month short option expires worthless, and the back-month long option (October 14) has the greatest time (extrinsic) value, as it’s the at-the-money option. If the underlying price doesn’t settle exactly at the strike price, any intrinsic value would be canceled out because both options have the same strike price. The value of the calendar spread depends on its implied volatility, expiration date, and movement of the underlying, which all change over time.
To push the potential of the calendar even further, you could roll the short option to the next month. Rolling is the process of buying back the short option near expiration and simultaneously selling the next expiration period’s same strike option. When a calendar spread is purchased and there is more than one expiration period separating the short and long options, the profit of a cal-endar spread might be augmented by “rolling” the short front-expiring option to the next expira-tion period for a credit.
LONG PUT CALENDAR PROFIT CURVE It’s hard to know exactly how a calendar will pan out. But with inputs specific to your positions, the thinkorswim platform can paint a clearer picture of how your position may pan out by plotting a hypothetical profit curve of the trade between inception and expiration of the short option.
for illustrative purposes only
P/L at expiration
P/L on current
day
CONSTRUCTING A CALENDAR SPREAD The 160-strike Sep 30/Oct 14 at-the-money put calendar is purchased by selling the September 30 160-strike put and buying the October 14 160-strike put.
BREAKING DOWN A CALENDAR SPREADRegarding long calen-dars on equities, note the following:
The time value of an option is the highest when it’s at the money (160 strike). So, the calendar spread is worth the most money when it closes at the money of the near-term short option.
The calendar spread is worth approximately the same if the selected strike closes an equal distance in or out of the money. So the spread is worth the same if the stock is at 155 or at 165 at expiration.
If, in the MNKY trade, you paid $0.56 for this calendar spread, you can see that you would likely profit if the stock is between approximately $30.50 and $33.50 at expiration of the near-term option.
Because both options use the same strike prices, any intrinsic value will be the same for both. They will cancel each other out because you are buying one option and selling the other. Remember, you can only make money on time value.
07Options: The Ultimate Primer
HO
W T
O T
RA
DE
OP
TIO
NS
, FU
TUR
ES, A
ND
FO
REX
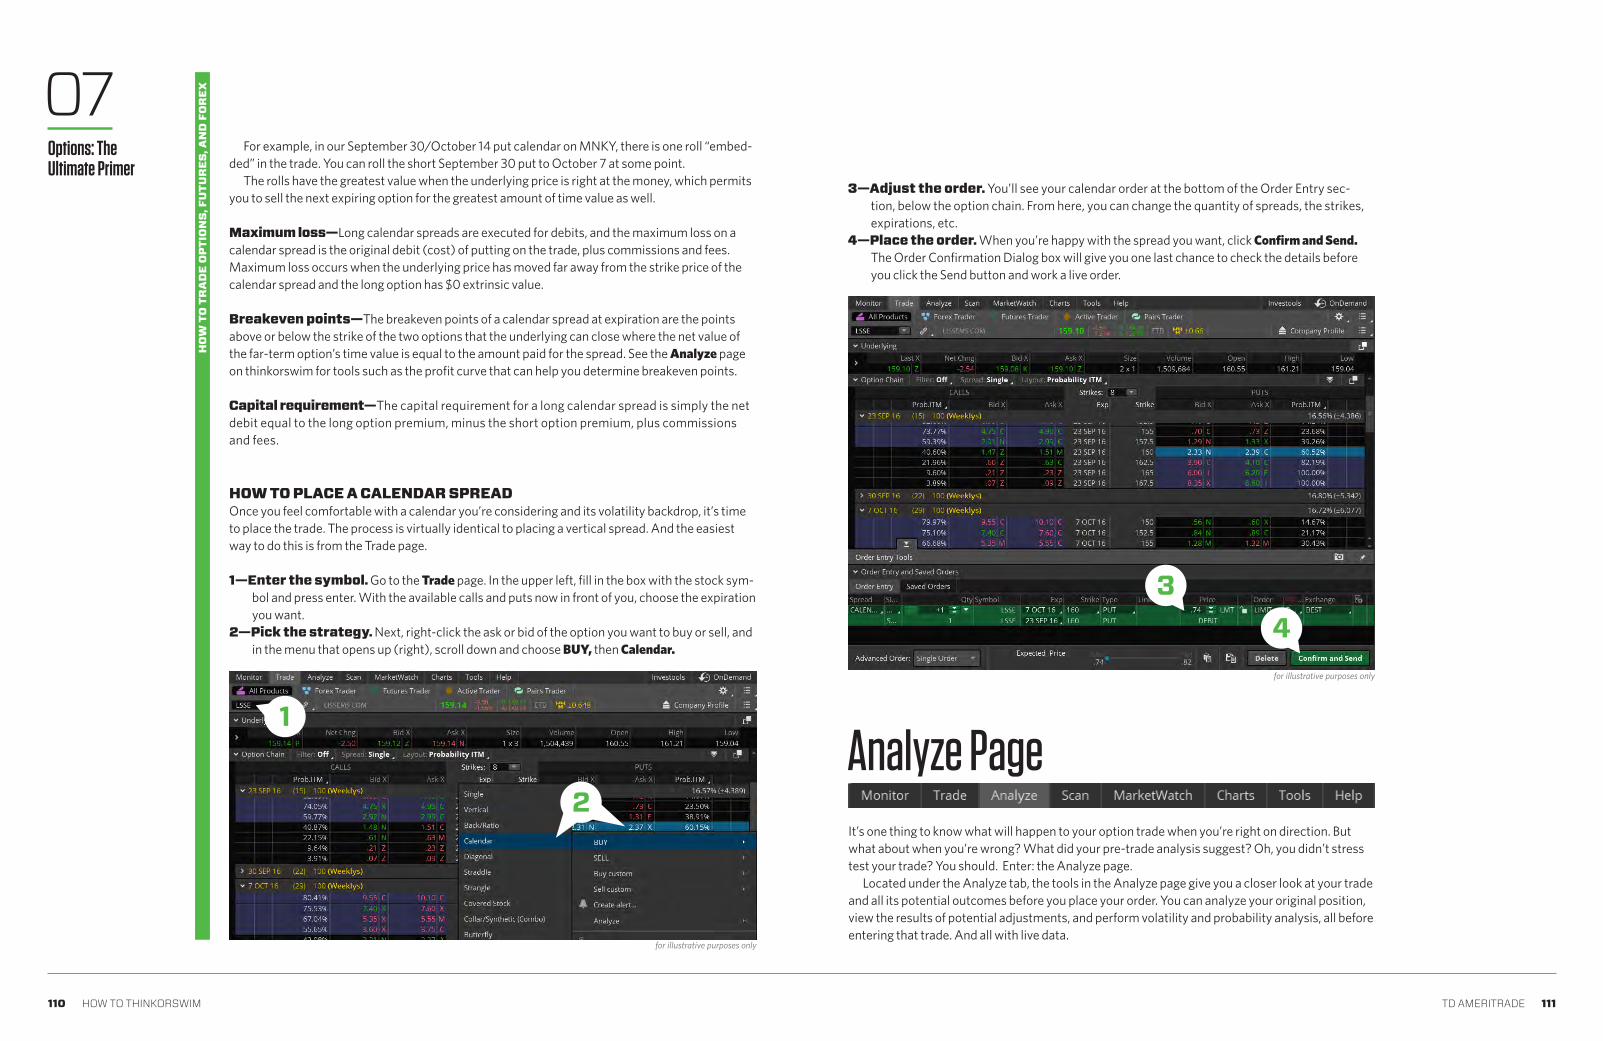
110 HOW TO THINKORSWIM TD AMERITRADE 111
HOW TO PLACE A CALENDAR SPREADOnce you feel comfortable with a calendar you’re considering and its volatility backdrop, it’s time to place the trade. The process is virtually identical to placing a vertical spread. And the easiest way to do this is from the Trade page.
1—Enter the symbol. Go to the Trade page. In the upper left, fill in the box with the stock sym-bol and press enter. With the available calls and puts now in front of you, choose the expiration you want.
2—Pick the strategy. Next, right-click the ask or bid of the option you want to buy or sell, and in the menu that opens up (right), scroll down and choose BUY, then Calendar.
For example, in our September 30/October 14 put calendar on MNKY, there is one roll “embed-ded” in the trade. You can roll the short September 30 put to October 7 at some point.
The rolls have the greatest value when the underlying price is right at the money, which permits you to sell the next expiring option for the greatest amount of time value as well.
Maximum loss—Long calendar spreads are executed for debits, and the maximum loss on a calendar spread is the original debit (cost) of putting on the trade, plus commissions and fees. Maximum loss occurs when the underlying price has moved far away from the strike price of the calendar spread and the long option has $0 extrinsic value.
Breakeven points—The breakeven points of a calendar spread at expiration are the points above or below the strike of the two options that the underlying can close where the net value of the far-term option’s time value is equal to the amount paid for the spread. See the Analyze page on thinkorswim for tools such as the profit curve that can help you determine breakeven points.
Capital requirement—The capital requirement for a long calendar spread is simply the net debit equal to the long option premium, minus the short option premium, plus commissions and fees.
Analyze PageIt’s one thing to know what will happen to your option trade when you’re right on direction. But what about when you’re wrong? What did your pre-trade analysis suggest? Oh, you didn’t stress test your trade? You should. Enter: the Analyze page.
Located under the Analyze tab, the tools in the Analyze page give you a closer look at your trade and all its potential outcomes before you place your order. You can analyze your original position, view the results of potential adjustments, and perform volatility and probability analysis, all before entering that trade. And all with live data.
1
2
for illustrative purposes only
34for illustrative purposes only
3—Adjust the order. You’ll see your calendar order at the bottom of the Order Entry sec-tion, below the option chain. From here, you can change the quantity of spreads, the strikes, expirations, etc.
4—Place the order. When you’re happy with the spread you want, click Confirm and Send. The Order Confirmation Dialog box will give you one last chance to check the details before you click the Send button and work a live order.
07Options: The Ultimate Primer
HO
W T
O T
RA
DE
OP
TIO
NS
, FU
TUR
ES, A
ND
FO
REX
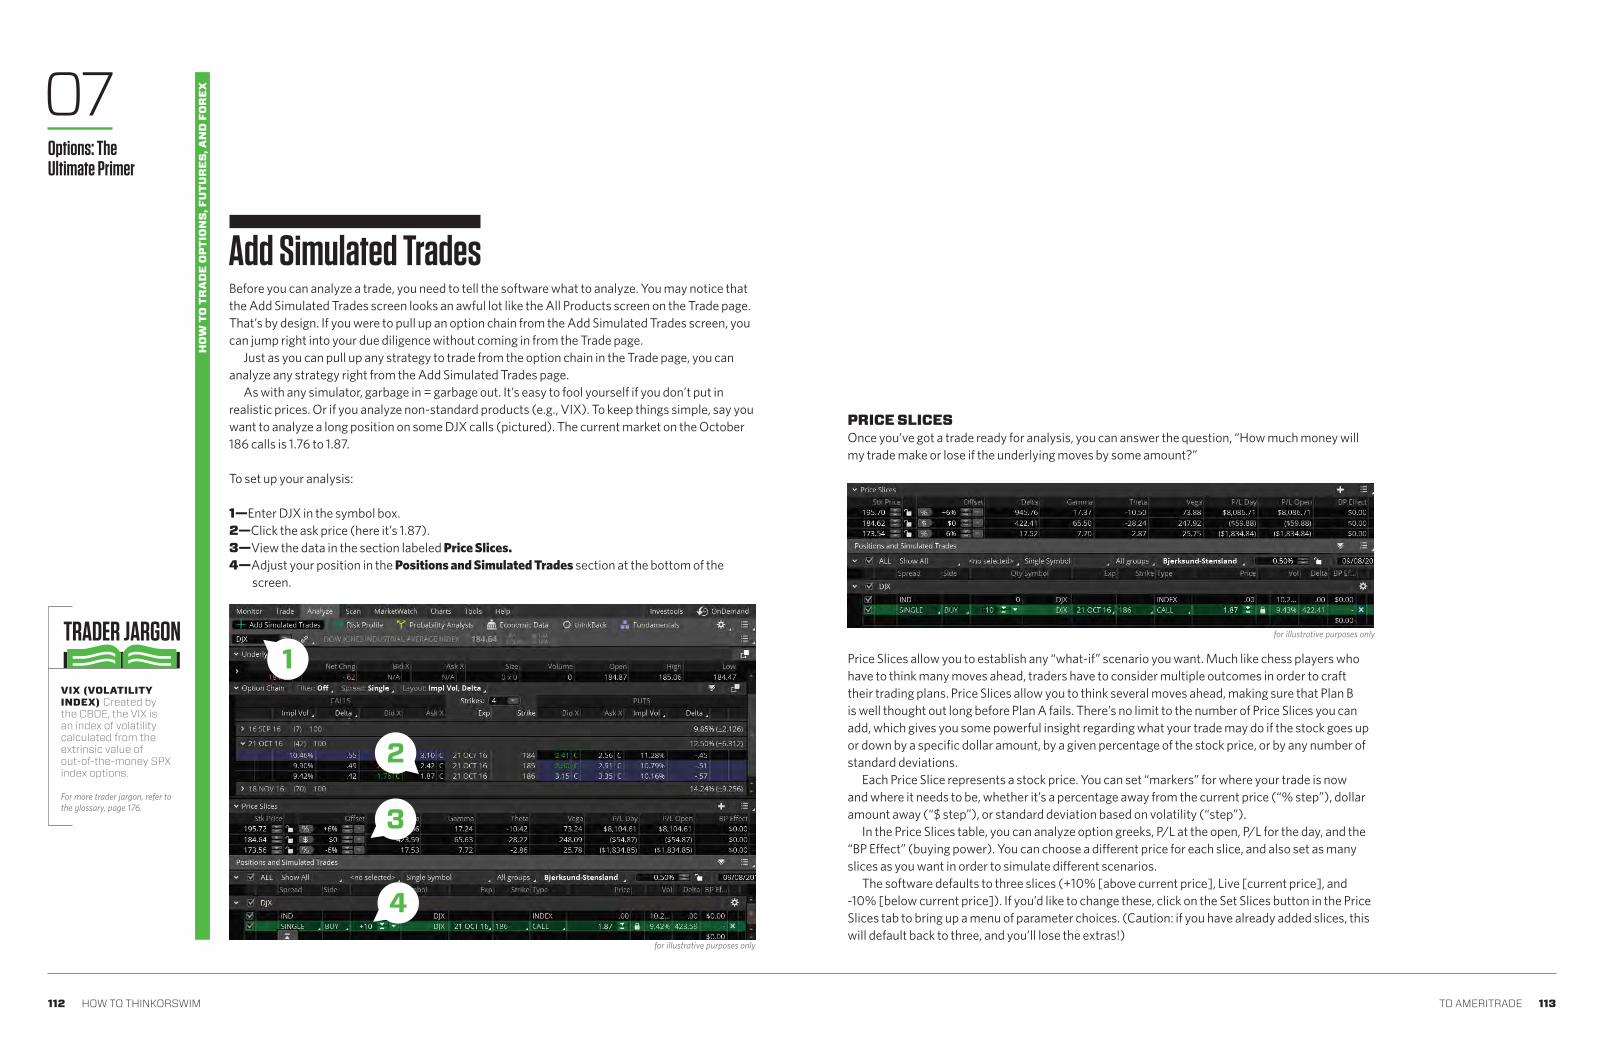
112 HOW TO THINKORSWIM TD AMERITRADE 113
TRADER JARGON
Before you can analyze a trade, you need to tell the software what to analyze. You may notice that the Add Simulated Trades screen looks an awful lot like the All Products screen on the Trade page. That’s by design. If you were to pull up an option chain from the Add Simulated Trades screen, you can jump right into your due diligence without coming in from the Trade page.
Just as you can pull up any strategy to trade from the option chain in the Trade page, you can analyze any strategy right from the Add Simulated Trades page.
As with any simulator, garbage in = garbage out. It’s easy to fool yourself if you don’t put in realistic prices. Or if you analyze non-standard products (e.g., VIX). To keep things simple, say you want to analyze a long position on some DJX calls (pictured). The current market on the October 186 calls is 1.76 to 1.87.
To set up your analysis:
1—Enter DJX in the symbol box. 2—Click the ask price (here it’s 1.87). 3—View the data in the section labeled Price Slices. 4—Adjust your position in the Positions and Simulated Trades section at the bottom of the
screen.
PRICE SLICES Once you’ve got a trade ready for analysis, you can answer the question, “How much money will my trade make or lose if the underlying moves by some amount?”
Price Slices allow you to establish any “what-if” scenario you want. Much like chess players who have to think many moves ahead, traders have to consider multiple outcomes in order to craft their trading plans. Price Slices allow you to think several moves ahead, making sure that Plan B is well thought out long before Plan A fails. There’s no limit to the number of Price Slices you can add, which gives you some powerful insight regarding what your trade may do if the stock goes up or down by a specific dollar amount, by a given percentage of the stock price, or by any number of standard deviations.
Each Price Slice represents a stock price. You can set “markers” for where your trade is now and where it needs to be, whether it’s a percentage away from the current price (“% step”), dollar amount away (“$ step”), or standard deviation based on volatility (“step”).
In the Price Slices table, you can analyze option greeks, P/L at the open, P/L for the day, and the “BP Effect” (buying power). You can choose a different price for each slice, and also set as many slices as you want in order to simulate different scenarios.
The software defaults to three slices (+10% [above current price], Live [current price], and -10% [below current price]). If you’d like to change these, click on the Set Slices button in the Price Slices tab to bring up a menu of parameter choices. (Caution: if you have already added slices, this will default back to three, and you’ll lose the extras!)
1
2
3
4for illustrative purposes only
for illustrative purposes only
Add Simulated Trades
07Options: The Ultimate Primer
VIX (VOLATILITY INDEX) Created by the CBOE, the VIX is an index of volatility calculated from the extrinsic value of out-of-the-money SPX index options.
For more trader jargon, refer to the glossary, page 176.
HO
W T
O T
RA
DE
OP
TIO
NS
, FU
TUR
ES, A
ND
FO
REX

114 HOW TO THINKORSWIM TD AMERITRADE 115
HOW TO CHANGE PRICE SLICES You can add, delete, and adjust the slices easily in the Price Slices feature.
1—To add a slice, simply click the “+” symbol in the upper right of the Price Slices feature. Or sim-ply right-click any of the slices to bring up a submenu, and choose + Add slice.
2—To delete a slice, simply right-click on the slice or click on the little blue dot next to a slice to bring up a menu, and select Delete slice.
To adjust slices, either left-click each slice individually in the Mode column to bring up a parameter menu, or click the Set Slices button in the upper tab of the Price Slices bar.
OPTION HACKERScanning for an options trade has become all-encompassing with the ability to scan for single options that meet any criteria you can dream up. Whether you’re buying single options or options spreads, you often know the criteria of the stock along with the legs of the options. Option Hacker allows you to input option criteria such as greeks, days to expiration, or premium right alongside your classic stock and study filters. The Option Hacker will then return the exact option(s) you are looking for, saving time and possibly identifying hidden opportunities.
1—Find Option Hacker in the submenu under the Scan tab.2—Adjust the criteria to your desired settings.3—To add a new parameter to your criteria, you can Add filter for options. You can also add stock
filters and study filters to this same set of criteria.4—You can choose to display only options, only stocks, or both. This allows you to sort your results
so they are relative to your desired criteria; that is, sorting by volume of the underlying symbol as opposed to the volume of each individual option.
5—Click Scan to view your results at the bottom of the screen.
OPTION HACKER Finding the needle in the haystack is easier when using this tool to sort through the cus-tom filters you prefer for your trades.
3—To modify a slice, manually input the number, or right-click on a slice and choose Set slices. The additional submenu that pops up contains preselected slice variances.
4—To reset all the slices back to the default settings, select Reset slices.
for illustrative purposes only
1
23
4 5
2
11
for illustrative purposes only
4
3
for illustrative purposes only
07Options: The Ultimate Primer
HO
W T
O T
RA
DE
OP
TIO
NS
, FU
TUR
ES, A
ND
FO
REX

116 HOW TO THINKORSWIM TD AMERITRADE 117
Risk ProfileThe Risk Profile tool on the Analyze page makes “stress testing” your trading ideas easy. By doing the math for you and drawing pictures of all the P/L possibilities—including the odds of making a profit (or not), it’ll help you figure out which option strikes to buy, which spreads to sell, or whether you even want to take the trade at all.
To start looking at your beautifully picturesque trades, click the Risk Profile tab in the main submenu at the top of the Analyze page. There you’ll see a P/L graph of your trade right before your eyes.
DON'T FORGET If forgetting to include commissions in your trades keeps screwing up your analysis, you can include them by clicking on the “commis-sions” dropdown menu above the graph.
COOLINFO
Theoretically, you can now get a better sense of what might happen when the underlying moves by any amount, over any time frame between now (pink P/L line pictured) and expiration (blue line)—which happen to be the defaults. To add more than two P/L lines, click on the dropdown box at the top under the label “Plot Lines.”
The plot lines are an integral part of your visual analysis. At a glance, you can see your position P/L at a given stock price.
If you want more plot lines prior to expiration, simply click on the “Plot Lines” menu and select your favorite type of interval:
Day step—These allow you to define your plot lines with specific days in between and watch a trade evolve over time.
Vol step—If you prefer to see how a change in implied volatility will affect your position, use this setting. Once you select it, you’ll see a subsequent setting allowing you to customize the amount of volatility percentage points between steps.
Expiration step—If you have a trade that crosses over multiple expirations, you can set the steps to view the trade at each of those expirations.
All of these steps are designed to allow you to see how a trade evolves as certain parameters change. The neat thing is that the parameters don’t have to change in real life for you to evaluate your position.
ANALYZING EXISTING POSITIONS AND SIMULATED TRADES Want to do some in-depth analysis on your existing positions? Your existing trades are automatically made available for you to analyze, so you don’t have to spend time searching for them or transferring them to the Analyze tab. You can also add new simulated trades. Either way, you’re covered.
1—In the Positions and Simulated Trades page, the first pull-down menu allows you to show all of your trades (“Show All”), to hide your positions, or to hide your simulations.
2—Click the little wrench icon on the right to change the dividend yield, the volatility, or the stock price.
3—Watch your curve change as you change the parameters.
Max loss.
Ouch!
Current plot line
(P/L)
Price slice
Expiration plot line
Sweet!
for illustrative purposes only
1
3
2
for illustrative purposes only
07Options: The Ultimate Primer
WHAT'S THE DAILYMOVE? You can convert any daily standarddeviation measure to avolatility reading like the CBOE Volatility Index (VIX). And vice versa. Say the impliedvolatility of stock “XYZ”is 24. Simply divide thatby the square root ofthe number of calendardays per year (365) toconvert that volatility toa percentage move inthe underlying. In other words, 24/19, or about 1.26%. So a 24 volatility means we expect XYZ to move less than 1.26% on 68% of all trading days.
HO
W T
O T
RA
DE
OP
TIO
NS
, FU
TUR
ES, A
ND
FO
REX
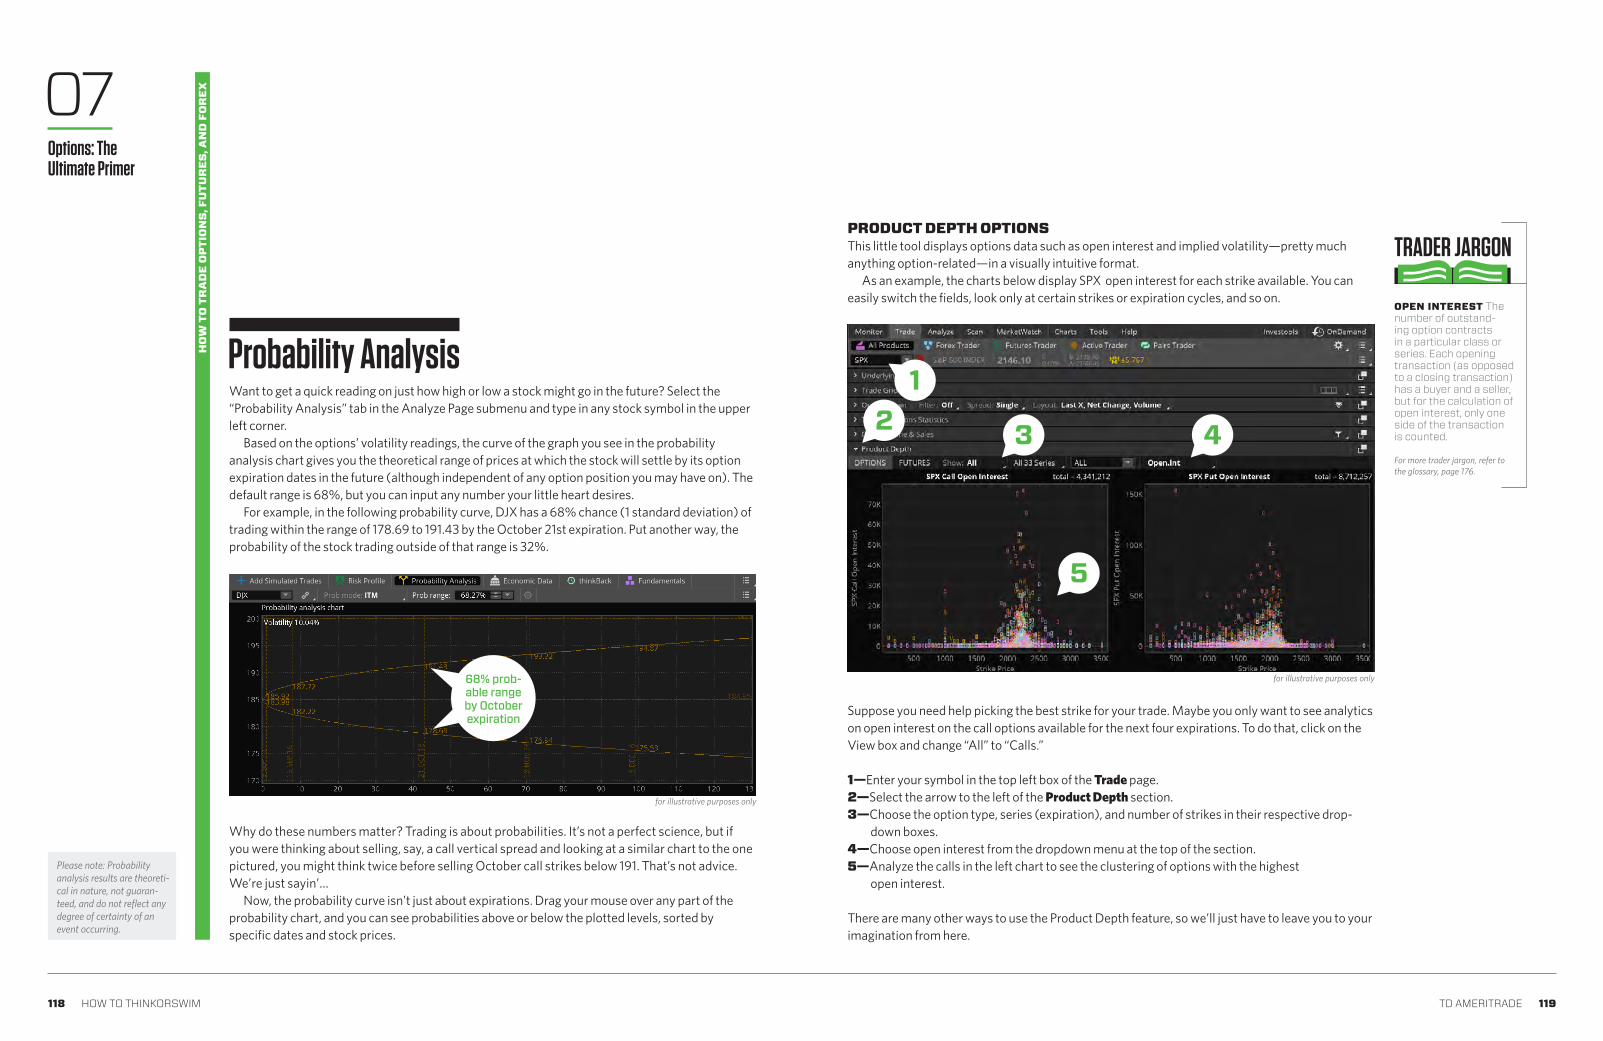
118 HOW TO THINKORSWIM TD AMERITRADE 119
TRADER JARGON
Why do these numbers matter? Trading is about probabilities. It’s not a perfect science, but if you were thinking about selling, say, a call vertical spread and looking at a similar chart to the one pictured, you might think twice before selling October call strikes below 191. That’s not advice. We’re just sayin’…
Now, the probability curve isn’t just about expirations. Drag your mouse over any part of the probability chart, and you can see probabilities above or below the plotted levels, sorted by specific dates and stock prices.
PRODUCT DEPTH OPTIONSThis little tool displays options data such as open interest and implied volatility—pretty much anything option-related—in a visually intuitive format.
As an example, the charts below display SPX open interest for each strike available. You can easily switch the fields, look only at certain strikes or expiration cycles, and so on.
Probability AnalysisWant to get a quick reading on just how high or low a stock might go in the future? Select the “Probability Analysis” tab in the Analyze Page submenu and type in any stock symbol in the upper left corner.
Based on the options’ volatility readings, the curve of the graph you see in the probability analysis chart gives you the theoretical range of prices at which the stock will settle by its option expiration dates in the future (although independent of any option position you may have on). The default range is 68%, but you can input any number your little heart desires.
For example, in the following probability curve, DJX has a 68% chance (1 standard deviation) of trading within the range of 178.69 to 191.43 by the October 21st expiration. Put another way, the probability of the stock trading outside of that range is 32%.
Suppose you need help picking the best strike for your trade. Maybe you only want to see analytics on open interest on the call options available for the next four expirations. To do that, click on the View box and change “All” to “Calls.”
1 —Enter your symbol in the top left box of the Trade page. 2—Select the arrow to the left of the Product Depth section. 3—Choose the option type, series (expiration), and number of strikes in their respective drop-
down boxes. 4—Choose open interest from the dropdown menu at the top of the section. 5—Analyze the calls in the left chart to see the clustering of options with the highest
open interest.
There are many other ways to use the Product Depth feature, so we’ll just have to leave you to your imagination from here.
68% prob-able range by October expiration
for illustrative purposes only
12 3 4
5
for illustrative purposes only
Please note: Probability analysis results are theoreti-cal in nature, not guaran-teed, and do not reflect any degree of certainty of an event occurring.
07Options: The Ultimate Primer
OPEN INTEREST The number of outstand-ing option contracts in a particular class or series. Each opening transaction (as opposed to a closing transaction) has a buyer and a seller, but for the calculation of open interest, only one side of the transaction is counted.
For more trader jargon, refer to the glossary, page 176.
HO
W T
O T
RA
DE
OP
TIO
NS
, FU
TUR
ES, A
ND
FO
REX
120 HOW TO THINKORSWIM TD AMERITRADE 121
HO
W T
O T
RA
DE
OP
TIO
NS
, FU
TUR
ES, A
ND
FO
REX07
Options: The Ultimate Primer
Options are not suitable for all investors as the special risks inherent to options trading may expose investors to potentially rap-id and substantial losses. Options trading subject to TD Ameritrade review and approval. Please read Characteristics and Risks of Standardized Options (http://www.optionsclearing.com/about/publications/character-risks.jsp) before investing in options.
Supporting documentation for any claims, comparison, statistics, or other technical data will be supplied upon request.
Examples are provided for informational purposes only and they may not take into consideration all transaction fees or taxes you would incur in an actual transaction.
Past performance does not guarantee future results.
A long call or put option position places the entire cost of the option position at risk. Should an individual long call or long put position expire worthless, the entire cost of the position would be lost.
The covered call strategy can limit the upside potential of the underlying stock position, as the stock would likely be called away in the event of substantial stock price increase.
The risk of loss on an uncovered call option position is potentially unlimited since there is no limit to the price increase of the underlying security. Naked option strategies involve the highest amount of risk and are only appropriate for traders with the highest risk tolerance.
The naked put strategy includes a high risk of purchasing the corresponding stock at the strike price when the market price of the stock will likely be lower. Naked option strategies involve the highest amount of risk and are only appropriate for traders with the highest risk tolerance.
With the protective put strategy, while the long put provides some temporary protection from a decline in the price of the corresponding stock, this does involve risking the entire cost of the put position. Should the long put position expire worthless, the entire cost of the put position would be lost.
Spreads, straddles, and other multiple-leg option strategies can entail substantial transaction costs, including multiple commis-sions, which may impact any potential return. These are advanced option strategies and often involve greater risk, and more complex risk, than basic options trades. Multiple-leg options transactions will incur contract fees on each leg.
The risk of loss on a short sale is potentially unlimited since there is no limit to the price increase of a security. There is no guar-antee the brokerage firm can continue to maintain a short position for an unlimited time period. Your position may be closed out by the firm without regard to your profit or loss.
Margin trading increases risk of loss and includes the possibility of a forced sale if account equity drops below required levels. Margin is not available in all account types. Margin trading privileges subject to TD Ameritrade review and approval. Carefully review the Margin Handbook (https://www.tdameritrade.com/retail-en_us/resources/pdf/AMTD086.pdf) and Margin Disclosure Document (https://www.tdameritrade.com/retail-en_us/resources/pdf/AMTD845.pdf) for more details. Please see our website or contact TD Ameritrade at 800-669-3900 for copies.

122 HOW TO THINKORSWIM TD AMERITRADE 123
TRADER JARGON
Futures trading isn't what it used to be, thanks to better technology. But using the right tools is critical. With thinkorswim, we've got you covered.
Futures: Not Just for Farmers Anymore
Futures BasicsFutures TraderActive TraderMonkey Bars
123
126
127
132
at a backyard party and your friends will likely think of farmers and pork bellies. Then there’s Hollywood, which often tells the story of the little guy making fortunes while the bad guys go broke. That’s what trading futures is all about, right? Well, not exactly. At least, not if you ask seasoned investors and traders.
Futures trading is certainly not appropriate for everyone, and not everyone will qualify. Trading futures does involve speculation, and the risk of loss can be substantial. But the idea that futures are for professionals only—industrial-size users, or farmers of some commodity, or some big financial institution or central bank looking to hedge, ganged with fire-breathing speculators tak-ing the other side of the risk—is Hollywood. It’s a fun story, but not practical.
In fact, futures trading can be boringly pragmatic. The concepts of hedging and speculation are still true, but it’s how you hedge or speculate with futures that can make all the difference. You can use the same strategies as the pros, but on a much smaller and less leveraged scale. Here’s how.
FUTURES DISASSEMBLEDLet’s start with a sober discussion of what a futures contract is by talking about the E-mini S&P 500 future (/ES). You’re probably familiar with the S&P 500 Index, calculated off the prices of 500 large-cap U.S. stocks. The E-mini S&P 500 future is a contract that that would deliver the cash equivalent of $50 times the price of the S&P 500 Index when the contract expires.
So, if you thought the S&P 500 might go higher, you could go to the trouble of buying all the 500 component stocks using the same weighting method that the index uses. Or, you could just buy an E-mini futures contract (/ES). You would have to put up some cash to cover the initial requirement for the futures contract. You’d potentially profit if the E-mini future went higher, and potentially lose if it went lower. Now, you may have mutual funds that track the S&P 500, so you may be ask-ing, why all the fuss about futures?
When you multiply the price of the E-mini S&P 500(/ES) by $50, you get the value of that future. With /ES at 2,100, it has a value of $105,000. The initial margin requirement, or the amount of cash you need in your account to buy that future, is about $5,225 plus transaction costs. (Note that margin requirements change frequently based on market conditions.) Initially using only $5,225 to establish a position worth $105,000 is known as leverage. Some say it’s a good and a bad thing about futures. Good in the sense you don’t need the full value of the contract to buy it. But leverage also increases your risk of losing more than you paid.
If /ES moves up 50 points in a week, you’d show a profit of $2,500. But if it drops 50 points, the loss would be $2,500, and you’d have potentially lost over 50% of your initial investment. You may also have to put up more cash to maintain the position. That’s called a margin call, which must be satisfied immediately. In that sense, leverage can be risky. But what if you actually had a portfolio of S&P 500 stocks worth $105,000? That doesn’t have any more risk than the S&P futures con-tract. Finally, what if your stock portfolio is smaller? Are there any advantages to buying an E-mini future versus a basket of the S&P 500 stocks?
Mention futures trading
FUTURES CONTRACT A standardized con-tract for the purchase and sale of financial instruments or physical commodities on a futures exchange for future delivery.
For more trader jargon, refer to the glossary, page 176.
HO
W T
O T
RA
DE
OP
TIO
NS
, FU
TUR
ES, A
ND
FO
REX08
Futures and futures options trading is specu-lative, and is not suitable for all investors. Please read the Risk Disclosure for Futures and Options (https://www.tdameritrade.com/retail-en_us/resources/pdf/TDA631.pdf) prior to trading futures prod-ucts. This information should not be construed as a recommendation or endorsement of any particular investment or investment strategy. Examples provided, in-cluding quotes, security or option symbols, order examples, price charts, and other depictions of trade and/or market data, are intended for educational and illustra-tive purposes only, and are not a recommen-dation or solicitation to purchase, sell, or hold any specific investment. Examples presented in this session are for educational and illus-trative purposes only. Real and/or hypothetical investments depicted are specifically not solicita-tions or recommenda-tions to trade a specific investment or to engage in a particular trading or investing strategy. Past performance does not guarantee future results.

124 HOW TO THINKORSWIM TD AMERITRADE 125
TRADER JARGON
SMALL DOSES CAN WORK, TOOLet’s say you’d like to invest $105,000 in an S&P 500 portfolio. What are your choices?
1—You could buy $105,000 worth of an S&P 500-tracking mutual fund. 2—Alternatively, you could buy $105,000 worth of an exchange-traded fund that tracks the S&P
500, and if you chose to use margin, you’d only need to put up $52,500 to do that (remember-ing the transaction costs and the cost of margin interest when borrowing from your broker).
3—Or you could buy one E-mini S&P future (/ES), and initially put up about $4,600 for the margin requirement, plus transaction costs.
Note that in scenario 3 you have not bought any actual securities like you did in the first two scenarios, but you’ve bought a product where the risk/reward profile is similar. And if you had remaining capital (since you did not have to spend $52,500 or $105,000), you could conceivably invest some of that in an interest-earning product. That could help diversify your overall portfolio, while possibly enhancing your potential return.
Many futures—like the E-mini S&P 500—are traded nearly 24 hours a day, making real-time information available in the middle of the night. You can even trade futures on a mobile platform, such as TD Ameritrade Mobile Trader. And you can trade in a wide variety of markets with futures—from commodities like corn, soybeans, and crude oil, to financial instruments like Treasury bonds and currencies. Some traders use futures to speculate, hedge, or diversify their portfolios by adding a different asset class (have you ever tried to buy 1,000 barrels of crude oil?).
The E-mini S&P 500 (/ES) is also frequently viewed as a heads up on what might be happening in the market. Ask any active trader what things she checks daily, and you’re likely to hear “the /ES.” That’s because the speed and efficiency of the futures markets helps professional traders make either bullish or bearish speculative trades on futures faster than buying or selling entire portfolios of stock.
When some news or event hits the wires, generally the product that reacts first is the E-mini S&P 500 future (/ES). Often, you might see /ES rally before you see the component stocks of the index rally. There’s no guarantee that individual stocks will follow the futures, but the futures market can give you an indication of how market participants might be interpreting a news event as either bullish or bearish for the overall market. To check it out yourself, put the symbol /ES in a watchlist.
TRADING VOL WITH VIX AND VIX FUTURESFutures products don’t always come from traditional asset classes like commodities, stocks, or bonds. In fact, there’s one more that might surprise you—volatility—referred to in trading circles as “vol.”
OK. Vol as an asset class might sound a little esoteric, and a little hard to fit into a portfolio. But if we define an asset class as a group of products that exhibit similar market behaviors, that’s in effect what volatility is. And we have VIX, the CBOE’s volatility index. And VIX futures. And VIX options. It’s VIX options and futures that exhibit similar market behavior.
When market temperament depresses VIX, you may find fewer equity trading opportunities. Or you might be concerned that a market drop could spike volatility. It’s important to understand how to treat volatility as an asset class, and find potential strategies for a VIX at any level.
VIX (the index). VIX itself is an index product (like the Dow Jones Industrial Average, or S&P 500) that’s a weighted average of a strip of short-term, out-of-the-money (OTM) SPX options. It’s designed to measure the overall implied vol of SPX options.
Remember that implied vol is derived from the market prices of options. And when plugged into an option pricing model, it’s the vol that makes the option’s theoretical value equal to the option’s market value. In a word, the VIX is a single implied volatility number that represents all SPX options.
The VIX is calculated from live SPX option price data. So, when you see VIX at 15, for example, it’s based on a snapshot of the option prices. What happens if traders start buying OTM calls or puts? Option prices are set by the market’s buying and selling activity. So, with more demand (buying), the price goes up. And because OTM option prices are made up entirely of extrinsic val-ue (the value of time to expiration and volatility), as their price goes up and time to expiration stays the same, their implied volatility goes up, too.
As SPX option prices rise, that translates into a higher price for the VIX. Traders might be buying the SPX options as a hedge against a big move in the market, or as a speculative trade. It doesn’t matter. The buying pressure on the SPX options increases their price. That in turn increases the VIX, which is sometimes called the market's “fear gauge” because it tends to rise when traders think there might be a big up-or-down change in an index.
Conversely, if traders think the market might not make any large moves, they sell their hedges, or sell options short. That selling pressure pushes SPX prices lower, which in turn pushes the VIX lower. This is how the VIX works as a handy snapshot of the market’s expectation of the potential magnitude of SPX price changes. But you can’t trade the VIX index itself. It’s just a number. That’s where the VIX futures come in.
VIX futures.You can see quotes and charts for VIX futures on thinkorswim using the symbol /VX. VIX futures are cash settled, meaning they deliver a cash amount equal to $1,000 times the /VX settlement price at expiration. You can even see the settlement price on the platform with the symbol VRO. Essentially, the /VX future, and VIX index, converge at expiration. Before expiration, though, /VX futures move up and down as traders speculate on whether vol might be higher or lower by a particular futures contract’s expiration.
08Futures: Not Just for Farmers Anymore
MARGIN CALL A brokerage firm's demand of a client for additional equity in order to bring margin deposits up to a required minimum level. If the client fails to deliver more equity in the account, the client's positions may be liquidated.
For more trader jargon, refer to the glossary, page 176.
HO
W T
O T
RA
DE
OP
TIO
NS
, FU
TUR
ES, A
ND
FO
REX
for illustrative purposes only
VIX VS. VIX FUTURES As you can see, the VIX that most people are watching, including what the business media typ-ically reports on, doesn’t match VIX futures. Note the variance between the highs, lows, and closing price for each.

126 HOW TO THINKORSWIM TD AMERITRADE 127
08Futures: Not Just for Farmers Anymore
HO
W T
O T
RA
DE
OP
TIO
NS
, FU
TUR
ES, A
ND
FO
REX
Keep in mind there’s no cost of carry for /VX futures because there is no underlying product like stocks, bonds, or commodities. So, the difference you see between the VIX index and the /VX future is pure speculation on the market’s future volatility. When you see the different expirations of /VX futures, the basis (see "Trader Jargon," left) between them is the market’s anticipation of where vol will be. For example, if you see the June /VX trading at 17, and the September /VX trading at 18, that’s the market’s way of telling you it anticipates higher vol by the time September rolls around. If the June /VX is trading at 20, and the September /VX is trading at 19, the market anticipates lower vol.
Near-term/VX futures tend to be more volatile than further-term /VX futures. And that usually means bigger, faster moves. The mechanics of the VIX and /VX can help explain why.
Some traders believe that when the market starts to sell off quickly, traders and investors panic. The first thing they do is bid for OTM SPX puts, as either protection, or as speculation on a crash. That spikes the VIX index. The near-term /VX futures rally in anticipation the VIX might stay higher, and that the price of the front-month /VX future will converge to a higher VIX price. Fur-ther-term /VX futures will rally, too. But not as much if the market believes it’s less likely the VIX will stay at a higher price by those further /VX expirations. This explains why /VX futures can go into backwardation, with the price of the front-month /VX higher than the back-month /VX.
And don’t be fooled by the relatively low prices of /VX futures. The contract size of the /VX futures is $1,000. So if you buy a /VX future for 16, and it drops to 15, you’ll be down $1,000. The minimum tick size of /VX is 0.05, which represents $50.
Futures Trader
Have you opened a futures trading account? Are you ready to trade futures? If so, you can go to the Trade page and click on the tab labeled “Futures Trader” in the submenu. This will take you to a series of dashboards that include various futures markets and their respective charts, all waiting for your input.
The Futures Trader page defaults to 12 panels—six dashboards and their six respective charts. Charts were covered in chapter 5, so let’s focus on getting futures quotes and placing orders.
GETTING FUTURES QUOTES In the box at the top left of the Futures Trader screen, you can enter the futures symbol. The symbol for the E-mini S&P 500 Index Futures is /ES. (See Trader Jargon on the next page.) The quote box in the center of each panel displays the bid and ask prices. As indicated, you typically sell on the bid and buy on the ask, along with the number of contracts (for which the current market pictured is 2150.50 to 2150.75).
for illustrative purposes only
Just below the box where you state your quan-tity, you’ll see the word “Tick,” which again is the minimum increment by which a futures contract is allowed to change. In this case, it’s $0.25, but it varies by instrument. However, you can also see that 25 cents is equivalent to $12.50. This is because the E-mini contract rep-resents 50 futures (50 x $0.25 = $12.50).
You can also find tick size, tick value, and initial margin requirements for each specific futures product by clicking on the little down arrow to the right of the symbol and then selecting "futures."
ENTERING FUTURES ORDERS Once you’ve identified a futures contract you want to trade and you’re looking to enter an order, simply follow these steps:
1—Type in the contract’s symbol in the symbol box (/ES in this example).
2—Adjust the quantity of the position. 3—Click BUY to purchase.
If you’re filled, you’ll see the same confirmation box open on your desktop as a stock or option fill—and yes, hear the chime.
for illustrative purposes only
1
2 3
TRADER JARGON
SYMBOL/
ES
U
6
DEFINITIONThis is a futures symbol
S&P 500 E-mini contract from the CME
September expiration
2016 contract year
ANATOMY OF A FUTURES SYMBOL Does the symbol /ESU6 mean anything to you? It should if you’re a futures trader. Here’s a breakdown of what you’re telling the thinkorswim plat-form when you type it in.
Now, this symbol will repeat and be equally as valid in 2021 as it was in 2001. But if you only want to see the current active month’s con-tracts, go to the All Products page under the Trade tab. Type in the symbol “/ES” in the top left. You’ll see the next three expirations, or all of the available contracts that are available, depending on the value of the dropdown menu.
For more trader jargon, refer to the glossary, page 176.
Active TraderIf you tend to trade more actively and really need a page that allows you to see each tick of the market, the Active Trader page might be for you. And if you’re looking for speed, there really is no place on the thinkorswim platform to place your order faster than this page. Not only can you enter orders with as little as one click, but you can also move orders to different price points with a simple slide of the mouse.**
**Please note: As with any platform, market volatility, volume, and system availability may delay account access and trade executions.
TRADER JARGON
BASIS Generally referring to the futures markets, the basis is the difference between the cash price of the underlying commodity and the price of a futures contract based on that underlying. Cash price minus futures price equals basis.
For more trader jargon, refer to the glossary, page 176.
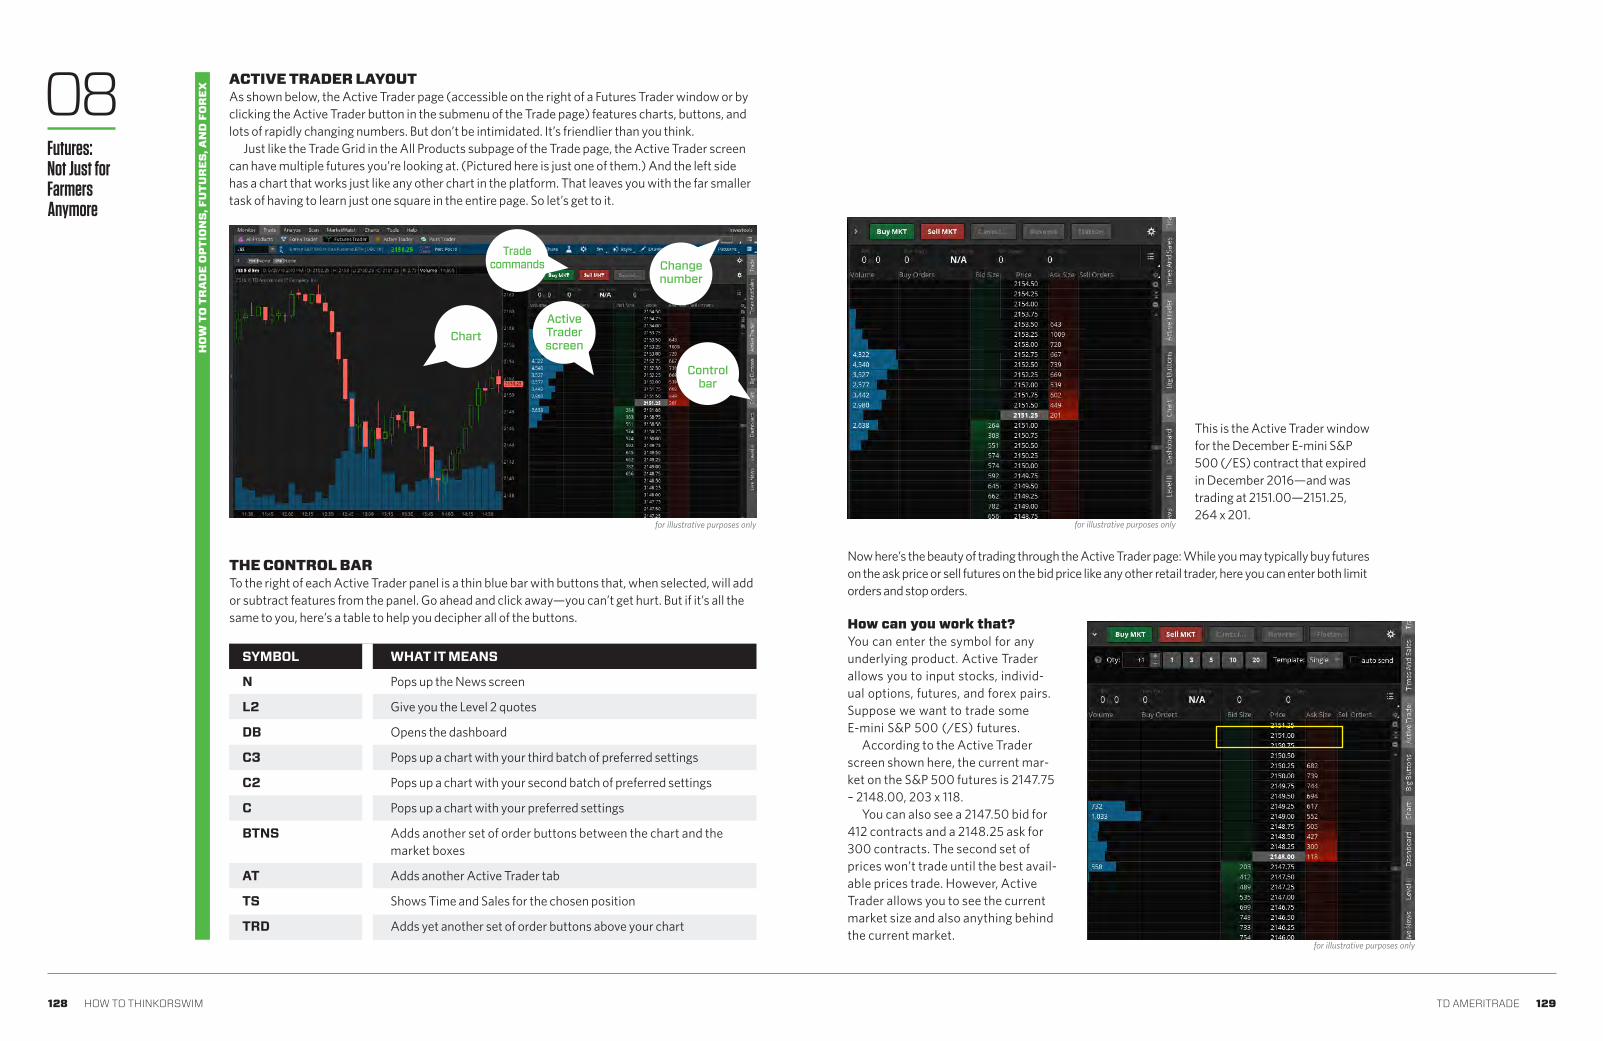
128 HOW TO THINKORSWIM TD AMERITRADE 129
THE CONTROL BAR To the right of each Active Trader panel is a thin blue bar with buttons that, when selected, will add or subtract features from the panel. Go ahead and click away—you can’t get hurt. But if it’s all the same to you, here’s a table to help you decipher all of the buttons.
ACTIVE TRADER LAYOUT As shown below, the Active Trader page (accessible on the right of a Futures Trader window or by clicking the Active Trader button in the submenu of the Trade page) features charts, buttons, and lots of rapidly changing numbers. But don’t be intimidated. It’s friendlier than you think.
Just like the Trade Grid in the All Products subpage of the Trade page, the Active Trader screen can have multiple futures you’re looking at. (Pictured here is just one of them.) And the left side has a chart that works just like any other chart in the platform. That leaves you with the far smaller task of having to learn just one square in the entire page. So let’s get to it.
N
L2
DB
C3
C2
C
BTNS
AT
TS
TRD
SYMBOL WHAT IT MEANS
Pops up the News screen
Give you the Level 2 quotes
Opens the dashboard
Pops up a chart with your third batch of preferred settings
Pops up a chart with your second batch of preferred settings
Pops up a chart with your preferred settings
Adds another set of order buttons between the chart and the market boxes
Adds another Active Trader tab
Shows Time and Sales for the chosen position
Adds yet another set of order buttons above your chart
This is the Active Trader window for the December E-mini S&P 500 (/ES) contract that expired in December 2016—and was trading at 2151.00—2151.25, 264 x 201.
for illustrative purposes only
Now here’s the beauty of trading through the Active Trader page: While you may typically buy futures on the ask price or sell futures on the bid price like any other retail trader, here you can enter both limit orders and stop orders.
How can you work that? You can enter the symbol for any underlying product. Active Trader allows you to input stocks, individ-ual options, futures, and forex pairs. Suppose we want to trade some E-mini S&P 500 (/ES) futures.
According to the Active Trader screen shown here, the current mar-ket on the S&P 500 futures is 2147.75 – 2148.00, 203 x 118.
You can also see a 2147.50 bid for 412 contracts and a 2148.25 ask for 300 contracts. The second set of prices won’t trade until the best avail-able prices trade. However, Active Trader allows you to see the current market size and also anything behind the current market.
for illustrative purposes only
Chart
Trade commands
ActiveTraderscreen
Changenumber
Controlbar
for illustrative purposes only
08Futures: Not Just for Farmers Anymore
HO
W T
O T
RA
DE
OP
TIO
NS
, FU
TUR
ES, A
ND
FO
REX

130 HOW TO THINKORSWIM TD AMERITRADE 131
You can also use the dashboard to enter the trade. In the control box on the right of the Active Trader panel you’re in, click DB to bring up the dashboard for the order that you see here. Using the pull-down menu, you select the quantity of contracts you want to trade. Then, to pay 2148.00 for the futures, you click on the Buy button to place a limit order for the listed price. To sell the futures at the limit price of 2147.75, you click on the Sell button. Simple enough!
However, suppose you want to join the 2147.75 bid with 10 contracts, meaning that you’d like the chance to pay $2147.75 for 10 futures. In that case, drag your cursor down to the 2147.75 bid and click on the green cell (the same one that currently has 136 contracts bid for) as shown.
Once you click on that cell, the order confirmation screen will pop up so you can edit or complete your trade. (For faster or-der entry, you can bypass the confirmation screen by checking the small box labeled “Auto Send,” but we don’t recommend it.)
BRACKETING FOR A BIGGER, BETTER TRADING PLAN Once you get filled on a trade, you have the ability to scale out of your positions by “bracketing” your orders—which is just a fancy term to describe the unique ability to scale out of your position in one to three different “brackets” of one-cancels-other (OCO) orders.
Here’s how it works: Suppose you’d like to buy 10 futures contracts at the market price and you’d like to scale out of the position in two levels. Let’s say we bracket five of them OCO to sell at $10 higher (you made money) or at $10 lower (your stop-loss). You can then bracket the other five with OCO exits, say at $20 higher or $20 lower. Keep in mind that using this kind of scaling strate-gy will likely incur additional transaction costs, including multiple commissions.
TO ENTER A BRACKET ORDER IN THE ACTIVE TRADER ORDER SCREEN1—Click the little triangle to the left of the Buy MKT button to bring up the bracket feature. 2—Select the number of “levels” (OCO orders) you want. 3—Adjust the OCO “Offset” by (a) choosing the little grey box to the right of the “Link” input for
percentage, tick, dollar, then (b) setting the amount. 4—Click Buy MKT to enter the order. 5—Confirm the order ticket and send.
So, how do you pick your exit levels? Pretty much any way you want. You can use specific prices (e.g., I want to exit when my trade is worth $2,150), a dollar-amount change (e.g., I want to exit when my trade increases by $10), or a percentage change (e.g., I want to exit when my trade gains 2%). We know trading plans are hard to follow. This is one way we’re trying to make things more simple for you.
ENTERING ORDERS WITH ACTIVE TRADER
1—If you simply want to pay the market price, adjust the quantity of contracts you’d like to buy. 2—Click the Buy MKT button. Remember that there's no price guarantee with a market order; it
seeks execution at the next available price.
for illustrative purposes only
1
2
for illustrative purposes only
Click to join bid
for illustrative purposes only
for illustrative purposes only
3
241
08Futures: Not Just for Farmers Anymore
HO
W T
O T
RA
DE
OP
TIO
NS
, FU
TUR
ES, A
ND
FO
REX

132 HOW TO THINKORSWIM TD AMERITRADE 133
HOW TO USE MONKEY BARSHow can you use the Monkey Bar? Many traders believe that when the market is in an orderly bell-curve formation, it suggests balance and shows the short-term traders are in control. The short-term trader has typically traded around the Monkey Bar. Think of it as a magnet or mean that usually attracts the market—historically in periods marked by low volume.
When it appears that the short-term traders have control of the market, long-term traders may decide to enter when new highs or lows are made without volume. Many longer-term traders like to take advantage of the “unfair” pricing caused by these spikes. That’s because they are gener-ally larger institutions or hedge funds and are looking at the bigger picture. As such, they are less sensitive to price entry.
When large institutions come in and out of the market, they are focused on what they perceive to be the new fair value. Because they are looking at longer time frames, they may be able to move the markets to new sustained highs or lows by the sheer volume. When the market pushes outside the “playground” with volume, this is often seen as a sign that longer-term traders may be in control.
We think one of the coolest trading features known to humanity is our very own “Monkey Bars”—a proprietary charting tool that takes traditional futures trading studies to a whole new level.
In the image below, you can see the Monkey Bars display numbers in a bell curve that rep-resents each instance where a price falls into a specified interval. The longest row of numbers in the study is called the Monkey Bar. The Monkey Bar exposes the price level that was most fre-quently traded during the specified time period. The price range surrounding the Monkey Bar is where 70% of the trading activity takes place for the specified time. We call that “The Playground.”
Monkey Bars
Monkey Bars start recording at 3:30 p.m. and end at 3:15 p.m. the following day. This way a trader can have some reference point in the morning for how the market traded in an overnight session. In fact, there is a different color to represent each time zone. At a glance, you can differentiate the U.S. trading session from U.S. after-hours, from the Asia trading session from the European trading session, etc.
To pull up a Monkey Bar chart:
1—Click on the Charts tab. 2—Click Studies at the top right of a chart. In the dropdown menu, select Quick Studies, then All
Studies. Look under “M” for Monkey Bars.
for illustrative purposes only
MonkeyBar
MONKEY BARS With this indicator, you can see where most of the trading activity takes place in the futures contract (/ES shown here).
08Futures: Not Just for Farmers Anymore
HO
W T
O T
RA
DE
OP
TIO
NS
, FU
TUR
ES, A
ND
FO
REX

134 HOW TO THINKORSWIM TD AMERITRADE 135
Familiarity breeds comfort, and although a chart’s a chart, there are some differences between trading currencies and equities you ought to know before diving in.
Forex: All the World’s a Trade
Forex BasicsForex TraderForex Trading Q&A
135
139
142 a big fish to swim in the pool of currency trading anymore. It’s certainly not shrouded in the mystique it once was, and advances in technology have helped to level the playing field by bringing it to the masses. But let’s be clear. It’s not for everyone, and we’ll cover some of the specific risks here.
Also known as forex (foreign exchange), currency trading is a vibrant marketplace. If you haven’t looked at forex yet, perhaps it’s because you were too afraid of it, or just didn’t quite under-stand it. But the pool of currency products to trade is expansive, and you don’t have to be a rocket scientist to figure things out. In fact, when trading forex, you can rely on many of the same tools available on the thinkorswim trading platform that you already know and love. And if you under-stand what makes a stock tick, you more than likely understand what makes forex—ahem, pip.
You don’t have to be
Trading forex with TD Ameritrade is essentially pairs trading: You are buying one currency and selling another. If you buy the EUR/USD pair, for example, you are long the euro and short the U.S. dollar. Some of the more actively traded "major pairs" today include the EUR/USD, USD/JPY, GBP/USD, and EUR/JPY (see list below). Other pairs that aren't traded as often are called “exotic.”
Forex Basics
The standard minimum price movement in a currency market is called a pip. For all curren-cies except JPY, the pip is equal to 1/100 of a cent, or 0.0001. For JPY, the pip is equal to 0.01. TD Ameritrade clients may trade in frac-tions of a pip; the smallest price increment is 1 tick, which is 1/10 of a pip or 0.00001 (0.001 for JPY). This seems like a small amount, but a standard lot trade is €100,000 (euros), so a 0.0001 pip equals $10. Suppose the quote for EUR/USD is 1.11430 bid to 1.11440 ask. The difference in price between the bid and ask is 1 pip (or 10 ticks), which is another way of saying that the difference in price for €10,000 is $1. Just as with stocks, investors generally buy at the ask and sell on the bid. If you capture 1 pip (or 10 ticks) on a trade of 10,000, you’ve made $1.
for illustrative purposes only
EURO QUOTE The quote for EUR/USD showing a bid of 1.11430 and an offer of 1.11440. For a quantity of 10,000, one pip = $0.10.
USD
JPY
EUR
AUD
CAD
GBP
CHF
DKK
NZD
NOK
SEK
U.S. dollar
Japanese yen
Euro
Australian dollar
Canadian dollar
British pound
Swiss franc
Danish krone
New Zealand dollar
Norwegian krone
Swedish krona
CURRENCY CURRENCYCOUNTRY COUNTRY
HO
W T
O T
RA
DE
OP
TIO
NS
, FU
TUR
ES, A
ND
FO
REX09

136 HOW TO THINKORSWIM TD AMERITRADE 137
IT’S ALL ABOUT THE LEVERAGEForex trading at TD Ameritrade offers a max leverage of 50 to 1 on major pairs and 20 to 1 on exotic pairs. The rules surrounding leverage on forex are a bit different from margin on equities. Let’s con-sider an example: Suppose the EUR/USD currency pair is trading at 1.11640 bid to 1.11650 ask, and you buy the pair on the 1.11650 ask. You are now long the euro and short the dollar. You’re anticipat-ing the euro will bounce higher against the dollar. Assume the euro gains against the dollar, and the quote is now 1.11950 bid to 1.11960 ask. You sell the position at the 1.11950 bid price. On a €10,000 transaction size, you net 30 pips, or a $30 profit. If you’re trading on the TD Ameritrade non-com-mission feed, your transaction costs are included in the quotes. More about that in just a bit.
($1.11950 – $1.11650) X 10,000 = 0.0030 = 30 pips = $30
On the other hand, if the euro loses against the dollar, and the quote is lower, say 1.11450 bid to 1.11460 ask, on a €10,000 transaction size, you’re down 20 pips, or a $20 loss.
($1.11450 – $1.11650) X 10,000 = -0.0020 = -20 pips = -$20
What’s important to understand about forex leverage is that you don’t need to put up the entire value of €10,000 to trade EUR/USD. The leverage varies by firm, but it’s not uncommon to see leverage rates of 5 to 1 or even 50 to 1 (as with TD Ameritrade). If, for example, you’ve put down $200 (50 to 1) and capture 10 pips on a currency trade, you’ve made $10 or 5% on your invest-ment. However, leverage like this is a double-edged sword: The more you have, the higher the potential rewards, and the greater the risk of hefty percentage losses.
WHAT MAKES THE DOLLAR MOVE?One way to think of a country’s currency is the same way equity investors think of stocks. Higher stock prices typically reflect investor confidence in a company’s future. Likewise, higher currency values typically reflect investor sentiment in the health of that country’s economy relative to other countries. For example, by buying bonds, the Fed signals to investors that it is taking action to keep interest rates in check. Lower rates in the U.S. make the dollar less interesting relative to other currencies. That is, as rates or yields fall, banks and other investors will move money into financial systems that offer higher rates. For instance, if rates are low in the U.S., investors might move mon-ey into Australia and invest in higher-yielding Australian bonds.
Capital movements across borders are like tides that flow in the ocean. These shifting assets are powerful forces that drive currencies higher and lower. Economic data and interest rates are the key fundamental drivers for this capital movement. As a result, trends can last months or even years and provide both short- and long-term opportunities in the currency markets.
LIKE STOCKS BUT NOT REALLYForex has some unique features that appeal to stock and options traders, in particular. The follow-ing is a short list.
Same board, different game. Adding forex to your game plan gives you another product to trade, but it’s not like you’ll be starting from scratch. You can use many of the same analysis techniques that you do for equities. After all, a chart is a chart. Chances are, many of the indica-tors that you use to trade stocks, futures, or options can be applied to forex charts as well. Notice the trend in the USD/JPY currency pair from December 2015 to September 2016 (below). Even simple trendlines can be useful when looking for the next major trend in a currency pair.
for illustrative purposes only
Forex trading involves leverage, carries a high level of risk, and is not suitable for all investors. For those who are approved, trading currencies can provide some portfolio diversification. It’s another asset class and an opportunity to initiate positions to build a portfolio. If your stock portfolio isn’t doing well, some of those losses might be offset by positive results from a profitable currency position. There’s a lot to be said for trading asset groups that don’t have a high degree of correlation.
To trade forex, you need to open up a forex account with TD Ameritrade. Not all clients will qualify, but if you do, once the forex sub-account is open, it will be listed under the same login as your other accounts using the thinkorswim platform.
A CHART IS A CHART Does this chart look familiar? Most of the technical indicators that stock and options traders use are shared by forex as well. This chart happens to show the dollar/yen (USD/JPY), but it could just as well be SPX.
09Forex: All the World's a Trade
HO
W T
O T
RA
DE
OP
TIO
NS
, FU
TUR
ES, A
ND
FO
REX

138 HOW TO THINKORSWIM TD AMERITRADE 139
Trading the ups with the downs. Again, currency markets tend to move in trends, so they can offer both short- and long-term trading opportunities. For example, the investor focused on fundamental factors such as interest rates and economic data can trade on information from news releases in search of short-term profits or even intraday moves. Economic news releases tend to cause very short bursts of activity in financial markets, including volatile moves in currency pairs. The idea is to capture a few pips here and there. Remember, hit for singles, not home runs.
Historically speaking, some currencies have tended to trend nicely over time and are some-times used for longer-term positions. For example, an investor who expects the pound to rebound against the dollar might initiate a long position in the GBP/USD while also placing a stop-loss below a recent low. That's a predetermined price designed to get him out of the trade—something you can program right into the thinkorswim platform. A long-term, trend-following approach can be just as useful in trading currency pairs as it is in equities. Frequently, the key is to correctly assess longer-term macro trends by reading the news and economic reports, just as you would equities. Of course, there’s no guarantee that any historical trend will continue in the future.
(Almost) 24/7. Because international currency markets overlap, you can trade currencies day and night. For the week, markets are normally open from 4:00 p.m. Sunday to 4:00 p.m. Friday (Central time). The continuous trading helps to ensure that there are no “speed bumps” or big moves when markets are closed. The largest volume and most liquid markets exist when multiple international markets are trading.
Because there is no daily close for the currency market, the value of any open forex position is calculated at 4:00 p.m. CT every day and adjusted for its rollover rates.
Finally, it’s worth mentioning that every investment involves some risk, and the risk of loss in trading off-exchange forex contracts can be substantial. So before jumping in with both feet, understand that the only funds that should ever be used to speculate in foreign currency trading are funds that represent risk capital—i.e., funds you can afford to lose without affecting your financial situation. The reality is that no one can predict which way exchange rates will go, and the forex market is volatile. Leverage can produce large losses in relation to your initial deposit. In fact, even a small move against your position may result in a large loss, including the loss of your entire deposit. And, depending on your agreement with your dealer, you could also be required to cover additional losses.
Understanding the risks of trading forex is key, and if it’s a new concept for you, sure, it will take a little time and education to learn the ins and outs. Yet, for many investors, forex is an exciting and liquid market to trade. The key drivers—economic data and changes in interest rates—are easy to follow. Just as we’ve seen with the U.S. dollar, currency prices can trend over time and provide both long-term and short-term trading opportunities. And the best part—if you’re already trading equities, you can use many of the thinkorswim platform tools that you’re already familiar with.
Forex Trader
To trade forex, you need to qualify for and open up a forex sub-account, because these trades are cleared and executed in a different way from stocks. But the thinkorswim platform lets you trade forex on the same platform where you’re trading your stocks and options. Yes, you’ll have a forex and equity account on the “back end,” but you’ll see both of them in a single account on the “front end.”
In fact, you can monitor, analyze, chart, and scan forex on all the same pages that you would use for stocks and options. Even placing trades from quote screens will feel the same. That makes it convenient to monitor forex prices and positions right alongside your stocks, and thus work forex into your trading strategy.
However, if you want a little more robust-ness in your forex trading choices, then you’ll want to place these trades on the Forex Trader page. The order screens might look a little funny at first, so let’s break ’em down.
Next to the All Products tab, you’ll see a tab labeled “Forex Trader.” Click on it and you’ll be taken to the foreign exchange dashboard.
for illustrative purposes only
Notice the buttons on the right side of each panel? They’re nearly identical to the Active Trader screen, which we described in chapter 8 on futures trading. They contain nearly the same func-tionality as the Active Trader screen, including charts, time and sales, trade confirmations and working orders, and so on. So if you want, you can skip to that section now. But if all you care about is understanding the Forex Trader quote screens and how to place orders, read on.
PRACTICE PRAC-TICE PRACTICE Once you’ve opened a forex account, you might want to practice in a virtual environment until you're comfortable committing real capital. If so, select the paperMoney option on the login screen for thinkorswim. With paperMoney, you can fa-miliarize yourself with all of the trading platform’s features, including how to place an order and manage your positions.
TAKEACTION
FOREX GALORE The Forex Trader page with six panels displayed.
09H
OW
TO
TR
AD
E O
PTI
ON
S, F
UTU
RES
, AN
D F
OR
EX
Forex: All the World's a Trade

140 HOW TO THINKORSWIM TD AMERITRADE 141
GETTING FOREX QUOTES At the top left of each panel in the grid, enter the currency pair symbol to get a quote. To get the symbols, simply click the down arrow on the right of the symbol box (top left of each panel) and choose the forex tab. The currency pairs traded on the thinkorswim platform are all listed there.
Here's an example of EUR/USD (the euro/U.S. dollar pair), for which the current commission-free market is 1.11843 – 1.11854.
for illustrative purposes only
ENTERING FOREX TRADES Once you’ve identified a currency pair you want to trade and you’re looking to enter an order, simply follow these steps:
1—Type the currency pair’s symbol in the sym-bol box (EUR/USD in this example).
2—Adjust the quantity of the position. 3—Click Buy to purchase the pair (or Sell to
sell the pair).
If you’re filled, you’ll see the same confirma-tion box open on your desktop as a stock or option fill, accompanied by the ever-charming thinkorswim platform signature chime.
CHECKING YOUR ROLLOVER RATES An important consideration when trading forex is the payout on overnight interest rates. Each country pays out some interest for holding its currency. In the U.S., for example, it’s the Fed funds rate. You earn that rate if you’re long the U.S. dollar (USD), and you pay that rate if you’re short it. That’s important, because every forex trade is a pairs trade, where you’re buying one currency and shorting another. For example, if you buy the USD/JPY and hold that overnight, you’re buying the U.S. dollar and shorting the Japanese yen.
Because you’re long the dollar, you receive the dollar interest rate. Because you’re short the yen, you pay the yen interest rate. If you hold a currency pair overnight, the net difference between the rate you’re paid and that which you pay, and the method that the interest is debited or credited, is called the rollover. If you hold a position through the close of the trading day at 4 p.m. CT, you'll receive a credit or debit for the financing that is usually posted anytime from 4 to 5 p.m. CT.
for illustrative purposes only
1
23
EUR/USD QUOTE A single panel showing the bid/ask spread of the euro versus the dollar.
TRADING A CURRENCY PAIR EUR/USD quote on the Forex Trader page.
COMMISSION OR NO COMMISSION?Commissions are a fact of life in every market, but that doesn’t mean we can’t make things less complicated for you. Especially when it comes to math. For forex there are two products you can choose from: a product where the quote includes your commission costs, and a product where the quote doesn’t.
In the image below (left), the GBP/USD (simply referred to as the “pound”) is 1.29874 at 1.29889. This 1.5 pip wide market includes your commission. See the switch at the bottom of the quote box? It’s on "Commission-free." So, for instance, if you buy 100,000 GBP/USD at the ask price 1.29889, and then later sell it at 1.29974, you’ve made 8.5 pips, which is $85. No commission costs to subtract from your $85. That’s it.
So what happens if you move the switch to "Commission-based"? See below, right. Now the market is 1.29858 at 1.29867. This bid/ask spread is only 0.9 pips wide compared to 1.5 pips wide for the commission-free quote.
You’ll find the rollover rates page on the MarketWatch tab in the “Financing Rates” submenu. That gives you an idea of the debit or credit for overnight forex positions. There are five fields for each pair: close price, long swap, long P/L, short swap, and short P/L. For example, take a look at the USD/JPY in the image below. The close price is 101.711, the long swap is 2.51 yen, the long P/L is $0.02, the short swap is -42.88 yen, and the short P/L was -$0.42. Note that these prices are for a position of 10,000.
FOREX ROLLOVER RATES To calculate how much interest your long or short currency pair is making or costing you per night, go to Market-Watch > Financing Rates > “Long P/L” or “Short P/L” columns.
for illustrative purposes only
CABLE QUOTE A quote for the GBP vs USD (British pound versus the U.S. dollar). The slang term is “cable.”
A DIFFERENT KIND OF CABLE Also GPB vs USD, but this time it’s the commission-based product.
for illustrative purposes only for illustrative purposes only
09H
OW
TO
TR
AD
E O
PTI
ON
S, F
UTU
RES
, AN
D F
OR
EX
Forex: All the World's a Trade

142 HOW TO THINKORSWIM TD AMERITRADE 143
Forex Trading Q&AIf you’re new to trading forex, and you’ve read everything in this chapter to this point, we figured you might have one or two of the following questions.
Can I trade forex in an IRA? Not at this time.
Can I just start trading forex in my account? You need to open an forex account with us before you can place orders, and it’s easy to do. Forex applications are completed in the TD Ameritrade website. Log in to www.tdameritrade.com and select Client Services > My Profile > General and select the APPLY link next to Forex. In addition (and just like futures), you will also need to have a Margin Account and Tier 2 options trading to be able to apply.
What is the commission on forex trading? If you choose the commission-free option for your forex trades, there isn’t a commission, but it isn’t exactly free. Because mid-market trades do not occur (you can only buy on the offer and sell on the bid), all of the transaction fees are implicitly priced into the quoted markets. Should you choose the commission-based option, forex trades are subject to a fixed-commission structure based on counter-currency units (the second symbol of a pair). For example, the commission from a 1,000-lot EUR/USD trade would be USD $1 ($1 minimum and/or $0.10 per 1,000 units). The commission from a USD/JPY trade of 5,000 units would be JPY ¥90.
When do forex traders sleep? Not often. The forex market is open continuously from Sunday at 4 p.m. CT to Friday at 4 p.m. CT. Because the forex market doesn’t really have a close during that time, the value and profit/loss on any position you hold is calculated at 4 p.m. CT every day.
How much money do I need to trade forex? There’s no minimum account size, but there are margin requirements for forex positions based on the leverage allowed for the currency. For pairs between major currencies, the maximum leverage allowed is 50 to 1. For all other pairs, the maximum leverage allowed is 20 to 1. However, margin requirements can fluctuate and may have leverage lower than the allowable maximum. For exam-ple, using the maximum leverage of 50 to 1, a position that's long 10,000 USD/JPY would have a margin requirement of $200. For 10,000 EUR/USD, the margin is 200 euros. The margin require-ment is based on the first currency of the pair.
Can trades be liquidated automatically? If the equity in your forex account falls to 100% or less of the required margin level at 4 a.m. ET, market orders are automatically entered to liquidate all positions in your account. In addition, if at any time your account equity falls to 25% or less of the required margin level, market orders are automatically entered to liquidate all positions in your account at that time.
Note also that you can trade only on funds in your forex account that have cleared. Any funds in transit, or promised funds, are not credited to your account until they are received by TD Ameritrade and cleared. It's important to note that, even if you have sent funds, we may close your open positions if the funds are not in the forex portion of the account.
Forex trading involves leverage, carries a high level of risk, and is not suitable for all investors. Please read the Forex Risk Disclosure (http://www.nfa.futures.org/NFA-investor-information/publication-library/forex.pdf) prior to trading forex products.
Forex accounts are not protected by the Securities Investor Protection Corporation (SIPC). Forex trading services provided by TD Ameritrade Futures & Forex LLC. Trading privileges subject to review and approval. Not all clients will qualify. Forex accounts are not available to residents of Ohio or Arizona.
But notice that the name in the right-hand ticker box is GBP/USD#. That hash tag at the end sig-nifies this is the commission-based forex product, and it also indicates that this is not the same as the commission-free forex product. You cannot close a GBP/USD trade with GBP/USD#. You’ll see this warning and reminder at the bottom of the trade confirmation box.
ORDER WARNING Forex order ticket show-ing a warning that you’re about to enter an order that could mix commis-sion-free and commis-sion-based products.
for illustrative purposes only
So the commission product gives you get a tighter bid/ask spread, but then you don't need to factor in your commission costs per trade. Which is better? Neither. It’s up to you.
09H
OW
TO
TR
AD
E O
PTI
ON
S, F
UTU
RES
, AN
D F
OR
EX
Forex: All the World's a Trade

144 HOW TO THINKORSWIM TD AMERITRADE 145
CHAPTER 10146 / Goin’ Mobile: iPhoneIf you’re on your iPhone anyway, you might as well be trading.
CHAPTER 11 160/ Goin’ Mobile: AndroidNo less amazing, Android makes it just as easy to fall in love with mobile trading.
There’s something magical about trading from a park bench while Junior swings from the jungle gym. And whether you’re using an iPhone or Android, thinkorswim Mobile is one awesome trading platform.
FUN WITHMOBILE TRADING
145144 HOW TO THINKORSWIM TD AMERITRADE

146 HOW TO THINKORSWIM TD AMERITRADE 147
Mobile trading just got real. With many of the same features as the thinkorswim desktop, you can’t claim lack of bells to ring or whistles to blow. But since it’s a different look and feel, it’s worth getting to know the buttons to push.
Goin’ Mobile:iPhone
Download & Log InQuotesPositionsOrdersOption ChainTradingSettings & CustomizationSupport Chat
147
148
149
151
152
153
157
158
you’re mobile. If you’re not mobile, you should be. And since you’re now on board with thinkorswim desktop, you need to meet her sister companion, thinkorswim Mobile for iPhone. Seriously. Download this app now if you don’t have it. (Android users, skip to chapter 11.)
While your friends are crushing candy, you’ll be crushing vol using more chart features than you can shake your iPhone at. Not to mention, you get all kinds of alerts and event notifications, along with a wide range of features. Let 1.21 gigawatts of trading technology give you the freedom to trade stocks, options, complex spreads, futures, and forex ’til your fingers bleed.
On board? Good. Now here’s how to get it, fire it up, and trade with it.
If you’re serious about trading,
HOW’RE WE DOING? At some point, do us a solid and rate your experience. Below Security Statement, tap Feedback. Our developers love hearing from you.
TAKEACTION
TAKE ACTIONDownload and Log In
You can download the thinkorswim Mobile app from the App Store on your iOS device. Tap the “Search” icon, type thinkorswim, and select “thinkorswim Mobile.” From there, follow your normal app download process.
To log in:1—Select Live Trading or Paper Money. Dis-
played in green, Live Trading accesses your trading account. paperMoney, displayed in yellow, is a virtual trading environment.
2—Enter your username and password using the same credentials you use to access thinkorswim or any of our other trading platforms.
3—If you prefer, tap on Remember Me to store your password.
4—If you want to hide your account balances while using the app, tap on Privacy Mode.
5—Once you’re ready, tap Login and you’re good to go.
for illustrative purposes only
FUN
WIT
H M
OB
ILE
TRA
DIN
G10
The paperMoney® trading software application is for educational purposes only. Successful virtual trading during one time period does not guarantee successful investing of actual funds during a later time period as market conditions change continuously.
12
3
4
5
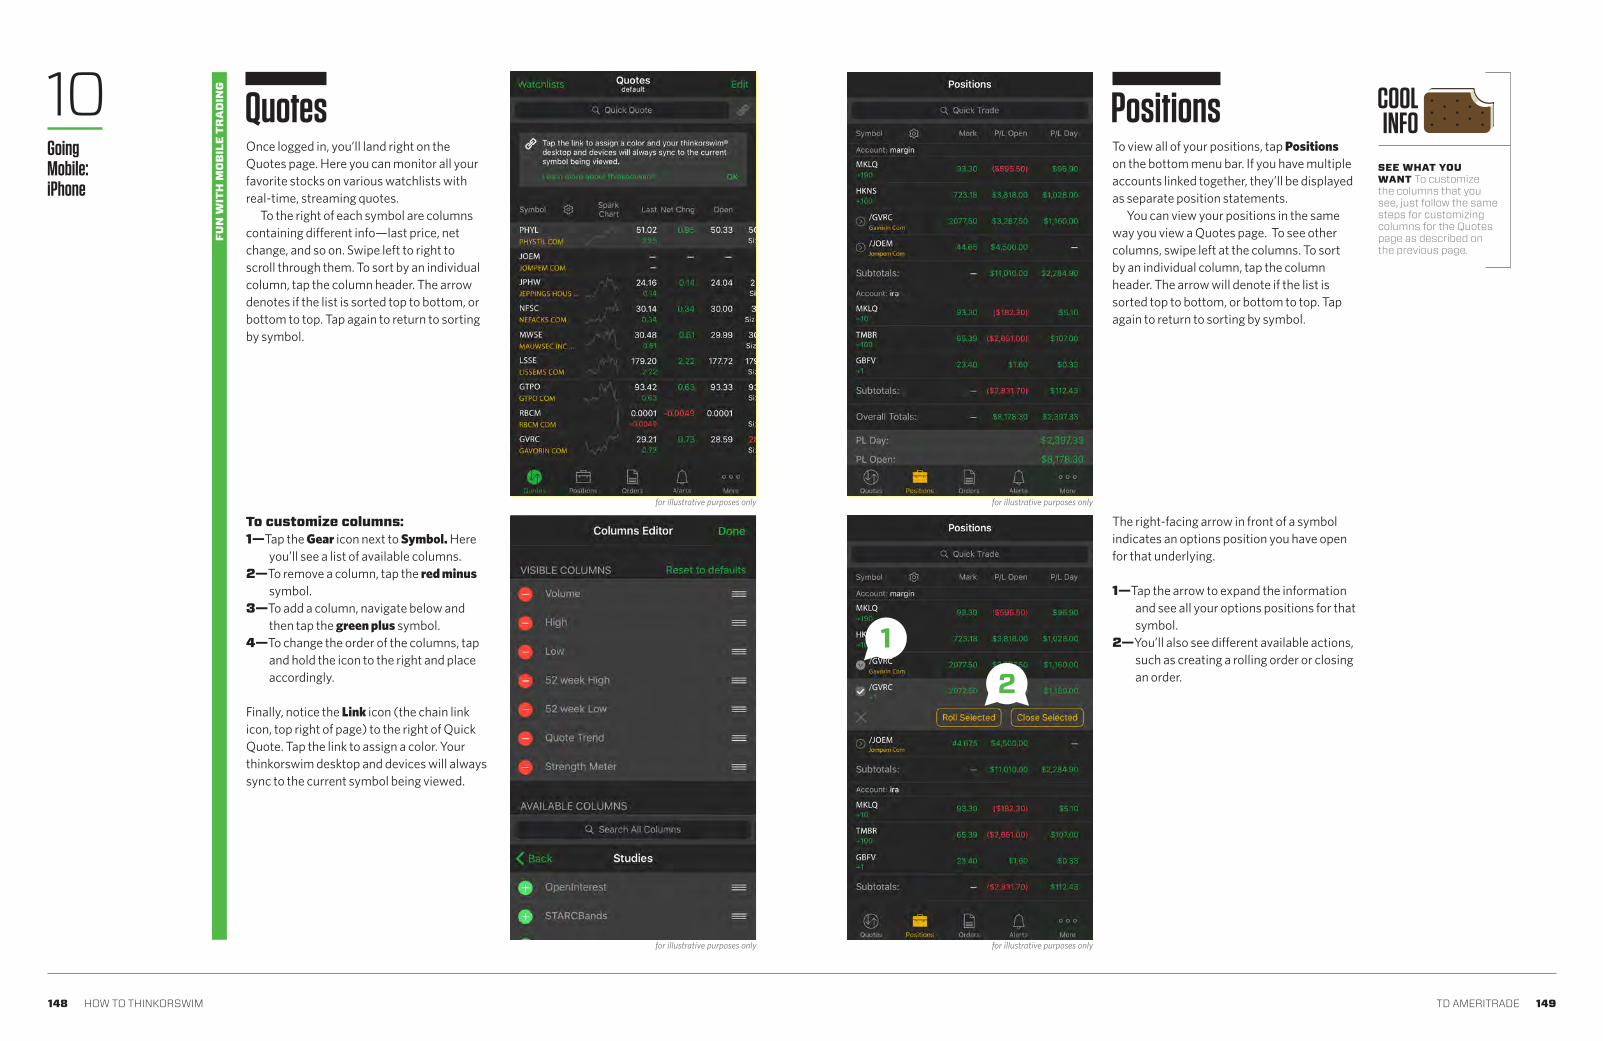
148 HOW TO THINKORSWIM TD AMERITRADE 149
Once logged in, you’ll land right on the Quotes page. Here you can monitor all your favorite stocks on various watchlists with real-time, streaming quotes.
To the right of each symbol are columns containing different info—last price, net change, and so on. Swipe left to right to scroll through them. To sort by an individual column, tap the column header. The arrow denotes if the list is sorted top to bottom, or bottom to top. Tap again to return to sorting by symbol.
To view all of your positions, tap Positions on the bottom menu bar. If you have multiple accounts linked together, they’ll be displayed as separate position statements.
You can view your positions in the same way you view a Quotes page. To see other columns, swipe left at the columns. To sort by an individual column, tap the column header. The arrow will denote if the list is sorted top to bottom, or bottom to top. Tap again to return to sorting by symbol.
The right-facing arrow in front of a symbol indicates an options position you have open for that underlying.
1—Tap the arrow to expand the information and see all your options positions for that symbol.
2—You’ll also see different available actions, such as creating a rolling order or closing an order.
To customize columns: 1—Tap the Gear icon next to Symbol. Here
you’ll see a list of available columns. 2—To remove a column, tap the red minus
symbol. 3—To add a column, navigate below and
then tap the green plus symbol. 4—To change the order of the columns, tap
and hold the icon to the right and place accordingly.
Finally, notice the Link icon (the chain link icon, top right of page) to the right of Quick Quote. Tap the link to assign a color. Your thinkorswim desktop and devices will always sync to the current symbol being viewed.
for illustrative purposes only for illustrative purposes only
for illustrative purposes only for illustrative purposes only
SEE WHAT YOU WANT To customize the columns that you see, just follow the same steps for customizing columns for the Quotes page as described on the previous page.
COOLINFOQuotes Positions10
Going Mobile:iPhone
FUN
WIT
H M
OB
ILE
TRA
DIN
G
12

150 HOW TO THINKORSWIM TD AMERITRADE 151
To get greater detail on a given position, tap on the position itself. Then, below the Sell and Buy buttons, you can select:
Close Position to enter an order to close your current position.
Create Alert to set an alert for the symbol.
Show Details to see the quote page for the symbol.
Remove from Current WL to remove the symbol from your watchlist.
At the bottom of the Positions page you’ll see vital account information including the profit and loss for the day, profit and loss since all positions were opened, the account net liqui-dation value, and the available buying power.
Tap Orders on the bottom menu to see all Working, Filled, Canceled, and Saved orders. You also have the ability to see all your order history in one list.
Columns here can be sorted and customized just like the other lists (Quotes and Positions).
If you prefer to see order information in one area, tap Hide Columns. This chang-es the layout of the information to include everything on one line sorted by the time of the order.
Tap the order for additional information and to cancel, cancel and replace, and create similar or opposite orders. You can also cre-ate alerts, show quote details, and share your order with others. But don’t let all this power go to your head.
To view account balances, tap More at the bottom right-hand corner. From the menu select Balances. Here you’ll see a list of differ-ent balances for your account.
To customize this list, select Edit in the upper right-hand corner and adjust to your heart’s content.
for illustrative purposes only
for illustrative purposes only
for illustrative purposes only
for illustrative purposes only for illustrative purposes only
PRIVACY, PLEASE If you don’t want your vital numbers on display for the guy next to you on the bus or in the grocery line, turn on Privacy Mode by scrolling to the bottom of the Balances page and tapping the slider.
COOLINFO
Orders
MO
BIL
E TR
AD
ING10
Going Mobile:iPhone
FUN
WIT
H M
OB
ILE
TRA
DIN
G

152 HOW TO THINKORSWIM TD AMERITRADE 153
To access the option chain, tap a symbol on your watchlist or type in a specific symbol or company name to bring up the quote details. Below the stock details, you’ll see various tabs. Select Options to view the option chain. To customize the option chain:
1—By default, you see quotes for single op-tions. To view quotes for different option spreads, tap Single and select a spread type from the list. For advanced traders who understand how to build different option spreads, select Custom inside this window. This allows you to tap mul-tiple option strikes at once, thus building a spread while looking at quotes for the individual options. Tap an individual leg to change quantity and buy/sell, then click Done.
2—To change the number of strikes displayed, tap Strikes, select a number, then tap Strikes again.
3—Expanding or collapsing a particular option series is also easy. Tap once to expand the series, and again to close.
You can customize the columns on this page just like any other.
Tap and hold a price to access the Option Details page. This page provides specific strike details, access to charting single op-tions, alert information, and the ability to add a specific strike price to a watchlist.
Access the Quote Details page by tapping a symbol on your watchlist or by typing in a specific symbol or company name, and then tapping Done. At the top of the quote details page you’ll see the symbol and description followed by the last traded price, the net change, and percentage net change. To the right are the current bid and ask prices for the symbol being displayed.
Tap the arrow to the left of the last price to see more information, including volume, volatility, open, high, low, and close, as well as other stock fundamentals.
Ready to pull the trigger and trade? Click Trade in the upper right corner, and turn to the next page.
for illustrative purposes only for illustrative purposes only
for illustrative purposes only for illustrative purposes only
TradingOption Chain
MO
BIL
E TR
AD
ING10
Going Mobile:iPhone
FUN
WIT
H M
OB
ILE
TRA
DIN
G
1
23
Clickto see data
Place atrade

154 HOW TO THINKORSWIM TD AMERITRADE 155
After tapping the Trade command, you’ll be taken to the Order Editor.
1—At the top left are the symbol and number of shares currently selected for your order. By default, the pending order is Buy, which is green. (You can tap Sell to change the action, which, of course, is red.)
2—Tap the arrows to the right to scroll be-tween order types, or simply tap and hold until the full menu of choices appears. Choose from market, limit, stop, stop lim-it, trailing stop, market on close (MOC), and limit on close (LOC).
3—Edit the quantity and price.4—For some accounts, you may see a field
called Position Effect. This denotes whether the pending order will be To Open or To Close a position. For other accounts this will automatically be differentiated.
5—If necessary, edit the TIF, which stands for “time in force.” You can specify a day order, GTC (good ’til canceled), EXT (ex-tended hours), and GTC EXT, which is a “good ’til canceled extended hours” order.
6—Tap Confirm in the upper right-hand cor-ner. Here you can review the order ticket one last time. If you need to make any changes, tap Edit in the upper left-hand corner. To save your order, tap Save Order at the bottom. This saves your order to be placed at another time.
7—Once you’re ready, tap Send in the up-per right-hand corner to begin working your order.
for illustrative purposes only for illustrative purposes only
for illustrative purposes only
1
2
Tap and choose
a spread like “iron condor”
PLACING A SINGLE OPTION ORDER1—Navigate to the Quote Details page as
described earlier and tap on the Options tab below the quote details.
2—To trade a single option, simply tap on the Bid price to create a sell order ticket or the Ask price to create a buy order ticket. From here, follow steps 3 through 7 from the previous page to place your order.
PLACING SPREAD ORDERSYou can place option spread orders a couple different ways.
First, from the option chain, tap the strat-egy to the right of Spread. Tap on Single to view a list of the various option spreads. For example, if you select iron condor (pictured), each bid and ask price displays the net bid and ask price of the iron condor spread. Then just tap on the Bid or Ask and follow steps 3 through 7 from the previous page to place your order.
10Going Mobile:iPhone
FUN
WIT
H M
OB
ILE
TRA
DIN
G 12
4
5
6
3
7
for illustrative purposes only

156 HOW TO THINKORSWIM TD AMERITRADE 157
Another way to build option spread orders is by tapping on the same Spread menu and selecting Custom. Here you can tap individ-ual strike prices to build spreads with up to four legs. You can also adjust the quantity by tapping on the selected option. Then, go back to steps 3 through 7 to place your order.
for illustrative purposes only
MO
BIL
E TR
AD
ING
for illustrative purposes only
To customize your experience, go back to the More button in the bottom right-hand corner and then tap Settings. You’ll be taken to the Settings screen you see here. Have a look at the table below to see what each of the screen functions does for you.
Settings and Customization
FUNCTION WHAT IT DOES
10Going Mobile:iPhone
FUN
WIT
H M
OB
ILE
TRA
DIN
G
Tap and choose
“Custom”
GROUP BY ACCOUNT
DEFAULT ACCOUNT
LOOK & FEEL
SECURITY
NOTIFICATIONS
VERSION
Choose to display account information by each individual account, or combined.
Tap the arrows left or right and select which account you prefer to access immediately after logging in.
You can choose between a dark or light theme to match your superhero persona.
• Tap on the button next to Privacy mode. This will hide balances and account information while you use the app.
• Next, configure the amount of time you would prefer the app to request a password for trading actions. The password will be requested when the specified interval has expired.
• If you wish to bypass typing your password in to trade, enable Touch ID authentication. This enhances security, as well as making password verification more efficient when placing trades.
Turn off message sound notifications and manage push notifications based on the type of message. Also, manage your devices that receive notifications.
This may help if you contact our support teams for help. The current version number helps them diagnose any issues and provide you with efficient customer service.

158 HOW TO THINKORSWIM TD AMERITRADE 159
for illustrative purposes only
for illustrative purposes only
Have a question or need help? No problem. We’ve created an awesome, industry-first experience for requesting help with the mobile app.
To start a support chat:1—Tap More in the bottom right-hand corner
of the Settings screen and select Help/Support at the bottom left.
2—Tap Support Chat. 3—Select the Help Type, such as “Mobile Ap-
plication Support.”4—Type a question and tap Post.
You’ll notice that the functionality is exactly like texting. The chat will appear with your questions and comments in green, and the support associate’s in gray.
In addition to instant messaging support, the support representative can actually view your screen if you want them to.
Once the support rep requests to see your screen, tap the check mark to allow access. Don’t worry, they won’t be able to see anything else on your phone—just the trading app. Every time the rep taps the mouse, a highlight bubble will appear directing you where to look or touch. Hey, we said it’d be awesome.
Once your questions have been answered, simply close the request and it’ll be logged in your Recent Chat sections. You can review the chat for the next seven days.
Support Chat10Going Mobile:iPhone
Help videos are avail-able in the app. Find them by selecting More > Help/Support > Help & Learning.
WATCH A VIDEO
FUN
WIT
H M
OB
ILE
TRA
DIN
G
Screen is shared

160 HOW TO THINKORSWIM TD AMERITRADE 161
If you’re on Android, you’re also in luck. No less awesome than iPhone, trading without desk-top borders has never been more fun. Here’s how to push all the buttons.
Goin’ Mobile: Android
Download & Log InAccount OverviewQuotes & WatchlistsPositionsOrdersOption ChainTradingSettings & Customization
161
162
163
164
166
167
168
172
of our mobile trading platform is, of course, thinkorswim Mobile for Android. Most of the features you’ll also find in the iPhone version (previ-ous chapter). But there are several nuances to the navigation that are very different.
That said, if you’re trading on iPhone, you’re on the wrong page! Jump back to the last chapter for all things iOS.
You can download the thinkorswim Mobile app from the Google Play Store on your Android device. In Search, simply type thinkorswim and select thinkorswim Mobile. From here follow your normal app download process.
To log in:1—Select Live Trading or Paper Money. Dis-
played in green, Live Trading accesses your trading account. paperMoney, displayed in yellow, is a virtual trading environment.
2—Enter your username and password, using the same credentials you use to access thinkorswim or any of our other trading platforms.
3—If you prefer, tap on Remember me? to store your password.
4—If you wish to mask your account balances while using the app, tap on Privacy Mode.
5—Once you’re ready, tap Log In and you’re ready to trade.
The other half
Download and Log In
for illustrative purposes only
for illustrative purposes only
11FU
N W
ITH
MO
BIL
E TR
AD
ING
The paperMoney® trading software application is for educational purposes only. Successful virtual trading during one time period does not guarantee successful investing of actual funds during a later time period as market conditions change continuously.
FUN
WIT
H M
OB
ILE
TRA
DIN
G
1
23
4
5

162 HOW TO THINKORSWIM TD AMERITRADE 163
At some point, you may want to chat with a human or just give us feedback on your expe-rience using the app. In the upper right corner, press the menu button to find a dropdown of-fering the Contact us and Feedback features. Give Feedback a whirl and shout from the mountaintop how much you love the app.
Ready to create a watchlist? Pull up the main menu by tapping the menu icon at the top left of the screen (three horizontal lines). Then do the following:
1—Click on Watchlist in the menu and you’re taken to the Quotes page. Here you can monitor all your favorite stocks on vari-ous watchlists.
2—To the right of each symbol are columns containing different info—last price, net change, and so on. Swipe left to right to scroll through them.
3—To sort by an individual column, tap the col-umn header. The arrow denotes if the list is sorted top to bottom or bottom to top. Tap again to return to sorting by symbol.
Once logged in, you’ll be placed on the Account Overview page. Here you can monitor your vital account information, such as Orders and Alerts, Positions, and Balanc-es. Stream premium media and gain market insights via our live Chat Rooms.
To customize the Account Overview page:1—Click the gear icon to see a list of available
components. 2—To remove a component, tap the eye icon. 3—To add a component, tap the eye icon. 4—To change the order, tap and hold the icon
to the right and place accordingly.
By selecting any of the components, you’ll navigate to that page in the app. You can also navigate through the app by selecting the icon in the upper left-hand corner to trigger the side menu.
for illustrative purposes only for illustrative purposes only
for illustrative purposes only for illustrative purposes only
Account Overview
Quotes & Watchlists11Going Mobile:Android
MO
BIL
E TR
AD
ING
Customizing columns in Watchlists is easy. 1—Tap the gear icon next to “Symbol.” Here
you’ll see a list of available columns. 2—To remove a column, tap the green eye
symbol to the left of the active features. This grays out the feature and places it at the bottom of the active feature list.
3—To add a column, navigate to the bottom of the page to the list of inactive features be-low the active list. Tap one of the features to activate it. Go back to your watchlist and scroll the screen right or left to see the feature now active.
4—To change the order of the columns, tap and hold the icon to the right and place accordingly.
5—Finally, notice the Link icon to the right of Symbol Search. Tap the link to assign a color and your thinkorswim desktop and devices will always sync to the current symbol being viewed.
FUN
WIT
H M
OB
ILE
TRA
DIN
G
Tap upper menu to
reach us or give feed-
back
1
2
3
4
51
1
2
2
3
3
4

164 HOW TO THINKORSWIM TD AMERITRADE 165
The right-facing arrow in front of a symbol (see image on previous page) indicates an option position for that underlying. Tap the arrow to expand the information and see all your option positions for that symbol (see image at left). At the bottom, you will see different actions, including creating a rolling order or exercising a long option (not shown).
At the bottom of this page you’ll also see vital account information including the profit and loss for the day, profit and loss since all positions were opened, the account net liqui-dation value, and the available buying power.
TO VIEW ACCOUNT BALANCES Select the $ icon in the upper right or select the side menu and tap Balances. Here you’ll see a list of different balances for your account.
To customize this list, select the gear icon in the upper right-hand corner and adjust to your heart’s content.
Finally, you can turn on Privacy Mode by sliding the circle button next to the eye icon.
To view account positions, tap Positions in the side menu or Account Overview. If you have multiple accounts linked together, they’ll be displayed as separate position statements.
You can view your positions in the same way you view a Quotes page. (See the five steps on the previous page.) To see other columns, swipe left. To sort by an individual column, tap the column header. The arrow will indicate if the list is sorted top to bottom or bottom to top. Tap again to return to sorting by symbol.
To get more details on a given position, tap on the position itself. Then, below the Sell and Buy buttons, you can select:
Close Position to enter an order to close your current position.
Create Alert to set an alert for the symbol.
Show Details to see the quote page for the symbol.
Remove from Current WL to remove the symbol from your watchlist.
To customize columns: 1—Click the Gear icon next to Symbol. Here
you will see a list of available data points.2—To remove a data point, tap the eye
symbol.3—To add a data point, navigate below and
then tap the eye symbol.4—To change the order of data points,
tap and hold the icon to the right and place accordingly.
for illustrative purposes onlyfor illustrative purposes only
for illustrative purposes only
Positions
MO
BIL
E TR
AD
ING11
Going Mobile:Android
FUN
WIT
H M
OB
ILE
TRA
DIN
G
COOLINFO
PRIVACY, PLEASEIf you don’t want your vital numbers on display for the guy next to you on the bus or in the grocery line, turn on Privacy Mode at the top of the Balances page by sliding the circle button next to the eye icon.

166 HOW TO THINKORSWIM TD AMERITRADE 167
Tap Orders in the main menu to see all work-ing, filled, canceled, and saved orders. You also have the ability to see all order history in one list.
To sort by an individual column, tap the column header. The arrow will denote if the list is sorted top to bottom, or bottom to top. Tap again to return to sorting by symbol.
If you prefer to see order information bro-ken out, tap the icon in the upper right-hand corner. This will change the layout to include everything in column order. Tap on the col-umn header to sort. The arrow will denote if the list is sorted top to bottom, or bottom to top. Tap again to return to sorting by symbol.
Tap the order for additional order informa-tion and to cancel, cancel and replace, and create similar or opposite orders. You can also create alerts, show quote details, and share your order with others.
To access the option chain, tap a symbol on your watchlist or type in a specific symbol or company name to bring up the quote details. Below the stock details, you’ll see various tabs. Select Options to view the option chain.
To customize the option chain:1—By default, you see quotes for single
options. To view quotes for different option spreads, tap Single and select a spread type from the list. Tap an individ-ual leg to change quantity and buy/sell, then click Done. (For advanced traders who understand how to build different option spreads, select Custom inside this window. This allows you to tap multiple option strikes at once, thus building a spread while looking at quotes for the individual options.)
2—To change the number of strikes displayed, tap Strikes, select a number, then tap Strikes again.
3—Expanding or collapsing a particular option series is also easy. Tap once to expand the series, and again to close.
You can also customize the columns on this page first by clicking the Gear icon. Here you will see a list of available data points. To remove a data point, tap the eye symbol. To add a data point, navigate below and then tap the eye symbol. To change the order of data points, tap and hold the icon to the right and place accordingly.
To get more information on a single op-tion contract, tap and hold a price to access the Option Details page (image, left). This page provides specific strike details, access to charting single options, alert information, and the ability to add a specific strike price to a watchlist.
for illustrative purposes only for illustrative purposes only
for illustrative purposes only for illustrative purposes only
Orders Option Chain
MO
BIL
E TR
AD
ING11
Going Mobile:Android
FUN
WIT
H M
OB
ILE
TRA
DIN
G1
2
3
Tap for custom
layout
Tap orders to manage

168 HOW TO THINKORSWIM TD AMERITRADE 169
Access the Quote Details page by tapping a symbol on your watchlist. (Alternatively, in the Quick Quote fill-in at the top of the main menu, enter a symbol or company name, and tap Done from the onscreen keyboard.) At the top of the new page, you’ll see the symbol and description followed by the last traded price, the net change, and percentage net change. To the right are the current bid and ask prices for the symbol being displayed.
Tap the arrow to the left of the last price to expand and see more information. Items include volume, volatility, open, high, low, and close information, as well as other stock fundamentals.
PLACING A MOBILE STOCK ORDERFirst off, tap Trade at the bottom of the Quote Details page. This places you in the Order Editor.
1—At the top left are the symbol and number of shares currently selected for your order. By default, the pending order is Buy, which is green. (You can tap Sell to change the action, which, of course, is red.)
2—Edit the Quantity. 3—Choose the order type. Tap to the right
and left to scroll between order types, or simply tap and hold until the full menu of choices appears. Choose from market, limit, stop, stop limit, trailing stop, market on close (MOC), and limit on close (LOC).
4—If it’s a limit order, edit the limit price. 5—Tap Confirm in the lower left corner. 6—Here you can review the order ticket one
last time. If you need to make any changes, tap the left arrow in the upper left-hand corner next to Order Confirmation to go back to the edit screen from which you came. To save your order, tap Save in the upper right-hand corner. This will save your order to be placed at another time.
7—Once you’re ready, tap Send Order at the bottom of the Order Confirmation screen.
for illustrative purposes only for illustrative purposes only
for illustrative purposes only
Trading
MO
BIL
E TR
AD
ING11
Going Mobile:Android
FUN
WIT
H M
OB
ILE
TRA
DIN
G
6
7
1
4
5
23
Tap arrow to get more
details
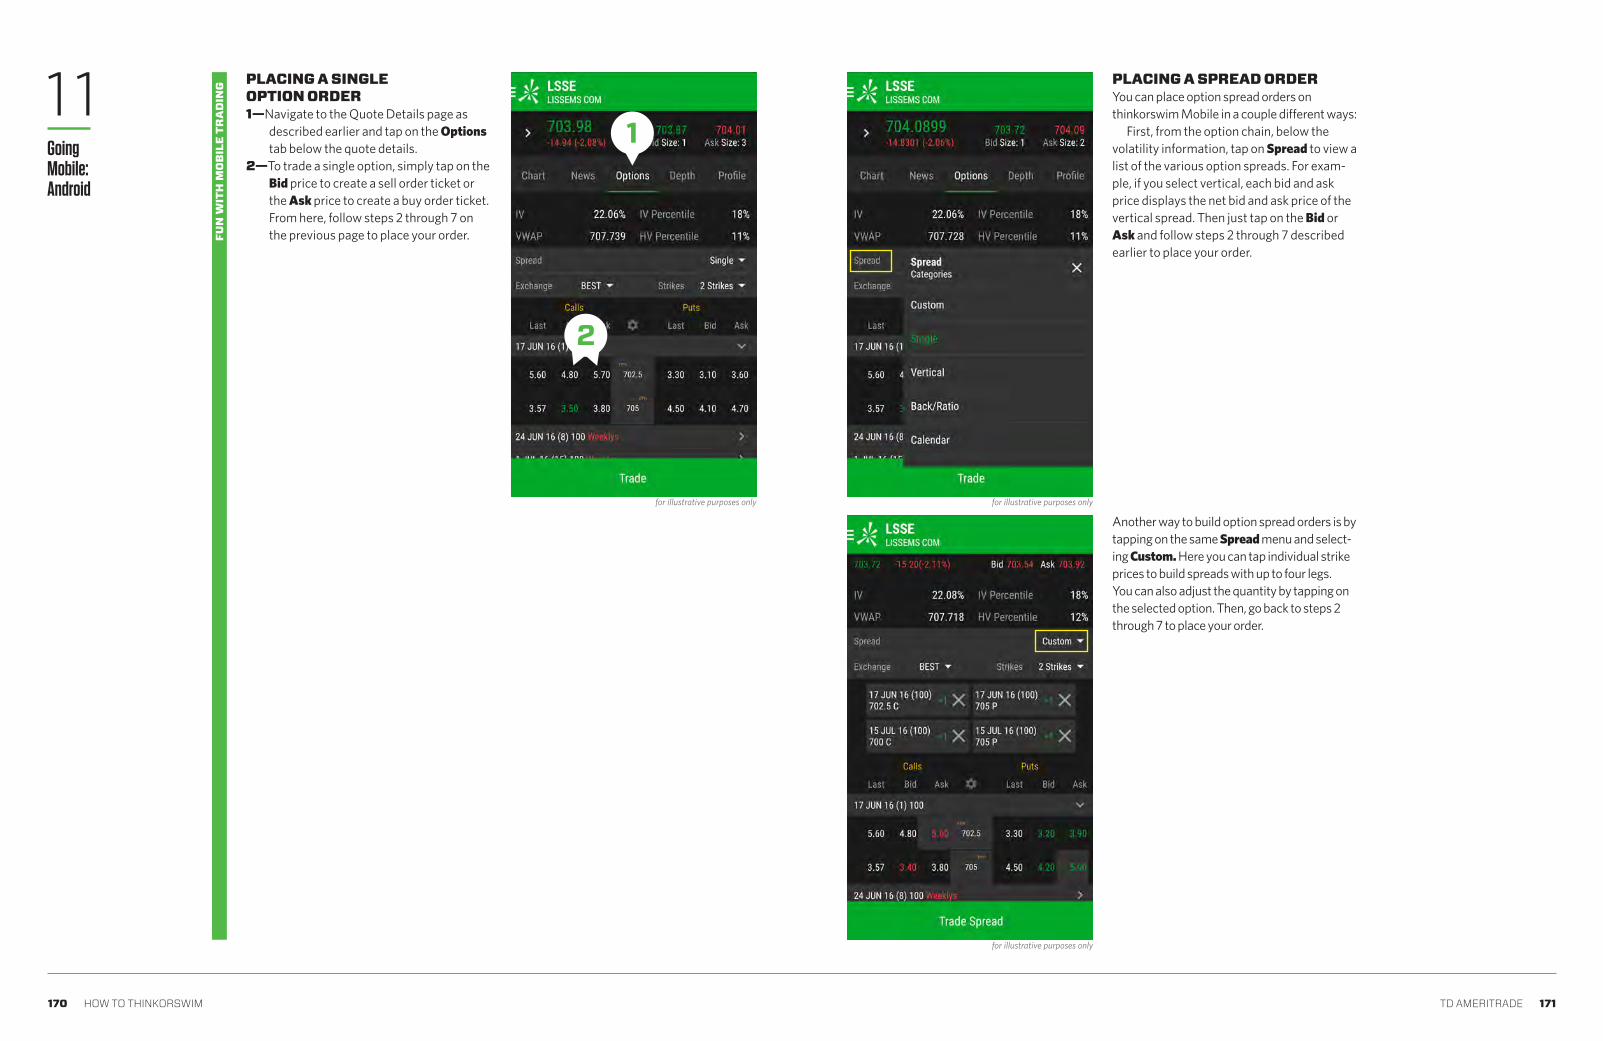
170 HOW TO THINKORSWIM TD AMERITRADE 171
PLACING A SINGLE OPTION ORDER1—Navigate to the Quote Details page as
described earlier and tap on the Options tab below the quote details.
2—To trade a single option, simply tap on the Bid price to create a sell order ticket or the Ask price to create a buy order ticket. From here, follow steps 2 through 7 on the previous page to place your order.
PLACING A SPREAD ORDERYou can place option spread orders on thinkorswim Mobile in a couple different ways:
First, from the option chain, below the volatility information, tap on Spread to view a list of the various option spreads. For exam-ple, if you select vertical, each bid and ask price displays the net bid and ask price of the vertical spread. Then just tap on the Bid or Ask and follow steps 2 through 7 described earlier to place your order.
for illustrative purposes only for illustrative purposes only
for illustrative purposes only
MO
BIL
E TR
AD
ING11
Going Mobile:Android
FUN
WIT
H M
OB
ILE
TRA
DIN
G
1
2
Another way to build option spread orders is by tapping on the same Spread menu and select-ing Custom. Here you can tap individual strike prices to build spreads with up to four legs. You can also adjust the quantity by tapping on the selected option. Then, go back to steps 2 through 7 to place your order.

172 HOW TO THINKORSWIM TD AMERITRADE 173
SUPPORT CHATHave a question or need help? No problem. We’ve created an awesome, industry-first experience for requesting help with the mobile app.
To start a support chat, from the side menu, select Help/Support. Then tap Sup-port Chat. Select the “TDA Mobile Applica-tion Support” item in the Help Type screen.
Type a question and hit Send. You’llnotice the functionality is exactly liketexting. The chat will appear with yourquestions and comments in green, andthe support associate’s in gray.
for illustrative purposes only for illustrative purposes only
for illustrative purposes only
To customize your thinkorswim Mobile experience, tap Settings in the side menu.
Settings and Customization
FUNCTION WHAT IT DOES
MO
BIL
E TR
AD
ING11
Going Mobile:Android
Help videos are available in the app! Find them via the side navigation menu > Help/Support > Help & Learning.
WATCH A VIDEO
Typeyour
questions here
FUN
WIT
H M
OB
ILE
TRA
DIN
G
COLOR THEME
PRIVACY MODE
GROUP ORDERS & POSITIONS
NOTIFICATIONS
You can choose between a Dark or Light theme to match your superhero persona.
This will hide balances and account information while you use the app.
Choose to display account information by each individual account, or combined.
Turn off message sound notifications and manage push notifications based on the type of message. Also, manage your devices that receive notifications.
Click to chat
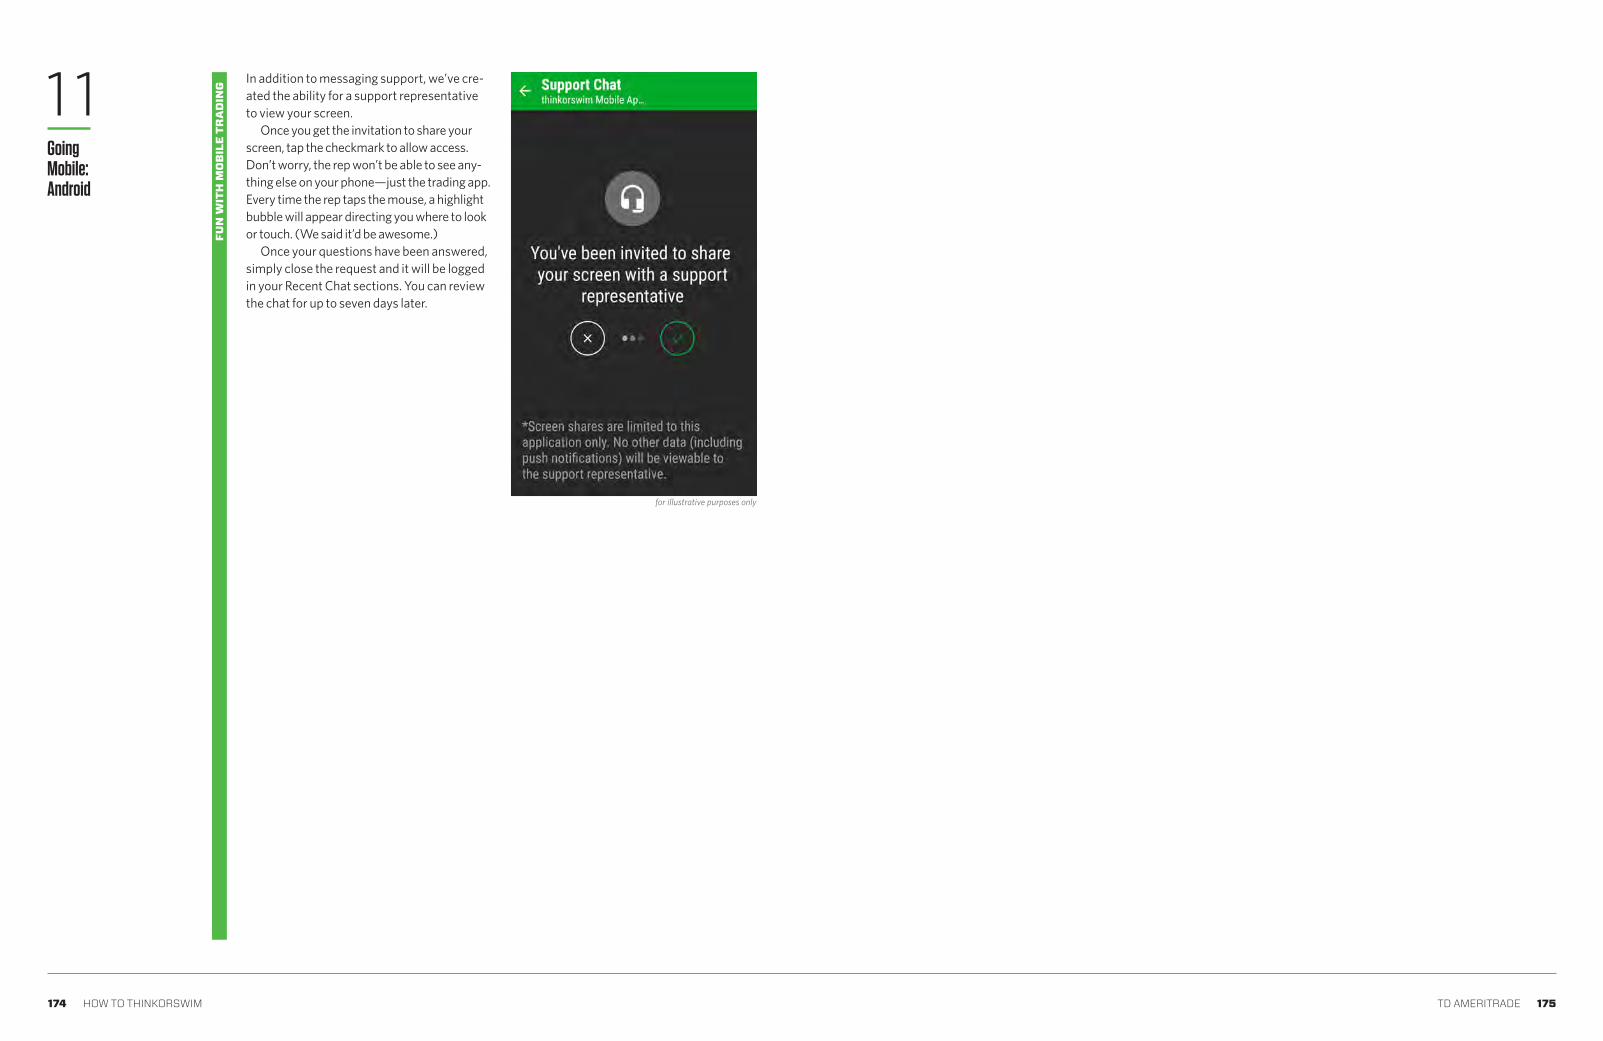
174 HOW TO THINKORSWIM TD AMERITRADE 175
for illustrative purposes only
In addition to messaging support, we’ve cre-ated the ability for a support representative to view your screen.
Once you get the invitation to share your screen, tap the checkmark to allow access. Don’t worry, the rep won’t be able to see any-thing else on your phone—just the trading app. Every time the rep taps the mouse, a highlight bubble will appear directing you where to look or touch. (We said it’d be awesome.)
Once your questions have been answered, simply close the request and it will be logged in your Recent Chat sections. You can review the chat for up to seven days later.
MO
BIL
E TR
AD
ING11
Going Mobile:Android
FUN
WIT
H M
OB
ILE
TRA
DIN
G
176 HOW TO THINKORSWIM TD AMERITRADE 177
Abandon The act of not exercising or selling an
option before its expiration.
Accrued Interest The interest due on a bond since the last interest payment was made, up to but not including the settlement date. Anyone wishing to buy the bond pays the market price of the bond plus any accrued interest. Conversely, anyone selling a bond will have the proceeds increased by the amount of accrued interest.
Adjusted Option An option resulting after an event such as a stock split, stock dividend, merger, or spin-off. An adjusted option may represent some amount other than the 100 shares that are standard in the U.S. For example, after a 2-for-1 stock split, the adjusted option will represent 200 shares. For certain adjusted options, the multiplier of the option may be something other than the $100 that is standard in the U.S.
All-or-None Order (AON) An order that must be filled completely when the order is executed or not filled at all. Partial fills are not allowed on this type of order.
American Depositary Receipt (ADR) Foreign company equities traded on a U.S. exchange. The ADR is issued by a U.S. bank repre-senting a specified number of the foreign company's shares, which are held in trust by the bank. ADRs facilitate the trading of foreign stocks in U.S. markets. ADRs have exposure to currency fluctuations.
American-Style Option An option contract that can be exercised at any time from the time the option is purchased, up to and including the option’s expiration date.
Arbitrage The simultaneous purchase and sale of identical or equivalent financial instruments in order to benefit from a discrep-ancy in their price relationship.
Ask or Offer The price at which a seller is offering to sell a security, that is, the price at which an investor may purchase a stock or option.
Assigned To have received notification of an assignment on short options by the Options Clearing Corporation (OCC) through a broker.
Automated Exercise The Options Clearing Corporation (OCC) uses this procedure to exercise in-the-money options at expiration. Doing so protects the owner of the option from losing the intrinsic value of the option because of the owner's failure to exercise. Unless instructed not to do so by the owner of the option (through the owner's broker), the OCC will exercise all expiring equity options that are held in client accounts if they are in the money by 0.01 or more. TD Ameritrade will automati-cally exercise an option position if it is 0.01 or more in the money at expiration unless the option’s owner instructs otherwise.
Automated Order Entry System Some exchanges have computerized systems designed to route stock and
option orders directly to the trading pit. They are intended to speed the execution of orders. These systems generally have limits on the size of orders. Examples include RAES, AUTO EX, and SUPERDOT.
Back Months A some-what arbitrary term that
refers to classes of options with expiration months that are further dated than the option class with the nearest expiration month.
Backspread An option position composed of either all calls or all puts, with long options and short options at two different strike prices. The options are all on the same stock and usually of the same expiration, with more options purchased than sold. For example, an 80/90 put 1-by-3 backspread is long three 80 puts and short one 90 put.
Backtesting The process of testing a strategy based on prior market conditions and time periods. Note that past perfor-mance of a security or strategy does not guarantee future results or success.
Basis Generally referring to the futures markets, the basis is the difference between the cash price of the underlying com-modity and the price of a futures contract based on that underly-ing commodity. Cash price minus futures price equals basis.
Basis Point A 0.01% tick on a 1.00% scale used to describe the yields of interest rates or interest rate products. For example, when the U.S. Federal Reserve
how to thinkorswim
Glossary
A
B
raises the discount rate 25 basis points, the discount rate goes from 5.00% to 5.25%.
Basis Risk The risk of the basis between the cash price and the future price widening or narrowing between the time a hedge position is implemented and liquidated.
Bear Someone who believes the price of a security or the market will go lower.
Bear Spread Generally speak-ing, any spread that is designed to profit when the market moves down. Specifically, it refers to a vertical spread.
Beta A measure of the return (in percentage terms) on a stock rel-ative to the return (in percentage terms) of an index. For example, a stock with a beta of 0.80 should have a percentage net change equal to 80% of the percentage net change of the index. Therefore, if the index is down 2%, the stock in question should be down 1.6% (0.80 x 2%).
Bid The price of a stock or option at which a buyer is willing to pur-chase a security; the price at which a client may sell a security.
Bid/Ask (Offer) Spread The difference between the bid and ask prices for a stock or option.Binomial Model A mathematical model used to price options. Generally used for American-style options, the model creates a binomial lattice to price an option based on the stock price, strike price, days until expiration, interest rate, dividends, and the estimated volatility of the stock. A primary difference from the Black-
Scholes model is that it factors in the possibility of early exercise of the options.
Black-Scholes Model A mathematical model used to price options. Generally used for European-style options, the model prices options using a probabil-ity-weighted sum of stock and a bond. Black-Scholes uses the stock price, strike price, days until expi-ration, interest rate, dividends, and the estimated volatility of the stock as variables in the model.
Block or Block Trade A large position or transaction of stock, generally at least 10,000 shares or more.
Bond A debt instrument or prom-issory note of a corporation, mu-nicipality, or the U.S. government. A bond represents debt on which the issuer usually promises to pay the owner of the bond a specific amount of interest for a defined amount of time and to repay the loan on the maturity date. Bonds are distinct from stock (equity), which represents ownership.
Book Value The value of a company based on its balance sheet. To calculate, take the total assets minus intangible assets minus liabilities. Basically, it’s the resulting value if a company sold all its assets and paid off all its debts.
Box Spread An option position composed of a long call and short put at one strike, and a short call and long put at a different strike. For example, a long 50/60 box spread would be long the 50 call, short the 50 put, short the 60 call, and long the 60 put. Considered largely immune to changes in the
price of the underlying stock, in most cases, a box spread is an interest rate trade. For all intents and purposes, the buyer of the box is lending money to the options market, and the seller of the box is borrowing money from the options market. Please note that multiple-leg option strategies can entail substantial transaction costs, including multiple com-missions, which may impact any potential return.
Breakeven Point(s) The stock price(s) at which an option position generates neither a profit nor a loss. An option position's breakeven point(s) are gener-ally calculated for the options' expiration date. Option pricing models can be used to calculate a position's breakeven point before the options' expiration date.
Bull Someone who believes the price of a security or the market will go higher.
Bull Spread Generally speak-ing, any spread that is designed to profit when the market moves up. Specifically, it refers to a vertical spread.
Butterfly Spread An option position composed of either all calls or all puts (except for an iron butterfly), with long options and short options at three different strikes. The options are all on the same stock and of the same ex-piration, with the quantity of long options and the quantity of short options netting to zero. The strikes are equidistant from each other. For example, a long 50/60/70 put butterfly is long one 50 put, short two 60 puts, and long one 70 put. Please note that multiple-leg op-
tion strategies can entail substan-tial transaction costs, including multiple commissions, which may impact any potential return.
Buy on Close To buy at the end of a trading session at a price within the closing range.
Buy on Open To buy at the beginning of a trading session at a price within the opening range.
Buy to Cover A buy order that closes or offsets a short position in stock or options.
Buying Power The amount of money available in a margin account to buy stocks or options. Buying power is determined by the sum of the cash held in the brokerage account and the loan value of any marginable securities in the account without depositing additional equity.
Buy-Write Synonymous with a covered call or covered write, this position includes long stock and short calls representing the same number of shares. This position may be entered as a single order via the thinkorswim platform with both sides (buying stock and sell-ing calls) executed simultaneously, for example, buying 500 shares of stock and writing 5 calls.
Calendar Spread (Time Spread) An option position
composed of either only calls or only puts, with the purchase or sale of an option with a nearby expira-tion offset by the purchase or sale of an option with the same strike price, but a more distant expiration. The options are on the same stock and have the same strike price. The quantity of long options and the
C

178 HOW TO THINKORSWIM TD AMERITRADE 179
how to thinkorswim
Glossary
put. Sometimes, combo is used to describe options at two different strikes, in which case it would not be synthetic stock. Please note that multiple-leg option strategies can entail substantial transaction costs, including multiple com-missions, which may impact any potential return.
Commission The one-time fee charged by a broker to a client when the client’s stock or option trade is executed through the brokerage firm.
Condor Spread An option position composed of either all calls or all puts (with the excep-tion of an iron condor), with long options and short options at four different strikes. The options are all on the same stock and of the same expiration, with the quantity of long options and the quantity of short options netting to zero. Gen-erally, the strikes are equidistant from each other, but if the strikes are not equidistant, the spread is called a pterodactyl. For example, a long 50/55/60/65 call condor is long one 50 call, short one 55 call, short one 60 call, and long one 65 call. In a long (short) condor, the highest and lowest strikes are both long (short) while the two middle strikes are both short (long). Please note that multiple-leg option strategies can entail substantial transaction costs, including multiple commissions, which may impact any potential return.
Confirmation Statement After a stock or options transaction has taken place, the brokerage firm must issue a statement to the client containing the name of the underlying stock, the number of shares or option contracts bought
or sold, and the prices at which the transactions occurred.
Consolidated Tape The ticker reporting transactions of NYSE-listed stocks that take place on the NYSE or any of the other regional stock exchanges.
Contingency Order When you place a stock or options order, you can choose to place contin-gencies on that order, meaning that the order will be filled only when a specific event has oc-curred. For example, a contingency order might be, "Buy 10 XYZ 80 calls at the market if XYZ stock trades above 75."
Contract The basic unit of trading for options. An option, whether it's a put or a call, is an agreement between two parties (the buyer and the seller) to abide by the terms of the option contract as defined by an exchange.
Contract Month Generally used to describe the month in which an option contract expires.
Contract Size The number of shares of the underlying stock that an option contract would deliver if exercised. Contract sizes for equity options in the U.S. are generally 100 shares, unless the contract size has been adjusted for a split, merger, or spin-off. For example, if you are long one XYZ 50 call with a contract size of 100 and you exercise that call, you will get 100 shares of XYZ for a price of $50 per share. TD Ameritrade incorporates the contract size in the calculation of your delta and gamma.
Conversion A position of long stock, short a call, and long a put
(with the call and put having the same strike price, expiration date, and underlying stock). The short call and long put act very much like short stock, thus acting as a hedge to the long stock. So, a conversion has a very small delta. A conver-sion is a way to exploit mispricings in carrying costs.
Correction A temporary rever-sal of direction of the overall trend of a particular stock or the market in general.
Cost Basis The original price paid for a stock or option, plus any commissions or fees. It is used to determine capital gains or losses when the stock or option is sold.
Cover Frequently used to describe the purchase of an option or stock to exit or close an existing short position.
Covered Return An annual-ized projected return of a covered position where options are sold for cash at the expense of limiting maximum gain on the underlying position. Covered return = call mark – in-the-money amount / stock price x 365/calendar days to expiration.
Covered Write or Covered Call or Put An option strategy composed of a short call option and long stock, or a short put op-tion and short stock. For example, selling (writing) two XYZ calls while owning 200 shares of XYZ stock is a covered call position.
Covered Writer (Seller) Someone who sells or "writes" an option is considered to have a "covered" position when they hold a position in the underlying
stock that offsets the risk of the short option. For example, a short put option is covered by a short position in the underlying stock, and a short call option is covered by a long position in the underlying stock. This strategy can limit the upside potential of the underlying stock position, as the stock would likely be called away in the event of a substantial stock price increase.
Credit An increase in the cash balance of an account resulting from either a deposit or a transac-tion. As it relates to option orders, a credit is how much the premium collected from selling options exceeds the premium paid for buying options.
Credit Balance (CR) The money the broker owes the client after all commitments have been paid in full. The money could come after a sale of securities, or simply be cash in the client's account.
Credit Spread Any option spread that collects a credit when the spread order is filled. The credit occurs when the amount of premium received for the option sold exceeds the premium paid for the option purchased.Crossed Market A situation that occurs on multiple-listed stock and options, where the highest bid price for a stock or option on one exchange is higher than the lowest ask price for that same stock or option on another exchange.
Crossing Orders The practice of using one client's order to fill a second client's order for the same security on the opposite side of the market. For this to occur, each order must be first offered on the exchange floor; if there are no
quantity of short options net to zero. For example, long the AUG/NOV 65 call calendar spread is short one August 65 call and long one November 65 call.
Call Option A contract that gives the owner of the call the right, but not the obligation, to buy the underlying stock at the option's strike price. The seller of the call is obligated to deliver (sell) the underlying stock at the option's strike price to the owner of the call when the owner exercises this right.
Call Writer An investor who receives a premium for selling a call and takes on, for a specified time period, the obligation to sell the underlying security at a specified price at the call buyer's discretion.
Called Away Term used when the seller of a call option is obligated to deliver the underlying stock to the buyer of the call at the strike price of the call option.
Canceled Order An order to buy or sell stock or options that is canceled before it has been executed. Generally, it is easier to cancel a limit order than a market order. A limit order can be canceled at any time as long as it has not been executed. Market orders can get executed so quickly that it is usually impossible to cancel them. TD Ameritrade will not accept an order cancellation for a market order.
Capital Gain or Capital Loss Profit or loss from a sale of an investment or a property.
Carry/Carrying Charge Interest is charged on any money borrowed to finance a position of stocks or options. The interest cost of financing the position is known as the carry.
Cash Account An account in which all positions must be paid for in full. Naked short calls or short stocks are not allowed in a cash account.
Cash Market Generally in the context of futures mar-kets, the cash market is where transactions are made in the commodity or instrument underlying the future. For ex-ample, there are cash markets in physical commodities such as grains, livestock, metals, and crude oil, financial instruments such as U.S. Treasury Bonds and eurodollars, as well as foreign currencies such as the Japanese yen and the Canadian dollar. As it relates to futures on stock indices, the cash market is the aggregate market value of the stocks making up the stock index.
Cash-Settled Option An option that delivers a cash amount (as opposed to under-lying stock or futures contracts) when exercised. The amount of cash delivered is determined by the difference between the option strike price and the value of the underlying index or security. In the U.S., stock index options on the OEX and SPX are cash settled.
Class of Options (Options Class) Options of the same type, either all calls or all puts, on the same underlying security.
Clear/Clearing The process by which orders are accounted for and matched, and funds transferred.
Close (C) The time at which trading on a stock or option ends for the day. In OHLC charts, C represents the closing price of the regular trading session.
Closing Price Price of a stock or option at the last transaction of the regular trading session.
Closing Purchase A trans-action in which a person who had initially sold short a stock or option exits or closes the short position by buying back the stock or option.
Closing Range The range of high and low prices, or bid and ask prices, recorded during the close (the final closing minutes of the trading day).
Closing Transaction A transaction in which a person who had initially bought or sold stock, futures, or options exits or closes (liquidates) the position by selling long stock, futures, or options or buying back the short stock, futures, or options.
Combo Often another term for synthetic stock, a combo is an option position composed of calls and puts on the same stock, same expiration, and typically the same strike price. The quantity of long options and the quantity of short options nets to zero. Buying a combo is buying synthetic stock; selling a combo is selling synthetic stock. For example, a long 60 combo is long one 60 call and short one 60

180 HOW TO THINKORSWIM TD AMERITRADE 181
how to thinkorswim
Glossary
D
E
FDividend A payment made by a company to its existing shareholders. Dividends are usually cash payments made on a quarterly basis. Dividends can also be in the form of additional shares of stock or property.
Dividend Frequency Indi-cates how many times per year (e.g., quarterly, semiannually) a particular stock pays a dividend.
Dividend Yield The annual percentage of return received from dividend payments on stock. The yield is based on the amount of the dividend divided by the price of the stock and fluctuates with the stock price.
Don't Know (DK) Notice A term used when brokers or trad-ers compare confirmations on a transaction. If one party re-ceives a confirmation on a trade that it does not recognize, that party would send the other party a DK notice.
Downtick A term used to describe a trade made at a price lower than the preceding trade.
Downtrend Successive downward price movements in a security over time.
Dual/Multiple Listed When the same stock or option is listed on two or more different exchanges. For example, IBM options are traded on the CBOE, PHLX, and AMEX.
Early Exercise A feature of American-style options
that allows the buyer to exercise a call or put at any time prior to its expiration date.
Equity Equity can mean stock, as it represents ownership in a corporation. In a margin account, equity represents a cli-ent's ownership in an account; it is the amount the trader would keep after all positions have been closed and all margin loans paid off.
Equity Options See Stock Options.
European-Style Option An option contract that can only be exercised upon its expira-tion date. Compare to Ameri-can-style options.
Excess Equity The value of cash or securities held in a margin account that exceeds the federal requirement.
Exchange An association of persons (members) who partici-pate in buying and selling securi-ties. It also refers to the physical location where the buying and selling takes place.
Exchange-Listed Secu-rity Securities that have met certain requirements and have been admitted for full trading privileges on an exchange such as the NYSE or NASDAQ.
Ex-Dividend Describes a stock whose buyer does not receive the most recently declared dividend. Dividends are payable only to shareholders recorded on the books of the company as of a specific date of record (the "record date"). If you do not hold the stock at the market open on the ex-dividend date, you will not be entitled to the dividend.
Ex-Dividend Date The day on and after which the buyer of a stock does not receive a particular dividend. This date is sometimes referred to simply as the "ex-date," and can apply to other situations beyond cash div-idends, such as stock splits and stock dividends. On the ex-divi-dend date, the opening price for the stock will have been reduced by the amount of the dividend, but may open at any price due to market forces.
Execution The actual comple-tion of an order to buy or sell stock or options.
Exercise Price (Strike Price) The cost per share at which the holder of an option may buy or sell the underlying security.
Expiration Cycle The expira-tion cycle has to do with the dates on which options on a particular underlying security expire. A stock option, other than LEAPS, will be in one of three cycles: the January cycle (with options listed in January, April, July, or October), the February cycle (with options listed in February, May, August, or November) or the March cycle (with options listed in March, June, September, or December). At any given time, an option will have contracts with four expiration dates outstanding.
Expiration (Expiration Date) On the expiration date, an option and the right to exercise it cease to exist. Every option con-tract becomes null and void after its expiration date. For standard stock options, this date is the Saturday following the third Friday of the expiration month.
Fast Market The exchange declares trading in stocks or
options to be in a "fast market" when transactions in the pit occur in such volume and with such rapidity that price reporters are behind in entering quotes. During this time, executing brokers are not held to any fills if a price is traded through on a limit order.
Fed Funds (Federal Funds) The money a bank borrows from another to meet its overnight reserve requirements.
Federal Funds Rate Set by the Federal Reserve Board, the Fed funds rate is the rate banks charge each other on overnight loans held by the Federal Reserve Bank.
Federal Open Market Committee (FOMC) A committee of the Federal Reserve Board that operates by buying and selling government securities in the open market. This buying and selling is how the Federal Reserve Board controls the U.S. money sup-ply. The FOMC decides whether to change the discount rate.
Federal Reserve Board (FRB) A seven-member board of governors of the Federal Reserve System, appointed by the U.S. president and confirmed by the Senate, that is responsible for monetary policy within the U.S. It controls the supply of money and credit to try to control inflation and create a stable, growing economy.
Fill The result of executing an order.
Fill or Kill (FOK) A type of order that is canceled unless it is execut-ed completely within a designated
takers, the broker may cross the orders, usually at a price somewhere in between the existing bid and ask prices.
Current Market Value (CMV) The current worth of the securities in an account. The market value of listed se-curities is based on the closing prices on the previous business day. Synonymous with long market value (LMV).
Date of Record (Record Date) Date on
which you must own shares of a stock to be entitled to a dividend payment.
Day Order A day order is an order that is "good for the day" and is automatically canceled if it cannot be executed the day it was placed. Compare to good-’til-canceled (GTC) orders.
Day Trade A stock or option position that is purchased and sold on the same day.
Day Trading Buying and sell-ing the same stock or option position in one day's trading session, thus ending the day with no position.
Days to Cover The number of days required to close out all of the short positions currently sold short in the market. Days to cover is calculated by the current short interest divided by average daily share volume.
Debit Balance (DR) In a client's margin account, that portion of the value of stocks that is covered by credit extended by the broker to the
margin client. In other words, the amount of money a client owes the brokerage firm.
Debit Spread Any option spread where you pay money for the spread. The debit occurs when the amount of premium paid for the option purchased exceeds the premium received for the option sold.
Deck The stack of stock or option orders that are to be filled by a broker on the floor of an exchange.
Declaration Date The date a company announces the payment date, record date, and amount of an upcoming dividend.
Deferred Contract Refers to "back-month" options or futures. See Back Months.
Delayed Opening Exchange officials can postpone the start of trading on a stock beyond the normal opening of a day's trading session. Reasons for the delay might include an influx of large buy or sell orders, an imbalance of buyers and sellers, or pending important corporate news that requires time to be disseminated.
Delayed Quotes Stock or option price quotes that are delayed by the exchanges 15 or 20 minutes from real time.
Delivery When referring to stock options, delivery is the process of delivering stock after an option is exercised. If a trader is long a call, and she exercises that call, the person who is short that call must
deliver the underlying stock to the trader who is long the call. If a trader is long a put, and she exercises that put, the trader will deliver the underly-ing stock to the person who is short that put. Actually, the de-livery of the stock takes place through clearing firms under specific terms and procedures established by the exchange where the option is traded. See Assignment and Exercise.
Delta A measure of an option's sensitivity to changes in the price of the underlying asset when all other factors are held constant. Generated by a mathematical model, delta depends on the stock price, strike price, volatility, interest rates, dividends, and time to ex-piration. Delta also changes as the underlying stock fluctuates. See Gamma.
Derivative Security A security whose value is derived from the value and characteris-tics of another security, called the underlying security. Calls and puts are derivative securities on underlying stocks.
Designated Order Turn-around (DOT) NYSE's auto-mated order entry system.
Discount Rate The rate that the Federal Reserve Bank charges on short-term loans it makes to other banks and financial institutions.
Discretionary Account An account in which the client has given the registered representa-tive authority to enter transac-tions at the rep's discretion.
182 HOW TO THINKORSWIM TD AMERITRADE 183
how to thinkorswim
Glossary
G
IJ
time period, generally as soon as it is announced by the floor broker to the traders in the pit. Compare to all-or-none (AON).
Flat Used to describe an ac-count that has no open positions in stocks or options. Flat can also refer to a position with little or no delta or gamma.
Float Number of shares of publicly owned stock of a corporation that are available for public trading.
Floor Physical location of an exchange where the buying and selling of stocks or options takes place.
Floor Broker A member of an exchange who executes orders on the exchange floor for clearing members or their clients.
Floor Trader A member of an exchange who trades only for his/her own or a proprietary account. On the CBOE, they are known as "market makers."
Free Credit Balance The amount of cash in a client’s account. Broker/dealers are required to notify clients of their free credit balances at least quarterly; TD Ameritrade clients may access this information at any time.
Full Power of Attorney A written authorization for some-one other than the beneficial owner of an account to execute trades or make deposits or with-drawals in a client account.
Full Trading Authoriza-tion An authorization, usually
provided by a full power of attorney, which gives someone other than the client full trading privileges in an account.
Fundamental Research Analysis of companies based on factors such as revenues, ex-penses, assets, debt level, earn-ings, products, management, and various financial ratios. As it re-lates to the economy, fundamen-tal research includes analysis of gross national product, interest rates, unemployment, savings, and so on.
Fundamentals Factors that are used to analyze a company and its potential for success, such as earnings, revenues, cash flow, debt level, financial ratios, and so on.
Fungibility Interchangeability resulting from identical charac-teristics or value. Options on a stock with the same expiration date, type (call or put), and strike price as standardized by the Options Clearing Corporation (OCC) are fungible. Therefore, dual-listed options traded on the CBOE can be liquidated or closed on the AMEX.
Futures Contract A forward contract for the future delivery of a financial instrument (e.g., Treasury bond) or physical commodities (e.g., corn), traded on a futures exchange (e.g., CBOT, CME).
Gamma An approximation of the change in the delta of
an option relative to a change in the price of the underlying stock when all other factors are held constant. Gamma is accurate
for small changes in the price of the underlying stock, but is expressed in terms of a change in delta for a 1-point move in the stock. For example, if a call has a delta of 0.49 and a gamma of 0.03, if the stock moves down 1 point, the call delta would be 0.46 (0.49 + [0.03 x$1.00]). Generated by a mathematical model, delta depends on the stock price, strike price, volatility, interest rates, dividends, and time to expiration.
Good ’Til Canceled (GTC) A type of limit order that is active until it is filled or canceled. As opposed to a day order, a GTC order can remain active for up to 90 days.
Greeks Regarding options, it's a colloquial term for analytic mea-surements such as delta, gamma, theta, vega, rho, and so on.
Handle The whole-dollar part of the bid or offer price.
For example, if the bid and offer prices for an option are 3 1/8 bid, offer 3/1/2, the handle is 3.
Hedge A position in stock or options that is established to offset the risk of another position in stock or options.
High The high price of a session; in OHLC charting, H is the high.
Historical Volatility The annualized standard deviation of percentage changes in the price of a stock over a specific period. Compare to implied volatility.
Holder Someone who has bought an option or owns a security.
Hypothecation The act of pledging of securities as collateral, as might be done in a margin account.
Immediate or Cancel (IOC) A type of order that
must be filled immediately or be canceled. IOC orders allow partial fills, with the balance of the order canceled.
Implied Volatility An estimate of the volatility of the underlying stock that is derived from the mar-ket value of an option. Implied vol-atility is the number that, if plugged into a theoretical pricing model along with all the other inputs, would yield a theoretical value of an option equal to the market price of the same option. Compare to historical volatility.
Index A proxy for the overall stock market or segments of the stock market. An index is typically made up of a group of stocks that are selected to represent all stocks in the stock market or market seg-ment (such as technology stocks or large-capitalization stocks). The performance of the index gives an idea of how individual stocks might be performing. The S&P 500 (Standard & Poor's 500 Index) and Dow Jones Industrial Average are two well-known indices.
Index Option An option that has a stock index as the underly-ing asset. The value of an index option is based on the value of the index. Typically, index options are cash settled.
Initial Margin Requirement The amount of equity a client must deposit when making a new purchase in a margin account. For
retail clients, the SEC's Regulation T requirement for equity securities currently stands at 50% of the purchase price. In addition, the FINRA and NYSE initial margin requirement is a deposit of $2,000 but not more than 100% of the pur-chase price. Purchases of options must be paid for in full, while the sale of naked options is subject to house requirements prescribed by TD Ameritrade. Also, the amount of money required to be in an account with a brokerage firm to carry a new position into the next trading day.
Initial Public Offering (IPO) A corporation's first sale of stock to the public.
Institutional Investors Organizations such as mutual funds, pension funds, endowment funds, and insurance companies that typically have very large sums of money to invest.
Interest Money paid when bor-rowing money or money earned when lending money.
Interest Rate A percentage that is charged when borrowing money, or that is earned when lending money.
Interest Rate Risk Risk that a change in interest rates will cause a position to change in value.
Investor Someone who pur-chases a stock with the intent of holding it for a certain amount of time and profiting from the trans-action. Compare to day trading.
Iron Butterfly Spread An op-tion spread composed of calls and puts, with long options and short
options at three different strikes. The options are all on the same stock and of the same expiration, with the quantity of long options and the quantity of short options netting to zero. The strikes are equidistant from each other.
An iron butterfly can be seen as a straddle at the middle strike and a strangle at the outer strikes. For example, a long 50/60/70 iron butterfly is long one 50 put, short one 60 call, short one 60 put, and long one 70 call. It's important to understand that you initiate an iron butterfly for a credit, that is, you take money in. The profit potential is limited to the credit received.
Iron Condor Spread An op-tion spread composed of calls and puts, with long options and short options at four different strikes. The options are all on the same stock and of the same expiration, with the quantity of long options and the quantity of short options netting to zero. The strikes are equidistant from each other. An iron condor can be seen as a short strangle at the middle strike and a long strangle at the outer strikes. For example, a long 50/55/60/65 iron condor is long one 50 put, short one 55 put, short one 60 call, and long one 65 call. You initiate an iron condor for a credit, that is, you take money in. The profit potential is limited to the credit received. It is a limited risk and limited profit strategy.
Issue As a verb, when a company offers shares of stock to the public; as a noun, the stock that has been offered by the company.
Issuer An entity that offers or proposes to offer its securities for sale, or the creator of an op-
tion. The issuer of a listed option is the OCC.
Joint Account An account that has two or more owners
who possess some form of control over the account and may transact business in the account. See also joint tenants.
Joint Tenants A type of ac-count with two owners. There are two types of joint tenant accounts: (1) Joint tenants with rights of sur-vivorship; in the event of the death of one party, the survivor receives total ownership of the account. (2) Joint tenants in common; in the event of the death of one party, the survivor receives a fractional inter-est of the account. The remaining fractional interest goes to the deceased party's estate.
Junk Bond (High-Yield Bond) A bond with a credit rating of BB or lower, carrying higher risk of default than invest-ment-grade bonds.
Last (Price) The price of the last transaction of a stock
or option for a trading session.
Last Trading Day The last business day prior to the option's expiration date during which options can be traded. For equity options, this is generally the third Friday of the expiration month. Note: If the third Friday of the month is an exchange holiday, the last trading day will be the Thursday immediately preceding the third Friday.
LEAPS An acronym for long-term equity anticipation securities. LEAPS are call or put options with expiration dates set
L
H
184 HOW TO THINKORSWIM TD AMERITRADE 185
how to thinkorswim
Glossary
M
as far as two years into the future. They function exactly like other, shorter-term exchange-traded options.
Leg One option of a spread position. When someone "legs" into a call vertical, for example, he might do the long call trade first and the short call trade later, hoping for a favorable price movement so the short side can be executed at a better price. Legging is a higher-risk method of establishing a spread position, and TD Ameritrade strongly suggests that if you decide to leg into a spread, you should, for margin and risk purposes, do the long trades first. Please note that multiple-leg option strategies can entail substantial transaction costs, including multiple com-missions, which may impact any potential return.
Leverage The ability to control a larger amount of money or assets with a smaller amount of money or assets, typically done by borrowing money or using options. If prices move favorably for a leveraged position, the profits can be larger than on an unleveraged position. However, if prices move against a leveraged position, the losses can also be larger than on an unleveraged position, but not necessarily with an option position. Buying stock on margin is using leverage. A long option position is leveraged because it "controls" a large number of shares with less mon-ey than it would take to maintain a position with the same number of shares.
Limit Move Relating to fu-tures markets, a limit move is an
increase or decrease of a futures price by the maximum amount allowed by the exchange for any one trading session. Price limits are established by the exchanges and approved by the Commodity Futures Trading Commission (CFTC). Limit moves vary depending on the futures contract.
Limit (Price) Order An order that has a limit on either price or time of execution or both. Compare to a market order that requires the order be filled at the most favorable price as soon as possible. Limit orders to buy are usually placed below the current ask price. Limit orders to sell are usually placed above the current bid price. Limit orders can be used when trading spreads. In markets with low liquidity or in fast markets, some traders use limits in an attempt to get filled by putting in a limit order to buy at or above the ask price or a limit order to sell at or below the bid price.
Limited Power of Attorney An authorization giving someone other than the beneficial owner of an account the authority to make certain investment decisions regarding transactions in the client's account.
Limited Trading Autho-rization This authorization, usually provided by a limited power of attorney, grants someone other than the client trading privileges in an account. These privileges are limited to purchases and sales; withdraw-als of assets is not authorized.
Liquidation A transaction or transactions that offsets or clos-es out a stock or options position.
Liquidity The ease with which a transaction in stock or options can take place without substan-tially affecting their price.
Liquidity Risk The potential that an investor might not be able to buy or sell a security when desired.
Listed Options An ex-change-approved call or put traded on an options exchange with standardized terms. Listed options are fully fungible. In con-trast, over-the-counter (OTC) options usually have non-stan-dard or negotiated terms.
Listed Stock The stock of a corporation that is traded on a securities exchange.
Loan Consent Agree-ment The agreement between a brokerage firm and its margin client permitting the brokerage firm to lend the margined secu-rities to other brokers; this contract is part of the margin agreement.
Loan Value The maximum amount of money that can be borrowed in a margin account at a brokerage firm using eligible securities as collateral.
Locked Limit Refers to a futures market that has moved its daily maximum amount and, if the move is up, no one is willing to sell. Conversely, if the move is down, no one is willing to buy. Hence, the market is "locked" at the limit price with no trading.
Long Hedge The strategy of buying puts as protection against the decline in the value of long securities.
Long Market Value See Current Market Value.
Lot Contract.
Low (L) The low price of a ses-sion; in OHLC charts, L is the low.
Maintenance Margin An amount of cash
or margin-eligible securities that must be maintained on deposit in a client's account to maintain a particular position. If a client's equity in his/her account drops to, or under, the maintenance margin level, the account may be frozen or liquidated until the client deposits more money or margin-eligible securities in the account to bring the equity above the maintenance margin level.
Margin The amount of equity contributed by a client (in the form of cash or margin-eligible securi-ties) as a percentage of the current market value of the stocks or option positions held in the client's margin account.
Margin Account An account that allows a client to borrow mon-ey from a brokerage firm against cash and margin-eligible securities held in the client's margin account at that brokerage firm.
Margin Agreement The doc-ument a client signs when opening a margin account with a broker/dealer; this document allows the firm to liquidate a portion or all of the client's account if the client fails to meet margin requirements
set by the firm or exchange. This document displays a client's trad-ing activity, positions, and account balance. The SEC requires the statement be sent quarterly; TD Ameritrade client futures statements are sent daily via email. All statements may be accessed online at any time.
Margin Balance The amount a client has borrowed, using cash or margin-eligible securities as collateral, in a margin account.
Margin Call A brokerage firm's demand of a client for additional equity in order to bring margin deposits up to a required minimum level. If the client fails to deliver more equity in the ac-count, the client's positions may be liquidated.
Margin-Eligible Securities Securities, such as stocks or bonds, that can be used as collat-eral in a margin account. Options are not margin-eligible securities.
Margin Requirement The minimum equity required in an account to initiate or maintain a position in stock or options.
Mark Mark is the midpoint between the bid and the ask.
Mark to Market The daily updating of the value of stocks and options to reflect profits and losses in a margin account.
Market A quote (that is, a bid and ask price for a stock or option, e.g., the market on XYZ stock is 23.10 by 23.11), or a term for all stocks as a whole (“the market is going up” means stocks in general are rising), or a place to trade.
Market Arbitrage The simul-taneous purchase and sale of the same security in different markets to take advantage of price dispar-ity between the two markets. For example, purchasing a call or put on the CBOE, and subsequently selling the contract at the PHLX at a higher price.
Market Capitalization Often regarded as the total dollar value of a company. To calculate, take the share price multiplied by the number of shares outstanding.
Market Maker A term for a broker/dealer that trades for its own account in order to facilitate trading in a security. Market makers compete with each other to provide the best bid and ask prices for stocks and options to the public.
Market on Close (MOC) MOC orders must be placed at least 20 minutes prior to the closing time of the market or exchange. Short sell MOC orders may not execute. Orders entered between 3:40:01 p.m. and 4:00:00 p.m. ET, if accepted, will be executed on a best-efforts basis for the current session.
Market (Price) Order An order to buy or sell stock or options that seeks immediate execution at the current market price. Compare to a limit order or stop order, which specifies requirements for price or time of execution.
Married Put The purchase of a put option and the underlying stock on the same day. Special tax rules may apply to this position. Consult a qualified tax advisor for more information.
Max Covered Return An annualized “covered return” if the cover always expired out of the money (meaning all of the cash was collected from the cover and another can be sold on the same position). Max covered return = call mark + out-of-the-money amount / stock price x 365 / calendar days to expiration.
Merger The act of combining two or more corporations into one corporate entity. Options on stocks involved in mergers can be difficult to evaluate.
Minimum Price Fluctu-ation The smallest possible increment of price movement for a stock or option. It is often referred to as a "tick."
Model Any of the various option pricing models used to value op-tions and calculate the "greeks." Models typically use six factors in their calculations: the underlying stock price, the strike price, the time until expiration, dividends, interest rates, and the volatility of the stock. TD Ameritrade uses the Black-Scholes model for European-style options and the binomial model for Ameri-can-style options.
Multiple Listed When the same stock or option is listed on two or more different exchanges. For example, IBM options are traded on the CBOE, PHLX, and AMEX.
Multiplier Refers to the number, typically $100, used to calculate aggregate strike prices and premiums for options. The multiplier affects profit/loss cal-culations on options positions.

186 HOW TO THINKORSWIM TD AMERITRADE 187
how to thinkorswim
Glossary
N
O
P
Naked Call or Put Refers to a short option
position that doesn't have an offsetting stock position. For ex-ample, a client has a naked call if he sells a call without being long the quantity of stock represented by his short call or long another call spread against it. He has a naked put if he sells a put without being short the quantity of stock represented by his short put or long another put spread against it. Compare to covered call or put.
Net Change The change in the price of a stock or option from the closing price of the previous day.
Net Position The difference between a client's open long and open short positions in any one stock or option.
Non-Marginable Security A security that must be paid for in full. Call and put option con-tracts are examples of this type of security.
Not Held (NH) Order An order that gives the floor broker discretion on time and price in getting the best possible fill for a client. When entering a not-held order, a client agrees to not hold the broker responsible if the best price is not obtained.
Odd Lot The purchaseor sale of stock in less
than the round-lot increment of 100 shares.
OEX Symbol for the Standard & Poor's 100 cash index, a capitalization-weighted index of 100 stocks from a broad range of industries. OEX is traded only at the CBOE and settles to cash.
Offer Another name for the ask price. The price of a stock or option at which a seller is offering to sell.
One Cancels Other (OCO) Two orders submitted simulta-neously by one client, where if one order is filled, the other is canceled immediately.
Open The beginning of the trading session. In OHLC charts, O represents the opening price of the session.
Open Equity The value of all open positions in stock and options, less the margin require-ments of those positions.
Open Interest The number of outstanding option contracts in a particular class or series. Each opening transaction (as opposed to a closing transac-tion) has a buyer and a seller, but for the calculation of open interest, only one side of the transaction is counted.
Open Outcry A public auction, using verbal bids and offers, for stocks or options on the floor of an exchange.
Open Position A long or short position in stock or options.
Open (Price) Order An order that is active until it is either executed or canceled.
Opening Price/Range The range of the first bid and offer prices made or the prices of the first transactions.
Opening Rotation Process by which options are systemat-
ically priced after the opening of the underlying stock.
Opening Trade/Transac-tion An opening purchase trans-action adds long stock or options to a position, and an opening sale transaction adds short stock or options to a position.
Option Chain A list of all options on a particular stock.
Option Class See Class of Options.
Option Disclosure Document A document pub-lished by the Options Clearing Corporation (OCC) that must be distributed to all clients wishing to apply for options trading with TD Ameritrade. The document itself outlines the characteristics and risks of investing in options. The document is also called the OCC Risk Disclosure Document.
Option Pricing Model Any one of the various models used to value options and calculate the "greeks." Models typically use six factors in their calcula-tions: the underlying stock price, the strike price, the time until expiration, dividends, interest rates, and the volatility of the stock. TD Ameritrade uses the Black-Scholes model for European-style options and the binomial model for Ameri-can-style options.
Options Clearing Corpo-ration (OCC) The issuer and registered clearing facility of all options contracts traded on any U.S. exchange. It supervises the listing of options and provides risk management, clearing, and
settlement services.
Order An instruction to purchase or sell stock or options.
Order Flow The orders to buy and sell stock or options that bro-kers send to market makers.
Order Routing System The system utilized by the Chicago Board Options Exchange (CBOE) to collect, store, route, and execute orders for clients of the exchange. The order routing system auto-matically routes option market and limit orders to the various execution vehicles at the CBOE, including the RAES system.
OTC Option Options traded in the over-the-counter (OTC) market. OTC options are not listed on or guaranteed an options exchange and do not have stan-dardized terms such as standard strike prices or expiration dates. See Fungibility.
Out-Trade A situation that results when there is some error on a trade, such as differences between the buyer and seller regarding option price, strike price, expiration month, or underlying stock. Other costly errors occur when there is a buy versus a buy or a sell versus a sell.
Over-the-Counter (OTC) Market A securities market made up of dealers who may or may not be members of a securities exchange. In the OTC market, there is no exchange floor, such as the NYSE or CBOE.
Parity A term used to describe an in-the-money
option when the option's total
premium is equal to its intrinsic value. Such an option moves one point for every one-point move in the underlying stock, and is said to be "worth parity" or "trading for parity."
Partial Fill A limit order that is only partially executed be-cause the total specified number of shares of stock or options could not be bought or sold at the limit price.
Payable Date Date on which the dividend on a stock is actually paid to shareholders of record. Compare to ex-dividend date and record date.
PEG Ratio “Price/earnings to growth” is a ratio used to deter-mine a stock’s value by consid-ering its earnings growth. It is calculated by the P/E ratio divid-ed by the annual EPS growth. The PEG ratio is favored by some over the P/E ratio because it considers the company’s growth.
Pin Risk The risk to a trader who is short an option where, at expira-tion, the underlying stock price is equal to (or "pinned to") the short option's strike price. If this hap-pens, he will not know whether he will be assigned on his short option. The risk is that the trader doesn't know if he will have no stock position, a short stock position (if he was short a call), or a long stock position (if he was short a put) on the Monday following expiration and thus be subject to an adverse price move in the stock.
Plus Tick or Uptick Rule A term used to describe a trade made at a price higher than the preceding trade.
Point The minimum change in the handle of a stock or option price. For stock or options in the U.S., a point means $1. If the price of an option goes from $2 to $7, it has risen 5 points.
Position Long or short stock or options in an account.
Position Limit For a single trader, client, or firm, the maximum number of allowable open option contracts on the same underlying stock. The limits are established by the exchanges.
Position Trading Establishing a position in stocks or options and holding it for an extended period of time. Compare to day trading.
Premium The price of an option.
Price-to-Earnings Multiple (P/E Ratio) The market price divided by the company’s earnings per share. The P/E ratio is a type of stock valuation methodology used in determining the price paid for a company’s earnings.
Prime Rate The lowest interest rate commercial banks charge their largest and most credit-worthy corporate clients.
Profit/Loss (P/L) % Calcu-lates the percentage of money made or lost as a function of your execution price. This takes the P/L open as the numerator and your execution price as the denom-inator. Note that this will only calculate the P/L of single options, not spreads.
Profit/Loss (P/L) Day The amount of money made or lost on a position from last night's close to
the current mark plus any intraday profit and loss. You can see the current price for any stock or op-tion in your position on the Position Statement. You can see the original execution price for any stock or option in your position by going to the Monitor tab and left-clicking on the P/L Day dollar amount.
Profit/Loss (P/L) Differ-ential (Diff) To view histor-ical account information for a specified date range, navigate to the Account Statement subtab and enter the desired date range. The profits and losses section will display gains or losses for only that date range. This offers the user an easy way to view profit and loss for a specific time period. This value, profit and loss differ-ential (P/L Diff), is calculated as follows: P/L Diff = P/L YTD of the end date – P/L YTD of the start date, where start date and end date refer to the border values of the time interval filter currently applied to Account Statement. In cases where the P/L YTD of the start date is N/A, the system will use P/L YTD of the end date value as the P/L Diff value.
Profit/Loss (P/L) Open The amount of money made or lost on your position since the inception of the trade. You can see the exe-cution price for any stock or option in your position by going to the Monitor tab and left-clicking on the P/L Open dollar amount.
Profit/Loss (P/L) Year-to-Date (YTD) The amount of money made or lost in a partic-ular underlying security in the current calendar year. It includes the P/L for all open positions and any closed positions made for a

188 HOW TO THINKORSWIM TD AMERITRADE 189
how to thinkorswim
Glossary
Q
R
S
specific stock or index done in a calendar year.
Put/Call Ratio A ratio of the trading volume of put options to call options. It is used to gauge investor sentiment.
Put Option A put option gives the owner of the put the right, but not the obligation, to sell the underlying stock at the option's strike price. Someone who is short the put is obligated to take delivery of (buy) the underlying stock at the option's strike price from the owner of the put if the owner exercises this right.
Quote The bid to buy and the offer to sell a particular
stock or option at a given time. If you see a quote for an option on the screen "3 1/2 3 7/8", it means that the bid price is $3.50 and the ask price is $3.875. This means that at the time the quote was disseminated, $3.50 was the highest price any buyer wanted to pay, and $3.875 was the low-est price any seller would take.
Range The high and low prices of a stock or option
recorded during a specified time.
Ratio Spread An option position composed of either all calls or all puts, with long options and short options at two different strike prices. The options are all on the same stock and usually of the same expiration, with more options sold than purchased. A ratio spread is the purchase of an option and the sale of a greater number of the same type of options that are out-of-the-money with respect to the one(s) purchased. For example, a 50/60
call 1-by-2 ratio spread is long one 50 call and short two 60 calls. Please note that multi-ple-leg option strategies such as this can entail substantial trans-action costs, including multiple commissions, which may impact any potential return.
Realized Gains or Losses The profit or loss incurred in an account when a closing trade on a stock or option is made and matched with an open position in the same stock or option.
Record Date (Date Of Record) The date by which someone must be registered as a shareholder of a company in order to receive a declared div-idend. Compare to ex-dividend date and payment date.
Regulation T (Reg T) The regulation, established by the Federal Reserve Board, govern-ing the amount of credit that brokers and dealers may give to clients to purchase securities. It determines the initial margin re-quirements and defines eligible, ineligible, and exempt securities.
Rejected Order An order that is not executed because it is invalid or unacceptable in some way.
Restricted Account A margin account in which the equity is less than the Reg T initial requirement. A restricted account with TD Ameritrade will at least be restricted to closing transactions only.
Return on Capital The percentage of the mark com-pared to the buying power of
an option position. Because the buying power effect is capital that is made unavailable by the trade, the return on capital could be viewed as the amount of return expected on a sale of the position for cash. Not annual-ized. Return on capital = mark / margin requirement.
Return on Risk The per-centage of the mark compared to the potential loss of an option position. Because most spread types have defined risk that is equal to the buying power, this number will often be the same as return on capital. Not annualized. Return on risk = max risk.
Reversal (Market Reversal) When a stock's direction of price movement stops and heads in the opposite direction.
Reversal (Reverse Con-version) A position of short stock, long a call, and short a put (with the call and put having the same strike price, expiration date, and underlying stock). The long call and short put act very much like long stock, thus acting as a hedge to the short stock. So a reversal has a very small delta. A reversal is a strategy designed to exploit mispricings in carrying costs. Please note that multi-ple-leg option strategies can entail substantial transaction costs, including multiple com-missions, which may impact any potential return.
Reverse Split An action tak-en by a corporation in which the number of outstanding shares is reduced and the price per share increases. For example, if a trader
were long 100 shares of stock of a company with a price of $80, and that company instituted a one-for-four reverse split, the trader would see the position become long 25 shares of stock with a price of $320. The value of the trader's position does not change (unless the price of the stock subsequently changes), and the proportionate ownership in the company remains the same. Compare to split.
Rho An instantaneous mea-surement of the price sensitivity of an option relative to a change in interest rates when all other factors are held constant. This is typically expressed in the amount of money per option, per 1% (100-basis-point) change in interest rates. Rho is dependent upon the stock price, strike price, volatility, interest rates, dividends, and time to expiration.
Roll (Noun) An option spread position composed of both calls and puts. The options are all on the same stock and strike price, but on two expirations. The roll is long synthetic stock (long call, short put) at one expiration and short synthetic stock (short call, long put) at another expiration. The quantity of long options and the quantity of short options net to zero. For example, short the SEP/DEC 70 roll is long one Sep-tember 70 call, short one Septem-ber 70 put, short one December 70 call, and long one December 70 put. The roll is usually executed when someone wishes to roll from a hedge in an expiring month to a hedge in a deferred month for added time. Please note that multiple-leg option strategies can entail substantial transaction costs, including multiple com-
missions, which may impact any potential return.
Roll (Verb) Adjusting or changing a position by closing out an existing option position and substituting it with an option on the same stock but with a different strike price or expiration date.
Round Lot A standard quantity of trading. For example, in U.S. equities, a round lot is 100 shares of stock.
Scalp A quick entry and exit on a position.
Scalper/Scalping Someone who enters and exits stock or options positions quickly, with small profits or losses, holding a position only for a short time during a trading session.
Secondary Market Markets in which securities are bought and sold subsequent to their being sold to the public for the first time.
Security A generic term for investment or trading vehicles. Securities can be stock, bonds, or derivative securities such as options or futures.
Securities Investor Pro-tection Corporation (SIPC) A nonprofit corporation created by an act of Congress to protect clients of brokerage firms that are forced into bankruptcy. TD Ameritrade, Inc. is a member of the SIPC, which protects secu-rities customers of its members up to $500,000 (including $250,000 for claims for cash). An explanatory brochure is available upon request at www.sipc.org. TD Ameritrade also provides
$149.5 million worth of protection for each client through supplemen-tal coverage provided by London insurers. The $149.5 million of coverage includes a sub-limit of $900,000 on cash. Each client is limited to a combined return of $150 million from SIPC or London insurers. The TD Ameritrade supplemental insurance policy has an aggregate limit of $500 million for claims from all TD Ameritrade clients. This supplemental insur-ance provides coverage following brokerage insolvency and does not protect against loss in market value of the securities.
Segregation The holding of client-owned securities separate from securities owned by other clients and separate from securi-ties owned by the brokerage firm.
Series All option contracts of the same class that also have the same exercise price and expiration date.
Settlement The conclusion of a stock or options trade through the transfer of the security (from the seller) or cash (from the buyer).
Settlement Date Date on which a transaction must be set-tled. Buyers pay for securities with cash and sellers deliver securities.
Settlement Price The closing price of a stock or option used for account statements and to calcu-late gains and losses in an account.
Shares A unit of ownership in a company or other financial asset.
Short As a noun, it refers to peo-ple who have sold stock or options without owning them first. As an adjective, it refers to a position of
short stock or options. Compare to long.
Short Covering Buying back stock or options to close out a short position.
Short Hedge The selling of options as protection against a decrease in value of a long securities position.
Short Interest The number of shares of stock that have been sold short is known as a stock's short interest.
Short Seller Someone who sells stock or options without owning them first. The short seller looks to profit from buying the stock or options back later at a price lower than where she sold.
Short Squeeze When traders who have sold a stock short start to lose profits or incur losses as the stock begins to rise, sometimes dramatically. The short sellers are forced to buy back their short stock positions in order to limit their losses.
Sizzle Index® A measure of the current option volume versus the past five trading days' volume. It is a ratio of the current volume of all the options for a stock and the average daily volume for all the options over the past five days. It indicates whether a stock's options are more or less active than they have been. If the Sizzle Index is greater than 1.00, the current option volume is greater than the average of the past five days. If the Sizzle Index is less than 1.00, the current option volume is less than the average of the past five days. The call sizzle and put sizzle

190 HOW TO THINKORSWIM TD AMERITRADE 191
how to thinkorswim
Glossary
are calculated the same way by comparing the call or put volume and the past five-day average call or put volume.
Skew See Volatility Skew.
Slippage The difference be-tween the price someone might expect to get filled at on an order and the actual, executed price of the order.
Special Memorandum Account A line of credit in a client's margin account; a limit on the amount of money a client can borrow against collateral in the account.
Speculator Someone who buys or sells stocks or options hoping to profit from favorable short-term moves in their price or volatility.
Spin-Off When a corpora-tion divides its assets into two companies, one the original company and the other a new, independent company. Shares of stock in the new company are issued to stockholders of the original corporation.
Split An action taken by a cor-poration in which the number of outstanding shares is increased and the price per share decreas-es. For example, if a trader were long 100 shares of stock of a company with a price of $120, and that company instituted a 3-for-1 split, the trader would see her position become long 300 shares of stock with a price of $40. The value of the trader's position does not change (unless the price of the stock subsequently changes) and the
proportionate ownership in the company remains the same. Compare to reverse split.
Spread A position or order involving two or more different options (see leg), or the differ-ence between the bid and offer prices of a stock or option.
Spread Order A type of order specifying two different option contracts on the same underlying security.
SPX Symbol for the Standard & Poor's 500 Index. It is a cap-italization-weighted index of 500 stocks from a broad range of industries. The options are cash-settled, European-style expiration, and trade only at the CBOE.
Stock Another name for equity, stock is a security that represents ownership in a corporation.
Stock Options Calls or puts with the right to buy or sell individual stocks.
Stop Limit (Price) Order A type of order that turns into a limit order to buy or sell stock or options when and if a specified price is reached. Stop limit orders to buy stock or options specify prices that are above their current market prices. Stop limit orders to sell stock or options specify prices that are below their current market prices. With a stop limit order, as with all limit orders, you risk missing the market altogether. In a fast-moving market, it might be impossible to execute an order at the limit price or a more favorable one.
Stop (Stop-Loss) Order A type of order that turns into a market order to buy or sell stock or options when and if a specified "stop" price is reached. Stop orders to buy stock or options specify prices that are above their current market prices. Stop orders to sell stock or options specify prices that are below their current market prices. A stop order will not guarantee an execution at or near the activa-tion price. Once activated, they compete with other incoming market orders.
Straddle An option position composed of calls and puts, with both calls and puts at the same strike. The options are on the same stock and of the same expiration, and either both long or both short with the quantity of calls equal to the quantity of puts. For example, a long 50 straddle is long one 50 call and long one 50 put. A long straddle requires a large move in the stock price, an increase in implied volatility, or both for profitability, while a short straddle performs well during a tight trading range, decreased implied volatility, or both. Please note that multiple-leg option strategies can entail substantial transaction costs, including mul-tiple commissions, which may impact any potential return.
Strangle An option position composed of calls and puts, with both out-of-the-money calls and out-of-the-money puts at two different strikes. The options are on the same stock and of the same expiration, and either both long or both short with the quan-tity of calls equal to the quan-
tity of puts. For example, a short 50/70 strangle is short one 50 put and short one 70 call. A long strangle requires a large move, an increase in implied volatility, or both for profitability, while a short strangle performs well during a tight trading range, decreased im-plied volatility, or both. Please note that multiple-leg option strategies can entail substantial transaction costs, including multiple com-missions, which may impact any potential return.
Street Name Securities held in the name of a brokerage firm on behalf of a client. This is required for margin accounts, and facilitates delivery for stock transactions.
Strike Price The predetermined price at which underlying stock is purchased (in the case of a call) or sold (in the case of a put) when an option is exercised.
Symbols Every corporation whose stock is traded on an exchange, and every option traded on an exchange, is given a unique identification symbol of up to five letters. Generally, these symbols abbreviate the corporation's complete name and, in the case of options, their strike price, expi-ration date, and whether they are calls or puts.
Synthetic Creating a position that emulates another by com-bining at least two of calls, puts, or stock that acts very much like a position of outright stock, calls, or puts.
Synthetic Long Call An option position composed of long puts and long stock. The quantity of long puts equals the number of
round lots of stock. For example, long five synthetic 70 calls can be created by being long five 70 puts and long 500 shares of stock.
Synthetic Long Put An option position composed of long calls and short stock. The quantity of long calls equals the number of round lots of stock. For example, long eight synthetic 80 puts can be created by being long eight 80 calls and short 800 shares of stock.
Synthetic Long Stock An option position composed of long calls and short puts on the same stock, strike price, and expiration. The quantity of long options and the quantity of short options nets to zero. For example, long 500 shares of synthetic stock can be created by being long five 70 calls and short five 70 puts. See combo. Please note that multiple-leg op-tion strategies can entail substan-tial transaction costs, including multiple commissions, which may impact any potential return.
Synthetic Short Call An option position composed of short puts and short stock. The quantity of short puts equals the number of round lots of stock. For example, short three synthetic 60 calls can be created by being short three 60 puts and short 300 shares of stock.
Synthetic Short Put An option position composed of short calls and long stock. The quantity of short calls equals the number of round lots of stock. For example, short four synthetic 70 calls can be created by being short four 70 calls and long 400 shares of stock.
Synthetic Short Stock An option position composed of short calls and long puts on the same stock, strike price, and expiration. The quantity of long puts and the quantity of short calls nets to zero. For example, short 400 shares of synthetic stock can be created by being short four 70 calls and long four 70 puts. See combo. Please note that multiple-leg option strategies can entail substantial transaction costs, including multiple commissions, which may impact any potential return.
Systematic Risk The broad macroeconomic factors that affect all companies in a stock market, also known as market risk. Theoretically, it's the risk in a portfolio that cannot be reduced through diversification. Compare to unsystematic risk.
Technical Analysis Calculations that use stock
price and volume data to identify previous patterns technical ana-lysts believe will help to predict future stock movements. Some technical analysis tools include moving averages, oscillators, and trendlines.
Tender Offer An offer from one company to buy shares of stock of another company from that other company's existing stockholders. Those stockholders are asked to "tender" (surrender) their shares for a specific price (represented by cash, shares in another com-pany, or both), which is usually higher than the current market price of the stock.
Theoretical Value An estimated price of a call or put derived from a mathematical
model, such as the Black-Scholes or binomial models.
Theta An approximation of the decrease in the price of an option over a period of time when all other factors are held constant. Theta is generally expressed on a daily ba-sis. For example, if a call has a price of $3.00 and a theta of 0.10, one day later, with all else unchanged, the call would have a price of $2.90 ($3.00 [0.10 x 1]). Generated by a mathematical model, theta depends on the stock price, strike price, volatility, interest rates, divi-dends, and time to expiration.
Tick The smallest possible price increment for a stock or option.
Ticker The telegraphic system that prints or displays last sale prices and volume of securities transactions on exchanges on a moving tape within a minute after each trade. Also known as the "tape."
Time and Sales A record of the time, price, and volume of each transaction of every stock and option.
Time Decay Option price erosion over time. Another name for theta.
Time Spread Another name for calendar spread.
Time Value Another name for extrinsic value.
Trading Authorization Written permission from the owner of an account authorizing another person to enter trades on behalf of the owner. Also called power of attorney.
T

192 HOW TO THINKORSWIM TD AMERITRADE 193
volatilities of options in one month on one stock are equal across the different strike prices, the skew is said to be "flat." Volatility skew can dramatically change the risk of a position when the price of the stock begins to move.
Volume The total number of shares of stock or option contracts traded on a given day.
Warrant A security issued by a corporation that gives
the holder the right to purchase se-curities at a specific price within a specified time limit (or sometimes with no time limit). Warrants are sometimes like call options, but the main differences are that warrants typically have much longer lives, whereas options tend to expire relatively soon, and that warrants are issued by a company to raise money, whereas options are created by the Options Clearing Corporation (OCC).
Write/Writer An individual who sells an option short.
how to thinkorswim
Glossary
U
V
W
Trading Halt A tempo-rary suspension of trading in a particular stock due to anticipation of a major news announcement or an imbal-ance of buy and sell orders.
Treasury Stock Shares of stock issued by a company but later bought back by the company. These shares may be held in the company's treasury indefinitely, used for employee bonus plans, reissued to the public, or retired. Treasury stock is ineligible to vote or receive dividends.
Trend Either an uptrend or a downtrend; successive price movements in the same direction in a security over time.
Trust A legal relationship in which a person or entity (the trustee) acts for the benefit of someone else.
Type The classification of an option as either a call or a put.
UNCHED Trader slang for when the market is
unchanged.
Uncovered Call or Put An-other term for naked call or put.
Underlying (Stock or Security) The stock or other security that determines the value of a derivative security and that (with the exception of cash-settled options) would be purchased or sold if an option on that underlying stock or security was exer-cised. Examples of underlying securities are stocks, bonds, futures, and indices.
Unsystematic Risk The company-specific microeco-nomic factors that affect an in-dividual stock. Theoretically, it's the risk in a portfolio that can be reduced through diversification. Compare to systematic risk.
Uptick A term used to describe a trade made at a price higher than the preceding trade.
Uptick/Plus Tick Rule SEC regulation governing the market price at which a short sale may be made. If a stock on a given day has already dropped by more than 10% since the previous day's close, it must trade higher before it can be shorted again. This rule does not apply to ex-change-traded funds (ETFs).
Uptrend Successive upward price movements in a security over time.
Vega An approximation of the change in the price of
an option relative to a change in the volatility of the underlying stock when all other factors are held constant. This is typically expressed for a 1% change in volatility. For example, if a call has a price of $2.00 and a vega of 0.65, if volatility rises 1%, the call would have a price of $2.65 ($2.00 + [0.65 x 1.00]). Generated by a mathematical model, vega depends on the stock price, strike price, volatili-ty, interest rates, dividends, and time to expiration.
Vertical An option position composed of either all calls or all puts, with long options and short options at two different strikes. The options are all on the same
stock and of the same expiration, with the quantity of long options and the quantity of short options netting to zero. A long call vertical (bull spread) is created by buying a call and selling a call with a higher strike price. A short call vertical (bear spread) is created by selling a call and buying a call with a higher strike price. A long put vertical (bear spread) is created by buying a put and selling a put with a lower strike price. A short put vertical (bull spread) is created by selling a put and buying a put with a lower strike price. For example, a short 70/80 put vertical is long one 70 put and short one 80 put. Please note that multiple-leg option strategies such as these can entail substantial transac-tion costs, including multiple commissions, which may impact any potential return.
Volatility Generically, volatility is the size of the changes in the price of the underlying security. In practice, volatility is presented as either historical or implied.
Volatility Index (VIX) Cre-ated by the CBOE, the VIX is an index of volatility calculated from the extrinsic value of out-of-the money SPX index options.
Volatility Skew Volatility skew, or just "skew," arises when the implied volatilities of options in one month on one stock are not equal across the different strike prices. For example, there is skew in XYZ April options when the 80 strike has an implied volatility of 45%, the 90 strike has an implied volatility of 47%, and the 100 strike has an implied volatility of 50%. If the implied

194 HOW TO THINKORSWIM TD AMERITRADE 195
Index
videos 25sharing ideas 26
Trade pageActive Trader 127–131Forex Trader 139Futures Trader 126–128
Tradingmobile 146–174 placing 9, 88spreads 92, 99–101, 107–111, 116. See also verticals, calendar spreadsTrades on Charts 82–83
Verticalslong vertical 50, 99, 102–103
short vertical 78, 99, 104Volatility
historical 42, 98implied 42, 94, 96, 97–99, 102, 104, 125Volatility Index (VIX) 124–126VIX futures 124–126. See also futures
Watchlistscreating 15, 28, 44, 163
filtering 23, 28customizing 43, 152, 163importing 45sorting 43viewing 43, 148
Alerts 13, 79–81Analyze page
economic data 42, 136, 138fundamentals 40–42probability analysis 111, 118risk profile 104, 108–109, 116–117simulated trades 112, 117At the money 89–90, 98, 105, 108–110
Beta-weighting 78. See also management
Chartscontrol panel 69–70
create 31customize 68Flexible Grid 71Monkey Bars 132–133multiple charts 70patterns 59–63time period 64Product Depth 46, 119studies 31, 65–67technical analysis 60–63types 58–59, 65
Calendar spreads 99, 107–111Calls 10, 87–95, 101, 106–107. See also optionsCommissions 38, 102, 105, 141
Forexbasics of 134–143
commissions 141leverage 136–137quotes 140rollover rates 140trading 139–140. See also Trade page
Futuresbasics of 122–126quotes 126trading 127–131placing orders 130–131. See also Trade page
GadgetsLive News 27
Trader TV 29
Trade Flash 29Use the News 28
Help pagesupport and chat 20, 24,
158, 173–174. See also mobile trading
Implied volatility 42, 88, 94, 96–99, 102, 104, 125.See also
volatility
Leverage 87, 123. See also forex
Linking windows 45
Managementof trades 76–83
position statement 18, 78, 149, 164. See also be-ta-weightingset alerts 79–81. See also MarketWatch page
MarketWatch pagealerts 78–81, 147, 151. See also mobile tradingcalendar 23, 81financing rates 141quotes 48, 72–73quotes, futures 126quotes, forex 140quotes, mobile 148, 163visualize 46–47
Mobile tradingAndroid 160–174iPhone 146–157
Monitor pageAccount Statement 16–17Activity and Positions 16, 19
Open interest 119Options
at the money 89–90, 98, 105, 108calls 87–92, 94, 101–103in the money 89, 94, 96, 102, 105option chain 54, 88, 94–95, 102, 108, 112, 152, 167out of the money 89, 93–94,
96, 102, 104–105pricing 92–93puts 87–95, 101, 107–110strategies 90–93, 98–99. See also verticals, calendar spreads
Ordersadjust 95, 100, 108, 111 cancel 16filled 16placing 38, 50–55. See also options, stocks, futures, forextypes of 51working 16
Pre-market movers 28Price Slices 112–114
Puts 10, 78, 88–93, 95, 99, 101, 105. See also options
Quotes 48, 72–73, 126, 140, 148–149, 163–164, 167. See
also MarketWatch page, futures, forex, mobile trading
Scan pagepreset scans 32
Option Hacker 115saving scans 32 Stock Hacker 30
SetupCustomizing 14Layout 13–21
Stocksanalyst reports 40–41basics of 37–41company profile 41earnings analysis 42research 40–42, 46. See also fundamentals
Supportcontact 9, 20chat 14–15. See also myTradeSymbols
thinkScript 73–75. See also charts, monitor
Tools pagemyTrade 26Trade Feeds 26
A
B
C
H
S
Q
T
VM
L
W
I
F
G
O
P
how to thinkorswim

TD AMERITRADE 3
• The information presented in this text book is for education-al purposes only and is not a recommendation or endorsement of the suitability of any particular investment or investment strategy or course of action. Returns will vary and all investments involve risk, including loss of principal. Asset allocation and diversification do not ensure a profit nor eliminate the risk of investment losses. Your account is self-directed and any investment decision you make is solely your responsibility.
• Options are not suitable for all investors as the special risks inher-ent to options trading may expose investors to potentially rapid and substantial losses. Options trading subject to TD Ameritrade review and approval. Please see our website or contact TD Ameritrade at 800-669-3900 for options dis-closure documents. Carefully read these documents before investing in options.
• A covered call strategy can limit the upside potential of the underlying stock position, as the stock would likely be called away in the event of substantial stock price increase. Additionally, any downside protection provided to the related stock position is limited to the premium received. (Short options can be assigned at any time up to expiration regardless of the in-the-money amount.)
• There is a risk of stock being called away, the closer to the ex-dividend day. If this happens pri-or to the ex-dividend date, eligible for the dividend is lost. Income gen-erated is at risk should the position moves against the investor, if the investor later buys the call back at a higher price. The investor can also lose the stock position if assigned.
• A long call or put option position places the entire cost of the option position at risk. Should an individ-ual long call or long put position expire worthless, the entire cost of the position would be lost.
• The risk of loss on an uncovered call option position is potentially unlimited since there is no limit to the price increase of the underlying
security. The naked put strategy includes a high risk of purchasing the corresponding stock at the strike price when the market price of the stock will likely be lower. Naked option strategies involve the highest amount of risk and are only appropriate for traders with the highest risk tolerance.
• With the protective put strategy, while the long put provides some temporary protection from a de-cline in the price of the correspond-ing stock, this does involve risking the entire cost of the put position. Should the long put position expire worthless, the entire cost of the put position would be lost.
• Market volatility, volume and sys-tem availability may delay account access and trade executions.
• In order to demonstrate the functionality of the thinkorswim platform, actual symbols have been shown. They are for illustrative purposes only and are specifically not recommendations.
• Past performance of a security or strategy does not guarantee future results or success.
• Access to real-time market data is conditioned on acceptance of the exchange agreements.
• The risk of loss in trading options, futures, and forex can be substantial. Clients must consider all relevant risk factors, including their own personal financial situations, before trading. Trading involves risk and is not suitable for all investors. See the Options Disclosure Document: Char-acteristics and Risks of Standardized Options. A copy accompanies this magazine if you have not previously received one. Additional copies can be obtained at tdameritrade.com or by contacting us. Trading privileges are subject to TD Ameritrade review and approval. Not all account owners will qualify. Forex accounts are not available to residents of Ohio or Arizona.
• Trading foreign exchange on margin carries a high level of risk, as well as its own unique risk factors. Before considering the trading of this product, please read the Forex
Risk Disclosure available at http://www.nfa.futures.org/ NFA-investor-information/ publication-library/forex.pdf.
• A forex dealer can be compensated via commission and/or spread on forex trades.
TD Ameritrade is subsequentlycompensated by the forex dealer. Funds deposited into an account with a broker-dealer for investment in any currency, or which are the proceeds of a currency position, or any curren-cy in an account with a broker-dealer, are not protected by the SecuritiesInvestor Protection Corporation (SIPC).
• Futures trading is not suitable for all investors as the risk of loss in trading futures is substantial. Futures accounts are not protected by the Securities Investor Protection Corpo-ration (SIPC).
Futures and futures options trading services provided by TD Ameritrade Futures & Forex LLC. Trading privileges subject to review and approval. Not all clients will qualify. Futures and futures options trading is speculative, and is not suitable for all investors. Please read the Risk Disclosure for Futures and Options prior to trading futures products (https://www. tdameritrade.com/retail-en_us/resources/pdf/TDA631.pdf).
• The paperMoney® trading soft-ware application is for educational purposes only. Successful virtual trading during one time period does not guarantee successful investing of actual funds during a later time period as market conditions change continuously.
• TD Ameritrade, Inc., member FINRA/SIPC. TD Ameritrade is a trademark jointly owned by TD Ameritrade IP Company, Inc. and The Toronto-Dominion Bank. © 2017 TD Ameritrade.
ImportantInformation
how to thinkorswim

4 HOW TO THINKORSWIM
Are the days of buy-and-hold investing over? Hardly. But if you’re looking for the other way to participate in the stock mar-ket—trading—that’s what How to thinkorswim is all about. It's filled with tips and tricks on how to use the popular, powerful thinkorswim® trading platform from TD Ameritrade.
Broken down into four colorful sections, you’ll learn about stocks, options, option spreads, how to size up a trade with charts and volatility analysis, how to place stock and options trades in the thinkorswim platform, and how to check your head when things go wrong.
A Buffet of Trading How-To and thinkorswim Prowess
HOW TO
thinkorswimyour first stop for
trading stocks, options, futures, & forex