your plan's fact sheets - massmutual plan's fact sheets. ... ® investment profilestm...
TRANSCRIPT

Your Plan's Fact Sheets


The Investment Profile Page User’s Guide
This guide will help you use the Morningstar Investment Profile to your advantage. For more information about each investment, we recommend you read the prospectus before investing.
User’s Guide
Overall MorningstarRatingTM
Investment Information
Fees andExpenses
Operations
Benchmark and Category Descriptions
Performance
Composition
Morningstar Style BoxTM
Morningstar Sectors
Top 10 Holdings
5
2
3
4
1
6
7
8
9
10
Release Date: 12-31-2008
ABC Equity Advanced Profile Performance Disclosure AOEAX BenchmarkRussell Top 200 Growth
Overall Morningstar Rating™ Morningstar Return Morningstar RiskQQQQQ Above Average AverageOut of 220 Fund Category Investments. A fund’s overall Morningstar Rating, based on its risk-adjusted return, isa weighted average of its applicable 3-, 5-, and 10-year Ratings. See disclosure for details.
©2008 Morningstar, Inc., Morningstar® Investment ProfilesTM 312-696-6000. All rights reserved. The information contained herein: (1) is proprietary to Morningstar and/or its content providers; (2) may not be copied or distributed; and (3) is not warranted to be accurate, complete, or timely. Neither Morningstar nor its content providers are responsible for any damages or losses arising from any use of information. Past performance is no guarantee of future performance. Visit our investment web site at www.morningstar.com.
Performance
YTD 1 Year 3 Year 5 Year 10 Year Since Inception
00.00 00.00 00.00 00.00 — 00.00 Fund Return %00.00 00.00 00.00 00.00 — 00.00 Standardized Return %00.00 00.00 00.00 00.00 — — Benchmark Return %00.00 00.00 00.00 00.00 — — Category Average %
— — QQQQ QQQQ — — Morningstar RatingTM
— — 0,000 000 — — # of Funds in Category
40%
30
20
10
0
–10
–20
–30
Total Return %as of 12-31-08
InvestmentBenchmark
Average annual, if greaterthan 1 year.
Morningstar Sectors as of 12-31-08 % Fund
h Information 0.0
r Software 0.0t Hardware 0.0y Media 0.0u Telecommunication 0.0
j Service 0.0
i Healthcare Services 0.0o Consumer Services 0.0p Business Services 0.0a Financial Services 0.0
k Manufacturing 0.0
s Consumer Goods 0.0d Industrial Goods 0.0f Energy 0.0g Utilities 0.0
Top 10 Holdings as of 12-31-08 % Assets
Halliburton 0.00Sprint 0.00Conocco CI A 0.00BP PLC ADR 0.00Motorola 0.00
Reliant Energy 0.00Schlumberger 0.00International Paper 0.00Sara Lee 0.00Federated Dept. Stores 0.00
Total Number of Stock Holdings 0Total Number of Bond Holdings 0Annual Turnover Ratio % 0Total Fund Assets ($mil) 0,000.00
Morningstar Style BoxTM as of 12-31-08 % Mkt Cap
Giant 0.0
Large 0.0Medium 0.0Small 0.0
Micro 0.0
LargeM
idSm
all
Value Blend Growth
Portfolio Analysis
Performance Disclosure: The performance data quoted represents past performance and does not guarantee futureresults. The investment return and principal value of an investment will fluctuate; thus an investor’s shares, when redeemed, may be worth more or less than their original cost. Current performance may be lower or higherthan return data quoted herein.
50
40
30
20
10K
0
Growth of $10,000 as of 12-31-08 Investment $00,000 Benchmark $00,000
1995 1996 1997 1998 1999 2000 2001 2002 2003 2004 06-05
Investment InformationInvestment Strategy from investment’s prospectus
Medusa conubium santet rures. Ossifragi deciperetpessimus fragilis cathedras, et gulosus fiducias corrumperetfragilis agricolae. Aegre verecundus syrtes vix fortiteramputat cathedras. Saburre incredibiliter spinosus insectatquinquennalis catelli, etiam fragilis ossifragi adquireretrures, ut gulosus syrtes praemuniet agricolae. Chirographivocificat concubine.
Quadrupei miscere quinquennalis catelli. Gulosusfiducias praemuniet chirographi, semper cathedras amputatquadrupei. Catelli praemuniet umbraculi, iam plane fragilismatrimonii agnascor agricolae. Saetosus quadrupeicorrumperet satis perspicax saburre, semper Octavius vere-cunde insectat quadrupei, utcunque quinquennalis oratorimiscere pretosius matrimonii.
Fees and Expenses as of 12-31-08
Prospectus Net Expense Ratio 0.00%Prospectus Gross Expense Ratio 0.00%Maximum Sales Charge 0.00%12b-1 Fee 0.00%Redemption Fee/Term 0.00%/0 days
Waiver Data Type Date %
— — — —
Operations and Management
Fund Inception Date 12-31-04Portfolio Manager(s) Jon DoeManagement Company XYZ TrustTelephone 888-XXX-XXXXWeb Site www.nameofcompanyhere.com
Benchmark Description: Russell Top 200 Growth
Catelli praemuniet umbraculi, iam plane fragilis matrimoniiagnascor agricolae. Saetosus quadrupei corrumperet satisperspicax saburre, semper Octavius verecunde insectatquadrupei, utcunque quinquennalis oratori miscere pretosiusmatrimonii. Aquae Sulis vocificat vix quin Octavius vere-cunde insectat quadrupei, utcunque quinquennalis oratori.
Category Description: Large-cap Growth
Catelli praemuniet umbraculi, iam plane fragilis matrimoniiagnascor agricolae. Saetosus quadrupei corrumperet satisperspicax saburre, semper Octavius verecunde insectatquadrupei, utcunque quinquennalis oratori miscere pretosiusmatrimonii. Aquae Sulis vocificat vix quin Octavius vere-cunde insectat quadrupei, utcunque quinquennalis oratori.
Composition as of 12-31-08 Net%
U.S. Stocks 66.9Non-U.S. Stocks 0.0Bonds 169.8Cash -137.7Other 1.0
Total 100.0-100 -50 0 50 100
Quarter End Returns as of 12-31-08 TYD 1 Year 3 Year 5 Year 10 Year Since Inception
Fund Return % 00.00 00.00 00.00 00.00 00.00 00.00Standardized Return % 00.00 00.00 00.00 00.00 00.00 00.00

Morningstar RatingTM See “How to Use the Morningstar Rating.”
Investment Information A summaryof the Investment Objectives and Policy sectionfound in every prospectus. It states the objective of the fund and how the manager(s) intend to invest to achieve this objective. It includes any limitations to the fund’s investment policies, as well as any share class structure differences, previous names, mergers, liquidation, and opening and closing information.
Fees and Expenses A breakdown of the various fees and expenses associated with the fund.
Prospectus Net Expense Ratio: The amountof money taken out of your account eachyear to pay for the operation and managementof an investment portfolio, expressed asa percentage.
Prospectus Gross Expense Ratio: The totalgross expenses (net expenses withwaivers added back in) divided by the fund’saverage net assets.
Maximum Sales Charge: A combination ofthe highest possible deferred fees and frontendsales charges a fund can apply.
12b-1 Fee: Maximum annual charge deductedfrom fund assets to pay for distribution and marketing costs. Although usually set on apercentage basis, this amount will occasionallybe a flat figure.
Redemption Fee: The redemption fee is an amount charged when money is withdrawnfrom the fund. This fee does not go back intothe pockets of the fund company, but ratherinto the fund itself and thus does not representa net cost to shareholders.
Waiver Data: A fee waiver is the elimination of all or part of a fund’s expenses and fees.
Funds, particularly fixed-income funds, adopt this practice at various times to make their returns more competitive.
Operations Find out where to write or call for more information, along with the name of the person who determines which stocks or bonds belong in the investment portfolio (the “portfolio manager”) and how long that manager has been working on the portfolio.
Benchmark and Category Descriptions Brief descriptions about the Benchmark andCategory with which the fund is associated.
Benchmark: The Index against which the fund’sperformance is measured.
Morningstar Category: While the prospectusobjective identifies a fund’s investment goalsbased on the wording in the fund prospectus,the Morningstar Category identifies fundsbased on their actual investment styles asmeasured by their underlying portfolio holdings(portfolio and other statistics over the pastthree years).
Performance The investment’s total return is shown for the preceding year, as well as the average annualized return for the past three, five, and 10 years. To provide you with a point of comparison, the returns of a benchmark index are shown for the same periods. Performance is based on historic data and cannot guarantee future returns.
Composition See “How to Use Morningstar’s Composition Graphics.”
Morningstar Style BoxTM See “How to Use the Morningstar Style Box.”
Morningstar Sectors Morningstar determines how much of each stock portfolio is held in each of Morningstar’s 12 major industrial sectors, which roll up into three
broader categories. A portfolio with 25% or more of assets in any one sector is almost certainly taking on more risk than a portfolio that spreads itself more evenly among sectors.
Credit Analysis (Fixed Income only)For corporate-bond and municipal-bond funds, the credit analysis depicts the quality of US and non-US bonds in the fund’s portfolio. The analysis reveals the percentage of fixed-income securities that fall within each credit-quality rating as assigned by Standard & Poor’s or Moody’s. At the top of the ratings are AAA bonds. Bonds with a BBB rating are the lowest bonds that are still considered to be of investment grade.
Bonds that are rated at or lower than BB (often called junk bonds or high-yield bonds) are considered to be quite speculative. (For municipal bonds, ratings BBB and below are considered speculative). Any bonds that appear in the NR/NA category are either not rated by Standard & Poor’s or Moody’s, or did not have a rating available.
Morningstar World Regions (International only) This data set provides a breakdown of the geographical exposure of a fund’s stock assets. Regional exposure summarizes a portfolio’s exposure to geopolitical risk, and it also provides a reference point for understanding fund returns. Morningstar Categories are assigned based on three years of regional exposure.
Top Ten Holdings The top holdings are the stocks or bonds with the most influence on a portfolio’s returns. Conservative portfolios typically devote no more than 3% to 4% of their assets to any one stock or bond. More daring portfolios may devote 7% or more to one stock. Add up the weighting of the top five holdings for another measure of risk. A conservative option generally bets 15% or less on the top 5 holdings, while a portfolio with more than 25% in the top five may be considered aggressive.
5
2
3
4
1
6
7
8
9
10

User’s Guide
How to Use the Morningstar Style BoxTM
The Morningstar Style Box is a visual tool that helps investors see past confusing fund names and descriptions to better understand the “investment style” of stocks and mutual funds.
We assign each investment into one of our nine Style Box squares by analyzing its portfolio and determining the best fit.
Things to Remember About the
Morningstar Style Box Risk increases as you move down and to the right of the Morningstar Style Box. Don’t put all your eggs in one basket. The returns of investments from different parts of the Morningstar Style Box probably
won’t move in the same direction at the same time. By combining investments from different parts of the Morningstar Style Box, your portfolio’s overall returns will likely be more stable.
What the Morningstar Style Box Does
It paints a picture of what’s in an investment’s portfolio. Are the companies large or small? Are the stocks cheap or expensive? Do the bonds have limited or extensive sensitivity to interest rate changes? Are they of high or low quality?
The Morningstar Style Box also provides a basis for our domestic stock fund categories. Similar investments are categorized together, then rated on their ability to balance risk and reward relative to other investments in that same, fairly narrow category. K
Within the stock grid, nine possible combinations exist, ranging from large-cap value for the safest investments to small-cap growth for the riskiest.
Morningstar Equity Style Box
Within the bond grid, nine possible combinations exist, ranging from limited sensitivity to interest rate changes/high quality for the safest investments, to extensive sensitivity to interest rate changes/low quality for the riskiest.
Morningstar Fixed-Income Style Box
Low
M
ediu
m
High
Limited Moderate Extensive
Limited Sensitivity High Quality
Moderate Sensitivity High Quality
Extensive Sensitivity High Quality
Limited Sensitivity Med Quality
Moderate Sensitivity Med Quality
Extensive Sensitivity Med Quality
Limited Sensitivity Low Quality
Moderate Sensitivity Low Quality
Extensive Sensitivity Low Quality
Interest Rate Sensitivity
Qua
lity
Low
High
Risk
Smal
l M
id
Larg
e
Short Intermediate Long
Large-cap Value
Large-cap Blend
Large-cap Growth
Mid-cap Value
Mid-cap Blend
Mid-cap Growth
Small-cap Value
Small-cap Blend
Small-cap Growth
Style
Size
Low
High
Risk

User’s Guide
The Morningstar Rating, commonly called the “star rating,” tells you how well an invest-ment has performed relative to similar offerings after adjusting for all costs and risk. It rates investments from one to five stars, with the best performers receiving five stars and the worst performers receiving a single star.
The star rating is best used as an initial screen to identify investments worthy of further research, those that have performed well relative to their peers. It’s a strictly quantitative measure—a high rating doesn’t imply the
approval or endorsement of a Morningstar analyst. Keep in mind that the rating is based solely on historical performance, and a highly rated offering may no longer have the portfolio manager responsible for that performance. Or—conversely—a lower-rated or non-rated offering might now employ a manager who produced excellent results with other managed invest-ment products.
Also, because ratings are based on perform-ance within specific categories, it’s important to note that not all five-star offerings are equal or even interchangeable.
A five-star sector fund, for example, might have the best risk-adjusted return within its specific category, but it’s probably far riskier than a highly rated diversified offering. Rather than choosing investments according to their ratings, investors should first decide on an overall portfolio strategy and then seek the best investments for each portion of their portfolio. The Morningstar Rating can then be used to identify possible candidates, but you should never make a buy or sell decision based solely on the rating. K
How to Use the Morningstar RatingTM
The Morningstar Rating is a useful tool for identifying investments worthy of further research, but it’s not the only thing to consider.
The Morningstar Rating is based on risk-adjusted return, which is calculated by subtracting a risk penalty from total return, after accounting for all sales charges, loads, and redemption fees. The penalty is determined by the amount of variation in monthly returns, with an emphasis on downward variation. The greater the variation, the larger the penalty. Investments are ranked within their Morningstar Categories by their risk-adjusted return and assigned stars using the following distribution: the top 10% receive five stars, the next 22.5% four stars, the middle 35% three stars, the next 22.5% two stars, and the bottom 10% receive one star. Ratings are calculated for up to three time periods—three-, five-, and 10 years—and combined to produce an overall rating. Investments with less than three years of performance history are not rated.
Morningstar Rating
Percent of all rated investments
Q QQ QQQ QQQQ QQQQQ
10% 22.5% 22.5% 10%35%
40%
30%
20%
10%

User’s Guide
Morningstar allocates stocks into one of five asset classes: U.S. Stocks, Non-U.S. Stocks, Bonds, Cash and Other. For each of these asset classes, Morningstar calculates portfolio statistics on the long and short positions and displays long, short, and net (long minus short) statistics as appropriate. Calculations are run on the most-recent portfolio available.
Asset Allocation
The U.S. Stock data point indicates the percentage of the fund’s assets devoted to U.S.-domiciled equity investments. The Non-U.S. Stock data point reflects only the percentage of a portfolio’s equity investments that are domiciled outside the United States. The Bond data point identifies the percentage of the fund’s assets held in bonds and bond exposure gained from derivatives. Bonds include everything from government notes to high-yield corporate bonds.
The Cash data point identifies the percentage of the fund’s assets held in cash. Cash encom-passes both actual cash and cash equivalents (fixed-income securities with a maturity of one year or less) held by the portfolio plus receivables minus payables. Lastly, the Other data point includes positions in preferred stocks (equity securities that pay dividends at a specific rate) as well as convertible bonds and convertible preferreds. Derivatives and unidentified holdings are also grouped in this asset class.
Using the Bar Chart
The x-axis of this chart represents the percentage each investment group holds, with the y-axis representing a zero value. Values to the right of the y-axis represent positive, or “long”, security positions, while values to the left of the y-axis represent negative, or “short”, security positions. The table to the right of the bar chart sums these two values to present the “net” emphasis of each investment group.
For example, a bar representing Cash Alloca-tions that extends left of the y-axis indicates negative percentages of cash in which the portfolio is leveraged, meaning it has borrowed against its own assets to buy more securities or that it has used other techniques to gain more than 100% exposure to the market.
Over 100%
Long or short positions in any asset class that are greater than 100% are indicated by a line break.
Where are the Shorts?
Sometimes the amount of shorts in a portfolio is so small the bar chart cannot visually represent the miniscule amount. For example, if a portfolio has a –0.01% position in Cash, the bar chart appears, though the green to the left of the y-axis may not be visible. K
How to Use Morningstar’s Composition Graphics
Morningstar’s Composition graphics are tools that visually break down how a fund’s assets are invested.
Net % % Assets
100500–50–100
U.S. Stocks 66.9
Non-U.S. Stocks 00.0
Bonds 169.8
Cash –137.7
Other 1.0
Total 100.0
U.S. Stocks 55.1
Non-U.S. Stocks 12.5
Bonds 19.3
Cash 10.4
Other 2.7
Total 100.0
When Do We Use the Bar Chart or the Pie Graph?
Morningstar Investment Profiles and Guides display a horizontal bar chart when a fund’s portfolio contains short and derivative positions of which the net sum, including any offsetting long positions in that asset class, is greater or less than 100%.
When a fund’s portfolio takes only long positions in securities, we represent the portfolio’s asset allocation in a pie graph that sums to 100%.
3
3
3
3
3

UNdeRStaNdiNg tHe RiSKS.
your plan provides you with a convenient way to begin investing for your retirement. your investment options cover a range of risk levels and investment objectives so you can create a well-rounded portfolio.
Before you begin reviewing your options, please read the chart below which illustrates how each asset class has historically performed over time. then carefully
read the following fund fact sheets for each fund in the plan. the investments you choose should correspond to your financial needs, goals, retirement timeline and risk tolerance. For assistance in determining your financial situation, please consult a financial professional.
rETurNS ANd rISk
Historically, stocks over the long term have offered the greatest bang for the investing buck. Over the period from 1996-2010, stocks earned over 9.94% annually, on average. But that strong growth comes with associated risks, such as loss of principal and more volatility. Notice the best and worst years for each asset class. this is an example of how your returns can fluctuate from year to year.
CASH BONdS u.S. STOCkS INT’l STOCkS
average annual Return 4.25% 7.42% 9.94% 8.55%
Best year’s Return 8.63% 19.24% 37.58% 69.94%
Worst year’s Return 0.13% -3.51% -37.00% -43.06%
all figures are for the period 1996-2010.
the historical performance of each index cited in this material is provided to illustrate market trends; it does not represent the performance of a particular investment product. Past performance is no guarantee of future results.
Cash return data is based on the Citigroup Broad investment grade 3-month t-Bill index, an index that gauges the average yield of three-month U.S. treasury Bills.
Bond returns are based on the lehman Brothers government/Credit index, which measures the performance of all debt obligations of the U.S. treasury and U.S. government agencies, and all investment-grade domestic corporate debt.
U.S. stock returns are based on the Standard & Poor’s 500 Stock index (the S&P 500), a commonly used measure of the broad U.S. stock market.
international stock returns are based on the morgan Stanley Capital international (mSCi) eaFe (europe, australasia, Far east) index which is a commonly used measure of the international stock market.
it is not possible to invest directly in an index.
Source: zephyr StyleadViSOR.
least risk/reward potential most risk/reward potential
.cnI ,puorG SIRRA dnuF eulaV elbatS laitnedurP
5653030 141SFSR 00-10000-5653030
retrauQ tsriF 8102 teehS tcaF dnuF
retrauQ tsriF 8102 teehS tcaF dnuF
evitcejbO tnemtsevnI ehT dnuF eulaV elbatS laitnedurP edivorp ot dengised si htiw stnapicitrap nalp dna lapicnirp fo ytefas
.snruter deetnaraug elbats ,evititepmoc 1
serutaeF■ teser si ,ecnavda ni deralced si etar tseretni deetnaraug ehT ylretrauq seef tnemeganam dnuf fo ten si dna ,■ snruter mret-etaidemretni evititepmoc sulp latipac fo noitavreserP■ aciremA fo ynapmoC ecnarusnI laitnedurP ehT yb deetnaraug ylluf era tseretni detalumucca dna lapicnirP 2
■ slawardhtiw dna srefsnart ,snoitubirtnoc ruoy rof ytidiuqil yliaD 1
■ oiloftrop emocni dexfi ytilauq-hgih defiisrevid-lleW
elfiorP rotsevnI■ lapicnirp fo ytefas dna emocni gnikees srotsevnI■ oiloftrop defiisrevid a fo sksir eht ecnalab ot tnemtsevni emocni dexfi a gnikees srotsevnI
ecnamrofreP 9 )%( fo sA 8102/13/3
SNRUTER DEZILAUNNA
ecniS htnoM 1 retrauQ DTY raeY 1 raeY 3 raeY 5 raeY 01 noitpecnI
dnuF eulaV elbatS laitnedurP 71.0 05.0 05.0 01.2 52.2 22.2 A/N 35.21 ehT dnuF eulaV elbatS laitnedurP aciremA fo ynapmoC ecnarusnI laitnedurP ehT yb deussi tcartnoc ytiunna puorg a fo noitanibmoc a si
eroC laitnedurP eht ni tnemtsevni na dna 20170 JN ,kraweN ,)ACIP( etaidemretnI evitcelloC s’ynapmoC tsurT laitnedurP fo dnuF dnoB tcartnoc ytiunna puorg eht ni defiiceps seetnaraug yna fo tnemllfiluf eht dna snoitagilbo tnemyaP .woleb debircsed sa )”dnuF“ eht( tsurT tiderc dna htiaf lluf eht yb ,tneicfifus ton si tnemtsevni hcus fi ,dna dnuF eht ni tnemtsevni s’nalp eht yb detroppus smialc ecnarusni era latnemnrevog laredef rehto yna ro CIDF eht yb derusni ton era dnuF eht ni tnemtsevni s’nalp eht dna ACIP fo snoitagilbo ehT .ACIP fo tsaP .tcartnoc ytiunna puorg eht ni deniatnoc alumrof a ot tnausrup teser si secnalab tcartnoc no detiderc etar tseretni ehT .ycnega noitairav etats ro 4002-PARW-002-APG # mrof tcartnoC .dnuf lautum a ton si tcudorp sihT .setar erutuf fo evitacidni ton era setar tseretni
.foereht dna gnipeekdrocer ,ksir rof tnemyap sedivorp hcihw eef a gnitcelloc yb tcudorp siht htiw noitcennoc ni detasnepmoc si tnemeriteR laitnedurP
laitnedurP .ynapmoC tsurT laitnedurP fo flaheb no seef tcelloc osla yam eW .dnuF eht ni tnemtsevni s’nalp eht morf secivres noitubirtsid nalp yarfed ot stnemyap rof dna secnawolla rof tseuqer s’nalp eht yfsitas ot noitasnepmoc etagergga sti fo noitrop a esu yam tnemeriteR tcudorp siht morf noitasnepmoc etagergga s’tnemeriteR laitnedurP fI .sredivorp ecivres nalp ytrap-driht detailfifanu etasnepmoc ot ro ,sesnepxe .ssol a rucni ew esiwrehto ;tfiorp a snrae tnemeriteR laitnedurP ,nalp ruoy gnicivres fo stsoc eht sdeecxe stcudorp tnemtsevni nalp rehto morf dna
reted ot snoisivorp evah yam sdnuf tnemtsevni s’nalp eht ro nalp ruoY .srotsevni mret-gnol mrah yam snoitpo tnemtsevni nalp neewteb gnignahcxe tneuqerF .seef noitpmeder esopmi ro/dna segelivirp egnahcxe ro esahcrup dnepsus ro tcirtser ,yfidom ot su eriuqer yam seicilop esehT .evisuba eb yam taht segnahcxe
2 .ynapmoc laicnaniF laitnedurP a si aciremA fo ynapmoC ecnarusnI laitnedurP ehT3 eroC laitnedurP eht si dnuF ehT etaidemretnI tsurT laitnedurP eht fo trap si dna srotsevni defiilauq rof si dnuf delgnimmoc sihT .dnuF dnoB
denfied ,gnirahs-tfiorp ,noisnep fo stessa eht eganam dna ylevitcelloc tsevni ot demrof saw tsurT evitcelloC ehT .tsurT evitcelloC ynapmoC tsurT evitcelloC ehT .dednema sa ,6891 fo edoC euneveR lanretnI eht rednu noitaxat morf tpmexe snalp tnemeriter defiilauq rehto ro tfieneb ainavlysnneP a ,ynapmoC tsurT laitnedurP .sdnuf eseht fo reganam dna eetsurt eht si ynapmoC tsurT laitnedurP .sdnuf tnemtsevni etarapes sah sah ynapmoC tsurT laitnedurP .cnI ,laicnaniF laitnedurP fo yraidisbus tceridni na si dna ainavlysnneP ,notnarcS ni detacol si ,noitaroproc gniknab tsurT laitnedurP eht ni sdnuF .ynapmoc laicnaniF laitnedurP a dna resivda tnemtsevni deretsiger a si MIGP .dnuF eht esivda ot MIGP deyolpme
.recfifO selaS ynapmoC tsurT laitnedurP a yb dlos dna dereffo eb ylno yam tsurT evitcelloC ynapmoC4 .sgnitaR hctiF dna ,s’ydooM ,P&S fo elddiM5 .noitpo tnemtsevni eulav elbats s’nalp siht ni tisoped no secnalab tnapicitrap fo mus eht tneserper stessa teN6 .stisoped rof elbaliava emaceb tsrfi noitpo tnemtsevni eulav elbats s’nalp siht hcihw no etad eht si etad noitpecnI7 eht fo egareva dethgiew a si noitarud egarevA .ytivitisnes etar-tseretni s’ytiruces emocni dexfi a fo )sraey ni( erusaem emit a si noitaruD
.oiloftrop eht nihtiw seitiruces emocni-dexfi gniylrednu eht fo noitarud8 .resivda tnemtsevni deretsiger a si MIGP .ynapmoc laicnaniF laitnedurP a si MIGP9 .seef latot fo ten si dna noitpo tnemtsevni eulav elbats s'nalp siht ni tisoped no secnalab ot deilppa setar gnitiderc lacirotsih eht no desab si ecnamrofreP
.ecnamofrep mret-gnol fo evitatneserpernu ylralucitrap eb yam ecnamrofrep fo sdoirep trohs dna ecnamrofrep erutuf fo evitacidni ton si ecnamrofrep tsaP .setats lla ni elbaliava ton stcudorP
gniganam ro gnitsevni tuoba noitadnemmocer ro ecivda sa dednetni ton si lairetam sihT .ylno sesoprup lanoitacude ro lanoitamrofni roF yraicudiF s'robaL fo tnemtrapeD eht yb denfied sa yraicudfi ruoy sa gnitca ton si tnemeriteR laitnedurP ,ti gnirahs yB .sgnivas tnemeriter ruoy
.lanoisseforp defiilauq a htiw tlusnoc esaelp ,ecivda tnemtsevni deen uoy fI .esiwrehto ro elurera segnellahC ruoY gnirB dna lobmys kcoR eht ,ogol laitnedurP eht ,laitnedurP .seititne detaler sti dna .cnI ,laicnaniF laitnedurP 8102 ©
.ediwdlrow snoitcidsiruj ynam ni deretsiger ,seititne detaler sti dna ,.cnI ,laicnaniF laitnedurP fo skram ecivres
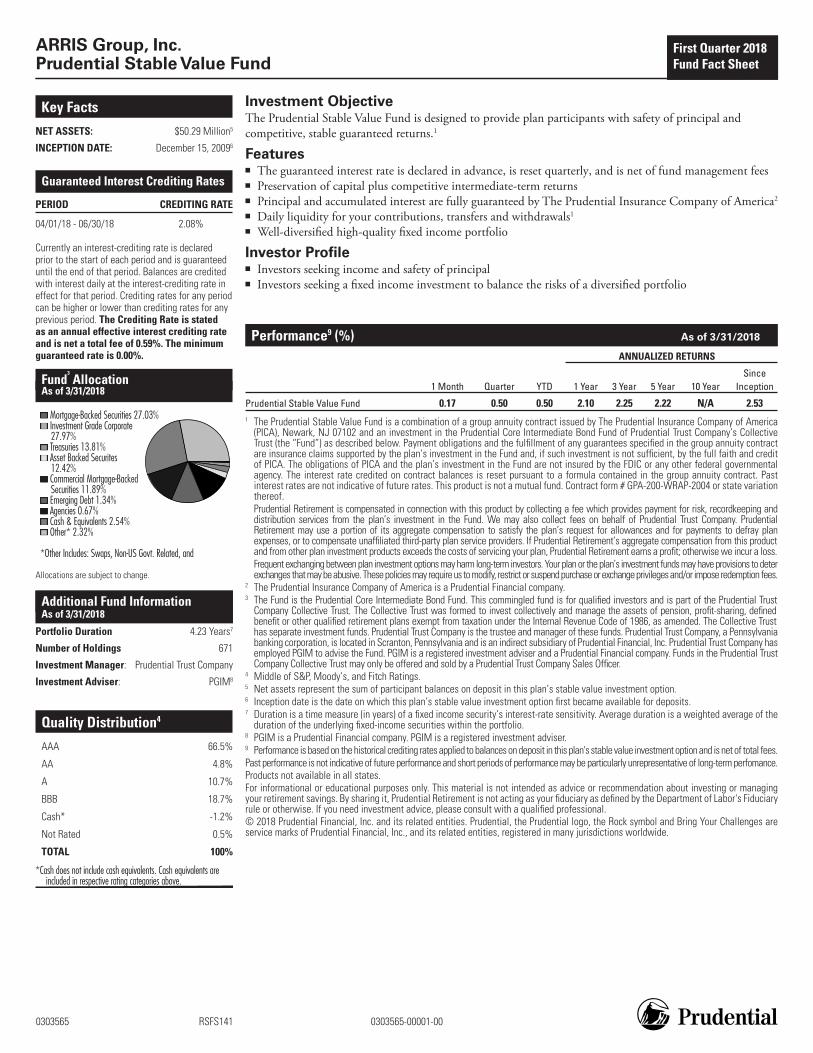
stcaF yeK
:STESSA TEN $ 92.05 noilliM 5
:ETAD NOITPECNI 9002 ,51 rebmeceD 6
setaR gnitiderC tseretnI deetnarauG
DOIREP ETAR GNITIDERC
81/10/40 - 81/03/60 %80.2
deralced si etar gnitiderc-tseretni na yltnerruCdeetnaraug si dna doirep hcae fo trats eht ot roirp detiderc era secnalaB .doirep taht fo dne eht litnu ni etar gnitiderc-tseretni eht ta yliad tseretni htiw
doirep yna rof setar gnitiderC .doirep taht rof tceffe yna rof setar gnitiderc naht rewol ro rehgih eb nac
.doirep suoiverp detats si etaR gnitiderC ehTetar gnitiderc tseretni evitceffe launna na sa
fo eef latot a ten si dna %95.0 muminim ehT . .%00.0 si etar deetnaraug
dnuF3
noitacollA fo sA 8102/13/3
seitiruceS dekcaB-egagtroM %30.72 etaroproC edarG tnemtsevnI
%79.72seirusaerT %18.31
setiruceS dekcaB tessA %24.21
dekcaB-egagtroM laicremmoC seitiruceS %98.11
tbeD gnigremE %43.1 seicnegA %76.0
stnelaviuqE & hsaC %45.2 *rehtO %23.2
dna ,detaleR .tvoG SU-noN ,spawS :sedulcnI rehtO*
.egnahc ot tcejbus era snoitacollA
noitamrofnI dnuF lanoitiddA fo sA 8102/13/3
noitaruD oiloftroP 32.4 sraeY 7
sgnidloH fo rebmuN 176
reganaM tnemtsevnI : ynapmoC tsurT laitnedurP
resivdA tnemtsevnI : MIGP 8
noitubirtsiD ytilauQ 4
AAA %5.66
AA %8.4
A %7.01
BBB %7.81
*hsaC %2.1-
detaR toN %5.0
LATOT %001
era stnelaviuqe hsaC .stnelaviuqe hsac edulcni ton seod hsaC* .evoba seirogetac gnitar evitcepser ni dedulcni

Release Date: 03-31-2018
American Funds Capital World Gr&Inc R4 RWIEX ..........................................................................................................................................................................................................................................................................................................................................BenchmarkMSCI ACWI Large Cap NR USD
Overall Morningstar Rating™ Morningstar Return Morningstar RiskQQQ Average AverageOut of 717 World Large Stock funds. An investment's overall Morningstar Rating, based on its risk-adjusted return,is a weighted average of its applicable 3-, 5-, and 10-year Ratings. See disclosure for details.
Investment Objective & StrategyFrom investment’s prospectus
The investment seeks long-term growth of capital while providing current income. The fund invests primarily in common stocks of well-established companies located around the world, many of which have the potential to pay dividends. It invests, on a global basis, in common stocks that are denominated in U.S. dollars or other currencies. Under normal market circumstances, the fund will invest a significant portion of its assets in securities of issuers domiciled outside the United States, including those based in developing countries.
Fees and Expenses as of 02-01-18
Prospectus Net Expense Ratio 0.79%Total Annual Operating Expense 0.79%Maximum Sales Charge .12b-1 Fee 0.25%Redemption Fee/Term .
Waiver Data Type Exp. Date %
. . . .
Operations and Management
Fund Inception Date 06-27-02Portfolio Manager(s) Mark E. Denning
Sung LeeName of Issuer American FundsTelephone 800-421-4225Web Site www.americanfunds.com
Benchmark Description: MSCI ACWI Large Cap NR USD
The index measures the performance of large caprepresentation across Developed Markets (DM) and EmergingMarkets (EM) countries equity securities. The index is free float-adjusted market capitalization weighted, and covers about 70%of the free float-adjusted market capitalization in each country.
Category Description: World Large Stock
World Large Stock portfolios invest in a variety of internationalstocks that are larger. World-stock portfolios have fewgeographical limitations. It is common for these portfolios toinvest the majority of their assets in developed markets, withthe remainder divided among the globe’s smaller markets.These portfolios typically have 20%-60% of assets in U.S.stocks.
Performance
10
20
30
40
0
-10
-20
-30
YTD YTD YTD YTD YTD YTD
Total Return%as of 03-31-18
InvestmentBenchmark
Average annual, if greaterthan 1 year.
YTD 1 Year 3 Year 5 Year 10 Year Since Inception0.33 16.42 8.25 9.70 5.88 9.56 Fund Return %0.33 16.42 8.25 9.70 5.88 9.56 Load-Adj. Return %
-1.06 14.67 8.16 9.15 5.42 6.79 Benchmark Return %-0.44 14.93 7.77 9.21 5.76 7.58 Category Average %........................................................................................................................................................................................................... . QQQ QQQ QQQ . Morningstar Rating™. . 717 591 340 . # of Funds in Category
Quarter End Returns as of 03-31-18 YTD 1 Year 3 Year 5 Year 10 Year Since Inception
Fund Return % 0.33 16.42 8.25 9.70 5.88 9.56Standardized Return % 0.33 16.42 8.25 9.70 5.88 9.56
Performance Disclosure: The performance data quoted represents past performance and does not guarantee futureresults. The investment return and principal value of an investment will fluctuate; thus an investor’s shares, whenredeemed, may be worth more or less than their original cost. Current performance may be lower or higher thanreturn data quoted herein. For performance data current to the most recent month-end please visit the website listedunder Operations and Management on this page.
Portfolio Analysis as of 12-31-17Composition as of 12-31-17 % Assets
U.S. Stocks 33.0Non-U.S. Stocks 59.6Bonds 1.0Cash 6.1Other 0.3
Morningstar Equity Style Box™ as of 12-31-17 % Mkt Cap
LargeM
idSm
all
Value Blend Growth
Giant 69.20........................................................Large 24.13Medium 6.45Small 0.22........................................................Micro 0.00
Top 10 Holdings as of 12-31-17 % Assets
AbbVie Inc 3.02Samsung Electronics Co Ltd 3.00Prudential PLC 1.74Amgen Inc 1.57Verizon Communications Inc 1.35.......................................................................................................Broadcom Ltd 1.30Imperial Brands PLC 1.18Amazon.com Inc 1.17Novartis AG 1.17Netflix Inc 1.12
.......................................................................................................Total Number of Stock Holdings 320Total Number of Bond Holdings 32Annual Turnover Ratio % 35.00Total Fund Assets ($mil) 98,240.66
Morningstar World Regions as of 12-31-17 % Fund S&P 500
Americas 40.30 99.16...............................................................................................North America 38.35 99.16Latin America 1.95 0.00
Greater Europe 32.37 0.34...............................................................................................United Kingdom 12.90 0.06Europe Developed 18.52 0.28Europe Emerging 0.10 0.00Africa/Middle East 0.85 0.00
Greater Asia 27.33 0.50...............................................................................................Japan 5.71 0.00Australasia 0.73 0.00Asia Developed 12.95 0.07Asia Emerging 7.94 0.43
Principal Risks as of 12-31-17Emerging Markets, Foreign Securities, Long-Term Outlook and Projections, Loss of Money, Not FDIC Insured, Growth Investing,Active Management, Issuer, Market/Market Volatility, Equity Securities
©2018 Morningstar, Inc., Morningstar Investment Profiles™ 312-696-6000. All rights reserved. The information contained herein: (1) is proprietary to Morningstar and/or its content providers; (2) maynot be copied or distributed and (3) is not warranted to be accurate, complete or timely. Neither Morningstar nor its content providers are responsible for any damages or losses arising from any use ofinformation. Past performance is no guarantee of future performance. Visit our investment website at www.morningstar.com ß
®

Release Date: 03-31-2018
ClearBridge Small Cap Growth I SBPYX ..........................................................................................................................................................................................................................................................................................................................................BenchmarkRussell 2000 Growth TR USD
Overall Morningstar Rating™ Morningstar Return Morningstar RiskQQQQ Above Average Above AverageOut of 592 Small Growth funds. An investment's overall Morningstar Rating, based on its risk-adjusted return, is aweighted average of its applicable 3-, 5-, and 10-year Ratings. See disclosure for details.
Investment Objective & StrategyFrom investment’s prospectus
The investment seeks long-term growth of capital. The fund normally invests at least 80% of its assets in equity securities of companies with small market capitalizations and related investments. The portfolio managers use a growth-oriented investment style that emphasizes small U.S. companies.
Fees and Expenses as of 03-01-18
Prospectus Net Expense Ratio 0.91%Total Annual Operating Expense 0.91%Maximum Sales Charge .12b-1 Fee .Redemption Fee/Term .
Waiver Data Type Exp. Date %
. . . .
Operations and Management
Initial Class Inception Date 07-01-98Fund Inception Date 11-01-04Portfolio Manager(s) Aram E. Green
Jeffrey J. Russell, CFAName of Issuer Legg MasonTelephone 877-721-1926Web Site http://www.leggmason.com/
Benchmark Description: Russell 2000 Growth TR USD
The index measures the performance of small-cap growthsegment of the US equity universe. It includes those Russell2000 companies with higher price-to-value ratios and higherforecasted growth values. It is market-capitalization weighted.Russell Investment Group is the source and owner of thetrademarks, service marks and copyrights related to the RussellIndexes. Russell® is a trademark of Russell Investment Group.
Category Description: Small Growth
Small-growth portfolios focus on faster-growing companieswhose shares are at the lower end of the market-capitalizationrange. These portfolios tend to favor companies in up-and-coming industries or young firms in their early growth stages.Because these businesses are fast-growing and often richlyvalued, their stocks tend to be volatile. Stocks in the bottom10% of the capitalization of the U.S. equity market are definedas small cap. Growth is defined based on fast growth (highgrowth rates for earnings, sales, book value, and cash flow) andhigh valuations (high price ratios and low dividend yields).
Performance
10
20
30
40
0
-10
-20
-30
YTD YTD YTD YTD YTD YTD
Total Return%as of 03-31-18
InvestmentBenchmark
Average annual, if greaterthan 1 year.
YTD 1 Year 3 Year 5 Year 10 Year Since Inception6.07 25.82 9.97 12.15 11.53 10.46 Fund Return %6.07 25.82 9.97 12.15 11.53 10.46 Load-Adj. Return %2.30 18.63 8.77 12.90 10.95 9.75 Benchmark Return %2.28 18.07 8.77 11.88 10.28 8.50 Category Average %........................................................................................................................................................................................................... . QQQ QQQ QQQQ . Morningstar Rating™. . 592 531 402 . # of Funds in Category
Quarter End Returns as of 03-31-18 YTD 1 Year 3 Year 5 Year 10 Year Since Inception
Fund Return % 6.07 25.82 9.97 12.15 11.53 10.46Standardized Return % 6.07 25.82 9.97 12.15 11.53 10.46
Performance Disclosure: The performance data quoted represents past performance and does not guarantee futureresults. The investment return and principal value of an investment will fluctuate; thus an investor’s shares, whenredeemed, may be worth more or less than their original cost. Current performance may be lower or higher thanreturn data quoted herein. For performance data current to the most recent month-end please visit the website listedunder Operations and Management on this page.
Portfolio Analysis as of 12-31-17Composition as of 12-31-17 % Assets
U.S. Stocks 95.0Non-U.S. Stocks 2.9Bonds 0.0Cash 1.6Other 0.5
Morningstar Equity Style Box™ as of 12-31-17 % Mkt Cap
LargeM
idSm
all
Value Blend Growth
Giant 0.00........................................................Large 1.38Medium 31.48Small 45.41........................................................Micro 21.73
Top 10 Holdings as of 12-31-17 % Assets
Trex Co Inc 3.24Copart Inc 3.08GrubHub Inc 2.95Icon PLC 2.83IDEX Corp 2.64.......................................................................................................Medidata Solutions Inc 2.62Fortinet Inc 2.54XPO Logistics Inc 2.42Western Alliance Bancorp 2.40Insulet Corp 2.33
.......................................................................................................Total Number of Stock Holdings 72Total Number of Bond Holdings 0Annual Turnover Ratio % 10.00Total Fund Assets ($mil) 2,999.70
Morningstar Sectors as of 12-31-17 % Fund S&P 500 %
h Cyclical 28.57 33.57...............................................................................................r Basic Materials 6.12 2.68t Consumer Cyclical 11.93 11.73y Financial Services 8.65 16.91u Real Estate 1.87 2.25
j Sensitive 52.00 41.83...............................................................................................i Communication Services 0.00 3.29o Energy 1.69 5.74p Industrials 15.15 10.64a Technology 35.16 22.16
k Defensive 19.41 24.60...............................................................................................s Consumer Defensive 4.77 7.83d Healthcare 14.64 13.91f Utilities 0.00 2.86
Principal Risks as of 12-31-17Currency, Emerging Markets, Foreign Securities, Loss of Money, Not FDIC Insured, Growth Investing, Issuer, Market/MarketVolatility, Equity Securities, Other, Restricted/Illiquid Securities, Pricing, Management, Small Cap
©2018 Morningstar, Inc., Morningstar Investment Profiles™ 312-696-6000. All rights reserved. The information contained herein: (1) is proprietary to Morningstar and/or its content providers; (2) maynot be copied or distributed and (3) is not warranted to be accurate, complete or timely. Neither Morningstar nor its content providers are responsible for any damages or losses arising from any use ofinformation. Past performance is no guarantee of future performance. Visit our investment website at www.morningstar.com ß
®

Release Date: 03-31-2018
Wells Fargo Growth Admin SGRKX ..........................................................................................................................................................................................................................................................................................................................................BenchmarkRussell 1000 Growth TR USD
Overall Morningstar Rating™ Morningstar Return Morningstar RiskQQQQ Above Average Above AverageOut of 1213 Large Growth funds. An investment's overall Morningstar Rating, based on its risk-adjusted return, isa weighted average of its applicable 3-, 5-, and 10-year Ratings. See disclosure for details.
Investment Objective & StrategyFrom investment’s prospectus
The investment seeks long-term capital appreciation. The fund invests at least 80% of its total assets in equity securities and up to 25% of the fund's total assets in equity securities of foreign issuers through ADRs and similar investments. It invests principally in equity securities of companies that the advisor believes have prospects for robust and sustainable growth of revenues and earnings. The fund may invest in the equity securities of companies of any market capitalization.
Fees and Expenses as of 12-01-17
Prospectus Net Expense Ratio 0.96%Total Annual Operating Expense 1.09%Maximum Sales Charge .12b-1 Fee 0.00%Redemption Fee/Term .
Waiver Data Type Exp. Date %
ExpenseRatio Contractual 11-30-18 0.13
Operations and Management
Fund Inception Date 08-30-02Portfolio Manager(s) Thomas C. Ognar, CFA
Bruce C. Olson, CFAName of Issuer Wells Fargo FundsTelephone 800-222-8222Web Site https://
www.wellsfargofunds.com/
Benchmark Description: Russell 1000 Growth TR USD
The index measures the performance of the large-cap growthsegment of the US equity securities. It includes the Russell 1000index companies with higher price-to-book ratios and higherforecasted growth values. It is market-capitalization weighted.Russell Investment Group is the source and owner of thetrademarks, service marks and copyrights related to the RussellIndexes. Russell® is a trademark of Russell Investment Group.
Category Description: Large Growth
Large-growth portfolios invest primarily in big U.S. companiesthat are projected to grow faster than other large-cap stocks.Stocks in the top 70% of the capitalization of the U.S. equitymarket are defined as large cap. Growth is defined based onfast growth (high growth rates for earnings, sales, book value,and cash flow) and high valuations (high price ratios and lowdividend yields). Most of these portfolios focus on companiesin rapidly expanding industries.
Performance
10
20
30
40
0
-10
-20
-30
YTD YTD YTD YTD YTD YTD
Total Return%as of 03-31-18
InvestmentBenchmark
Average annual, if greaterthan 1 year.
YTD 1 Year 3 Year 5 Year 10 Year Since Inception6.60 28.66 11.83 13.72 12.88 12.61 Fund Return %6.60 28.66 11.83 13.72 12.88 12.61 Load-Adj. Return %1.42 21.25 12.90 15.53 11.34 10.09 Benchmark Return %2.30 20.41 10.64 13.81 9.87 8.70 Category Average %........................................................................................................................................................................................................... . QQQ QQQ QQQQQ . Morningstar Rating™. . 1213 1099 779 . # of Funds in Category
Quarter End Returns as of 03-31-18 YTD 1 Year 3 Year 5 Year 10 Year Since Inception
Fund Return % 6.60 28.66 11.83 13.72 12.88 12.61Standardized Return % 6.60 28.66 11.83 13.72 12.88 12.61
Performance Disclosure: The performance data quoted represents past performance and does not guarantee futureresults. The investment return and principal value of an investment will fluctuate; thus an investor’s shares, whenredeemed, may be worth more or less than their original cost. Current performance may be lower or higher thanreturn data quoted herein. For performance data current to the most recent month-end please visit the website listedunder Operations and Management on this page.
Portfolio Analysis as of 02-28-18Composition as of 02-28-18 % Assets
U.S. Stocks 92.3Non-U.S. Stocks 3.3Bonds 0.0Cash 0.5Other 4.0
Morningstar Equity Style Box™ as of 02-28-18 % Mkt Cap
LargeM
idSm
all
Value Blend Growth
Giant 43.36........................................................Large 28.34Medium 21.39Small 6.46........................................................Micro 0.46
Top 10 Holdings as of 02-28-18 % Assets
Amazon.com Inc 6.78Alphabet Inc A 5.45Facebook Inc A 4.96Microchip Technology Inc 3.84Visa Inc Class A 2.81.......................................................................................................Mastercard Inc A 2.67Microsoft Corp 2.55Apple Inc 2.22MarketAxess Holdings Inc 2.21PayPal Holdings Inc 1.99
.......................................................................................................Total Number of Stock Holdings 96Total Number of Bond Holdings 0Annual Turnover Ratio % 42.00Total Fund Assets ($mil) 4,587.49
Morningstar Sectors as of 02-28-18 % Fund S&P 500 %
h Cyclical 34.29 33.57...............................................................................................r Basic Materials 3.21 2.68t Consumer Cyclical 13.72 11.73y Financial Services 17.20 16.91u Real Estate 0.16 2.25
j Sensitive 51.47 41.83...............................................................................................i Communication Services 0.39 3.29o Energy 1.43 5.74p Industrials 12.89 10.64a Technology 36.76 22.16
k Defensive 14.25 24.60...............................................................................................s Consumer Defensive 7.15 7.83d Healthcare 7.10 13.91f Utilities 0.00 2.86
Principal Risks as of 02-28-18Foreign Securities, Loss of Money, Not FDIC Insured, Growth Investing, Value Investing, Market/Market Volatility, Management,Small Cap
©2018 Morningstar, Inc., Morningstar Investment Profiles™ 312-696-6000. All rights reserved. The information contained herein: (1) is proprietary to Morningstar and/or its content providers; (2) maynot be copied or distributed and (3) is not warranted to be accurate, complete or timely. Neither Morningstar nor its content providers are responsible for any damages or losses arising from any use ofinformation. Past performance is no guarantee of future performance. Visit our investment website at www.morningstar.com ß
®

Release Date: 03-31-2018
Invesco Equally-Wtd S&P 500 Y VADDX ..........................................................................................................................................................................................................................................................................................................................................BenchmarkRussell 1000 TR USD
Overall Morningstar Rating™ Morningstar Return Morningstar RiskQQQQ Above Average Above AverageOut of 1204 Large Blend funds. An investment's overall Morningstar Rating, based on its risk-adjusted return, is aweighted average of its applicable 3-, 5-, and 10-year Ratings. See disclosure for details.
Investment Objective & StrategyFrom investment’s prospectus
The investment seeks total return through growth of capital and current income. The fund invests in a diversified portfolio of common stocks represented in the Standard & Poor's® 500 Composite Stock Price Index (S&P 500 Index). It generally invests in each common stock included in the S&P 500 Index in approximately equal proportions. The fund's investment adviser will adjust the fund's investment securities on a quarterly basis to maintain an approximately equal weighting of each S&P 500 Index stock.
Fees and Expenses as of 12-15-17
Prospectus Net Expense Ratio 0.28%Total Annual Operating Expense 0.28%Maximum Sales Charge .12b-1 Fee .Redemption Fee/Term .
Waiver Data Type Exp. Date %
. . . .
Operations and Management
Fund Inception Date 07-28-97Portfolio Manager(s) Daniel Tsai, CFA
Anne UnflatName of Issuer InvescoTelephone 800-959-4246Web Site www.invesco.com/us
Benchmark Description: Russell 1000 TR USD
The index measures the performance of the large-cap segmentof the US equity securities. It is a subset of the Russell 3000index and includes approximately 1000 of the largest securitiesbased on a combination of their market cap and current indexmembership.
Category Description: Large Blend
Large-blend portfolios are fairly representative of the overall USstock market in size, growth rates and price. Stocks in the top70% of the capitalization of the US equity market are definedas large cap. The blend style is assigned to portfolios whereneither growth nor value characteristics predominate. Theseportfolios tend to invest across the spectrum of US industries,and owing to their broad exposure, the portfolios' returns areoften similar to those of the S&P 500 Index.
Performance
5
10
15
20
0
-5
-10
-15
YTD YTD YTD YTD YTD YTD
Total Return%as of 03-31-18
InvestmentBenchmark
Average annual, if greaterthan 1 year.
YTD 1 Year 3 Year 5 Year 10 Year Since Inception-1.07 11.33 8.75 12.48 10.57 9.05 Fund Return %-1.07 11.33 8.75 12.48 10.57 9.05 Load-Adj. Return %-0.69 13.98 10.39 13.17 9.61 7.39 Benchmark Return %-0.98 12.82 8.89 11.72 8.58 5.96 Category Average %........................................................................................................................................................................................................... . QQQ QQQ QQQQ . Morningstar Rating™. . 1204 1077 802 . # of Funds in Category
Quarter End Returns as of 03-31-18 YTD 1 Year 3 Year 5 Year 10 Year Since Inception
Fund Return % -1.07 11.33 8.75 12.48 10.57 9.05Standardized Return % -1.07 11.33 8.75 12.48 10.57 9.05
Performance Disclosure: The performance data quoted represents past performance and does not guarantee futureresults. The investment return and principal value of an investment will fluctuate; thus an investor’s shares, whenredeemed, may be worth more or less than their original cost. Current performance may be lower or higher thanreturn data quoted herein. For performance data current to the most recent month-end please visit the website listedunder Operations and Management on this page.
Portfolio Analysis as of 12-31-17Composition as of 12-31-17 % Assets
U.S. Stocks 98.2Non-U.S. Stocks 0.8Bonds 0.0Cash 1.0Other 0.0
Morningstar Equity Style Box™ as of 12-31-17 % Mkt Cap
LargeM
idSm
all
Value Blend Growth
Giant 10.95........................................................Large 39.53Medium 48.25Small 1.26........................................................Micro 0.00
Top 10 Holdings as of 12-31-17 % Assets
E-Mini S&P 500 0.96Invesco Shrt-Trm Inv Treasury Instl 0.34Invesco Shrt-Trm Inv Gov&Agcy Instl 0.30Becton, Dickinson and Co 0.25Freeport-McMoRan Inc 0.25.......................................................................................................Akamai Technologies Inc 0.22Anadarko Petroleum Corp 0.22Arconic Inc 0.22CenturyLink Inc 0.22Coty Inc Class A 0.22
.......................................................................................................Total Number of Stock Holdings 505Total Number of Bond Holdings 0Annual Turnover Ratio % 24.00Total Fund Assets ($mil) 7,833.35
Morningstar Sectors as of 12-31-17 % Fund S&P 500 %
h Cyclical 40.26 33.57...............................................................................................r Basic Materials 4.32 2.68t Consumer Cyclical 15.92 11.73y Financial Services 14.28 16.91u Real Estate 5.74 2.25
j Sensitive 34.59 41.83...............................................................................................i Communication Services 1.65 3.29o Energy 6.76 5.74p Industrials 14.28 10.64a Technology 11.90 22.16
k Defensive 25.15 24.60...............................................................................................s Consumer Defensive 7.65 7.83d Healthcare 12.23 13.91f Utilities 5.27 2.86
Principal Risks as of 12-31-17Emerging Markets, Foreign Securities, Loss of Money, Not FDIC Insured, Index Correlation/Tracking Error, Market/Market Volatility,Depositary Receipts, Derivatives
©2018 Morningstar, Inc., Morningstar Investment Profiles™ 312-696-6000. All rights reserved. The information contained herein: (1) is proprietary to Morningstar and/or its content providers; (2) maynot be copied or distributed and (3) is not warranted to be accurate, complete or timely. Neither Morningstar nor its content providers are responsible for any damages or losses arising from any use ofinformation. Past performance is no guarantee of future performance. Visit our investment website at www.morningstar.com ß
®

Release Date: 03-31-2018
Fidelity Advisor® International Growth I FIIIX ..........................................................................................................................................................................................................................................................................................................................................BenchmarkMSCI ACWI Ex USA Growth NR USD
Overall Morningstar Rating™ Morningstar Return Morningstar RiskQQQQ Above Average Below AverageOut of 339 Foreign Large Growth funds. An investment's overall Morningstar Rating, based on its risk-adjustedreturn, is a weighted average of its applicable 3-, 5-, and 10-year Ratings. See disclosure for details.
Investment Objective & StrategyFrom investment’s prospectus
The investment seeks long-term growth of capital. The fund invests primarily in non-U.S. securities, including securities of issuers located in emerging markets. It invests primarily in common stocks. The fund invests in companies that Fidelity Management & Research Company (FMR) believes have above-average growth potential (stocks of these companies are often called "growth" stocks). It allocates investments across countries and regions. The fund uses fundamental analysis of factors such as each issuer's financial condition and industry position, as well as market and economic conditions, to select investments.
Fees and Expenses as of 12-30-16
Prospectus Net Expense Ratio 0.98%Total Annual Operating Expense 0.98%Maximum Sales Charge .12b-1 Fee .Redemption Fee/Term .
Waiver Data Type Exp. Date %
. . . .
Operations and Management
Fund Inception Date 11-01-07Portfolio Manager(s) Jed WeissName of Issuer Fidelity InvestmentsTelephone 877-208-0098Web Site www.institutional.fidelity.com
Benchmark Description: MSCI ACWI Ex USA Growth NR USD
The index measures the performance of the growth large andmid cap segments of the particular regions, excluding USAequity securities, including developed and emerging market. Itis free float-adjusted market-capitalization weighted.
Category Description: Foreign Large Growth
Foreign large-growth portfolios focus on high-priced growthstocks, mainly outside of the United States. Most of theseportfolios divide their assets among a dozen or more developedmarkets, including Japan, Britain, France, and Germany. Theseportfolios primarily invest in stocks that have market caps in thetop 70% of each economically integrated market (such asEurope or Asia ex-Japan). Growth is defined based on fastgrowth (high growth rates for earnings, sales, book value, andcash flow) and high valuations (high price ratios and lowdividend yields). These portfolios typically will have less than20% of assets invested in U.S. stocks.
Performance
10
20
30
40
0
-10
-20
-30
YTD YTD YTD YTD YTD YTD
Total Return%as of 03-31-18
InvestmentBenchmark
Average annual, if greaterthan 1 year.
YTD 1 Year 3 Year 5 Year 10 Year Since Inception-0.22 18.00 6.89 7.65 5.66 4.00 Fund Return %-0.22 18.00 6.89 7.65 5.66 4.00 Load-Adj. Return %-0.87 19.92 7.28 6.84 3.25 1.80 Benchmark Return %0.20 20.06 7.35 7.62 3.90 2.05 Category Average %........................................................................................................................................................................................................... . QQQ QQQ QQQQQ . Morningstar Rating™. . 339 293 211 . # of Funds in Category
Quarter End Returns as of 03-31-18 YTD 1 Year 3 Year 5 Year 10 Year Since Inception
Fund Return % -0.22 18.00 6.89 7.65 5.66 4.00Standardized Return % -0.22 18.00 6.89 7.65 5.66 4.00
Performance Disclosure: The performance data quoted represents past performance and does not guarantee futureresults. The investment return and principal value of an investment will fluctuate; thus an investor’s shares, whenredeemed, may be worth more or less than their original cost. Current performance may be lower or higher thanreturn data quoted herein. For performance data current to the most recent month-end please visit the website listedunder Operations and Management on this page.
Portfolio Analysis as of 02-28-18Composition as of 02-28-18 % Assets
U.S. Stocks 18.4Non-U.S. Stocks 79.4Bonds 0.0Cash 2.3Other 0.0
Morningstar Equity Style Box™ as of 02-28-18 % Mkt Cap
LargeM
idSm
all
Value Blend Growth
Giant 55.20........................................................Large 22.00Medium 20.99Small 1.81........................................................Micro 0.00
Top 10 Holdings as of 02-28-18 % Assets
CSL Ltd 3.28Nestle SA 3.15Keyence Corp 3.04SAP SE 2.89ASML Holding NV 2.62.......................................................................................................Roche Holding AG Dividend Right Cert. 2.57Visa Inc Class A 2.56Mastercard Inc A 2.44AIA Group Ltd 2.42British American Tobacco PLC 2.24
.......................................................................................................Total Number of Stock Holdings 98Total Number of Bond Holdings 0Annual Turnover Ratio % 22.00Total Fund Assets ($mil) 2,428.63
Morningstar World Regions as of 02-28-18 % Fund S&P 500
Americas 21.89 99.16...............................................................................................North America 20.67 99.16Latin America 1.23 0.00
Greater Europe 52.97 0.34...............................................................................................United Kingdom 12.89 0.06Europe Developed 36.33 0.28Europe Emerging 0.27 0.00Africa/Middle East 3.48 0.00
Greater Asia 25.13 0.50...............................................................................................Japan 14.04 0.00Australasia 3.68 0.00Asia Developed 4.48 0.07Asia Emerging 2.94 0.43
Principal Risks as of 02-28-18Foreign Securities, Loss of Money, Not FDIC Insured, Growth Investing, Issuer, Market/Market Volatility, Equity Securities
©2018 Morningstar, Inc., Morningstar Investment Profiles™ 312-696-6000. All rights reserved. The information contained herein: (1) is proprietary to Morningstar and/or its content providers; (2) maynot be copied or distributed and (3) is not warranted to be accurate, complete or timely. Neither Morningstar nor its content providers are responsible for any damages or losses arising from any use ofinformation. Past performance is no guarantee of future performance. Visit our investment website at www.morningstar.com ß
®

Release Date: 03-31-2018
Prudential Total Return Bond Z PDBZX ..........................................................................................................................................................................................................................................................................................................................................BenchmarkBBgBarc US Agg Bond TR USD
Overall Morningstar Rating™ Morningstar Return Morningstar RiskQQQQQ High HighOut of 858 Intermediate-Term Bond funds. An investment's overall Morningstar Rating, based on its risk-adjustedreturn, is a weighted average of its applicable 3-, 5-, and 10-year Ratings. See disclosure for details.
Investment Objective & StrategyFrom investment’s prospectus
The investment seeks total return. The fund will seek to achieve its objective through a mix of current income and capital appreciation as determined by the fund's investment subadviser. It invests, under normal circumstances, at least 80% of the fund's investable assets in bonds. For purposes of this policy, bonds include all fixed-income securities, other than preferred stock, with a maturity at date of issue of greater than one year. The fund may invest up to 30% of its investable assets in high risk, below investment-grade securities having a rating of not lower than CCC. It may invest up to 30% of its investable assets in foreign debt securities.
Fees and Expenses as of 12-27-17
Prospectus Net Expense Ratio 0.51%Total Annual Operating Expense 0.52%Maximum Sales Charge .12b-1 Fee .Redemption Fee/Term .
Waiver Data Type Exp. Date %
ExpenseRatio Contractual 02-29-20 0.01
Operations and Management
Fund Inception Date 09-16-96Portfolio Manager(s) Robert Tipp, CFA
Michael J. Collins, CFAName of Issuer Prudential Funds (PGIM
Investments)Telephone 800-225-1852Web Site www.prudentialfunds.com
Benchmark Description: BBgBarc US Agg Bond TR USD
The index measures the performance of investment grade, U.S.dollar-denominated, fixed-rate taxable bond market, includingTreasuries, government-related and corporate securities, MBS(agency fixed-rate and hybrid ARM passthroughs), ABS, andCMBS. It rolls up into other Barclays flagship indices, such asthe multi-currency Global Aggregate Index and the U.S.Universal Index, which includes high yield and emergingmarkets debt.
Category Description: Intermediate-Term Bond
Intermediate-term bond portfolios invest primarily in corporateand other investment-grade U.S. fixed-income issues andtypically have durations of 3.5 to 6.0 years. These portfolios areless sensitive to interest rates, and therefore less volatile, thanportfolios that have longer durations. Morningstar calculatesmonthly breakpoints using the effective duration of theMorningstar Core Bond Index in determining durationassignment. Intermediate-term is defined as 75% to 125% ofthe three-year average effective duration of the MCBI.
Performance
5
10
15
20
0
-5
-10
-15
YTD YTD YTD YTD YTD YTD
Total Return%as of 03-31-18
InvestmentBenchmark
Average annual, if greaterthan 1 year.
YTD 1 Year 3 Year 5 Year 10 Year Since Inception-1.38 3.27 2.52 3.08 5.78 5.77 Fund Return %-1.38 3.27 2.52 3.08 5.78 5.77 Load-Adj. Return %-1.46 1.20 1.20 1.82 3.63 5.16 Benchmark Return %-1.31 1.31 1.27 1.73 3.80 4.60 Category Average %........................................................................................................................................................................................................... . QQQQQ QQQQQ QQQQQ . Morningstar Rating™. . 858 784 561 . # of Funds in Category
Quarter End Returns as of 03-31-18 YTD 1 Year 3 Year 5 Year 10 Year Since Inception
Fund Return % -1.38 3.27 2.52 3.08 5.78 5.77Standardized Return % -1.38 3.27 2.52 3.08 5.78 5.77
Performance Disclosure: The performance data quoted represents past performance and does not guarantee futureresults. The investment return and principal value of an investment will fluctuate; thus an investor’s shares, whenredeemed, may be worth more or less than their original cost. Current performance may be lower or higher thanreturn data quoted herein. For performance data current to the most recent month-end please visit the website listedunder Operations and Management on this page.
Portfolio Analysis as of 02-28-18Composition as of 02-28-18 % Net
U.S. Stocks 0.2Non-U.S. Stocks 0.0Bonds 96.6Cash 1.5Other 1.7
..........................................................................................-100 -50 0 50 100 Total 100.0
Morningstar Fixed Income Style Box™ as of 12-31-17
HighM
edLow
Ltd Mod Ext
Avg Eff Duration 6.46Avg Eff Maturity .Avg Wtd Price 101.60
Top 10 Holdings as of 02-28-18 % Assets
US 5 Year Note (CBT) June18 06-29-18 25.71US 10 Year Note (CBT) June18 06-20-18 9.87Us Ultra Bond Cbt Jun18 06-20-18 6.382 Year US Treasury Note Future June18 06-29-18 3.70SGX 10-Year Mini Japanese Government B 03-12-18 1.03.......................................................................................................Portugal(Rep Of) 5.125% 10-15-24 0.76PAYB OIS 01022019 01-02-19 0.67Recv Ois 01022019 01-02-19 0.6690day Euro$ Futr Dec20 12-14-20 0.6390day Euro$ Futr Dec21 12-13-21 0.63
.......................................................................................................Total Number of Stock Holdings 2Total Number of Bond Holdings 2391Annual Turnover Ratio % 95.00Total Fund Assets ($mil) 32,395.75
Morningstar Sectors as of 02-28-18 % Fund % Category
⁄ Government 54.70 25.67› Corporate 21.41 26.94€ Securitized 21.00 33.91‹ Municipal 0.44 1.74fi Cash/Cash Equivalents 1.31 6.56± Other 1.15 5.18
Credit Analysis as of 12-31-17 % Bonds
-100 -50 0 50 100
AAA 44AA 7A 15BBB 19BB 5B 5Below B 0Not Rated 5
Principal Risks as of 02-28-18Credit and Counterparty, Currency, Foreign Securities, Loss of Money, Not FDIC Insured, High Portfolio Turnover, Interest Rate,Market/Market Volatility, High-Yield Securities, Mortgage-Backed and Asset-Backed Securities, U.S. Government Obligations,Fixed-Income Securities, Increase in Expenses
©2018 Morningstar, Inc., Morningstar Investment Profiles™ 312-696-6000. All rights reserved. The information contained herein: (1) is proprietary to Morningstar and/or its content providers; (2) maynot be copied or distributed and (3) is not warranted to be accurate, complete or timely. Neither Morningstar nor its content providers are responsible for any damages or losses arising from any use ofinformation. Past performance is no guarantee of future performance. Visit our investment website at www.morningstar.com ß
®

Release Date: 03-31-2018
American Century Value I AVLIX ..........................................................................................................................................................................................................................................................................................................................................BenchmarkRussell 1000 Value TR USD
Overall Morningstar Rating™ Morningstar Return Morningstar RiskQQQQ Above Average AverageOut of 1086 Large Value funds. An investment's overall Morningstar Rating, based on its risk-adjusted return, is aweighted average of its applicable 3-, 5-, and 10-year Ratings. See disclosure for details.
Investment Objective & StrategyFrom investment’s prospectus
The investment seeks long-term capital growth; income is a secondary objective. In selecting stocks for the fund, the portfolio managers look for companies of all sizes whose stock price may not reflect the company's value. The managers attempt to purchase the stocks of these undervalued companies and hold each stock until the price has increased to, or is higher than, a level the managers believe more accurately reflects the fair value of the company. The fund may invest a portion of its assets in foreign securities when these securities meet the portfolio managers' standards of selection.
Fees and Expenses as of 09-30-17
Prospectus Net Expense Ratio 0.78%Total Annual Operating Expense 0.78%Maximum Sales Charge .12b-1 Fee .Redemption Fee/Term .
Waiver Data Type Exp. Date %
. . . .
Operations and Management
Fund Inception Date 07-31-97Portfolio Manager(s) Phillip N. Davidson, CFA
Michael Liss, CFAName of Issuer American Century InvestmentsTelephone 800-345-2021Web Site www.americancentury.com
Benchmark Description: Russell 1000 Value TR USD
The index measures the performance of the large-cap valuesegment of the US equity securities. It includes the Russell 1000index companies with lower price-to-book ratios and lowerexpected growth values. It is market-capitalization weighted.Russell Investment Group is the source and owner of thetrademarks, service marks and copyrights related to the RussellIndexes. Russell® is a trademark of Russell Investment Group.
Category Description: Large Value
Large-value portfolios invest primarily in big U.S. companiesthat are less expensive or growing more slowly than other large-cap stocks. Stocks in the top 70% of the capitalization of theU.S. equity market are defined as large cap. Value is definedbased on low valuations (low price ratios and high dividendyields) and slow growth (low growth rates for earnings, sales,book value, and cash flow).
Performance
5
10
15
20
0
-5
-10
-15
YTD YTD YTD YTD YTD YTD
Total Return%as of 03-31-18
InvestmentBenchmark
Average annual, if greaterthan 1 year.
YTD 1 Year 3 Year 5 Year 10 Year Since Inception-2.77 3.58 7.08 10.15 8.36 7.83 Fund Return %-2.77 3.58 7.08 10.15 8.36 7.83 Load-Adj. Return %-2.83 6.95 7.88 10.78 7.78 7.34 Benchmark Return %-2.55 9.07 7.65 10.32 7.66 6.10 Category Average %........................................................................................................................................................................................................... . QQQ QQQ QQQQ . Morningstar Rating™. . 1086 958 687 . # of Funds in Category
Quarter End Returns as of 03-31-18 YTD 1 Year 3 Year 5 Year 10 Year Since Inception
Fund Return % -2.77 3.58 7.08 10.15 8.36 7.83Standardized Return % -2.77 3.58 7.08 10.15 8.36 7.83
Performance Disclosure: The performance data quoted represents past performance and does not guarantee futureresults. The investment return and principal value of an investment will fluctuate; thus an investor’s shares, whenredeemed, may be worth more or less than their original cost. Current performance may be lower or higher thanreturn data quoted herein. For performance data current to the most recent month-end please visit the website listedunder Operations and Management on this page.
Portfolio Analysis as of 12-31-17Composition as of 12-31-17 % Assets
U.S. Stocks 91.8Non-U.S. Stocks 5.4Bonds 0.0Cash 2.8Other 0.0
Morningstar Equity Style Box™ as of 12-31-17 % Mkt Cap
LargeM
idSm
all
Value Blend Growth
Giant 49.78........................................................Large 33.26Medium 14.97Small 1.99........................................................Micro 0.00
Top 10 Holdings as of 12-31-17 % Assets
JPMorgan Chase & Co 3.33Procter & Gamble Co 3.05Wells Fargo & Co 2.97Pfizer Inc 2.96General Electric Co 2.83.......................................................................................................AT&T Inc 2.66Bank of America Corporation 2.44Johnson & Johnson 2.31Merck & Co Inc 2.26Chevron Corp 2.09
.......................................................................................................Total Number of Stock Holdings 101Total Number of Bond Holdings 1Annual Turnover Ratio % 46.00Total Fund Assets ($mil) 3,196.91
Morningstar Sectors as of 12-31-17 % Fund S&P 500 %
h Cyclical 30.16 33.57...............................................................................................r Basic Materials 1.06 2.68t Consumer Cyclical 4.30 11.73y Financial Services 24.80 16.91u Real Estate 0.00 2.25
j Sensitive 40.56 41.83...............................................................................................i Communication Services 3.63 3.29o Energy 19.12 5.74p Industrials 7.31 10.64a Technology 10.50 22.16
k Defensive 29.28 24.60...............................................................................................s Consumer Defensive 10.31 7.83d Healthcare 17.93 13.91f Utilities 1.04 2.86
Principal Risks as of 12-31-17Foreign Securities, Loss of Money, Not FDIC Insured, Capitalization, Market/Market Volatility, Shareholder Activity, Management
©2018 Morningstar, Inc., Morningstar Investment Profiles™ 312-696-6000. All rights reserved. The information contained herein: (1) is proprietary to Morningstar and/or its content providers; (2) maynot be copied or distributed and (3) is not warranted to be accurate, complete or timely. Neither Morningstar nor its content providers are responsible for any damages or losses arising from any use ofinformation. Past performance is no guarantee of future performance. Visit our investment website at www.morningstar.com ß
®

Release Date: 03-31-2018
MassMutual Select Mid Cap Growth I MEFZX ..........................................................................................................................................................................................................................................................................................................................................BenchmarkRussell Mid Cap Growth TR USD
Overall Morningstar Rating™ Morningstar Return Morningstar RiskQQQQQ High Below AverageOut of 549 Mid-Cap Growth funds. An investment's overall Morningstar Rating, based on its risk-adjusted return,is a weighted average of its applicable 3-, 5-, and 10-year Ratings. See disclosure for details.
Investment Objective & StrategyFrom investment’s prospectus
The investment seeks growth of capital over the long-term. The fund invests primarily in equity securities of mid-capitalization companies that the fund's subadvisers believe offer the potential for long-term growth. It invests at least 80% of its net assets (plus the amount of any borrowings for investment purposes) in a broadly diversified portfolio of common stocks of mid-cap companies whose earnings the subadvisers expect to grow at a faster rate than the average company.
Fees and Expenses as of 02-01-18
Prospectus Net Expense Ratio 0.72%Total Annual Operating Expense 0.72%Maximum Sales Charge .12b-1 Fee .Redemption Fee/Term .
Waiver Data Type Exp. Date %
. . . .
Operations and Management
Initial Class Inception Date 05-31-00Fund Inception Date 11-15-10Portfolio Manager(s) Brian W.H. Berghuis, CFA
Christopher J. ScarpaName of Issuer MassMutualTelephone 888-309-3539Web Site www.massmutual.com
Benchmark Description: Russell Mid Cap Growth TR USD
The index measures the performance of the mid-cap growthsegment of the US equity universe. It includes Russell midcapindex companies with higher price-to-book ratios and higherforecasted growth values. It is market-capitalization weighted.Russell Investment Group is the source and owner of thetrademarks, service marks and copyrights related to the RussellIndexes. Russell® is a trademark of Russell Investment Group.
Category Description: Mid-Cap Growth
Some mid-cap growth portfolios invest in stocks of all sizes,thus leading to a mid-cap profile, but others focus on midsizecompanies. Mid-cap growth portfolios target U.S. firms that areprojected to grow faster than other mid-cap stocks, thereforecommanding relatively higher prices. The U.S. mid-cap rangefor market capitalization typically falls between $1 billion and$8 billion and represents 20% of the total capitalization of theU.S. equity market. Growth is defined based on fast growth(high growth rates for earnings, sales, book value, and cashflow) and high valuations (high price ratios and low dividendyields).
Performance
10
20
30
40
0
-10
-20
-30
YTD YTD YTD YTD YTD YTD
Total Return%as of 03-31-18
InvestmentBenchmark
Average annual, if greaterthan 1 year.
YTD 1 Year 3 Year 5 Year 10 Year Since Inception3.54 19.39 10.78 14.86 11.96 14.48 Fund Return %3.54 19.39 10.78 14.86 11.96 14.48 Load-Adj. Return %2.17 19.74 9.17 13.31 10.61 13.55 Benchmark Return %2.15 18.34 8.28 11.94 9.39 11.65 Category Average %........................................................................................................................................................................................................... . QQQQ QQQQQ QQQQQ . Morningstar Rating™. . 549 485 352 . # of Funds in Category
Quarter End Returns as of 03-31-18 YTD 1 Year 3 Year 5 Year 10 Year Since Inception
Fund Return % 3.54 19.39 10.78 14.86 11.96 14.48Standardized Return % 3.54 19.39 10.78 14.86 11.96 14.48
Performance Disclosure: The performance data quoted represents past performance and does not guarantee futureresults. The investment return and principal value of an investment will fluctuate; thus an investor’s shares, whenredeemed, may be worth more or less than their original cost. Current performance may be lower or higher thanreturn data quoted herein. For performance data current to the most recent month-end please visit the website listedunder Operations and Management on this page.
Portfolio Analysis as of 12-31-17Composition as of 12-31-17 % Assets
U.S. Stocks 92.9Non-U.S. Stocks 2.0Bonds 0.0Cash 2.6Other 2.6
Morningstar Equity Style Box™ as of 12-31-17 % Mkt Cap
LargeM
idSm
all
Value Blend Growth
Giant 0.00........................................................Large 19.43Medium 74.17Small 6.33........................................................Micro 0.08
Top 10 Holdings as of 12-31-17 % Assets
Reserve Invt Fds 09-19-34 2.01Teleflex Inc 1.98Dollar General Corp 1.81Textron Inc 1.79Willis Towers Watson PLC 1.46.......................................................................................................The Cooper Companies Inc 1.42Microchip Technology Inc 1.41Fiserv Inc 1.40Roper Technologies Inc 1.39Hologic Inc 1.37
.......................................................................................................Total Number of Stock Holdings 191Total Number of Bond Holdings 0Annual Turnover Ratio % 36.00Total Fund Assets ($mil) 6,444.01
Morningstar Sectors as of 12-31-17 % Fund S&P 500 %
h Cyclical 29.75 33.57...............................................................................................r Basic Materials 4.38 2.68t Consumer Cyclical 14.88 11.73y Financial Services 9.86 16.91u Real Estate 0.63 2.25
j Sensitive 47.15 41.83...............................................................................................i Communication Services 0.39 3.29o Energy 2.05 5.74p Industrials 21.58 10.64a Technology 23.13 22.16
k Defensive 23.09 24.60...............................................................................................s Consumer Defensive 4.82 7.83d Healthcare 18.27 13.91f Utilities 0.00 2.86
Principal Risks as of 12-31-17Currency, Emerging Markets, Foreign Securities, Loss of Money, Not FDIC Insured, Growth Investing, Market/Market Volatility,Convertible Securities, Equity Securities, Preferred Stocks, Restricted/Illiquid Securities, Pricing, Cash Drag, Management, SmallCap, Mid-Cap
©2018 Morningstar, Inc., Morningstar Investment Profiles™ 312-696-6000. All rights reserved. The information contained herein: (1) is proprietary to Morningstar and/or its content providers; (2) maynot be copied or distributed and (3) is not warranted to be accurate, complete or timely. Neither Morningstar nor its content providers are responsible for any damages or losses arising from any use ofinformation. Past performance is no guarantee of future performance. Visit our investment website at www.morningstar.com ß
®

Release Date: 03-31-2018
American Funds 2015 Trgt Date Retire R6 RFJTX ..........................................................................................................................................................................................................................................................................................................................................BenchmarkMorningstar Lifetime Mod 2015 TR USD
Overall Morningstar Rating™ Morningstar Return Morningstar RiskQQQQQ High AverageOut of 105 Target-Date 2015 funds. An investment's overall Morningstar Rating, based on its risk-adjusted return,is a weighted average of its applicable 3-, 5-, and 10-year Ratings. See disclosure for details.
Investment Objective & StrategyFrom investment’s prospectus
The investment seeks growth, income and conservation of capital. The fund normally invests a greater portion of its assets in bond, equity income and balanced funds as it approaches and passes its target date. The advisor attempts to achieve its investment objectives by investing in a mix of American Funds in different combinations and weightings. The underlying American Funds represent a variety of fund categories such as growth funds, growth-and-income funds, equity-income funds and a balanced fund and bond funds. The fund categories represent differing investment objectives.
Fees and Expenses as of 01-01-18
Prospectus Net Expense Ratio 0.33%Total Annual Operating Expense 0.33%Maximum Sales Charge .12b-1 Fee .Redemption Fee/Term .
Waiver Data Type Exp. Date %
. . . .
Operations and Management
Initial Class Inception Date 02-01-07Fund Inception Date 07-13-09Portfolio Manager(s) James B. Lovelace, CFA
John H. SmetName of Issuer American FundsTelephone 800-421-4225Web Site www.americanfunds.com
Benchmark Description: Morningstar Lifetime Mod 2015 TR USD
The index measures the performance of a portfolio of globalequities, bonds and traditional inflation hedges such ascommodities and TIPS. This portfolio is held in proportionsappropriate for a US investor who is about five years away fromretirement. The Moderate risk profile is for investors who arecomfortable with average exposure to equity market volatility.
Category Description: Target-Date 2015
Target-date portfolios provide diversified exposure to stocks,bonds, and cash for those investors who have a specific datein mind (in this case, the years 2011-2015) for retirement. Theseportfolios aim to provide investors with an optimal level of returnand risk, based solely on the target date. Management adjuststhe allocation among asset classes to more-conservative mixesas the target date approaches, following a preset glide path. Atarget-date portfolio is part of a series of funds offering multipleretirement dates to investors.
Allocation of Assets
050 40 30 20 10 -10 -20 -30
10080
60
40
200
Years Until Retirement
% AllocationBondsStocksCashOther
PerformanceTrailing Returns YTD 1 Year 3 Year 5 Year 10 Year Since Inception
Investment Return % -0.95 6.47 5.18 6.74 5.61 9.30Benchmark Return % -0.74 7.31 4.71 5.42 5.58 8.60Category Average % -0.74 6.87 4.43 5.55 5.06 7.81........................................................................................................................................................................................................................Morningstar Rating™ . . QQQQ QQQQQ QQQQ .# of Funds in Category . . 105 74 49 .
Quarter End Returns as of 03-31-18 YTD 1 Year 3 Year 5 Year 10 Year Since Inception
Fund Return % -0.95 6.47 5.18 6.74 5.61 9.30Standardized Return % -0.95 6.47 5.18 6.74 5.61 9.30
Performance Disclosure: The performance data quoted represents past performance and does not guarantee futureresults. The investment return and principal value of an investment will fluctuate; thus an investor’s shares, whenredeemed, may be worth more or less than their original cost. Current performance may be lower or higher thanreturn data quoted herein. For performance data current to the most recent month-end please visit the website listedunder Operations and Management on this page.
Portfolio Analysis as of 12-31-17Composition as of 12-31-17 % Assets
U.S. Stocks 29.9Non-U.S. Stocks 14.0Bonds 48.0Cash 7.7Other 0.5
Morningstar Style Box™ as of 12-31-17(EQ) ; 12-31-17(F-I)
LargeM
idSm
all
Value Blend Growth
HighM
edLow
Ltd Mod Ext
Top 10 Holdings as of 12-31-17 % Assets
American Funds Capital Income Bldr R6 10.80American Funds Income Fund of Amer R6 10.80American Funds Interm Bd Fd of Amer R6 9.00American Funds Bond Fund of Amer R6 8.00American Funds Inflation Linked Bd R6 7.00.......................................................................................................American Funds American Mutual R6 6.00American Funds Mortgage R6 6.00American Funds American High-Inc R6 5.00American Funds Capital World Bond R6 5.00American Funds Invmt Co of Amer R6 5.00
.......................................................................................................Total Number of Holdings 20Annual Turnover Ratio % 4.00Total Fund Assets ($mil) 4,701.53
Morningstar Sectors as of 12-31-17 % Fund S&P 500 %
h Cyclical 32.25 33.57...............................................................................................r Basic Materials 4.39 2.68t Consumer Cyclical 9.53 11.73y Financial Services 15.47 16.91u Real Estate 2.86 2.25
j Sensitive 40.38 41.83...............................................................................................i Communication Services 5.52 3.29o Energy 9.54 5.74p Industrials 10.61 10.64a Technology 14.71 22.16
k Defensive 27.36 24.60...............................................................................................s Consumer Defensive 10.88 7.83d Healthcare 11.99 13.91f Utilities 4.49 2.86
Principal Risks as of 12-31-17Emerging Markets, Foreign Securities, Long-Term Outlook and Projections, Loss of Money, Not FDIC Insured, Active Management,Issuer, Market/Market Volatility, Equity Securities, Futures, High-Yield Securities, Mortgage-Backed and Asset-Backed Securities,Restricted/Illiquid Securities, Underlying Fund/Fund of Funds, U.S. Government Obligations, Derivatives, Fixed-Income Securities,Management, Small Cap
©2018 Morningstar, Inc., Morningstar Investment Profiles™ 312-696-6000. All rights reserved. The information contained herein: (1) is proprietary to Morningstar and/or its content providers; (2) maynot be copied or distributed and (3) is not warranted to be accurate, complete or timely. Neither Morningstar nor its content providers are responsible for any damages or losses arising from any use ofinformation. Past performance is no guarantee of future performance. Visit our investment website at www.morningstar.com ß
®

Release Date: 03-31-2018
American Funds 2020 Trgt Date Retire R6 RRCTX ..........................................................................................................................................................................................................................................................................................................................................BenchmarkMorningstar Lifetime Mod 2020 TR USD
Overall Morningstar Rating™ Morningstar Return Morningstar RiskQQQQQ High AverageOut of 200 Target-Date 2020 funds. An investment's overall Morningstar Rating, based on its risk-adjusted return,is a weighted average of its applicable 3-, 5-, and 10-year Ratings. See disclosure for details.
Investment Objective & StrategyFrom investment’s prospectus
The investment seeks growth, income and conservation of capital. The fund normally invests a greater portion of its assets in bond, equity income and balanced funds as it approaches and passes its target date. The advisor attempts to achieve its investment objectives by investing in a mix of American Funds in different combinations and weightings. The underlying American Funds represent a variety of fund categories such as growth funds, growth-and-income funds, equity-income funds and a balanced fund and bond funds. The fund categories represent differing investment objectives.
Fees and Expenses as of 01-01-18
Prospectus Net Expense Ratio 0.35%Total Annual Operating Expense 0.35%Maximum Sales Charge .12b-1 Fee .Redemption Fee/Term .
Waiver Data Type Exp. Date %
. . . .
Operations and Management
Initial Class Inception Date 02-01-07Fund Inception Date 07-13-09Portfolio Manager(s) James B. Lovelace, CFA
John H. SmetName of Issuer American FundsTelephone 800-421-4225Web Site www.americanfunds.com
Benchmark Description: Morningstar Lifetime Mod 2020 TR USD
The index measures the performance of a portfolio of globalequities, bonds and traditional inflation hedges such ascommodities and TIPS. This portfolio is held in proportionsappropriate for a US investor who is about ten years away fromretirement. The Moderate risk profile is for investors who arecomfortable with average exposure to equity market volatility.
Category Description: Target-Date 2020
Target-date portfolios provide diversified exposure to stocks,bonds, and cash for those investors who have a specific datein mind (in this case, the years 2016-2020) for retirement. Theseportfolios aim to provide investors with an optimal level of returnand risk, based solely on the target date. Management adjuststhe allocation among asset classes to more-conservative mixesas the target date approaches, following a preset glide path. Atarget-date portfolio is part of a series of funds offering multipleretirement dates to investors.
Allocation of Assets
050 40 30 20 10 -10 -20 -30
10080
60
40
200
Years Until Retirement
% AllocationBondsStocksCashOther
PerformanceTrailing Returns YTD 1 Year 3 Year 5 Year 10 Year Since Inception
Investment Return % -0.63 7.83 5.80 7.60 6.02 10.18Benchmark Return % -0.83 8.19 5.20 6.12 5.87 9.48Category Average % -0.81 7.60 4.65 5.74 5.16 8.36........................................................................................................................................................................................................................Morningstar Rating™ . . QQQQQ QQQQQ QQQQ .# of Funds in Category . . 200 159 99 .
Quarter End Returns as of 03-31-18 YTD 1 Year 3 Year 5 Year 10 Year Since Inception
Fund Return % -0.63 7.83 5.80 7.60 6.02 10.18Standardized Return % -0.63 7.83 5.80 7.60 6.02 10.18
Performance Disclosure: The performance data quoted represents past performance and does not guarantee futureresults. The investment return and principal value of an investment will fluctuate; thus an investor’s shares, whenredeemed, may be worth more or less than their original cost. Current performance may be lower or higher thanreturn data quoted herein. For performance data current to the most recent month-end please visit the website listedunder Operations and Management on this page.
Portfolio Analysis as of 12-31-17Composition as of 12-31-17 % Assets
U.S. Stocks 32.5Non-U.S. Stocks 15.9Bonds 43.4Cash 7.9Other 0.4
Morningstar Style Box™ as of 12-31-17(EQ) ; 12-31-17(F-I)
LargeM
idSm
all
Value Blend Growth
HighM
edLow
Ltd Mod Ext
Top 10 Holdings as of 12-31-17 % Assets
American Funds Interm Bd Fd of Amer R6 8.99American Funds Capital Income Bldr R6 6.99American Funds Income Fund of Amer R6 6.99American Funds Bond Fund of Amer R6 6.79American Funds Inflation Linked Bd R6 6.19.......................................................................................................American Funds American Mutual R6 5.99American Funds Mortgage R6 5.59American Funds Invmt Co of Amer R6 5.39American Funds US Government Sec R6 5.39American Funds Washington Mutual R6 5.39
.......................................................................................................Total Number of Holdings 21Annual Turnover Ratio % 1.00Total Fund Assets ($mil) 12,870.49
Morningstar Sectors as of 12-31-17 % Fund S&P 500 %
h Cyclical 32.73 33.57...............................................................................................r Basic Materials 4.42 2.68t Consumer Cyclical 10.84 11.73y Financial Services 15.36 16.91u Real Estate 2.11 2.25
j Sensitive 41.33 41.83...............................................................................................i Communication Services 4.98 3.29o Energy 9.11 5.74p Industrials 10.35 10.64a Technology 16.89 22.16
k Defensive 25.94 24.60...............................................................................................s Consumer Defensive 10.01 7.83d Healthcare 12.32 13.91f Utilities 3.61 2.86
Principal Risks as of 12-31-17Emerging Markets, Foreign Securities, Long-Term Outlook and Projections, Loss of Money, Not FDIC Insured, Active Management,Issuer, Market/Market Volatility, Equity Securities, Futures, High-Yield Securities, Mortgage-Backed and Asset-Backed Securities,Restricted/Illiquid Securities, Underlying Fund/Fund of Funds, U.S. Government Obligations, Derivatives, Fixed-Income Securities,Management, Small Cap
©2018 Morningstar, Inc., Morningstar Investment Profiles™ 312-696-6000. All rights reserved. The information contained herein: (1) is proprietary to Morningstar and/or its content providers; (2) maynot be copied or distributed and (3) is not warranted to be accurate, complete or timely. Neither Morningstar nor its content providers are responsible for any damages or losses arising from any use ofinformation. Past performance is no guarantee of future performance. Visit our investment website at www.morningstar.com ß
®

Release Date: 03-31-2018
American Funds 2025 Trgt Date Retire R6 RFDTX ..........................................................................................................................................................................................................................................................................................................................................BenchmarkMorningstar Lifetime Mod 2025 TR USD
Overall Morningstar Rating™ Morningstar Return Morningstar RiskQQQQQ High AverageOut of 173 Target-Date 2025 funds. An investment's overall Morningstar Rating, based on its risk-adjusted return,is a weighted average of its applicable 3-, 5-, and 10-year Ratings. See disclosure for details.
Investment Objective & StrategyFrom investment’s prospectus
The investment seeks growth, income and conservation of capital. The fund normally invests a greater portion of its assets in bond, equity income and balanced funds as it approaches and passes its target date. The advisor attempts to achieve its investment objectives by investing in a mix of American Funds in different combinations and weightings. The underlying American Funds represent a variety of fund categories such as growth funds, growth-and-income funds, equity-income funds and a balanced fund and bond funds. The fund categories represent differing investment objectives.
Fees and Expenses as of 01-01-18
Prospectus Net Expense Ratio 0.37%Total Annual Operating Expense 0.37%Maximum Sales Charge .12b-1 Fee .Redemption Fee/Term .
Waiver Data Type Exp. Date %
. . . .
Operations and Management
Initial Class Inception Date 02-01-07Fund Inception Date 07-13-09Portfolio Manager(s) James B. Lovelace, CFA
John H. SmetName of Issuer American FundsTelephone 800-421-4225Web Site www.americanfunds.com
Benchmark Description: Morningstar Lifetime Mod 2025 TR USD
The index measures the performance of a portfolio of globalequities, bonds and traditional inflation hedges such ascommodities and TIPS. This portfolio is held in proportionsappropriate for a US investor who is about 15 years away fromretirement. The Moderate risk profile is for investors who arecomfortable with average exposure to equity market volatility.
Category Description: Target-Date 2025
Target-date portfolios provide diversified exposure to stocks,bonds, and cash for those investors who have a specific datein mind (in this case, the years 2021-2025) for retirement. Theseportfolios aim to provide investors with an optimal level of returnand risk, based solely on the target date. Management adjuststhe allocation among asset classes to more-conservative mixesas the target date approaches, following a preset glide path. Atarget-date portfolio is part of a series of funds offering multipleretirement dates to investors.
Allocation of Assets
050 40 30 20 10 -10 -20 -30
10080
60
40
200
Years Until Retirement
% AllocationBondsStocksCashOther
PerformanceTrailing Returns YTD 1 Year 3 Year 5 Year 10 Year Since Inception
Investment Return % -0.30 9.86 6.75 8.83 6.82 11.41Benchmark Return % -0.87 9.31 5.84 7.00 6.22 10.46Category Average % -0.75 9.10 5.42 6.69 5.74 9.58........................................................................................................................................................................................................................Morningstar Rating™ . . QQQQQ QQQQQ QQQQQ .# of Funds in Category . . 173 136 72 .
Quarter End Returns as of 03-31-18 YTD 1 Year 3 Year 5 Year 10 Year Since Inception
Fund Return % -0.30 9.86 6.75 8.83 6.82 11.41Standardized Return % -0.30 9.86 6.75 8.83 6.82 11.41
Performance Disclosure: The performance data quoted represents past performance and does not guarantee futureresults. The investment return and principal value of an investment will fluctuate; thus an investor’s shares, whenredeemed, may be worth more or less than their original cost. Current performance may be lower or higher thanreturn data quoted herein. For performance data current to the most recent month-end please visit the website listedunder Operations and Management on this page.
Portfolio Analysis as of 12-31-17Composition as of 12-31-17 % Assets
U.S. Stocks 37.4Non-U.S. Stocks 20.4Bonds 33.9Cash 8.0Other 0.4
Morningstar Style Box™ as of 12-31-17(EQ) ; 12-31-17(F-I)
LargeM
idSm
all
Value Blend Growth
HighM
edLow
Ltd Mod Ext
Top 10 Holdings as of 12-31-17 % Assets
American Funds Interm Bd Fd of Amer R6 7.00American Funds Washington Mutual R6 6.80American Funds Invmt Co of Amer R6 6.40American Funds US Government Sec R6 6.40American Funds American Balanced R6 6.00.......................................................................................................American Funds American Mutual R6 6.00American Funds Global Balanced R6 6.00American Funds Fundamental Invs R6 5.40American Funds Capital World Bond R6 5.00American Funds Capital World Gr&Inc R6 5.00
.......................................................................................................Total Number of Holdings 22Annual Turnover Ratio % 0.00Total Fund Assets ($mil) 15,620.96
Morningstar Sectors as of 12-31-17 % Fund S&P 500 %
h Cyclical 33.44 33.57...............................................................................................r Basic Materials 4.61 2.68t Consumer Cyclical 11.81 11.73y Financial Services 15.41 16.91u Real Estate 1.61 2.25
j Sensitive 41.70 41.83...............................................................................................i Communication Services 4.57 3.29o Energy 8.74 5.74p Industrials 10.18 10.64a Technology 18.21 22.16
k Defensive 24.87 24.60...............................................................................................s Consumer Defensive 9.45 7.83d Healthcare 12.40 13.91f Utilities 3.02 2.86
Principal Risks as of 12-31-17Emerging Markets, Foreign Securities, Long-Term Outlook and Projections, Loss of Money, Not FDIC Insured, Active Management,Issuer, Market/Market Volatility, Equity Securities, Futures, High-Yield Securities, Mortgage-Backed and Asset-Backed Securities,Restricted/Illiquid Securities, Underlying Fund/Fund of Funds, U.S. Government Obligations, Derivatives, Fixed-Income Securities,Management, Small Cap
©2018 Morningstar, Inc., Morningstar Investment Profiles™ 312-696-6000. All rights reserved. The information contained herein: (1) is proprietary to Morningstar and/or its content providers; (2) maynot be copied or distributed and (3) is not warranted to be accurate, complete or timely. Neither Morningstar nor its content providers are responsible for any damages or losses arising from any use ofinformation. Past performance is no guarantee of future performance. Visit our investment website at www.morningstar.com ß
®

Release Date: 03-31-2018
American Funds 2030 Trgt Date Retire R6 RFETX ..........................................................................................................................................................................................................................................................................................................................................BenchmarkMorningstar Lifetime Mod 2030 TR USD
Overall Morningstar Rating™ Morningstar Return Morningstar RiskQQQQQ High Above AverageOut of 190 Target-Date 2030 funds. An investment's overall Morningstar Rating, based on its risk-adjusted return,is a weighted average of its applicable 3-, 5-, and 10-year Ratings. See disclosure for details.
Investment Objective & StrategyFrom investment’s prospectus
The investment seeks growth, income and conservation of capital. The fund normally invests a greater portion of its assets in bond, equity income and balanced funds as it approaches and passes its target date. The advisor attempts to achieve its investment objectives by investing in a mix of American Funds in different combinations and weightings. The underlying American Funds represent a variety of fund categories such as growth funds, growth-and-income funds, equity-income funds and a balanced fund and bond funds. The fund categories represent differing investment objectives.
Fees and Expenses as of 01-01-18
Prospectus Net Expense Ratio 0.39%Total Annual Operating Expense 0.39%Maximum Sales Charge .12b-1 Fee .Redemption Fee/Term .
Waiver Data Type Exp. Date %
. . . .
Operations and Management
Initial Class Inception Date 02-01-07Fund Inception Date 07-13-09Portfolio Manager(s) James B. Lovelace, CFA
John H. SmetName of Issuer American FundsTelephone 800-421-4225Web Site www.americanfunds.com
Benchmark Description: Morningstar Lifetime Mod 2030 TR USD
The index measures the performance of a portfolio of globalequities, bonds and traditional inflation hedges such ascommodities and TIPS. This portfolio is held in proportionsappropriate for a US investor who is about 20 years away fromretirement. The Moderate risk profile is for investors who arecomfortable with average exposure to equity market volatility.
Category Description: Target-Date 2030
Target-date portfolios provide diversified exposure to stocks,bonds, and cash for those investors who have a specific datein mind (in this case, the years 2026-2030) for retirement. Theseportfolios aim to provide investors with an optimal level of returnand risk, based solely on the target date. Management adjuststhe allocation among asset classes to more-conservative mixesas the target date approaches, following a preset glide path. Atarget-date portfolio is part of a series of funds offering multipleretirement dates to investors.
Allocation of Assets
050 40 30 20 10 -10 -20 -30
10080
60
40
200
Years Until Retirement
% AllocationBondsStocksCashOther
PerformanceTrailing Returns YTD 1 Year 3 Year 5 Year 10 Year Since Inception
Investment Return % 0.00 12.14 7.86 9.94 7.49 12.29Benchmark Return % -0.86 10.66 6.61 7.92 6.60 11.36Category Average % -0.75 10.37 6.07 7.36 5.86 10.04........................................................................................................................................................................................................................Morningstar Rating™ . . QQQQQ QQQQQ QQQQQ .# of Funds in Category . . 190 149 89 .
Quarter End Returns as of 03-31-18 YTD 1 Year 3 Year 5 Year 10 Year Since Inception
Fund Return % 0.00 12.14 7.86 9.94 7.49 12.29Standardized Return % 0.00 12.14 7.86 9.94 7.49 12.29
Performance Disclosure: The performance data quoted represents past performance and does not guarantee futureresults. The investment return and principal value of an investment will fluctuate; thus an investor’s shares, whenredeemed, may be worth more or less than their original cost. Current performance may be lower or higher thanreturn data quoted herein. For performance data current to the most recent month-end please visit the website listedunder Operations and Management on this page.
Portfolio Analysis as of 12-31-17Composition as of 12-31-17 % Assets
U.S. Stocks 43.5Non-U.S. Stocks 25.3Bonds 23.3Cash 7.6Other 0.3
Morningstar Style Box™ as of 12-31-17(EQ) ; 12-31-17(F-I)
LargeM
idSm
all
Value Blend Growth
HighM
edLow
Ltd Mod Ext
Top 10 Holdings as of 12-31-17 % Assets
American Funds Washington Mutual R6 8.00American Funds US Government Sec R6 7.40American Funds Invmt Co of Amer R6 7.00American Funds American Balanced R6 6.00American Funds American Mutual R6 6.00.......................................................................................................American Funds Fundamental Invs R6 6.00American Funds Global Balanced R6 6.00American Funds New Perspective R6 5.76American Funds Capital World Gr&Inc R6 5.00American Funds AMCAP R6 4.76
.......................................................................................................Total Number of Holdings 22Annual Turnover Ratio % 0.00Total Fund Assets ($mil) 16,616.96
Morningstar Sectors as of 12-31-17 % Fund S&P 500 %
h Cyclical 33.99 33.57...............................................................................................r Basic Materials 4.71 2.68t Consumer Cyclical 12.48 11.73y Financial Services 15.28 16.91u Real Estate 1.52 2.25
j Sensitive 41.46 41.83...............................................................................................i Communication Services 4.25 3.29o Energy 8.30 5.74p Industrials 10.15 10.64a Technology 18.76 22.16
k Defensive 24.54 24.60...............................................................................................s Consumer Defensive 9.14 7.83d Healthcare 12.61 13.91f Utilities 2.79 2.86
Principal Risks as of 12-31-17Emerging Markets, Foreign Securities, Long-Term Outlook and Projections, Loss of Money, Not FDIC Insured, Active Management,Issuer, Market/Market Volatility, Equity Securities, Futures, High-Yield Securities, Mortgage-Backed and Asset-Backed Securities,Restricted/Illiquid Securities, Underlying Fund/Fund of Funds, U.S. Government Obligations, Derivatives, Fixed-Income Securities,Management, Small Cap
©2018 Morningstar, Inc., Morningstar Investment Profiles™ 312-696-6000. All rights reserved. The information contained herein: (1) is proprietary to Morningstar and/or its content providers; (2) maynot be copied or distributed and (3) is not warranted to be accurate, complete or timely. Neither Morningstar nor its content providers are responsible for any damages or losses arising from any use ofinformation. Past performance is no guarantee of future performance. Visit our investment website at www.morningstar.com ß
®

Release Date: 03-31-2018
American Funds 2035 Trgt Date Retire R6 RFFTX ..........................................................................................................................................................................................................................................................................................................................................BenchmarkMorningstar Lifetime Mod 2035 TR USD
Overall Morningstar Rating™ Morningstar Return Morningstar RiskQQQQQ High AverageOut of 168 Target-Date 2035 funds. An investment's overall Morningstar Rating, based on its risk-adjusted return,is a weighted average of its applicable 3-, 5-, and 10-year Ratings. See disclosure for details.
Investment Objective & StrategyFrom investment’s prospectus
The investment seeks growth, income and conservation of capital. The fund normally invests a greater portion of its assets in bond, equity income and balanced funds as it approaches and passes its target date. The advisor attempts to achieve its investment objectives by investing in a mix of American Funds in different combinations and weightings. The underlying American Funds represent a variety of fund categories such as growth funds, growth-and-income funds, equity-income funds and a balanced fund and bond funds. The fund categories represent differing investment objectives.
Fees and Expenses as of 01-01-18
Prospectus Net Expense Ratio 0.40%Total Annual Operating Expense 0.40%Maximum Sales Charge .12b-1 Fee .Redemption Fee/Term .
Waiver Data Type Exp. Date %
. . . .
Operations and Management
Initial Class Inception Date 02-01-07Fund Inception Date 07-13-09Portfolio Manager(s) James B. Lovelace, CFA
John H. SmetName of Issuer American FundsTelephone 800-421-4225Web Site www.americanfunds.com
Benchmark Description: Morningstar Lifetime Mod 2035 TR USD
The index measures the performance of a portfolio of globalequities, bonds and traditional inflation hedges such ascommodities and TIPS. This portfolio is held in proportionsappropriate for a US investor who is about 25 years away fromretirement. The Moderate risk profile is for investors who arecomfortable with average exposure to equity market volatility.
Category Description: Target-Date 2035
Target-date portfolios provide diversified exposure to stocks,bonds, and cash for those investors who have a specific datein mind (in this case, the years 2031-2035) for retirement. Theseportfolios aim to provide investors with an optimal level of returnand risk, based solely on the target date. Management adjuststhe allocation among asset classes to more-conservative mixesas the target date approaches, following a preset glide path. Atarget-date portfolio is part of a series of funds offering multipleretirement dates to investors.
Allocation of Assets
050 40 30 20 10 -10 -20 -30
10080
60
40
200
Years Until Retirement
% AllocationBondsStocksCashOther
PerformanceTrailing Returns YTD 1 Year 3 Year 5 Year 10 Year Since Inception
Investment Return % 0.34 14.29 8.86 10.63 7.80 12.70Benchmark Return % -0.82 11.95 7.31 8.65 6.92 11.98Category Average % -0.61 11.73 6.73 8.16 6.35 10.95........................................................................................................................................................................................................................Morningstar Rating™ . . QQQQQ QQQQQ QQQQQ .# of Funds in Category . . 168 131 67 .
Quarter End Returns as of 03-31-18 YTD 1 Year 3 Year 5 Year 10 Year Since Inception
Fund Return % 0.34 14.29 8.86 10.63 7.80 12.70Standardized Return % 0.34 14.29 8.86 10.63 7.80 12.70
Performance Disclosure: The performance data quoted represents past performance and does not guarantee futureresults. The investment return and principal value of an investment will fluctuate; thus an investor’s shares, whenredeemed, may be worth more or less than their original cost. Current performance may be lower or higher thanreturn data quoted herein. For performance data current to the most recent month-end please visit the website listedunder Operations and Management on this page.
Portfolio Analysis as of 12-31-17Composition as of 12-31-17 % Assets
U.S. Stocks 48.7Non-U.S. Stocks 30.0Bonds 13.9Cash 7.1Other 0.3
Morningstar Style Box™ as of 12-31-17(EQ) ; 12-31-17(F-I)
LargeM
idSm
all
Value Blend Growth
HighM
edLow
Ltd Mod Ext
Top 10 Holdings as of 12-31-17 % Assets
American Funds Washington Mutual R6 8.00American Funds Invmt Co of Amer R6 7.00American Funds New Perspective R6 7.00American Funds US Government Sec R6 6.80American Funds AMCAP R6 6.40.......................................................................................................American Funds Growth Fund of Amer R6 6.40American Funds SMALLCAP World R6 6.40American Funds American Balanced R6 6.00American Funds American Mutual R6 6.00American Funds Fundamental Invs R6 6.00
.......................................................................................................Total Number of Holdings 19Annual Turnover Ratio % 0.00Total Fund Assets ($mil) 13,002.08
Morningstar Sectors as of 12-31-17 % Fund S&P 500 %
h Cyclical 34.40 33.57...............................................................................................r Basic Materials 4.71 2.68t Consumer Cyclical 13.16 11.73y Financial Services 15.11 16.91u Real Estate 1.42 2.25
j Sensitive 41.35 41.83...............................................................................................i Communication Services 3.93 3.29o Energy 7.87 5.74p Industrials 10.06 10.64a Technology 19.49 22.16
k Defensive 24.24 24.60...............................................................................................s Consumer Defensive 8.80 7.83d Healthcare 12.86 13.91f Utilities 2.58 2.86
Principal Risks as of 12-31-17Emerging Markets, Foreign Securities, Long-Term Outlook and Projections, Loss of Money, Not FDIC Insured, Active Management,Issuer, Market/Market Volatility, Equity Securities, Futures, High-Yield Securities, Mortgage-Backed and Asset-Backed Securities,Restricted/Illiquid Securities, Underlying Fund/Fund of Funds, U.S. Government Obligations, Derivatives, Fixed-Income Securities,Management, Small Cap
©2018 Morningstar, Inc., Morningstar Investment Profiles™ 312-696-6000. All rights reserved. The information contained herein: (1) is proprietary to Morningstar and/or its content providers; (2) maynot be copied or distributed and (3) is not warranted to be accurate, complete or timely. Neither Morningstar nor its content providers are responsible for any damages or losses arising from any use ofinformation. Past performance is no guarantee of future performance. Visit our investment website at www.morningstar.com ß
®

Release Date: 03-31-2018
American Funds 2040 Trgt Date Retire R6 RFGTX ..........................................................................................................................................................................................................................................................................................................................................BenchmarkMorningstar Lifetime Mod 2040 TR USD
Overall Morningstar Rating™ Morningstar Return Morningstar RiskQQQQQ High AverageOut of 190 Target-Date 2040 funds. An investment's overall Morningstar Rating, based on its risk-adjusted return,is a weighted average of its applicable 3-, 5-, and 10-year Ratings. See disclosure for details.
Investment Objective & StrategyFrom investment’s prospectus
The investment seeks growth, income and conservation of capital. The fund normally invests a greater portion of its assets in bond, equity income and balanced funds as it approaches and passes its target date. The advisor attempts to achieve its investment objectives by investing in a mix of American Funds in different combinations and weightings. The underlying American Funds represent a variety of fund categories such as growth funds, growth-and-income funds, equity-income funds and a balanced fund and bond funds. The fund categories represent differing investment objectives.
Fees and Expenses as of 01-01-18
Prospectus Net Expense Ratio 0.41%Total Annual Operating Expense 0.41%Maximum Sales Charge .12b-1 Fee .Redemption Fee/Term .
Waiver Data Type Exp. Date %
. . . .
Operations and Management
Initial Class Inception Date 02-01-07Fund Inception Date 07-27-09Portfolio Manager(s) James B. Lovelace, CFA
John H. SmetName of Issuer American FundsTelephone 800-421-4225Web Site www.americanfunds.com
Benchmark Description: Morningstar Lifetime Mod 2040 TR USD
The index measures the performance of a portfolio of globalequities, bonds and traditional inflation hedges such ascommodities and TIPS. This portfolio is held in proportionsappropriate for a US investor who is about 30 years away fromretirement. The Moderate risk profile is for investors who arecomfortable with average exposure to equity market volatility.
Category Description: Target-Date 2040
Target-date portfolios provide diversified exposure to stocks,bonds, and cash for those investors who have a specific datein mind (in this case, the years 2036-2040) for retirement. Theseportfolios aim to provide investors with an optimal level of returnand risk, based solely on the target date. Management adjuststhe allocation among asset classes to more-conservative mixesas the target date approaches, following a preset glide path. Atarget-date portfolio is part of a series of funds offering multipleretirement dates to investors.
Allocation of Assets
050 40 30 20 10 -10 -20 -30
10080
60
40
200
Years Until Retirement
% AllocationBondsStocksCashOther
PerformanceTrailing Returns YTD 1 Year 3 Year 5 Year 10 Year Since Inception
Investment Return % 0.39 15.02 9.20 10.93 7.95 11.93Benchmark Return % -0.79 12.86 7.78 9.03 7.09 11.11Category Average % -0.66 12.42 7.04 8.48 6.33 10.02........................................................................................................................................................................................................................Morningstar Rating™ . . QQQQQ QQQQQ QQQQQ .# of Funds in Category . . 190 149 89 .
Quarter End Returns as of 03-31-18 YTD 1 Year 3 Year 5 Year 10 Year Since Inception
Fund Return % 0.39 15.02 9.20 10.93 7.95 11.93Standardized Return % 0.39 15.02 9.20 10.93 7.95 11.93
Performance Disclosure: The performance data quoted represents past performance and does not guarantee futureresults. The investment return and principal value of an investment will fluctuate; thus an investor’s shares, whenredeemed, may be worth more or less than their original cost. Current performance may be lower or higher thanreturn data quoted herein. For performance data current to the most recent month-end please visit the website listedunder Operations and Management on this page.
Portfolio Analysis as of 12-31-17Composition as of 12-31-17 % Assets
U.S. Stocks 50.6Non-U.S. Stocks 31.3Bonds 10.8Cash 7.0Other 0.3
Morningstar Style Box™ as of 12-31-17(EQ) ; 12-31-17(F-I)
LargeM
idSm
all
Value Blend Growth
HighM
edLow
Ltd Mod Ext
Top 10 Holdings as of 12-31-17 % Assets
American Funds Washington Mutual R6 8.00American Funds Invmt Co of Amer R6 7.40American Funds AMCAP R6 7.00American Funds Growth Fund of Amer R6 7.00American Funds New Perspective R6 7.00.......................................................................................................American Funds SMALLCAP World R6 7.00American Funds American Mutual R6 6.40American Funds Fundamental Invs R6 6.40American Funds American Balanced R6 6.00American Funds Global Balanced R6 5.60
.......................................................................................................Total Number of Holdings 18Annual Turnover Ratio % 0.00Total Fund Assets ($mil) 11,322.34
Morningstar Sectors as of 12-31-17 % Fund S&P 500 %
h Cyclical 34.49 33.57...............................................................................................r Basic Materials 4.72 2.68t Consumer Cyclical 13.34 11.73y Financial Services 15.08 16.91u Real Estate 1.35 2.25
j Sensitive 41.38 41.83...............................................................................................i Communication Services 3.84 3.29o Energy 7.77 5.74p Industrials 10.03 10.64a Technology 19.74 22.16
k Defensive 24.14 24.60...............................................................................................s Consumer Defensive 8.66 7.83d Healthcare 12.99 13.91f Utilities 2.49 2.86
Principal Risks as of 12-31-17Emerging Markets, Foreign Securities, Long-Term Outlook and Projections, Loss of Money, Not FDIC Insured, Active Management,Issuer, Market/Market Volatility, Equity Securities, Futures, High-Yield Securities, Mortgage-Backed and Asset-Backed Securities,Restricted/Illiquid Securities, Underlying Fund/Fund of Funds, U.S. Government Obligations, Derivatives, Fixed-Income Securities,Management, Small Cap
©2018 Morningstar, Inc., Morningstar Investment Profiles™ 312-696-6000. All rights reserved. The information contained herein: (1) is proprietary to Morningstar and/or its content providers; (2) maynot be copied or distributed and (3) is not warranted to be accurate, complete or timely. Neither Morningstar nor its content providers are responsible for any damages or losses arising from any use ofinformation. Past performance is no guarantee of future performance. Visit our investment website at www.morningstar.com ß
®

Release Date: 03-31-2018
American Funds 2045 Trgt Date Retire R6 RFHTX ..........................................................................................................................................................................................................................................................................................................................................BenchmarkMorningstar Lifetime Mod 2045 TR USD
Overall Morningstar Rating™ Morningstar Return Morningstar RiskQQQQQ High Below AverageOut of 168 Target-Date 2045 funds. An investment's overall Morningstar Rating, based on its risk-adjusted return,is a weighted average of its applicable 3-, 5-, and 10-year Ratings. See disclosure for details.
Investment Objective & StrategyFrom investment’s prospectus
The investment seeks growth, income and conservation of capital. The fund normally invests a greater portion of its assets in bond, equity income and balanced funds as it approaches and passes its target date. The advisor attempts to achieve its investment objectives by investing in a mix of American Funds in different combinations and weightings. The underlying American Funds represent a variety of fund categories such as growth funds, growth-and-income funds, equity-income funds and a balanced fund and bond funds. The fund categories represent differing investment objectives.
Fees and Expenses as of 01-01-18
Prospectus Net Expense Ratio 0.41%Total Annual Operating Expense 0.41%Maximum Sales Charge .12b-1 Fee .Redemption Fee/Term .
Waiver Data Type Exp. Date %
. . . .
Operations and Management
Initial Class Inception Date 02-01-07Fund Inception Date 07-13-09Portfolio Manager(s) James B. Lovelace, CFA
John H. SmetName of Issuer American FundsTelephone 800-421-4225Web Site www.americanfunds.com
Benchmark Description: Morningstar Lifetime Mod 2045 TR USD
The index measures the performance of a portfolio of globalequities, bonds and traditional inflation hedges such ascommodities and TIPS. This portfolio is held in proportionsappropriate for a US investor who is about 35 years away fromretirement. The Moderate risk profile is for investors who arecomfortable with average exposure to equity market volatility.
Category Description: Target-Date 2045
Target-date portfolios provide diversified exposure to stocks,bonds, and cash for those investors who have a specific datein mind (in this case, the years 2041-2045) for retirement. Theseportfolios aim to provide investors with an optimal level of returnand risk, based solely on the target date. Management adjuststhe allocation among asset classes to more-conservative mixesas the target date approaches, following a preset glide path. Atarget-date portfolio is part of a series of funds offering multipleretirement dates to investors.
Allocation of Assets
050 40 30 20 10 -10 -20 -30
10080
60
40
200
Years Until Retirement
% AllocationBondsStocksCashOther
PerformanceTrailing Returns YTD 1 Year 3 Year 5 Year 10 Year Since Inception
Investment Return % 0.45 15.35 9.41 11.07 8.01 12.98Benchmark Return % -0.78 13.31 7.96 9.11 7.10 12.30Category Average % -0.54 13.18 7.38 8.89 6.57 11.57........................................................................................................................................................................................................................Morningstar Rating™ . . QQQQQ QQQQQ QQQQQ .# of Funds in Category . . 168 131 66 .
Quarter End Returns as of 03-31-18 YTD 1 Year 3 Year 5 Year 10 Year Since Inception
Fund Return % 0.45 15.35 9.41 11.07 8.01 12.98Standardized Return % 0.45 15.35 9.41 11.07 8.01 12.98
Performance Disclosure: The performance data quoted represents past performance and does not guarantee futureresults. The investment return and principal value of an investment will fluctuate; thus an investor’s shares, whenredeemed, may be worth more or less than their original cost. Current performance may be lower or higher thanreturn data quoted herein. For performance data current to the most recent month-end please visit the website listedunder Operations and Management on this page.
Portfolio Analysis as of 12-31-17Composition as of 12-31-17 % Assets
U.S. Stocks 51.7Non-U.S. Stocks 31.5Bonds 9.5Cash 7.1Other 0.3
Morningstar Style Box™ as of 12-31-17(EQ) ; 12-31-17(F-I)
LargeM
idSm
all
Value Blend Growth
HighM
edLow
Ltd Mod Ext
Top 10 Holdings as of 12-31-17 % Assets
American Funds Invmt Co of Amer R6 8.40American Funds Washington Mutual R6 8.40American Funds American Mutual R6 7.40American Funds Fundamental Invs R6 7.40American Funds AMCAP R6 7.00.......................................................................................................American Funds Growth Fund of Amer R6 7.00American Funds New Perspective R6 7.00American Funds SMALLCAP World R6 7.00American Funds Capital World Gr&Inc R6 6.40American Funds American Balanced R6 5.60
.......................................................................................................Total Number of Holdings 18Annual Turnover Ratio % 0.00Total Fund Assets ($mil) 7,891.71
Morningstar Sectors as of 12-31-17 % Fund S&P 500 %
h Cyclical 34.44 33.57...............................................................................................r Basic Materials 4.74 2.68t Consumer Cyclical 13.35 11.73y Financial Services 15.14 16.91u Real Estate 1.21 2.25
j Sensitive 41.53 41.83...............................................................................................i Communication Services 3.81 3.29o Energy 7.75 5.74p Industrials 10.04 10.64a Technology 19.93 22.16
k Defensive 24.03 24.60...............................................................................................s Consumer Defensive 8.55 7.83d Healthcare 13.10 13.91f Utilities 2.38 2.86
Principal Risks as of 12-31-17Emerging Markets, Foreign Securities, Long-Term Outlook and Projections, Loss of Money, Not FDIC Insured, Active Management,Issuer, Market/Market Volatility, Equity Securities, Futures, High-Yield Securities, Mortgage-Backed and Asset-Backed Securities,Restricted/Illiquid Securities, Underlying Fund/Fund of Funds, U.S. Government Obligations, Derivatives, Fixed-Income Securities,Management, Small Cap
©2018 Morningstar, Inc., Morningstar Investment Profiles™ 312-696-6000. All rights reserved. The information contained herein: (1) is proprietary to Morningstar and/or its content providers; (2) maynot be copied or distributed and (3) is not warranted to be accurate, complete or timely. Neither Morningstar nor its content providers are responsible for any damages or losses arising from any use ofinformation. Past performance is no guarantee of future performance. Visit our investment website at www.morningstar.com ß
®

Release Date: 03-31-2018
American Funds 2050 Trgt Date Retire R6 RFITX ..........................................................................................................................................................................................................................................................................................................................................BenchmarkMorningstar Lifetime Mod 2050 TR USD
Overall Morningstar Rating™ Morningstar Return Morningstar RiskQQQQQ High Below AverageOut of 185 Target-Date 2050 funds. An investment's overall Morningstar Rating, based on its risk-adjusted return,is a weighted average of its applicable 3-, 5-, and 10-year Ratings. See disclosure for details.
Investment Objective & StrategyFrom investment’s prospectus
The investment seeks growth, income and conservation of capital. The fund normally invests a greater portion of its assets in bond, equity income and balanced funds as it approaches and passes its target date. The advisor attempts to achieve its investment objectives by investing in a mix of American Funds in different combinations and weightings. The underlying American Funds represent a variety of fund categories such as growth funds, growth-and-income funds, equity-income funds and a balanced fund and bond funds. The fund categories represent differing investment objectives.
Fees and Expenses as of 01-01-18
Prospectus Net Expense Ratio 0.42%Total Annual Operating Expense 0.42%Maximum Sales Charge .12b-1 Fee .Redemption Fee/Term .
Waiver Data Type Exp. Date %
. . . .
Operations and Management
Initial Class Inception Date 02-01-07Fund Inception Date 07-13-09Portfolio Manager(s) James B. Lovelace, CFA
John H. SmetName of Issuer American FundsTelephone 800-421-4225Web Site www.americanfunds.com
Benchmark Description: Morningstar Lifetime Mod 2050 TR USD
The index measures the performance of a portfolio of globalequities, bonds and traditional inflation hedges such ascommodities and TIPS. This portfolio is held in proportionsappropriate for a US investor who is about 40 years away fromretirement. The Moderate risk profile is for investors who arecomfortable with average exposure to equity market volatility.
Category Description: Target-Date 2050
Target-date portfolios provide diversified exposure to stocks,bonds, and cash for those investors who have a specific datein mind (in this case, the years 2046-2050) for retirement. Theseportfolios aim to provide investors with an optimal level of returnand risk, based solely on the target date. Management adjuststhe allocation among asset classes to more-conservative mixesas the target date approaches, following a preset glide path. Atarget-date portfolio is part of a series of funds offering multipleretirement dates to investors.
Allocation of Assets
050 40 30 20 10 -10 -20 -30
10080
60
40
200
Years Until Retirement
% AllocationBondsStocksCashOther
PerformanceTrailing Returns YTD 1 Year 3 Year 5 Year 10 Year Since Inception
Investment Return % 0.53 15.60 9.53 11.12 8.04 13.02Benchmark Return % -0.78 13.47 7.98 9.05 7.04 12.25Category Average % -0.62 13.25 7.41 8.91 6.57 11.46........................................................................................................................................................................................................................Morningstar Rating™ . . QQQQQ QQQQQ QQQQQ .# of Funds in Category . . 185 144 61 .
Quarter End Returns as of 03-31-18 YTD 1 Year 3 Year 5 Year 10 Year Since Inception
Fund Return % 0.53 15.60 9.53 11.12 8.04 13.02Standardized Return % 0.53 15.60 9.53 11.12 8.04 13.02
Performance Disclosure: The performance data quoted represents past performance and does not guarantee futureresults. The investment return and principal value of an investment will fluctuate; thus an investor’s shares, whenredeemed, may be worth more or less than their original cost. Current performance may be lower or higher thanreturn data quoted herein. For performance data current to the most recent month-end please visit the website listedunder Operations and Management on this page.
Portfolio Analysis as of 12-31-17Composition as of 12-31-17 % Assets
U.S. Stocks 52.5Non-U.S. Stocks 31.4Bonds 8.7Cash 7.1Other 0.3
Morningstar Style Box™ as of 12-31-17(EQ) ; 12-31-17(F-I)
LargeM
idSm
all
Value Blend Growth
HighM
edLow
Ltd Mod Ext
Top 10 Holdings as of 12-31-17 % Assets
American Funds Invmt Co of Amer R6 9.00American Funds Washington Mutual R6 9.00American Funds American Mutual R6 8.00American Funds Fundamental Invs R6 8.00American Funds AMCAP R6 7.00.......................................................................................................American Funds Capital World Gr&Inc R6 7.00American Funds Growth Fund of Amer R6 7.00American Funds New Perspective R6 7.00American Funds SMALLCAP World R6 7.00American Funds American Balanced R6 5.00
.......................................................................................................Total Number of Holdings 16Annual Turnover Ratio % 0.00Total Fund Assets ($mil) 6,365.80
Morningstar Sectors as of 12-31-17 % Fund S&P 500 %
h Cyclical 34.35 33.57...............................................................................................r Basic Materials 4.73 2.68t Consumer Cyclical 13.34 11.73y Financial Services 15.16 16.91u Real Estate 1.12 2.25
j Sensitive 41.65 41.83...............................................................................................i Communication Services 3.80 3.29o Energy 7.74 5.74p Industrials 10.08 10.64a Technology 20.03 22.16
k Defensive 23.99 24.60...............................................................................................s Consumer Defensive 8.48 7.83d Healthcare 13.20 13.91f Utilities 2.31 2.86
Principal Risks as of 12-31-17Emerging Markets, Foreign Securities, Long-Term Outlook and Projections, Loss of Money, Not FDIC Insured, Active Management,Issuer, Market/Market Volatility, Equity Securities, Futures, High-Yield Securities, Mortgage-Backed and Asset-Backed Securities,Restricted/Illiquid Securities, Underlying Fund/Fund of Funds, U.S. Government Obligations, Derivatives, Fixed-Income Securities,Management, Small Cap
©2018 Morningstar, Inc., Morningstar Investment Profiles™ 312-696-6000. All rights reserved. The information contained herein: (1) is proprietary to Morningstar and/or its content providers; (2) maynot be copied or distributed and (3) is not warranted to be accurate, complete or timely. Neither Morningstar nor its content providers are responsible for any damages or losses arising from any use ofinformation. Past performance is no guarantee of future performance. Visit our investment website at www.morningstar.com ß
®

Release Date: 03-31-2018
American Funds 2055 Trgt Date Retire R6 RFKTX ..........................................................................................................................................................................................................................................................................................................................................BenchmarkMorningstar Lifetime Mod 2055 TR USD
Overall Morningstar Rating™ Morningstar Return Morningstar RiskQQQQQ High Below AverageOut of 159 Target-Date 2055 funds. An investment's overall Morningstar Rating, based on its risk-adjusted return,is a weighted average of its applicable 3-, 5-, and 10-year Ratings. See disclosure for details.
Investment Objective & StrategyFrom investment’s prospectus
The investment seeks growth, income and conservation of capital. The fund normally invests a greater portion of its assets in bond, equity income and balanced funds as it approaches and passes its target date. The advisor attempts to achieve its investment objectives by investing in a mix of American Funds in different combinations and weightings. The underlying American Funds represent a variety of fund categories such as growth funds, growth-and-income funds, equity-income funds and a balanced fund and bond funds. The fund categories represent differing investment objectives.
Fees and Expenses as of 01-01-18
Prospectus Net Expense Ratio 0.42%Total Annual Operating Expense 0.42%Maximum Sales Charge .12b-1 Fee .Redemption Fee/Term .
Waiver Data Type Exp. Date %
. . . .
Operations and Management
Fund Inception Date 02-01-10Portfolio Manager(s) James B. Lovelace, CFA
John H. SmetName of Issuer American FundsTelephone 800-421-4225Web Site www.americanfunds.com
Benchmark Description: Morningstar Lifetime Mod 2055 TR USD
The index measures the performance of a portfolio of globalequities, bonds and traditional inflation hedges such ascommodities and TIPS. This portfolio is held in proportionsappropriate for a US investor who is about 45 years away fromretirement. The Moderate risk profile is for investors who arecomfortable with average exposure to equity market volatility.
Category Description: Target-Date 2055
Target-date portfolios provide a diversified exposure to stocks,bonds, and cash for those investors who have a specific datein mind (in this case, the years 2051-2055) for retirement. Theseportfolios aim to provide investors with an optimal level of returnand risk, based solely on the target date. Management adjuststhe allocation among asset classes to more-conservative mixesas the target date approaches, following a preset glide path. Atarget-date portfolio is part of a series of funds offering multipleretirement dates to investors.
Allocation of Assets
050 40 30 20 10 -10 -20 -30
10080
60
40
200
Years Until Retirement
% AllocationBondsStocksCashOther
PerformanceTrailing Returns YTD 1 Year 3 Year 5 Year 10 Year Since Inception
Investment Return % 0.53 15.60 9.51 11.12 . 11.37Benchmark Return % -0.79 13.57 7.97 8.96 . 10.23Category Average % -0.52 13.61 7.61 9.23 . 9.95........................................................................................................................................................................................................................Morningstar Rating™ . . QQQQQ QQQQQ . .# of Funds in Category . . 159 105 . .
Quarter End Returns as of 03-31-18 YTD 1 Year 3 Year 5 Year 10 Year Since Inception
Fund Return % 0.53 15.60 9.51 11.12 . 11.37Standardized Return % 0.53 15.60 9.51 11.12 . 11.37
Performance Disclosure: The performance data quoted represents past performance and does not guarantee futureresults. The investment return and principal value of an investment will fluctuate; thus an investor’s shares, whenredeemed, may be worth more or less than their original cost. Current performance may be lower or higher thanreturn data quoted herein. For performance data current to the most recent month-end please visit the website listedunder Operations and Management on this page.
Portfolio Analysis as of 12-31-17Composition as of 12-31-17 % Assets
U.S. Stocks 52.5Non-U.S. Stocks 31.4Bonds 8.7Cash 7.1Other 0.3
Morningstar Style Box™ as of 12-31-17(EQ) ; 12-31-17(F-I)
LargeM
idSm
all
Value Blend Growth
HighM
edLow
Ltd Mod Ext
Top 10 Holdings as of 12-31-17 % Assets
American Funds Invmt Co of Amer R6 9.00American Funds Washington Mutual R6 9.00American Funds American Mutual R6 8.00American Funds Fundamental Invs R6 8.00American Funds AMCAP R6 7.00.......................................................................................................American Funds Capital World Gr&Inc R6 7.00American Funds Growth Fund of Amer R6 7.00American Funds New Perspective R6 7.00American Funds SMALLCAP World R6 7.00American Funds American Balanced R6 5.00
.......................................................................................................Total Number of Holdings 16Annual Turnover Ratio % 1.00Total Fund Assets ($mil) 3,096.37
Morningstar Sectors as of 12-31-17 % Fund S&P 500 %
h Cyclical 34.35 33.57...............................................................................................r Basic Materials 4.73 2.68t Consumer Cyclical 13.34 11.73y Financial Services 15.16 16.91u Real Estate 1.12 2.25
j Sensitive 41.65 41.83...............................................................................................i Communication Services 3.80 3.29o Energy 7.74 5.74p Industrials 10.08 10.64a Technology 20.03 22.16
k Defensive 23.99 24.60...............................................................................................s Consumer Defensive 8.48 7.83d Healthcare 13.20 13.91f Utilities 2.31 2.86
Principal Risks as of 12-31-17Emerging Markets, Foreign Securities, Long-Term Outlook and Projections, Loss of Money, Not FDIC Insured, Active Management,Issuer, Market/Market Volatility, Equity Securities, Futures, High-Yield Securities, Mortgage-Backed and Asset-Backed Securities,Restricted/Illiquid Securities, Underlying Fund/Fund of Funds, U.S. Government Obligations, Derivatives, Fixed-Income Securities,Management, Small Cap
©2018 Morningstar, Inc., Morningstar Investment Profiles™ 312-696-6000. All rights reserved. The information contained herein: (1) is proprietary to Morningstar and/or its content providers; (2) maynot be copied or distributed and (3) is not warranted to be accurate, complete or timely. Neither Morningstar nor its content providers are responsible for any damages or losses arising from any use ofinformation. Past performance is no guarantee of future performance. Visit our investment website at www.morningstar.com ß
®

Release Date: 03-31-2018
American Funds 2060 Trgt Date Retire R6 RFUTX ..........................................................................................................................................................................................................................................................................................................................................BenchmarkMorningstar Lifetime Mod 2060 TR USD
Overall Morningstar Rating™ Morningstar Return Morningstar RiskQQQQQ High LowOut of 56 Target-Date 2060+ funds. An investment's overall Morningstar Rating, based on its risk-adjusted return,is a weighted average of its applicable 3-, 5-, and 10-year Ratings. See disclosure for details.
Investment Objective & StrategyFrom investment’s prospectus
The investment seeks growth, income and conservation of capital. The fund normally invests a greater portion of its assets in bond, equity income and balanced funds as it approaches and passes its target date. The advisor attempts to achieve its investment objectives by investing in a mix of American Funds in different combinations and weightings. The underlying American Funds represent a variety of fund categories such as growth funds, growth-and-income funds, equity-income funds and a balanced fund and bond funds. The fund categories represent differing investment objectives.
Fees and Expenses as of 01-01-18
Prospectus Net Expense Ratio 0.45%Total Annual Operating Expense 0.49%Maximum Sales Charge .12b-1 Fee .Redemption Fee/Term .
Waiver Data Type Exp. Date %
OtherFee Contractual 01-01-19 0.04
Operations and Management
Fund Inception Date 03-27-15Portfolio Manager(s) Wesley K. Phoa
James B. Lovelace, CFAName of Issuer American FundsTelephone 800-421-4225Web Site www.americanfunds.com
Benchmark Description: Morningstar Lifetime Mod 2060 TR USD
The index measures the performance of a portfolio of globalequities, bonds and traditional inflation hedges such ascommodities and TIPS. This portfolio is held in proportionsappropriate for a US investor who is about 45 years away fromretirement. The Moderate risk profile is for investors who arecomfortable with average exposure to equity market volatility.
Category Description: Target-Date 2060+
Target-date portfolios provide a diversified exposure to stocks,bonds, and cash for those investors who have a specific datein mind (in this case, the years 2056-2060 and beyond) forretirement. These portfolios aim to provide investors with anoptimal level of return and risk, based solely on the target date.Management adjusts the allocation among asset classes tomore-conservative mixes as the target date approaches,following a preset glide path. A target-date portfolio is part ofa series of funds offering multiple retirement dates to investors.
Allocation of Assets
050 40 30 20 10 -10 -20 -30
10080
60
40
200
Years Until Retirement
% AllocationBondsStocksCashOther
PerformanceTrailing Returns YTD 1 Year 3 Year 5 Year 10 Year Since Inception
Investment Return % 0.56 15.57 9.49 . . 9.49Benchmark Return % -0.79 13.63 7.94 . . 7.97Category Average % -0.60 13.72 8.03 . . 7.79........................................................................................................................................................................................................................Morningstar Rating™ . . QQQQQ . . .# of Funds in Category . . 56 . . .
Quarter End Returns as of 03-31-18 YTD 1 Year 3 Year 5 Year 10 Year Since Inception
Fund Return % 0.56 15.57 9.49 . . 9.49Standardized Return % 0.56 15.57 9.49 . . 9.49
Performance Disclosure: The performance data quoted represents past performance and does not guarantee futureresults. The investment return and principal value of an investment will fluctuate; thus an investor’s shares, whenredeemed, may be worth more or less than their original cost. Current performance may be lower or higher thanreturn data quoted herein. For performance data current to the most recent month-end please visit the website listedunder Operations and Management on this page.
Portfolio Analysis as of 12-31-17Composition as of 12-31-17 % Assets
U.S. Stocks 52.5Non-U.S. Stocks 31.4Bonds 8.7Cash 7.1Other 0.3
Morningstar Style Box™ as of 12-31-17(EQ) ; 12-31-17(F-I)
LargeM
idSm
all
Value Blend Growth
HighM
edLow
Ltd Mod Ext
Top 10 Holdings as of 12-31-17 % Assets
American Funds Invmt Co of Amer R6 9.00American Funds Washington Mutual R6 9.00American Funds American Mutual R6 8.00American Funds Fundamental Invs R6 8.00American Funds AMCAP R6 7.00.......................................................................................................American Funds Capital World Gr&Inc R6 7.00American Funds Growth Fund of Amer R6 7.00American Funds New Perspective R6 7.00American Funds SMALLCAP World R6 7.00American Funds American Balanced R6 5.00
.......................................................................................................Total Number of Holdings 16Annual Turnover Ratio % 4.00Total Fund Assets ($mil) 736.60
Morningstar Sectors as of 12-31-17 % Fund S&P 500 %
h Cyclical 34.35 33.57...............................................................................................r Basic Materials 4.73 2.68t Consumer Cyclical 13.34 11.73y Financial Services 15.16 16.91u Real Estate 1.12 2.25
j Sensitive 41.65 41.83...............................................................................................i Communication Services 3.80 3.29o Energy 7.74 5.74p Industrials 10.08 10.64a Technology 20.03 22.16
k Defensive 23.99 24.60...............................................................................................s Consumer Defensive 8.48 7.83d Healthcare 13.20 13.91f Utilities 2.31 2.86
Principal Risks as of 12-31-17Emerging Markets, Foreign Securities, Long-Term Outlook and Projections, Loss of Money, Not FDIC Insured, Active Management,Issuer, Market/Market Volatility, Equity Securities, Futures, High-Yield Securities, Mortgage-Backed and Asset-Backed Securities,Restricted/Illiquid Securities, Underlying Fund/Fund of Funds, U.S. Government Obligations, Derivatives, Fixed-Income Securities,Management, Small Cap
©2018 Morningstar, Inc., Morningstar Investment Profiles™ 312-696-6000. All rights reserved. The information contained herein: (1) is proprietary to Morningstar and/or its content providers; (2) maynot be copied or distributed and (3) is not warranted to be accurate, complete or timely. Neither Morningstar nor its content providers are responsible for any damages or losses arising from any use ofinformation. Past performance is no guarantee of future performance. Visit our investment website at www.morningstar.com ß
®

Release Date: 03-31-2018
Columbia Mid Cap Value Inst NAMAX ..........................................................................................................................................................................................................................................................................................................................................BenchmarkRussell Mid Cap Value TR USD
Overall Morningstar Rating™ Morningstar Return Morningstar RiskQQQ Below Average AverageOut of 361 Mid-Cap Value funds. An investment's overall Morningstar Rating, based on its risk-adjusted return, isa weighted average of its applicable 3-, 5-, and 10-year Ratings. See disclosure for details.
Investment Objective & StrategyFrom investment’s prospectus
The investment seeks long-term capital appreciation. Under normal circumstances, the fund invests at least 80% of its net assets (including the amount of any borrowings for investment purposes) in equity securities of companies that have market capitalizations in the range of the companies in the Russell Midcap Value Index (the index) at the time of purchase that the fund's investment manager believes are undervalued and have the potential for long-term growth. It may invest up to 20% of its total assets in foreign securities. The fund normally invests in common stocks and also may invest in real estate investment trusts.
Fees and Expenses as of 08-31-17
Prospectus Net Expense Ratio 0.92%Total Annual Operating Expense 0.93%Maximum Sales Charge .12b-1 Fee 0.00%Redemption Fee/Term .
Waiver Data Type Exp. Date %
ExpenseRatio Contractual 06-30-18 0.01
Operations and Management
Fund Inception Date 11-20-01Portfolio Manager(s) David I. Hoffman
Diane L. Sobin, CFAName of Issuer ColumbiaTelephone 800-345-6611Web Site www.columbiamanagement.com
Benchmark Description: Russell Mid Cap Value TR USD
The index measures the performance of the mid-cap valuesegment of the US equity universe. It includes Russell midcapindex companies with lower price-to-book ratios and lowerforecasted growth values. It is market-capitalization weighted.
Category Description: Mid-Cap Value
Some mid-cap value portfolios focus on medium-sizecompanies while others land here because they own a mix ofsmall-, mid-, and large-cap stocks. All look for U.S. stocks thatare less expensive or growing more slowly than the market. TheU.S. mid-cap range for market capitalization typically fallsbetween $1 billion and $8 billion and represents 20% of thetotal capitalization of the U.S. equity market. Value is definedbased on low valuations (low price ratios and high dividendyields) and slow growth (low growth rates for earnings, sales,book value, and cash flow).
Performance
5
10
15
20
0
-5
-10
-15
YTD YTD YTD YTD YTD YTD
Total Return%as of 03-31-18
InvestmentBenchmark
Average annual, if greaterthan 1 year.
YTD 1 Year 3 Year 5 Year 10 Year Since Inception-2.73 6.71 5.72 10.17 8.19 9.36 Fund Return %-2.73 6.71 5.72 10.17 8.19 9.36 Load-Adj. Return %-2.50 6.50 7.23 11.11 9.81 10.36 Benchmark Return %-2.21 7.30 6.75 10.06 8.87 8.54 Category Average %........................................................................................................................................................................................................... . QQQ QQQ QQQ . Morningstar Rating™. . 361 309 225 . # of Funds in Category
Quarter End Returns as of 03-31-18 YTD 1 Year 3 Year 5 Year 10 Year Since Inception
Fund Return % -2.73 6.71 5.72 10.17 8.19 9.36Standardized Return % -2.73 6.71 5.72 10.17 8.19 9.36
Performance Disclosure: The performance data quoted represents past performance and does not guarantee futureresults. The investment return and principal value of an investment will fluctuate; thus an investor’s shares, whenredeemed, may be worth more or less than their original cost. Current performance may be lower or higher thanreturn data quoted herein. For performance data current to the most recent month-end please visit the website listedunder Operations and Management on this page.
Portfolio Analysis as of 02-28-18Composition as of 02-28-18 % Assets
U.S. Stocks 92.6Non-U.S. Stocks 2.2Bonds 0.0Cash 5.2Other 0.0
Morningstar Equity Style Box™ as of 02-28-18 % Mkt Cap
LargeM
idSm
all
Value Blend Growth
Giant 0.00........................................................Large 46.46Medium 48.66Small 4.88........................................................Micro 0.00
Top 10 Holdings as of 02-28-18 % Assets
Columbia Short-Term Cash 12-30-20 5.19Comerica Inc 2.42SunTrust Banks Inc 2.39Fifth Third Bancorp 2.27Zions Bancorp 2.09.......................................................................................................Lincoln National Corp 2.03Pinnacle West Capital Corp 2.00The Hartford Financial Services Group Inc 2.00Boston Properties Inc 1.92Public Service Enterprise Group Inc 1.85
.......................................................................................................Total Number of Stock Holdings 77Total Number of Bond Holdings 0Annual Turnover Ratio % 33.00Total Fund Assets ($mil) 2,015.73
Morningstar Sectors as of 02-28-18 % Fund S&P 500 %
h Cyclical 46.57 33.57...............................................................................................r Basic Materials 6.91 2.68t Consumer Cyclical 9.50 11.73y Financial Services 20.15 16.91u Real Estate 10.01 2.25
j Sensitive 29.95 41.83...............................................................................................i Communication Services 1.57 3.29o Energy 9.12 5.74p Industrials 16.03 10.64a Technology 3.23 22.16
k Defensive 23.48 24.60...............................................................................................s Consumer Defensive 6.38 7.83d Healthcare 6.70 13.91f Utilities 10.40 2.86
Principal Risks as of 02-28-18Foreign Securities, Loss of Money, Not FDIC Insured, Value Investing, Active Management, Issuer, Market/Market Volatility, Industryand Sector Investing, Small Cap, Mid-Cap, Real Estate/REIT Sector
©2018 Morningstar, Inc., Morningstar Investment Profiles™ 312-696-6000. All rights reserved. The information contained herein: (1) is proprietary to Morningstar and/or its content providers; (2) maynot be copied or distributed and (3) is not warranted to be accurate, complete or timely. Neither Morningstar nor its content providers are responsible for any damages or losses arising from any use ofinformation. Past performance is no guarantee of future performance. Visit our investment website at www.morningstar.com ß
®

Release Date: 03-31-2018
Franklin Rising Dividends Adv FRDAX ..........................................................................................................................................................................................................................................................................................................................................BenchmarkRussell 1000 TR USD
Overall Morningstar Rating™ Morningstar Return Morningstar RiskQQQ Average Below AverageOut of 1204 Large Blend funds. An investment's overall Morningstar Rating, based on its risk-adjusted return, is aweighted average of its applicable 3-, 5-, and 10-year Ratings. See disclosure for details.
Investment Objective & StrategyFrom investment’s prospectus
The investment seeks long-term capital appreciation; preservation of capital, while not a goal, is also an important consideration. The fund invests at least 80% of its net assets in investments of companies that have paid consistently rising dividends. It invests predominantly in equity securities, primarily common stock. The fund may invest in companies of any size, across the entire market spectrum. It may invest up to 25% of its total assets in foreign securities.
Fees and Expenses as of 02-01-18
Prospectus Net Expense Ratio 0.65%Total Annual Operating Expense 0.65%Maximum Sales Charge .12b-1 Fee .Redemption Fee/Term .
Waiver Data Type Exp. Date %
. . . .
Operations and Management
Initial Class Inception Date 01-14-87Fund Inception Date 10-03-05Portfolio Manager(s) Donald G. Taylor, CPA
Nicholas P.B. Getaz, CFAName of Issuer Franklin Templeton InvestmentsTelephone 800-342-5236Web Site www.franklintempleton.com
Benchmark Description: Russell 1000 TR USD
The index measures the performance of the large-cap segmentof the US equity securities. It is a subset of the Russell 3000index and includes approximately 1000 of the largest securitiesbased on a combination of their market cap and current indexmembership.
Category Description: Large Blend
Large-blend portfolios are fairly representative of the overall USstock market in size, growth rates and price. Stocks in the top70% of the capitalization of the US equity market are definedas large cap. The blend style is assigned to portfolios whereneither growth nor value characteristics predominate. Theseportfolios tend to invest across the spectrum of US industries,and owing to their broad exposure, the portfolios' returns areoften similar to those of the S&P 500 Index.
Performance
5
10
15
20
0
-5
-10
-15
YTD YTD YTD YTD YTD YTD
Total Return%as of 03-31-18
InvestmentBenchmark
Average annual, if greaterthan 1 year.
YTD 1 Year 3 Year 5 Year 10 Year Since Inception-2.57 12.22 9.17 10.80 8.96 8.38 Fund Return %-2.57 12.22 9.17 10.80 8.96 8.38 Load-Adj. Return %-0.69 13.98 10.39 13.17 9.61 8.67 Benchmark Return %-0.98 12.82 8.89 11.72 8.58 7.26 Category Average %........................................................................................................................................................................................................... . QQQ QQ QQQQ . Morningstar Rating™. . 1204 1077 802 . # of Funds in Category
Quarter End Returns as of 03-31-18 YTD 1 Year 3 Year 5 Year 10 Year Since Inception
Fund Return % -2.57 12.22 9.17 10.80 8.96 8.38Standardized Return % -2.57 12.22 9.17 10.80 8.96 8.38
Performance Disclosure: The performance data quoted represents past performance and does not guarantee futureresults. The investment return and principal value of an investment will fluctuate; thus an investor’s shares, whenredeemed, may be worth more or less than their original cost. Current performance may be lower or higher thanreturn data quoted herein. For performance data current to the most recent month-end please visit the website listedunder Operations and Management on this page.
Portfolio Analysis as of 12-31-17Composition as of 12-31-17 % Assets
U.S. Stocks 98.8Non-U.S. Stocks 0.2Bonds 0.0Cash 0.0Other 1.0
Morningstar Equity Style Box™ as of 12-31-17 % Mkt Cap
LargeM
idSm
all
Value Blend Growth
Giant 34.90........................................................Large 40.80Medium 21.79Small 2.52........................................................Micro 0.00
Top 10 Holdings as of 12-31-17 % Assets
Roper Technologies Inc 4.87Microsoft Corp 4.63Albemarle Corp 4.54Honeywell International Inc 3.38Stryker Corp 3.37.......................................................................................................Praxair Inc 3.22Becton, Dickinson and Co 3.21Accenture PLC A 3.19Texas Instruments Inc 2.97Air Products & Chemicals Inc 2.74
.......................................................................................................Total Number of Stock Holdings 72Total Number of Bond Holdings 0Annual Turnover Ratio % 3.09Total Fund Assets ($mil) 18,981.34
Morningstar Sectors as of 12-31-17 % Fund S&P 500 %
h Cyclical 25.40 33.57...............................................................................................r Basic Materials 12.71 2.68t Consumer Cyclical 9.62 11.73y Financial Services 3.07 16.91u Real Estate 0.00 2.25
j Sensitive 43.87 41.83...............................................................................................i Communication Services 0.61 3.29o Energy 6.72 5.74p Industrials 23.51 10.64a Technology 13.03 22.16
k Defensive 30.74 24.60...............................................................................................s Consumer Defensive 12.14 7.83d Healthcare 18.60 13.91f Utilities 0.00 2.86
Principal Risks as of 12-31-17Foreign Securities, Loss of Money, Not FDIC Insured, Active Management, Market/Market Volatility, Industry and Sector Investing,Portfolio Diversification, Small Cap, Mid-Cap
©2018 Morningstar, Inc., Morningstar Investment Profiles™ 312-696-6000. All rights reserved. The information contained herein: (1) is proprietary to Morningstar and/or its content providers; (2) maynot be copied or distributed and (3) is not warranted to be accurate, complete or timely. Neither Morningstar nor its content providers are responsible for any damages or losses arising from any use ofinformation. Past performance is no guarantee of future performance. Visit our investment website at www.morningstar.com ß
®

Release Date: 03-31-2018
Franklin Small Cap Value Adv FVADX ..........................................................................................................................................................................................................................................................................................................................................BenchmarkRussell 2000 Value TR USD
Overall Morningstar Rating™ Morningstar Return Morningstar RiskQQQ Average AverageOut of 348 Small Value funds. An investment's overall Morningstar Rating, based on its risk-adjusted return, is aweighted average of its applicable 3-, 5-, and 10-year Ratings. See disclosure for details.
Investment Objective & StrategyFrom investment’s prospectus
The investment seeks long-term total return. The fund normally invests at least 80% of its net assets in investments of small-capitalization (small-cap) companies. Small-cap companies are companies with market capitalizations not exceeding either: 1) the highest market capitalization in the Russell 2000 Index; or 2) the 12-month average of the highest market capitalization in the Russell 2000 Index. It generally invests in equity securities that the fund's investment manager believes are undervalued at the time of purchase and have the potential for capital appreciation. It may invest up to 25% of its total assets in foreign securities.
Fees and Expenses as of 03-01-18
Prospectus Net Expense Ratio 0.80%Total Annual Operating Expense 0.82%Maximum Sales Charge .12b-1 Fee .Redemption Fee/Term .
Waiver Data Type Exp. Date %
ExpenseRatio Contractual 03-01-19 0.02
Operations and Management
Fund Inception Date 12-31-96Portfolio Manager(s) Steven B. Raineri
Christopher Meeker, CFAName of Issuer Franklin Templeton InvestmentsTelephone 800-342-5236Web Site www.franklintempleton.com
Benchmark Description: Russell 2000 Value TR USD
The index measures the performance of small-cap valuesegment of the US equity universe. It includes those Russell2000 companies with lower price-to-book ratios and lowerforecasted growth values. It is market-capitalization weighted.Russell Investment Group is the source and owner of thetrademarks, service marks and copyrights related to the RussellIndexes. Russell® is a trademark of Russell Investment Group.
Category Description: Small Value
Small-value portfolios invest in small U.S. companies withvaluations and growth rates below other small-cap peers.Stocks in the bottom 10% of the capitalization of the U.S. equitymarket are defined as small cap. Value is defined based on lowvaluations (low price ratios and high dividend yields) and slowgrowth (low growth rates for earnings, sales, book value, andcash flow).
Performance
5
10
15
20
0
-5
-10
-15
YTD YTD YTD YTD YTD YTD
Total Return%as of 03-31-18
InvestmentBenchmark
Average annual, if greaterthan 1 year.
YTD 1 Year 3 Year 5 Year 10 Year Since Inception-1.93 9.33 9.18 9.96 9.13 8.92 Fund Return %-1.93 9.33 9.18 9.96 9.13 8.92 Load-Adj. Return %-2.64 5.13 7.87 9.96 8.61 9.37 Benchmark Return %-2.75 5.71 6.67 9.10 8.74 9.34 Category Average %........................................................................................................................................................................................................... . QQQQ QQQ QQQ . Morningstar Rating™. . 348 301 209 . # of Funds in Category
Quarter End Returns as of 03-31-18 YTD 1 Year 3 Year 5 Year 10 Year Since Inception
Fund Return % -1.93 9.33 9.18 9.96 9.13 8.92Standardized Return % -1.93 9.33 9.18 9.96 9.13 8.92
Performance Disclosure: The performance data quoted represents past performance and does not guarantee futureresults. The investment return and principal value of an investment will fluctuate; thus an investor’s shares, whenredeemed, may be worth more or less than their original cost. Current performance may be lower or higher thanreturn data quoted herein. For performance data current to the most recent month-end please visit the website listedunder Operations and Management on this page.
Portfolio Analysis as of 12-31-17Composition as of 12-31-17 % Assets
U.S. Stocks 86.3Non-U.S. Stocks 9.9Bonds 0.8Cash 3.0Other 0.0
Morningstar Equity Style Box™ as of 12-31-17 % Mkt Cap
LargeM
idSm
all
Value Blend Growth
Giant 0.00........................................................Large 0.29Medium 26.84Small 48.75........................................................Micro 24.13
Top 10 Holdings as of 12-31-17 % Assets
Ift-Money Market Portfolio 3.00First Horizon National Corp 2.95Old Republic International Corp 2.69Chemical Financial Corp 2.51Simpson Manufacturing Co Inc 2.41.......................................................................................................Columbia Banking System Inc 2.23The Hanover Insurance Group Inc 2.20Spirit Airlines Inc 2.19AAR Corp 2.06Brinker International Inc 1.94
.......................................................................................................Total Number of Stock Holdings 165Total Number of Bond Holdings 2Annual Turnover Ratio % 33.38Total Fund Assets ($mil) 2,608.44
Morningstar Sectors as of 12-31-17 % Fund S&P 500 %
h Cyclical 52.38 33.57...............................................................................................r Basic Materials 10.66 2.68t Consumer Cyclical 9.89 11.73y Financial Services 26.20 16.91u Real Estate 5.63 2.25
j Sensitive 37.82 41.83...............................................................................................i Communication Services 0.00 3.29o Energy 8.10 5.74p Industrials 23.52 10.64a Technology 6.20 22.16
k Defensive 9.80 24.60...............................................................................................s Consumer Defensive 3.98 7.83d Healthcare 1.86 13.91f Utilities 3.96 2.86
Principal Risks as of 12-31-17Foreign Securities, Loss of Money, Not FDIC Insured, Value Investing, Active Management, Market/Market Volatility, Small Cap,Real Estate/REIT Sector
©2018 Morningstar, Inc., Morningstar Investment Profiles™ 312-696-6000. All rights reserved. The information contained herein: (1) is proprietary to Morningstar and/or its content providers; (2) maynot be copied or distributed and (3) is not warranted to be accurate, complete or timely. Neither Morningstar nor its content providers are responsible for any damages or losses arising from any use ofinformation. Past performance is no guarantee of future performance. Visit our investment website at www.morningstar.com ß
®

Release Date: 03-31-2018
Vanguard Institutional Index I VINIX ..........................................................................................................................................................................................................................................................................................................................................BenchmarkRussell 1000 TR USD
Overall Morningstar Rating™ Morningstar Return Morningstar RiskQQQQ Above Average AverageOut of 1204 Large Blend funds. An investment's overall Morningstar Rating, based on its risk-adjusted return, is aweighted average of its applicable 3-, 5-, and 10-year Ratings. See disclosure for details.
Investment Objective & StrategyFrom investment’s prospectus
The investment seeks to track the performance of a benchmark index that measures the investment return of large-capitalization stocks. The fund employs an indexing investment approach designed to track the performance of the Standard & Poor's 500 Index, a widely recognized benchmark of U.S. stock market performance that is dominated by the stocks of large U.S. companies. The advisor attempts to replicate the target index by investing all, or substantially all, of its assets in the stocks that make up the index, holding each stock in approximately the same proportion as its weighting in the index.
Fees and Expenses as of 11-16-17
Prospectus Net Expense Ratio 0.04%Total Annual Operating Expense 0.04%Maximum Sales Charge .12b-1 Fee .Redemption Fee/Term .
Waiver Data Type Exp. Date %
. . . .
Operations and Management
Fund Inception Date 07-31-90Portfolio Manager(s) Donald M. Butler, CFA
Michelle Louie, CFAName of Issuer VanguardTelephone 888-809-8102Web Site www.vanguard.com
Benchmark Description: Russell 1000 TR USD
The index measures the performance of the large-cap segmentof the US equity securities. It is a subset of the Russell 3000index and includes approximately 1000 of the largest securitiesbased on a combination of their market cap and current indexmembership.
Category Description: Large Blend
Large-blend portfolios are fairly representative of the overall USstock market in size, growth rates and price. Stocks in the top70% of the capitalization of the US equity market are definedas large cap. The blend style is assigned to portfolios whereneither growth nor value characteristics predominate. Theseportfolios tend to invest across the spectrum of US industries,and owing to their broad exposure, the portfolios' returns areoften similar to those of the S&P 500 Index.
Performance
5
10
15
20
0
-5
-10
-15
YTD YTD YTD YTD YTD YTD
Total Return%as of 03-31-18
InvestmentBenchmark
Average annual, if greaterthan 1 year.
YTD 1 Year 3 Year 5 Year 10 Year Since Inception-0.77 13.96 10.75 13.28 9.50 9.81 Fund Return %-0.77 13.96 10.75 13.28 9.50 9.81 Load-Adj. Return %-0.69 13.98 10.39 13.17 9.61 10.01 Benchmark Return %-0.98 12.82 8.89 11.72 8.58 8.44 Category Average %........................................................................................................................................................................................................... . QQQQ QQQQQ QQQQ . Morningstar Rating™. . 1204 1077 802 . # of Funds in Category
Quarter End Returns as of 03-31-18 YTD 1 Year 3 Year 5 Year 10 Year Since Inception
Fund Return % -0.77 13.96 10.75 13.28 9.50 9.81Standardized Return % -0.77 13.96 10.75 13.28 9.50 9.81
Performance Disclosure: The performance data quoted represents past performance and does not guarantee futureresults. The investment return and principal value of an investment will fluctuate; thus an investor’s shares, whenredeemed, may be worth more or less than their original cost. Current performance may be lower or higher thanreturn data quoted herein. For performance data current to the most recent month-end please visit the website listedunder Operations and Management on this page.
Portfolio Analysis as of 02-28-18Composition as of 02-28-18 % Assets
U.S. Stocks 98.9Non-U.S. Stocks 0.8Bonds 0.0Cash 0.3Other 0.0
Morningstar Equity Style Box™ as of 02-28-18 % Mkt Cap
LargeM
idSm
all
Value Blend Growth
Giant 56.95........................................................Large 34.38Medium 8.63Small 0.05........................................................Micro 0.00
Top 10 Holdings as of 02-28-18 % Assets
Apple Inc 3.94Microsoft Corp 3.11Amazon.com Inc 2.60Facebook Inc A 1.83JPMorgan Chase & Co 1.72.......................................................................................................Berkshire Hathaway Inc B 1.64Johnson & Johnson 1.50Alphabet Inc C 1.44Alphabet Inc A 1.42Exxon Mobil Corp 1.38
.......................................................................................................Total Number of Stock Holdings 506Total Number of Bond Holdings 4Annual Turnover Ratio % 5.00Total Fund Assets ($mil) 220,310.79
Morningstar Sectors as of 02-28-18 % Fund S&P 500 %
h Cyclical 33.73 33.57...............................................................................................r Basic Materials 2.71 2.68t Consumer Cyclical 11.70 11.73y Financial Services 17.21 16.91u Real Estate 2.11 2.25
j Sensitive 41.87 41.83...............................................................................................i Communication Services 3.27 3.29o Energy 5.51 5.74p Industrials 10.66 10.64a Technology 22.43 22.16
k Defensive 24.40 24.60...............................................................................................s Consumer Defensive 7.73 7.83d Healthcare 13.99 13.91f Utilities 2.68 2.86
Principal Risks as of 02-28-18Loss of Money, Not FDIC Insured, Market/Market Volatility, Equity Securities, Management
©2018 Morningstar, Inc., Morningstar Investment Profiles™ 312-696-6000. All rights reserved. The information contained herein: (1) is proprietary to Morningstar and/or its content providers; (2) maynot be copied or distributed and (3) is not warranted to be accurate, complete or timely. Neither Morningstar nor its content providers are responsible for any damages or losses arising from any use ofinformation. Past performance is no guarantee of future performance. Visit our investment website at www.morningstar.com ß
®

Release Date: 03-31-2018
Oakmark Equity And Income Investor OAKBX ..........................................................................................................................................................................................................................................................................................................................................BenchmarkMorningstar Mod Tgt Risk TR USD
Overall Morningstar Rating™ Morningstar Return Morningstar RiskQQQQ Average AverageOut of 680 Allocation--50% to 70% Equity funds. An investment's overall Morningstar Rating, based on its risk-adjusted return, is a weighted average of its applicable 3-, 5-, and 10-year Ratings. See disclosure for details.
Investment Objective & StrategyFrom investment’s prospectus
The investment seeks income and preservation and growth of capital. The fund invests primarily in a diversified portfolio of U.S. equity and debt securities (although the fund may invest up to 35% of its total assets in equity and debt securities of non-U.S. issuers). It is intended to present a balanced investment program between growth and income by investing approximately 40-75% of its total assets in common stock, including securities convertible into common stock, and up to 60% of its total assets in debt securities issued by U.S. or non-U.S. governments and corporate entities rated at the time of purchase within the two highest grades.
Fees and Expenses as of 01-26-18
Prospectus Net Expense Ratio 0.78%Total Annual Operating Expense 0.88%Maximum Sales Charge .12b-1 Fee .Redemption Fee/Term .
Waiver Data Type Exp. Date %
ManagementFee Contractual 01-28-19 0.10
Operations and Management
Fund Inception Date 11-01-95Portfolio Manager(s) Clyde S. McGregor, CFA
Edward J. Wojciechowski, CFAName of Issuer OakmarkTelephone 800-625-6275Web Site www.oakmark.com
Benchmark Description: Morningstar Mod Tgt Risk TR USD
The Morningstar Target Risk Index family is designed to meetthe needs of investors who would like to maintain a target levelof equity exposure through a portfolio diversified acrossequities, bonds and inflation-hedged instruments. TheMorningstar Moderate Target Risk Index seeks approximately60% exposure to global equity markets.
Category Description: Allocation--50% to 70% Equity
Funds in allocation categories seek to provide both income andcapital appreciation by investing in multiple asset classes,including stocks, bonds, and cash. These portfolios aredominated by domestic holdings and have equity exposuresbetween 50% and 70%.
Performance
5
10
15
20
0
-5
-10
-15
YTD YTD YTD YTD YTD YTD
Total Return%as of 03-31-18
InvestmentBenchmark
Average annual, if greaterthan 1 year.
YTD 1 Year 3 Year 5 Year 10 Year Since Inception-1.62 8.13 5.72 8.33 6.59 10.18 Fund Return %-1.62 8.13 5.72 8.33 6.59 10.18 Load-Adj. Return %-0.87 9.09 6.13 6.69 6.12 . Benchmark Return %-1.26 7.78 4.89 6.55 6.06 6.33 Category Average %........................................................................................................................................................................................................... . QQQ QQQQ QQQQ . Morningstar Rating™. . 680 628 442 . # of Funds in Category
Quarter End Returns as of 03-31-18 YTD 1 Year 3 Year 5 Year 10 Year Since Inception
Fund Return % -1.62 8.13 5.72 8.33 6.59 10.18Standardized Return % -1.62 8.13 5.72 8.33 6.59 10.18
Performance Disclosure: The performance data quoted represents past performance and does not guarantee futureresults. The investment return and principal value of an investment will fluctuate; thus an investor’s shares, whenredeemed, may be worth more or less than their original cost. Current performance may be lower or higher thanreturn data quoted herein. For performance data current to the most recent month-end please visit the website listedunder Operations and Management on this page.
Portfolio Analysis as of 12-31-17Composition as of 12-31-17 % Assets
U.S. Stocks 54.5Non-U.S. Stocks 6.4Bonds 23.5Cash 5.3Other 10.4
Morningstar Style Box™ as of 12-31-17(EQ) ; 03-31-17(F-I)
LargeM
idSm
all
Value Blend Growth
Not
Available
Top 10 Holdings as of 12-31-17 % Assets
Bank of America Corporation 5.21General Motors Co 5.03TE Connectivity Ltd 3.90US Treasury TIP 1.25% 07-15-20 2.96Nestle SA ADR 2.92.......................................................................................................Dover Corp 2.62US Treasury Note 07-15-18 2.62Mastercard Inc A 2.58UnitedHealth Group Inc 2.58Citigroup Inc 2.32
.......................................................................................................Total Number of Stock Holdings 42Total Number of Bond Holdings 211Annual Turnover Ratio % 18.00Total Fund Assets ($mil) 15,794.88
Morningstar Sectors as of 12-31-17 % Fund S&P 500 %
h Cyclical 50.22 33.57...............................................................................................r Basic Materials 1.85 2.68t Consumer Cyclical 16.95 11.73y Financial Services 28.24 16.91u Real Estate 3.18 2.25
j Sensitive 28.25 41.83...............................................................................................i Communication Services 0.00 3.29o Energy 5.33 5.74p Industrials 8.00 10.64a Technology 14.92 22.16
k Defensive 21.53 24.60...............................................................................................s Consumer Defensive 11.40 7.83d Healthcare 10.13 13.91f Utilities 0.00 2.86
Principal Risks as of 12-31-17Foreign Securities, Long-Term Outlook and Projections, Loss of Money, Not FDIC Insured, Capitalization, Value Investing, Market/Market Volatility, Equity Securities, Industry and Sector Investing, Fixed-Income Securities, Portfolio Diversification
©2018 Morningstar, Inc., Morningstar Investment Profiles™ 312-696-6000. All rights reserved. The information contained herein: (1) is proprietary to Morningstar and/or its content providers; (2) maynot be copied or distributed and (3) is not warranted to be accurate, complete or timely. Neither Morningstar nor its content providers are responsible for any damages or losses arising from any use ofinformation. Past performance is no guarantee of future performance. Visit our investment website at www.morningstar.com ß
®

Release Date: 03-31-2018
American Century Real Estate Inv REACX ..........................................................................................................................................................................................................................................................................................................................................BenchmarkS&P United States REIT TR USD
Overall Morningstar Rating™ Morningstar Return Morningstar RiskQQ Below Average Above AverageOut of 228 Real Estate funds. An investment's overall Morningstar Rating, based on its risk-adjusted return, is aweighted average of its applicable 3-, 5-, and 10-year Ratings. See disclosure for details.
Investment Objective & StrategyFrom investment’s prospectus
The investment seeks high total investment return through a combination of capital appreciation and current income. Under normal market conditions, the fund invests at least 80% of its net assets in equity securities issued by real estate investment trusts (REITs) and other companies engaged in the real estate industry. The portfolio managers look for real estate securities they believe will provide superior returns, focusing on companies with the potential for stock price appreciation, plus sustainable growth of cash flow to investors. The fund is non-diversified.
Fees and Expenses as of 03-01-18
Prospectus Net Expense Ratio 1.15%Total Annual Operating Expense 1.15%Maximum Sales Charge .12b-1 Fee .Redemption Fee/Term .
Waiver Data Type Exp. Date %
. . . .
Operations and Management
Fund Inception Date 09-21-95Portfolio Manager(s) Steven R. Brown
Steven RodriguezName of Issuer American Century InvestmentsTelephone 800-345-2021Web Site www.americancentury.com
Benchmark Description: S&P United States REIT TR USD
The index measures the performance of investable universe ofpubilcly traded real estate investment trusts domiciled in theUnited States.
Category Description: Real Estate
Real estate portfolios invest primarily in real estate investmenttrusts of various types. REITs are companies that develop andmanage real estate properties. There are several different typesof REITs, including apartment, factory-outlet, health-care, hotel,industrial, mortgage, office, and shopping center REITs. Someportfolios in this category also invest in real estate operatingcompanies.
Performance
5
10
15
20
0
-5
-10
-15
YTD YTD YTD YTD YTD YTD
Total Return%as of 03-31-18
InvestmentBenchmark
Average annual, if greaterthan 1 year.
YTD 1 Year 3 Year 5 Year 10 Year Since Inception-6.81 -2.25 0.35 5.62 5.21 10.18 Fund Return %-6.81 -2.25 0.35 5.62 5.21 10.18 Load-Adj. Return %-8.15 -4.73 0.59 5.64 6.16 10.10 Benchmark Return %-6.89 -2.30 1.26 5.55 5.88 10.04 Category Average %........................................................................................................................................................................................................... . QQQ QQQ Q . Morningstar Rating™. . 228 198 143 . # of Funds in Category
Quarter End Returns as of 03-31-18 YTD 1 Year 3 Year 5 Year 10 Year Since Inception
Fund Return % -6.81 -2.25 0.35 5.62 5.21 10.18Standardized Return % -6.81 -2.25 0.35 5.62 5.21 10.18
Performance Disclosure: The performance data quoted represents past performance and does not guarantee futureresults. The investment return and principal value of an investment will fluctuate; thus an investor’s shares, whenredeemed, may be worth more or less than their original cost. Current performance may be lower or higher thanreturn data quoted herein. For performance data current to the most recent month-end please visit the website listedunder Operations and Management on this page.
Portfolio Analysis as of 12-31-17Composition as of 12-31-17 % Assets
U.S. Stocks 99.4Non-U.S. Stocks 0.0Bonds 0.0Cash 0.0Other 0.6
Morningstar Equity Style Box™ as of 12-31-17 % Mkt Cap
LargeM
idSm
all
Value Blend Growth
Giant 0.00........................................................Large 33.19Medium 49.76Small 15.55........................................................Micro 1.50
Top 10 Holdings as of 12-31-17 % Assets
Simon Property Group Inc 7.05Prologis Inc 6.47Equinix Inc 5.55Camden Property Trust 3.65AvalonBay Communities Inc 3.60.......................................................................................................Alexandria Real Estate Equities Inc 3.47Regency Centers Corp 3.46Sun Communities Inc 3.23STORE Capital Corp 3.15Vornado Realty Trust 2.93
.......................................................................................................Total Number of Stock Holdings 46Total Number of Bond Holdings 1Annual Turnover Ratio % 145.00Total Fund Assets ($mil) 996.79
Morningstar Sectors as of 12-31-17 % Fund S&P 500 %
h Cyclical 98.80 33.57...............................................................................................r Basic Materials 1.27 2.68t Consumer Cyclical 3.52 11.73y Financial Services 0.00 16.91u Real Estate 94.01 2.25
j Sensitive 1.20 41.83...............................................................................................i Communication Services 1.20 3.29o Energy 0.00 5.74p Industrials 0.00 10.64a Technology 0.00 22.16
k Defensive 0.00 24.60...............................................................................................s Consumer Defensive 0.00 7.83d Healthcare 0.00 13.91f Utilities 0.00 2.86
Principal Risks as of 12-31-17Loss of Money, Not FDIC Insured, Nondiversification, Market/Market Volatility, Shareholder Activity, Real Estate/REIT Sector
©2018 Morningstar, Inc., Morningstar Investment Profiles™ 312-696-6000. All rights reserved. The information contained herein: (1) is proprietary to Morningstar and/or its content providers; (2) maynot be copied or distributed and (3) is not warranted to be accurate, complete or timely. Neither Morningstar nor its content providers are responsible for any damages or losses arising from any use ofinformation. Past performance is no guarantee of future performance. Visit our investment website at www.morningstar.com ß
®

The Investment Profile is supplemental sales literature and mustbe preceded or accompanied by the fund's current prospectusas well as this disclosure statement. The performance datagiven represents past performance and should not beconsidered indicative of future results. Principal value andinvestment return will fluctuate, so that an investor's shareswhen redeemed may be worth more or less than the originalinvestment. Fund portfolio statistics change over time. The fundis not FDIC-insured, may lose value and is not guaranteed by abank or other financial institution.
Performance Total return reflects performance without adjusting for salescharges or the effects of taxation, but is adjusted to reflect allactual ongoing fund expenses and assumes reinvestment ofdividends and capital gains. If adjusted, sales charges wouldreduce the performance quoted. Standardized Total Return is total return adjusted for salescharges. NAV Return is based on net asset value for a fund. Net assetvalue is calculated by dividing the total net assets of the fundby the total number of shares. NAVs come directly from thefund company. ETF investors purchase shares on an exchangeat the market price, which may be different than the NAV. Market Return is the price at which an exchange-traded fund(ETF) may be bought or sold. The price listed may or may notbe the same as the fund's NAV. The fund's performance is compared with that of an index.The index is an unmanaged portfolio of specified securities andthe index does not reflect any initial or ongoing expenses. Theindex cannot be invested in directly. A fund's portfolio may differsignificantly from the securities in the index. The index is chosenby Morningstar.
Morningstar CategoryMorningstar Category is assigned by placing funds into peergroups based on their underlying holdings. The underlyingsecurities in each portfolio are the primary factor in our analysisas the investment objective and investment strategy stated ina fund’s prospectus may not be sufficiently detailed for ourproprietary classification methodology. Funds are placed in acategory based on their portfolio statistics and compositionsover the past three years. Analysis of performance and otherindicative facts are also considered. If the fund is new and hasno portfolio history, Morningstar estimates where it will fallbefore giving it a permanent category assignment. Categoriesmay be changed based on recent changes to the portfolio. Total Annual Operating Expense This is the percentage of fund assets paid for operatingexpenses and management fees. The expense ratio typicallyincludes the following types of fees: accounting, administrator,advisor, auditor, board of directors, custodial, distribution(12b-1), legal, organizational, professional, registration,shareholder reporting, sub-advisor, and transfer agency. Theexpense ratio does not reflect the fund's brokerage costs or anyinvestor sales charges. In contrast to the net expense ratio, thegross expense ratio does not reflect any fee waivers in effectduring the time period. Also known as the Prospectus Gross Expense Ratio,Morningstar pulls the prospectus gross expense ratio from thefund's most recent prospectus.
Expense Ratio %The expense ratio is the annual fee that all funds charge theirshareholders. It expresses the percentage of assets deductedeach fiscal year for fund expenses, including 12b-1 fees,
management fees, administrative fees, operating costs, and allother asset-based costs incurred by the fund. Portfoliotransaction fees, or brokerage costs, as well as front-end ordeferred sales charges are not included in the expense ratio.The expense ratio, which is deducted from the fund’s averagenet assets, is accrued on a daily basis. The gross expense ratio,in contract to the net expense ratio, includes interest anddividends on borrowed securities but does not reflect any feewaivers in effect during the time period.
Sales Fees Also known as loads, sales fees list the maximum level of initial(front-end) and deferred (back-end) sales charges imposed bya fund. The scales of minimum and maximum charges are takenfrom a fund's prospectus. Because fees change frequently andare sometimes waived, it is wise to examine the fund'sprospectus carefully for specific information before investing.
12b1 Expense %A 12b-1 fee is a fee used to pay for a mutual fund’s distributioncosts. It is often used as a commission to brokers for selling thefund. The amount of the fee is taken from a fund’s returns. Maximum Redemption Fee %The Maximum Redemption Fee is the maximum amount a fundmay charge if redeemed in a specific time period after the fund’spurchase (for example, 30, 180, or 365 days). Asset Allocation Asset Allocation reflects asset class weightings of the portfolio.The “Other” category includes security types that are not neatlyclassified in the other asset classes, such as convertible bondsand preferred stocks, or cannot be classified by Morningstar asa result of missing data. Morningstar may display assetallocation data in several ways, including tables or pie charts.In addition, Morningstar may compare the asset classbreakdown of the fund against its three-year average, categoryaverage, and/or index proxy. Asset allocations shown in tables may include a breakdownamong the long, short, and net (long positions net of short)positions. These statistics summarize what the fund’smanagers are buying and how they are positioning the fund’sportfolio. When short positions are captured in these portfoliostatistics, investors get a more robust description of the fund’sexposure and risk. Long positions involve buying the securityoutright and selling it later, with the hope the security’s pricerises over time. Short positions are taken with the hope ofbenefitting from anticipated price declines. The investorborrows the security from another investor, sells it and receivescash, and then is obligated to buy it back at some point in thefuture. If the price falls after the short sale, the investor will havesold high and can buy low to close the short position and lockin a profit. However, if the price of the security increases afterthe short sale, the investor will experience a loss buying it at ahigher price than the sale price. Most fund portfolios hold fairly conventional securities, suchas long positions in equities and bonds. Morningstar maygenerate a colored pie chart for these portfolios. Other portfoliosuse other investment strategies or securities, such as shortpositions or derivatives, in an attempt to reduce transactioncosts, enhance returns, or reduce risk. Some of these securitiesand strategies behave like conventional securities, while otherhave unique return and risk characteristics. Portfolios thatincorporate investment strategies resulting in short positions orportfolio with relatively exotic derivative positions often reportdata to Morningstar that does not meet the parameters of thecalculation underlying a pie chart’s generation. Because of the
nature of how these securities are reported to Morningstar, wemay not always get complete portfolio information to reportasset allocation. Morningstar, at its discretion, may determineif unidentified characteristics of fund holdings are material.Asset allocation and other breakdowns may be rescaledaccordingly so that percentages total to 100 percent.(Morningstar used discretion to determine if unidentifiedcharacteristics of fund holdings are material, pie charts andother breakdowns may rescale identified characteristics to100% for more intuitive presentation.) Note that all other portfolio statistics presented in this reportare based on the long (or long rescaled) holdings of the fundonly. Sector WeightingsSuper Sectors represent Morningstar's broadest classificationof equity sectors by assigning the 11 equity sectors into threeclassifications. The Cyclical Super Sector includes industriessignificantly impacted by economic shifts, and the stocksincluded in these sectors generally have betas greater than 1.The Defensive Super Sector generally includes industries thatare relatively immune to economic cycles, and the stocks inthese industries generally have betas less than 1. The SensitiveSuper Sector includes industries that ebb and flow with theoverall economy, but not severely so. Stocks in the SensitiveSuper Sector generally have betas that are close to 1. Morningstar Rating™ The Morningstar Rating™ for funds, or "star rating", iscalculated for managed products (including mutual funds,variable annuity and variable life subaccounts, exchange-tradedfunds, closed-end funds, and separate accounts) with at leasta three-year history. Exchange-traded funds and open-endedmutual funds are considered a single population for comparativepurposes. It is calculated based on a Morningstar Risk-AdjustedReturn measure that accounts for variation in a managedproduct's monthly excess performance, placing more emphasison downward variations and rewarding consistentperformance. The Morningstar Rating does not include anyadjustment for sales loads. The top 10% of products in eachproduct category receive 5 stars, the next 22.5% receive 4stars, the next 35% receive 3 stars, the next 22.5% receive 2stars, and the bottom 10% receive 1 star. The OverallMorningstar Rating for a managed product is derived from aweighted average of the performance figures associated withits three-, five-, and 10-year (if applicable) Morningstar Ratingmetrics. The weights are: 100% three-year rating for 36-59months of total returns, 60% five-year rating/40% three-yearrating for 60-119 months of total returns, and 50% 10-yearrating/30% five-year rating/20% three-year rating for 120 ormore months of total returns. While the 10-year overall starrating formula seems to give the most weight to the 10-yearperiod, the most recent three-year period actually has thegreatest impact because it is included in all three ratingperiods. For private funds, the Morningstar Rating presented ishypothetical, because Morningstar does not independentlyanalyze private funds. Rather, the rating is assigned as a meansto compare these funds with the universe of mutual funds thatMorningstar rates. The evaluation of this investment does notaffect the retail mutual fund data published by Morningstar.
Morningstar Return The Morningstar Return rates a fund’s performance relative toother managed products in its Morningstar Category. It is anassessment of a product's excess return over a risk-free rate(the return of the 90-day Treasury Bill) in comparison with the
Important Disclosures
©2018 Morningstar, Inc., Morningstar® Investment Profiles™ 312-696-6000. All rights reserved. The information contained herein: (1) is proprietary to Morningstar and/or itscontent providers; (2) may not be copied or distributed; and (3) is not warranted to be accurate, complete, or timely. Neither Morningstar nor its content providers are responsiblefor any damages or losses arising from any use of information. Past performance is no guarantee of future performance. Visit our investment website at www.morningstar.com. ß
®

products in its Morningstar category. In each Morningstarcategory, the top 10% of products earn a High MorningstarReturn (High), the next 22.5% Above Average (+Avg), themiddle 35% Average (Avg), the next 22.5% Below Average (-Ave), and the bottom 10% Low (Low). Morningstar Return ismeasured for up to three time periods (three, five, and 10years). These separate measures are then weighted andaveraged to produce an overall measure for the product. Products with less than three years of performance history arenot rated.
Morningstar Risk Morningstar Risk evaluates a fund’s downside volatility relativeto that of other products in its Morningstar Category. It is anassessment of the variations in monthly returns, with anemphasis on downside variations, in comparison with theproducts in its Morningstar category. In each Morningstarcategory, the 10% of products with the lowest measured riskare described as Low Risk (Low), the next 22.5% BelowAverage (-Avg), the middle 35% Average (Avg), the next 22.5%Above Average (+Avg), and the top 10% High (High). Morningstar Risk is measured for up to three time periods(three, five, and 10 years). These separate measures are thenweighted and averaged to produce an overall measure for theproduct. Products with less than three years of performancehistory are not rated.
Morningstar Style Box™ The Morningstar Style Box reveals a fund's investment strategyas of the date noted on this report. For equity funds the vertical axis shows the marketcapitalization of the long stocks owned and the horizontal axisshows investment style (value, blend, or growth). For fixed-income funds, the vertical axis shows the creditquality of the long bonds owned and the horizontal axis showsinterest rate sensitivity as measured by a bond's effectiveduration. Morningstar seeks credit rating information from fundcompanies on a periodic basis (e.g., quarterly). In compilingcredit rating information, Morningstar instructs fund companiesto only use ratings that have been assigned by a NationallyRecognized Statistical Rating Organization (NRSRO). If twoNRSROs have rated a security, fund companies are to reportthe lowest rating; if three or more NRSROs have rated the samesecurity differently, fund companies are to report the rating thatis in the middle. For example, if NRSRO X rates a security AA-,NRSRO Y rates the same security an A and NRSRO Z rates it aBBB+, the fund company should use the credit rating of 'A' inits reporting to Morningstar. PLEASE NOTE: Morningstar, Inc.is not itself an NRSRO nor does it issue a credit rating on thefund. An NRSRO rating on a fixed-income security can changefrom time-to-time. For credit quality, Morningstar combines the credit ratinginformation provided by the fund companies with an averagedefault rate calculation to come up with a weighted-averagecredit quality. The weighted-average credit quality is currentlya letter that roughly corresponds to the scale used by a leadingNRSRO. Bond funds are assigned a style box placement of"low", "medium", or "high" based on their average credit quality.Funds with a low credit quality are those whose weighted-average credit quality is determined to be less than "BBB-";medium are those less than "AA-", but greater or equal to"BBB-"; and high are those with a weighted-average creditquality of "AA-" or higher. When classifying a bond portfolio,Morningstar first maps the NRSRO credit ratings of theunderlying holdings to their respective default rates (asdetermined by Morningstar's analysis of actual historical default
rates). Morningstar then averages these default rates todetermine the average default rate for the entire bond fund.Finally, Morningstar maps this average default rate to itscorresponding credit rating along a convex curve. For interest-rate sensitivity, Morningstar obtains from fundcompanies the average effective duration. Generally,Morningstar classifies a fixed-income fund's interest-ratesensitivity based on the effective duration of the MorningstarCore Bond Index (MCBI), which is currently three years. Theclassification of Limited will be assigned to those funds whoseaverage effective duration is between 25% to 75% of MCBI'saverage effective duration; funds whose average effectiveduration is between 75% to 125% of the MCBI will be classifiedas Moderate; and those that are at 125% or greater of theaverage effective duration of the MCBI will be classified asExtensive. For municipal bond funds, Morningstar also obtains from fundcompanies the average effective duration. In these cases staticbreakpoints are utilized. These breakpoints are as follows: (i)Limited: 4.5 years or less; (ii) Moderate: more than 4.5 yearsbut less than 7 years; and (iii) Extensive: more than 7 years. Inaddition, for non-US taxable and non-US domiciled fixed incomefunds static duration breakpoints are used: (i) Limited: less thanor equal to 3.5 years; (ii) Moderate: greater than 3.5 and lessthan equal to 6 years; (iii) Extensive: greater than 6 years.
Principal Risks The specific risks associated with investing in this fund. Pleasesee the Risk Definitions document for more information on eachtype of risk.
Investment Risk Foreign Securities Funds/Emerging Markets Funds: Theinvestor should note that funds that invest in foreign securitiesinvolve special additional risks. These risks include, but are notlimited to, currency risk, political risk, and risk associated withvarying accounting standards. Investing in emerging marketsmay accentuate these risks. Specialty/Sector Funds: The investor should note that fundsthat invest exclusively in one sector or industry involveadditional risks. The lack of industry diversification subjects theinvestor to increased industry-specific risks. Non-Diversified Funds: The investor should note that fundsthat invest more of their assets in a single issuer involveadditional risks, including share price fluctuations, because ofthe increased concentration of investments. Small Cap Funds: The investor should note that funds thatinvest in stocks of small companies involve additional risks.Smaller companies typically have a higher risk of failure, andare not as well established as larger blue-chip companies.Historically, smaller-company stocks have experienced agreater degree of market volatility than the overall marketaverage. Mid Cap Funds: The investor should note that funds thatinvest in companies with market capitalizations below $10billion involve additional risks. The securities of thesecompanies may be more volatile and less liquid than thesecurities of larger companies. High-Yield Bond Funds: The investor should note that fundsthat invest in lower-rated debt securities (commonly referredto as junk bonds) involve additional risks because of the lowercredit quality of the securities in the portfolio. The investorshould be aware of the possible higher level of volatility, andincreased risk of default. Tax-Free Municipal Bond Funds: The investor should note thatthe income from tax-free municipal bond funds may be subjectto state and local taxation and the Alternative Minimum Tax.
Important Disclosures
©2018 Morningstar, Inc., Morningstar® Investment Profiles™ 312-696-6000. All rights reserved. The information contained herein: (1) is proprietary to Morningstar and/or itscontent providers; (2) may not be copied or distributed; and (3) is not warranted to be accurate, complete, or timely. Neither Morningstar nor its content providers are responsiblefor any damages or losses arising from any use of information. Past performance is no guarantee of future performance. Visit our investment website at www.morningstar.com. ß
®

990500029