youth and employment in north africa: a regional … contents 1. introduction 5 youth employment: a...
TRANSCRIPT

A Report Prepared for the Conference on Youth and Employment in North Africa
Youth and Employment in North Africa:
September 2017
Geneva, September 2017
A Regional Overview


2
Yo
uth
an
d E
mp
loym
ent
in N
ort
h A
fric
a: A
Reg
ion
al O
verv
iew
Contents1. Introduction 5 Youth Employment: A Global Challenge 5 Report Methodology 6 Key Findings 7
2. Youth and Employment in North Africa 8 Economic Growth 8 Demographics 11 Educational Attainment 12 Economic Participation and Employment 15 Labour Productivity 15 The Gender Perspective 20 Self-employment 24 Informal Work 24 Rural Employment 25
3. Governance, Institutions and Rights 27 Labour Norms and Standards 27 Youth Voices 28 Labour Inspection 28 Minimum Wages 28 Active Labour Market Policies 29
Conclusion 30
References and Data Sources 31

3
List of TablesTable 1: GDP per capita (current US$), 2010-2015 9Table 2: Inflation, Consumer Price Index, 2010-2015 9Table 3: Youth share (15-24) in total population (per cent), by country, 2005, 2010, 2015 11Table 4: Gross enrolment ratio (percentage, both sexes) 13Table 5: Unemployment by level of educational attainment (% of total unemployment) 14Table 6: Total unemployment rate (all persons aged above 15 years, percentage) 2010-2016 15Table 7: Employment-to-population ratio (percentage), 2010-2015 18Table 8: Share of youth not in employment, education or training (NEET) (percentage), 2010-2015 19Table 9: Labour productivity in US Dollars (GDP per employed person), 2010-2015 20Table 10: Gender Inequality in the Region 21Table 11: Female youth labour force participation rates by region 1997 and 2016 22Table 12: Self-employment as percentage of total employment rates, 2010-2015 24Table 13: Active Contributors to an Old Age Pension Scheme in countries in the region 24Table 14: Rural population (percentage of total population), 2015-2016 25Table 15: Employment in Agriculture (percentage of total employment), 2011-15 25
List of FiguresFigure 1: GDP growth (annual %) at market prices based on constant local currency. Aggregates are based on constant 2010 U.S. dollars 8Figure 2: Annual output growth in Agriculture, Industry, and Services (percentage), 2010-2015 10Figure 3: Total dependency ratio (ratio of population aged 0-14 and 65+ per 100 population 15-64) 12Figure 4: Youth unemployment rate (percentage), 2010-2015 16Figure 5: Ratio of youth to adult unemployment rates, 2010-2015 17Figure 6: Gender gaps in youth labour force participation rates (male rate minus female rate, percentage points), 2010-2016 23

4
Yo
uth
an
d E
mp
loym
ent
in N
ort
h A
fric
a: A
Reg
ion
al O
verv
iew
1. Introduction This report provides a broad situational analysis for use by policy-makers, social partners and other key stakeholders involved in the promotion of youth employment-related policies and programmes in North Africa. Regional trends and features have been considered together with the country-specific contexts in Egypt, Morocco, Tunisia, Algeria, Mauritania and Sudan. It has been prepared as a background paper for the conference on “Youth and Employment in North Africa” (YENA Conference), to be convened by the ILO in Geneva in September 2017.
The social and political turmoil that spread across the region at the turn of the 2010s was the expression of a youthful population demanding more freedom, justice and jobs. But the instability that followed, compounded by downward pressures in the world economy, further increased decent work deficits, particularly among the youth. North Africa’s youth unemployment rates stand today five points above 2011 levels. Reduced economic activity rates (youth leaving or postponing their entry into the labour market), under-employment (working below one’s qualifications or fewer hours than one would wish to), increased precarity and informal work are also dominant characteristics of the lives at work of North Africa’s youth.
Governments across North Africa have recognised the challenge. Employment promotion, particularly for youth, has come centre-stage in their social and economic agendas. New public funding has been mobilised even as the fiscal context was worsening, and important reforms have been adopted. These measures were to a large extent conceived as a response to immediate challenges. Now that Governments are able to move past emergency measures, a window of opportunity has opened for long term social and economic reforms that would allow youth to be the drivers of North Africa’s progress.
Youth Employment: A Global Challenge
The 2030 Agenda for Sustainable Development explicitly identifies the need to incorporate youth policies into comprehensive, sustainable development strategies. Goal 8 of the Sustainable Development Goals specifically refers to the need to incorporate youth policies into development strategies. As part of the stated goal of promoting ‘inclusive and sustainable economic growth, employment and decent work for all’ world leaders agreed to develop and operationalize a global strategy for youth employment, and implement the Global Jobs Pact of the International Labour Organization (ILO) by 2020 (UN General Assembly 2015, p.20).
Youth employment remains a global challenge and a top policy concern worldwide. Youth are a key resource for the present and future of our society, accounting for over 18 per cent of the world’s population and more than 15 per cent of the world’s labour force. It is not only the quantity of jobs but also the quality of jobs that matters, as few youth have access to productive employment opportunities that provide them with a decent wage, job security and good working conditions.
The ILO has long recognized the importance of taking vigorous and sustained action on youth employment. In 2012, the International Labour Conference adopted the Resolution “Youth Employment Crisis: A Call for Action” (The ‘Call for Action’, ILO 2012a) and resolved to take urgent action to counter youth unemployment and underemployment. The Call for Action and its Follow-up Plan 2012-2019 (which sets priorities for implementation of the Call for Action till 2019), drive the engagement of the ILO on youth employment. Together, they identify five areas, in particular, which require policymakers’ attention: i) employment and economic policies; (ii) employability; (iii) labour market policies; (iv) entrepreneurship; and (v) rights for young people at work. The Call for Action and its Follow-up Plan 2012-2019 are supplemented by ILO’s strategies to promote decent work and social justice as key drivers of social cohesion in fragile and disaster-afflicted countries, as well as initiatives such as ‘Green Jobs’ and the ‘Future of Work’.
5
ILO also has a long history of delivering a large number of development cooperation initiatives all over the world. Since 2011, in North Africa, it has delivered over US$ 50 million in development assistance to support Governments and social partners with the promotion of decent work opportunities1.
In October 2014, the UN High-level Committee on Programmes selected youth employment as a prototype for an issue-based initiative that would mobilize the capacity of the UN and global actors committed to more and better jobs for youth. The Global Initiative on Decent Jobs for Youth is the first-ever, comprehensive United Nations system-wide effort for the promotion of youth employment worldwide. It brings together the vast global resources and convening power of the UN and other global key partners to maximize the effectiveness of youth employment investments and assist Member States in delivering on the 2030 Agenda for Sustainable Development.
A necessary pre-requisite for the development of appropriate policies on youth employment is an assessment of labour market and social challenges/conditions faced by young people in their search for decent work. In North Africa, where the youth unemployment rates are among the highest globally, such an assessment is particularly important.
Report Methodology
This report provides a situation analysis of youth employment in the six countries of Egypt, Morocco, Tunisia, Algeria, Mauritania and Sudan. It has been prepared as background to the conference on ‘Youth Employment in North Africa’ (YENA Conference), which will be convened by the ILO in Geneva on September 26th and 27th 2017. The objectives of the YENA Conference are:
• to assess achievements and progress made towards decent work in North Africa (through South-South cooperation and ILO technical assistance) since 2011;
• review the youth-employment context more than five years after the 2011 Arab uprisings (which affected some of the countries in the region), including current and prospective challenges and opportunities;
• ascertain strategic directions for development cooperation and technical assistance for youth employment in North Africa,
• adopt a ‘Youth-Employment Roadmap’ for North Africa.
Data for the report was collected on the basis of a detailed research framework that included a set of key indicators measuring economic, social and governance conditions (the Indicator Framework).
The Indicator Framework was, in turn, based on ILO’s Decent Work Indicators (see ILO 2013b), which are a set of statistical and legal indicators intended to measure decent work. The indicators were adapted according to the priorities identified in ILO’s 2012 Call to Action2, ILO guidance on analysing youth labour market information (see ILO 2013c), and further revised by the research team based on data availability. Where data was not available, the research team utilized alternate indicators and related sources. The data collected through this process forms the basis of this report.
1 ILO’s programme in North Africa since 2011 has focused on promoting employment opportunities, protecting the most vulnerable, empowering people and communities by strengthening social dialogue, and strengthening the rule of law (including international labour standards).
2 These were: employment and economic policies, employability, labour market policies, entrepreneurship, and rights for young people at work (ILO 2012a).
6
Yo
uth
an
d E
mp
loym
ent
in N
ort
h A
fric
a: A
Reg
ion
al O
verv
iew
The data collected was benchmarked against the equivalent data for middle-income/emerging countries (MICs) as defined by the ILO (ILO 2017a, p.33-34)3. It is also worth noting, that the availability and quality of data remains a major limitation for a study of this nature. The research process revealed large gaps and great variation in terms of both the quantity and quality of data that was available for each country in the study.
Key Findings
Key findings from this report that are of greatest relevance to the youth employment challenge are outlined below.
North Africa is still affected by unsustainable levels of youth unemployment and low economic participation. While economic growth has made a come-back since 2014/15, employment growth is lagging behind. Only about one in three youth are economically active, and among those active, one in three is unemployed. One young women in five is economically active, and across the studied countries young women are two to three times more unemployed than young men. The low employment intensity of growth in North Africa is no recent phenomenon; policies that are “only” aiming at higher growth are not likely to induce a level of employment creation commensurate with strong demographic pressures.
The quality of jobs matters as much as their availability. Under-employment, informality and vulnerable employment are the reality for a growing majority of the young workforce. Youth are queuing in large numbers for (ever more elusive) public sector jobs, and ready to renounce higher wages in private employment, on the expectation of better security and working conditions.
Young people are more affected than other age groups by deficits in the application of national and international labour standards. Youth are more vulnerable to unfair, sometimes unacceptable practices in the labour market. National legislations that are up-to-date with the realities of modern economies and aligned with international standards and best practices, inspection and enforcement authorities, as well as effective collective bargaining and social dialogue are essential levers for countries to improve the lives of youth at work.
A misalignment persists between the needs of North African economies’ and the educational and skills systems, including both general education and technical and vocational education and training. Significant progress has been made across the region in increasing educational enrolment, including for females. But the more educated are also the more unemployed among the youth. The “MENA gender paradox” is an expression used to describe the fact that young women achieve higher educational levels but are also more likely to be unemployed or not economically active.
Young women are at a particular disadvantage in North African labour markets. Despite rising levels of education among women in the region, their opportunities in the economic sphere remain limited. Women face much higher unemployment rates in most countries in the region and have lower labour market participation rates.
Significant disparities endure between urban and rural areas. A significant labour market segmentation for women: women work mostly as self-employed in agriculture and rural men work mostly as non-
3 For the sake of this research, the category of ‘Emerging countries’ has been used interchangeably with the category of ‘Middle Income Countries’ as defined by the World Bank (see Middle Income Countries, World Bank Open Data, http://data.worldbank.org/income-level/middle-income). This category is further sub-divided into ‘upper middle-income countries’ (upper MICs), and ‘lower middle-income countries’ (lower MICs) (for a full list, see Department of Economic and Social Affairs of the United Nations Secretariat (UN/DESA) 2014, p. 143). Of the six countries studied in this report, Algeria and Tunisia are classified as upper MICs whereas the others are classified as lower MICs.

7
agricultural wage earners. In addition, work in rural economies often involves long hours and is not sufficiently remunerated. Rural economies remain extremely important to the overall conditions of economic growth and employment in these countries.
8
Yo
uth
an
d E
mp
loym
ent
in N
ort
h A
fric
a: A
Reg
ion
al O
verv
iew
2. Youth and Employment in North Africa
Economic Growth
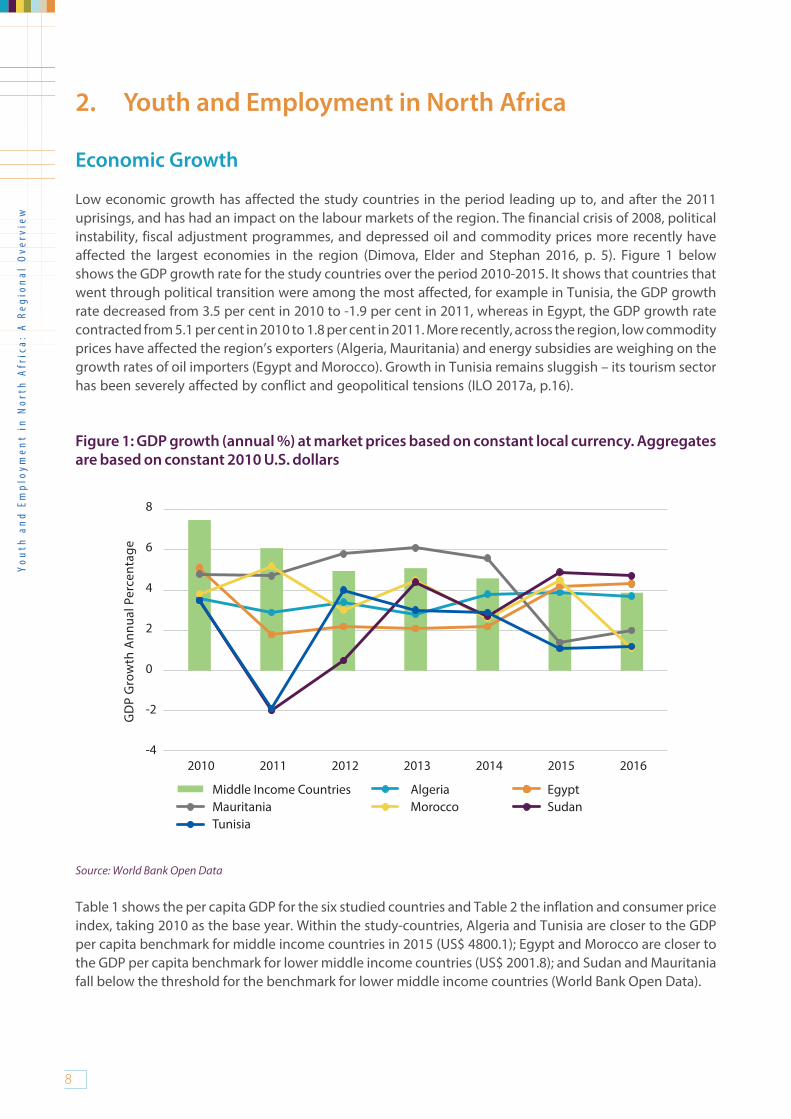
Low economic growth has affected the study countries in the period leading up to, and after the 2011 uprisings, and has had an impact on the labour markets of the region. The financial crisis of 2008, political instability, fiscal adjustment programmes, and depressed oil and commodity prices more recently have affected the largest economies in the region (Dimova, Elder and Stephan 2016, p. 5). Figure 1 below shows the GDP growth rate for the study countries over the period 2010-2015. It shows that countries that went through political transition were among the most affected, for example in Tunisia, the GDP growth rate decreased from 3.5 per cent in 2010 to -1.9 per cent in 2011, whereas in Egypt, the GDP growth rate contracted from 5.1 per cent in 2010 to 1.8 per cent in 2011. More recently, across the region, low commodity prices have affected the region’s exporters (Algeria, Mauritania) and energy subsidies are weighing on the growth rates of oil importers (Egypt and Morocco). Growth in Tunisia remains sluggish – its tourism sector has been severely affected by conflict and geopolitical tensions (ILO 2017a, p.16).
Figure 1: GDP growth (annual %) at market prices based on constant local currency. Aggregates are based on constant 2010 U.S. dollars
Source: World Bank Open Data
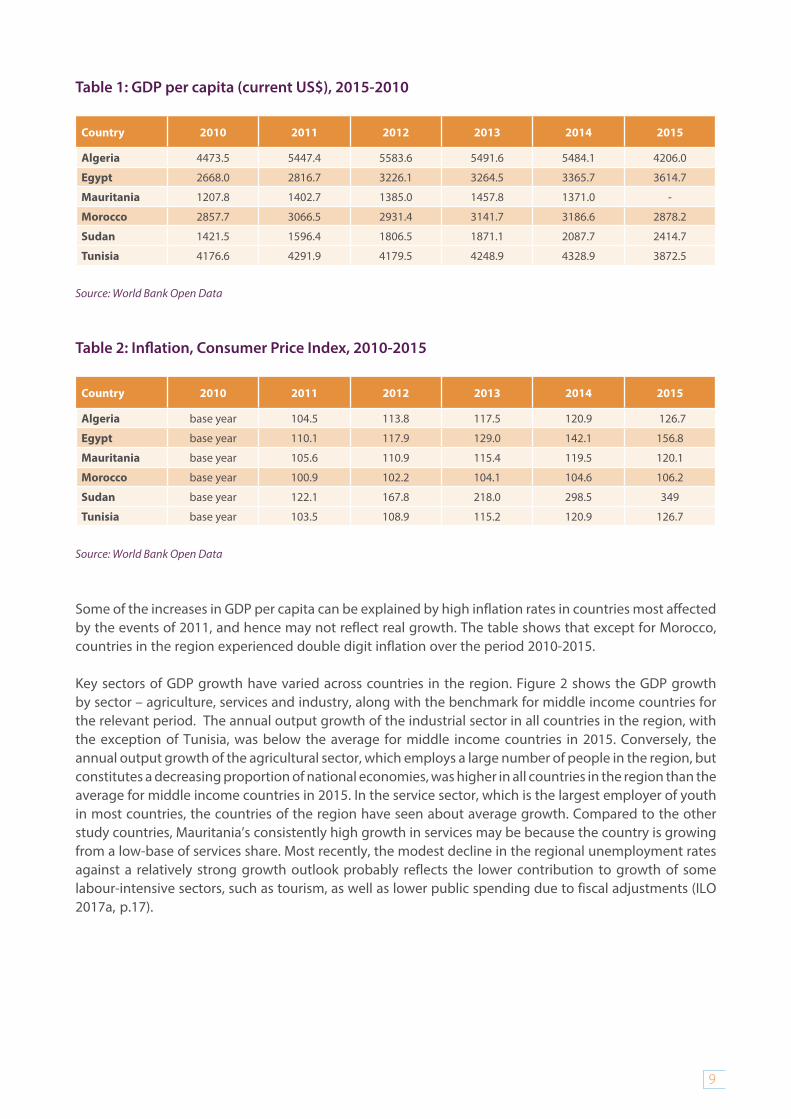
Table 1 shows the per capita GDP for the six studied countries and Table 2 the inflation and consumer price index, taking 2010 as the base year. Within the study-countries, Algeria and Tunisia are closer to the GDP per capita benchmark for middle income countries in 2015 (US$ 4800.1); Egypt and Morocco are closer to the GDP per capita benchmark for lower middle income countries (US$ 2001.8); and Sudan and Mauritania fall below the threshold for the benchmark for lower middle income countries (World Bank Open Data).
9
Table 1: GDP per capita (current US$), 2015-2010
Country 2010 2011 2012 2013 2014 2015
Algeria 4473.5 5447.4 5583.6 5491.6 5484.1 4206.0
Egypt 2668.0 2816.7 3226.1 3264.5 3365.7 3614.7
Mauritania 1207.8 1402.7 1385.0 1457.8 1371.0 -
Morocco 2857.7 3066.5 2931.4 3141.7 3186.6 2878.2
Sudan 1421.5 1596.4 1806.5 1871.1 2087.7 2414.7
Tunisia 4176.6 4291.9 4179.5 4248.9 4328.9 3872.5
Source: World Bank Open Data
Table 2: Inflation, Consumer Price Index, 2010-2015
Country 2010 2011 2012 2013 2014 2015
Algeria base year 104.5 113.8 117.5 120.9 126.7
Egypt base year 110.1 117.9 129.0 142.1 156.8
Mauritania base year 105.6 110.9 115.4 119.5 120.1
Morocco base year 100.9 102.2 104.1 104.6 106.2
Sudan base year 122.1 167.8 218.0 298.5 349
Tunisia base year 103.5 108.9 115.2 120.9 126.7
Source: World Bank Open Data
Some of the increases in GDP per capita can be explained by high inflation rates in countries most affected by the events of 2011, and hence may not reflect real growth. The table shows that except for Morocco, countries in the region experienced double digit inflation over the period 2010-2015.
Key sectors of GDP growth have varied across countries in the region. Figure 2 shows the GDP growth by sector – agriculture, services and industry, along with the benchmark for middle income countries for the relevant period. The annual output growth of the industrial sector in all countries in the region, with the exception of Tunisia, was below the average for middle income countries in 2015. Conversely, the annual output growth of the agricultural sector, which employs a large number of people in the region, but constitutes a decreasing proportion of national economies, was higher in all countries in the region than the average for middle income countries in 2015. In the service sector, which is the largest employer of youth in most countries, the countries of the region have seen about average growth. Compared to the other study countries, Mauritania’s consistently high growth in services may be because the country is growing from a low-base of services share. Most recently, the modest decline in the regional unemployment rates against a relatively strong growth outlook probably reflects the lower contribution to growth of some labour-intensive sectors, such as tourism, as well as lower public spending due to fiscal adjustments (ILO 2017a, p.17).

10
Yo
uth
an
d E
mp
loym
ent
in N
ort
h A
fric
a: A
Reg
ion
al O
verv
iew
Figure 2: Annual output growth in Agriculture, Industry, and Services (percentage), 2010-20154
Source: World Bank Open Data; No data was available for Sudan.
4 This graph measures the annual growth rate for value added by agriculture, services and industry based on constant local currency. Aggregates are based on constant 2010 U.S. dollars. An economy’s growth is measured by the change in the volume of its output or in the real incomes of its residents. The 2008 United Nations System of National Accounts offers three plausible indicators for calculating growth: the volume of gross domestic product (GDP), real gross domestic income, and real gross national income. The volume of GDP is the sum of value added, measured at constant prices, by households, government, and industries operating in the economy. GDP accounts for all domestic production, regardless of whether the income accrues to domestic or foreign institutions.

11
Low economic growth and weak gains in productivity have meant that the progress made in alleviating working poverty in the region has stagnated. Whereas, between 1991-2012, the rates of working poverty among youth was almost halved, there has been very little reduction in this rate since 2012 and almost one in every four working-youth in the region are estimated to be living in moderate or extreme poverty (ILO 2017a, p.42; ILO 2016, p. 8).
More generally, data on incidence of poverty varies across the region, given its different levels of GDP per capita. The 2016 Human Development Report (HDR) notes that in Morocco, 15.6 per cent of the population (5,090 thousand people) are multi-dimensionally poor while an additional 12.6 per cent live near multidimensional poverty (4,115 thousand people)5. In Sudan, 46.5 per cent of the population were estimated to be below the national poverty line. Data sources are not unified across the region and there are some information gaps, which limits comparability.
Demographics
Youth constitute between 16 per cent and 20 per cent of the total populations in the studied countries. Rapid growth in populations over the past decade means that the youth share has decreased in 5 of the 6 surveyed countries between 2005 and 2015. The 15–24-year-old age group has declined by almost 7 percentage points in Algeria, 4 percentage points in Egypt, 3 percentage points in Morocco and by 2 percentage points in Egypt.
Table 3: Youth share (15-24) in total population (per cent), by country, 2005, 2010, 2015
2005 2010 2015
Algeria 23.0 20.7 16.6
Egypt 21.6 20.3 17.4
Mauritania 20.0 19.7 19.4
Morocco 20.3 19.2 17.4
Sudan 19.4 19.3 20.1
Tunisia 20.7 18.7 15.5
Source: UNDESA 2017
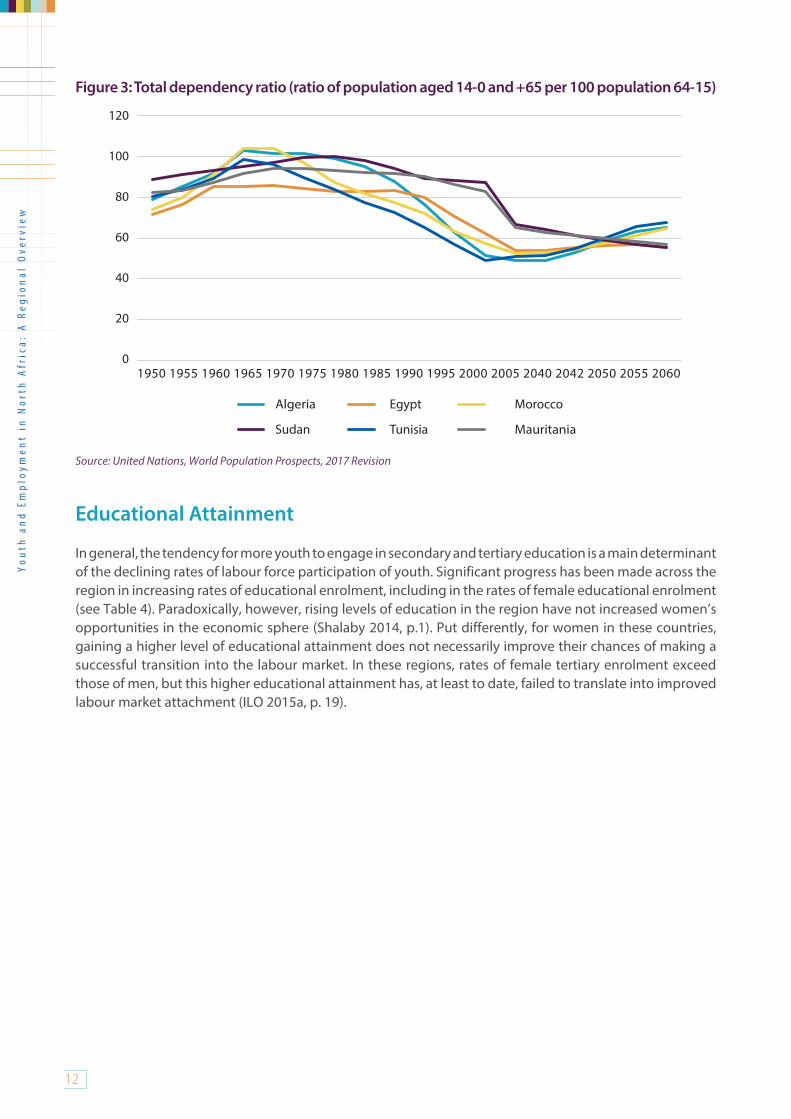
The total dependency ratios, defined as the share of the number of dependants, aged 0–14 and over the age of 65 (65+), in the total population aged 15–64 is displayed in Figure 3 for the sampled countries. It is evident from the figure that some of the countries are at a demographic turning point. Declining dependency ratios since the 1970s have created a demographic dividend for these North African nations. Characterized by a growing labour force, increased savings and rapid economic growth, this window of opportunity is now closing for Egypt, as their dependency ratios begin to rise. It will therefore be necessary to provide the current youth with adequate employment opportunities to support older populations in the second half of the twenty-first century.
5 Based on Multidimensional Poverty Index data, which identifies multiple overlapping deprivations suffered by households in the three dimensions of education, health and living standards and uses a deprivation score of 33.3% to distinguish between the poor and non-poor. The multidimensional poverty headcount is generally higher than income poverty.
12
Yo
uth
an
d E
mp
loym
ent
in N
ort
h A
fric
a: A
Reg
ion
al O
verv
iew
Figure 3: Total dependency ratio (ratio of population aged 14-0 and +65 per 100 population 64-15)
Source: United Nations, World Population Prospects, 2017 Revision
Educational Attainment
In general, the tendency for more youth to engage in secondary and tertiary education is a main determinant of the declining rates of labour force participation of youth. Significant progress has been made across the region in increasing rates of educational enrolment, including in the rates of female educational enrolment (see Table 4). Paradoxically, however, rising levels of education in the region have not increased women’s opportunities in the economic sphere (Shalaby 2014, p.1). Put differently, for women in these countries, gaining a higher level of educational attainment does not necessarily improve their chances of making a successful transition into the labour market. In these regions, rates of female tertiary enrolment exceed those of men, but this higher educational attainment has, at least to date, failed to translate into improved labour market attachment (ILO 2015a, p. 19).

13
Table 4: Gross enrolment ratio6 (percentage, both sexes)
2005 2010 2015 (or latest available year)Primary Secondary Tertiary Primary Secondary Tertiary Primary Secondary Tertiary
Algeria 107.75 78.78 20.76 115.46 97.17 29.84 116.1599.86 (2011)
36.92
Egypt 100.3 -- 29.72 107.11 71.5 30.9103.93 (2014)
86.1(2014)
36.23
Mauritania 90.75 22.25 2.93 96.3 20.33 4.43 102.45 30.65.47
(2013)
Morocco 105.03 49.84 11.72 112.28 62.69 14.41 114.769.06 (2012)
28.14
Sudan 61.98 37.53 11.73 69.9 41.18 14.9970.4
(2013)42.7
(2014)16.32 (2014)
Tunisia 111.75 84.8 31.83 107.23 90.43 35.17 114.17 88.2 34.6
Source: World Bank Open Data (extracted from UNESCO Institute for Statistics).
Labour markets in the region are consistently marked by high unemployment rates among educated youth, although on average, the bulk of the unemployed have lower education. In other words, the proportion of youth with higher education who are unemployed is higher than the proportion of youth with lower educational attainment who are unemployed, but, a larger number of youth with lower education are unemployed overall (Subrahmanyam and Castel 2014, p. 3). In Egypt, for instance, in 2015, the unemployment rates for youth with basic education was 14.9 per cent, for those with intermediate education it was 37.5 per cent, and for youth with advanced education, the unemployment rate was 56.7 per cent (ILOSTAT). Table 12 shows that unemployment is highest among graduates of secondary and tertiary education in Egypt, Tunisia and Sudan. Unemployment in Algeria and Morocco is highest among those with only primary education.
6 The gross enrolment ratio is the ratio of total enrolment, regardless of age, to the population of the age group that officially corresponds to the level of education shown. This can exceed 100% due to the inclusion of over-aged and under-aged students because of early or late school entrance and grade repetition. Gross enrollment ratios indicate the capacity of each level of the education system, but a high ratio may reflect a substantial number of overage children enrolled in each grade because of repetition or late entry rather than a successful education system.

14
Yo
uth
an
d E
mp
loym
ent
in N
ort
h A
fric
a: A
Reg
ion
al O
verv
iew
Table 5: Unemployment by level of educational attainment (% of total unemployment)
Country Education Level 2010 2011 2012 2013 2014 2015
Algeria
primary education .. 55.7 .. .. .. ..
secondary education .. 18.5 .. .. .. ..
tertiary education .. 23.1 .. .. .. ..
Egypt
primary education 3.5 7.5 8.7 4.1 .. ..
secondary education 53.2 50 51.9 47.1 .. ..
tertiary education 39.7 32.1 33.2 31.1 .. ..
Morocco
primary education 51.1 49.2 50.1 .. .. ..
secondary education 21.7 24 23.3 .. .. ..
tertiary education 17.5 18.3 18.5 .. .. ..
Sudan
primary education 21.5
secondary education 21.6
tertiary education 38.8
Tunisia
primary education 24.1 22.4 .. .. .. ..
secondary education 39.4 42.5 .. .. .. ..
tertiary education 32 30.9 .. .. .. ..
Source: ILO Labour Statistics; no data was available for Mauritania.
Several factors could have a role in the elevated unemployment rates for the educated. Those youth may have higher expectations of attaining particular kinds of work, and may also have support mechanisms (such as family) which allows them to search for jobs longer or ‘wait’ until they get jobs which match their expectations. Further, jobs may simply not exist for the highly educated – either because companies are unable to develop these posts (or do so rarely), or because there is a mismatch between the skills acquired by the highly educated youth, and those sought by the companies. In a study covering some countries in the MENA region, Dimova, Elder and Stephan (2016) found, for instance, that the majority of those unemployed had unreasonable expectations of obtaining employment in the public sector, and the majority of students in the region wanted to work in careers that could be described as highly skilled. Similarly, Barsoum (2016) documents the desirability for public sector jobs among graduates in Egypt. This also reaffirms the potential mismatch between young people’s aspirations and demand conditions across the region. Elder and Kring (2016) also argue that the high rates of unemployment among young women with tertiary education may be influenced by the limited number of “acceptable” occupations for women in the region, such as public administration jobs, teaching and work in the health-care sector.
15
Economic Participation and Employment
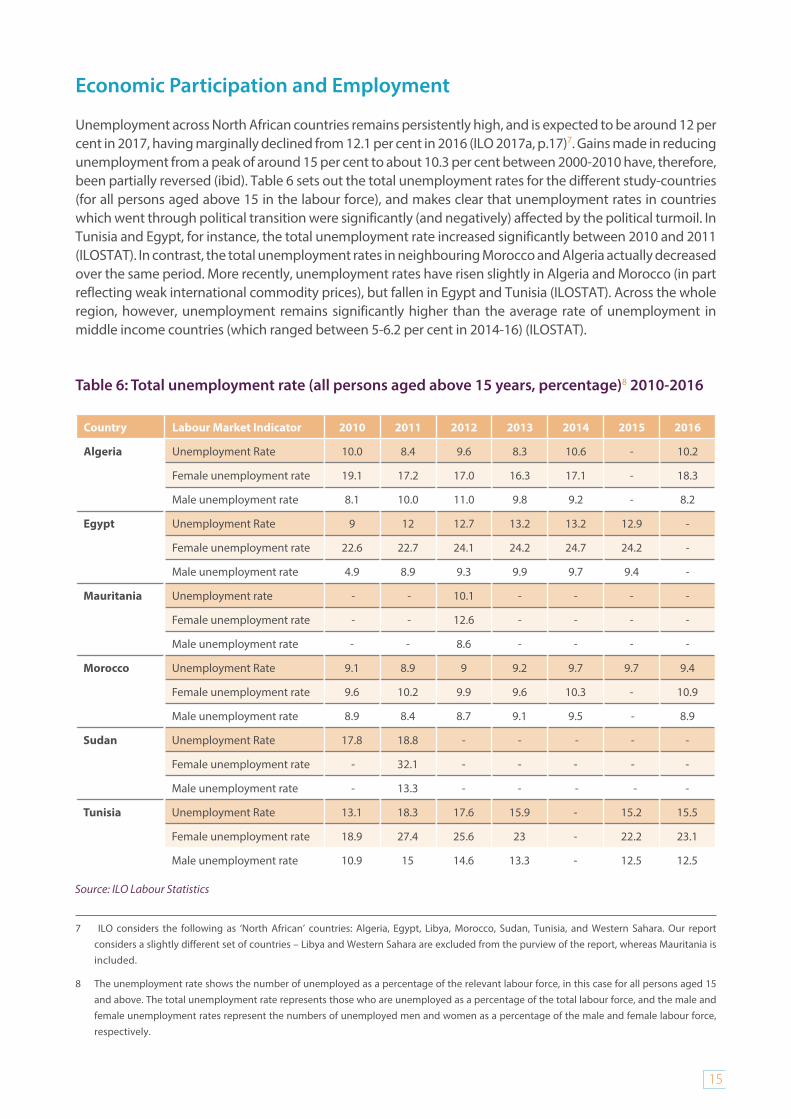
Unemployment across North African countries remains persistently high, and is expected to be around 12 per cent in 2017, having marginally declined from 12.1 per cent in 2016 (ILO 2017a, p.17)7. Gains made in reducing unemployment from a peak of around 15 per cent to about 10.3 per cent between 2000-2010 have, therefore, been partially reversed (ibid). Table 6 sets out the total unemployment rates for the different study-countries (for all persons aged above 15 in the labour force), and makes clear that unemployment rates in countries which went through political transition were significantly (and negatively) affected by the political turmoil. In Tunisia and Egypt, for instance, the total unemployment rate increased significantly between 2010 and 2011 (ILOSTAT). In contrast, the total unemployment rates in neighbouring Morocco and Algeria actually decreased over the same period. More recently, unemployment rates have risen slightly in Algeria and Morocco (in part reflecting weak international commodity prices), but fallen in Egypt and Tunisia (ILOSTAT). Across the whole region, however, unemployment remains significantly higher than the average rate of unemployment in middle income countries (which ranged between 5-6.2 per cent in 2014-16) (ILOSTAT).
Table 6: Total unemployment rate (all persons aged above 15 years, percentage)8 2010-2016
Country Labour Market Indicator 2010 2011 2012 2013 2014 2015 2016
Algeria Unemployment Rate 10.0 8.4 9.6 8.3 10.6 - 10.2
Female unemployment rate 19.1 17.2 17.0 16.3 17.1 - 18.3
Male unemployment rate 8.1 10.0 11.0 9.8 9.2 - 8.2
Egypt Unemployment Rate 9 12 12.7 13.2 13.2 12.9 -
Female unemployment rate 22.6 22.7 24.1 24.2 24.7 24.2 -
Male unemployment rate 4.9 8.9 9.3 9.9 9.7 9.4 -
Mauritania Unemployment rate - - 10.1 - - - -
Female unemployment rate - - 12.6 - - - -
Male unemployment rate - - 8.6 - - - -
Morocco Unemployment Rate 9.1 8.9 9 9.2 9.7 9.7 9.4
Female unemployment rate 9.6 10.2 9.9 9.6 10.3 - 10.9
Male unemployment rate 8.9 8.4 8.7 9.1 9.5 - 8.9
Sudan Unemployment Rate 17.8 18.8 - - - - -
Female unemployment rate - 32.1 - - - - -
Male unemployment rate - 13.3 - - - - -
Tunisia Unemployment Rate 13.1 18.3 17.6 15.9 - 15.2 15.5
Female unemployment rate 18.9 27.4 25.6 23 - 22.2 23.1
Male unemployment rate 10.9 15 14.6 13.3 - 12.5 12.5
Source: ILO Labour Statistics
7 ILO considers the following as ‘North African’ countries: Algeria, Egypt, Libya, Morocco, Sudan, Tunisia, and Western Sahara. Our report considers a slightly different set of countries – Libya and Western Sahara are excluded from the purview of the report, whereas Mauritania is included.
8 The unemployment rate shows the number of unemployed as a percentage of the relevant labour force, in this case for all persons aged 15 and above. The total unemployment rate represents those who are unemployed as a percentage of the total labour force, and the male and female unemployment rates represent the numbers of unemployed men and women as a percentage of the male and female labour force, respectively.

16
Yo
uth
an
d E
mp
loym
ent
in N
ort
h A
fric
a: A
Reg
ion
al O
verv
iew
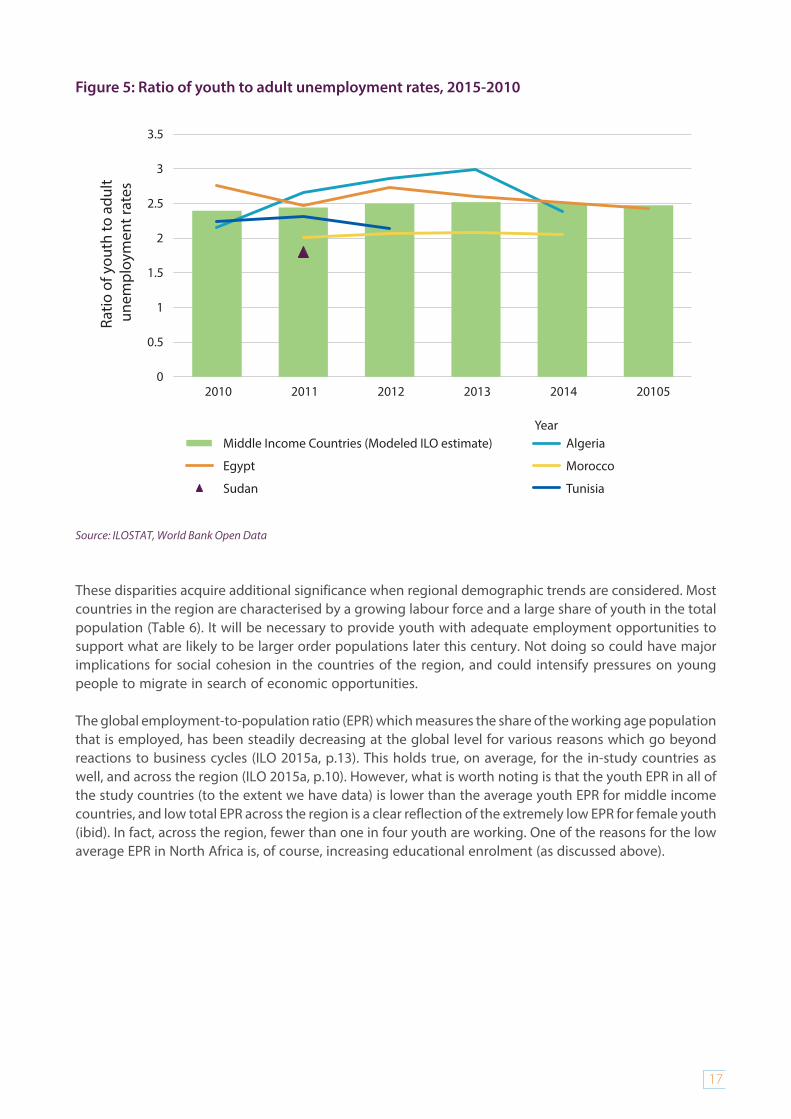
Youth and women have been particularly affected by these challenging labour market conditions, and providing decent jobs for them is likely to be a major medium-term challenge for the studied countries. In 2016, unemployment among youth in the region was 29.3 per cent, the second highest across all regions (ILO 2016a, p.5). This was particularly affected by the political unrest in North Africa in, and after 2011. As Figure 4 shows, for instance, the youth unemployment rate increased dramatically in Tunisia between 2010 and 2011, from 29.4 per cent to 42.3 per cent, and in Egypt, from 24.9 per cent in 2010 to 29.7 per cent in 2011. More recently, there has been a slight improvement in regional figures attributable to improvements in Tunisia and Algeria, where, despite these improvements, youth unemployment remains stubbornly high. In contrast, the youth unemployment rate for middle-income countries has increased slightly from 13.6 per cent in 2014 to 13.8 per cent in 2016. Figure 5 shows the ratio of youth to adult unemployment rates in the study countries (for the years for which we have both sets of data).
Figure 4: Youth unemployment rate (percentage), 2010-2015
Source: ILOSTAT. No data for Mauritania was available for these years.
17
Figure 5: Ratio of youth to adult unemployment rates, 2015-2010
Source: ILOSTAT, World Bank Open Data
These disparities acquire additional significance when regional demographic trends are considered. Most countries in the region are characterised by a growing labour force and a large share of youth in the total population (Table 6). It will be necessary to provide youth with adequate employment opportunities to support what are likely to be larger order populations later this century. Not doing so could have major implications for social cohesion in the countries of the region, and could intensify pressures on young people to migrate in search of economic opportunities.
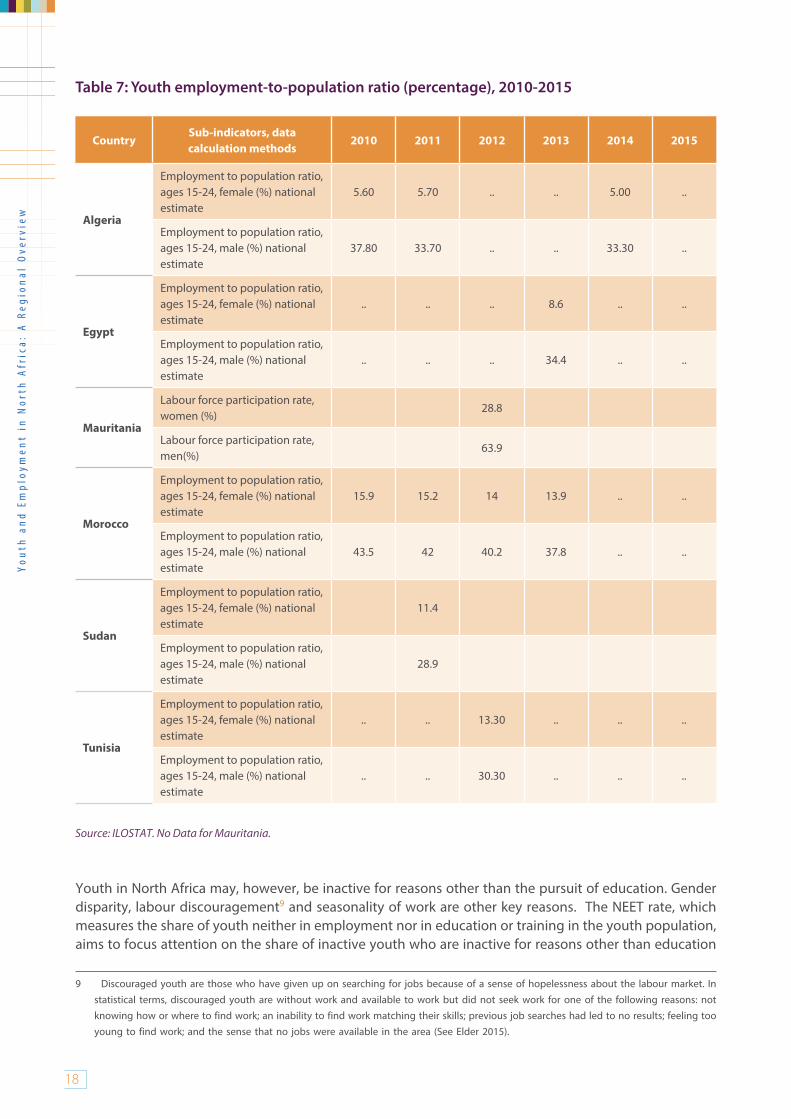
The global employment-to-population ratio (EPR) which measures the share of the working age population that is employed, has been steadily decreasing at the global level for various reasons which go beyond reactions to business cycles (ILO 2015a, p.13). This holds true, on average, for the in-study countries as well, and across the region (ILO 2015a, p.10). However, what is worth noting is that the youth EPR in all of the study countries (to the extent we have data) is lower than the average youth EPR for middle income countries, and low total EPR across the region is a clear reflection of the extremely low EPR for female youth (ibid). In fact, across the region, fewer than one in four youth are working. One of the reasons for the low average EPR in North Africa is, of course, increasing educational enrolment (as discussed above).
18
Yo
uth
an
d E
mp
loym
ent
in N
ort
h A
fric
a: A
Reg
ion
al O
verv
iew
Table 7: Youth employment-to-population ratio (percentage), 2010-2015
CountrySub-indicators, data calculation methods
2010 2011 2012 2013 2014 2015
Algeria
Employment to population ratio, ages 15-24, female (%) national estimate
5.60 5.70 .. .. 5.00 ..
Employment to population ratio, ages 15-24, male (%) national estimate
37.80 33.70 .. .. 33.30 ..
Egypt
Employment to population ratio, ages 15-24, female (%) national estimate
.. .. .. 8.6 .. ..
Employment to population ratio, ages 15-24, male (%) national estimate
.. .. .. 34.4 .. ..
Mauritania
Labour force participation rate, women (%)
28.8
Labour force participation rate, men(%)
63.9
Morocco
Employment to population ratio, ages 15-24, female (%) national estimate
15.9 15.2 14 13.9 .. ..
Employment to population ratio, ages 15-24, male (%) national estimate
43.5 42 40.2 37.8 .. ..
Sudan
Employment to population ratio, ages 15-24, female (%) national estimate
11.4
Employment to population ratio, ages 15-24, male (%) national estimate
28.9
Tunisia
Employment to population ratio, ages 15-24, female (%) national estimate
.. .. 13.30 .. .. ..
Employment to population ratio, ages 15-24, male (%) national estimate
.. .. 30.30 .. .. ..
Source: ILOSTAT. No Data for Mauritania.
Youth in North Africa may, however, be inactive for reasons other than the pursuit of education. Gender disparity, labour discouragement9 and seasonality of work are other key reasons. The NEET rate, which measures the share of youth neither in employment nor in education or training in the youth population, aims to focus attention on the share of inactive youth who are inactive for reasons other than education
9 Discouraged youth are those who have given up on searching for jobs because of a sense of hopelessness about the labour market. In statistical terms, discouraged youth are without work and available to work but did not seek work for one of the following reasons: not knowing how or where to find work; an inability to find work matching their skills; previous job searches had led to no results; feeling too young to find work; and the sense that no jobs were available in the area (See Elder 2015).

19
(for example, to look after households or to care for children), as well as on youth who are without work and looking for work, i.e. the unemployed10. Table 7 below sets out the NEET rates for the study countries (where available).
Table 8: Share of youth not in employment, education or training (NEET) (percentage), 2010-2015
2010 2011 2012 2013 2014 2015
Algeria 24.5 26 22.7 21.5 22.8 21.2
Egypt 32.1 31.6 27.9 26.9
Morocco 28.84
Sudan 62.7
Tunisia 25.4
Source: ILOSTAT; World Bank Open Data. No data was available for Mauritania. For the calculation of the NEET rate for Morocco, see
World Bank 2015, p. 7.
All listed countries in Table 8, other than Algeria, register a NEET rate higher than the benchmark for middle income countries of 23 per cent. In this too, the rate of female NEETs dwarves the share of male youth who are not in employment, education or training. For 2015, which is the last year for which we have data, the male to female youth NEET rates in Algeria were 10.8 per cent compared to 32.1 per cent, and in Egypt 18.9 per cent and 35.2 per cent11. In comparison, in middle income countries, the male youth NEET rate in 2015 was around 16.1 per cent, and the female youth NEET rate was around 30 per cent (data extracted from ILOSTAT; author’s calculations based on data for 44 countries). In North Africa, young women are categorised as NEETs principally because they are inactive non-students. The numbers of young men, in contrast, are more evenly spread between the unemployed non-student and inactive non-student categories (Dimova, Elder and Stephan 2016, p.24-25). In general, these NEET figures are particularly worrisome because inactivity at an early stage in life has a negative impact on employability, future earnings and access to quality jobs (ILO 2016c, p.30).
It is worth noting that comparisons of the unemployment rate between countries may give misleading, or at least incomplete, information about the health of the economy and the related labour market opportunities open to youth. In North Africa, it is not merely that youth unemployment rates in the region are high; the quality of jobs available to youth are poor. This can be observed by looking at two indicators. First, and as we pointed out above, there has been very little reduction in the rate of working poverty among youth since 2012. This suggests the prevalence of (a) low earnings or self-employed workers with low employment-related income, and (b) prevalence of time-related underemployment (ILO 2013b). Moreover, data on employment informality, further discussed below, show that even those youth who are in paid employment are particularly vulnerable to precarious work.
10 The indicator merges two distinct categories: the unemployed and the inactive non-students; these result from distinct determinants and respond to different policy responses (Elder, 2015). It is also worth noting that although the definition of youth is usually taken as a person aged between 15-24, for many NEET and other school-to-work surveys, the upper limit is extended to 29. This recognizes the fact that some young people remain in education beyond the age of 24.
11 Note that the ILO School-to-Work Transition Surveys calculated the NEET rate for Egypt as 33.9 per cent (male youth NEET rate: 14.8 per cent, female youth NEET rate: 54.5 percent) on the basis of surveys conducted in 2012, and 2014. For Tunisia in 2013, the calculated NEET rate was 32.2 per cent (male youth NEET rate: 22.5 per cent, female youth NEET rate: 42.3 per cent) (see Dimova, Elder, and Stephan 2016, p. 25).

20
Yo
uth
an
d E
mp
loym
ent
in N
ort
h A
fric
a: A
Reg
ion
al O
verv
iew
Labour Productivity
Generally, countries in the region are characterized by low productivity growth (Dimova, Elder and Stephan 2016, p. 11). Labour productivity in Algeria and Tunisia are higher than the average labour productivity for upper middle-income countries, which was US$9,750.057 in 2015. Other countries had higher labour productivity than the average for lower middle income countries, which was US$3,433.31 in 2015.
Table 9: Labour productivity in US Dollars (GDP per employed person), 2010-2015
Country 2010 2011 2012 2013 2014 2015
Algeria 11665 11770 12042 11753 12127 12444
Egypt 4848 5041 5081 5098 5119 5196
Mauritania 3144 3192 3259 3349 3464 3442
Morocco 7244 7455 7658 7941 8058 8255
Sudan 4295 4101 3903 3919 3929 4015
Tunisia 12177 12440 12487 12475 12691 12561
Source: ILO Labour Statistics 12
Some empirical evidence suggests that a focus on lower-productivity sectors, and above all on the development of the agricultural sector, can be an effective sector-specific strategy for promoting youth employment, particularly in MICs. However, such a focus runs the risk of encouraging low-wage, low-quality employment growth, and the concentration of youth in low productivity jobs across the region remains a significant challenge for the goal of improving job quality (O’Higgins 2017, p.29).
The Gender Perspective
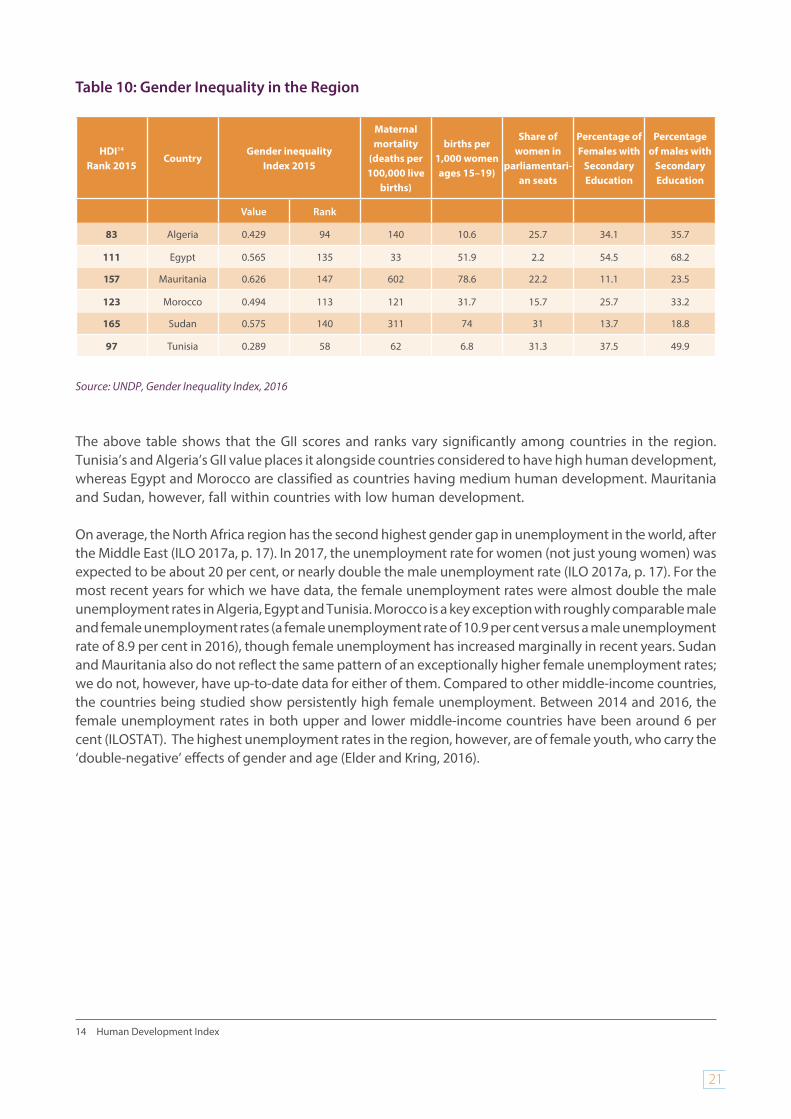
The gender inequality index (GII)13 for countries in the region reflects some of the economic barriers to gainful employment. It also reflects some other worrying socio-cultural trends in lower income countries in the region, such as early marriage and adolescent birth. These factors further limit women’s participation in the labour market.
12 Based on Output per worker (GDP constant 2005 US $) -- ILO modeled estimates, Nov. 2016
13 GII is a composite index measuring loss in achievements in three dimensions of human development — reproductive health, empowerment and labour market, due to inequality between genders.
21
Table 10: Gender Inequality in the Region
HDI14
Rank 2015Country
Gender inequalityIndex 2015
Maternalmortality
(deaths per 100,000 live
births)
births per 1,000 women ages 15–19)
Share ofwomen in
parliamentari-an seats
Percentage of Females with
Secondary Education
Percentage of males with
Secondary Education
Value Rank
83 Algeria 0.429 94 140 10.6 25.7 34.1 35.7
111 Egypt 0.565 135 33 51.9 2.2 54.5 68.2
157 Mauritania 0.626 147 602 78.6 22.2 11.1 23.5
123 Morocco 0.494 113 121 31.7 15.7 25.7 33.2
165 Sudan 0.575 140 311 74 31 13.7 18.8
97 Tunisia 0.289 58 62 6.8 31.3 37.5 49.9
Source: UNDP, Gender Inequality Index, 2016
The above table shows that the GII scores and ranks vary significantly among countries in the region. Tunisia’s and Algeria’s GII value places it alongside countries considered to have high human development, whereas Egypt and Morocco are classified as countries having medium human development. Mauritania and Sudan, however, fall within countries with low human development.
On average, the North Africa region has the second highest gender gap in unemployment in the world, after the Middle East (ILO 2017a, p. 17). In 2017, the unemployment rate for women (not just young women) was expected to be about 20 per cent, or nearly double the male unemployment rate (ILO 2017a, p. 17). For the most recent years for which we have data, the female unemployment rates were almost double the male unemployment rates in Algeria, Egypt and Tunisia. Morocco is a key exception with roughly comparable male and female unemployment rates (a female unemployment rate of 10.9 per cent versus a male unemployment rate of 8.9 per cent in 2016), though female unemployment has increased marginally in recent years. Sudan and Mauritania also do not reflect the same pattern of an exceptionally higher female unemployment rates; we do not, however, have up-to-date data for either of them. Compared to other middle-income countries, the countries being studied show persistently high female unemployment. Between 2014 and 2016, the female unemployment rates in both upper and lower middle-income countries have been around 6 per cent (ILOSTAT). The highest unemployment rates in the region, however, are of female youth, who carry the ‘double-negative’ effects of gender and age (Elder and Kring, 2016).
14 Human Development Index
22
Yo
uth
an
d E
mp
loym
ent
in N
ort
h A
fric
a: A
Reg
ion
al O
verv
iew
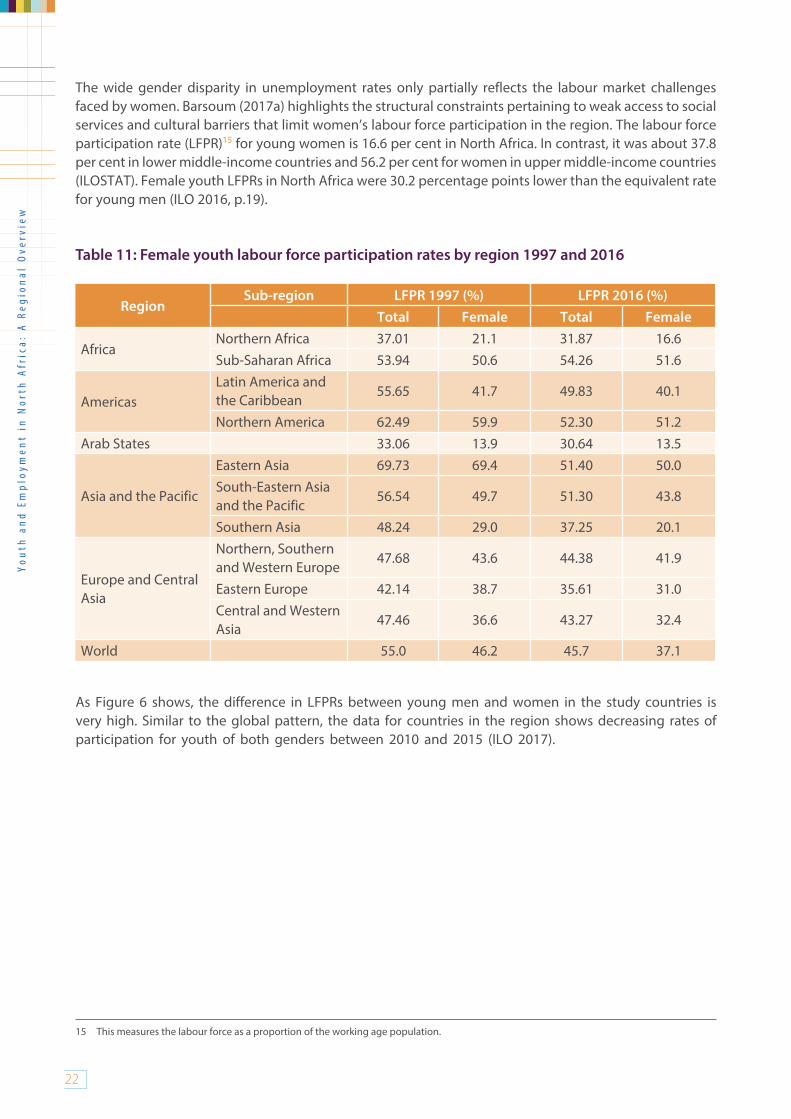
The wide gender disparity in unemployment rates only partially reflects the labour market challenges faced by women. Barsoum (2017a) highlights the structural constraints pertaining to weak access to social services and cultural barriers that limit women’s labour force participation in the region. The labour force participation rate (LFPR)15 for young women is 16.6 per cent in North Africa. In contrast, it was about 37.8 per cent in lower middle-income countries and 56.2 per cent for women in upper middle-income countries (ILOSTAT). Female youth LFPRs in North Africa were 30.2 percentage points lower than the equivalent rate for young men (ILO 2016, p.19).
Table 11: Female youth labour force participation rates by region 1997 and 2016
RegionSub-region LFPR 1997 (%) LFPR 2016 (%)
Total Female Total Female
AfricaNorthern Africa 37.01 21.1 31.87 16.6Sub-Saharan Africa 53.94 50.6 54.26 51.6
AmericasLatin America and the Caribbean
55.65 41.7 49.83 40.1
Northern America 62.49 59.9 52.30 51.2Arab States 33.06 13.9 30.64 13.5
Asia and the Pacific
Eastern Asia 69.73 69.4 51.40 50.0South-Eastern Asia and the Pacific
56.54 49.7 51.30 43.8
Southern Asia 48.24 29.0 37.25 20.1
Europe and Central Asia
Northern, Southern and Western Europe
47.68 43.6 44.38 41.9
Eastern Europe 42.14 38.7 35.61 31.0Central and Western Asia
47.46 36.6 43.27 32.4
World 55.0 46.2 45.7 37.1
As Figure 6 shows, the difference in LFPRs between young men and women in the study countries is very high. Similar to the global pattern, the data for countries in the region shows decreasing rates of participation for youth of both genders between 2010 and 2015 (ILO 2017).
15 This measures the labour force as a proportion of the working age population.

23
Figure 6: Gender gaps in youth labour force participation rates (male rate minus female rate, percentage points), 2010-2016
Source: ILOSTAT; No data was available for Sudan and Mauritania.
Self-employment
Table 10 sets out the rates of self-employment in some of the study countries (share of those self-employed or employed in micro-enterprises including owners to total employed)16. Available data (which is not disaggregated by age) suggests that Algeria falls slightly above the benchmark for middle income countries and Egypt slightly below it. Self-employment, is considered to be an effective policy mechanism for reducing poverty and promoting upward social mobility when combined with encouragement of entrepreneurship, provision of coaching, information and training to youth, and removing perceived practical barriers to setting up a business including easing access to credit and capital through provision of small grants. Globally, about 75 per cent of workers in lower and middle-income countries are deemed to be self-employed (Burchell, Coutts, Hall and Pye 2015, p. v) and this ranges between 40-60 per cent in middle income countries. It is important to note however that self-employment is not always a deliberately chosen career; self-employment largely overlaps with informal and most vulnerable forms of work (further discussed below). Also, in lower and middle-income countries, high incidences of underemployment may be concealed within the numbers of self-employed persons, since self-employment is the only way for youth to earn a subsistence-living (Burchell, Coutts, Hall and Pye 2015).
16 Microenterprise are defined nationally or are those enterprises with less than 3 full-time employees.

24
Yo
uth
an
d E
mp
loym
ent
in N
ort
h A
fric
a: A
Reg
ion
al O
verv
iew
Table 12: Self-employment as percentage of total employment rates, 2010-2015
Country 2010 2011 2012 2013 2014 2015
Algeria 33 .. 31 27.5 ..
Egypt 37.8 38.8 37.5 38.9 .. ..
Morocco 53.1 53.9 53.3 .. .. ..
Tunisia 31.5 28.8 28.6 27.9 .. ..
Source: World Bank: World Development Indicators (Self-employed); No data was available for Mauritania or Sudan.
Informal Work
Job quality and informality are a major concern for youth in the North Africa region. Data on informality and access to social protection are not disaggregated by age for most countries in the region; however, the global evidence suggests that young people and young entrants to the labour market are more likely to face informality and vulnerability (ILO 2016). Informality accounts for 40 per cent of non-agricultural jobs in North Africa, and only 30 per cent of workers in Morocco, 46 per cent in Tunisia and 50 per cent in Egypt have an employment contract (Subrahmanyam and Castel 2014, p.4). Nearly two thirds of women across North Africa are in vulnerable employment, compared to one-third of men. Data on active contributors to an old age pension scheme is also a good proxy measure for informality (Gatti et al., 2011). Table 13 shows latest available data on this indicator
Table 13: Active Contributors to an Old Age Pension Scheme in countries in the region
Country Contributors as % of working age population Year
Egypt 29% 2009
Morocco 15.6% 2011
Sudan 2.8% 2008
Tunisia 41.4% 2011
Sudan 160 49.55
Tunisia 60 67.35
Source: ILOSTAT – only countries with available data are shown on the table
Rural Employment
Rural employment includes farming, self-employment working in trade, small enterprises providing goods and services, wage labour in these and wage labour in agriculture (see FAO, IFAD, and ILO 2010, p.3). Across the region, there are significant disparities between urban and rural areas. Table 12 sets out the rural population in the study countries as a proportion of the total population in 2015 and 2016. In all countries other than Algeria, at least one third of the total population lives in rural areas, and the proportion is greater than half for Sudan and Egypt. Rural economies remain extremely important to the overall conditions of economic growth and employment in these countries.

25
Table 14: Rural population (percentage of total population), 2015-2016
Country 2015 2016
Algeria 29.27 28.7
Egypt 56.87 56.78
Mauritania 40.14 39.55
Morocco 39.8 39.32
Sudan 66.19 66
Tunisia 33.96 32.95
Source: World Bank Open Data
Rural economies present significant labour market segmentation for women: women work mostly as self-employed in agriculture and rural men work mostly as non-agricultural wage earners. In addition, work in rural economies often involves long hours and is not sufficiently remunerated. Unpaid work on family agricultural enterprises constitutes a significant proportion of women’s informal employment in some countries – in Egypt it was 85 per cent in 2005, compared to 10 per cent for men (ibid). This makes women’s work in rural areas extremely difficult to measure, and a large number of rural women are consequently classified as inactive in labour statistics and national surveys. Women are also paid less in rural economies. Globally, their earnings typically average about two thirds of male pay for comparable work (de Pryck and Termine 2014). These difficulties of measurement point to the importance of studying ‘time use’ in a developing country context (Ringhofer, 2013, pp. 1-3).
Tables 13 set out the share of agricultural employment in these countries (as a proportion of total employment). As mentioned, there are clear gender disparities when these rates are disaggregated by gender. In Egypt in 2014, for instance, agricultural employment accounted for 23.45 per cent of men compared to 43.22 per cent of women; in Morocco (2012) 31.88 per cent of men and 59.94 per cent of women were engaged in agricultural employment. Algeria, conversely, reports that three times as many men were employed in agriculture compared to women. This could be a consequence of the difficulties in capturing women’s rural employment (World Bank Open Data). Unfortunately, as is the case for most other indicators of rural employment and gender inequality, data on this indicator is not consistently available.
Table 15: Employment in Agriculture (percentage of total employment), 2011-15
Country 2011 2012 2013 2014 2015
Algeria .. .. 10.58 8.78 ..
Egypt 29.17 27.06 27.96 27.55 25.84
Morocco 39.76 39.2 38 37.2 ..
Sudan 44.6 .. .. .. ..
Tunisia 16.24 17.02 15.3 .. ..
Source: World Bank Open Data; No data was available for Mauritania
In concluding, urban-rural migration (which has become a common livelihood strategy in all the countries of the region) merits a brief mention. In the study countries, migration often occurs because of lack of economic opportunities, land shortages and poor infrastructure in rural areas, perceived better employment
26
Yo
uth
an
d E
mp
loym
ent
in N
ort
h A
fric
a: A
Reg
ion
al O
verv
iew
prospects elsewhere and improved communication. Although attention has focused on those who migrate, less attention has been given to those left behind, many of whom are women and children in most regions. While the effects of migration are ambiguous (for instance, food security may be compromised due to lack of labour, but household income may increase due to remittances) it is worth noting that out-migration by men from rural areas in the study-countries may increase the burden of labour on women.

27
3. Governance, Institutions and RightsLabour market institutions, the rules and regulations governing them and the extent to which these are applied are factors that are likely to affect the labour market experiences of young people more than those of older workers. Young people are usually new or recent entrants into the labour market, and as such, are less established in their working relations. They are more likely therefore to be the object of unfair practices, including unaccounted-for dismissal, imposition of excessive working hours, or of inequitable remuneration. Youth are also more often found in informal forms of work, where they may be entirely deprived from the protection of the law - from minimum wages to maximum working hours, access to social security or to secure and safe work environments. A large share of female workers is found in unpaid domestic work. Youth are also more exposed than other age groups to particularly distressing, unacceptable forms of work. Historically, much of the debate around the governance of youth labour markets and the systems of laws, rules and regulations which comprise labour market institutions has focused on the effects of these institutions on youth employment and unemployment. While some areas in this debate remain in dispute, there are some broad areas of consensus (O’Higgins and Moscariello 2017, p. 33).
Labour Norms and Standards
It is essential to recognise, that the experience of youth in the labour market is closely related to the effective enforcement and coverage of international and national labour standards (ILO 2013d, p.69). The interrelation between the enactment of labour legislation with other social, economic and labour policy is also important to note. For instance, the establishment or increase of a minimum wage, while warranted from a wider economic and labour market perspective, may have negative effects on young workers; as new or recent entrants, their productivity may stand around or below this minimum level of remuneration, making it more difficult for employers to recruit. Compensatory fiscal or social mechanisms can mitigate these effects, reducing the overall cost of young workers. O’Higgins and Moscariello (2017, p. 43) argue that employment protection legislation can also acts to mitigate the negative effects (on youth employment) of increasing the minimum wage.
In its ILO’s Call to Action (ILO 2012a), the rights of young people represent one key pillar of any concerted action by Governments and other stakeholders to promote youth employment. Areas of action from a rights-based approach include ensuring equal treatment for young people at work, ensuring effective enforcement of labour laws and collective agreements, promoting and protecting the rights of young workers to organize, ensuring that minimum wages are set by law or collective agreement and effectively enforced, etc. In addition, it points to the need for social dialogue at the national level to develop a wage policy framework that takes into account the specific context of young people, and for collective agreements to be extended to young workers.
Labour markets in the study countries are, on average, quite segmented (Assaad, 2014). This means that institutions affect different groups of people differently, within the same labour market. For example, men participate more, are more employed, and earn more than women. This holds true for prime-age adults compared to youth: workers who already have a job (typically middle-aged men) are stable in their positions and more likely to have access to social security, while newcomers (young, first-time job seekers) and women usually fare worse (Gatti, et al. 2013, p.141). An inclusive social dialogue process can help countries make the difficult political choices to overcome this segmentation and move towards greater social justice. Youth would need to play a meaningful role in such a process.

28
Yo
uth
an
d E
mp
loym
ent
in N
ort
h A
fric
a: A
Reg
ion
al O
verv
iew
Youth Voices
Not a great deal of data exists on the role of youth in decision-making processes at the regional level, nor on the degree to which young people are unionized - membership in unions is one way in which youth can participate in social dialogue and collective bargaining. The literature on youth participation in selected national contexts suggests, overall, that youth remain largely under-represented in political and social participation at national levels (American University of Beirut, forthcoming).
Social dialogue (the involvement of workers, employers and governments in decision-making on employment and workplace issues)17 is, of course, one of the founding principles of the ILO, and collective bargaining mechanisms are often used to arrive at collective agreements which govern the employment relationship between employers and workers (ILO 2013e, p. 5; Hayter 2011, p. 1). From a perspective of pluralism and freedom of association, and while resting on a long and rich history of social movements and social dialogue, the region would benefit from expanded and strengthened labour market institutions. Generalisations for the region are less appropriate in this domain than in others, as national legislations and actual practices vary greatly from country to country. It may be argued however that compared to other regions, some trade unions and employer organizations in North Africa have narrower bases of representation or less experience and exposure to the major economic and social policy dialogues and negotiations. Union membership is wider in the public sector and in privatized public enterprises. The unemployed, or workers in the informal economy often lack an organised voice (Gatti et al. 2013, p. 290). With some notable exceptions, local and sectoral bipartite and tripartite collective bargaining and dialogue are too rarely used to define relevant and mutually agreeable standards (including minimum wages, occupational safety and health, working hours and others). Workers’ and employers’ organizations will be required to adapt to the increasing pace of social and economic changes, from a youthful population having embraced new forms of socialization and communication, to the fast-paced global economy as it enters a new industrial revolution driven by artificial intelligence and other astounding technological advances.
Labour Inspection
Equally importantly, labour inspection mechanisms need strengthening in some of North African countries. Inspection services are often understaffed and underequipped. They tend to focus more on formal and large establishments, or sanctioning non-compliance, rather than on advising and coaching establishments towards improved compliance.
Minimum Wages
All countries in the region have regulations for minimum wage setting, although only Egypt and Morocco have signed and ratified ILO’s Minimum Wage Fixing Convention, 1970 (No.131). Algeria has a government-mandated minimum wage policy that dates back to the 1990s. The Egyptian labour law also mandates the establishment of a national council for wages. Morocco has a legal minimum wage policy and similarly, Tunisia too has a minimum wage policy, under which wages have been raised by the Ministry of Social Affairs annually from 2003 to 2012 by an average of 4.7 per cent per annum. It is worth noting, however, that only Morocco and Tunisia have signed and ratified ILO’s Collective Bargaining Convention, 1981 (No. 154).
17 It includes all types of negotiation, consultation and exchange of information among representatives of these groups on common interests in economic, labour and social policy.
29
Active Labour Market Policies
Youth employment has been brought to the fore of the economic and social agenda across the region in the wake of the events of 2011. This has been true even among countries not witnessing political transitions. Additional public funding and key policy changes to boost youth employment were introduced.
Active labour market policies (ALMPs) have been the focus of public interventions aimed at promoting the employment of the most vulnerable groups in the labour market. By providing or facilitating access to decent employment, they reduce poverty, create equity and offer security in a changing environment (Auer et al. 2008, page 18-20). ALMPs can include both supply-side and demand-side measures. Programmes are often categorized into four main groups: vocational training programmes; entrepreneurship promotion programmes (in the form of financial and non-financial assistance); employment services and intermediation; and subsidized employment and public works projects (Card, Kluve and Weber, 2010). In short, these include all social expenditure (other than education) which is aimed at the improvement of the beneficiaries’ prospect of finding gainful employment or to otherwise increase their earnings capacity (Kluve et al. 2016, p.24).
Global evidence suggests that investing in youth through active labour market policies does pay off. It is an investment that needs however careful design, solid enactment capacities, as well as time to achieve results (Kluve et al. 2016, p.24). A recent study on the impact of a youth-focused financial training programme in rural and semi-rural Morocco shows a positive impact on the financial behavior but only marginal employment effects in the short-term (Bausch et al., 2017). However, these policies remain out of the purview of social policies in the region (Barsoum, 2017b).
There is scarce publicly available data on spending on ALMPs in the region. According to Angel-Urdinola, Kuddo, and Semlali (2013, p. 30), Tunisia spent 0.8 per cent of gross domestic product (GDP) on active labour market policies and Morocco spent 0.1 per cent. This data is not available for other countries in the region. To benchmark this data, Kuddo (2012) notes that across the European Union 0.5 per cent of EU-27 GDP, was spent on ALMPs in 2009, which was the year of economic downturn. More recently, in 2015, OECD calculated that member countries spent (on average) 0.53 per cent of their GDP on active labour market policies (OECD Data). A number of countries in the region, notably Tunisia, Morocco and Algeria, have recently increased their allocated budgets for ALMPs and diversified their programme offerings.

30
Yo
uth
an
d E
mp
loym
ent
in N
ort
h A
fric
a: A
Reg
ion
al O
verv
iew
ConclusionYouth transitions to the labour market are difficult and long, while on the demand side, creating opportunities for decent work for youth remains a huge challenge. This is likely to be further compounded by a rapidly changing world of work, as new technology and new forms of employment are impacting labour markets at a record pace, triggering immediate and long-term effects on employment and decent work among youth. Prompt, targeted action will be needed ever more frequently to mitigate any consequences faced by individuals arising from the more frequent periods of joblessness, more frequent and possibly longer transitions.
Dealing with the youth employment policy challenge requires a coordinated strategy. As noted above, changes to social and economic institutions, policies and programmes interact with each other – both positively and negatively. These interactions need to be managed, as presenting both risks to be mitigated, and opportunities to be leveraged. Youth employment requires a transversal, whole-of-government approach, as it cuts across several ministerial mandates and involves a wide array of public organizations. The role of employers and workers organizations in the policy dialogue, but also in the mobilisation of the active forces of the economy for behavioural change, as well as in the implementation of certain services and programmes, cannot be overlooked. Policies and programmes must seek complementarities across actors and interventions. In doing so, they should build on a wealth of knowledge which is available internationally and on multiple good practices within the region, to avoid making common mistakes and squandering resources and opportunities. The regular, systematic production of evidence to inform the design as well as the monitoring, evaluation and revision of public policies and programmes applies to the field of youth employment as in other social and economic fields of practice.

31
References and Data SourcesDatabases Utilized
ILOSTAT: ILO Database of Labour Statistics, http://www.ilo.org/ilostat.
NORMLEX: ILO Information System on International Labour Standards, http://www.ilo.org/dyn/normlex/en/f?p=NORMLEXPUB:1:0::NO.
ILO What Works in Youth Employment, http://www.wwinye.org/resources.
OECD Data, https://data.oecd.org/.
UNDP, Multidimensional Poverty Index (MPI), http://hdr.undp.org/en/content/multidimensional-poverty-index-mpi.
World Bank Open Data, http://data.worldbank.org/.
References
Algerian Ministry of Work. 2016. Informations Statistiques. December. Available at http://www.anem.dz/ressources/pdf/2016/decembre-2016.pdf [30 August 2017].
American University of Beirut, Faculty of Health Sciences, Center for Public Health Practice. Forthcoming. Regional Analysis on Youth in Arab Countries, unpublished draft dated 31 March 2017.
ANAPEC. 2016. The National Plan for Job Creation 2020. Available at https://www.slideshare.net/ANAPEC/2020-58376270 [30 August 2017].
Angel-Urdinola, D.; Leon-Solano, R. 2013. “Overview,” in D. Angel-Urdinola; A. Kuddo; R. Leon-Solano (eds): Building Effective Employment Programs for Unemployed Youth in the Middle East and North Africa (World Bank Group, Washington, D.C.), pp. 1-28.
Angel-Urdinola, D.; Hilger, A.; Leon-Solano, R. 2013. “Public Employment Programs in Tunisia,” in D. Angel-Urdinola; A. Kuddo; R. Leon-Solano (eds): Building Effective Employment Programs for Unemployed Youth in the Middle East and North Africa (World Bank Group, Washington, D.C.), pp. 129-150.
Angel-Urdinola, D.; Kuddo, A.; Leon-Solano, R. 2013. “Public Employment Agencies in the Middle East and North Africa Region,” in D. Angel-Urdinola; A. Kuddo; R. Leon-Solano (eds): Building Effective Employment Programs for Unemployed Youth in the Middle East and North Africa (World Bank Group, Washington, D.C.), pp. 29-50.
Assaad, R. 2013. Making Sense of Arab Labor Markets: The Enduring Legacy of Dualism. IZA Discussion Paper No. 7573. August 2013
Assaad, R.; Krafft, C. 2016. Labour Market Dynamics and Youth Unemployment in the Middle East and North Africa: Evidence from Egypt, Tunisia and Jordan, Economic Research Forum Working Paper No. 993 (Economic Research Forum, Egypt). Also available online at http://erf.org.eg/publications/labor-market-dynamics-and-youth-unemployment-in-the-middle-east-and-north-africa-evidence-from-egypt-jordan-and-tunisia/ [31 August 2017]. Auer, P.; Efendioğlu, Ü.; Leschke, J. 2008. Active Labour Market Policies Around the World: Coping with the Consequences of Globalization (ILO, Geneva).
Baddock, E.; Lang, P.; Srivastava, V. 2015. Size of the Public Sector: Government Wage Bill and Employment (World Bank Group, Washington D.C.)
32
Yo
uth
an
d E
mp
loym
ent
in N
ort
h A
fric
a: A
Reg
ion
al O
verv
iew
Barsoum, G. 2015. “Striving for Job Security: The Lived Experience of Employment Informality among Educated Youth in Egypt”. International Journal of Sociology and Social Policy. Volume 35, issue 5/6, 2015. pp.340 – 358
Barsoum, G., 2016. The Public Sector as the Employer of Choice among Youth in Egypt: The Relevance of Public Service Motivation Theory. International Journal of Public Administration. Volume 39, Issue 3, pages 205-215
Barsoum, G. 2017a. “Youth‐focused active labour market programmes in a constraining welfare regime: A qualitative reading of programmes in Egypt,” in International Journal of Social Welfare, Vol. 26, no. 2, pp. 168-176.
Barsoum, G. 2017b. Educated young women’s employment decisions in Egypt: A qualitative account, SAHWA Scientific Papers. DOI: doi.org/10.24241/swsp.2017.13.1.
Barsoum, G.; Ramadan, M.; Mostafa, M. 2014. Labour market transitions of young women and men in Egypt, Work4Youth Publication Series No. 16, June (ILO, Geneva).
Bausch, J.; Dyer, P.; Gardiner, D. ; Kluve, J.; Kovacevic , S. 2017. The impact of skills training on the financial behaviour, employability and educational choices of rural young people Findings from a Randomized Controlled Trial in Morocco. International Labour Organization. Taqueem Initiative. Impact Report Series, Issue 6
Belghazi, S. 2013. “Public Employment Programs in Morocco,” in D. Angel-Urdinola; A. Kuddo; R. Leon-Solano (eds): Building Effective Employment Programs for Unemployed Youth in the Middle East and North Africa (World Bank Group, Washington, D.C.), pp. 101-114.
Boughzala, M. 2011. Labor Market Regulations and Institutions: The Case of Tunisia, Tunisia background paper (World Bank Group, Washington, D.C.).
Bteddini, L. 2016. Public employment and governance in Middle East and North Africa (World Bank Group, Washington, D.C.). Also available online at http://documents.worldbank.org/curated/en/339381472236811833/Public-employment-and-governance-in-Middle-East-and-North-Africa [31 August 2017].
Barsoum, G. 2017a. Educated young women’s employment decisions in Egypt: A qualitative account, SAHWA Scientific Papers. DOI: HYPERLINK «http://sahwa.eu/OUTPUTS/SAHWA-Scientific-Papers/Scientific-Paper-on-young-women-s-employment-decisions-in-Egypt»doi.org/10.24241/swsp.2017.13.1.
Burchell, B.; Coutts, A.; Hall, E.; Pye, N. 2015. Self-employment programmes for young people: A review of the context, policies and evidence, Employment Working Paper No. 198 (ILO, Geneva). Card, D.; Kluve, J.; Weber, A. 2010. Active Labor Market Policy Evaluations: A Meta Analysis, NBER Working Paper 16173 (National Bureau of Economic Research, Cambridge, MA).
Charmes, J.; Remaoun, M. 2016. L’économie informelle en Algérie, Estimations, tendances, politiques (ILO, Algiers). Commonwealth Secretariat. 2016. Global Youth Development Index and Report 2016 (London). Available at http://cmydiprod.uksouth.cloudapp.azure.com/sites/default/files/2016-10/2016%20Global%20Youth%20Development%20Index%20and%20Report.pdf [30 August 2017].
Darbo, S.; Eltahir, Y. 2017. African Economic Outlook: Sudan. Available at http://www.africaneconomicoutlook.org/en/country-notes/sudan [30 August 2017].
De Pryck, J.; Termine, P. 2014. “Gender Inequalities in Rural Labour Markets,” in A. Quisumbing, R. Meinzen-Dick, T.L Raney, A. Croppenstedt, J. Berman, A. Peterman (eds): Gender in Agriculture: Closing the knowledge gap (Springer, Dodrecht).
Dimova, R.; Elder, S.; Stephan, K. 2016. Labour market transitions of young women and men in the Middle East and North Africa, Work4Youth Publication Series No. 44 (Geneva, ILO).
33
Downie, A. 2017. African Economic Outlook: Egypt. http://www.africaneconomicoutlook.org/en/country-notes/egypt [30 August 2017].
Elder, S. 2015. What does NEETs mean and why is the concept so easily misinterpreted?, Work4Youth Technical Brief No. 1 (Geneva, ILO).
Elder, S.; Kring, S. 2016. Young and female: A double strike? Gender analysis of school-to-work transition surveys in 32 developing countries, Work4Youth Publication Series No. 32, January (ILO, Geneva).
Enders, K. 2008. IMF Survey: Egypt: Reforms Trigger Economic Growth. Available at https://www.imf.org/en/News/Articles/2015/09/28/04/53/socar021308a [30 August 2017].
Food and Agriculture Organization (FAO). 2017. Regional and Country Projects: Mauritania. Available at http://www.fao.org/agriculture/ippm/projects/mauritania/en/ [June 2017].
FAO, International Fund for Agricultural Development (IFAD) and the International Labour Office. 2010. Gender dimensions of agricultural and rural employment: Differentiated pathways out of poverty (FAO, Rome).
Gatti, R.; Angel-Urdinola, D.; Silva, J.; Bodor, A. 2011. Striving for Better Jobs: The Challenge of Informality in the Middle East and North Africa Region, Directions in development (World Bank Group: Washington, DC.) Also available at http://documents.worldbank.org/curated/en/445141468275941540/Striving-for-better-jobs-the-challenge-of-informality-in-the-Middle-East-and-North-Africa [30 August 2017].
Gatti, R.; Morgandi, M.; Grun, R.; Brodmann, S.; Angel-Urdinola, D.; Moreno, J.M.; Marotta, D.; Schiffbauer, M.; Lorenzo, E.M. 2013. Jobs for Shared Prosperity: Time for Action in the Middle-East and North Africa (World Bank Group: Washington, DC.).
Hayter, S. 2011. “Introduction,” in S. Hayter (eds): The Role of Collective Bargaining in the Global Economy: Negotiating for Social Justice (Edward Elgar Publishing, Cheltenham, UK, and ILO, Geneva). Institut National de la Statistique (INS). 2015. Enquête nationale sur la population et l’emploi (3ème trimestre 2015) (INS, Tunis). International Institute for Labour Studies. 2011. Tunisia: A New Social Contract for Fair and Equitable Growth, Studies on Growth with Equity (ILO, Geneva).
International Labour Office (ILO). 2008. ILO Declaration on Social Justice for a Fair Globalization, adopted by the International Labour Conference at its 97th Session, Geneva, 10 June 2008 (Geneva).
—. 2012a. The youth employment crisis: A call for action, Report V, International Labour Conference, 101st Session, Geneva, 2012 (Geneva).
—. 2012b. Tunisia. Country Brief. Available at http://www.ilo.org/addisababa/media-centre/WCMS_177334/lang--en/index.htm [August 2017].
—. 2013a. National Tripartite Social Dialogue: An ILO guide for improved guidance (Geneva).
—. 2013b. Decent Work Indicators: Guidelines for Producers and Users of Statistical and Legal Framework Indicators, ILO Manual, Second Version, December (Geneva).
—. 2013c. Youth Labour Market Analysis: A Training Package on Youth Labour Market Information (Geneva).
—. 2013d. Global Employment Trends for Youth 2013: A generation at risk (Geneva).
—. 2013e. Social Dialogue: Recurrent discussions under the ILO Declaration on Social Justice for a Fair Globalization, Report VI, International Labour Conference, 102nd Session, Geneva, 2013 (Geneva).
—. 2015a. Global Employment Trends for Youth 2015: Scaling up investments in decent jobs for youth (Geneva).
—. 2015b. Key Indicators of the Labour Market, 9th edition (Geneva).
—. 2015c. La jeunesse tunisienne et l’économie informelle (Geneva).

34
Yo
uth
an
d E
mp
loym
ent
in N
ort
h A
fric
a: A
Reg
ion
al O
verv
iew
—. 2016a. World Employment Social Outlook Youth: Trends for Youth 2016 (Geneva).
—. 2016b. Women’s entrepreneurship development assessment- Egypt, (ILO, Cairo). Also available at http://www.ilo.org/wcmsp5/groups/public/---ed_emp/---emp_ent/---ifp_seed/documents/publication/wcms_551168.pdf. [30 August 2017].
—. 2016c. World Employment Social Outlook: Trends 2016 (Geneva).
—. 2017a. World Employment Social Outlook Trends 2017 (Geneva).
—. 2017b. MSMEs and Entrepreneurship National Strategy and Operational Plan (2017-2022). Capturing Opportunities of Economic Transformation. UNPUBLISHED DRAFT.
International Monetary Fund (IMF). 2013. Sudan: Interim Poverty Reduction Strategy Paper, IMF Country Report No. 13/318, (IMF: Washington, D.C.). Also available at https://www.imf.org/external/pubs/ft/scr/2013/cr13318.pdf [30 August 2017].
—. 2015. Islamic Republic of Mauritania: Selected Issues Paper, IMF Country Report No. 15/36(IMF: Washington, D.C.). Also available at http://www.imf.org/en/Publications/CR/Issues/2016/12/31/Islamic-Republic-of-Mauritania-Selected-Issues-Paper-42705 [June 2017].International Trade Union Confederation (ITUC). 2017. List of Affiliated Organizations. Available at http://www.ituc-csi.org/IMG/pdf/list_of_affiliates_16th_gc_2_.pdf [June 2017].
Ismail, A.; Tolba, A.; Barakat, S. 2016. Global Entrepreneurship Monitor: Egypt National Report 2015/2016 (American University in Cairo: Cairo). Available at http://www.gemconsortium.org/country-profile/58 [June 2017].
Kluve, J.; Puerto, S.; Robalino, D; Romero, J.M.; Rother, F.; Stöterau, J.; Weidenkaff, F.; Witte, M. 2016. Interventions to improve the labour market outcomes of youth: a systematic review of training, entrepreneurship promotion, employment services, and subsidized employment interventions (ILO, Geneva).
LO/FTF, Ulandssekretariatet (Danish Trade Council for International Development and Cooperation). 2015. Morocco: Labour Market Profile 2015 (Copenhagen).
Malainine, S.C.; Ntah, M.N.; Diarra, B. 2017. African Economic Outlook: Mauritania. Available at http://www.africaneconomicoutlook.org/en/country-notes/mauritania [June 2017].
Mansuy, M. and Werquin, P. 2015. Labour market entry in Tunisia: The gender gap. International Labour Organization. Publication Series Youth Employment Programme. Employment Policy Department December 2015
Meknassi, R.; Rioux, C. 2010. Working Paper 14: Labour Relations and collective bargaining in Morocco, October (ILO, Geneva).
Ministry of Economy and Finance. n.d. Régime Fiscal de l’auto-entrepreneur. Morocco. Available on line at https://portail.tax.gov.ma/wps/wcm/connect/cd4e08b9-c580-4d77-bd98-a649d1e7e2f8/Guide+auto+entrepreneur15_Fr.pdf?MOD=AJPERES&CACHEID=cd4e08b9-c580-4d77-bd98-a649d1e7e2f8 [August 2017].
Ministry of Employment and Social Affairs. 2016. Morocco’s National Employment Strategy. Summary document (2016) (Morocco).
Ministry of Human Resources Development and Labour, Sudan. 2014. Sudan Labour Force Survey 2011 Report (Khartoum).
Musette, M.S. 2014. Employment Policies and Active Labour Market Programmes in Algeria (European Training Foundation, Brussels).
Observatoire National de l’Emploi et des Qualifications. 2014. Transition vers le marché du travail des jeunes femmes et hommes en Tunisie, YouthWork4Youth Series No. 15 (ILO, Geneva).
35
OECD/CAWTAR. 2014. Women in public life: Gender, law and policy in the Middle East and North Africa (OECD Publishing, Paris). Available at http://dx.doi.org/10.1787/9789264224636-en [June 2017].
Office National des Statistique (ONS). 2016. Activite, Emploi & Chômage en Septembre 2016. Bulletin 763, December (ONS, Algiers).
O’Higgins, N. 2017. “Overview,” in N. O’Higgins (eds): Rising to the Youth Employment Challenge: New Evidence on Key Policy Issues (ILO, Geneva), pp. 1-11.
O’Higgins, N.; Moscariello, V. 2017. “Labour market institutions and youth labour markets: Minimum wages and youth employment revisited,” in N. O’Higgins (eds): Rising to the Youth Employment Challenge: New Evidence on Key Policy Issues (ILO, Geneva), pp. 31-46.
Omri, M. 2015. “No ordinary union: UGTT and the Tunisian path to revolution and transition,” in Workers of the World: International Journal on Strikes and Social Conflict, Vol. 1 no. 7, pp. 14-29.
Republic of Tunisia, Ministry of Vocational Training and Employment. Undated. National Strategy for Employment: 2013-2017 (Tunis)Ringhofer, L. 2013. Introducing Functional Time use (FTU) Analysis: A Gender-Sensitive Approach to Labor Time ( Center for Gender in Global Context, East Lansing). ProQuest, online [5 Sep. 2017].
Shalaby, M. 2014. The Paradox of Female Economic Participation in the Middle East and North Africa, Issue Brief no. 03.07.14 (Rice University’s Baker Institute, Houston).
Subrahmanyam, G.; Castel, V. 2014. Labour market reforms in post-transition North Africa, AfDB Economic Brief (online). Available at https://www.afdb.org/fileadmin/uploads/afdb/Documents/Publications/Economic_Brief_-_Labour_market_reforms_in_post-transition_North_Africa.pdf [30 August 2017].
United Nations Department of Economic and Social Affairs of the United Nations Secretariat, Population Division (UNDESA). 2014. World Economic and Social Prospects (United Nations Secretariat, New York).
—. 2017. World Population Prospects: The 2017 Revision (United Nations Secretariat, New York).
United Nations Development Programme (UNDP) 2014. Update on Macroeconomic Developments in Sudan, Sudan Talks Series (UNDP, Khartoum). Available at http://www.undp.org/content/dam/sudan/docs/policy_roundtable/doc/Final%20Macroeconomic%20Update%202011-2013%20December%2024,2013.pdf [June 2017].
—. 2016. Human Development Report: Development for Everyone (New York).
United Nations Economic Commission for Africa (UNECA). 2013. The Economic Situation in Egypt in the Context of Political Instability and a Risky Transition (UNECA, Addis Ababa). Also available at http://www.uneca.org/sites/default/files/PublicationFiles/note-on-egypten.pdf [June 2017].
United Nations General Assembly. 2015. “Transforming our world: the 2030 Agenda for Sustainable Development,” Resolution adopted by the General Assembly on 25 September 2015, A/RES/70/1, 21 October. Available at http://www.un.org/ga/search/view_doc.asp?symbol=A/RES/70/1&Lang=E [4 September 2017].
World Bank Group. 2015. Morocco – Social Protection and Labour: Diagnostic, Draft, Social Protection and Labour Brief, May 26 (Online). Available at http://documents.worldbank.org/curated/en/485991468190443363/pdf/103119-WP-P133498-Box394855B-PUBLIC-A2I-REQUEST-SPL-Morocco-Draft-Policy-Note-v12.pdf [31 August 2017].
—. 2009. Doing Business 2010 (World Bank Group, Washington, D.C.)
—. 2013a. Doing Business in Egypt 2014: Understanding Regulations for Small and Medium-Size Enterprises (World Bank Group, Washington, D.C.).
—. 2013b. Doing Business 2014: Understanding Regulations for Small and Medium-Size Enterprises (World Bank Group, Washington, D.C.).

36
Yo
uth
an
d E
mp
loym
ent
in N
ort
h A
fric
a: A
Reg
ion
al O
verv
iew
—. 2014. Doing Business 2015: Going Beyond Efficiency (World Bank Group, Washington, D.C.).
—. 2015. Egypt Economic Monitor: Paving the Way to Sustained Recovery (World Bank Group, Cairo. Available at http://documents.worldbank.org/curated/en/653461467986287791/pdf/96946-WP-PUBLIC-Box391469B-Egypt-Economic-Monitor-Spring-2015.pdf [August 2017]. —
—. 2016. Doing Business 2017: Equal Opportunity for All (World Bank Group, Washington, D.C.).
Zouari, S. 2014. Employment Policies and Active Labour Market Programmes in Tunisia (European Training Foundation, Brussels).

