youth population, it is
TRANSCRIPT

As a statewide convener of
youth serving organizations,
Ready for Life seeks to identify
the initiatives, policies and
practices impacting quality of life
for Nevada’s children and youth.
By analyzing a composite set of
local and statewide data
reflecting important changes in
the youth serving social services
sector, our community can
specifically pinpoint and respond
to policy areas in need of
attention. Since many systems
may interact with the same
youth population, it is
youth population, it is
imperative to have a broader
understanding of each
system and how these
systems interact with each
other. Viewing the indicators
collectively as a measure of
overall youth well-being
reflects the strength of
Nevada as a place to live and
call home.

Table of Contents
YOUTH WELL-BEING INDICATORS ...................................................................................................................... 3
EDUCATION INDICATORS ..................................................................................................................................... 6
WORKFORCE DEVELOPMENT INDICATORS .................................................................................................... 12
CHILD WELFARE INDICATORS ........................................................................................................................... 14
JUVENILE JUSTICE INDICATORS ........................................................................................................................ 16
HOUSING AND ECONOMY INDICATORS ............................................................................................................ 20
EARLY CHILDHOOD INDICATORS ..................................................................................................................... 24
MATERNAL AND CHILD HEALTH INDICATORS............................................................................................... 26
BEHAVIORAL HEALTH INDICATORS ................................................................................................................ 30
READY FOR LIFE NEVADA ................................................................................................................................... 32
STATEWIDE COUNCIL MEMBERS ...................................................................................................................... 33
NEVADA PUBLIC EDUCATION FOUNDATION .................................................................................................. 34
SOURCES ................................................................................................................................................................ 35

YOUTH WELL-BEING INDICATORS
Ready for Life is a statewide movement in Nevada aimed at connecting local youth to education and/or employment by
25 years of age. Research demonstrates that youth who are not working or in school may have difficulty gaining the
skills and knowledge needed to attain self-sufficiency, placing enormous and unnecessary strains on public social service
delivery systems.
In today's society, the transition to adulthood is changing rapidly due to the increased educational requirements of an
increasingly knowledge-based economy. Most young adults experience detours on the road to economic independence,
including periods of unemployment and periodic interruptions in their education. These youth are at high risk of
becoming 'disconnected'.
Certain youth populations are at increased risk for disconnection, including:
As a statewide convener of youth serving organizations, Ready for Life seeks to identify the initiatives, policies and
practices impacting quality of life for Nevada’s children and youth. By analyzing a composite set of local and statewide
data reflecting important changes in the youth serving social services sector, our community can specifically pinpoint
and respond to policy areas in need of attention. Since many systems may interact with the same youth population, it is
imperative to have a broader understanding of each system and how these systems interact with each other.
High school dropouts
Pregnant and
Parenting Teens
Youth in Foster Care and Homeless
Youth
Youth Involved
with Juvenile Justice

This report was created to address questions such as the following:
o How has child and youth well-being in Nevada changed in the last several years?
o Did it improve or deteriorate?
o By approximately how much?
o Were certain social domains impacted more than others?
Ready for Life analyzed 27 key indicators across multiple youth serving systems. These indicators were chosen,
with direction from the Ready for Life Nevada Statewide Council, because they are easy to understand, based on
substantial research connecting them to child well-being, cut across important areas of children’s lives, and are
measured regularly in order to show trends over time. Additionally, many of the indicators chosen are aligned
with Ready for Life target populations, including: high school dropouts, youth in the child welfare system, youth
involved with the juvenile justice system, homeless youth, and pregnant and parenting teens.
Viewing the indicators collectively as a measure of overall youth well-being reflects the strength of Nevada as a
place to live and call home: its social institutions, families, schools and communities. Ready for Life will update
this report annually to measure and report on progress over time.
Ready for Life Nevada Youth Well-Being Indicators
Previous Year Most Recent Change*
Education Indicators
NAEP 4th grade Reading Scores 211 (2007)
211 (2009)
0.0%
NAEP 8th grade Reading Scores 252 (2007)
254 (2009)
0.8%
NAEP 4th grade math scores 232 (2007)
235 (2009)
1.3%
NAEP 8th grade math scores 271 (2007)
274 (2009)
1.1%
High School Graduation Rates 52.0% (2007)
51.3% (2008)
-0.7%
Residents who are High School Graduates 83.5% (2008) 83.9% (2009)
0.4%
4
4

*Green arrows represent positive change, red arrows indicate negative change, and yellow arrows indicate no change.
Previous Year Most Recent Change*
Workforce Indicators
Unemployment Rate for Nevada Youth Ages 16-19 23.9% (2009)
33.4% (2010)
9.5%
Unemployment Rate for High School Graduates 7.1% (2009) 11.8% (2009)
4.7%
Child Welfare Indicators
Number of children in out-of-home care 4,779 (2009)
5,089 (2010)
6.5%
Substantiated Reports 2,136 (2009) 1,810 (2010)
-15.3%
Juvenile Justice Indicators
Bookings (Arrests) 12,510 (2009)
10,943 (2010)
-12.5%
Youth Referred Back to DJJS 16.1% (2008)
13.5% (2009)
-2.6%
Habitual Truancy (Discipline Events) 3,612 (2009) 4,205 (2010)
16.4%
Housing and Economy Indicators
Number of Homeless Youth 7,734 (2010)
7,916 (2011)
2.4%
Children under 18 Living in Poverty 15.0% (2008)
17.6% (2009)
2.6%
Number of Children Receiving TANF 17,028 (2009) 19,991 (2010)
17.4%
Early Childhood Indicators
Nursery School, Preschool Enrollment 26,865 (2008)
29,468 (2009)
9.7%
Percent of Children Age 3-5 Not Enrolled in School 58.0% (2008) 56.0% (2009)
-2.0%
Maternal and Child Health
Teen Birth Rates 55.3 (2007)
53.5 (2008)
-3.3%
Enrollment in Medicaid 238,590 (2009)
280,285 (2010)
17.5%
Enrollment in Nevada Check Up 21,515 (2009)
21,002 (2010)
-2.4%
Children without Health Insurance 16.0% (2008)
17.8% (2009)
1.8%
Pregnant women receiving prenatal care 67.1% (2007) 67.8% (2008)
0.7%
Behavioral Health
Dependence on or Abuse of Illicit Drugs or Alcohol 9.4% (2007)
9.5% (2008)
0.1%
Domestic Violence Incidents 21,072 (2008)
24,141 (2009)
14.6%
Youth Experiencing a Major Depressive Episode 8.1% (2007)
8.2% (2008)
0.0%
Youth reporting alcohol use in the past 30 days 37.0% (2007) 38.6% (2009)
1.6%

206
209207 207
211 211213
217216
217
220 220
200
205
210
215
220
225
1998 2002 2003 2005 2007 2009
Nevada National
258
251 252 253 252 254
261 263 261 260 261 262
200
210
220
230
240
250
260
270
1998 2002 2003 2005 2007 2009
Nevada National
EDUCATION INDICATORS
Average reading and math scores for students in grades 4 and 8
Research indicates that increasing student performance by the fourth grade is critical for longer-term
educational success. The necessity of having a solid foundation of basic skills, including reading and math, is
increasingly important as today’s workforce requires new and more demanding skills. Reading and math skills
are measured nationally in the 4th and 8th grades by the U.S. Department of Education’s National Assessment of
Educational Progress (NAEP).
Nevada’s 4th and 8th grade average reading scores are presented below, in comparison to national 4th and 8th
grade average reading scores.
4th Grade Average Reading Scoresi 8th Grade Average Reading Scoresii
Nevada’s average reading test scores are significantly lower than the national average in both the 4th and 8th
grades. As evidenced by the figures above, this discrepancy is more pronounced among Nevada 4th grade
reading scores. Additionally, it is important to note that in 1998, 8th grade reading scores were only three points
lower than the national average – over the course of the last 11 years Nevada’s 8th grade average reading scores
have decreased while national scores have seen little variation.
A mere 24 percent of Nevada’s 4th graders are reading at or above proficiency, and by 8th grade that percentage
drops even more – only 22 percent of Nevada’s 8th graders tested at or above proficiency.iii Only four percent of
Nevada’s 4th graders tested at an advanced level of proficiency.iv Nevada female students achieved higher
reading scores than their male counterparts in both the 4th and 8th grade.v
6 6

220
228230
232235
224
234237
239 239
200
205
210
215
220
225
230
235
240
2000 2003 2005 2007 2009
Nevada National
265 268 270 271 274272276 278 280 282
200
220
240
260
280
300
2000 2003 2005 2007 2009
Nevada National
4th Grade Average Math Scoresvi 8th Grade Average Math Scoresvii
From 2000 to 2009, Nevada’s 4th grade average math scores increased 6.8 percent. During that same time period,
national average 4th grade math scores increased by a similar measure, at 6.7 percent. Test score increases are more
subtle in the 8th grade, increasing by 3.4 percent in Nevada and 3.7 percent nationwide. Similar to the trend observed
in reading scores, Nevada’s average mathematics test scores are also significantly lower than the national average in
both the 4th and 8th grades.
Nevada’s 4th graders are faring better in mathematics than reading, with 32 percent of Nevada’s 4th graders performing
at or above proficiency.viii By 8th grade that percentage decreases substantially – only 25 percent of Nevada’s 8th graders
are math proficient.ix
While female students performed better than their male counterparts in reading proficiency, no such distinction was
found in mathematics scores, with both genders achieving similar scores.
The percentage of 4th grade Nevada students who are proficient in mathematics increased from 2000 to 2009 for all
race/ethnicity groups. In general, Caucasian and Asian students had the highest percentage of proficient students in
both reading and mathematics in both 4th and 8th grades, while African American and Hispanic residents had much lower
rates of reading proficiency.x Students eligible for free/reduced-price school lunch, an
indicator of low income, had average test scores that were 16 - 20 points lower than that of students who were not
eligible for free/reduced-price school lunch. These trends persisted irrespective of grade or test subject.xi
Although NAEP results are commonly cited as a benchmark for elementary and middle school performance,
comparisons based on these tests may be somewhat flawed. NAEP does not administer tests every year and

tests are given only to a sampling of students, only in selected schools (140 of 608 Nevada public schools), only
in grades 4 and 8, and the content is not based on the Nevada curriculum.xii
High school graduation rates
Educational attainment is correlated with greater earnings potential, lower rates of joblessness, and an overall
healthier population and safer community.
According to the U.S. Department of Education, in 1998, Nevada’s high school graduation rate was on par with
the national average. While the United States as a whole has maintained, and even marginally increased (by 3
percent) its graduation rate, Nevada’s has declined substantially (19 percent).xiii
High School Graduation Ratesxiv
Today, Nevada has the worst graduation rate in the country, and has maintained claim to this title for the last
five successive years.xv In the space of one school year (2003 – 2004), Nevada’s national ranking dropped from
38 to 52. However, this drop of 15 percentage points in a single year was caused by a change in calculation
methods: prior to 2004, the Nevada Department of Education reported the completion rate rather than the
graduation rate.
Since 2004, Nevada has used the Leaver Rate, which calculates graduation rates by dividing the number of
diploma recipients by the number of completers plus the number of dropouts, and multiplying by 100 to
generate a percentage value. Beginning in 2011, calculation methods are changing again as Nevada shifts to the
graduation rate definition promoted by the National Governors Association and adopted by the vast majority of
states. This new method is more accurate, as it tracks a specific cohort of students over time.
71% 71% 70% 70% 72% 72%
57% 56% 56% 52% 51%
40%
50%
60%
70%
80%
1998 1999 2000 2001 2002 2003 2004 2005 2006 2007 2008
Nevada United States Average
8

Poor and often conflicting definitions have resulted in a range of confusing graduation rate calculations that do not
provide accurate measurement. Over the last few years, independent researchers have confirmed that many more of
the nation’s youth are dropping out during high school than had been reported. This is certainly true for Nevada, where
there is a 20% variation between state reported, federally reported, and independently reported rates. (According to
the Editorial Projects in Education Research Center, about 44 percent of all students in Nevada graduate from high
school with a regular diploma in four years.) While methodologies differ, NPEF has chosen to adhere to those published
by the U.S. Department of Education for the purposes of this report.
Despite the downward trend shown above, Nevada has made progress in improving its graduation rate over the last
several years. In 2008, Ready for Life Nevada, with statewide support, set a goal to achieve a 10 percent increase in
graduation rates by 2013. Using the Nevada Department of Education-reported rate of 67.4 percent for the Class of
2007 as the baseline year, Nevada is on track to achieve this goal, as shown in the chart below. Data for the Class of
2010 and the Class of 2011 has not yet been released. In 2010, Washoe County achieved an impressive seven percent
increase in high school graduation rates, due in part to a door-to-door campaign to locate and reconnect dropouts.
Nevada’s High School Graduation Rate As Reported by the Nevada Department of Education
67.4% 68.7%
71.4%
77.4%
60%
62%
64%
66%
68%
70%
72%
74%
76%
78%
80%
Class of 2007(Baseline Year)
Class of 2008 Class of 2009 Goal for 2013(Class of 2012)

Level of educational attainment
Nevada residents’ level of educational attainment closely approximates the national average, with the exception
of college graduates. The percentage of Nevada residents earning a bachelor’s degree is substantially lower (6
percentage points) than the national average.xvi
Lower graduation rates in Nevada may take up to ten years before showing an impact in the overall percentage
of residents 25 and older without a high school degree. Even then, the numbers may not be severely impacted,
as high school dropouts may still finish high school at a later date separate from their original cohorts, or in
alternative settings. Resident migration in and out of the state may also impact the levels displayed in the chart
below.
Level of Educational Attainmentxvii (Percentage of Residents 25 and Older, 2009)
15%
85%
28%
10%
16%
84%
22%
8%
0% 20% 40% 60% 80% 100%
Not a high school graduate
High school graduate or more
Bachelor's degree or more
Advanced degree or more
Nevada United States Average
10
10

Wise Investments &
Leveraging of Resources
National Best Practices
Implementation
REAL NEVADA NEEDS
Supported a training opportunity that led to a successful
grant award of $15 million for youth re-engagement.
Granted nearly $1 million in grants and leveraged $23.5
million in investments over the past six years.
REAL NEVADA IMPACT
Ready for Life and NPEF Response

WORKFORCE DEVELOPMENT INDICATORS
High school youth with early work experience
Research has shown that early work experiences are crucial to youth acquisition of 21st Century skills. School
and employment are fundamental activities that occupy the time of youth, and detachment from these activities
put youth at increased risk of disconnection. At risk for years of unemployment and social hardships, these
youth are frequently unable to reconnect to education or the workforce.
Nevada’s teenagers had the 5th highest unemployment rate in the nation during the 12-month period ending
January 2011, with an astounding 34.2 percent of teenagers in the labor force currently unemployed.xviii
Georgia’s teen unemployment rate of 37.3 percent was the highest in the nation, followed by California, South
Carolina and the state of Washington.xix High rates of youth unemployment are not surprising given the current
status of Nevada’s overall employment market. The silver state leads the nation in record high unemployment,
a spot it claimed from Michigan more than a year ago.
Unemployment Rate for Nevada Youth (Nevadans 16 - 19 Years of Age)
More than 48,000 Nevada youths ages 16-19 wish to obtain employment, or 36 percent of the total Nevada
population aged 16-19. Of these 48,000 youth, 34.2 percent, or 16,558 are unemployed. This rate has more
than doubled since the start of the Great Recession in December 2007.
0%
5%
10%
15%
20%
25%
30%
35%
40%
2006 2007 2008 2009 2010 2011
13.6%
17.2% 15.5%
18.7%
32.4% 34.2%
12

Overall, 25 states had teen unemployment rates that stood above 25 percent throughout 2010, with 1.94 million teens
wanting jobs, but not able to find them.xx Nationally, teen unemployment stood at 42.1 percent for African American
teens, 31.9 percent for Hispanics and 21.6 percent for Caucasians.xxi
Disconnected youth are at increased risk of interaction with other expensive social service systems, including, but not
limited to: welfare, corrections, emergency health care, substance abuse, mental health, Medicaid, unemployment
insurance payments, and/or homelessness.
Unemployment rate for high school graduates as compared to non-graduates
Those without high school diplomas or the equivalent are overrepresented among the adult unemployed population,
making up more than 16% of Nevada’s jobless adults. Higher levels of educational attainment are directly correlated
with increased rates of employment. While the impacts of Nevada’s current economic and financial crisis have been felt
by all residents, high school and college graduates have fared better than those who left school without obtaining a high
school diploma.
Nevada Unemployment Rates by Educational Attainment (Civilian Non-institutional Population 25 and Over)
6.7% 8.2%
6.4% 6.8%
8.9%
16.7%
6.7% 5.6% 4.4% 5.5%
7.1%
11.8%
2.4% 2.3% 2.8% 2.1% 3.2%
6.3%
0%
5%
10%
15%
20%
2004 2005 2006 2007 2008 2009
Less than a High School Diploma High School Graduates Bachelors Degree

CHILD WELFARE INDICATORS
Substantiated reports of child maltreatment
Child maltreatment comprises neglect (including medical neglect), as well as overt physical, sexual and
psychological abuse. Young people who are victims of abuse and/or neglect oftentimes have difficulty
transitioning from childhood and adolescence to becoming adults.xxii Children who are abused or neglected,
including those who witness domestic violence, often exhibit emotional, cognitive, and behavioral problems,
such as depression, suicidal behavior, difficulty in school, use of alcohol and other drugs, and early sexual
activity. These children are also more likely to repeat this cycle of violence by entering into violent relationships
as teens and adults or abusing their own children.xxiii
Approximately 1,800 reports of child abuse and neglect were substantiated in Nevada during 2010, nearly 25
percent of all reports.xxiv The majority of reports, 73.5 percent, originated in Clark County; Washoe County
reported 15.6 percent, and the rurals consisted of 12.1 percent of statewide substantiated reports.xxv
Substantiated Reports of Child Abuse and Neglectxxvi
An analysis of the data provided concludes that substantiated reports of child abuse and neglect have been
declining for the last four years, representing a 41 percent decrease between 2006 and 2010. Within the last
year alone, substantiated reports declined 15 percent. For many observers, this trend was not at all
anticipated. In fact, industry leaders as well as community members expected quite the opposite given the
severity of the Great Recession on the state of Nevada. Both local law enforcement and child protective
0
500
1,000
1,500
2,000
2,500
3,000
3,500
2002 2003 2004 2005 2006 2007 2008 2009 2010
Clark County Washoe County Rurals
14

services agree that they are not seeing the increases in incidents they expected. That said, the incidents they do see
appear to be more serious.xxvii That is, violent acts toward children and spouses or partners are resulting in more serious
injuries than commonly seen in the past.xxviii
Number of children in out-of-home care
Children who lack permanent connections with either family members or a caring adult face numerous barriers as they
struggle to become self-sufficient adults. This fact is even more pronounced when a child is removed from their home
and placed in foster care. Approximately 42 percent of foster youth do not finish high school.
National trends in recent years have placed an important emphasis on avoiding entry into the foster care system by
providing preventative services to families in crisis. For those youth already in care, there is a renewed sense of urgency
in expediting these children into more permanent placement settings, and exiting them from care. For older youth
especially, it is less likely that foster care systems will find a suitable foster family or relative and many youth age out of
the system.
As a result, the number of children in foster care nationwide has decreased by more than 19 percent from 2002 to 2009.
Conversely, the number of children in out of home care in Nevada has increased by 58 percent during the same time
period. As of December 31, 2010, 5,089 Nevada children were living in out of home foster care placements.
Approximately 29 percent of these children are between the ages of 13 and 17.
Total Children in Foster Care
-
100,000
200,000
300,000
400,000
500,000
600,000
0
1,000
2,000
3,000
4,000
5,000
6,000
2002 2003 2004 2005 2006 2007 2008 2009 2010
Nevada US

JUVENILE JUSTICE INDICATORS
Number of juvenile arrests
The link between education and delinquency problems is well established. Researchers have documented that
youth with educational difficulties have a heightened risk of behavior problems and crime. A five percent
increase in male high school graduation rates would produce an annual savings of almost $5 billion in crime-
related expenses.xxix Incarceration during late adolescence also appears to increase the risk for other high risk
behavior. The number one referral to the juvenile justice system is truancy.xxx Additionally, youth offenders in
custody use drugs and alcohol at higher rates than the general population.xxxi
Number of Juvenile Bookings (Arrests)xxxii
The majority of youth arrests occurred in Clark County, consistent with the population distribution of the state.
A report prepared by the Clark County Department of Juvenile Justice portrays the average youth brought to
booking as a Hispanic male, as approximately 78 percent of bookings involved male youths, and 38 percent of all
youth arrested are of Hispanic origin.
Youth success in leaving the juvenile justice system (recidivism rates)
The prevalence of serious juvenile delinquency could be reduced significantly by identifying and treating the
small percentage of juveniles who are at risk of becoming chronic offenders when they first come into contact
0
2,000
4,000
6,000
8,000
10,000
12,000
14,000
2008 2009 2010
Clark County Washoe County
71% 74% 75%
29% 26%
25%
16

with the juvenile justice system. Low juvenile recidivism indicates that juveniles are successfully leaving the juvenile
justice system.
Unfortunately, there is no national recidivism rate for juveniles. While the majority of jurisdictions do track the
measure, many use different meanings to define what constitutes a re-offense, making comparisons across jurisdictions
difficult if not impossible. That said, as a general measure, it is estimated that among juveniles with no prior referrals, 4
in 10 returned to juvenile court while 6 in 10 did not. Among juveniles 14 or younger with at least 1 prior referral, more
than three-quarters returned to juvenile court.xxxiii These general statements should be cautiously compared to the rates
presented below for Nevada, since it is unclear how the general measure was calculated and whether the same
definitions are being used.
Youth Referred Back to DJJS within One Year (Recidivism Rates)xxxiv
Washoe County experienced a dramatic decrease in rates of recidivism from 2008 to 2009. Department officials
identified two factors believed to have contributed to this successxxxv:
o Increased efforts with diversion services, providing appropriate services and programs to youth and families
which allow them to exit the system at the earliest possible point (usually before formal court proceedings).
o Development of specialty units to provide supervision to youth on formal probation with specific needs or
supervision requirements. Specialized units include: Sex Offender Unit, Mental Health Unit, Substance Abuse
Unit and Gang Unit.
16.0%
11.0%
15.0%
17.2%
0.0% 5.0% 10.0% 15.0% 20.0%
Clark County
Washoe County
2008 2009

Success using up front services, or diversion services, have ultimately decreased the number of formal cases
requiring supervision. Decreased caseload numbers and the development of specialty units allow Probation
Officers more time to focus on their caseloads and the needs of youth.
Truancy rates
Students who are continually absent from school and fall into truant status are more likely to be at risk of
dropping out. As mentioned previously, truancy is the number one referral to the Clark County Department of
Juvenile Justice. Truancy has been clearly identified as one of the early warning signs of students headed for
potential delinquent activity, social isolation, or educational failure via suspension, expulsion, or dropping
out.xxxvi Factors such as these explain why truancy is often labeled as the gateway to the juvenile justice system.
Truancy is more prevalent than most people realize. While there is not an abundance of national truancy data,
some metropolitan areas report thousands of unexcused absences each day. xxxvii
Nevada Habitual Truancy Discipline Events
The numbers depicted above represent only those incidents that have been reported to the Department of
Juvenile Justice, and subsequently, only a small portion of all Nevada truancy incidents. The majority of Nevada
truancies remain undiscovered and underreported.
1,524
2,117 1,961
2,607
662
875 774
519 911
951 877
1,079
0
500
1,000
1,500
2,000
2,500
3,000
3,500
4,000
4,500
2007 2008 2009 2010
Clark County Washoe County Rural
18

Organizational & Policy
Barriers Removed
A Community Ethic
that Values Education
REAL NEVADA NEEDS
Contributed to multi-system policy. Senate Bill 312
now provides credit-deficient students alternatives to
attaining necessary credits.
Created the Nevada Compact, reflecting a statewide
cross-sector commitment to education.
Facilitated the creation of a child care center at Desert
Rose High School and awarded grants directly
benefiting 105,000 students.
Increased Academic
Opportunities for At-Risk
Students
REAL NEVADA IMPACT
Ready for Life and NPEF Response

HOUSING AND ECONOMY INDICATORS
Homeless Youth
Stable housing is the foundation upon which people build their lives – absent a safe, decent, affordable place to
live, it is next to impossible to achieve good health, positive educational outcomes, or reach one’s economic
potential.xxxviii Homelessness has particularly adverse effects on children and youth including hunger, poor
physical and mental health, and missed educational opportunities. Schooling for homeless children is often
interrupted and delayed, with homeless children twice as likely to have a learning disability, repeat a grade, or
to be suspended from school.xxxix
School districts must adhere to the federal definition of homelessness when identifying homeless students,
which is anyone lacking a ‘fixed, regular and adequate nighttime residence’. This definition specifically includes
children and youth living in shelters, transitional housing, cars, campgrounds, motels, and sharing the housing of
others temporarily due to loss of housing, economic hardship, or similar reasons. Prior to 2007, the state’s
homeless student population had been relatively steady, with the exception of a spike in 2005 after Hurricane
Katrina, when hundreds of families relocated temporarily from New Orleans.xl But between 2007 and 2008, the
number of homeless students in Clark County jumped 45 percent, to 4,700. Washoe County soon followed, with
a 41 percent increase in enrolled homeless students from 2008 to 2009. Statewide, since the start of the Great
Recession, the number of homeless Nevada youth has increased 61 percent.
Homeless Youth Identified by School Districts in Nevadaxli
0
1,000
2,000
3,000
4,000
5,000
6,000
7,000
8,000
2007 2008 2009 2010 2011
3,352 4,801
5,708 5,897 6,063
1,561
1,364
1,926 1,837 1,853
Clark County Washoe County
20
School district officials estimate – and social service agencies agree- there are thousands of additional students who
meet the definition of homeless but are not identified, particularly in the higher grades.
This trend is not unique to Nevada - school districts across the country have reported increases in the number of
homeless students in the classroom due to the economic downturn and foreclosure crisis. In the latest survey by the
National Association for the Education of Homeless Children and Youth, 330 school districts reported that by the fall of
2008, they had already met or exceeded their homeless student count for the entire prior academic year. A whopping
459 school districts reported their homeless student populations were up at least 25 percent between the 2006-07 and
2007-08 academic years.
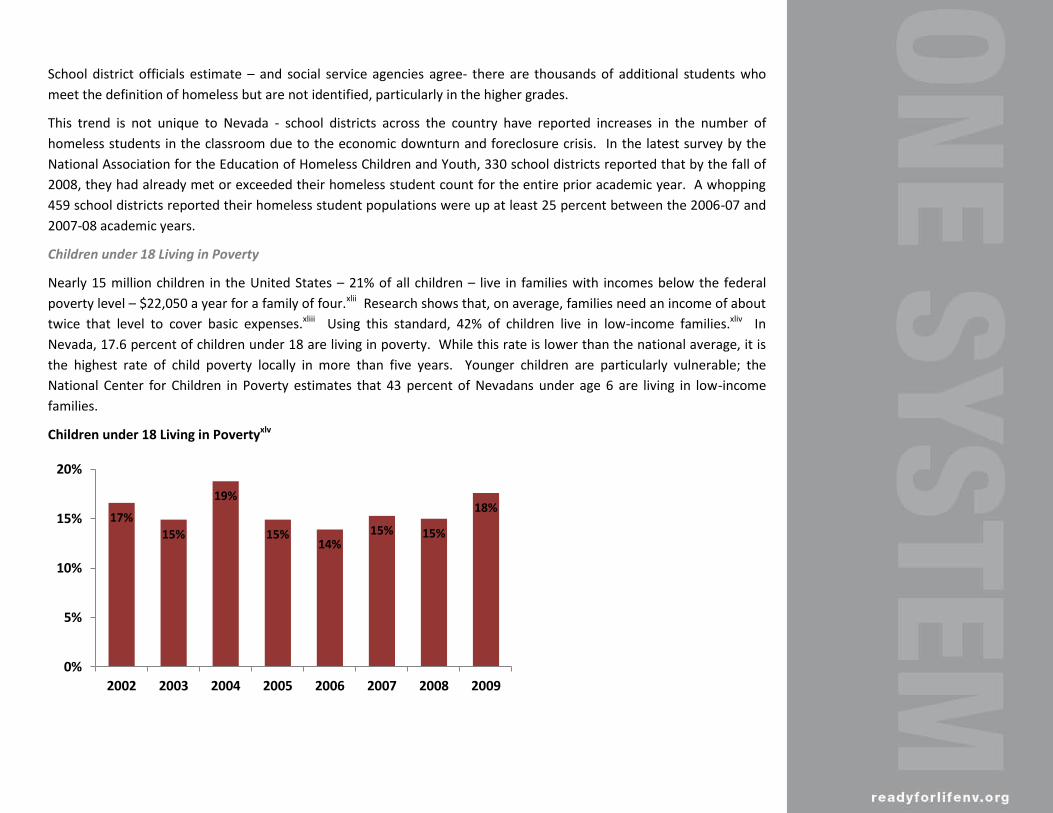
Children under 18 Living in Poverty
Nearly 15 million children in the United States – 21% of all children – live in families with incomes below the federal
poverty level – $22,050 a year for a family of four.xlii Research shows that, on average, families need an income of about
twice that level to cover basic expenses.xliii Using this standard, 42% of children live in low-income families.xliv In
Nevada, 17.6 percent of children under 18 are living in poverty. While this rate is lower than the national average, it is
the highest rate of child poverty locally in more than five years. Younger children are particularly vulnerable; the
National Center for Children in Poverty estimates that 43 percent of Nevadans under age 6 are living in low-income
families.
Children under 18 Living in Povertyxlv
17%
15%
19%
15% 14%
15% 15%
18%
0%
5%
10%
15%
20%
2002 2003 2004 2005 2006 2007 2008 2009

Growing up at or near the poverty line increases a child’s risk of experiencing many potential negative
outcomes, including decreased educational performance and cognitive problems, social and emotional
development difficulties, including behavior problems and mental health disorders, and, as an adult, to
experience economic disadvantages, earning less and experiencing greater unemployment.
Low levels of parental education are a primary risk factor for being low income. Eighty-three percent of children
whose parents have less than a high school diploma live in low-income families, and over half of children whose
parents have only a high school degree are low income as well. Low income African American and Latino
children are generally more susceptible to the consequences of economic fluctuations, as are the children of
immigrant families. Although low-income rates for minority children are considerably higher than those for
Caucasian children, this is due largely to a higher prevalence of other risk factors, for example, higher rates of
single parenthood and lower levels of parental education and earnings.xlvi
Average Number of Children Receiving TANF Assistance
The purpose of the Temporary Assistance to Needy Families (TANF) program is to:
o Provide assistance to needy families so that children may be cared for in their own homes or in the homes of
relatives
o End the dependence of low-income parents on government benefits by promoting job preparation, work
and marriage
o Prevent and reduce the incidence of out-of-wedlock pregnancies and establish annual numerical goals for
preventing and reducing the incidence of these pregnancies
o Encourage the formation and maintenance of two-parent families
Between 2002 and 2006, the number of children receiving TANF assistance was steadily decreasing. This trend
reversed in 2007, and 2010 marked the 4th year of annual increases, the majority of which were double digit
increases. From 2007 to 2010, the number of Nevada children receiving TANF assistance increased by 52
percent.
22

Average Monthly Number of Children Receiving TANF Assistance
Children make up three out of every four TANF recipients. In many cases, the child is the only beneficiary in the
household. So-called ‘children only’ cases, where the child is eligible for welfare benefits, but the adult parent is not,
account for almost half of the total TANF caseload.
Child-only cases are classified as either parental or non-parental. Parental child-only cases are those cases in which a
parent is present in the household, but is ineligible for TANF receipt due to a sanction, time limit, SSI receipt or alien
status. Non-parental cases are those cases in which no parent is present; the children are residing with a relative or
other adult with legal guardianship or custody.
Dramatic increases in caseloads such as those witnessed in Nevada may be partially attributable to the American
Recovery and Reinvestment Act of 2009 (ARRA). In February 2009, as part of the American Recovery and Reinvestment
Act of 2009 (ARRA), Congress created a new TANF Emergency Fund, funded at $5 billion and available to states,
territories, and tribes for federal fiscal years 2009 and 2010. The original TANF law provided for a Contingency Fund
funded at $2 billion which allows states meeting certain economic triggers to draw additional funds based upon high
levels of state Maintenance-of-Effort spending. This program expired on September 30, 2010.
0
5,000
10,000
15,000
20,000
25,000
2002 2003 2004 2005 2006 2007 2008 2009 2010

EARLY CHILDHOOD INDICATORS
Preschool Enrollment
Research has demonstrated that supporting healthy early childhood development—from before birth through
age 5—produces substantial educational, social and financial benefits for children and their communities.
Children enrolled in high quality early childhood education programs are more likely to complete higher levels of
education, have higher earnings, be in better health, form stable relationships, and are less likely to commit a
crime or be incarcerated.xlvii
The short-term effects of preschool are undeniable – children enrolled in quality preschool programs experience
larger cognitive gains during their time in preschool and are better prepared to enter kindergarten. While this
holds true for all enrollees, English language learners benefit significantly from early childhood programs. This is
an important characteristic for the state of Nevada, where 16.6 percent of students enrolled in Nevada school
districts are identified as Limited English Proficient (LEP).xlviii
In Nevada, a mere 37 percent of three and four year old children are enrolled in nursery school or preschool.xlix
While this rate has been increasing over the last several years, the majority of young Nevadans aged 3-5 are not
enrolled in nursery school, preschool, or kindergarten. Nursery school and preschool include any group or class
of institution providing educational experiences for children during the years preceding kindergarten. Places
where instruction is an integral part of the program are included, but private homes that primarily provide
custodial care are not included. Children enrolled in programs sponsored by federal, state or local agencies to
provide preschool education to young children--including Head Start programs--are considered as enrolled in
nursery school or preschool.
Nursery School and Preschool Enrollmentl
-
5,000
10,000
15,000
20,000
25,000
30,000
2002 2003 2004 2005 2006 2007 2008 2009
24

Children Age 3-5 Not Enrolled in Nursery School, Preschool or Kindergartenli
The low percentage of Nevada children age 3-5 enrolled in nursery school, preschool, or kindergarten ranks the state
last in the country when compared to the rest of the nation.
Children Age 3-5 Not Enrolled in Nursery School, Preschool or Kindergarten, by Statelii
0%
10%
20%
30%
40%
50%
60%
2007 2008 2009
59% 58% 56%
41% 39% 40%
Nevada United States
0%
10%
20%
30%
40%
50%
60%
New
Je
rse
yC
on
nec
ticu
tM
assa
chu
sett
sLo
uis
ian
aN
ew Y
ork
Pu
erto
Ric
oH
awai
iIll
ino
isG
eorg
iaM
aryl
and
New
Ham
psh
ire
Sou
th C
aro
lina
Ark
ansa
sM
issi
ssip
pi
Cal
ifo
rnia
Mic
hig
anN
ebra
ska
Pe
nn
sylv
ania
Vir
gin
iaW
isco
nsi
nC
olo
rad
oD
ela
war
eFl
ori
da
Iow
aK
ansa
sR
ho
de
Isla
nd
No
rth
Car
olin
aK
en
tuck
yM
inn
eso
taM
on
tan
aO
hio
Mis
sou
riO
klah
om
aTe
xas
Ve
rmo
nt
Ala
bam
aSo
uth
Dak
ota
Ten
nes
see
Mai
ne
New
Mex
ico
Ore
gon
Uta
hW
ash
ingt
on
We
st V
irgi
nia
Ind
ian
aA
rizo
na
Idah
oN
ort
h D
ako
taA
lask
aN
evad
a
US Average

MATERNAL AND CHILD HEALTH INDICATORS
Teenage Pregnancy Rates
Parenthood is a leading cause of dropping out of school among teenage women—30 percent of teen girls cited
pregnancy or parent-hood as a reason for dropping out of high school.liii Moreover, only 51 percent of women
who become mothers as a teenager eventually graduate from high school.liv Children born to teen mothers fare
even worse than their young mothers, these children are more likely to be born prematurely and at low
birthrate, and do worse in school: they are 50 percent more likely to repeat a grade, less likely to complete high
school, and have lower performance scores on standardized tests.lv
It is estimated that 27 percent of Nevada females are at risk for becoming teen mothers. The risk is even higher
for Hispanic and African American teenagers; while 37 percent of Nevada’s enrolled students are Hispanic, 54
percent of teenage births are born to Hispanic teenagers.lvi The public costs to Nevada taxpayers associated
with children born to teen parents exceeds $53 million per year.lvii Nevada has the 10th highest teenage birth
rate in the country.
Nevada Teenage Birth Ratelviii
In a recent survey conducted by Ready for Life, Nevada government agencies and non-profit organizations
serving pregnant and parenting teens expressed a strong desire to mobilize existing resources to better serve
this population, but acknowledged a critical lack of infrastructure to do so.
63
56 54 53 51 50
56 55 54
0
10
20
30
40
50
60
70
2000 2001 2002 2003 2004 2005 2006 2007 2008
Bir
ths
per
1,0
00
26

0
5,000
10,000
15,000
20,000
25,000
30,000
35,000
-
50,000
100,000
150,000
200,000
250,000
300,000
2005 2006 2007 2008 2009 2010
Medicaid Nevada Checkup
17%20%
63%
10%
34%
55%
0%
10%
20%
30%
40%
50%
60%
70%
Uninsured Public Private
Nevada United States
Enrollment in Medicaid / Nevada Checkup / Children without Health Insurance
Enrollment at Nevada Checkup (Children’s Health Insurance Program, or CHIP) decreased by 2.4 percent from the prior
year, and by 29 percent when compared to the start of the Great Recession. While at first glance this statistic may
appear refreshing, it is underscored by the fact that many of the families traditionally served by this program have now
experienced a job loss or other financial hardship, disqualifying them from one program only to be covered by another,
in this case, Medicaid. Nevada Medicaid recipients increased 17.5 percent compared to the prior year and are up 56
percent since the start of the recession.
Enrollment in Medicaid and Nevada Checkup Insurance Coverage of Children 0-18
More than 17 percent of Nevada’s children under the age of 18 are uninsured, a rate that is well above the national
average. Children without health insurance are less likely to have a regular health care provider, less likely to have a
regular dentist, or to have had a dental visit in the last year; and more likely to be in fair or poor health than low-income,
privately-insured children. When comparing Nevada’s statistics to the national average, it draws mention whether or
not Nevada’s larger uninsured population may in fact qualify for public health insurance programs, since Nevada’s rate
of public health insurance coverage is significantly lower than the national average. While nearly 82 percent of U.S.
residents eligible for Medicaid or CHIP are enrolled, only 55.4 percent of eligible Nevada residents are enrolled in
Medicaid or CHIP.lix In fact, some studies estimate that more than 80 percent of the current uninsured population are
indeed eligible for public health insurance coverage or live in families with incomes below 300 percent of the federal
poverty level (FPL).lx

Percentage of Pregnant Women Receiving Prenatal Care in the First Trimester
All children need a healthy start in life. A child’s health at birth can impact educational outcomes, and
compromised health can have far-reaching effects well into adulthood.lxi Prenatal visits during the first
trimester, which include clinical evaluation and treatment, are highly recommended. Dating the baby and
identifying risk factors are important to achieve in an early visit with a healthcare professional. Risk factors
such as illicit drug use, teen pregnancy, chronic medical health, being overweight, tobacco or substance use of
mothers-to-be, and lack of prenatal care contribute to poor birth outcomes.lxii Current data indicates the
percentage of mothers who begin prenatal care in the first trimester is 67.8 percent, while the national average
is 78 percent.lxiii When race and ethnicity are taken into account the percentage shows additional disparities;
only 58 percent of Hispanic women and 62 percent of African American women began prenatal care in the first
trimester in 2008.lxiv The statistics are even worse for teenage women; 54.5 percent of pregnant teenagers
receive prenatal care in the first trimester.lxv This is a disturbing trend as they are also more likely to give birth
to very low birth weight infants who are at-risk for lifelong health complications.
Percentage of Nevada Pregnant Women Receiving Prenatal Care in the First Trimesterlxvi
Thirty-two percent of Nevada’s pregnant women received inadequate or no prenatal care in 2007, resulting in
costly pregnancy complications and poor birth outcomes for many infants. There has been a downward trend in
the number of Nevada women receiving prenatal care in the first trimester since 1995. Inadequate numbers of
eligibility counselors are available to assist women getting emergency Medicaid in a timely manner.
71% 70%
72% 72%
66%
69% 69%
67% 68%
62%
64%
66%
68%
70%
72%
74%
2000 2001 2002 2003 2004 2005 2006 2007 2008
28

Navigation through
Segmented & Disjointed
Systems
Education & Workforce
Development Alignment
REAL NEVADA NEEDS
Opened dialogue between a local school district and
United Way that resulted in a national grant award for
family engagement.
Aligned goals and prioritized funding between Governor's
Workforce Investment Board, workforceCONNECTIONS,
education needs and goal to increase graduation rates.
Workforce Development Aligned youth job training with academic credits and
employment opportunities with summer school.
REAL NEVADA IMPACT
Ready for Life and NPEF Response

0%
10%
20%
30%
40%
50%
60%
1997 1999 2001 2003 2005 2007 2009
50% 53%48%
43%41% 37% 39%
0%
10%
2003 2004 2005 2006 2007 2008
10% 10% 10% 10% 9% 10%
BEHAVIORAL HEALTH INDICATORS
When children have multiple risk factors in their home and family environment, they are more likely to perform
poorly in school.lxvii Environmental factors such as family, peer group, school, and community characteristics
also contribute to the challenges that adolescents face.
Substance Abuse
Parental substance dependence and abuse can have profound effects on children, including child abuse and
neglect, injuries and deaths related to motor vehicle accidents, and increased odds that the children will become
substance dependent or abusers themselves.
Dependence on or Abuse of Illicit Drugs or Youth Reporting Alcohol Use in Alcohol in the Past Year, Age 12 and overlxviii the Past 30 Dayslxix
SAMHSA’s National Survey on Drug Use and Health (NSDUH) reports indicate that nationally, 11.9 percent of
children live with at least one parent who was dependent on or abused alcohol or an illicit drug during the past
year. Of these, the majority of youth lived with a parent who was dependent on or abused alcohol.lxx
The Nevada mean and the national mean do not differ significantly over the years considered and this is
reflected in the stability of Nevada’s ranking among the states. Nevadans between 18 and 34 and those
between 55 and 64 reported heavy drinking more frequently than those in the U.S. in general. Binge drinking is
by far most common in people 18 to 25 in Nevada, the U.S. and the Western states.
Emotional Disorders
A Major Depressive Episode is defined using the diagnostic criteria set forth by the 4th edition of the Diagnostic
and Statistical Manual of Mental Disorders (DSM-IV), which specifies a period of 2 weeks or longer during which
30

there is either depressed mood or loss of interest or pleasure and at least four other symptoms that reflect a change in
functioning, such as problems with sleep, eating, energy, concentration, and self-image.
Among youth, rates of depression in Nevada are consistent with national rankings, with 8.14% of youth aged 12 to 17
reporting a major depressive episode within the past year.
Domestic Violence
Domestic violence rates in Nevada have been steadily increasing for the last three years, and have increased 24.4
percent from 2008 to 2010. Nevada children are present during 46 percent of domestic violence incidents reported.
The weapon of choice in 82 percent of incidents includes physical bodily contact, using the hands, fist, or feet.
Domestic Violence Incidents and the Number of Children Presentlxxi
12,154
12,060
24,141
11,441
21,072
- 5,000 10,000 15,000 20,000 25,000
Children Present
Domestic Violence IncidentsReported
2008 2009 2010
26,223

READY FOR LIFE NEVADA
OUR SHARED YOUTH VISION
Ready for Life is anchored on best practice programs and seminal research from leading institutions across the
country, including the Annie E. Casey Foundation, the Intermediary Network, the Institute for Youth, Education
and Families, Urban Institute, and Youth Transition Funders Group. The framework is based on Connected by 25,
a report by Michael Wald and Tia Martinez of Stanford University, produced by the William and Flora Hewlett
Foundation, which has guided the efforts of many of the groups above, and is generally accepted as identifying
the drivers for change in communities that are required to improve the outcomes of disconnected or at risk
youth.
The goal of Ready for Life is to connect youth to education or productive employment by age 25. Ready for Life
seeks to “graduate all,” including increasing the graduation rate 10 percent by 2013, while helping to ensure
that youth have access to the post-secondary education or training and employment they need to successfully
transition to life on their own.
Ready for Life was launched in 2005 by the Nevada Public Education Foundation (NPEF) in partnership with
dozens of public and private organizations, as a collaborative cross-agency effort to improve Nevada's success at
engaging and graduating ‘ready for life’ students and re-engaging those who prematurely left school. The
working definition of cross-system collaboration for disconnected youth we are using is when two or more
public agencies commit and follow through on exchanging information, altering activities, sharing resources, and
enhancing each other's capacity for common or overlapping groups of young adults. Ready for Life partners
believe that as they work together, students will be more likely to complete high school and gain appropriate
post-secondary education or training to become productive, contributing members of society.
The statewide Ready for Life Nevada movement is facilitated by Nevada Public Education Foundation. In 2009,
Ready for Life Nevada united with the federal Shared Youth Vision partnership overseen by the Nevada
Department of Employment, Training and Rehabilitation. In so doing, NPEF and Ready for Life work closely with
the Governor’s Workforce Investment Board Youth Council, further solidifying the alliance among leaders in
both public and private sectors of education, workforce and youth development to strengthen Nevada’s
capacity to help our young people become “ready for life.”
32

READY FOR LIFE NEVADA: OUR SHARED YOUTH VISION STATEWIDE COUNCIL MEMBERS Sue Chambers, Churchill Ready for Life | Churchill County School District
Diane Comeaux/ Jill Marano, Nevada Department of Health and Human Services
Ken Dugan, Nevadaworks Youth Council | Sierra Nevada Job Corps
Ardell Galbreth, workforceCONNECTIONS
Terri Janison, Office of the Governor, Brian Sandoval
Dr. Lauren Kohut-Rost, Clark County School District, Retired
Kenneth LoBene, workforceCONNECTIONS Youth Council | U. S. Department of Housing and Urban Development
Dr. Magdalena Martinez, Nevada System of Higher Education
Dr. Karlene McCormick Lee, Nevada Public Education Foundation | Clark County School District, Retired
Dennis Perea, Nevada Department of Employment, Training and Rehabilitation
Christy McGill, Lyon and Storey Counties Ready for Life | Healthy Communities Coalition
Mike Pomi, Children’s Cabinet | Washoe County Ready for Life
Fritz Reese, Ready for Life Southern Nevada – Committee on Youth | Clark County Department of Juvenile Justice
Superintendent Keith Rheault, Nevada Department of Education
Eric James, Governor’s Workforce Investment Board Youth Council
Victor-Hugo Schulze II, Senior Deputy Attorney General
Stacy Smith, Nye and Esmeralda Counties Ready for Life | Nye Communities Coalition
Karen Stanley, Clark County School District
Craig Stevens, Nevada State Education Association
Assemblyman Lynn Stewart, Nevada Legislature
Denise Tanata Ashby, J.D., The Lincy Institute | Nevada Institute for Children’s Research and Policy
Frank Woodbeck, Nevada Commission on Economic Development
Joyce Woodhouse, Community Volunteer
Juanita Ydiando, Washoe County Ready for Life | Washoe County School District, Retired

NEVADA PUBLIC EDUCATION FOUNDATION
Our Mission - To secure and sustain resources that will assist, support and promote excellence in public
education programs in Nevada.
Our Vision and Ready for Life Values
o All youth are educated and ready to learn.
o All youth are experienced and ready for careers.
o All youth are connected to adults, peers, and educational services.
o All youth are confident and ready for life.
o A connected, operational infrastructure supports youth success.
The Nevada Public Education Foundation (NPEF) was created in state statute in 1991 and, as a 501(c)(3) non-
profit organization, is governed by a volunteer Board of Trustees and funded by grants and donations. In 2003,
NPEF gained traction on the high school dropout issue in Nevada. When a statewide education needs
assessment was conducted by NPEF in 2004 to determine where to focus efforts, it became clear that too many
youth were leaving high school without graduating. In response, the NPEF Board of Trustees committed to
focusing on helping youth become “ready for life” through successful transitions at each developmental stage
during their educational careers in Nevada and beyond.
After more research and in collaboration with a steering committee of community leaders and stakeholders,
NPEF launched Ready for Life™ in 2005, which quickly became a viable movement under NPEF’s visionary
leadership. Established first in Southern Nevada, Ready for Life (RFL) expanded statewide in 2007, with the first
statewide Ready for Life Nevada Dropout Prevention Summit in 2008. Convened and facilitated by NPEF, Ready
for Life now includes the leadership of a broad-based Statewide Council, with local collaboratives active in seven
Nevada counties.
As a statewide intermediary organization, Nevada Public Education Foundation:
o Connects schools, communities, government agencies, workplace partners, non-profits and youth
organizations to improve outcomes for youth.
o Convenes local, regional and statewide organizations doing similar work to maximize resources and
impact.
o Measures and improves programs and services.
o Sustains work by organizing public and private support and ensuring young people receive the education
and resources they need to become productive, contributing members of society.
34

SOURCES
i U.S. Department of Education, National Center for Education Statistics, National Assessment of Educational Progress ii Ibid
iii Ibid
iv Ibid
v Ibid
vi Ibid
vii Ibid
viii Ibid
ix Ibid
x Nevada State Health Division, Department of Health and Human Services, Healthy People Nevada, Moving from 2010 to 2020, March 2011
xi Institute of Education Sciences, The Nation’s Report Card: Nevada State Snapshot Report, National Center for Education Statistics, 2009
xii Applied Analysis, Education Briefing Series: K-12 Student Achievement Testing, Las Vegas Chamber of Commerce, March 2010
xiii U.S. Department of Education, National Center for Education Statistics, National Assessment of Educational Progress
xiv Ibid
xv Ibid
xvi U.S. Census Bureau, American Community Survey, "Educational Attainment for the Population 25 Years and Over," using American FactFinder
xvii Ibid
xviii Nevada Department of Employment, Training, and Rehabilitation, April 2011
xix Dave Berns, Nevada’s teen jobless rate of 32.9 percent among nation’s highest, Las Vegas Sun, April 2011
xx Ibid
xxi Ibid
xxii Chapple, Constance L, Vaske, Jamie, Child Neglect, Social Context, and Educational Outcomes: Examining the Moderating Effects of School and Neighborhood
Context Violence and Victims, 2010 xxiii
The Community We Will, The Campaign for What’s Possible for Children, Families, and Southern Nevada, Strategic Progress, 2009 xxiv
Nevada Division of Child and Family Services, UNITY Database, July 2011 xxv
Ibid xxvi
Ibid xxvii
Thomas D. Morton "Domestic violence, the recession and child welfare". Policy & Practice. FindArticles.com. 20 Jul, 2011, http://findarticles.com/p/articles/mi_m0PCD/is_2_69/ai_n57341842/ xxviii Ibid xxix
US Department of Justice, Findings from the Survey of Youth in Residential Placement, April 2010; Alliance for Excellent Education, 2006 xxx
Clark County Department of Juvenile Justice, 2010 xxxi
US Department of Justice, Findings from the Survey of Youth in Residential Placement, April 2010 xxxii
Clark County Department of Juvenile Justice, 2011; Washoe County Department of Juvenile Justice, 2011 xxxiii
Office of Juvenile Justice and Delinquency Prevention, Juvenile Offenders and Victims: 2006 National Report, U.S. Department of Justice, Office of Justice Programs, 2006 xxxiv
Clark County Department of Juvenile Justice, 2011; Washoe County Department of Juvenile Justice, 2011 xxxv
Washoe County Department of Juvenile Justice, 2011

xxxvi
Huizinga, D., Loeber, R., Thornberry, T. P. & Cothern, L., Co-occurrence of delinquency and other problem behaviors. Juvenile Justice Bulletin, OJJDP, 2000 xxxvii
DeKalb, Jay, “Student Truancy,” ERIC Digest 125, April 1999 xxxviii
Federal Strategic Plan to Prevent and End Homelessness, United States Interagency Council on Homelessness, 2010 xxxix
American Psychological Association, Effects of Poverty, Hunger, and Homelessness on Children and Youth, available at http://www.apa.org/pi/families/poverty.aspx, last accessed July 2011 xl Scholastic.com, Las Vegas Hard Numbers: 7000 Homeless Kids, available at http://www2.scholastic.com/browse/article.jsp?id=3752943, last accessed July 2011
xli Washoe County School District, Clark County School District
xlii National Center for Children in Poverty, 2011, available at http://www.nccp.org/topics/childpoverty.html, last accessed July 2011
xliii Ibid
xliv Ibid
xlv U.S. Census Bureau, American Community Survey, "Selected Economic Characteristics", using American FactFinder
xlvi National Center for Children in Poverty, 2011, available at http://www.nccp.org/topics/childpoverty.html, last accessed July 2011
xlvii Currie, Janet, Early Childhood Education Programs, Journal of Economic Perspectives, Volume 15 No. 2, pages 213-238, 2001
xlviii Nevada Annual Report of Accountability, available at www.nevadareportcard.com, last accessed July 2011
xlix U.S. Census Bureau, American Community Survey, "Selected Social Characteristics", using American FactFinder
l Ibid li Kids Count Data Center, The Annie E. Casey Foundation, available at http://datacenter.kidscount.org, last accessed July 2011
lii Ibid
liii The National Center for Educational Statistics: Washington, DC. Retrieved March 2010, from http://nces.ed.gov/edat
liv Child Trends, Diploma Attainment Among Teen Mothers, January 2010
lv The National Campaign to Prevent Teen Pregnancy, Not Just Another Single Issue: Teen Pregnancy, Out of Wedlock Births, and Marriage, 2002
lvi Nevada Vital Statistics, 2010; Clark County School District Accountability Reports, 2009-2010
lvii National Campaign to Prevent Teen Pregnancy, 2004
lviii Centers for Disease Control and Prevention, National Center for Health Statistics, VitalStats, http://www.cdc.gov/nchs/vitalstats.htm
lix Who And Where Are The Children Yet To Enroll In Medicaid And The Children's Health Insurance Program?, Health Affairs, October 2010
lx The Henry J. Kaiser Family Foundation, Kaiser Commission on Medicaid and the Uninsured, February 2007
lxi Child Trends, Late to No Prenatal Care, available at www.childtrendsdatabank.org
lxii Nevada Maternal and Child Health Issue Brief– Access to Prenatal Care, February 2009
lxiii Nevada Vital Statistics Records, Nevada State Health Division, Healthy People Nevada - Moving from 2010 to 2020, March 2011
lxiv Ibid
lxv Ibid
lxvi Ibid
lxvii Clearinghouse on Elementary and Early Childhood Education, December 2002
lxviii U.S. Department of health and Human Services, SAMHSA, Office of Applied Studies, http://oas.samhsa.gov/states.cfm
lxix National Center for Chronic Disease Prevention and Health Promotion, Division for Adolescent and School Health, Youth Risk Behavior Surveillance System
lxx Substance Abuse and Mental Health Services Administration, The NSDUH Report: Children Living with Substance-Dependent or Substance-Abusing Parents: 2002 to
2007, Office of Applied Studies, 2009 lxxi
Nevada Department of Public Safety, Crime and Justice in Nevada, 2008 and 2009, available at http://nvrepository.state.nv.us

SPECIAL THANKS TO
THE READY FOR LIFE NEVADA
STATEWIDE COUNCIL,
FACILITATED BY
NEVADA PUBLIC EDUCATION
FOUNDATION
IN PARTNERSHIP WITH
THE NEVADA
WORKFORCE SYSTEM
AUTHORED BY:
JENNIFER OUELLETTE
OF STRATEGIC PROGRESS
GRAPHIC DESIGN BY: JASON WIRTH