zacks small-cap researchs1.q4cdn.com/460208960/files/news/2018/feb-06-2018_v.wml...zacks investment...
TRANSCRIPT

© Copyright 2018, Zacks Investment Research. All Rights Reserved.
Wealth Minerals Ltd. (V.WML TSX-V)
Current Price (02/06/18) $1.32
Valuation $2.60
OUTLOOK
SUMMARY DATA
Risk Level Above Average
Type of Stock Small - Value
Industry Mining
Wealth Minerals is a junior mineral exploration company that is well-positioned to benefit from its portfolio of prospective lithium projects in the Lithium Triangle. The company holds control over portions of four lithium salar projects in northern Chile (Atacama, Trinity, Laguna Verde and Five Salars) and is in the process of acquiring a 24.5% beneficial interest in another (Seven Salars). The company intends to continue acquiring concessions encompassing salars and advancing them through exploration programs. The Lithium Triangle appears to be the global sweet spot for low-cost incremental supply of lithium.
52-Week High $2.34
52-Week Low $1.22
One-Year Return (%) -13.16
Beta 2.68
Average Daily Volume (shrs.) 167,554
Shares Outstanding (million) 103.327
Market Capitalization ($mil.) $136.39
Short Interest Ratio (days) N/A
Institutional Ownership (%) N/A
Insider Ownership (%) N/A
Annual Cash Dividend $0.00
Dividend Yield (%) 0.00
5-Yr. Historical Growth Rates
Sales (%) N/A
Earnings Per Share (%) N/A
Dividend (%) N/A
P/E using TTM EPS N/M
P/E using 2018 Estimate N/M
P/E using 2019 Estimate N/M
ZACKS ESTIMATES
Revenue (in millions of $)
Q1 Q2 Q3 Q4 Year (Feb) (May) (Aug) (Nov) (Nov)
2016 0.0 A
0.0 A
0.0 A
0.0 A
0.0 A
2017 0.0 E
0.0 A
0.0 A
0.0 E
0.0 E
2018
0.0 E
2019
0.0 E
Price/Sales Ratio (Industry = 2.5x)
Q1 Q2 Q3 Q4 Year (Feb) (May) (Aug) (Nov) (Nov)
2016
-$0.01 A
-$0.05 A
-$0.06 A -$0.02 A -$0.14 A
2017
-$0.05 A -$0.02 A
-$0.04 A
-$0.02 E -$0.13 E
2018
-$0.09 E
2019
-$0.07 E
Zacks Projected EPS Growth Rate - Next 5 Years % N/A
Quarterly EPS may not equal annual EPS total due to rounding.
Zacks Small-Cap Research Steven Ralston, CFA
312-265-9426 [email protected]
scr.zacks.com 10 S. Riverside Plaza, Chicago, IL 60606
February 6, 2018
Recent Company Highlights: geophysical survey results from the Trinity Project; shareholder update. Also, lithium pricing update
Based on comparative analysis that utilizes the valuation metric of price-to-book (P/B), an industry average peak P/B ratio of 9.2 indicates a share price target of $2.60
Sponsored Impartial - Comprehensive

Zacks Investment Research Page 2 scr.zacks.com
MOST RECENT EVENTS
Shareholder Update
On December 21, 2017, Wealth Mineral s CEO Henk van Alphen provided an update to shareholders. He stated that the company s focus is migrating from acquisitions of lithium concessions to the development of the portfolio of lithium brine properties already under option. The 2018 evaluation program is currently targeting the properties at Laguna Verde, Atacama and Trinity. Recent geophysical tests will help guide the next stage of development of conducting targeted drilling programs and other exploration efforts. Drilling has already started at the Laguna Verde project. During 2017, the company was able to raise $16.09 million in capital to help finance management s agenda.
Management is extremely encouraged by the recent Presidential election of Conservative leader Sebastian Piñera, who ran on a pro-business, pro-investment platform with plans to stimulate the economy by offering incentives to investors. In the mining sector, the timetable for granting permits is expected to be accelerated, especially for lithium mining projects.
The lithium market received significant investor attention, especially during the fourth quarter of 2017. With its portfolio of Chilean lithium brine properties, Wealth Minerals is well positioned to benefit from the expected industry consolidation as serious supply issues emerge.
Trinity Project
- Geophysical Results
On January 24, 2018, Wealth Minerals reported that the company has received positive results from geophysical surveys conducted on and around the Quisquiro Salar (part of the Trinity Project). Transient Electromagnetic (TEM) surveys have identified highly conductive zones underlying the surface brines, starting at 50 meters below the surface and extending to a depth of at least 300 meters. This thick, highly conductive layer is interpreted to represent porous media with high-salinity fluids (and potentially lithium-bearing brines). The TEM survey consisted of 88 stations of a 200-meter coincident loop with TEM sites located along 11 lines (see below). The survey was completed by Southernrock Geophysics S.A.
The data was processed and 1D inversion modeling was used to generate compiled sections and 3D visualizations (see below). Multiple anomalies were identified; however, the area around Line 2 had the highest level of conductivity, which suggests a zone of greater saturation and/or higher salinity. Management has identified this area as a high-priority drill target and anticipates conducting a drilling test on this anomaly during the first quarter of 2018, probably in March.

Zacks Investment Research Page 3 scr.zacks.com
Trinity Project
- Pacana Concessions
Concurrent with the announcement of the geophysical results at the Trinity Project, the company also announced that it has entered into a property purchase option agreement which grants Wealth Minerals the right to acquire 100% beneficial royalty-free interest in an additional 23 exploration concessions encompassing 5,700 hectares. Dubbed the Pacana Concessions (outlined in red in figure below), the properties lie to the northwest and southwest of the Quisquiro Salar. With the 9 Quiso concessions optioned in 2016 (outlined in green), the total land package controlled by Wealth Minerals around the Quisquiro Salar now totals 8,100 hectares.
In order to exercise the option, Wealth Minerals must issue 2,000,000 common shares as outlined in the table below. Wealth Minerals is required to keep the concessions in good standing throughout the term of the option.

Zacks Investment Research Page 4 scr.zacks.com
Financing
On December 29, 2017, Wealth Minerals announced the closing of the first tranche of the previously announced non-brokered private placement of up to 6,250,000 shares. The first tranche consists of 4,557,254 common shares, which provided gross proceeds of $7,323,606.40. Also, 171,063 additional shares were issued as finder s fees. Furthermore, cash finder s fees totaling $124,335.34 were paid, along with 75,960 broker warrants. Net proceeds are intended to fund option payments, exploration work, general & administrative expenses and working capital.
Lithium Pricing Update
After the steep run-up during the first half of 2016, spot lithium product pricing (battery-grade 99.5% lithium carbonate Li2CO3) corrected slightly and dipped below $18,000 during the first quarter of 2017 despite continued demand for lithium concentrate and lithium carbonate. However, spot pricing began to firm and strengthened during the third quarter of 2017 after Xin Guobin, China s Vice Minister of Industry and Information Technology, announced at an auto forum in Tianjin on September 9th that Chinese regulators are working on a timetable to phase out the production and sales of fossil fuel vehicles. Spot prices rallied to over $25,000 during the fourth quarter of 2017. Thus far during early 2018, spot pricing has been under steady pressure, especially after a contract was announced between SQM (Sociedad Quimica y Minera) and CORFO (Corporación de Fomento de la Producción - Chile s governmental agency for the promotion of production) in mid-January, which allows SQM (NYSE: SQM) to produce up to 216,000 tonnes of lithium carbonate annually through 2025, reducing the risk of a lithium carbonate supply shortage.
$6,450 $7,000 $7,000
$13,000
$22,000 $21,750$20,000
$18,500 $18,000$19,000
$22,750
$25,000$23,350
$0
$5,000
$10,000
$15,000
$20,000
$25,000
1Q '15 2Q '15 3Q '15 4Q '15 1Q '16 2Q '16 3Q '16 4Q '16 1Q '17 2Q '17 3Q '17 4Q '17 1Q '18
Quarterly Average Lithium Carbonate PriceSpot Market - Battery Grade 99%+
($ per tonne)

Zacks Investment Research Page 5 scr.zacks.com
OTHER RECENT EXPLORATION & TESTING PROGRAMS
Laguna Verde Project
- Process Work
Tenova Advanced Technologies (TAT) has completed process test work on samples collected at the Laguna Verde project. On November 17, 2017, Wealth Minerals announced that the test work confirmed that the TAT Process can be successfully applied to Laguna Verde surface brines.
The laboratory test work on a 50-liter surface brine sample from Laguna Verde demonstrated that both TAT processes of LiP and LiSX can be utilized to successfully extract lithium. The sample was analyzed and estimated to contain approximately 220 mg/l of lithium. In order to remove calcium and magnesium contaminants, the sample was pretreated by the LiP process, through which approximately 88% of the calcium and 97% of the magnesium were removed in a two-pass membrane filtering regimen. Test work for the recovery of lithium sulfate (Li SO ) through TAT s LiSX (proprietary solvent extraction) process succeeded in producing a lithium sulfate solution with purity of 99.9%. In addition, a 100% recovery rate is assumed since analysis of the waste stream did not detect the presence of lithium at a 3mg/l detection limit.
In due course, management expects to initiate a Stage II order of magnitude cost estimate study for the purpose of estimating the capital expenditures and operating expenses required to annually produce 20,000 tons of LCE (lithium carbonate equivalent or LiOH·H O) from Laguna Verde.
In addition to the known surface brines at Laguna Verde, there is considerable potential for the discovery of subsurface brines. Management plans to drill subsurface brine targets that are indicated from anomalies detected in the recently completed geophysical surveys.
On December 8, 2017, Wealth Minerals announced that the company is transitioning from a focus on acquisitions to one on development, initially at the Laguna Verde, Atacama and Trinity projects.

Zacks Investment Research Page 6 scr.zacks.com
Laguna Verde Project
- Drilling
Drilling has commenced at Laguna Verde. Targets were determined by analyzing the results of the Transient Electromagnetic (TEM) and gravity geophysical surveys completed earlier in 2017.
Laguna Verde Project
- Geophysical Results
Geophysical data defined an area for shallow lithium brine drill targets approximately 200-to-300 meters below surface (the transparent red area in the figure below). Groundwater / brine samples will be collected at 50-meter intervals and later analyzed for lithium content.
Atacama Project
- Initial Geophysical Results
Having started in October 2017, geophysical surveys have been completed at Atacama and Trinity. On December 14, 2017, Wealth Minerals announced it has received positive geophysical results for the Atacama Lithium Brine Project. The Magneto-Telluric (MT) and Transient Electromagnetic (TEM) surveys conducted by Southernrock Geophysics S.A. have identified very highly conductive (very low resistivity) zones, which are being interpreted as representing porous media with high-salinity fluids (and potentially lithium-bearing brines).

Zacks Investment Research Page 7 scr.zacks.com
The surveys consisted of 141 MT and coincident loop TEM sites. In addition to the resistivity imaging, 1D inversion model data (presented as depth slices) were used to generate a 3D visualization in order to interpret the resistivity structure at depth.
The geophysical surveys provide many near-surface and deeper drill targets. Initial drill testing of shallow targets in the southwest (to a depth of between 100 and 150 meters) is being planned for the first quarter of 2018.
Laguna Verde Project
- Initial Geophysical Results
On June 5, 2017, Wealth Minerals announced initial results from the Transient Electromagnetic (TEM) and gravity geophysical surveys around the Laguna Verde Project. Data for TEM survey was collected from 132 stations of 250-meter coincident transmitter loops while the gravity survey lines utilized 108 reading stations.
The initial results of the gravity geophysical survey suggest the depth of the Laguna Verde s basin ranges from about 400 meters to slightly more the 1,000 meters in the area surveyed. The TEM geophysical survey measured variations in the subsurface electrical resistivity and conductivity in the selected areas around the Laguna Verde surface brine-lake. The variations in conductivity support the potential presence of saline groundwater (potentially brine) contiguous to the lake and at an indicated depth of 200-to-300 meters. The strongest electromagnetic measurements of conductivities potentially identifying groundwater yielding zones were recorded at the western end of the lake. A zone of low resistivity was observed to the northeast of the lake (at a depth over 400 meters). Zones with low resistivity values are typical of sandy zones filled with saline groundwater and here at Laguna Verde, may represent a separated saline groundwater aquifer (see the Laguna Verde Project section for a 3-D visualization of TEM survey results).
Initial analysis indicated up to three shallow drill targets very near to Laguna Verde brine-lake and an additional drill target to test the prospective deeper zone of low resistivity to the northeast.

Zacks Investment Research Page 8 scr.zacks.com
KEY POINTS
Wealth Minerals is junior mining company pursuing a strategy of accumulating early stage exploration lithium projects within the Lithium Triangle, initially properties located in Chile.
Management s strategy is to increase shareholder value by gaining control of prospective lithium exploration concessions that encompass salars.
The Lithium Triangle, particularly in Chile and Argentina, appears to be the global sweet spot for low-cost incremental supply of lithium.
Management intends to advance the mineral concessions through exploration programs.
The company may enter joint venture partnerships with senior mining companies to advance concessions to further explore and develop each property, thereby potentially receiving cash payments to carry the projects into the future while laying off significant exploration costs onto the partner.
Management may consolidate properties under its control for the purpose of being able to offer more attractive packages of prospective lithium properties to senior mining companies.
Concurrently, additional prospective projects are being identified and evaluated in order to augment the company s portfolio of properties.
Thus far, since July 26, 2016, Wealth Minerals has entered into formal option agreements for multiple prospective lithium properties. After consolidating several properties into one project, the company now controls four projects (Atacama, Trinity, Laguna Verde and Five Salars) which encompass 71,800 hectares. A fifth project under agreement would provide a 24.5% beneficial interest in Seven Salars. See table below.
Wealth Minerals Ltd.Formal Number
Exploration Option of HectaresProject Concession Date Concessions (approx.) Salar RegionAtacama 10/28/2016 144 46,200 Atacama II
Trinity various 49 12,100 IIAguas Calientes Norte
Puritama 11/30/2016 8 2,000 Aguas Calientes II
Salar 7/25/2016 2 400 Aguas Calientes IIPujsa 7/20/2016 7 1,600 Pujsa IIQuiso 9/5/2016 9 2,400 Quisquiro II
Pacana 2/1/2018 23 5,700 Pacana IILaguna Verde 12/2/2016 23 2,438 Laguna Verde III
Land Package (Laguna Verde) 3Q FY2017 N/A 6,262 Laguna Verde III
Salar Green Green IIIUnion III
Five Salars 3Q FY2017 5 10,500 I, II, III
Ascotán 1 1,300 Ascotán IIPiedra Parada 1 1,900 Piedra Parada III
Huasco 1 5,300 Huasco I
Siglia 1 1,600 Siglia IILejia 1 400 Lejia II
Seven Salars (24.5% interest) Agreement N/A 39,404 III
Salar de La Isla N/A 16,500 La Isla III
Salar de Aquilar N/A 8,800 Aquilar IIISalar de Las Parinas N/A 5,400 Las Parinas III
Salar Grande N/A 4,000 Grande III
Salar Agua Amerga N/A 3,100 Agua Amerga IIISalar de Piedra Parada N/A 1,500 Piedra Parada III
Maricunga Salar N/A 104 Maricunga III
Total under Formal Option Agreements 77,500Total under Option, Agreement & LOI 87,154

Zacks Investment Research Page 9 scr.zacks.com
With lithium carbonate prices having risen significantly over the last two years from under $6,000 to above $17,000 per tonne, investors are intently focused on ferreting out opportunities in the lithium industry.
Consistent news flow from Tesla and other builders of battery gigafactories reinforces the macro-case for lithium.
Concurrently, the growth of Electric Vehicles should drive profound increases in demand for lithium.
Though there is some debate, as always, about the resolution of the current lithium supply-demand imbalance and the resulting effect on pricing, I fall into the camp that there will be insufficient supply to meet the anticipated demand over the next few years, which should result in a robust lithium pricing environment. Such opportunities, especially when accompanied with targeted areas, such as the Lithium Triangle, are infrequent and should be pursued vigorously when they occur.
On September 9, 2017, Xin Guobin, China s Vice Minister of Industry and Information Technology, announced at an auto forum in Tianjin that Chinese regulators are working on a timetable to phase out the production and sales of fossil fuel vehicles.
Since the company s projects are still in the early exploration stage and management continues to pursue acquiring control over additional properties, Wealth Minerals will continue to need to raise capital in order to fund the advancement of its lithium brine projects.
Zacks Investment Research Page 10 scr.zacks.com
OTHER RECENT NEWS
Government Regulation to Bolster Lithium Demand
On September 9, 2017, at an auto industry event in Tianjin, Xin Guobin, China s Vice Minister of Industry and Information Technology, announced that Chinese regulators are working on a timetable to phase out the production and sales of fossil fuel vehicles. The Chinese Ministry stated that relevant research has begun in order to compose a timeline with an initial goal of having at least a fifth of Chinese automobile sales comprised of electric and plug-in hybrid cars by 2025.
As measured by the Global X Lithium & Battery Tech ETF (NYSE: LIT), the announcement sparked a 14%+ rally in lithium-related stocks over the subsequent seven market days.
The announcement follows similar plans announced by the French and UK governments in July 2017. In early July, Nicolas Hulot, the French Ecology Minister, announced plans for an end to the sale of petrol and diesel cars by 2040. A couple of weeks later, Great Britain made a similar announcement under a draft plan to improve air quality through the reduction of automotive emissions.
Third Fiscal Quarter Results
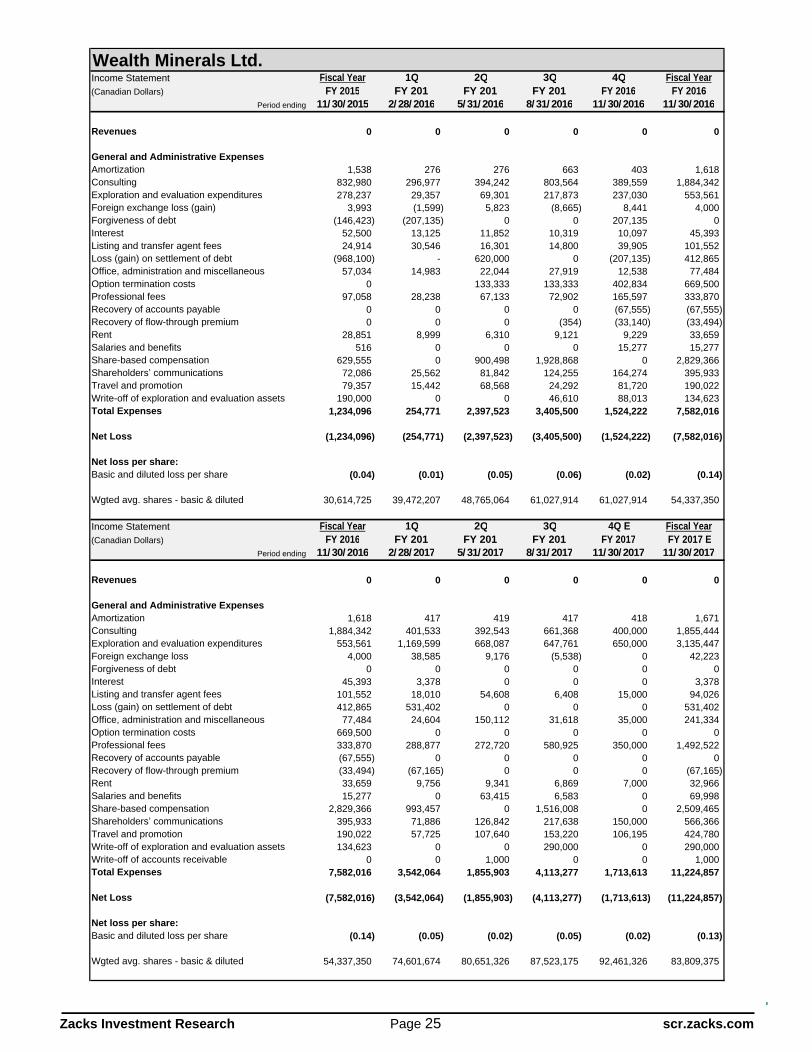
On October 30, 2017, Wealth Minerals reported financial results for the third fiscal quarter ending August 31, 2017. For the quarter, the company reported a loss of $4,113,277 ($0.04 per diluted share) versus a loss of $3,405,500 ($0.06 per diluted share) in the comparable-quarter last year. Exploration and evaluation expenditures and professional fees expanded significantly due to increased exploration activities and increased need for legal services, respectively. Exploration and evaluation expenditures increased 197% or $429,888 while professional fees increased 697% or $ 508,023.
The weighted average number of common shares outstanding increased 43.4% YOY to 87,523,175. During the quarter, 4,409,946 shares were issued through private placements and the exercise of options. In addition, the company issued 4,000,000 shares pursuant to the formal option agreements to acquire the Salar de Atacama and Laguna Verde (Salar Green and Union) projects. At the end of the quarter, 91,154,520 shares were outstanding.
During the quarter and subsequently, the company made several option payments, fulfilling calendar 2017 obligations:
In the Trinity Project, US$50,000 for Pujsa and US$500,000 for Quiso (aka Quisquiro)
At Salar de Atacama, US$3,000,000 and 4,000,000 shares
At Laguna Verde - US$200,000 and 1,000,000 shares for the Salar Green and Union
For the Five Salars Project, US$1,000,000
The only option payments remaining in 2017 are
US$1,000,000 and 1,000,000 shares for Laguna Verde
1,000,000 shares for the Five Salars Project
The initial payment of US$3,920,000 and the issuance of 4,104,545 shares related to a binding Letter of Agreement for 24.5% interest of Seven Salars still appear to pending.
Subsequent to August 31, 2017, Wealth Minerals received $437,125 via the exercise of options for 562,500 common shares and issued 1,024,000 shares in settlement of $1,925,120 of debt.
Zacks Investment Research Page 11 scr.zacks.com
OTHER RECENT OPTION AGREEMENTS OF PROSPECTIVE LITHIUM PROPERTIES
During the third fiscal quarter, Wealth Minerals entered into a formal property option agreement for the acquisition of an additional Laguna Verde land package (Salar Green and Union properties).
On August 1, 2017, the company announced the execution of a binding Letter Agreement to acquire a 24.5% beneficial interest in the 39,400-hectare Seven Salars Project through the acquisition of 49% of the outstanding shares of San Antonio Sociedad Contractual Minera.
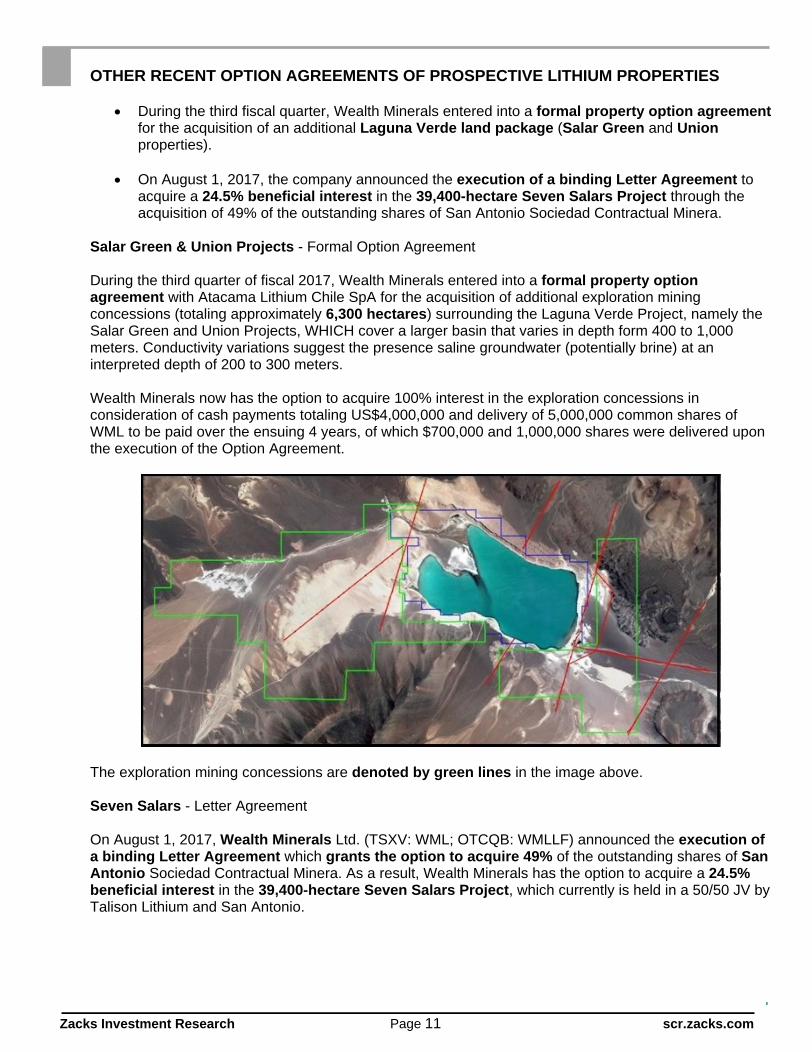
Salar Green & Union Projects - Formal Option Agreement
During the third quarter of fiscal 2017, Wealth Minerals entered into a formal property option agreement with Atacama Lithium Chile SpA for the acquisition of additional exploration mining concessions (totaling approximately 6,300 hectares) surrounding the Laguna Verde Project, namely the Salar Green and Union Projects, WHICH cover a larger basin that varies in depth form 400 to 1,000 meters. Conductivity variations suggest the presence saline groundwater (potentially brine) at an interpreted depth of 200 to 300 meters.
Wealth Minerals now has the option to acquire 100% interest in the exploration concessions in consideration of cash payments totaling US$4,000,000 and delivery of 5,000,000 common shares of WML to be paid over the ensuing 4 years, of which $700,000 and 1,000,000 shares were delivered upon the execution of the Option Agreement.
The exploration mining concessions are denoted by green lines in the image above.
Seven Salars - Letter Agreement
On August 1, 2017, Wealth Minerals Ltd. (TSXV: WML; OTCQB: WMLLF) announced the execution of a binding Letter Agreement which grants the option to acquire 49% of the outstanding shares of San Antonio Sociedad Contractual Minera. As a result, Wealth Minerals has the option to acquire a 24.5% beneficial interest in the 39,400-hectare Seven Salars Project, which currently is held in a 50/50 JV by Talison Lithium and San Antonio.

Zacks Investment Research Page 12 scr.zacks.com
Upon the completion of due diligence, Wealth Minerals can exercise its option to acquire 49% of the issued and outstanding shares of San Antonio by issuing 4,104,545 shares of WML.V at closing and the payment of US$11,760,000 over the ensuing eight months.
The Seven Salars Project is comprised of Salar de La Isla (16,500 hectares), Salar de Aquilar (8,800), Salar de Las Parinas (5,400), Salar Grande (4,000), Salar Agua Amerga (3,100), Salar de Piedra Parada (1,500) and Maricunga Salar (104) - all located Chile s Region III.
The salars have had varying degrees of historical exploratory work. Between 2010 and 2011, Talison completed TEM (Transient Electromagnetic) geophysical surveys over five salars of the seven salars. In addition, geochemical surface brine sampling and exploration drilling were conducted on the properties. Roughly 200 surface brine samples were collected and 34 drill holes (27 at Salar de La Isla and seven at Salar de Las Parinas) were completed.

Zacks Investment Research Page 13 scr.zacks.com
Highlights include surface brine sampling with a maximum value of 1,080 mg/l Li at Salar de La Isla, a maximum lithium concentration of 480 mg/l (average of 331 mg/l) in a drill program at Salar de Las Parinas and brine samples ranging from 257 mg/l to 337 mg/l at Salar de Aquilar.
Concerning the other JV partner of the Seven Salars Project, Talison is a leading global producer of lithium. Talison s Greenbushes Project in Western Australia produces lithium concentrate, which accounts for roughly 40% of global lithium production. Talison acquired its 50% interest in the Seven Salars Project through the acquisition of Salares Lithium Ltd. in 2010. Talison Lithium, itself, is jointly owned by Tianqi Lithium (51%) and Albemarle Corporation (49%), the latter being the one of the two current lithium producers in Chile with production from Salar de Atacama Salar and the operator of the Greenbushes Project.
Five Salars - LOI
On April 18, 2017, Wealth Minerals announced the execution of a non-binding Letter of Intent to enter into an option agreement granting the right to acquire a 100% royalty-free interest in a portfolio of exploration concessions located in northern Chile. The package of properties (known as the Five Salars Project) totals 10,500 hectares of exploration concessions and is comprised of five projects: Ascotán, Piedra Parada, Huasco, Lejia and Siglia.

Zacks Investment Research Page 14 scr.zacks.com
In order to exercise the formal option agreement, Wealth Minerals must make cash payments totaling $8.0 million and issue 8,000,000 common shares according to the schedule in the table below.
Wealth Minerals Ltd.Upon Required Required Required Required Required Total
Exploration Signing Payment Payment Payment Payment Payment RequiredConcession Hectares Agreement +6 months +12 months +18 months +24 months +28 months Payments
Five Salars 10,500 $1,000,000 $1,000,000 $1,000,000 $1,000,000 $2,000,000 $2,000,000 $8,000,0001,000,000 shrs 1,000,000 shrs 1,000,000 shrs 1,000,000 shrs 2,000,000 shrs 2,000,000 shrs 8,000,000 shrs
Thus far, payments totaling $2,000,000 have been made.
RECENT FINANCINGS
To date, Wealth Minerals has been very successful funding the company s operations and initiatives through its equity financing activities. Net proceeds have been utilized to finance option payments on mineral property options, costs for assessing potential acquisitions of additional lithium properties and expenditures for exploration work on existing lithium projects, in addition to funding G&A expenses.
On December 29, 2017, Wealth Minerals announced the closing of the first tranche of the previously announced non-brokered private placement of up to 6,250,000 shares. The first tranche consists of 4,557,254 common shares, which provided gross proceeds of $7,323,606.40. Also, 171,063 additional shares were issued as finder s fees. Moreover, cash finder s fees totaling $124,335.34 were paid, along with 75,960 broker warrants.
On September 28, 2017, Wealth Minerals closed a non-brokered private placement and issued 2,583,700 common shares priced at $1.50 per share providing gross proceeds of $3,875,550. Haywood Securities Inc. and Canaccord Genuity Corp. received cash finders' fees of $113,841.00 and $31,447.50, respectively. Net proceeds are intended to finance option payments on mineral property options, costs for assessing potential acquisitions of additional lithium properties and expenditures for exploration work on existing lithium projects, in addition to funding G&A expenses.
On August 2, 2017, Wealth Minerals announced the closing of the non-brokered private placement first announced on June 2, 2017. A total of 3,704,946 shares were issued in two tranches; gross proceeds were $5,483,459.
During the second fiscal quarter, 4,082,728 shares were issued through a private placement (3,707,728 shares) and the exercise of options (375,000 shares) providing net proceeds of $6,849,314.
During first fiscal quarter of 2017 (ending February 28, 2017), a non-brokered private placement of 1,838,800 shares provided net proceeds of $1,788,944. Also, the exercise of warrants provided an additional $67,500. During the second fiscal quarter, 4,082,728 shares were issued through a private placement (3,707,728 shares) and the exercise of options (375,000 shares) providing net proceeds of $6,849,314.
During fiscal 2016 (ending November 30, 2016), equity financing activities provided Wealth Minerals a total of $12,382,800 to help finance the company s activities and fund the necessary option payments to maintain its formal option agreements in good standing. During the year, Wealth Minerals successfully closed five non-brokered private placements, which provided $11,514,700 in net proceeds; in addition, the company received $868,100 from the exercise of options and warrants.

Zacks Investment Research Page 15 scr.zacks.com
Going forward, in addition to ongoing general & administrative expenses and working capital requirements, the company needs to make the required option payments on its mineral property options, pay the costs of reviewing potential new acquisitions as well as fund exploration work.
OVERVIEW
Headquartered in Vancouver, British Columbia, Wealth Minerals Ltd (WML.V) is a junior exploration company that is building a portfolio of highly prospective lithium-brine mineral concessions located within the Lithium Triangle, currently targeting properties within salars situated in Chile. However, management s scope for potential lithium-in-water and brine candidates extends beyond the region in the search for prospective mineral properties.
Since July 2016, the company has entered into several formal option agreements to acquire interests in certain lithium exploration concessions, namely:
Atacama Project - option to acquire a 100% royalty-free interest in 144 exploration concessions (46,200 hectares) located the northern portion of the Salar de Atacama
Laguna Verde Project - option to acquire a 100% royalty-free interest in 23 mining concessions (2,438 hectares)
Trinity Project - comprised of three neighboring properties (totaling roughly 6,400 hectares) o Aguas Calientes Norte (Salar and Puritama totaling 2,400 hectares) o Pujsa (1,600 hectares) o Quisquiro Salar
Quiso (2,400 hectares)
Pacana (5,700 hectares)
Salar Green and Union Projects option to acquire 6,262 hectares contiguous to the Laguna Verde Project.
Entered into a non-binding LOI for the right to acquire 100% interest in 5 exploration concessions (10,500 hectares) collectively known as the Five Salars Project
o Ascotán Project in the west portion of the Salar de Ascotán (1,300 hectares) o Piedra Parada Project in the Salar de Piedra Parada (1,900 hectares) o Huasco Project in the Huasco Salar (5,300 hectares)

Zacks Investment Research Page 16 scr.zacks.com
o Siglia Salar (1,600 hectares) o Lejia Salar (400 hectares)
Entered into a binding agreement for option to acquire 49% interest in San Antonio Sociedad Contractual Minera. The 39,400-hectare Seven Salars Project is held in a 50/50 JV by Talison Lithium and San Antonio. As a result, Wealth Minerals has the option to acquire a 24.5% beneficial interest in.the Seven Salars Project.
o Salar de La Isla (16,500 hectares) o Salar de Aquilar (8,800 hectares) o Salar de Las Parinas (5,400 hectares) o Salar Grande (4,000 hectares) o Salar Agua Amerga (3,100 hectares) o Salar de Piedra Parada (1,500 hectares) o Maricunga Salar (104 hectares)
Today, Wealth Minerals controls 77,500 hectares of mineral concessions, having consolidated various concessions in Chile into a portfolio of prospective lithium-brine properties. The company s salar projects have the potential to produce lithium compounds and other metals from subsurface brines.
Strategic Plan
In late 2015, management recognized the increasing interest in lithium brines located with the Lithium Triangle, especially Chile. Rising prices of the lithium compounds, especially lithium carbonate, appeared to be forerunner of an expected potential future supply shortage of high-grade lithium to feed the demand being generated by Electric Vehicle (EV) manufacturers and builders of battery gigafactories. The market dynamics of lithium portend profound structural issues from which the company is being positioned to benefit.
Management s business plan is comprised of acquiring greenfield lithium concessions, advancing the properties through exploratory studies (brine sampling, geophysics and drilling) to an extent that they appear technically feasibility and economically viable and then developing these properties into revenue generating operations. Given the growing global demand for lithium and the limited number of low-cost lithium-brine projects, management anticipates that strategic partnerships will be a core part of asset development. The company has identified and approached potential strategic partners, including mining companies, fertilizer companies and industrial concerns. In general, the expected timeframe to reach commercial production at Atacama and Laguna Verde (the company s priority projects) would require a minimum of four years.
Not only has management positioned the company to benefit from the upcoming expected growth of demand in the lithium space, but also continues to seek the acquisition of additional interests in prospective concessions. The company continues to constantly review and evaluate a number of properties in the region and then aggressively pursues control of the attractive ones that would complement the current portfolio of concessions.
Prior to 2016, Wealth Minerals was primarily focused on prospective precious metal and copper exploration concessions and still holds a 100% interest in the Yanamina Gold Project (Peru) and options to acquire a 100% interest in the Valsequillo Silver Project (Mexico) and the Jesse Creek Porphyry Copper Property (British Columbia). These prospective gold, silver and copper properties are now being advanced secondarily to the company s lithium projects.
Management has been very successful in obtaining capital through equity offerings (see Recent Financings section).
On May 31, 2016, Wealth Minerals Ltd. (OTCQB: WMLLF) was upgraded from the OTC Pink market to the OTCQB market. The company trading symbol remained unchanged.

Zacks Investment Research Page 17 scr.zacks.com
LITHIUM PRICING
The lithium market is an oligopoly where three major producers account for approximately 58% of global production: Sociedad Quimca Y Minera De Chile (NYSE: SQM), Albemarle (NYSE: ALB) and the FMC Lithium subsidiary of FMC (NYSE: FMC). The Big Three are diversified companies with divisions that produce the lithium compounds, such as lithium carbonate, lithium chloride and lithium hydroxide. SQM extracts lithium solutions from the brine deposits of the Salar de Atacama in northern Chile. Albemarle also has lithium brine operations at the Salar de Atacama and in addition, operates the Greenbushes spodumene mine in Australia with partner Sichuan Tianqi Lithium through the Talison JV. FMC Lithium s lithium reserves are located in the Salar del Hombre Muerto in Argentina. A few Chinese producers (like Jiangxi Ganfeng Lithium and Xinjiang Haoxing Lithium), which convert spodumene ore into lithium compounds, account for an additional 40%, which also includes Tianqi Lithium s 51% of production from the Australian Greenbushes mine.
Lithium is not traded on an exchange and lacks a transparent pricing mechanism like the LME or COMEX. Instead, a few producing companies manage supply, and lithium compounds are sold on a contract basis at specified prices that are set by direct negotiation between producers and customers. For the most part, these contract prices are not published; however, approximate values can be gathered from industry sources, company financial reports and management presentations. Firms like CRU, Macquarie and Roskill make periodic price assessments.
A small number of major producers supply well over 90% of the commercially available lithium with some analysts believing that the percentage may be as high as 98%. An extremely limited spot market satisfies incremental demand. As a result, very little high-grade lithium carbonate is available on the spot market so that modest changes in demand magnify the movement in price of lithium that is not under contract. The spot market represents a small amount of the lithium compounds actually sold, but is an indicator of marginal demand.
The price of lithium is most commonly quoted in $ per tonne of high-grade LCE (lithium carbonate equivalent), which generally has become the industry standard to estimate the unit value for lithium. It should be noted that lithium is sold in a variety of different lithium compounds, each available in different quantities, purities and particle size, often specific to various processes and applications. As a point of reference, lithium carbonate (Li2CO3) contains approximately 18.8% of lithium; consequently, 5.3 tonnes of lithium carbonate contains 1.0 tonne of lithium. Also, generally high-grade lithium carbonate (99%+ pure) sells at a $500-to-$1,000 per tonne premium to industrial-grade Li2CO3.

Zacks Investment Research Page 18 scr.zacks.com
2,190 2,390 2,4502,800
3,300
4,525
5,900 6,025 5,8005,180 5,180
6,060
6,800 6,690
$0
$1,000
$2,000
$3,000
$4,000
$5,000
$6,000
$7,000
$8,000
2001 2002 2003 2004 2005 2006 2007 2008 2009 2010 2011 2012 2013 2014
Annual Average Lithium Carbonate PriceBattery Grade($ per tonne)
Over the past 15 years, supply/demand imbalances have impacted price. According to the USGS (which appears to utilize technical/industrial-grade prices), between 2001 and 2005, LCE prices were relatively stable with the average annual price between $1,720 and $1,460. However, from 2005 to 2009, the average annual price rose from $1,460 to $4,530 (32.7% CAGR). Following the global financial crisis (2009 to 2011), high-grade LCE prices declined to $3,870 in 2011, despite industry leaders SQM and Rockwood Holdings (which was acquired by Albemarle in 2014) idling capacity. From 2011 to 2014, LCR prices recovered to $4,510 (5.2% CAGR).
However, beginning in 2015, the supply-demand imbalance of lithium became manifest. The LCE market tightened and culminated in a price spike starting in late-2015 and lasting through the first quarter of 2016, which may be a forerunner of price expectations that are expected to result from a potential future supply shortage of high-grade lithium. As demand for rechargeable batteries has increased, the supply of lithium compounds tightened, primarily lithium concentrate (spodumene) feedstock, but also high-grade lithium carbonate. As demand from the battery factories in China increased (particularly from EV manufacturers), the supply of spodumene concentrate from Australia, the world s largest producer of lithium, came into question. Albemarle, which acquired had Rockwood in the prior year, not only controlled more Australia s lithium concentrate supply, but also a major investment by Tianqi Lithium into a German subsidiary of Albemarle raised concerns about a potential supply deficit in the spot market, which was further fueled by the anticipation of the wave of gigafactories. Also, companies in need of lithium compounds as a raw material but without contracts scrambled to acquire supply in the spot market. The spot price of high-grade lithium carbonate entered a period of significant price increase. Spot prices almost doubled to $13,000 per tonne by the end of December 2015 and then surged during the first quarter of 2016, peaking above $25,000 per tonne in mid-March 2016. There were even some reports of transactions as high as $26,000 per tonne, even though we estimate that the average price during the first quarter of 2016 was approximately $22,000.
After the steep run-up during the first half of 2016, lithium product pricing corrected slightly, dipping below $18,000 during the first quarter of 2017 despite continued demand for lithium concentrate and lithium carbonate. However, pricing began to firm and strengthened during the third quarter of 2017 after Xin Guobin, China s Vice Minister of Industry and Information Technology, announced at an auto forum in Tianjin on September 9th that Chinese regulators are working on a timetable to phase out the production and sales of fossil fuel vehicles. Spot prices rallied to over $25,000 during the fourth quarter of 2017. Thus far during early 2018, spot pricing has been under steady pressure, especially after a contract was announced between SQM and CORFU allowing SQM to produce up to 216,000 tonnes of lithium carbonate annually through 2025, reducing the risk of a lithium carbonate shortage after 2022.

Zacks Investment Research Page 19 scr.zacks.com
Initially as demand increases, the major companies can respond by increasing production. However, to be able to satisfy large increases in demand over the long-term, as for most metals and minerals, the addition of new lithium production capacity is required. This supply side response not only is capital intensive but also necessitates lead times measured in years to properly develop. Projects require financing, exploration (geophysical surveys, surface geochemical sampling programs and drilling), economic assessments, metallurgical studies, environmental report, processing design, permitting, construction, commissioning and optimization.
A number of greenfield hard rock and brine expansions are being advanced to alleviate the tight market situation. However, we do not expect that these few projects will be able to meet the rising level of demand until the mid-2020s, given the anticipated robust demand from a global wave of construction projects for new gigafactories and grid power storage initiatives, along with the continued growth in the demand for mobile devices.
The lithium mining industry is expected to expand production through the development of new projects in order to accommodate increasing demand. Over the medium-term, the supply of lithium will be dominated by projects being initiated in Argentina, Chile, China and Australia, but particularly from the Lithium Triangle. Typically, the cost of production from brines is much lower than from hard rock, and therefore, it is expected that continental brine resources will be preferred over hard-rock ore for new capacity.
LITHIUM TRIANGLE
One of the world s largest and higher quality resource bases of lithium is the undeveloped brine deposits of the Lithium Triangle, which refers to one of the world s major continental evaporate complexes located in the mountainous region where borders of Argentina, Bolivia and Chile meet. The Lithium Triangle hosts many significant lithium brine deposits that have formed in the closed basins of this tectonically active and arid region. The concentration of saturated salt brines include accumulations of lithium salts: initially deposited during periods of intense volcanic activity along the west coast of South America in the late-Cretaceous to early-Tertiary Periods; subsequently conveyed by hydrothermal activity (via preferential flow paths previously created by tectonic activity); and later concentrated in depressions (often inland closed lakes and/or calderas) through weathering and leaching of the volcanic lithium source-rocks by snowmelt and rainwater run-off. Another potential mechanism for transporting lithium to the basins may have been the interaction of groundwater with the magmatic systems. Nevertheless, the accumulation of lithium-rich brine in closed basins (aka salars) within the Lithium Triangle is well documented.

Zacks Investment Research Page 20 scr.zacks.com
Around half of the world s lithium supply is derived from the brines of the Lithium Triangle. Chile is the #2 producer of lithium in the world and the #1 in identified lithium resources, while Argentina is #3 in both categories. Though Bolivia is #1 in in identified lithium resources, the country only made its first shipment to China in August 2016 due to various reasons: the unfavorable political/business environment, the cost considerations of refining Bolivia s magnesium-rich lithium salts and a less competitive evaporation rate.
In the near future, the Lithium Triangle is poised to become even more dominate as the major source of lithium in the world not only due to the vast identified lithium resources in the region, but also because brine production more cost-competitive relative to hard-rock and clay sources of lithium.
With the tipping point toward higher lithium prices on the horizon and with brine deposits poised to be a major contributor to low-cost incremental supply, lithium exploration & development companies of the Lithium Triangle, with their blue sky potential, appear to be well positioned to benefit from higher lithium prices.
VALUATION
The valuation of junior exploration companies with projects that do not contain estimated resources is challenging. As a junior gold exploration company, Wealth Minerals cannot be valued on the basis of revenues, EBITDA, earnings or cash flow. Also, more sophisticated methodologies based on market capitalization-to-resources, average grade of contained metals and elements, etc. also are not germane. Methodologies based on the geological potential of a project are decidedly dependent on an extraordinary degree of geological knowledge as well as experience, but tend to be highly subjective in ascertaining the magnitude of mineral deposit, estimating the expected exploration and infrastructure costs and prescribing the probability of the project s success.
Management s strategy is to increase shareholder value by gaining control of prospective lithium exploration concessions that encompass salars in the Lithium Triangle. This approach of accumulating potentially low-cost lithium-brine mineral concessions is hard-to-replicate. Therefore, a valuation technique based on book value is an appropriate alternative, especially in comparison to junior lithium companies holding similar exploration-discovery stage concessions.
Book value of a junior exploration company represents the equity capital that has been raised to acquire the mineral concessions and to conduct exploration programs. An amalgamation of information is encapsulated within the raised capital total, including the quality of the properties (both in terms of mineral potential and political stability) and the exploration results from introductory geophysical surveys and brine sampling programs. The equity capital that has been raised augments book value, which then represents the extent to which investors are willing to fund the acquisitive and exploration efforts of the

Zacks Investment Research Page 21 scr.zacks.com
company or in other words, expresses a measure of investor confidence in the company s projects. Therefore, book value captures the complex valuation potential of the company s resource value potential by investors, many with expert knowledge of junior mining companies in the exploration phase. Hence, we find the use of book value is an appropriate metric by which to determine a junior exploration company s valuation.
First, large diversified lithium-producing companies are not appropriate comparables (such as Albemarle, SQM and FMC) as are companies exploiting and/or pursuing higher cost spodumene (hard rock) deposits. Nor are companies having recently attained commercial production, such as Galaxy Resources (ASX: GXY) and Orocobre (ASX: ORE), where the dynamics of initiating production and debt issues often are the primary factors driving valuation. We believe that emerging junior exploration companies engaged in acquiring and/or advancing lithium-brine projects are the applicable comparables to Wealth Minerals.
Peak MonthExchange % Chg Mkt Cap Price/ Adj. of
Ticker Beta YTD ($ mil.) Book Price/ HighBook P/B
WEALTH MINERALS LTD. WML.V TSXV 2.68 -25.0% 136.4 4.7 12.3 May-17
Industry Mean 6.79 -5.8% 290.9 4.4 9.2 N/AIndustry Median 4.47 -11.3% 297.8 4.7 11.1 N/AS&P 500 1.00 20.2% N/A 4.3 5.1 Dec-99
Small Cap JuniorsADVANTAGE LITHIUM CORP. AAL.V TSXV 4.47 -1.7% 166.1 2.9 11.9 Apr-16BEARING LITHIUM LTD. BRZ.V TSXV 1.72 -11.3% 39.1 5.0 9.7 Feb-17LITHIUM AMERICAS CORP. LAC.CA TSX 3.92 -22.0% 771.5 5.5 8.5 Dec-17LITHIUM X ENERGY CORP. LIX.V TSXV 1.16 5.0% 250.6 2.9 7.4 Mar-16MILLENNIAL LITHIUM CORP. ML.V TSXV 4.50 13.1% 297.8 5.3 11.1 Sep-16NEO LITHIUM CORP. NLC.V TSXV 24.96 -18.3% 220.3 4.7 6.5 Jan-18
Larger Cap ProducersOROCOBRE LTD ORE ASX 1.27 -5.3% 1,634 5.1 6.1 Jan-18SQM SQM NYSE 1.50 -9.8% 14,097 6.4 7.4 Jan-18ALBEMARLE ALB NYSE 1.72 -15.9% 11,880 3.0 4.1 Nov-17
Industry Comparables
We believe that companies like Advantage Lithium Corp. (TSXV: AAL), Bearing Lithium (TSXV: BRZ), Lithium Americas Corp. (TSX: LAC), Lithium X Energy (TSXV: LIX), Millennial Lithium Corp. (TSXV: ML) and Neo Lithium Corp. (TSXV: NLC) are suitable comparables. The companies range in market capitalization from about $40 million to $770 million with each controlling properties with salars encompassing roughly 4,000-to-47,000 hectares. All operate in the exploration-pre-feasibility stage, focusing on the acquisition and/or exploration of lithium-brine properties. All are also focused on salars in the Lithium Triangle.
Though lithium-brine companies may trade as a group based on the fundamentals of lithium in general, peak valuations of individual stocks are largely determined by company specific developments (reaching a particular project development milestone or announcing a property/company transaction). To determine our target, we observed the peak valuation levels of the comparable companies, which range from 6.5-to-11.9 times book value. We believe that Wealth Minerals can attain at least an industry average peak price-to-book valuation of 9.2 times book; therefore, our target is $2.60 per share.
The stocks of junior mining companies have a unique trading profile. The stocks tend to mark time, trading sideways-to-down, during an incubation phase until a discovery, partnership or acquisition is announced. Significant positive results are the stimulus for upside gaps in stock s price in a mark-up phase as the new information is discounted by first-movers.

Zacks Investment Research Page 22 scr.zacks.com
In the case of Wealth Minerals, management s change in focus from gold to lithium in early 2016 (and the subsequent acquisition of control over multiple properties) sparked considerable price appreciation on heavy volume (+680% from $0.25 to $1.96). At some point, the newly created demand instigated by the company s new emphasis on prospective lithium-brine properties is fulfilled.
After the initial rally, another period of time of sideways-to-down action occurs. Often the stock retraces some, or sometimes all, of the prior price-appreciation during this digestion phase. If and when subsequent acquisitions or partnerships to facilitate project development are announced, another mark-up phase typically is set in motion.
RISKS
As with almost all junior resource exploration companies, the accounting firm s opinion in the company s most recent annual filing to SEDAR contains the standard language for a company that does not generate sufficient cash flow from operations to adequately fund its activities and is in need of additional capital to continue as a going concern. Wealth Minerals has effectively funded its operations and initiatives to date. In fact, the company s working capital in now positive due to the successful completion of recent private placements. Despite the fact that management expects to operate at a loss for the foreseeable future, we believe that the company should be able to continue to raise additional capital over the near-term as the demand for lithium continues to increase.
Shares outstanding have increased dramatically in fiscal 2015 (+140%), fiscal 2016 (+94%) and the first nine months of fiscal 2017 (+25.5%) as private placements and option agreement payments funded the company s acquisition of options on exploration concessions and other activities.
The acquisition of greenfield mining concessions, exploration for resource deposits and advancement of prospective mineral properties is a speculative endeavor for junior mining companies. Many risks are beyond the company s control, especially the fluctuations in the price of the sought-after mineral and potential changes in governmental regulations. In the case of Wealth Minerals, the macro-economic dynamics of the lithium industry appear very positive while the Government of Chile is considered to be mining friendly, which is demonstrated by its mining laws and by overt statements by officials encouraging foreign investment in the sector.
There are no known resources or reserves on any of the properties over which Wealth Mineral has control. There is no assurance that exploration will discover NI 43-101-compliant resources or that partners can be found to help defray the cost of advancing the company s projects.

Zacks Investment Research Page 23 scr.zacks.com
BALANCE SHEET
Wealth Minerals Ltd.Year ending November 30th FY 2012 FY 2013 FY 2014 FY 2015 FY 2016 3Q FY 2017(Canadian Dollars) 11/ 30/ 2012 11/ 30/ 2013 11/ 30/ 2014 11/ 30/ 2015 11/ 30/ 2016 8/ 31/ 2017ASSETS
Cash and cash equivalents 70,660 7,057 4,946 96,887 2,988,156 3,567,779Accounts receivable 69,223 390,366 16,388 23,724 50,169 96,263Advances 0 0 0 0 188,173 2,099Prepaid expenses 87,388 28,021 21,166 35,916 73,994 63,461Total Current Assets 227,271 425,444 42,500 156,527 3,300,492 3,729,602
Equipment 10,718 7,698 5,545 9,040 10,866 9,613Exploration and evaluation assets 272,074 0 0 450,748 8,601,295 26,026,791TOTAL ASSETS 510,063 433,142 48,045 616,315 11,912,653 29,766,006
Liabilities and Stockholders' Equity
Accounts payable and accrued liabilities 169,816 477,453 396,009 224,457 202,747 688,079Loans payable 1,118,365 1,170,865 1,223,365 1,258,194 1,063,587 0Due to related parties 1,769,428 1,409,908 567,537 585,919 118,585 86,018Flow through share premium liabilities 0 0 0 0 71,506 0Total Current Liabilities 3,057,609 3,058,226 2,186,911 2,068,570 1,456,425 774,097
`TOTAL LIABILITIES 3,057,609 3,058,226 2,186,911 2,068,570 1,456,425 774,097
Capital stock 42,120,266 42,490,817 42,499,967 45,031,919 62,189,356 88,023,735Share based payment reserve 6,304,863 6,347,263 6,347,263 6,976,818 9,359,880 11,572,426Obligation to issue shares 0 0 1,290,800 50,000 0 0Accumulated deficit (50,972,675) (51,463,164) (52,276,896) (53,510,992) (61,093,008) (70,604,252)Total Stockholders' Equity (2,547,546) (2,625,084) (2,138,866) (1,452,255) 10,456,228 28,991,909
TOTAL LIABILITIES & STOCKHOLDERS' EQUITY 510,063 433,142 48,045 616,315 11,912,653 29,766,006
Shares outstanding 14,264,522 15,438,397 15,565,897 37,428,251 72,615,911 91,154,520

Zacks Investment Research Page 24 scr.zacks.com
INCOME STATEMENT
Wealth Minerals Ltd.Income Statement (Canadian Dollars) FY 2012 FY 2013 FY 2014 FY 2015 FY 2016 FY 2017 E
Period ending 11/ 30/ 2012 11/ 30/ 2013 11/ 30/ 2014 11/ 30/ 2015 10/ 30/ 2016 10/ 30/ 2017
Revenues 0 0 0 0 0 0
ExpensesAmortization 4,244 3,020 2,153 1,538 1,618 1,671Consulting 613,735 503,958 217,925 832,980 1,884,342 1,855,444Exploration and evaluation expenditures 231,748 20,381 14,914 278,237 553,561 3,135,447Foreign exchange loss (gain) 11,571 13,235 (31,733) 3,993 4,000 42,223Listing and transfer agent fees 38,450 15,542 18,162 24,914 101,552 94,026Office, administration and miscellaneous 122,070 92,409 70,090 57,034 77,484 241,334Option termination costs 0 0 0 0 669,500 0Professional fees 151,584 122,810 48,965 97,058 333,870 1,492,522Property investigation 0 29,786 900 0 0 0Rent 52,109 30,161 26,646 28,851 33,659 32,966Salary 69,787 57,617 22,702 516 15,277 69,998Share-based compensation 270,336 0 0 629,555 2,829,366 2,509,465Shareholders communications 50,272 102,624 11,121 72,086 395,933 566,366Travel and promotion 0 22,088 24,262 79,357 190,022 424,780Loss Before Other Income (Expenses) (1,615,906) (1,013,631) (426,107) (2,106,119) (7,090,184) (10,466,242)
Other income (expense):Interest income (expense) (201,533) (52,500) (52,500) (52,500) (45,393) (3,378)Gain (loss) from discontinued operations (2,226,758) 847,716 0 0 0 0Recovery (loss) of flow-through premium 0 0 0 0 33,494 67,165Gain (loss) on settlement of debt 0 0 0 968,100 (412,865) (531,402)Forgiveness of debt 0 0 21,323 146,423 0 0Gain (loss) on debt 0 0 (346,248) 0 0 0Recovery (write-off) of accounts payable 0 0 0 0 67,555 0Recovery (write-off) of accounts receivable 0 0 0 0 0 (1,000)Exploration and evaluation assets (write-down) 0 (272,074) (10,200) (190,000) (134,623) (290,000)Total other income (expense) (2,428,291) 523,142 (387,625) 872,023 (491,832) (758,615)
Net Loss Before Tax (4,044,197) (490,489) (813,732) (1,234,096) (7,582,016) (11,224,857)Income tax expense (recovery) 0 0 0 0 0 0Net Loss (4,044,197) (490,489) (813,732) (1,234,096) (7,582,016) (11,224,857)
Net loss per share:Basic and diluted loss per share (0.29) (0.03) (0.05) (0.04) (0.14) (0.13)
Wgted avg. shares - basic & diluted 13,798,490 15,438,397 15,466,342 30,614,725 54,337,350 83,809,375
Zacks Investment Research Page 25 scr.zacks.com
Wealth Minerals Ltd.Income Statement Fiscal Year 1Q 2Q 3Q 4Q Fiscal Year(Canadian Dollars) FY 2015 FY 2016 FY 2016 FY 2016 FY 2016 FY 2016
Period ending 11/ 30/ 2015 2/ 28/ 2016 5/ 31/ 2016 8/ 31/ 2016 11/ 30/ 2016 11/ 30/ 2016
Revenues 0 0 0 0 0 0
General and Administrative ExpensesAmortization 1,538 276 276 663 403 1,618Consulting 832,980 296,977 394,242 803,564 389,559 1,884,342Exploration and evaluation expenditures 278,237 29,357 69,301 217,873 237,030 553,561Foreign exchange loss (gain) 3,993 (1,599) 5,823 (8,665) 8,441 4,000Forgiveness of debt (146,423) (207,135) 0 0 207,135 0Interest 52,500 13,125 11,852 10,319 10,097 45,393Listing and transfer agent fees 24,914 30,546 16,301 14,800 39,905 101,552Loss (gain) on settlement of debt (968,100) - 620,000 0 (207,135) 412,865Office, administration and miscellaneous 57,034 14,983 22,044 27,919 12,538 77,484Option termination costs 0 133,333 133,333 402,834 669,500Professional fees 97,058 28,238 67,133 72,902 165,597 333,870Recovery of accounts payable 0 0 0 0 (67,555) (67,555)Recovery of flow-through premium 0 0 0 (354) (33,140) (33,494)Rent 28,851 8,999 6,310 9,121 9,229 33,659Salaries and benefits 516 0 0 0 15,277 15,277Share-based compensation 629,555 0 900,498 1,928,868 0 2,829,366Shareholders communications 72,086 25,562 81,842 124,255 164,274 395,933Travel and promotion 79,357 15,442 68,568 24,292 81,720 190,022Write-off of exploration and evaluation assets 190,000 0 0 46,610 88,013 134,623Total Expenses 1,234,096 254,771 2,397,523 3,405,500 1,524,222 7,582,016
Net Loss (1,234,096) (254,771) (2,397,523) (3,405,500) (1,524,222) (7,582,016)
Net loss per share:Basic and diluted loss per share (0.04) (0.01) (0.05) (0.06) (0.02) (0.14)
Wgted avg. shares - basic & diluted 30,614,725 39,472,207 48,765,064 61,027,914 61,027,914 54,337,350
Income Statement Fiscal Year 1Q 2Q 3Q 4Q E Fiscal Year(Canadian Dollars) FY 2016 FY 2017 FY 2017 FY 2017 FY 2017 FY 2017 E
Period ending 11/ 30/ 2016 2/ 28/ 2017 5/ 31/ 2017 8/ 31/ 2017 11/ 30/ 2017 11/ 30/ 2017
Revenues 0 0 0 0 0 0
General and Administrative ExpensesAmortization 1,618 417 419 417 418 1,671Consulting 1,884,342 401,533 392,543 661,368 400,000 1,855,444Exploration and evaluation expenditures 553,561 1,169,599 668,087 647,761 650,000 3,135,447Foreign exchange loss 4,000 38,585 9,176 (5,538) 0 42,223Forgiveness of debt 0 0 0 0 0 0Interest 45,393 3,378 0 0 0 3,378Listing and transfer agent fees 101,552 18,010 54,608 6,408 15,000 94,026Loss (gain) on settlement of debt 412,865 531,402 0 0 0 531,402Office, administration and miscellaneous 77,484 24,604 150,112 31,618 35,000 241,334Option termination costs 669,500 0 0 0 0 0Professional fees 333,870 288,877 272,720 580,925 350,000 1,492,522Recovery of accounts payable (67,555) 0 0 0 0 0Recovery of flow-through premium (33,494) (67,165) 0 0 0 (67,165)Rent 33,659 9,756 9,341 6,869 7,000 32,966Salaries and benefits 15,277 0 63,415 6,583 0 69,998Share-based compensation 2,829,366 993,457 0 1,516,008 0 2,509,465Shareholders communications 395,933 71,886 126,842 217,638 150,000 566,366Travel and promotion 190,022 57,725 107,640 153,220 106,195 424,780Write-off of exploration and evaluation assets 134,623 0 0 290,000 0 290,000Write-off of accounts receivable 0 0 1,000 0 0 1,000Total Expenses 7,582,016 3,542,064 1,855,903 4,113,277 1,713,613 11,224,857
Net Loss (7,582,016) (3,542,064) (1,855,903) (4,113,277) (1,713,613) (11,224,857)
Net loss per share:Basic and diluted loss per share (0.14) (0.05) (0.02) (0.05) (0.02) (0.13)
Wgted avg. shares - basic & diluted 54,337,350 74,601,674 80,651,326 87,523,175 92,461,326 83,809,375

Zacks Investment Research Page 26 scr.zacks.com
HISTORICAL STOCK PRICE

Zacks Investment Research Page 27 scr.zacks.com
DISCLOSURES
The following disclosures relate to relationships between Zacks Small-Cap Research ( Zacks SCR ), a division of Zacks Investment Research ( ZIR ), and the issuers covered by the Zacks SCR Analysts in the Small-Cap Universe.
ANALYST DISCLOSURES
I, Steven Ralston, hereby certify that the view expressed in this research report accurately reflect my personal views about the subject securities and issuers. I also certify that no part of my compensation was, is, or will be, directly or indirectly, related to the recommendations or views expressed in this research report. I believe the information used for the creation of this report has been obtained from sources I considered to be reliable, but I can neither guarantee nor represent the completeness or accuracy of the information herewith. Such information and the opinions expressed are subject to change without notice.
INVESTMENT BANKING AND FEES FOR SERVICES
Zacks SCR does not provide investment banking services nor has it received compensation for investment banking services from the issuers of the securities covered in this report or article. Zacks SCR has received compensation from the issuer directly or from an investor relations consulting firm engaged by the issuer for providing non-investment banking services to this issuer and expects to receive additional compensation for such non-investment banking services provided to this issuer. The non-investment banking services provided to the issuer includes the preparation of this report, investor relations services, investment software, financial database analysis, organization of non-deal road shows, and attendance fees for conferences sponsored or co-sponsored by Zacks SCR. The fees for these services vary on a per-client basis and are subject to the number and types of services contracted. Fees typically range between ten thousand and fifty thousand dollars per annum. Details of fees paid by this issuer are available upon request.
POLICY DISCLOSURES
This report provides an objective valuation of the issuer today and expected valuations of the issuer at various future dates based on applying standard investment valuation methodologies to the revenue and EPS forecasts made by the SCR Analyst of the issuer s business. SCR Analysts are restricted from holding or trading securities in the issuers that they cover. ZIR and Zacks SCR do not make a market in any security followed by SCR nor do they act as dealers in these securities. Each Zacks SCR Analyst has full discretion over the valuation of the issuer included in this report based on his or her own due diligence. SCR Analysts are paid based on the number of companies they cover. SCR Analyst compensation is not, was not, nor will be, directly or indirectly, related to the specific valuations or views expressed in any report or article.
ADDITIONAL INFORMATION
Additional information is available upon request. Zacks SCR reports and articles are based on data obtained from sources that it believes to be reliable, but are not guaranteed to be accurate nor do they purport to be complete. Because of individual financial or investment objectives and/or financial circumstances, this report or article should not be construed as advice designed to meet the particular investment needs of any investor. Investing involves risk. Any opinions expressed by Zacks SCR Analysts are subject to change without notice. Reports or articles or tweets are not to be construed as an offer or solicitation of an offer to buy or sell the securities herein mentioned.