zacks small-cap researchs1.q4cdn.com/.../news/2018/apr172018_v.wml_ralston.pdf · zacks investment...
TRANSCRIPT

© Copyright 2018, Zacks Investment Research. All Rights Reserved.
Wealth Minerals Ltd. (V.WML TSX-V)
Current Price (04/16/18) $1.35
Valuation $2.55
OUTLOOK
SUMMARY DATA
Risk Level Above Average
Type of Stock Small - Value
Industry Mining
Wealth Minerals is a junior mineral exploration company that is well-positioned to benefit from its portfolio of prospective lithium projects in the Lithium Triangle. The company holds control over portions of four lithium salar projects in northern Chile (Atacama, Trinity, Laguna Verde and Five Salars). Management intends to advance its concessions through exploration programs and opportunistically acquire additional ones. The Agreement with ENAMI creates a path for the development of Wealth s Atacama and Laguna Verde Projects. The Lithium Triangle appears to be the global sweet spot for low-cost incremental supply of lithium.
52-Week High $2.34
52-Week Low $1.16
One-Year Return (%) -4.93
Beta 2.41
Average Daily Volume (shrs.) 399,879
Shares Outstanding (million) 111.19
Market Capitalization ($mil.) $150.11
Short Interest Ratio (days) N/A
Institutional Ownership (%) N/A
Insider Ownership (%) N/A
Annual Cash Dividend $0.00
Dividend Yield (%) 0.00
5-Yr. Historical Growth Rates
Sales (%) N/A
Earnings Per Share (%) N/A
Dividend (%) N/A
P/E using TTM EPS N/M
P/E using 2018 Estimate N/M
P/E using 2019 Estimate N/M
ZACKS ESTIMATES
Revenue (in millions of $)
Q1 Q2 Q3 Q4 Year (Feb) (May) (Aug) (Nov) (Nov)
2016 0.0 A
0.0 A
0.0 A
0.0 A
0.0 A
2017 0.0 A
0.0 A
0.0 A
0.0 A
0.0 E
2018 0.0 E
0.0 E
0.0 E
0.0 E
0.0 E
2019
0.0 E
Earnings per Share (EPS is operating earnings before non-recurring items)
Q1 Q2 Q3 Q4 Year (Feb) (May) (Aug) (Nov) (Nov)
2016
-$0.01 A
-$0.05 A
-$0.06 A -$0.02 A -$0.14 A
2017
-$0.05 A -$0.02 A
-$0.05 A
-$0.03 A -$0.15 A
2018
-$0.04 E -$0.02 E
-$0.04 E
-$0.03 E -$0.13 E
2019
-$0.09 E
Zacks Projected EPS Growth Rate - Next 5 Years % N/A
Quarterly EPS may not equal annual EPS total due to rounding.
Zacks Small-Cap Research Steven Ralston, CFA
312-265-9426 [email protected]
scr.zacks.com 10 S. Riverside Plaza, Chicago, IL 60606
April 16, 2018
Wealth Minerals enters agreement with ENAMI to form a strategic alliance that should lead to a JV to develop WML s lithium properties
Based on comparative analysis that utilizes the valuation metric of price-to-book (P/B), an industry third quartile peak P/B ratio of 8.0 indicates a share price target of $2.55
Sponsored Impartial - Comprehensive

Zacks Investment Research Page 2 scr.zacks.com
KEY POINTS
Wealth Minerals is junior mining company pursuing a strategy of accumulating early stage exploration lithium projects within the Lithium Triangle, initially properties located in Chile.
Management s strategy is to increase shareholder value by gaining control of prospective lithium exploration concessions that encompass salars.
The Lithium Triangle, particularly in Chile and Argentina, appears to be the global sweet spot for low-cost incremental supply of lithium.
Management intends to advance the mineral concessions through exploration programs.
The company may enter joint venture partnerships with senior mining companies to advance concessions to further explore and develop each property, thereby potentially receiving cash payments to carry the projects into the future while laying off significant exploration costs onto the partner.
Management may consolidate properties under its control for the purpose of being able to offer more attractive packages of prospective lithium properties to senior mining companies.
Concurrently, additional prospective projects are being identified and evaluated in order to augment the company s portfolio of properties.
Thus far, since July 26, 2016, Wealth Minerals has entered into formal option agreements for multiple prospective lithium properties. After consolidating several properties into one project, the company now controls four projects (Atacama, Trinity, Laguna Verde and Five Salars) which encompass 75,900 hectares.
With lithium carbonate prices having risen significantly over the last three years from under $6,000 to above $22,000 per tonne, investors are intently focused on ferreting out opportunities in the lithium industry.
Consistent news flow from Tesla and other builders of battery gigafactories reinforces the macro-case for lithium.
Concurrently, the growth of Electric Vehicles should drive profound increases in demand for lithium.
Though there is some debate, as always, about the resolution of the current lithium supply-demand imbalance and the resulting effect on pricing, I fall into the camp that there will be insufficient supply to meet the anticipated demand over the next few years, which should result in a robust lithium pricing environment. Such opportunities, especially when accompanied with targeted areas, such as the Lithium Triangle, are infrequent and should be pursued vigorously when they occur.
On September 9, 2017, Xin Guobin, China s Vice Minister of Industry and Information Technology, announced at an auto forum in Tianjin that Chinese regulators are working on a timetable to phase out the production and sales of fossil fuel vehicles.
Since the company s projects are still in the early exploration stage and management continues to pursue acquiring control over additional properties, Wealth Minerals will continue to need to raise capital in order to fund the advancement of its lithium brine projects.

Zacks Investment Research Page 3 scr.zacks.com
Wealth Minerals Ltd.Formal Number
Exploration Option of HectaresProject Concession Date Concessions (approx.) Salar RegionAtacama 10/28/2016 144 46,200 Atacama II
Trinity various 42 10,500 II
Aguas Calientes NortePuritama 11/30/2016 8 2,000 Aguas Calientes II
Salar 7/25/2016 2 400 Aguas Calientes II
Quiso 9/5/2016 9 2,400 Quisquiro II
Pacana 2/1/2018 23 5,700 Pacana II
Laguna Verde 12/2/2016 23 2,438 Laguna Verde III
Land Package (Laguna Verde) 3Q FY2017 N/A 6,262 Laguna Verde III
Salar Green Green III
Union III
Five Salars 3Q FY2017 5 10,500 I, II, III
Ascotán 1 1,300 Ascotán II
Piedra Parada 1 1,900 Piedra Parada III
Huasco 1 5,300 Huasco I
Siglia 1 1,600 Siglia II
Lejia 1 400 Lejia II
Total under Formal Option Agreements 75,900
MOST RECENT EVENTS
Strategic Alliance with ENAMI
On March 19, 2018, Wealth Minerals announced that the company had entered into an agreement with ENAMI (Empresa Nacional de Minería aka National Mining Company of Chile) to form a strategic alliance
Zacks Investment Research Page 4 scr.zacks.com
that should result in a JV partnership for the development and commercialization of Wealth Minerals Projects in the Salar de Atacama and Laguna Verde. Management anticipates that it will be 24-month process to formally form and efficiently structure the JV, which will be 90% owned by Wealth Minerals and 10% owned by ENAMI with free-carried interest.
Under current Chilean law, lithium can only be exploited by the Government of Chile, a Chilean state-owned company or special operational contracts specified by the President of Chile. Only three (3) entities qualify to advance lithium projects to production in Chile: ENAMI, CORFO and CODELCO. ENAMI was founded in 1969 as a state company to promote the success of small-and-medium sized Chilean mining companies by providing toll milling and processing services. Founded in 1939, CORFO (Corporación de Fomento de la Producción aka Production Development Corporation) is a state development agency designed to promote economic development and business investments in Chile. CORFO is the governmental agency that has contracted Albemarle (NYSE: ALB) and Sociedad Química y Minera de Chile S.A. (NYSE: SQM) to extract lithium from the Salar de Atacama. CODELCO (Corporación Nacional del Cobre de Chile aka National Copper Corporation of Chile) is Chile s state-owned copper mining company, formed by nationalizing foreign-owned copper companies in 1976. Though CODELCO focuses on copper production (and also produces molybdenum and gold doré), the company appears to meet the state-mandated qualifications to enter the lithium space.
Capital Funding During Fiscal 2017
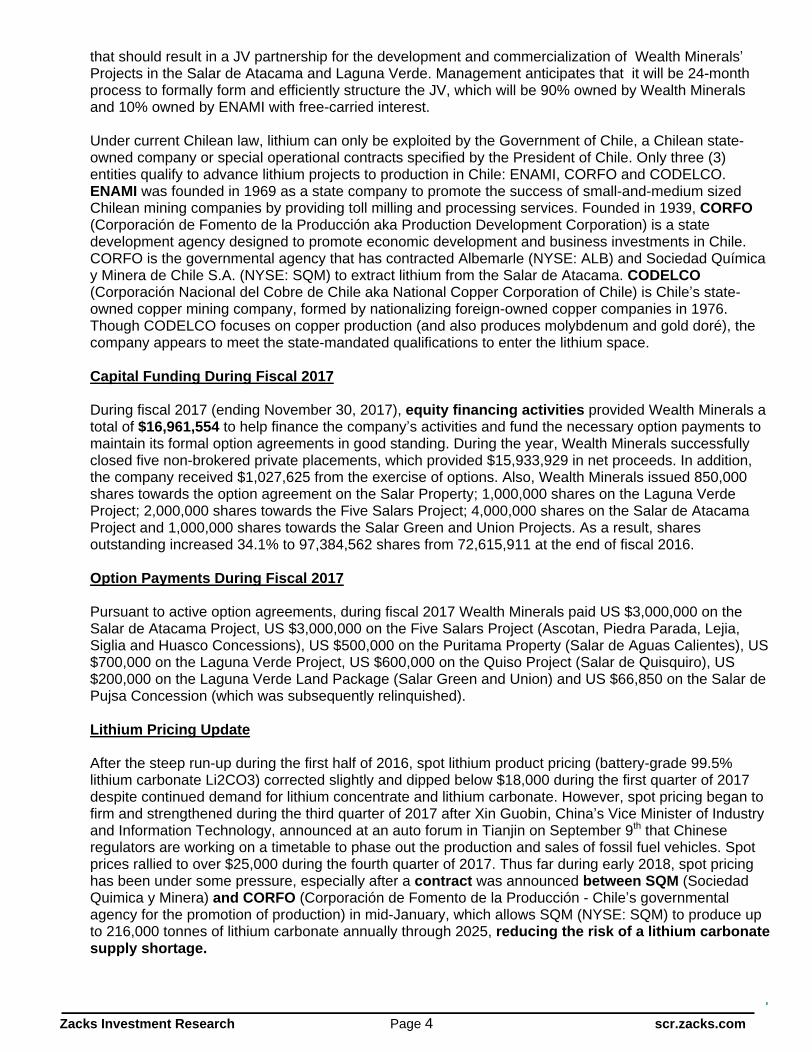
During fiscal 2017 (ending November 30, 2017), equity financing activities provided Wealth Minerals a total of $16,961,554 to help finance the company s activities and fund the necessary option payments to maintain its formal option agreements in good standing. During the year, Wealth Minerals successfully closed five non-brokered private placements, which provided $15,933,929 in net proceeds. In addition, the company received $1,027,625 from the exercise of options. Also, Wealth Minerals issued 850,000 shares towards the option agreement on the Salar Property; 1,000,000 shares on the Laguna Verde Project; 2,000,000 shares towards the Five Salars Project; 4,000,000 shares on the Salar de Atacama Project and 1,000,000 shares towards the Salar Green and Union Projects. As a result, shares outstanding increased 34.1% to 97,384,562 shares from 72,615,911 at the end of fiscal 2016.
Option Payments During Fiscal 2017
Pursuant to active option agreements, during fiscal 2017 Wealth Minerals paid US $3,000,000 on the Salar de Atacama Project, US $3,000,000 on the Five Salars Project (Ascotan, Piedra Parada, Lejia, Siglia and Huasco Concessions), US $500,000 on the Puritama Property (Salar de Aguas Calientes), US $700,000 on the Laguna Verde Project, US $600,000 on the Quiso Project (Salar de Quisquiro), US $200,000 on the Laguna Verde Land Package (Salar Green and Union) and US $66,850 on the Salar de Pujsa Concession (which was subsequently relinquished).
Lithium Pricing Update
After the steep run-up during the first half of 2016, spot lithium product pricing (battery-grade 99.5% lithium carbonate Li2CO3) corrected slightly and dipped below $18,000 during the first quarter of 2017 despite continued demand for lithium concentrate and lithium carbonate. However, spot pricing began to firm and strengthened during the third quarter of 2017 after Xin Guobin, China s Vice Minister of Industry and Information Technology, announced at an auto forum in Tianjin on September 9th that Chinese regulators are working on a timetable to phase out the production and sales of fossil fuel vehicles. Spot prices rallied to over $25,000 during the fourth quarter of 2017. Thus far during early 2018, spot pricing has been under some pressure, especially after a contract was announced between SQM (Sociedad Quimica y Minera) and CORFO (Corporación de Fomento de la Producción - Chile s governmental agency for the promotion of production) in mid-January, which allows SQM (NYSE: SQM) to produce up to 216,000 tonnes of lithium carbonate annually through 2025, reducing the risk of a lithium carbonate supply shortage.

Zacks Investment Research Page 5 scr.zacks.com
$6,450 $7,000 $7,000
$13,000
$22,000 $21,750$20,000
$18,500$20,000
$19,000
$24,000 $23,500 $23,500
$0
$5,000
$10,000
$15,000
$20,000
$25,000
1Q '15 2Q '15 3Q '15 4Q '15 1Q '16 2Q '16 3Q '16 4Q '16 1Q '17 2Q '17 3Q '17 4Q '17 1Q '18
Quarterly Average Lithium Carbonate PriceSpot Market - Battery Grade 99%+
($ per tonne)
Government Regulation to Bolster Lithium Demand
On September 9, 2017, at an auto industry event in Tianjin, Xin Guobin, China s Vice Minister of Industry and Information Technology, announced that Chinese regulators are working on a timetable to phase out the production and sales of fossil fuel vehicles. The Chinese Ministry stated that relevant research has begun in order to compose a timeline with an initial goal of having at least a fifth of Chinese automobile sales comprised of electric and plug-in hybrid cars by 2025.
As measured by the Global X Lithium & Battery Tech ETF (NYSE: LIT), the announcement sparked a 14%+ rally in lithium-related stocks over the subsequent seven market days.
The announcement follows similar plans announced by the French and UK governments in July 2017. In early July, Nicolas Hulot, the French Ecology Minister, announced plans for an end to the sale of petrol and diesel cars by 2040. A couple of weeks later, Great Britain made a similar announcement under a draft plan to improve air quality through the reduction of automotive emissions.
Fiscal 2017 Results
On March 29, 2018, Wealth Minerals reported financial results for the 2017 fiscal year ending November 30, 2017. For the fiscal year, the company reported a loss of $12,733,758 ($0.15 per diluted share) versus a loss of $7,825,061 ($0.14 per diluted share) in fiscal 2016.
Exploration and evaluation expenditures and professional fees expanded significantly due to increased exploration activities and increased need for legal services, respectively. Exploration and evaluation expenditures increased 412% or $2.28 million while professional fees increased 418% or $1.39 million.
The weighted average number of common shares outstanding increased 55.0% YOY to 84,204,987. At the end of the fiscal year, 97,384,562 shares were outstanding.
Zacks Investment Research Page 6 scr.zacks.com
Operational Update
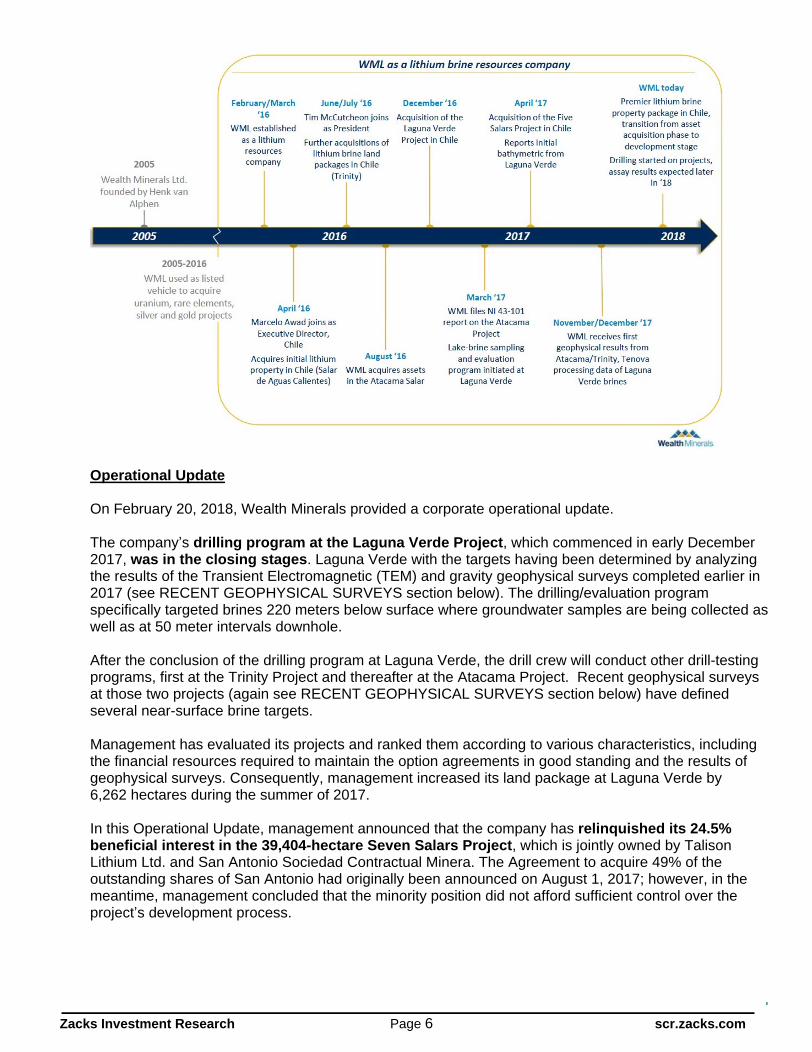
On February 20, 2018, Wealth Minerals provided a corporate operational update.
The company s drilling program at the Laguna Verde Project, which commenced in early December 2017, was in the closing stages. Laguna Verde with the targets having been determined by analyzing the results of the Transient Electromagnetic (TEM) and gravity geophysical surveys completed earlier in 2017 (see RECENT GEOPHYSICAL SURVEYS section below). The drilling/evaluation program specifically targeted brines 220 meters below surface where groundwater samples are being collected as well as at 50 meter intervals downhole.
After the conclusion of the drilling program at Laguna Verde, the drill crew will conduct other drill-testing programs, first at the Trinity Project and thereafter at the Atacama Project. Recent geophysical surveys at those two projects (again see RECENT GEOPHYSICAL SURVEYS section below) have defined several near-surface brine targets.
Management has evaluated its projects and ranked them according to various characteristics, including the financial resources required to maintain the option agreements in good standing and the results of geophysical surveys. Consequently, management increased its land package at Laguna Verde by 6,262 hectares during the summer of 2017.
In this Operational Update, management announced that the company has relinquished its 24.5% beneficial interest in the 39,404-hectare Seven Salars Project, which is jointly owned by Talison Lithium Ltd. and San Antonio Sociedad Contractual Minera. The Agreement to acquire 49% of the outstanding shares of San Antonio had originally been announced on August 1, 2017; however, in the meantime, management concluded that the minority position did not afford sufficient control over the project s development process.
Zacks Investment Research Page 7 scr.zacks.com
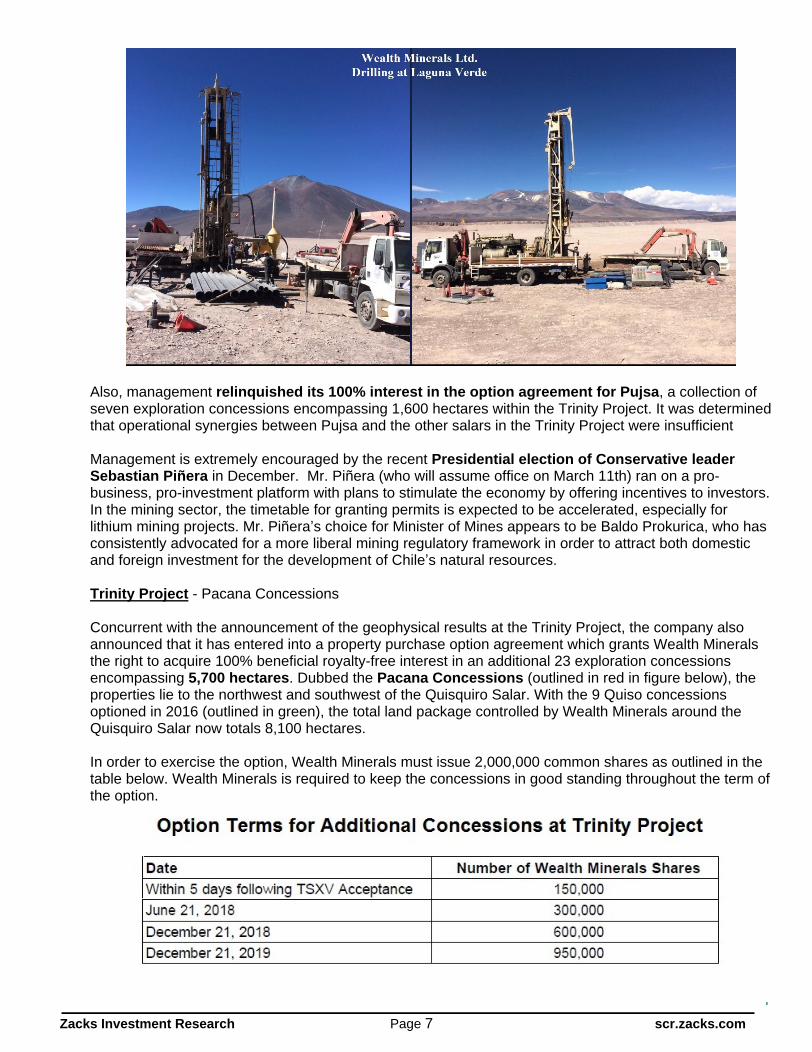
Also, management relinquished its 100% interest in the option agreement for Pujsa, a collection of seven exploration concessions encompassing 1,600 hectares within the Trinity Project. It was determined that operational synergies between Pujsa and the other salars in the Trinity Project were insufficient
Management is extremely encouraged by the recent Presidential election of Conservative leader Sebastian Piñera in December. Mr. Piñera (who will assume office on March 11th) ran on a pro-business, pro-investment platform with plans to stimulate the economy by offering incentives to investors. In the mining sector, the timetable for granting permits is expected to be accelerated, especially for lithium mining projects. Mr. Piñera s choice for Minister of Mines appears to be Baldo Prokurica, who has consistently advocated for a more liberal mining regulatory framework in order to attract both domestic and foreign investment for the development of Chile s natural resources.
Trinity Project
- Pacana Concessions
Concurrent with the announcement of the geophysical results at the Trinity Project, the company also announced that it has entered into a property purchase option agreement which grants Wealth Minerals the right to acquire 100% beneficial royalty-free interest in an additional 23 exploration concessions encompassing 5,700 hectares. Dubbed the Pacana Concessions (outlined in red in figure below), the properties lie to the northwest and southwest of the Quisquiro Salar. With the 9 Quiso concessions optioned in 2016 (outlined in green), the total land package controlled by Wealth Minerals around the Quisquiro Salar now totals 8,100 hectares.
In order to exercise the option, Wealth Minerals must issue 2,000,000 common shares as outlined in the table below. Wealth Minerals is required to keep the concessions in good standing throughout the term of the option.

Zacks Investment Research Page 8 scr.zacks.com
ATACAMA LITHIUM PROJECT
On October 28, 2016, Wealth Minerals entered into a formal property option agreement with Atacama Lithium SpA, granting the company the exclusive right to acquire a 100% royalty-free interest in 144 exploration mining concessions (pedimentos) known as the Atacama Lithium Project (aka Proyecto Atacama Lithium), which encompasses 46,200 hectares in Chile s Region II. The option agreement does not require any work commitments; however, Wealth Minerals is responsible for maintaining the concessions in good standing throughout the term of the option. The formal option agreement was submitted for registration with the Mining Registry of Calama, and the TSX Venture Exchange conditionally accepted transaction for filing on October 31, 2016. The completion of a NI 43-101 Technical Report on March 10, 2017 fulfilled the Exchange s condition.
The company s Atacama Lithium Project borders the producing claims held by Sociedad Quimica y Minera de Chile (SQM) and Albermarle Corp. (NYSE: ALB), each of which operates evaporation ponds and harvesting facilities that concentrate potassium and lithium compounds from subsurface brines in the south part of the Salar de Atacama, approximately 30 kilometers south and 50 kilometers south of the Atacama Lithium Project, respectively. The lithium concentrate is transported to processing plants for further purification into lithium carbonate and lithium chloride.
Prior Ownership
In 2016, Atacama Lithium SpA staked mining exploration concessions (pedimentos), and Chilean mining authorities have conferred title, free and clear of encumbrances, to Atacama Lithium SpA. In October 2016, Wealth Minerals entered into a formal property option agreement with Atacama Lithium SpA for the exclusive right to acquire a 100% royalty-free interest in the pedimentos now known as Atacama Lithium Project.
Salar de Atacama
The Salar de Atacama is the largest salar in Chile (surface area of 300,000 hectares) and the world s highest-grade lithium brine deposit, currently producing over 62,000 tonnes of lithium carbonate equivalent (LCE) annually or approximately one-third of global lithium output, making the Salar de Atacama the world s largest active lithium brine resource. The success of the commercial operations at the Salar de Atacama are due to the salar s high grade of lithium and potassium (1,840 mg/l and 22,630 mg/l, respectively), high rate of evaporation (3,200 mm per year) and exceptionally low annual rainfall (15mm average per year). Even though the Salar de Atacama hosts more than 15% of the world s known

Zacks Investment Research Page 9 scr.zacks.com
lithium reserves, exploration and production has occurred only in the southern portion of the Salar.
NI 43-101 Technical Report
On March 16, 2017 Wealth Minerals filed a NI 43-101 Technical Report on the Atacama Lithium Project. The report interprets that the principal source of lithium in the Salar de Atacama to be the lithium-bearing geothermal waters from the El Tatio geyser field located approximately 110 kilometers north of the salar. Geothermal fluids flow both on surface into the Rio Salado, which enters the Rio San Pedro, and subsurface into the northern reaches of the Salar de Atacama. The location of the Atacama Lithium Project would appear to benefit from the underground flows from the north. The Salar de Atacama is a closed fault-bounded basin that receives drainage from the north and east. Runoff from the east is local and seasonal and attributable to tributaries flowing from the Andes.
The surface area of the Atacama Lithium Project is predominantly mud flats and encrusted salts. Wealth Minerals plans to target subsurface aquifers within the Project area. With the assumption that the brines from the El Tatio geyser field travel from north to south through the exploration concessions that Wealth Minerals control and given that current commercial lithium production occurs proximately to the south, the 2017 Technical report states that exploration potential is good for the discovery of brines in the northern portion of the Salar .i
The Atacama Lithium Project is clearly an early stage exploration project. The Report states that there has been no exploration or development activity by prior owners within the Project in respect of lithium or potassium. Accordingly, there are no historic mineral resource or mineral reserve estimates and no data to support any resource or reserve estimate that would meet NI 43-101 standards. Furthermore, there has been no production of lithium from the Project. ii However, there are indications from prior regional work, based on surface sampling and geophysical work that a brine aquifer may exist on the Project. iii

Zacks Investment Research Page 10 scr.zacks.com
Exploration by Wealth Minerals
On December 14, 2017, Wealth Minerals announced it has received positive geophysical results for the Atacama Lithium Brine Project. The Magneto-Telluric (MT) and Transient Electromagnetic (TEM) surveys conducted by Southernrock Geophysics S.A. have identified very highly conductive (very low resistivity) zones, which are being interpreted as representing porous media with high-salinity fluids (and potentially lithium-bearing brines).
The surveys consisted of 141 MT and coincident loop TEM sites. In addition to the resistivity imaging, 1D inversion model data (presented as depth slices) were used to generate a 3D visualization in order to interpret the resistivity structure at depth.
The geophysical surveys provide many near-surface and deeper drill targets. Initial drill testing of shallow targets in the southwest (to a depth of between 100 and 150 meters) is being planned for the first quarter of 2018.

Zacks Investment Research Page 11 scr.zacks.com
OVERVIEW
Headquartered in Vancouver, British Columbia, Wealth Minerals Ltd (WML.V) is a junior exploration company that is building a portfolio of highly prospective lithium-brine mineral concessions located within the Lithium Triangle, currently targeting properties within salars situated in Chile. However, management s scope for potential lithium-in-water and brine candidates extends beyond the region in the search for prospective mineral properties.
Since July 2016, the company has entered into several formal option agreements to acquire interests in certain lithium exploration concessions, namely:
Atacama Project - option to acquire a 100% royalty-free interest in 144 exploration concessions (46,200 hectares) located the northern portion of the Salar de Atacama
Laguna Verde Project - option to acquire a 100% royalty-free interest in 23 mining concessions (2,438 hectares)
Trinity Project - comprised of three neighboring properties (totaling roughly 10,500 hectares) o Aguas Calientes Norte (Salar and Puritama totaling 2,400 hectares) o Quisquiro Salar (Quiso 2,400 hectares) o Pacana (5,700 hectares)
Salar Green and Union Projects option to acquire 6,262 hectares contiguous to the Laguna Verde Project.
Zacks Investment Research Page 12 scr.zacks.com
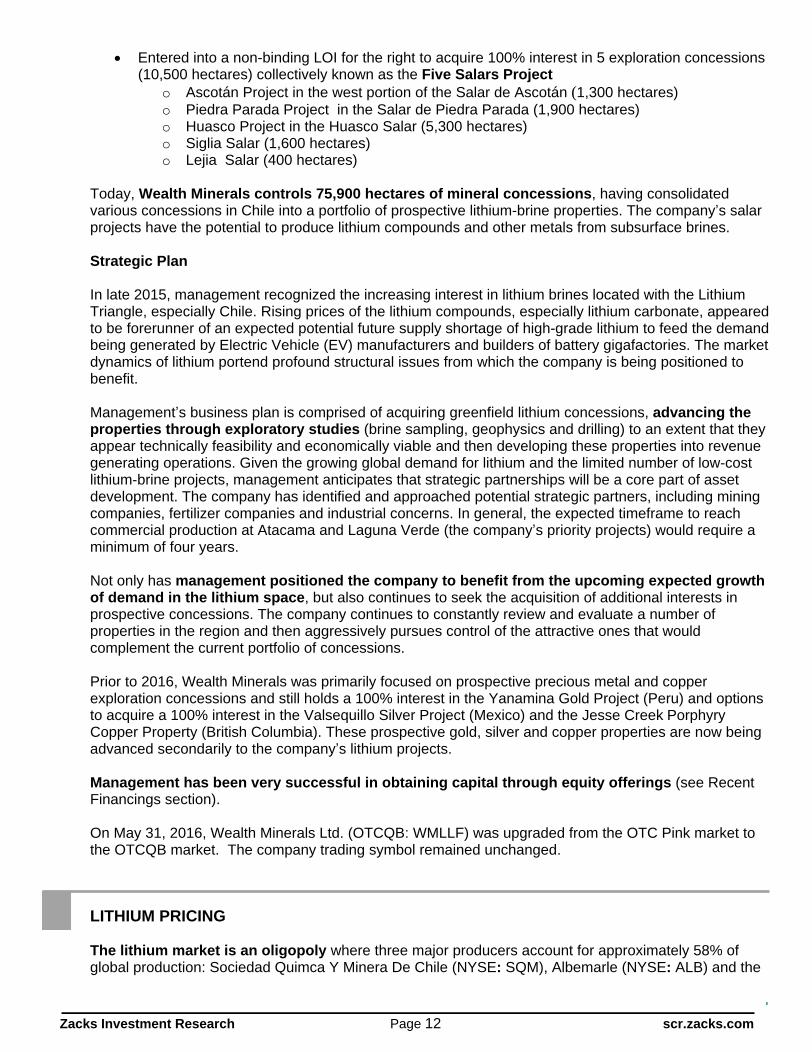
Entered into a non-binding LOI for the right to acquire 100% interest in 5 exploration concessions (10,500 hectares) collectively known as the Five Salars Project
o Ascotán Project in the west portion of the Salar de Ascotán (1,300 hectares) o Piedra Parada Project in the Salar de Piedra Parada (1,900 hectares) o Huasco Project in the Huasco Salar (5,300 hectares) o Siglia Salar (1,600 hectares) o Lejia Salar (400 hectares)
Today, Wealth Minerals controls 75,900 hectares of mineral concessions, having consolidated various concessions in Chile into a portfolio of prospective lithium-brine properties. The company s salar projects have the potential to produce lithium compounds and other metals from subsurface brines.
Strategic Plan
In late 2015, management recognized the increasing interest in lithium brines located with the Lithium Triangle, especially Chile. Rising prices of the lithium compounds, especially lithium carbonate, appeared to be forerunner of an expected potential future supply shortage of high-grade lithium to feed the demand being generated by Electric Vehicle (EV) manufacturers and builders of battery gigafactories. The market dynamics of lithium portend profound structural issues from which the company is being positioned to benefit.
Management s business plan is comprised of acquiring greenfield lithium concessions, advancing the properties through exploratory studies (brine sampling, geophysics and drilling) to an extent that they appear technically feasibility and economically viable and then developing these properties into revenue generating operations. Given the growing global demand for lithium and the limited number of low-cost lithium-brine projects, management anticipates that strategic partnerships will be a core part of asset development. The company has identified and approached potential strategic partners, including mining companies, fertilizer companies and industrial concerns. In general, the expected timeframe to reach commercial production at Atacama and Laguna Verde (the company s priority projects) would require a minimum of four years.
Not only has management positioned the company to benefit from the upcoming expected growth of demand in the lithium space, but also continues to seek the acquisition of additional interests in prospective concessions. The company continues to constantly review and evaluate a number of properties in the region and then aggressively pursues control of the attractive ones that would complement the current portfolio of concessions.
Prior to 2016, Wealth Minerals was primarily focused on prospective precious metal and copper exploration concessions and still holds a 100% interest in the Yanamina Gold Project (Peru) and options to acquire a 100% interest in the Valsequillo Silver Project (Mexico) and the Jesse Creek Porphyry Copper Property (British Columbia). These prospective gold, silver and copper properties are now being advanced secondarily to the company s lithium projects.
Management has been very successful in obtaining capital through equity offerings (see Recent Financings section).
On May 31, 2016, Wealth Minerals Ltd. (OTCQB: WMLLF) was upgraded from the OTC Pink market to the OTCQB market. The company trading symbol remained unchanged.
LITHIUM PRICING
The lithium market is an oligopoly where three major producers account for approximately 58% of global production: Sociedad Quimca Y Minera De Chile (NYSE: SQM), Albemarle (NYSE: ALB) and the

Zacks Investment Research Page 13 scr.zacks.com
FMC Lithium subsidiary of FMC (NYSE: FMC). The Big Three are diversified companies with divisions that produce the lithium compounds, such as lithium carbonate, lithium chloride and lithium hydroxide. SQM extracts lithium solutions from the brine deposits of the Salar de Atacama in northern Chile. Albemarle also has lithium brine operations at the Salar de Atacama and in addition, operates the Greenbushes spodumene mine in Australia with partner Sichuan Tianqi Lithium through the Talison JV. FMC Lithium s lithium reserves are located in the Salar del Hombre Muerto in Argentina. A few Chinese producers (like Jiangxi Ganfeng Lithium and Xinjiang Haoxing Lithium), which convert spodumene ore into lithium compounds, account for an additional 40%, which also includes Tianqi Lithium s 51% of production from the Australian Greenbushes mine.
Lithium is not traded on an exchange and lacks a transparent pricing mechanism like the LME or COMEX. Instead, a few producing companies manage supply, and lithium compounds are sold on a contract basis at specified prices that are set by direct negotiation between producers and customers. For the most part, these contract prices are not published; however, approximate values can be gathered from industry sources, company financial reports and management presentations. Firms like CRU, Macquarie and Roskill make periodic price assessments.
A small number of major producers supply well over 90% of the commercially available lithium with some analysts believing that the percentage may be as high as 98%. An extremely limited spot market satisfies incremental demand. As a result, very little high-grade lithium carbonate is available on the spot market so that modest changes in demand magnify the movement in price of lithium that is not under contract. The spot market represents a small amount of the lithium compounds actually sold, but is an indicator of marginal demand.
The price of lithium is most commonly quoted in $ per tonne of high-grade LCE (lithium carbonate equivalent), which generally has become the industry standard to estimate the unit value for lithium. It should be noted that lithium is sold in a variety of different lithium compounds, each available in different quantities, purities and particle size, often specific to various processes and applications. As a point of reference, lithium carbonate (Li2CO3) contains approximately 18.8% of lithium; consequently, 5.3 tonnes of lithium carbonate contains 1.0 tonne of lithium. Also, generally high-grade lithium carbonate (99%+ pure) sells at a $500-to-$1,000 per tonne premium to industrial-grade Li2CO3.
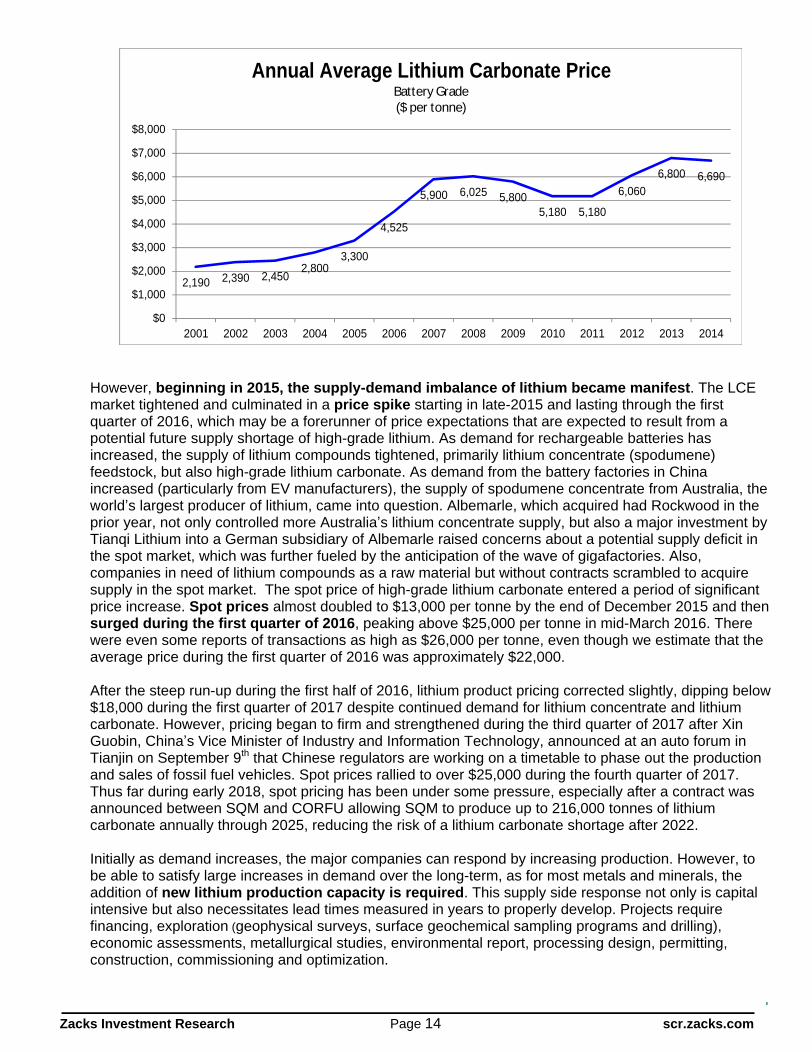
Over the past 15 years, supply/demand imbalances have impacted price. According to the USGS (which appears to utilize technical/industrial-grade prices), between 2001 and 2005, LCE prices were relatively stable with the average annual price between $1,720 and $1,460. However, from 2005 to 2009, the average annual price rose from $1,460 to $4,530 (32.7% CAGR). Following the global financial crisis (2009 to 2011), high-grade LCE prices declined to $3,870 in 2011, despite industry leaders SQM and Rockwood Holdings (which was acquired by Albemarle in 2014) idling capacity. From 2011 to 2014, LCR prices recovered to $4,510 (5.2% CAGR).
Zacks Investment Research Page 14 scr.zacks.com
2,190 2,390 2,4502,800
3,300
4,525
5,900 6,025 5,8005,180 5,180
6,060
6,800 6,690
$0
$1,000
$2,000
$3,000
$4,000
$5,000
$6,000
$7,000
$8,000
2001 2002 2003 2004 2005 2006 2007 2008 2009 2010 2011 2012 2013 2014
Annual Average Lithium Carbonate PriceBattery Grade($ per tonne)
However, beginning in 2015, the supply-demand imbalance of lithium became manifest. The LCE market tightened and culminated in a price spike starting in late-2015 and lasting through the first quarter of 2016, which may be a forerunner of price expectations that are expected to result from a potential future supply shortage of high-grade lithium. As demand for rechargeable batteries has increased, the supply of lithium compounds tightened, primarily lithium concentrate (spodumene) feedstock, but also high-grade lithium carbonate. As demand from the battery factories in China increased (particularly from EV manufacturers), the supply of spodumene concentrate from Australia, the world s largest producer of lithium, came into question. Albemarle, which acquired had Rockwood in the prior year, not only controlled more Australia s lithium concentrate supply, but also a major investment by Tianqi Lithium into a German subsidiary of Albemarle raised concerns about a potential supply deficit in the spot market, which was further fueled by the anticipation of the wave of gigafactories. Also, companies in need of lithium compounds as a raw material but without contracts scrambled to acquire supply in the spot market. The spot price of high-grade lithium carbonate entered a period of significant price increase. Spot prices almost doubled to $13,000 per tonne by the end of December 2015 and then surged during the first quarter of 2016, peaking above $25,000 per tonne in mid-March 2016. There were even some reports of transactions as high as $26,000 per tonne, even though we estimate that the average price during the first quarter of 2016 was approximately $22,000.
After the steep run-up during the first half of 2016, lithium product pricing corrected slightly, dipping below $18,000 during the first quarter of 2017 despite continued demand for lithium concentrate and lithium carbonate. However, pricing began to firm and strengthened during the third quarter of 2017 after Xin Guobin, China s Vice Minister of Industry and Information Technology, announced at an auto forum in Tianjin on September 9th that Chinese regulators are working on a timetable to phase out the production and sales of fossil fuel vehicles. Spot prices rallied to over $25,000 during the fourth quarter of 2017. Thus far during early 2018, spot pricing has been under some pressure, especially after a contract was announced between SQM and CORFU allowing SQM to produce up to 216,000 tonnes of lithium carbonate annually through 2025, reducing the risk of a lithium carbonate shortage after 2022.
Initially as demand increases, the major companies can respond by increasing production. However, to be able to satisfy large increases in demand over the long-term, as for most metals and minerals, the addition of new lithium production capacity is required. This supply side response not only is capital intensive but also necessitates lead times measured in years to properly develop. Projects require financing, exploration (geophysical surveys, surface geochemical sampling programs and drilling), economic assessments, metallurgical studies, environmental report, processing design, permitting, construction, commissioning and optimization.

Zacks Investment Research Page 15 scr.zacks.com
A number of greenfield hard rock and brine expansions are being advanced to alleviate the tight market situation. However, we do not expect that these few projects will be able to meet the rising level of demand until the mid-2020s, given the anticipated robust demand from a global wave of construction projects for new gigafactories and grid power storage initiatives, along with the continued growth in the demand for mobile devices.
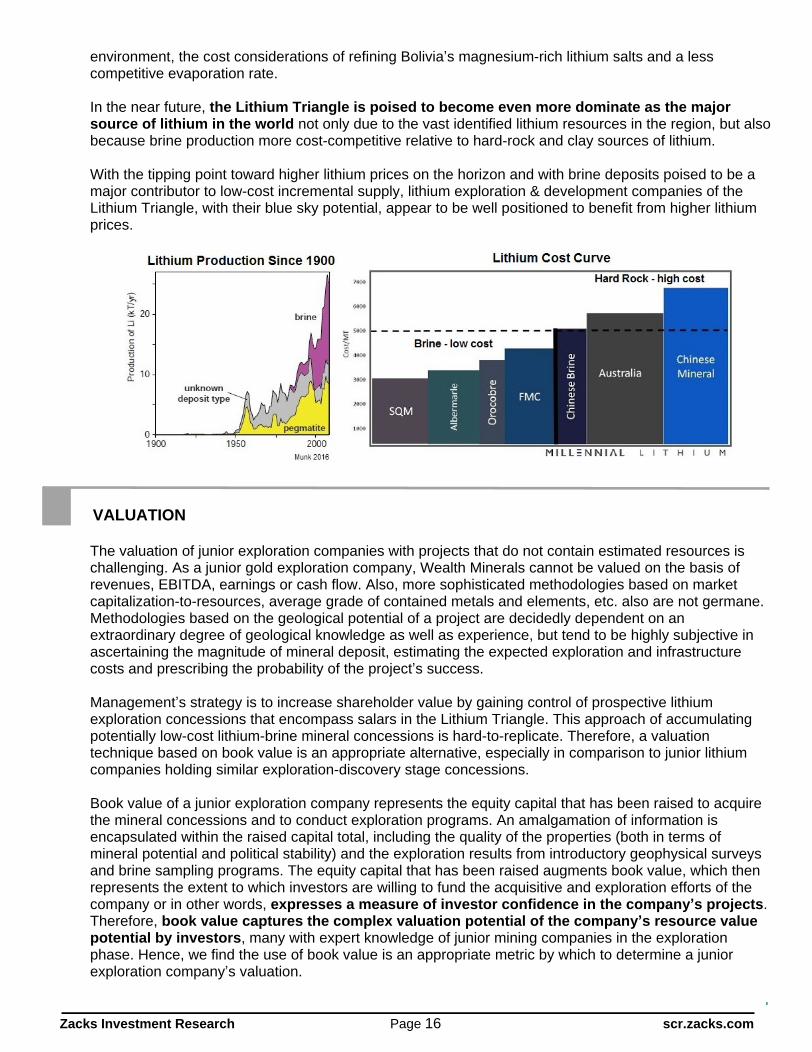
The lithium mining industry is expected to expand production through the development of new projects in order to accommodate increasing demand. Over the medium-term, the supply of lithium will be dominated by projects being initiated in Argentina, Chile, China and Australia, but particularly from the Lithium Triangle. Typically, the cost of production from brines is much lower than from hard rock, and therefore, it is expected that continental brine resources will be preferred over hard-rock ore for new capacity.
LITHIUM TRIANGLE
One of the world s largest and higher quality resource bases of lithium is the undeveloped brine deposits of the Lithium Triangle, which refers to one of the world s major continental evaporate complexes located in the mountainous region where borders of Argentina, Bolivia and Chile meet. The Lithium Triangle hosts many significant lithium brine deposits that have formed in the closed basins of this tectonically active and arid region. The concentration of saturated salt brines include accumulations of lithium salts: initially deposited during periods of intense volcanic activity along the west coast of South America in the late-Cretaceous to early-Tertiary Periods; subsequently conveyed by hydrothermal activity (via preferential flow paths previously created by tectonic activity); and later concentrated in depressions (often inland closed lakes and/or calderas) through weathering and leaching of the volcanic lithium source-rocks by snowmelt and rainwater run-off. Another potential mechanism for transporting lithium to the basins may have been the interaction of groundwater with the magmatic systems. Nevertheless, the accumulation of lithium-rich brine in closed basins (aka salars) within the Lithium Triangle is well documented.
Around half of the world s lithium supply is derived from the brines of the Lithium Triangle. Chile is the #2 producer of lithium in the world and the #1 in identified lithium resources, while Argentina is #3 in both categories. Though Bolivia is #1 in in identified lithium resources, the country only made its first shipment to China in August 2016 due to various reasons: the unfavorable political/business
Zacks Investment Research Page 16 scr.zacks.com
environment, the cost considerations of refining Bolivia s magnesium-rich lithium salts and a less competitive evaporation rate.
In the near future, the Lithium Triangle is poised to become even more dominate as the major source of lithium in the world not only due to the vast identified lithium resources in the region, but also because brine production more cost-competitive relative to hard-rock and clay sources of lithium.
With the tipping point toward higher lithium prices on the horizon and with brine deposits poised to be a major contributor to low-cost incremental supply, lithium exploration & development companies of the Lithium Triangle, with their blue sky potential, appear to be well positioned to benefit from higher lithium prices.
VALUATION
The valuation of junior exploration companies with projects that do not contain estimated resources is challenging. As a junior gold exploration company, Wealth Minerals cannot be valued on the basis of revenues, EBITDA, earnings or cash flow. Also, more sophisticated methodologies based on market capitalization-to-resources, average grade of contained metals and elements, etc. also are not germane. Methodologies based on the geological potential of a project are decidedly dependent on an extraordinary degree of geological knowledge as well as experience, but tend to be highly subjective in ascertaining the magnitude of mineral deposit, estimating the expected exploration and infrastructure costs and prescribing the probability of the project s success.
Management s strategy is to increase shareholder value by gaining control of prospective lithium exploration concessions that encompass salars in the Lithium Triangle. This approach of accumulating potentially low-cost lithium-brine mineral concessions is hard-to-replicate. Therefore, a valuation technique based on book value is an appropriate alternative, especially in comparison to junior lithium companies holding similar exploration-discovery stage concessions.
Book value of a junior exploration company represents the equity capital that has been raised to acquire the mineral concessions and to conduct exploration programs. An amalgamation of information is encapsulated within the raised capital total, including the quality of the properties (both in terms of mineral potential and political stability) and the exploration results from introductory geophysical surveys and brine sampling programs. The equity capital that has been raised augments book value, which then represents the extent to which investors are willing to fund the acquisitive and exploration efforts of the company or in other words, expresses a measure of investor confidence in the company s projects. Therefore, book value captures the complex valuation potential of the company s resource value potential by investors, many with expert knowledge of junior mining companies in the exploration phase. Hence, we find the use of book value is an appropriate metric by which to determine a junior exploration company s valuation.
Zacks Investment Research Page 17 scr.zacks.com
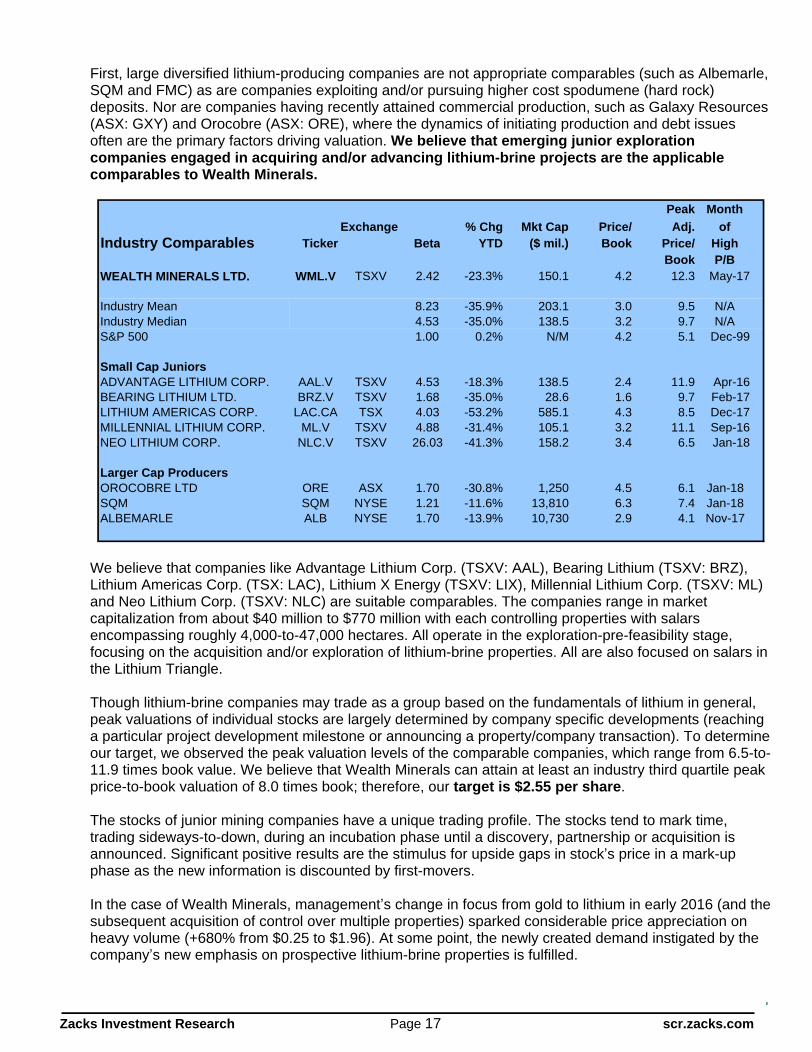
First, large diversified lithium-producing companies are not appropriate comparables (such as Albemarle, SQM and FMC) as are companies exploiting and/or pursuing higher cost spodumene (hard rock) deposits. Nor are companies having recently attained commercial production, such as Galaxy Resources (ASX: GXY) and Orocobre (ASX: ORE), where the dynamics of initiating production and debt issues often are the primary factors driving valuation. We believe that emerging junior exploration companies engaged in acquiring and/or advancing lithium-brine projects are the applicable comparables to Wealth Minerals.
Peak MonthExchange % Chg Mkt Cap Price/ Adj. of
Ticker Beta YTD ($ mil.) Book Price/ HighBook P/B
WEALTH MINERALS LTD. WML.V TSXV 2.42 -23.3% 150.1 4.2 12.3 May-17
Industry Mean 8.23 -35.9% 203.1 3.0 9.5 N/AIndustry Median 4.53 -35.0% 138.5 3.2 9.7 N/AS&P 500 1.00 0.2% N/M 4.2 5.1 Dec-99
Small Cap JuniorsADVANTAGE LITHIUM CORP. AAL.V TSXV 4.53 -18.3% 138.5 2.4 11.9 Apr-16BEARING LITHIUM LTD. BRZ.V TSXV 1.68 -35.0% 28.6 1.6 9.7 Feb-17LITHIUM AMERICAS CORP. LAC.CA TSX 4.03 -53.2% 585.1 4.3 8.5 Dec-17MILLENNIAL LITHIUM CORP. ML.V TSXV 4.88 -31.4% 105.1 3.2 11.1 Sep-16NEO LITHIUM CORP. NLC.V TSXV 26.03 -41.3% 158.2 3.4 6.5 Jan-18
Larger Cap ProducersOROCOBRE LTD ORE ASX 1.70 -30.8% 1,250 4.5 6.1 Jan-18SQM SQM NYSE 1.21 -11.6% 13,810 6.3 7.4 Jan-18ALBEMARLE ALB NYSE 1.70 -13.9% 10,730 2.9 4.1 Nov-17
Industry Comparables
We believe that companies like Advantage Lithium Corp. (TSXV: AAL), Bearing Lithium (TSXV: BRZ), Lithium Americas Corp. (TSX: LAC), Lithium X Energy (TSXV: LIX), Millennial Lithium Corp. (TSXV: ML) and Neo Lithium Corp. (TSXV: NLC) are suitable comparables. The companies range in market capitalization from about $40 million to $770 million with each controlling properties with salars encompassing roughly 4,000-to-47,000 hectares. All operate in the exploration-pre-feasibility stage, focusing on the acquisition and/or exploration of lithium-brine properties. All are also focused on salars in the Lithium Triangle.
Though lithium-brine companies may trade as a group based on the fundamentals of lithium in general, peak valuations of individual stocks are largely determined by company specific developments (reaching a particular project development milestone or announcing a property/company transaction). To determine our target, we observed the peak valuation levels of the comparable companies, which range from 6.5-to-11.9 times book value. We believe that Wealth Minerals can attain at least an industry third quartile peak price-to-book valuation of 8.0 times book; therefore, our target is $2.55 per share.
The stocks of junior mining companies have a unique trading profile. The stocks tend to mark time, trading sideways-to-down, during an incubation phase until a discovery, partnership or acquisition is announced. Significant positive results are the stimulus for upside gaps in stock s price in a mark-up phase as the new information is discounted by first-movers.
In the case of Wealth Minerals, management s change in focus from gold to lithium in early 2016 (and the subsequent acquisition of control over multiple properties) sparked considerable price appreciation on heavy volume (+680% from $0.25 to $1.96). At some point, the newly created demand instigated by the company s new emphasis on prospective lithium-brine properties is fulfilled.
Zacks Investment Research Page 18 scr.zacks.com
After the initial rally, another period of time of sideways-to-down action occurs. Often the stock retraces some, or sometimes all, of the prior price-appreciation during this digestion phase. If and when subsequent acquisitions or partnerships to facilitate project development are announced, another mark-up phase typically is set in motion.
RISKS
As with almost all junior resource exploration companies, the accounting firm s opinion in the company s most recent annual filing to SEDAR contains the standard language for a company that does not generate sufficient cash flow from operations to adequately fund its activities and is in need of additional capital to continue as a going concern. Wealth Minerals has effectively funded its operations and initiatives to date. In fact, the company s working capital in now positive due to the successful completion of recent private placements. Despite the fact that management expects to operate at a loss for the foreseeable future, we believe that the company should be able to continue to raise additional capital over the near-term as the demand for lithium continues to increase.
Shares outstanding have increased dramatically in fiscal 2015 (+140%), fiscal 2016 (+94%) and fiscal 2017 (+34.1%) as private placements and option agreement payments funded the company s acquisition of options on exploration concessions and other activities.
The acquisition of greenfield mining concessions, exploration for resource deposits and advancement of prospective mineral properties is a speculative endeavor for junior mining companies. Many risks are beyond the company s control, especially the fluctuations in the price of the sought-after mineral and potential changes in governmental regulations. In the case of Wealth Minerals, the macro-economic dynamics of the lithium industry appear very positive while the Government of Chile is considered to be mining friendly, which is demonstrated by its mining laws and by overt statements by officials encouraging foreign investment in the sector.
There are no known resources or reserves on any of the properties over which Wealth Mineral has control. There is no assurance that exploration will discover NI 43-101-compliant resources or that partners can be found to help defray the cost of advancing the company s projects.

Zacks Investment Research Page 19 scr.zacks.com
BALANCE SHEET
Wealth Minerals Ltd.Year ending November 30th FY 2012 FY 2013 FY 2014 FY 2015 FY 2016 FY 2017(Canadian Dollars) 11/ 30/ 2012 11/ 30/ 2013 11/ 30/ 2014 11/ 30/ 2015 11/ 30/ 2016 11/ 30/ 2017ASSETS
Cash and cash equivalents 70,660 7,057 4,946 96,887 2,988,156 2,474,738Accounts receivable 69,223 390,366 16,388 23,724 50,169 32,957Advances 0 0 0 0 188,173 8,711Prepaid expenses 87,388 28,021 21,166 35,916 73,994 97,042Total Current Assets 227,271 425,444 42,500 156,527 3,300,492 2,613,448
Equipment 10,718 7,698 5,545 9,040 10,866 25,305Exploration and evaluation assets 272,074 0 0 450,748 8,601,295 33,595,285TOTAL ASSETS 510,063 433,142 48,045 616,315 11,912,653 36,234,038
Liabilities and Stockholders' Equity
Accounts payable and accrued liabilities 169,816 477,453 396,009 224,457 202,747 605,901Loans payable 1,118,365 1,170,865 1,223,365 1,258,194 1,063,587 0Due to related parties 1,769,428 1,409,908 567,537 585,919 118,585 81,298Flow through share premium liabilities 0 0 0 0 71,506 0Total Current Liabilities 3,057,609 3,058,226 2,186,911 2,068,570 1,456,425 687,199
`TOTAL LIABILITIES 3,057,609 3,058,226 2,186,911 2,068,570 1,456,425 687,199
Capital stock 42,120,266 42,490,817 42,499,967 45,031,919 62,189,356 98,019,897Share based payment reserve 6,304,863 6,347,263 6,347,263 6,976,818 9,359,880 11,353,708Obligation to issue shares 0 0 1,290,800 50,000 0 0Accumulated deficit (50,972,675) (51,463,164) (52,276,896) (53,510,992) (61,093,008) (73,826,766)Total Stockholders' Equity (2,547,546) (2,625,084) (2,138,866) (1,452,255) 10,456,228 35,546,839
TOTAL LIABILITIES & STOCKHOLDERS' EQUITY 510,063 433,142 48,045 616,315 11,912,653 36,234,038
Shares outstanding 14,264,522 15,438,397 15,565,897 37,428,251 72,615,911 97,384,562

Zacks Investment Research Page 20 scr.zacks.com
INCOME STATEMENT
Wealth Minerals Ltd.Income Statement (Canadian Dollars) FY 2012 FY 2013 FY 2014 FY 2015 FY 2016 FY 2017
Period ending 11/ 30/ 2012 11/ 30/ 2013 11/ 30/ 2014 11/ 30/ 2015 10/ 30/ 2016 10/ 30/ 2017
Revenues 0 0 0 0 0 0
ExpensesAmortization 4,244 3,020 2,153 1,538 1,618 3,459Consulting 613,735 503,958 217,925 832,980 1,884,342 1,802,256Exploration and evaluation expenditures 231,748 20,381 14,914 278,237 553,561 2,835,192Foreign exchange loss (gain) 11,571 13,235 (31,733) 3,993 4,000 (41,355)Listing and transfer agent fees 38,450 15,542 18,162 24,914 101,552 162,836Office, administration and miscellaneous 122,070 92,409 70,090 57,034 77,484 269,006Option termination costs 0 0 0 0 669,500 0Professional fees 151,584 122,810 48,965 97,058 333,870 1,728,210Property investigation 0 29,786 900 0 0 0Rent 52,109 30,161 26,646 28,851 33,659 34,148Salary 69,787 57,617 22,702 516 15,277 73,290Share-based compensation 270,336 0 0 629,555 2,829,366 3,996,307Shareholders communications 50,272 102,624 11,121 72,086 395,933 517,697Travel and promotion 0 22,088 24,262 79,357 190,022 282,631Loss Before Other Income (Expenses) (1,615,906) (1,013,631) (426,107) (2,106,119) (7,090,184) (11,663,677)
Other income (expense):Interest income (expense) (201,533) (52,500) (52,500) (52,500) (45,393) (3,378)Gain (loss) from discontinued operations (2,226,758) 847,716 0 0 0 0Recovery (loss) of flow-through premium 0 0 0 0 33,494 71,506Gain (loss) on settlement of debt 0 0 0 968,100 (412,865) (491,082)Forgiveness of debt 0 0 21,323 146,423 0 0Gain (loss) on debt 0 0 (346,248) 0 0 0Recovery (write-off) of accounts payable 0 0 0 0 67,555 0Recovery (write-off) of accounts receivable 0 0 0 0 0 (46,582)Exploration and evaluation assets (write-down) 0 (272,074) (10,200) (190,000) (134,623) (600,545)Total other income (expense) (2,428,291) 523,142 (387,625) 872,023 (491,832) (1,070,081)
Net Loss Before Tax (4,044,197) (490,489) (813,732) (1,234,096) (7,582,016) (12,733,758)Income tax expense (recovery) 0 0 0 0 0 0Net Loss (4,044,197) (490,489) (813,732) (1,234,096) (7,582,016) (12,733,758)
Net loss per share:Basic and diluted loss per share (0.29) (0.03) (0.05) (0.04) (0.14) (0.15)
Wgted avg. shares - basic & diluted 13,798,490 15,438,397 15,466,342 30,614,725 54,337,350 84,204,987
Zacks Investment Research Page 21 scr.zacks.com
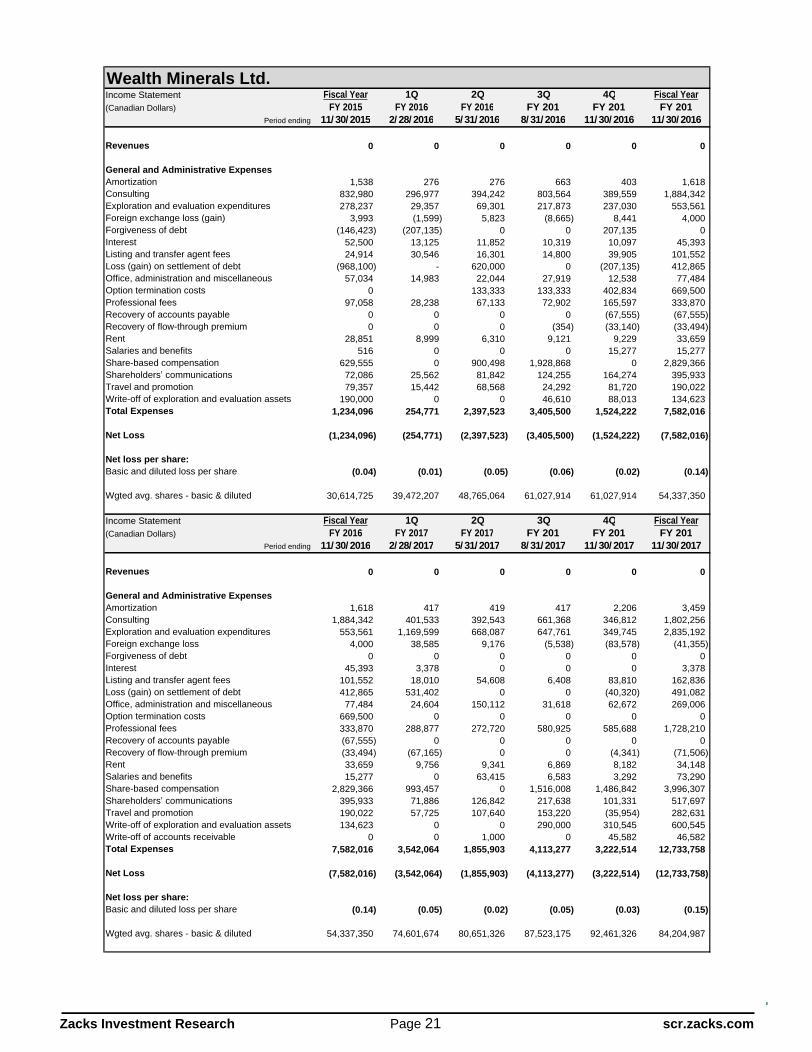
Wealth Minerals Ltd.Income Statement Fiscal Year 1Q 2Q 3Q 4Q Fiscal Year(Canadian Dollars) FY 2015 FY 2016 FY 2016 FY 2016 FY 2016 FY 2016
Period ending 11/ 30/ 2015 2/ 28/ 2016 5/ 31/ 2016 8/ 31/ 2016 11/ 30/ 2016 11/ 30/ 2016
Revenues 0 0 0 0 0 0
General and Administrative ExpensesAmortization 1,538 276 276 663 403 1,618Consulting 832,980 296,977 394,242 803,564 389,559 1,884,342Exploration and evaluation expenditures 278,237 29,357 69,301 217,873 237,030 553,561Foreign exchange loss (gain) 3,993 (1,599) 5,823 (8,665) 8,441 4,000Forgiveness of debt (146,423) (207,135) 0 0 207,135 0Interest 52,500 13,125 11,852 10,319 10,097 45,393Listing and transfer agent fees 24,914 30,546 16,301 14,800 39,905 101,552Loss (gain) on settlement of debt (968,100) - 620,000 0 (207,135) 412,865Office, administration and miscellaneous 57,034 14,983 22,044 27,919 12,538 77,484Option termination costs 0 133,333 133,333 402,834 669,500Professional fees 97,058 28,238 67,133 72,902 165,597 333,870Recovery of accounts payable 0 0 0 0 (67,555) (67,555)Recovery of flow-through premium 0 0 0 (354) (33,140) (33,494)Rent 28,851 8,999 6,310 9,121 9,229 33,659Salaries and benefits 516 0 0 0 15,277 15,277Share-based compensation 629,555 0 900,498 1,928,868 0 2,829,366Shareholders communications 72,086 25,562 81,842 124,255 164,274 395,933Travel and promotion 79,357 15,442 68,568 24,292 81,720 190,022Write-off of exploration and evaluation assets 190,000 0 0 46,610 88,013 134,623Total Expenses 1,234,096 254,771 2,397,523 3,405,500 1,524,222 7,582,016
Net Loss (1,234,096) (254,771) (2,397,523) (3,405,500) (1,524,222) (7,582,016)
Net loss per share:Basic and diluted loss per share (0.04) (0.01) (0.05) (0.06) (0.02) (0.14)
Wgted avg. shares - basic & diluted 30,614,725 39,472,207 48,765,064 61,027,914 61,027,914 54,337,350
Income Statement Fiscal Year 1Q 2Q 3Q 4Q Fiscal Year(Canadian Dollars) FY 2016 FY 2017 FY 2017 FY 2017 FY 2017 FY 2017
Period ending 11/ 30/ 2016 2/ 28/ 2017 5/ 31/ 2017 8/ 31/ 2017 11/ 30/ 2017 11/ 30/ 2017
Revenues 0 0 0 0 0 0
General and Administrative ExpensesAmortization 1,618 417 419 417 2,206 3,459Consulting 1,884,342 401,533 392,543 661,368 346,812 1,802,256Exploration and evaluation expenditures 553,561 1,169,599 668,087 647,761 349,745 2,835,192Foreign exchange loss 4,000 38,585 9,176 (5,538) (83,578) (41,355)Forgiveness of debt 0 0 0 0 0 0Interest 45,393 3,378 0 0 0 3,378Listing and transfer agent fees 101,552 18,010 54,608 6,408 83,810 162,836Loss (gain) on settlement of debt 412,865 531,402 0 0 (40,320) 491,082Office, administration and miscellaneous 77,484 24,604 150,112 31,618 62,672 269,006Option termination costs 669,500 0 0 0 0 0Professional fees 333,870 288,877 272,720 580,925 585,688 1,728,210Recovery of accounts payable (67,555) 0 0 0 0 0Recovery of flow-through premium (33,494) (67,165) 0 0 (4,341) (71,506)Rent 33,659 9,756 9,341 6,869 8,182 34,148Salaries and benefits 15,277 0 63,415 6,583 3,292 73,290Share-based compensation 2,829,366 993,457 0 1,516,008 1,486,842 3,996,307Shareholders communications 395,933 71,886 126,842 217,638 101,331 517,697Travel and promotion 190,022 57,725 107,640 153,220 (35,954) 282,631Write-off of exploration and evaluation assets 134,623 0 0 290,000 310,545 600,545Write-off of accounts receivable 0 0 1,000 0 45,582 46,582Total Expenses 7,582,016 3,542,064 1,855,903 4,113,277 3,222,514 12,733,758
Net Loss (7,582,016) (3,542,064) (1,855,903) (4,113,277) (3,222,514) (12,733,758)
Net loss per share:Basic and diluted loss per share (0.14) (0.05) (0.02) (0.05) (0.03) (0.15)
Wgted avg. shares - basic & diluted 54,337,350 74,601,674 80,651,326 87,523,175 92,461,326 84,204,987

Zacks Investment Research Page 22 scr.zacks.com
HISTORICAL STOCK PRICE

Zacks Investment Research Page 23 scr.zacks.com
DISCLOSURES
The following disclosures relate to relationships between Zacks Small-Cap Research ( Zacks SCR ), a division of Zacks Investment Research ( ZIR ), and the issuers covered by the Zacks SCR Analysts in the Small-Cap Universe.
ANALYST DISCLOSURES
I, Steven Ralston, hereby certify that the view expressed in this research report accurately reflect my personal views about the subject securities and issuers. I also certify that no part of my compensation was, is, or will be, directly or indirectly, related to the recommendations or views expressed in this research report. I believe the information used for the creation of this report has been obtained from sources I considered to be reliable, but I can neither guarantee nor represent the completeness or accuracy of the information herewith. Such information and the opinions expressed are subject to change without notice.
INVESTMENT BANKING AND FEES FOR SERVICES
Zacks SCR does not provide investment banking services nor has it received compensation for investment banking services from the issuers of the securities covered in this report or article. Zacks SCR has received compensation from the issuer directly or from an investor relations consulting firm engaged by the issuer for providing non-investment banking services to this issuer and expects to receive additional compensation for such non-investment banking services provided to this issuer. The non-investment banking services provided to the issuer includes the preparation of this report, investor relations services, investment software, financial database analysis, organization of non-deal road shows, and attendance fees for conferences sponsored or co-sponsored by Zacks SCR. The fees for these services vary on a per-client basis and are subject to the number and types of services contracted. Fees typically range between ten thousand and fifty thousand dollars per annum. Details of fees paid by this issuer are available upon request.
POLICY DISCLOSURES
This report provides an objective valuation of the issuer today and expected valuations of the issuer at various future dates based on applying standard investment valuation methodologies to the revenue and EPS forecasts made by the SCR Analyst of the issuer s business. SCR Analysts are restricted from holding or trading securities in the issuers that they cover. ZIR and Zacks SCR do not make a market in any security followed by SCR nor do they act as dealers in these securities. Each Zacks SCR Analyst has full discretion over the valuation of the issuer included in this report based on his or her own due diligence. SCR Analysts are paid based on the number of companies they cover. SCR Analyst compensation is not, was not, nor will be, directly or indirectly, related to the specific valuations or views expressed in any report or article.
ADDITIONAL INFORMATION
This research report is a product of Zacks SCR and prepared by a research analyst who is employed by or is a consultant to Zacks SCR. The research analyst preparing the research report is resident outside of Canada and is not an associated person of any Canadian registered adviser and/or dealer and, therefore, the analyst is not subject to supervision by a Canadian registered adviser and/or dealer, and is not required to satisfy the regulatory licensing requirements of any Canadian provincial securities regulators, the Investment Industry Regulatory Organization of Canada and is not required to otherwise comply with Canadian rules or regulations.
Additional information is available upon request. Zacks SCR reports and articles are based on data obtained from sources that it believes to be reliable, but are not guaranteed to be accurate nor do they purport to be complete. Because of individual financial or investment objectives and/or financial circumstances, this report or article should not be construed as advice designed to meet the particular investment needs of any investor. Investing involves risk. Any opinions expressed by Zacks SCR Analysts are subject to change without notice. Reports or articles or tweets are not to be construed as an offer or solicitation of an offer to buy or sell the securities herein mentioned.
i NI 43-101 Technical Report on the Atacama Lithium Project, El Loa Province, Region 2 Republic of Chile, March 10, 2017, 25.0 Interpretation and Conclusions. ii NI 43-101 Technical Report on the Atacama Lithium Project, El Loa Province, Region 2 Republic of Chile, March 10, 2017, 6.0 History. iii NI 43-101 Technical Report on the Atacama Lithium Project, El Loa Province, Region 2 Republic of Chile, March 10, 2017, 7.3 Mineralization.