zero-emission bus evaluation results: long beach transit
TRANSCRIPT

Zero-Emission Bus Evaluation Results: Long Beach Transit
Battery Electric Buses
FTA Report No. 0163 Federal Transit Administration
PREPARED BY
Leslie Eudy Matthew Jeffers
National Renewable Energy Laboratory
APRIL 2020

COVER PHOTO Image courtesy of NREL Image Gallery, https://images.nrel.gov/bp/#/, number 54532
DISCLAIMER This document is disseminated under the sponsorship of the U.S. Department of Transportation in the interest of information exchange. The United States Government assumes no liability for its contents or use thereof. The United States Government does not endorse products of manufacturers. Trade or manufacturers’ names appear herein solely because they are considered essential to the objective of this report.

FEDERAL TRANSIT ADMINISTRATION i
Zero-Emission Bus Evaluation Results: Long Beach Transit Battery Electric Buses
APRIL 2020FTA Report No. 0163
PREPARED BY
Leslie EudyMatthew JeffersNational Renewable Energy Laboratory 15013 Denver West Parkway Golden, CO 80401
SPONSORED BY
Federal Transit AdministrationOffice of Research, Demonstration and Innovation U.S. Department of Transportation1200 New Jersey Avenue, SEWashington, DC 20590
AVAILABLE ONLINE
https://www.transit.dot.gov/about/research-innovation

FEDERAL TRANSIT ADMINISTRATION iv
Metric Conversion Table
SYMBOL WHEN YOU KNOW MULTIPLY BY TO FIND SYMBOL
LENGTH
in inches 25.4 millimeters mm
ft feet 0.305 meters m
yd yards 0.914 meters m
mi miles 1.61 kilometers km
VOLUME
fl oz fluid ounces 29.57 milliliters mL
gal gallons 3.785 liters L
ft3 cubic feet 0.028 cubic meters m3
yd3 cubic yards 0.765 cubic meters m3
NOTE: volumes greater than 1000 L shall be shown in m3
MASS
oz ounces 28.35 grams g
lb pounds 0.454 kilograms kg
T short tons (2000 lb) 0.907 megagrams
(or "metric ton") Mg (or "t")
TEMPERATURE (exact degrees)
oF Fahrenheit 5 (F-32)/9
or (F-32)/1.8 Celsius oC
FEDERAL TRANSIT ADMINISTRATION ii
Metric Conversion TableMetric Conversion Table

FEDERAL TRANSIT ADMINISTRATION v
REPORT DOCUMENTATION PAGE Form ApprovedOMB No. 0704-0188
1. AGENCY USE ONLY 2. REPORT DATEApril 2020
3. REPORT TYPE AND DATES COVEREDJanuary–December 2018
Public reporting burden for this collection of information is estimated to average 1 hour per response, including the time for reviewing instruc-tions, searching existing data sources, gathering and maintaining the data needed, and completing and reviewing the collection of information. Send comments regarding this burden estimate or any other aspect of this collection of information, including suggestions for reducing this burden, to Washington Headquarters Services, Directorate for Information Operations and Reports, 1215 Jefferson Davis Highway, Suite 1204, Arlington, VA 22202-4302, and to the Office of Management and Budget, Paperwork Reduction Project (0704-0188), Washington, DC 20503.
4. TITLE AND SUBTITLEZero-Emission Bus Evaluation Results: Long Beach Transit Battery Electric Buses
5. FUNDING NUMBERS
6. AUTHOR(S)Leslie Eudy and Matthew Jeffers
7. PERFORMING ORGANIZATION NAME(S) AND ADDRESS(ES)National Renewable Energy Laboratory 15013 Denver West Parkway Golden, CO 80401
8. PERFORMING ORGANIZATION REPORT NUMBER
FTA Report No. 0163
9. SPONSORING/MONITORING AGENCY NAME(S) AND ADDRESS(ES) 10. SPONSORING/MONITORING AGENCY REPORTNUMBER
FTA Report No. 0163
11. SUPPLEMENTARY NOTES [https://www.transit.dot.gov/about/research-innovation] [https://doi.org/10.21949/1518335]
12A. DISTRIBUTION/AVAILABILITY STATEMENT Available from: National Technical Information Service (NTIS), Springfield, VA 22161. Phone 703.605.6000, Fax 703.605.6900, email [[email protected]]
12B. DISTRIBUTION CODE
TRI-30
13. ABSTRACTThis report summarizes the experience and results from a demonstration of a fleet of battery electric buses (BEB) operated by Long Beach Transit (LBT) in southern California. In 2011, LBT was awarded a $6.7 million grant through FTA’s Transit Investments for Greenhouse Gas and Energy Reduction (TIGGER) program to fund an electric bus pilot project. The agency selected BYD through a competitive bidding process to build ten 40-ft BEBs. FTA collaborated with the U.S. Department of Energy (DOE) and DOE’s National Renewable Energy Laboratory (NREL) to conduct in-service evaluations of advanced technology buses developed under its programs. This report presents evaluation results for the BEBs in comparison to baseline buses in similar service. The focus of the analysis is on one year of service from January through December 2018.
14. SUBJECT TERMSFederal Transit Administration; Office of Research, Demonstration and Innovation; Transit Investments for Greenhouse Gas and Energy Reduction; TIGGER; National Fuel Cell Bus Program
15. NUMBER OF PAGES54
16. PRICE CODE
17. SECURITY CLASSIFICATIONOF REPORTUnclassified
18. SECURITY CLASSIFICATIONOF THIS PAGE Unclassified
19. SECURITY CLASSIFICATIONOF ABSTRACTUnclassified
20. LIMITATION OF ABSTRACTUnlimited
U.S. Department of TransportationFederal Transit AdministrationOffice of Research, Demonstration and InnovationEast Building1200 New Jersey Avenue, SEWashington, DC 20590
Suggested citation: Federal Transit Administration. Zero-Emission Bus Evaluation Results: Long Beach Transit Battery Electric Buses. Washington, D.C.: United States Department of Transportation, 2020. https://doi.org/10.21949/1518335

FEDERAL TRANSIT ADMINISTRATION vi
1 Executive Summary
4 Section 1: Introduction 5 Fleet Profile—LBT
7
9
11
Section 2: Bus Technology Descriptions
Section 3: Charging Infrastructure
Section 4: In-Service Operations Evaluation Results 11 Route Assignments 12 Bus Use 14 Availability 17 Fuel Economy, Energy Use, and Cost 23 Roadcall Analysis 25 Maintenance Analysis
33 Section 5 Summary of Challenges 33 Lessons Learned 34 Technical Issues
36 Appendix A: Fleet Summary Statistics – LBT
41 Appendix B: Fleet Summary Statistics – SI Units
42 Acronyms/Abbreviations
43 Glossary
TABLE OF CONTENTS

FEDERAL TRANSIT ADMINISTRATION vii
6 Figure 1-1 LBT service area 7 Figure 2-1 LBT BEB 8 Figure 2-2 LBT CNG bus 9 Figure 3-1 Row of BEB parking with chargers at depot 10 Figure 3-2 LBT charger installed at depot 10 Figure 3-3 WAVE inductive charging station installed at Long Beach
Convention Center 11 Figure 4-1 Passport shuttle route 12 Figure 4-2 Cumulative miles for BEB fleet 13 Figure 4-3 Average monthly miles for BEB and CNG fleets 15 Figure 4-4 Monthly availability and reasons for unavailability for BEB fleet 15 Figure 4-5 Overall availability for BEB and CNG fleets during evaluation
period 17 Figure 4-6 Monthly Passport service fulfilled by BEB fleet 19 Figure 4-7 Monthly fuel economy for BEB and CNG fleets 20 Figure 4-8 Monthly average minimum SOC for BEB fleet 20 Figure 4-9 Electric utility daily power profiles for depot charging 21 Figure 4-10 Monthly total depot charges by bus for BEB fleet 22 Figure 4-11 Electric utility component costs for depot charging 22 Figure 4-12 CNG fuel component costs 23 Figure 4-13 Equivalent monthly average fuel price for BEB and CNG fleets 23 Figure 4-14 Monthly average fuel cost per mile for BEB and CNG fleets 25 Figure 4-15 Cumulative bus MBRC and propulsion-related MBRC 27 Figure 4-16 Monthly scheduled and unscheduled maintenance cost per mile 27 Figure 4-17 Monthly parts and labor maintenance cost per mile 29 Figure 4-18 Monthly maintenance cost per mile by system for BEB fleet 29 Figure 4-19 Monthly maintenance cost per mile by system for CNG fleet 30 Figure 4-20 Monthly maintenance cost per mile by propulsion subsystem
for BEB fleet 31 Figure 4-21 Monthly maintenance cost per mile by propulsion subsystem
for CNG fleet
1 Table ES-1 Summary of LBT Evaluation Results 5 Table 1-1 Selected Evaluation Projects 7 Table 2-1 System Descriptions for BEBs and CNG Buses 13 Table 4-1 Average Monthly Mileage (Evaluation Period) 14 Table 4-2 Availability for BEB and CNG Buses (Evaluation Period) 16 Table 4-3 Summary of Availability and Unavailability by Category 18 Table 4-4 Mileage, Fuel Use, and Fuel Economy
LIST OF FIGURES
LIST OF TABLES

FEDERAL TRANSIT ADMINISTRATION viii
24 Table 4-5 Roadcalls and MBRC 26 Table 4-6 Total Work Order Maintenance Costs 28 Table 4-7 Work Order Maintenance Cost per Mile by System 32 Table 4-8 Propulsion-Related Work Order Maintenance Costs by System 36 Table A-1 LBT – Fleet Operations and Economics 36 Table A-2 LBT – Maintenance Costs 37 Table A-3 LBT – Breakdown of Maintenance Costs by System 41 Table B-1 LBT – Fleet Operations and Economics (SI) 41 Table B-2 LBT – Maintenance Costs (SI)

FEDERAL TRANSIT ADMINISTRATION ix
AcknowledgmentsThis report could not have been possible without the cooperation of transit agencies, manufacturer partners, and others. Transit agency staff provided data on zero-emission and baseline buses, reviewed analyses and reports, and participated in meetings to discuss the agency’s overall experience. Manufacturers provided selected data and feedback and reviewed reports. The U.S. Department of Transportation’s (DOT’s) Federal Transit Administration (FTA) provided funding for the evaluation. The authors thank the following individuals:
• FTA Office of Research, Demonstration and Innovation
– Terrell Williams
– Sean Ricketson (former FTA staff)
– Mike Baltes
• Long Beach Transit (LBT)
– Brianna Lozada
– Steven Jorgensen
– Oscar Sanchez
– Samantha Ihlenfeldt
– China Gipson
– Enrique Medina
– Teresa Lopez
– Rolando Cruz (former LBT staff)
– Andrew Choi (former LBT staff)
– Tony Cohen (former LBT staff)
• BYD
– Bobby Hill
– James Holtz
– Macy Neshati (former BYD staff)
• Center for Transportation and the Environment
– Steve Clermont
– Will Manget

FEDERAL TRANSIT ADMINISTRATION x
AbstractThis report summarizes the experience and results from a demonstration of a fleet of battery electric buses (BEB) operated by Long Beach Transit (LBT) in southern California. In 2011, LBT was awarded a $6.7 million grant through FTA’s Transit Investments for Greenhouse Gas and Energy Reduction (TIGGER) program to fund an electric bus pilot project. The agency selected BYD through a competitive bidding process to build ten 40-ft BEBs. FTA collaborated with the U.S. Department of Energy (DOE) and DOE’s National Renewable Energy Laboratory (NREL) to conduct in-service evaluations of advanced technology buses developed under its programs. This report presents evaluation results for the BEBs in comparison to baseline buses in similar service. The focus of the analysis is on one year of service from January through December 2018.

EXECUTIVE SUMMARY
FEDERAL TRANSIT ADMINISTRATION 1
The U.S. Department of Transportation’s (DOT’s) Federal Transit Administration (FTA) supports the research, development, and demonstration of low- and zero-emission technology for transit buses. Research projects are funded with a goal of facilitating commercialization of advanced technologies for transit buses that will increase efficiency and improve transit operations. FTA is collaborating with the U.S. Department of Energy (DOE) and DOE’s National Renewable Energy Laboratory (NREL) to conduct in-service evaluations of advanced technology buses developed under its programs. NREL uses a standard evaluation protocol for evaluating the advanced technologies deployed under the FTA programs.
FTA seeks to provide results from new technologies being adopted by transit agencies. The evaluations selected include fuel cell electric buses (FCEBs) and battery electric buses (BEBs) from different manufacturers operating in fleets in both cold and hot climates. The purpose of this report is to present the results from NREL’s evaluation of 10 BEBs operated by Long Beach Transit (LBT) in Long Beach, California.
LBT’s BEBs are 40-ft BYD buses with a ferro-type lithium iron phosphate energy storage system (ESS) also produced by BYD. NREL is collecting data on a conventional fleet of eight Gillig compressed natural gas (CNG) buses of similar age as the primary baseline comparison. LBT operates the BEBs primarily on its Passport route, a free shuttle service that travels around the Waterfront area between the Queen Mary and downtown Long Beach. The agency installed 10 plug in chargers for overnight charging of the BEBs, which is the primary means of charging the buses, although the agency also installed an inductive charging station at one of the stops on the Passport route. Table ES-1 provides a summary of BEB and baseline bus performance results for the first year of service (evaluation period).
Table ES-1Summary of LBT
Evaluation Results
Data Item BEB CNG
Number of buses 10 8
Total mileage in evaluation period 161,275 315,382
Average monthly mileage per bus 1,344 3,285
Availability (85% is target) 70.9% 89.9%
Fuel economy (kWh/mile or mpggea) 1.82 3.05
Fuel economy (mpdgeb) 20.71 3.49
Miles between roadcalls (MBRC)—busc 4,244 15,018
MBRC – ESS onlyc 40,319 —
Total maintenance cost ($/mile) 0.44 0.54
Maintenance cost – propulsion system only ($/mi) 0.04 0.16a Miles per gasoline gallon equivalent. b Miles per diesel gallon equivalent. c MBRC data cumulative through December 2018.

FEDERAL TRANSIT ADMINISTRATION 2
EXECUTIVE SUMMARY
The BEBs averaged 1,344 monthly miles per bus, which is lower than the baseline CNG bus fleet average of 3,285 monthly miles per bus. This is a direct result of the planned operation of the bus fleets, so this difference was expected. LBT’s target mileage for the BEB fleet operating on the Passport route was 7,500 miles per month or 90,000 fleet miles per year. The fleet far exceeded that, accumulating more than 13,400 miles per month, on average.
The availability data presented are based on both morning and afternoon pull-out. Buses available for both pull-outs received credit for one day available; if a bus was available for morning pull-out but not afternoon pull-out, that day counted as 0.5 available. The overall average availability for the BEBs was 70.9%; CNG fleet availability was 89.9%. LBT purchased the fleet of 10 BEBs to electrify transit service on the Passport route, which does not require the entire fleet.
In addition to tracking the daily availability of each BEB, NREL evaluated the effectiveness of the BEB fleet at fulfilling scheduled service on the Passport route. The monthly percentage of the Passport route service electrified by the BEB fleet ranged from a minimum of 51.5% in June 2018 to a maximum of 90.5% in September 2018. The average was 78.6% for the evaluation period.
The fuel economy for the BEB fleet on the Passport route varied seasonally, from a maximum of 23.6 miles per diesel gallon equivalent (mpdge) in March 2018 to a minimum of 18.4 mpdge in September 2018. The fuel economy for the CNG fleet was very consistent throughout the year, averaging 3.49 mpdge in random-dispatch service, equivalent to 3.26 mpdge on the Passport route. The average for the BEB fleet was 5.9 times that of the randomly-dispatched CNG buses and 6.3 times the CNG buses in service on the slower-speed Passport route.
The BEBs typically are charged overnight at the depot. The average overall electricity price during the evaluation period (based on utility billing periods) was $0.264 per kWh, including demand charges. This is equivalent to approximately $10 per diesel gallon equivalent (dge), which is 6.6 times the average CNG price of $1.52 per dge. The corresponding fuel cost per mile for each fleet was $0.61 per mile for the BEBs and $0.43 per mile for the CNG fleet.
Maintenance costs for both fleets include overall cost per mile and cost per mile by vehicle system. Warranty costs are not included in the calculations. During the evaluation period, the BEBs were under warranty, and the CNG buses were not. The maintenance cost for the BEBs ($0.44 per mile) was 19% lower than for the CNG buses ($0.54 per mile). The total propulsion-related maintenance cost for the BEBs was 73% lower than for the CNG buses; this is influenced by the respective warranty periods for the bus fleets.
As with all new technology development, lessons learned during this project could aid other agencies considering BEB technology. One of NREL’s goals for advanced technology vehicle evaluation is to document the experience of early-

FEDERAL TRANSIT ADMINISTRATION 3
EXECUTIVE SUMMARY
adopter transit agencies and share critical lessons learned with the rest of the industry to increase the successful deployment of these vehicles elsewhere in similar service. LBT reported having a good relationship with BYD and that the original equipment manufacturer (OEM) has worked closely with the agency to identify and solve the early issues with the buses. Key lessons learned include the following:
• Assemble an effective project team. LBT reported that a good project team leads to a better product collectively. This project could not have progressed without the commitment of each member of the team working for a successful deployment of BEBs and continual improvement.
• Expect growing pains with new technologies. LBT experienced challenges in implementing the new technology from an OEM that was new to the U.S. market and in the process of completing its new bus manufacturing facility. The team encountered more issues than expected at the initial deployment, including with bus components such as doors and the wheelchair lift. Although these components are not part of the advanced technology, the time needed to solve the issues delayed deployment of the affected buses.
• Plan for sufficient training. LBT reported that there was a steep learning curve for implementing a new technology bus. Some of the agency’s early challenges arose from maintaining the buses. The necessary skill set did not exist at the agency at the time of initial deployment. An agency needs to ensure that enough time is planned for the OEM to train staff in maintaining the buses.
• Begin planning infrastructure early in the project. Completing installation of needed BEB charging infrastructure by the time the buses are delivered can be a balancing act. An agency needs to begin planning early in the process and anticipate potential issues that could delay the installation.

SECTION
1
FEDERAL TRANSIT ADMINISTRATION 4
Introduction
The U.S. Department of Transportation’s (DOT’s) Federal Transit Administration (FTA) supports the research, development, and demonstration of low- and zero-emission technology for transit buses. FTA funds projects with a goal of facilitating commercialization of advanced technologies for transit buses that will increase efficiency and improve transit operations. These programs include the following:
• National Fuel Cell Bus Program – a $180 million, multi-year, cost-share research program for developing and demonstrating commercially-viable fuel cell technology for transit buses
• Transit Investments for Greenhouse Gas and Energy Reduction (TIGGER) – $225 million for capital investments that would reduce greenhouse gas emissions and/or lower the energy use of public transportation systems
• Low or No Emission Vehicle Deployment Program – $486.36 million in funding (Fiscal Years 2013–2020) to transit agencies for capital purchases of zero- and low-emission transit buses that have been largely proven in testing and demonstration efforts but are not yet widely deployed
FTA understands the need to share early experience with advanced technologies with the transit industry and funded evaluations of a selection of these projects to provide comprehensive, unbiased performance results from advanced technology bus development, operations, and implementation. These evaluations have proved useful for a variety of groups, including transit operators considering the technology for future procurements, manufacturers needing to understand the status of the technology for transit applications, and government agencies making policy decisions or determining future research needs. The evaluations include economic, performance, and safety factors. Data were collected on the operation, maintenance, and performance of each advanced technology fleet and a comparable baseline fleet operating at the same site (if available).
FTA collaborated with the U.S. Department of Energy (DOE) and DOE’s National Renewable Energy Laboratory (NREL) to conduct in-service evaluations of advanced technology buses. For more than a decade, NREL has been evaluating advanced technology transit buses using a standard data collection and analysis protocol originally developed for DOE heavy-duty vehicle evaluations. Funding for these evaluations has come from several agencies, including FTA, DOE, and the California Air Resources Board. NREL has evaluated fuel cell electric buses (FCEBs) and battery electric buses (BEBs) following this standard protocol.

SECTION 1: INTRODUCTION
FEDERAL TRANSIT ADMINISTRATION 5
NREL uses a set of criteria to prioritize the available projects for selection, including number of buses deployed, data collection and record-keeping practices of the transit agency, commitment level of the bus original equipment manufacturer (OEM), and the availability of appropriate baseline buses for comparison. The criteria are not intended to be rigid; however, the determination of priority is based on how many criteria are met. In consultation with FTA, NREL selected several projects that were in the highest-priority category. Table 1-1 lists the projects selected for evaluation.
Table 1-1Selected Evaluation
Projects
Site #
Transit Agency and Location Project Description Evaluation
Status
1King County Metro, Seattle, WA
3 Proterra 40-ft Catalyst buses and 1 fast-charge station
Completed
2Long Beach Transit, Long Beach, CA
10 BYD 40-ft BEBs, overnight charging with 1 inductive charger on route
Completed
3Central Contra Costa Transit Authority, Concord, CA
4 Gillig/BAE Systems 29-ft BEBs, overnight charging with 1 inductive charger on route
Completed
4Orange County Transportation Authority, Santa Ana, CA
1 American Fuel Cell Bus (AFCB): BAE Systems, Ballard Power Systems, and El Dorado National-California
Completed
5Stark Area Regional Transit Authority, Canton, OH
5 AFCBs Completed
6Massachusetts Bay Transportation Authority, Boston, MA
1 AFCB with Nuvera PowerTap system fueling infrastructure
Completed
The purpose of this report is to present the results from the evaluation of 10 BEBs in operation at Long Beach Transit (LBT) in comparison to a fleet of compressed natural gas (CNG) baseline buses. LBT first began operating its BEBs in March 2017. The focus of the analysis is on the first full year of data from the clean point, January–December 2018.
LBT Fleet Profile LBT provides public transit service in a 98-square-mile area of southern California, including the cities of Long Beach, Signal Hill, and Lakewood and parts of Artesia, Bellflower, Carson, Cerritos, Compton, Hawaiian Gardens, Norwalk, and Paramount. It operates a variety of fixed-route bus service and demand-responsive “Dial-A-Lift” paratransit service to several communities in the LBT service area. LBT contracts with a third-party provider for its complementary paratransit services within three-quarters of a mile of any fixed-route bus service, and its current fleet of 249 buses serves 36 fixed routes. The agency has a commitment to clean technologies and operates low-emission CNG and gasoline hybrid buses. The bus fleet comprises approximately 50% CNG buses, 35% gasoline hybrids, 10% standard diesels, and 4% battery electric buses. Figure

SECTION 1: INTRODUCTION
FEDERAL TRANSIT ADMINISTRATION 6
1-1 shows LBT’s general service area and the Passport circulator route that is the focus of this bus evaluation.
Figure 1-1 LBT service area
In 2011, LBT was awarded a $6.7 million grant through FTA’s TIGGER program to fund an electric bus pilot project. The agency selected BYD through a competitive bidding process to build ten 40-ft BEBs. The BEBs operate primarily on LBT’s Passport route, an eight-mile free circulator around downtown Long Beach. They are charged overnight at the depot, with the potential for supplemental charging at the Convention Center stop through an inductive charging station by WAVE. In total, 6–8 buses are required for the Passport route; the remaining buses are operated on a selection of routes to test the BEB capability. The agency brought in the Center for Transportation and the Environment (CTE) to manage the project.

SECTION
2
FEDERAL TRANSIT ADMINISTRATION 7
Bus Technology Descriptions
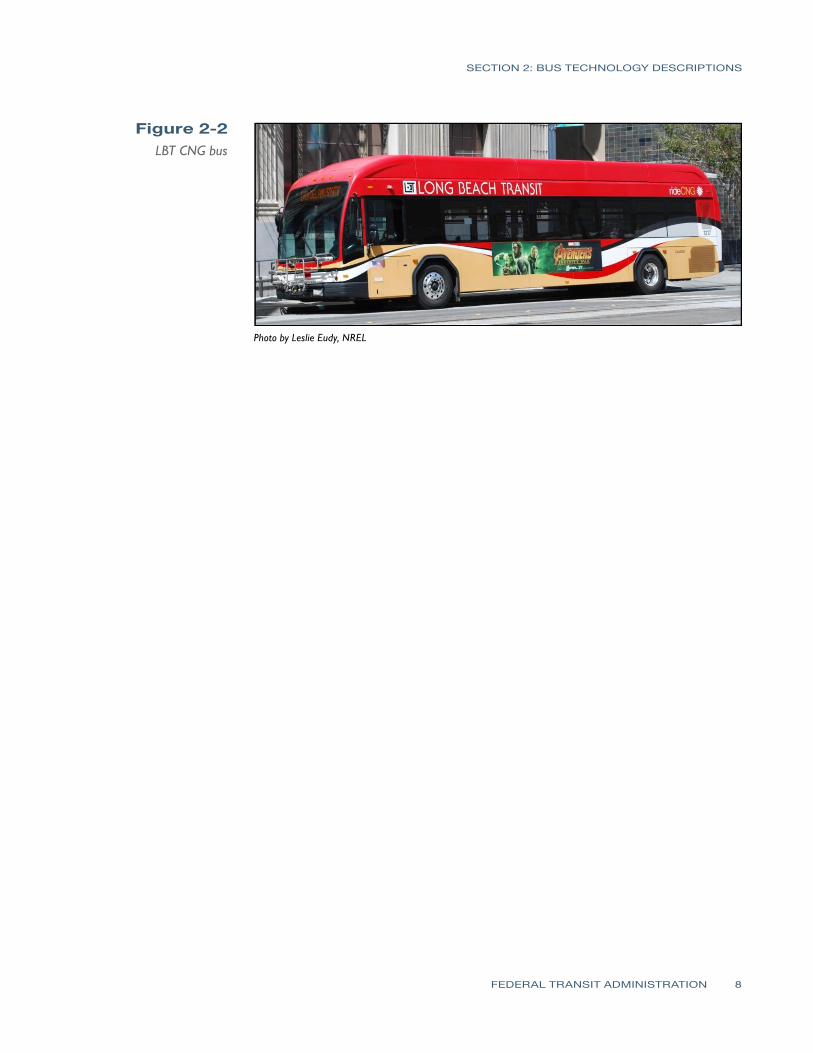
LBT’s BEBs are 40-ft BYD buses with a ferro-type lithium iron phosphate energy storage system (ESS), also produced by BYD. NREL collected data on a conventional fleet of eight Gillig CNG buses of similar age as the primary baseline comparison. Table 2-1 provides selected specifications for each bus type. The BEB cost in the table includes the buses, on-board WAVE charging system, LBT equipment (cameras, bike rack, radio), spare parts, training, and diagnostic equipment; it does not include charging infrastructure. A portion of the bus cost was offset by California Hybrid and Zero-Emission Truck and Bus Voucher Incentive Project (HVIP) credits totaling $1.13 million. Figure 2-1 is a photo of a one of the BEBs, and Figure 2-2 is a photo of a baseline CNG bus.
Table 2-1System Descriptions for
BEBs and CNG Buses
Vehicle System BEB CNG
Number of buses in evaluation 10 8
Bus manufacturer BYD Gillig
Bus year and model 2015 6120 LGEV 2014 G27B102N4
Length (ft) 40.2 ft 40 ft
GVWR (lb) 43,431 41,600
ESSLiFePO4 (LFP) Ferro type Lithium
Iron PhosphateN/A
Electric drive motor or engine BYD-TYC90A Traction Motor 90 kWCummins ISL G280
280 hp
Accessories Electric Mechanical
Energy storage or fuel capacity324 kWh (original)
360 kWh (ESS upgrade)25,304 SCF @
3,500 psi
Charging equipment50 kW WAVE induction charging
systemN/A
Bus purchase cost $1,002,550 $546,314
Figure 2-1LBT BEB
Photo by Leslie Eudy, NREL
SECTION 2: BUS TECHNOLOGY DESCRIPTIONS
FEDERAL TRANSIT ADMINISTRATION 8
Photo by Leslie Eudy, NREL
Figure 2-2LBT CNG bus

SECTION
3
FEDERAL TRANSIT ADMINISTRATION 9
Charging Infrastructure
LBT dedicated 10 parking spaces along a wall of the facility to accommodate charging the buses. Individual chargers, provided by BYD, were installed along the wall at the head of each parking space, as shown in Figure 3-1. Figure 3-2 is a photo of one of the 80-kW chargers. At the end of each day, the buses are serviced, parked, and plugged in for overnight charging, which is LBT’s primary means of charging the buses. The agency built its infrastructure to accommodate up to 25 chargers to allow for future growth of the BEB fleet. The charging is managed through a real-time monitoring system. To manage electric demand and cost, the agency charges the buses after 10:00 PM when the rate is lowest. Typically, four buses are charged simultaneously; once charged, the system cycles through the remaining buses.
Figure 3-1Row of BEB parking
with chargers at depot
Photo from Long Beach Transit

SECTION 3: TRANSIT BUS CONSIDERATIONS FOR ANALYSIS
FEDERAL TRANSIT ADMINISTRATION 10
Figure 3-3WAVE inductive charging station installed at Long
Beach Convention Center
Figure 3-2LBT charger installed
at depot
Photo by Leslie Eudy, NREL
LBT installed a WAVE inductive charger at the Convention Center stop on the Passport route to provide supplemental charging to extend the bus range. The agency has not used the charger on a regular basis because the BEB range meets current block schedules and there is not enough time planned at the Convention Center stop to allow a charge. The agency plans to reconfigure the schedule to include a layover that would allow the bus to charge. Figure 3-3 shows the WAVE inductive charging station at the Convention Center, with the charging equipment in the foreground and the circular charging pad on the street.
Photo by Leslie Eudy, NREL

SECTION
4
FEDERAL TRANSIT ADMINISTRATION 11
In-Service Operations Evaluation Results
This section focuses on a full year of operation from January through December 2018 (the evaluation period). LBT began placing the BEBs into service in March 2017. NREL follows a standard evaluation protocol that was outlined in a previous report, which establishes the start—clean point—of the evaluation period.1
Route AssignmentsThe BEBs are planned to operate on the Passport route, which is a free shuttle that travels around the Waterfront area between the Queen Mary and Downtown Long Beach. Figure 4-1 shows the Passport route, which operates every day of the week. During the evaluation period, six buses were required for weekday service and eight for weekends. LBT has three service adjustments each year that could result in different bus number requirements for this and other routes. The selected baseline CNG buses are randomly dispatched with LBT’s total bus fleet. Based on scheduled blocks, the average speed for the agency is 10.3 mph; the average speed of the Passport route is 8.1 mph. NREL collected data on CNG buses previously operated on the Passport route to provide a baseline fuel economy comparison for buses in the same service.
1 FTA Report No 0118, Zero-Emission Bus Evaluation Results: King County Metro Battery Electric Buses, Section 2, https://www.transit.dot.gov/sites/fta.dot.gov/files/docs/research-innovation/115086/zero-emission-bus-evaluation-results-king-county-metro-battery-electric-buses-fta-report-no-0118.pdf.
Figure 4-1 Map of Passport shuttle route
Image from LBT

SECTION 4: IN-SERVICE OPERATIONS EVALUATION RESULTS
FEDERAL TRANSIT ADMINISTRATION 12
Bus UseFigure 4-2 shows the tracking of the accumulated mileage of the BEBs since they were placed into service. The in-service month for each bus is marked along the trend line. Since the first few BEBs began entering service, the BEB fleet accumulated almost 300,000 combined miles as of the end of the evaluation period. During 2018, LBT accumulated more than 161,000 miles on the BEB fleet. The clean point indicates the first full month in which all BEBs were in service, marking the start of the evaluation period.
Figure 4-2Cumulative miles
for BEB fleet
Table 4-1 shows the evaluation period mileage for each bus and the average monthly mileage by bus type, which is also displayed in Figure 4-3. The BEBs averaged 1,344 monthly miles per bus, which is lower than the baseline CNG bus fleet average of 3,285 monthly miles per bus. This is a direct result of the planned operation of the bus fleets, so this difference was expected. LBT’s target mileage for the BEB fleet operating on the Passport route was 7,500 miles per month or 90,000 fleet miles per year. The fleet far exceeded that, accumulating more than 13,400 miles per month on average.

SECTION 4: IN-SERVICE OPERATIONS EVALUATION RESULTS
FEDERAL TRANSIT ADMINISTRATION 13
Table 4-1Average Monthly
Mileage (Evaluation Period), BEB and
CNG Fleets
Bus # Total Mileage Months Average Monthly Mileage
BEB Fleet
1601 14,630 12 1,219
1602 15,873 12 1,323
1603 14,037 12 1,170
1604 19,280 12 1,607
1605 17,084 12 1,424
1606 7,689 12 641
1607 17,427 12 1,452
1608 17,718 12 1,477
1609 17,760 12 1,480
1610 19,777 12 1,648
Total 161,275 120 1,344
CNG Fleet
1521 38,256 12 3,188
1522 41,049 12 3,421
1523 30,266 12 2,522
1524 43,010 12 3,584
1525 40,803 12 3,400
1526 37,920 12 3,160
1527 40,359 12 3,363
1528 43,718 12 3,643
Total 315,382 96 3,285
Figure 4-3Average monthly
miles for BEB and CNG fleets

SECTION 4: IN-SERVICE OPERATIONS EVALUATION RESULTS
FEDERAL TRANSIT ADMINISTRATION 14
AvailabilityThe availability analysis covered 12 months of data collection and evaluation. Planned service for LBT was seven days per week for both the BEB and CNG bus fleets; however, the Passport route does not require all 10 buses to meet service. The data presented are based on availability at both morning and afternoon pull-out. Buses available for both pull-outs get credit for one day available; if a bus is available for morning pull-out but not afternoon pull-out, that day counts as 0.5 available. The overall average availability for the BEBs was 70.9%; CNG fleet availability was 89.9%. Table 4-2 shows the availability for each bus and the overall fleet totals during the evaluation period.
Bus # Planned Days Available Days % Availability
BEB Fleet
1601 289 208.5 72.1%
1602 346 219 63.3%
1603 294 184 62.6%
1604 343 254.5 74.2%
1605 327 201.5 61.6%
1606 161 109.5 68.0%
1607 282 213.5 75.7%
1608 305 201 65.9%
1609 325 256.5 78.9%
1610 297.5 256 86.1%
Total 2,969.5 2,104.0 70.9%
CNG Fleet
1521 311.5 293.5 94.2%
1522 365 281.5 77.1%
1523 284.5 259.5 91.2%
1524 365 340 93.2%
1525 356.5 324.5 91.0%
1526 365 305.5 83.7%
1527 365 344.5 94.4%
1528 365 349 95.6%
Total 2,777.5 2,498.0 89.9%
Figure 4-4 shows the tracking of the monthly average availability for the BEBs and CNG buses as a line series along the top of the chart. The stacked columns in the figure show the number of days that the BEBs were unavailable, organized into five categories—Transmission, Bus Charging Issues, ESS, Electric Drive, PM, and Bus Maintenance.
Table 4-2Availability for BEB
and CNG Buses (Evaluation Period)

SECTION 4: IN-SERVICE OPERATIONS EVALUATION RESULTS
FEDERAL TRANSIT ADMINISTRATION 15
Figure 4-4Monthly availability
and reasons for unavailability for
BEB fleet
Figure 4-5 shows the overall percentage of available days for the BEB and CNG fleets, the percentage of days each fleet was unavailable for service, and the reasons for unavailability. The Electric Drive, ESS, and Charging Issues categories apply only to the BEB fleet, and the Engine category applies only to the CNG fleet. These charts represent fleet availability during the one-year evaluation period of January–December 2018. Table 4-3 corresponds to Figure 4-5 and provides a breakdown of the number of days and availability percentages for each category.
Figure 4-5Overall availability for BEB and CNG
fleets during evaluation period

SECTION 4: IN-SERVICE OPERATIONS EVALUATION RESULTS
FEDERAL TRANSIT ADMINISTRATION 16
Table 4-3Summary of
Availability and Unavailability by
Category
Category BEB # Days BEB % CNG # Days CNG %
Planned Days 2,969.5 — 2,777.5 —
Days Available 2,104.0 70.9% 2,498.0 89.9%
Days Unavailable 865.5 29.1% 279.5 10.1%
General Bus Maintenance 574 19.3% 195 7.0%
Preventive Maintenance 161 5.4% 75.5 2.7%
Electric Drive 57.5 1.9% — —
ESS 52 1.8% — —
Charging Issues 20 0.7% — —
Transmission 1 0.0% 1.5 0.1%
Engine — — 7.5 0.3%
LBT experienced several issues with the buses in the early stage of the deployment, many of which involved bus systems not related to the advanced technology; these included problems with doors, water leaks, suspension, fire suppression, air system, and wheelchair ramps. Advanced technology issues included problems with the inductive charging system, electric drive, and high-voltage batteries. These buses were some of the first built at the new BYD facility in Lancaster, California, and many issues could be attributed to growing pains with the first bus builds off the assembly line. LBT reported that BYD has been a good partner and worked closely with the agency to address these early issues. Over time, each bus was returned to the factory to repair these early issues. During the time that a bus was at the BYD facility, it was considered not planned for the availability analysis. Major issues are described later in the report.
LBT purchased the fleet of 10 BEBs to electrify transit service on the Passport route, which does not require the entire fleet. In addition to tracking the daily availability of each BEB, NREL evaluated the effectiveness of the BEB fleet at fulfilling scheduled service on the Passport route. Spare CNG buses were used to fill in any time there were not enough BEBs available. LBT has three service changes each year. During most of the evaluation period, the Passport service required only six buses on weekdays and eight buses on weekends to meet daily service. Figure 4-6 shows the monthly percentage of the Passport route service that was electrified by the BEB fleet, ranging from a minimum of 51.5% in June 2018 to a maximum of 90.5% in September 2018. The average was 78.6% for the evaluation period.

SECTION 4: IN-SERVICE OPERATIONS EVALUATION RESULTS
FEDERAL TRANSIT ADMINISTRATION 17
Figure 4-6Monthly Passport service fulfilled by
BEB fleet
Fuel Economy, Energy Use, and CostTable 4-4 lists the per-bus mileage, fuel use, and fuel economy along with the fleet averages. Electricity consumption in kilowatt-hours was converted to diesel gallon equivalent (dge) according to the per-unit energy content of each fuel. CNG consumption was reported by the agency in dge and also was converted to gasoline gallon equivalent (gge) for reference. The conversion factor used for electricity was 37.64 kWh/dge, and the conversion factor used for CNG was 1.146 gge/dge.

SECTION 4: IN-SERVICE OPERATIONS EVALUATION RESULTS
FEDERAL TRANSIT ADMINISTRATION 18
Table 4-4Mileage, Fuel Use, and Fuel Economy
BusMileage
(fuel base)
Fuel Consumption (BEB: kWh, CNG: gge)
Fuel Consumption
(dge)
Fuel Economy (BEB: kWh/mi, CNG: mi/gge)
Fuel Economy (mpdge)
BEB Fleet
1601 12,930 23,821 632.9 1.84 20.4
1602 14,135 25,528 678.3 1.81 20.8
1603 12,847 26,512 704.4 2.06 18.2
1604 17,355 31,588 839.3 1.82 20.7
1605 15,483 26,045 692.0 1.68 22.4
1606 6,550 12,623 335.4 1.93 19.5
1607 15,620 26,541 705.2 1.70 22.1
1608 15,139 25,740 683.9 1.70 22.1
1609 16,102 30,855 819.8 1.92 19.6
1610 17,966 32,676 868.2 1.82 20.7
Total 144,127 261,928 6,960 1.82 20.7
CNG Fleet
1521 32,997 10,634 9,278 3.10 3.56
1522 33,258 10,863 9,479 3.06 3.51
1523 26,914 8,563 7,472 3.14 3.6
1524 38,114 12,893 11,250 2.96 3.39
1525 37,116 12,860 11,221 2.89 3.31
1526 35,913 12,065 10,528 2.98 3.41
1527 37,564 11,763 10,264 3.19 3.66
1528 41,121 13,173 11,494 3.12 3.58
Total 282,997 92,813 80,986 3.05 3.49
Figure 4-7 shows the monthly average fuel economy in miles per diesel gallon equivalent (mpdge) for the BEB and CNG bus fleets. A vehicle’s drive cycle is an important factor in the fuel economy it can attain. Included in the fuel economy analysis were historical data of a fleet of LBT’s 1200-series CNG buses operating on the Passport route from September 2015 through August 2016. The monthly averages were aligned with the calendar months for 2018 and plotted in the figure for reference. Also plotted in Figure 4-6 is the average daily high temperature recorded at Long Beach Daugherty Airport2 to highlight seasonal variation of fuel economy.
2 NOAA, National Centers for Environmental Information, Climate Data Online, https://www.ncdc.noaa.gov/cdo-web/.

SECTION 4: IN-SERVICE OPERATIONS EVALUATION RESULTS
FEDERAL TRANSIT ADMINISTRATION 19
Figure 4-7Monthly fuel
economy for BEB and CNG fleets
The fuel economy for the CNG fleet was very consistent throughout the year, averaging 3.26 mpdge on the Passport route and 3.49 mpdge in random-dispatch service. The fuel economy for the BEB fleet varied seasonally, from a maximum of 23.6 mpdge in March 2018 to a minimum of 18.4 mpdge in September 2018. Although other operating factors also play a role in the fuel economy, this trend loosely corresponds inversely to the ambient temperature, as interior heating and cooling loads have a significant impact on the overall bus efficiency. The average of 20.7 mpdge for the BEB fleet was 5.9 times the randomly-dispatched CNG buses and 6.3 times the CNG buses in service on the slower-speed Passport route.
BEB ChargingThe typical daily routine for the BEBs after operating on the Passport route is to return to the depot and park in a designated parking spot with a plug-in charger. Although the WAVE inductive charger installed on the route has been commissioned, the current block schedule for the Passport route does not have adequate time for opportunity charging. LBT staff reported that the supplemental charging was not needed to meet service. Using only overnight depot charging, the BEBs typically discharge 50–70% of the usable stored energy to complete daily route service. Figure 4 8 shows the average minimum state of charge (SOC) for the BEB fleet by month, which represents the SOC when the BEBs plug in to charge at the end of each day.

SECTION 4: IN-SERVICE OPERATIONS EVALUATION RESULTS
FEDERAL TRANSIT ADMINISTRATION 20
Figure 4-8Monthly average
minimum SOC for BEB fleet
Figure 4-9 overlays the daily charging profiles of the BEB fleet from the utility grid perspective, shifted by 12 hours to show continuous overnight charging periods. Regardless of the time of day each BEB returned to the depot, it is clear from the chart that the buses began charging after 10:00 PM. This charging schedule coincides with the timeframe of the utility’s “Super Off-Peak” category, which is the lowest-cost tier for the current rate schedule. LBT has implemented this charging strategy to minimize the energy costs to operate the electric bus fleet. To manage the peak power demand and associated costs from electricity demand charges, LBT limits the number of buses charging concurrently to four. The 80-kW chargers produce a peak demand of 320 kW for four charging concurrently. The peak power profile tapers off throughout the early morning as each BEB reaches full charge.
Figure 4-9Electric utility daily power profiles for
depot charging

SECTION 4: IN-SERVICE OPERATIONS EVALUATION RESULTS
FEDERAL TRANSIT ADMINISTRATION 21
Figure 4-10 shows the total number of monthly depot charges recorded for each BEB. The numbers at the top of each column indicate the fleet total. The BEBs typically received one overnight charge per day of service. Thus, these columns generally follow the BEB availability and Passport route electrification trends shown above. The BEB fleet averaged approximately 160 depot charges per month.
Figure 4-10Monthly total depot
charges by bus for BEB fleet
Fuel CostsSouthern California Edison is LBT’s electric utility provider. During the evaluation period, electricity for the BEBs was purchased under TOU-EV-6 and TOU-EV-4 rate schedules. A change in rate schedule occurred between August and September 2018. LBT is subject to time-of-use charges and demand charges under both EV schedules. Figure 4-11 shows the cost components that comprise the monthly electric utility bill. The BEBs are primarily charged during the Super Off-Peak period, which is the lowest cost time of use for electricity consumption; however, charges for electricity demand have a significant impact on overall cost—averaging 61% of the bill each month. The stacked columns in the figure correspond to the monthly billing periods for the utility and do not exactly match the calendar months. The average overall electricity price paid by LBT for depot charging was $0.264 per kWh, which is equivalent to $9.92 per dge. This includes the average cost for electricity consumption ($0.066 per kWh, 25.1%), the cost for electricity demand ($0.162 per kWh, 61.4%), and the combined cost for all other taxes and fees on the utility bills ($0.036 per kWh, 13.5%).

SECTION 4: IN-SERVICE OPERATIONS EVALUATION RESULTS
FEDERAL TRANSIT ADMINISTRATION 22
Figure 4-11Electric utility
component costs for depot charging
Figure 4-12 outlines the fuel cost per unit for the CNG buses separated by actual fuel cost, station maintenance cost, and the cost of electricity to operate the station. The variability in cost each month is driven primarily by the commodity cost for CNG fuel, which fluctuated toward the end of the evaluation period due to disruptions in regional CNG supply. At its highest, the CNG unit cost was more the $2.50 per dge. The average for the evaluation period was $1.52 per dge.
Figure 4-12CNG fuel
component costs
The average monthly price per unit for the two fuels is compared in Figure 4-13, shown in equivalent units and adjusted to correspond to the calendar month. The equivalent price for electricity was approximately $10 per dge, 6.6 times the average CNG price of $1.52 per dge.

SECTION 4: IN-SERVICE OPERATIONS EVALUATION RESULTS
FEDERAL TRANSIT ADMINISTRATION 23
Figure 4-13Equivalent monthly
average fuel price for BEB and CNG fleets
Combining the fuel economy of each fleet with the unit price for their respective fuels provides the monthly fuel cost per mile, as shown in Figure 4-14. The fuel economy benefit of the BEBs (5.9 times CNG) offsets much of the impact of the higher fuel price (6.6 times CNG), resulting in a similar—yet still higher—average fuel cost per mile for the BEB fleet compared to the baseline.
Figure 4-14Monthly average fuel cost per mile for BEB
and CNG fleets
3 NTD website, www.ntdprogram.gov/ntdprogram/.
Roadcall AnalysisA roadcall or revenue vehicle system failure (as named in the National Transit Database [NTD]3) is defined as a failure of an in-service bus that causes the bus to be replaced on route or causes a significant delay in schedule. If the problem with the bus can be resolved during a layover and the schedule is kept, it is not

SECTION 4: IN-SERVICE OPERATIONS EVALUATION RESULTS
FEDERAL TRANSIT ADMINISTRATION 24
considered a roadcall. This analysis included only roadcalls that were caused by “chargeable” failures. Chargeable roadcalls include systems that can physically disable the bus from operating on route, such as interlocks (doors, air system), engine, or things deemed to be safety issues if operation of the bus continues; they do not include roadcalls for problems with radios, fareboxes, or destination signs.
The transit industry measures reliability as mean distance between failures, also documented as miles between roadcalls (MBRC). Table 4-5 provides the MBRC for the BEBs and CNG buses categorized by bus roadcalls, propulsion-related roadcalls, and ESS-related roadcalls. Propulsion-related roadcalls include all roadcalls due to propulsion-related systems, including the battery system (or engine for a conventional bus), electric drive, fuel, exhaust, air intake, cooling, non-lighting electrical, and transmission systems. ESS-related roadcalls and ESS-related MBRC are included for the BEBs. This roadcall analysis included data accumulated since the clean point of January 2018.
Table 4-5Roadcalls and MBRC
BEB CNG
Dates 1/1/2018–12/31/2018 1/1/2018–12/31/2018
Mileage 161,275 315,382
Bus roadcalls 38 21
Bus MBRC 4,244 15,018
Propulsion-related roadcalls 18 13
Propulsion-related MBRC 8,960 24,260
ESS-related roadcalls 4 —
ESS-related MBRC 40,319 —
Figure 4-15 presents the cumulative MBRC by category for the BEBs and CNG baseline buses. The upper plot tracks the overall MBRC for the two bus fleets; the lower plot tracks the MBRC for propulsion-only roadcalls and ESS-related roadcalls for the BEBs. DOE and FTA have not established performance targets specific to BEBs, but the MBRC targets established for fuel cell electric buses4 were based on typical conventional buses, so the targets could be considered appropriate for any advanced technology. The ultimate target for bus MBRC (4,000) is included in the upper plot of Figure 4-14 as a black dotted line. The overall MBRC for the BEBs (4,244) is much lower than the incumbent CNG technology (15,018), but the cumulative trend just surpasses the ultimate target. The LBT BEBs have achieved a propulsion-related MBRC of 8,960. The ESS-related MBRC for the BEBs shows a steady increase over time; this indicates that the ESS is not the system causing in-service issues.
4 Fuel Cell Technologies Program Record # 12012, September 2012, www.hydrogen.energy.gov/pdfs/12012_fuel_cell_bus_targets.pdf.

SECTION 4: IN-SERVICE OPERATIONS EVALUATION RESULTS
FEDERAL TRANSIT ADMINISTRATION 25
Figure 4-15Cumulative bus MBRC
and propulsion- related MBRC
Maintenance Analysis
This section discusses total maintenance costs and maintenance costs by bus system. Costs for accident-related repair, which are extremely variable from bus to bus, were eliminated from the analysis for both BEB and CNG bus fleets. NREL also excluded warranty repairs from the calculations. The BEBs were under warranty support by the OEM during the evaluation period; the CNG buses were out of the warranty period for most systems. Any work covered under warranty was removed from the data set. NREL uses a constant maintenance labor rate of $50 per hour to calculate labor costs; this does not reflect an average rate for LBT.
Total Work Order Maintenance CostsTable 4-6 shows maintenance costs per mile for the BEB and CNG buses and includes scheduled cost, unscheduled cost, and total cost. Scheduled costs include preventive maintenance based on the OEMs’ recommendations; all other maintenance is included in unscheduled costs. During the evaluation period, the maintenance cost for the BEBs was 19% lower than that of the CNG buses.

SECTION 4: IN-SERVICE OPERATIONS EVALUATION RESULTS
FEDERAL TRANSIT ADMINISTRATION 26
Bus Fleet Mileage Parts
($)Labor Hours
Scheduled Cost per Mile ($)
Unscheduled Cost per Mile ($)
Total Cost per Mile ($)
BEB Fleet
1601 14,630 108.15 85.0 0.07 0.23 0.30
1602 15,873 754.18 152.5 0.15 0.37 0.53
1603 14,037 746.75 105.5 0.05 0.38 0.43
1604 19,280 698.71 138.0 0.16 0.24 0.39
1605 17,084 185.45 150.0 0.18 0.27 0.45
1606 7,689 197.10 67.3 0.20 0.26 0.46
1607 17,427 1,160.34 160.0 0.11 0.42 0.53
1608 17,718 813.91 123.5 0.17 0.22 0.39
1609 17,760 1,728.80 162.3 0.23 0.33 0.55
1610 19,777 324.24 134.0 0.16 0.19 0.36
Total 161,275 6,717.63 1,278.0 0.15 0.29 0.44
CNG Fleet
1521 38,256 9,237.31 186.0 0.16 0.32 0.48
1522 41,049 18,820.65 335.0 0.21 0.66 0.87
1523 30,266 6,831.85 148.8 0.17 0.30 0.47
1524 43,010 9,832.96 294.5 0.19 0.39 0.57
1525 40,803 7,599.14 209.5 0.19 0.25 0.44
1526 37,920 9,194.37 290.0 0.21 0.42 0.62
1527 40,359 7,699.69 253.5 0.19 0.31 0.50
1528 43,718 5,797.97 211.0 0.16 0.22 0.37
Total 315,382 75,003.93 1,928.3 0.19 0.29 0.54
The monthly scheduled and unscheduled maintenance costs per mile for the buses are shown as stacked columns in Figure 4-16. LBT reported that minor repairs identified during preventive maintenance are sometimes completed during the scheduled preventive maintenance and not separated out as unscheduled repairs. As a result, costs for preventive maintenance are slightly higher than expected for both bus fleets.
Table 4-6Total Work Order
Maintenance Costs

SECTION 4: IN-SERVICE OPERATIONS EVALUATION RESULTS
FEDERAL TRANSIT ADMINISTRATION 27
Figure 4-17Monthly parts and labor maintenance
cost per mile
Work Order Maintenance Costs Categorized by SystemTable 4-7 shows maintenance costs per mile by vehicle system and bus fleet (without warranty costs). The vehicle systems include the following:
• Cab, body, and accessories – includes body, glass, cab and sheet metal, seats and doors, and accessory repairs, such as hubodometers, fareboxes, and radios
Figure 4-16Monthly scheduled
and unscheduled maintenance cost
per mile
Figure 4-17 shows the same monthly maintenance data separated by parts and labor costs for the BEB and CNG fleets. As noted, the BEBs were under warranty during this evaluation period, and most parts costs were covered by the manufacturer. As a result, the BEB parts costs were significantly lower than those of the CNG buses; the average parts cost for the BEBs was $0.03 per mile, compared to $0.20 per mile for the CNG buses.

SECTION 4: IN-SERVICE OPERATIONS EVALUATION RESULTS
FEDERAL TRANSIT ADMINISTRATION 28
System BEB Cost per Mile ($)
BEB Percent of Total (%)
CNG Cost per Mile ($)
CNG Percent of Total (%)
Propulsion-related 0.04 10 0.16 29
Cab, body, and accessories 0.19 44 0.16 29
PMI 0.15 34 0.09 17
Brakes 0.01 2 0.04 7
Frame, steering, and suspension 0.02 4 0.03 6
HVAC 0.01 1 0.02 4
Lighting 0.01 1 0.01 2
General air system repairs 0.01 2 0.01 2
Axles, wheels, and drive shaft 0.01 3 0.02 4
Tires 0.00 0 0.00 0
Total 0.44 100 0.54 100a The top three categories for maintenance for each fleet are color-coded as follows: orange = highest, green = second highest, purple = third highest.
Table 4-7Work Order
Maintenance Cost per Mile by Systema
The systems with the highest percentage of maintenance costs for the BEB fleet were (1) cab, body, and accessories; (2) PMI; and (3) propulsion-related. The systems with the highest percentage of maintenance costs for the CNG buses were (1) propulsion-related; (2) cab, body, and accessories; and (3) PMI.
Figure 4-18 shows the monthly cost per mile by system for the BEBs, and Figure 4-19 shows the monthly cost per mile by system for the CNG fleet.
• Propulsion-related systems – repairs for exhaust, fuel, engine, electric motors, battery modules, propulsion control, non-lighting electrical (charging, cranking and ignition), air intake, cooling, and transmission
• Preventive Maintenance Inspection (PMI) – labor for inspections during preventive maintenance
• Brakes – includes brake pads, disks, calipers, anti-lock braking system, and brake chambers
• Frame, steering, and suspension
• HVAC
• Lighting
• Air system (general)
• Axles, wheels, and drive shaft
• Tires

SECTION 4: IN-SERVICE OPERATIONS EVALUATION RESULTS
FEDERAL TRANSIT ADMINISTRATION 29
Figure 4-19Monthly maintenance
cost per mile by system for CNG fleet
Propulsion-Related Work Order Maintenance CostsPropulsion-related vehicle systems include the exhaust, fuel, engine, battery modules, electric propulsion, air intake, cooling, non-lighting electrical, transmission, and hydraulic systems. These vehicle subsystems were separated to highlight how maintenance costs for the propulsion system were affected by the change from conventional technology (CNG) to advanced technology (BEB). Figure 4-20 and Figure 4-21 provide monthly propulsion-related system maintenance costs by category for the BEBs and CNG buses, respectively:
• Total Propulsion-related – Total propulsion-related maintenance cost for the BEBs was 73% lower than for the CNG buses; this is influenced by the respective warranty periods for the bus fleets.
• Exhaust System – Costs for the CNG buses were low; the BEBs do not have an exhaust system.
Figure 4-18Monthly maintenance
cost per mile by system for BEB fleet

SECTION 4: IN-SERVICE OPERATIONS EVALUATION RESULTS
FEDERAL TRANSIT ADMINISTRATION 30
• Fuel System – Costs for the fuel system for the CNG buses made up 20% of the total propulsion system costs; the BEBs do not have a fuel system.
• Power Plant and Electric Propulsion – For the BEBs, the costs for the electric propulsion system and ESS made up 35% of the total cost and were primarily for labor because most parts costs were covered under warranty. Power plant repairs made up 31% of the total propulsion system costs for the CNG buses; there are no electric propulsion costs for the CNG buses.
• Non-lighting Electrical (Charging, Cranking, and Ignition) – Costs for this system made up 46% of the propulsion system costs for the BEBs and 38% of the total propulsion costs for the CNG buses. Costs for both fleets were for items like low-voltage batteries and electric switches.
• Air Intake – Costs for this system were low or zero for the BEBs and CNG buses.
• Cooling – Costs for this system were low or zero for the BEBs and CNG buses.
• Transmission – Costs for this system were low or zero for the BEBs and CNG buses.
• Hydraulic – Costs for this system were low or zero for the BEBs and CNG buses.
Figure 4-20 Monthly maintenance
cost per mile by propulsion subsystem
for BEB fleet

SECTION 4: IN-SERVICE OPERATIONS EVALUATION RESULTS
FEDERAL TRANSIT ADMINISTRATION 31
Figure 4-21Monthly maintenance
cost per mile by propulsion subsystem
for CNG fleet
Table 4-8 summarizes these costs during the evaluation period. Parts for scheduled maintenance, such as filters and fluids, are included in the specific system categories; for example, oil and oil filters are included in the power plant (engine) subsystem parts costs, and air filters are included in the air intake subsystem parts costs.

SECTION 4: IN-SERVICE OPERATIONS EVALUATION RESULTS
FEDERAL TRANSIT ADMINISTRATION 32
Maintenance System Maintenance Costs BEB CNG
Mileage 161,275 315,382
Total Propulsion-Related Systems (Roll-up)
Parts cost ($) 1,758 34,645
Labor hours 105.0 317.0
Total cost ($) 7,008 50,495
Total cost ($) per mile 0.04 0.16
Exhaust System Repairs
Parts cost ($) 0 314
Labor hours 0.0 0.0
Total cost ($) 0 314
Total cost ($) per mile 0.00 0.00
Fuel System Repairs
Parts cost ($) 0 7,730
Labor hours 0.0 51.5
Total cost ($) 0 10,305
Total cost ($) per mile 0.00 0.03
Power Plant System Repairs
Parts cost ($) 104 10,331
Labor hours 21.5 110.5
Total cost ($) 1,179 15,856
Total cost ($) per mile 0.01 0.05
Electric Propulsion System Repairs
Parts cost ($) 36 0
Labor hours 49.0 0.0
Total cost ($) 2,486 0
Total cost ($) per mile 0.02 0.00
Non-Lighting Electrical System Repairs (General Electrical, Charging, Cranking, Ignition)
Parts cost ($) 1,607 14,025
Labor hours 33.0 99.5
Total cost ($) 3,257 19,000
Total cost ($) per mile 0.02 0.06
Air Intake System Repairs
Parts cost ($) 11 206
Labor hours 0.0 0.0
Total cost ($) 11 206
Total cost ($) per mile 0.00 0.00
Cooling System Repairs
Parts cost ($) 0 1,892
Labor hours 0.0 42.0
Total cost ($) 0 3,992
Total cost ($) per mile 0.00 0.01
Transmission System Repairs
Parts cost ($) 0 0
Labor hours 1.0 11.5
Total cost ($) 50 575
Total cost ($) per mile 0.00 0.00
Hydraulic System Repairs
Parts cost ($) 0 148
Labor hours 0.5 2.0
Total cost ($) 25 248
Total cost ($) per mile 0.00 0.00
Table 4-8Propulsion-Related
Work Order Maintenance Costs
by System

SECTION
5
FEDERAL TRANSIT ADMINISTRATION 33
Summary of Challenges
As with all new technology development, lessons learned during this project could help other agencies that are considering BEB technology. One of NREL’s goals for advanced technology vehicle evaluation is to document the experience of early adopter transit agencies and share critical lessons learned with the rest of the industry to increase the successful deployment of these vehicles elsewhere in similar service. LBT reported having a good relationship with BYD and that the OEM worked closely with the agency to identify and solve the early issues with the buses. Advanced-technology demonstrations typically experience challenges and issues that need to be resolved.
Issues and lessons learned for LBT include the following.
Lessons Learned• Assemble an effective project team. LBT reported that a good project
team leads to a better product collectively. This project could not have progressed without the commitment of each member of the team working for a successful deployment of BEBs and continual improvement.
• Expect growing pains with new technologies. LBT experienced challenges in implementing the new technology from an OEM that was new to the U.S. market and in the process of completing its new bus manufacturing facility. The team encountered more issues than expected at the initial deployment. Some issues were with bus components, such as doors and the wheelchair lift. Although these components are not part of the advanced technology, the time needed to solve the issues delayed deployment of the affected buses.
• Plan for sufficient training. LBT reported a steep learning curve for implementing a new technology bus. Some early challenges arose from maintaining the buses, as the necessary skill set did not exist at the agency at the time of initial deployment. Agencies need to ensure that enough time is planned for the OEM to train staff in maintaining the buses. Agencies should also work closely with the OEM to ensure that training materials for operating and maintaining the buses are available at the beginning of the project.
• Begin planning infrastructure early in the project. Completing installation of needed BEB charging infrastructure by the time the buses are delivered can be a balancing act. Agencies need to begin planning early in the process and anticipate potential issues that could delay the installation. Early in the planning stage, LBT included an inductive charging station on

SECTION 5: SUMMARY OF CHALLENGES
FEDERAL TRANSIT ADMINISTRATION 34
the Passport route to extend the range of the BEBs. The original station was planned for the Queen Mary stop, which is the end point on the route, and the schedule includes time for operators to take a break at this stop, which made it an ideal location for the charger. Issues in getting all parties on board for constructing the station at this stop resulted in the need to move the charger to another location. The Long Beach Convention Center was eventually selected as the inductive charging site. Construction was further delayed because of an annual event—the Grand Prix—which required use of the roads around the city, including in front of the Convention Center. By the time the charger was installed and commissioned, LBT determined that the BEBs could complete daily service without needing supplemental charging on the route. LBT has the option of using the station in the future; however, it will need to restructure the schedule to include sufficient layover to allow time to charge.
Technical Issues• High-voltage battery issue – Beginning in mid-2018, the buses developed
battery balancing and degradation issues. Several factors contributed to the problem, including 1) the buses were some of the first produced by BYD at its new U.S. manufacturing plant, and the initial commissioning was not adequate; and 2) LBT’s planned use of the buses at 60–70 miles per day was too conservative because the batteries were not allowed to discharge below a certain SOC. The battery capacity degraded quickly, and, before long, the BEBs did not have sufficient range to complete service every day. BYD’s first solution was to do a full rebalance of the batteries, but this did not solve the problem. BYD replaced all the original batteries under warranty with its newest-generation batteries. The upgraded battery pack (344 kWh) has more energy than the previous version (295 kWh), which allowed LBT to meet its service with about 40% SOC on the batteries each day. The agency reported that the buses are performing well.
• Steering/suspension/axles – LBT experienced issues with the durability of the bushings in the sway bar system. The original bushings were wearing out and breaking much faster than expected, requiring a component upgrade. LBT also experienced durability problems with the hub reduction units in the axles. Maintenance staff found that the heads of bolts attaching the inner gearset covers were shearing off unexpectedly. After attempting temporary repairs, LBT had to send the affected buses back to BYD’s manufacturing plant for permanent repairs.
• Early bus issues – LBT experienced issues with several bus systems in the initial deployment stage. Although these issues were not attributed to the advanced technology components, they resulted in downtime and delays in putting the buses into service. Components included wheelchair lifts and doors. To resolve these issues, many buses were returned to

SECTION 5: SUMMARY OF CHALLENGES
FEDERAL TRANSIT ADMINISTRATION 35
the manufacturing facility. Once repairs were completed, the buses were returned to LBT and were commissioned and placed into service.
• Vehicle monitoring and data collection system – BYD’s Health Alert Monitoring System promised to be an ideal solution for real-time monitoring of the BEBs, scheduling/managing depot charging, and collecting detailed data for analysis. This system was not fully functioning at the beginning of the BEB deployment, which caused challenges for the evaluation. When data first became available, there were reliability issues that LBT traced down to interference in the wireless receivers collecting the data from the buses. This highlights the importance of validating the data collection systems with any new installation.

APPENDIX
FEDERAL TRANSIT ADMINISTRATION 36
AFleet Summary Statistics – LBT
Table A-1 LBT—Fleet Operations and Economics
BEB CNG
Number of vehicles 10 8
Period used for fuel and oil analysis 1/2018–12/2018 1/2018–12/2018
Total number of months in period 12 12
Fuel and oil analysis base fleet mileage 144,127 282,997
Period used for maintenance analysis 1/2018–12/2018 1/2018–12/2018
Total number of months in period 12 12
Maintenance analysis base fleet mileage 161,275 315,382
Average monthly mileage per vehicle 1,344 3,285
Availability 71 80
Fleet energy usage in kWh (BEB) or gge (CNG) 261,927.8 92,813.38
Roadcalls 38 21
Total MBRC 4,244 15,018
Propulsion roadcalls 18 13
Propulsion MBRC 8,960 24,260
Fleet kWh/mile (BEB) or mpgge (CNG) 1.82 3.05
Representative fleet mpdge (energy equivalent) 20.71 3.49
Energy cost per kWh (BEB), cost per gge (CNG) 0.27 1.32
Energy/fuel cost per mile (based on purchased energy) 0.42 0.43
Total scheduled repair cost per mile 0.15 0.19
Total unscheduled repair cost per mile 0.29 0.36
Total maintenance cost per mile 0.44 0.54
Total operating cost per mile 0.85 0.98
Table A-2 LBT—Maintenance Costs
BEB CNG
Fleet mileage 161,275 315,382
Total parts cost $6,717.63 $75,003.93
Total labor hours 1,277.0 1,928.3
Labor cost (at $50 per hour) $63,850.00 $96,415.00
Total maintenance cost $70,567.63 $171,418.93
Total maintenance cost per bus $7,056.76 $21,427.37
Total maintenance cost per mile $0.44 $0.54
APPENDIX A: FLEET SUMMARY STATISTICS – LBT
FEDERAL TRANSIT ADMINISTRATION 37
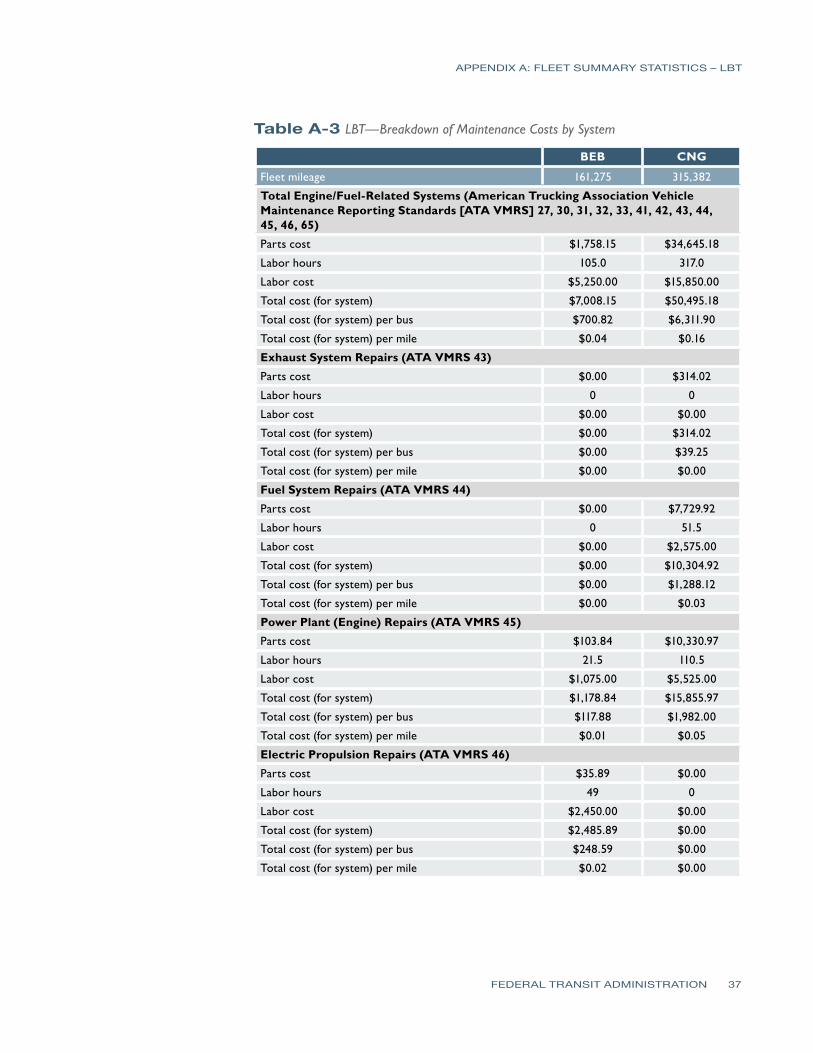
Table A-3 LBT—Breakdown of Maintenance Costs by System
BEB CNG
Fleet mileage 161,275 315,382
Total Engine/Fuel-Related Systems (American Trucking Association Vehicle Maintenance Reporting Standards [ATA VMRS] 27, 30, 31, 32, 33, 41, 42, 43, 44, 45, 46, 65)
Parts cost $1,758.15 $34,645.18
Labor hours 105.0 317.0
Labor cost $5,250.00 $15,850.00
Total cost (for system) $7,008.15 $50,495.18
Total cost (for system) per bus $700.82 $6,311.90
Total cost (for system) per mile $0.04 $0.16
Exhaust System Repairs (ATA VMRS 43)
Parts cost $0.00 $314.02
Labor hours 0 0
Labor cost $0.00 $0.00
Total cost (for system) $0.00 $314.02
Total cost (for system) per bus $0.00 $39.25
Total cost (for system) per mile $0.00 $0.00
Fuel System Repairs (ATA VMRS 44)
Parts cost $0.00 $7,729.92
Labor hours 0 51.5
Labor cost $0.00 $2,575.00
Total cost (for system) $0.00 $10,304.92
Total cost (for system) per bus $0.00 $1,288.12
Total cost (for system) per mile $0.00 $0.03
Power Plant (Engine) Repairs (ATA VMRS 45)
Parts cost $103.84 $10,330.97
Labor hours 21.5 110.5
Labor cost $1,075.00 $5,525.00
Total cost (for system) $1,178.84 $15,855.97
Total cost (for system) per bus $117.88 $1,982.00
Total cost (for system) per mile $0.01 $0.05
Electric Propulsion Repairs (ATA VMRS 46)
Parts cost $35.89 $0.00
Labor hours 49 0
Labor cost $2,450.00 $0.00
Total cost (for system) $2,485.89 $0.00
Total cost (for system) per bus $248.59 $0.00
Total cost (for system) per mile $0.02 $0.00

APPENDIX A: FLEET SUMMARY STATISTICS – LBT
FEDERAL TRANSIT ADMINISTRATION 38
BEB CNG
Electrical System Repairs (ATA VMRS 30–Electrical General, 31–Charging, 32-Cranking, 33–Ignition)
Parts cost $1,607.39 $14,024.50
Labor hours 33 99.5
Labor cost $1,650.00 $4,975.00
Total cost (for system) $3,257.39 $18,999.50
Total cost (for system) per bus $325.74 $2,374.94
Total cost (for system) per mile $0.02 $0.06
Air Intake System Repairs (ATA VMRS 41)
Parts cost $11.03 $205.75
Labor hours 0 0
Labor cost $0.00 $0.00
Total cost (for system) $11.03 $205.75
Total cost (for system) per bus $1.10 $25.72
Total cost (for system) per mile $0.00 $0.00
Cooling System Repairs (ATA VMRS 42)
Parts cost $0.00 $1,891.63
Labor hours 0 42
Labor cost $0.00 $2,100.00
Total cost (for system) $0.00 $3,991.63
Total cost (for system) per bus $0.00 $498.95
Total cost (for system) per mile $0.00 $0.01
Hydraulic System Repairs (ATA VMRS 65)
Parts cost $0.00 $148.39
Labor hours 0.5 2
Labor cost $25.00 $100.00
Total cost (for system) $25.00 $248.39
Total cost (for system) per bus $2.50 $31.05
Total cost (for system) per mile $0.00 $0.00
General Air System Repairs (ATA VMRS 10)
Parts cost $0.00 $1,948.74
Labor hours 30.5 14
Labor cost $1,525.00 $700.00
Total cost (for system) $1,525.00 $2,648.74
Total cost (for system) per bus $152.50 $331.09
Total cost (for system) per mile $0.01 $0.01
Brake System Repairs (ATA VMRS 13)
Parts cost $11.62 $7,443.18
Labor hours 22 90
Labor cost $1,100.00 $4,500.00
Total cost (for system) $1,111.62 $11,943.18
Total cost (for system) per bus $111.16 $1,492.90
Total cost (for system) per mile $0.01 $0.04

APPENDIX A: FLEET SUMMARY STATISTICS – LBT
FEDERAL TRANSIT ADMINISTRATION 39
BEB CNG
Transmission Repairs (ATA VMRS 27)
Parts cost $0.00 $0.00
Labor hours 1 11.5
Labor cost $50.00 $575.00
Total cost (for system) $50.00 $575.00
Total cost (for system) per bus $5.00 $71.88
Total cost (for system) per mile $0.00 $0.00
Inspections Only – No Parts Replacements (101)
Parts cost $0.00 $0.00
Labor hours 477 593
Labor cost $23,850.00 $29,650.00
Total cost (for system) $23,850.00 $29,650.00
Total cost (for system) per bus $2,385.00 $3,706.25
Total cost (for system) per mile $0.15 $0.09
Cab, Body, and Accessories Systems Repairs (ATA VMRS 02–Cab and Sheet Metal, 50–Accessories, 71–Body)
Parts cost $4,867.75 $16,798.41
Labor hours 521.5 649.8
Labor cost $26,075.00 $32,490.00
Total cost (for system) $30,942.75 $49,288.41
Total cost (for system) per bus $3,094.28 $6,161.05
Total cost (for system) per mile $0.19 $0.16
HVAC System Repairs (ATA VMRS 01)
Parts cost $13.54 $3,377.64
Labor hours 19 72
Labor cost $950.00 $3,600.00
Total cost (for system) $963.54 $6,977.64
Total cost (for system) per bus $96.35 $872.21
Total cost (for system) per mile $0.01 $0.02
Lighting System Repairs (ATA VMRS 34)
Parts cost $0.21 $1,918.40
Labor hours 17 27
Labor cost $850.00 $1,350.00
Total cost (for system) $850.21 $3,268.40
Total cost (for system) per bus $85.02 $408.55
Total cost (for system) per mile $0.01 $0.01
Frame, Steering, and Suspension Repairs (ATA VMRS 14-Frame, 15-Steering, 16-Suspension)
Parts cost $66.36 $7,535.10
Labor hours 49.5 54.5
Labor cost $2,475.00 $2,725.00
Total cost (for system) $2,541.36 $10,260.10
Total cost (for system) per bus $254.14 $1,282.51
Total cost (for system) per mile $0.02 $0.03

APPENDIX A: FLEET SUMMARY STATISTICS – LBT
FEDERAL TRANSIT ADMINISTRATION 40
BEB CNG
Axle, Wheel, and Drive Shaft Repairs (ATA VMRS 11–Front Axle, 18–Wheels, 22–Rear Axle, 24–Drive Shaft)
Parts cost $0.00 $1,337.10
Labor hours 35.5 109.5
Labor cost $1,775.00 $5,475.00
Total cost (for system) $1,775.00 $6,812.28
Total cost (for system) per bus $177.50 $815.54
Total cost (for system) per mile $0.01 $0.02
Tire Repairs (ATA VMRS 17)
Parts cost $0.00 $0.00
Labor hours 0 1.5
Labor cost $0.00 $75.00
Total cost (for system) $0.00 $75.00
Total cost (for system) per bus $0.00 $9.38
Total cost (for system) per mile $0.00 $0.00

APPENDIX
FEDERAL TRANSIT ADMINISTRATION 41
BFleet Summary Statistics – SI Units
Table B-1 LBT Fleet Operations and Economics (SI)
BEB CNG
Number of vehicles 10 8
Period used for fuel and oil analysis 1/2018–12/2018 1/2018–12/2018
Total number of months in period 12 12
Fuel and oil analysis base fleet kilometers 231,944 455,427
Period used for maintenance analysis 1/2018–12/2018 1/2018–12/2018
Total number of months in period 12 12
Maintenance analysis base fleet kilometers 259,539 507,544
Average monthly kilometers per vehicle 2,163 5,287
Availability 71 80
Fleet fuel usage in liter equivalent 26,344.8 351,336.9
Roadcalls 38 21
Total KMBRC 6,830 24,169
Propulsion roadcalls 18 13
Propulsion KMBRC 14,419 39,042
Rep. fleet fuel consumption (L/100 km) 11.36 77.14
Energy cost per kWh/ CNG cost/liter $0.27 $0.35
Energy/fuel cost per kilometer (based on purchased energy) $0.29 $0.27
Total scheduled repair cost per kilometer $0.09 $0.12
Total unscheduled repair cost per kilometer $0.18 $0.22
Total maintenance cost per kilometer $0.27 $0.34
Total operating cost per kilometer $0.56 $0.61
Table B-2 LBT Maintenance Costs (SI)
BEB CNG
Fleet mileage 259,539 507,544
Total parts cost $6,717.63 $75,003.93
Total labor hours 1,277.0 1,928.3
Average labor cost ($50 per hour) $63,850.00 $96,415.00
Total maintenance cost $70,567.63 $171,418.93
Total maintenance cost per bus $7,056.76 $21,427.37
Total maintenance cost per kilometer $0.27 $0.34

FEDERAL TRANSIT ADMINISTRATION 42
Acronyms/Abbreviations
AFCB American fuel cell bus ATA VMRS American Trucking Association Vehicle Maintenance Reporting Standards BEB battery electric bus CNG compressed natural gas dge diesel gallon equivalent DOE U.S. Department of Energy DOT U.S. Department of Transportation ESS energy storage system FTA Federal Transit Administration gge gasoline gallon equivalent hp horsepower HVAC heating, ventilation, and air conditioning KMBRC kilometers between roadcalls LBT Long Beach Transit MBRC miles between roadcalls mpdge miles per diesel gallon equivalent NREL National Renewable Energy Laboratory OEM original equipment manufacturer PMI preventive maintenance inspections SI International System of Units SOC state of charge TIGGER Transit Investments for Greenhouse Gas and Energy Reduction

GLOSSARY
FEDERAL TRANSIT ADMINISTRATION 43
Availability – The number of days the buses are actually available, compared to the days that the buses are planned for operation, expressed as percentage availability.
Clean point – For each evaluation, NREL works with the project partners to determine a starting point—or clean point—for the data analysis period. The clean point is chosen to avoid some of the early and expected operations problems with a new vehicle going into service, such as early maintenance campaigns. In some cases, reaching the clean point may require three to six months of operation before the evaluation can start. This applies to new technology buses as well as conventional buses.
Deadhead – The miles and hours that a vehicle travels when out of revenue service with no expectation of carrying revenue passengers. Deadhead includes leaving or returning to the garage or yard facility and changing routes.
Miles between roadcalls (MBRC) – A measure of reliability calculated by dividing the number of miles traveled by the total number of roadcalls, also known as mean distance between failures. MBRC results in the report are categorized as follows:
• Bus MBRC – includes all chargeable roadcalls. Includes propulsion-related issues as well as problems with bus-related systems such as brakes, suspension, steering, windows, doors, and tires
• Propulsion-related MBRC – includes roadcalls that are attributed to the propulsion system. Propulsion-related roadcalls can be caused by issues with the transmission, batteries, and electric drive
• ESS-related MBRC – includes roadcalls attributed to the ESS only (specific to BEBs)
• Fuel cell system-related MBRC – includes roadcalls attributed to the fuel cell and balance of plant only (specific to fuel cell electric buses)
Revenue service – The time when a vehicle is available to the general public with an expectation of carrying fare-paying passengers. Vehicles operated in a fare-free service are also considered revenue service.
Roadcall – A failure of an in-service bus that causes the bus to be replaced on route or causes a significant delay in schedule. The analysis includes chargeable roadcalls that affect the operation of the bus or may cause a safety hazard. Non-chargeable roadcalls can be passenger incidents that require the bus to be cleaned before going back into service or problems with an accessory such as a farebox or radio.

U.S. Department of TransportationFederal Transit Administration
East Building1200 New Jersey Avenue, SE
Washington, DC 20590https://www.transit.dot.gov/about/research-innovation