zertifikate a4 cz-2018 -...
TRANSCRIPT

CERTIFICATEP3 communicati ons GmbHhereby certi fi es that
in the Mobile Benchmark Czech Republic 04/2018.
Score 942 of 1000 in TotalScore 362 of 400 in Voice ServicesScore 580 of 600 in Data Services
04/2018
Mobile BenchmarkCzech Republic
in test
VODAFONE CZECH REPUBLICACHIEVED BEST IN TEST
VodafoneCzech Republic
Maziar KianzadManaging Director
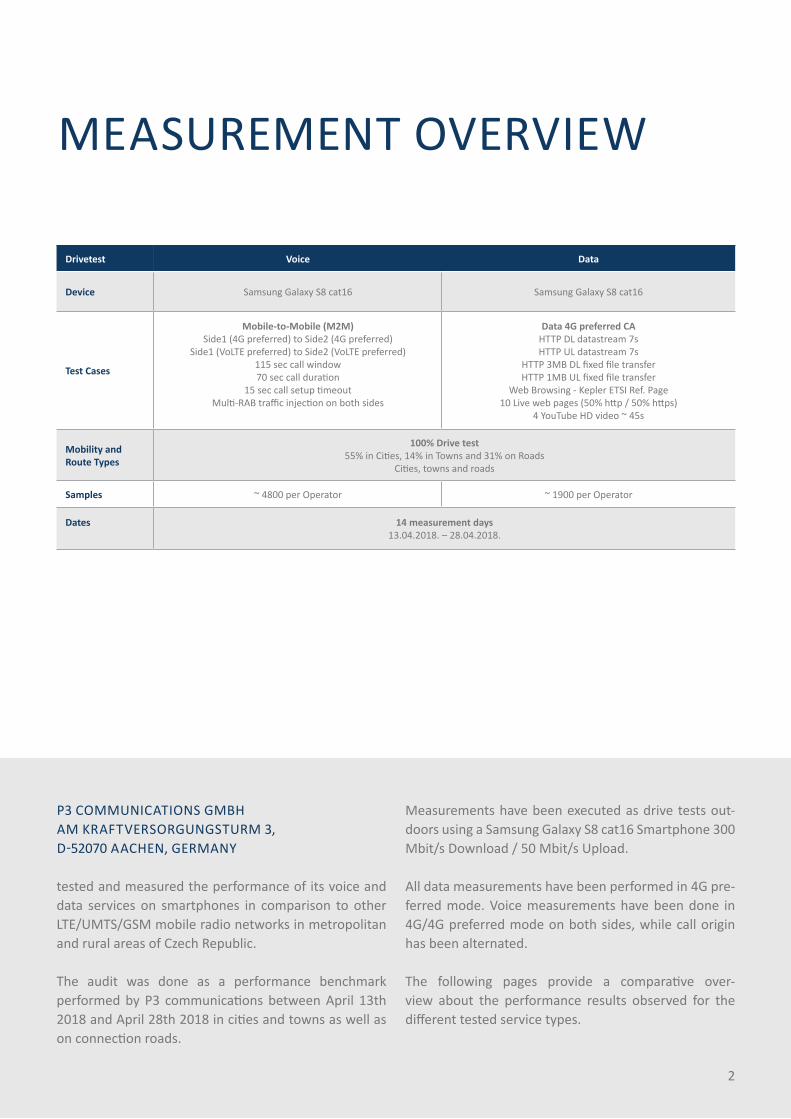
MEASUREMENT OVERVIEW
Drivetest Voice Data
Device Samsung Galaxy S8 cat16 Samsung Galaxy S8 cat16
Test Cases
Mobile-to-Mobile (M2M)Side1 (4G preferred) to Side2 (4G preferred)
Side1 (VoLTE preferred) to Side2 (VoLTE preferred) 115 sec call window70 sec call duration
15 sec call setup timeoutMulti-RAB traffic injection on both sides
Data 4G preferred CAHTTP DL datastream 7sHTTP UL datastream 7s
HTTP 3MB DL fixed file transferHTTP 1MB UL fixed file transfer
Web Browsing - Kepler ETSI Ref. Page10 Live web pages (50% http / 50% https)
4 YouTube HD video ~ 45s
Mobility andRoute Types
100% Drive test55% in Cities, 14% in Towns and 31% on Roads
Cities, towns and roads
Samples ~ 4800 per Operator ~ 1900 per Operator
Dates 14 measurement days13.04.2018. – 28.04.2018.
P3 COMMUNICATIONS GMBHAM KRAFTVERSORGUNGSTURM 3, D-52070 AACHEN, GERMANY
tested and measured the performance of its voice and data services on smartphones in comparison to other LTE/UMTS/GSM mobile radio networks in metropolitan and rural areas of Czech Republic.
The audit was done as a performance benchmark performed by P3 communications between April 13th 2018 and April 28th 2018 in cities and towns as well as on connection roads.
Measurements have been executed as drive tests out-doors using a Samsung Galaxy S8 cat16 Smartphone 300 Mbit/s Download / 50 Mbit/s Upload.
All data measurements have been performed in 4G pre-ferred mode. Voice measurements have been done in 4G/4G preferred mode on both sides, while call origin has been alternated.
The following pages provide a comparative over-view about the performance results observed for the different tested service types.
2

3
LiberecTeplice
Ceske Budejovice
Brno
Jihlava
PlzenOstrava
Olomuc
Zlin
Opava
Vyskov
Stochov
Novy Bor
Roudnice nad Labem Horice
Turnov
Hradec KralovePodebrady
Velke Mezirici
Modrice
Hulin Vse n
Klimkovice
Novy Jicin
Fulnek
HlucinHradec nad Moravici
Otrokovice
Benesov
Velke Popovice
SobeslavPlana nad Luznici
Pisek
Blatna
PragueKladno
Us nad Labem
TESTING ROUTE
5000 kmmeasuring distance
29 �of population measured
CitiesTownsRoads

CLAIMS
BEST IN TESTVODAFONE
BEST IN VOICEVODAFONE
4
BEST IN DATAVODAFONE
5
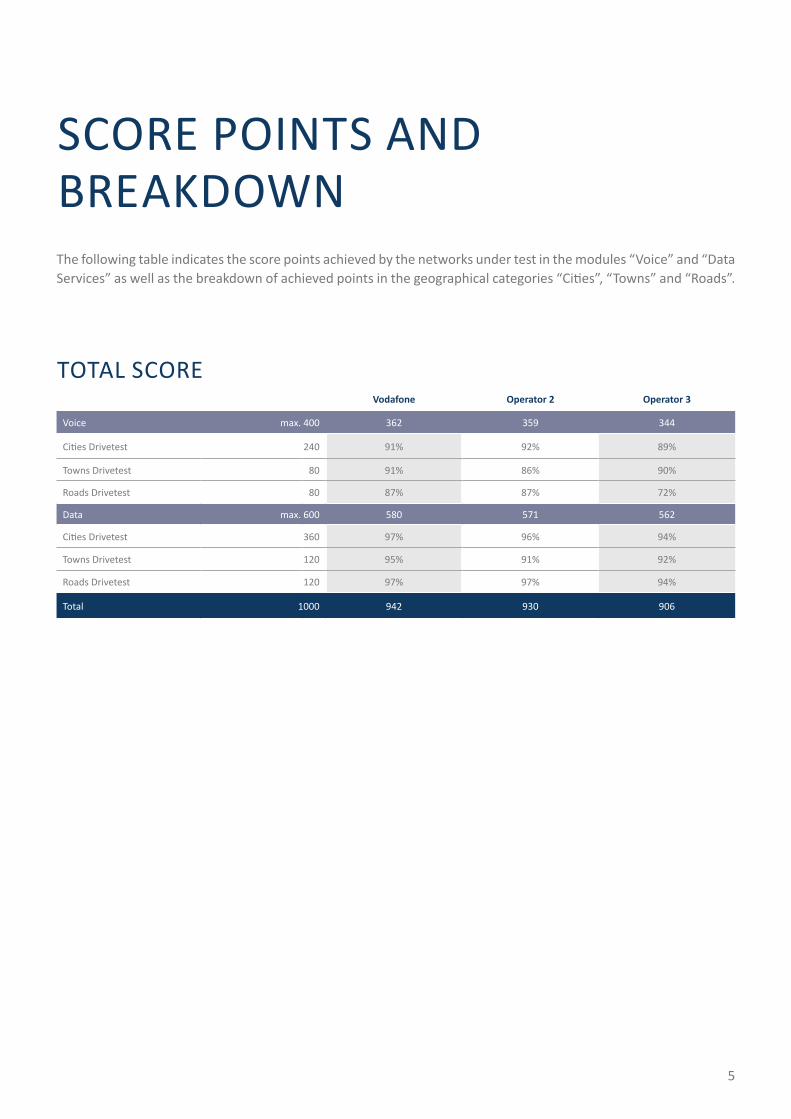
SCORE POINTS AND BREAKDOWNThe following table indicates the score points achieved by the networks under test in the modules “Voice” and “Data Services” as well as the breakdown of achieved points in the geographical categories “Cities”, “Towns” and “Roads”.
TOTAL SCOREVodafone Operator 2 Operator 3
Voice max. 400 362 359 344
Cities Drivetest 240 91% 92% 89%
Towns Drivetest 80 91% 86% 90%
Roads Drivetest 80 87% 87% 72%
Data max. 600 580 571 562
Cities Drivetest 360 97% 96% 94%
Towns Drivetest 120 95% 91% 92%
Roads Drivetest 120 97% 97% 94%
Total 1000 942 930 906
6
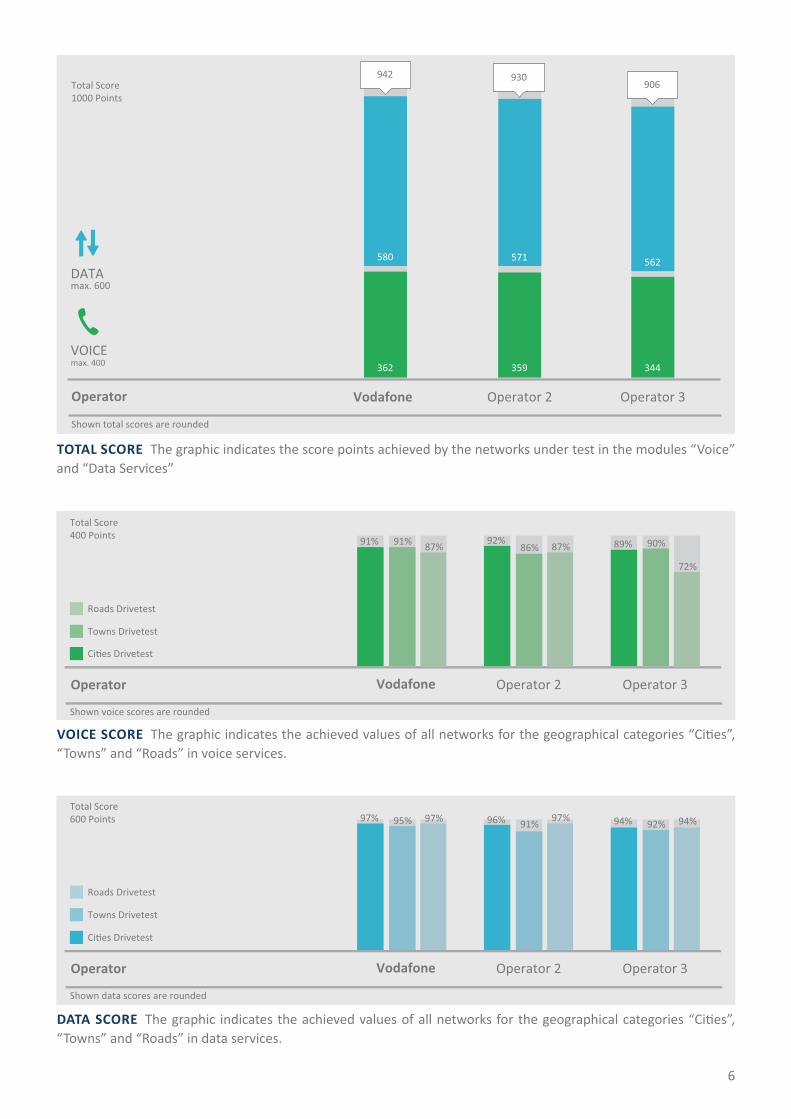
VOICE SCORE The graphic indicates the achieved values of all networks for the geographical categories “Cities”, “Towns” and “Roads” in voice services.
Total Score400 Points
Shown voice scores are rounded
Towns Drivetest
Roads Drivetest
Ci�es Drivetest
Operator
91% 91% 87%
Vodafone
92%86% 87%
Operator 2
89% 90%
72%
Operator 3
Total Score600 Points
Shown data scores are rounded
Towns Drivetest
Roads Drivetest
Ci�es Drivetest
Operator
97% 95% 96% 91% 94% 92%97%
Vodafone Operator 2 Operator 3
97% 94%
DATA SCORE The graphic indicates the achieved values of all networks for the geographical categories “Cities”, “Towns” and “Roads” in data services.
TOTAL SCORE The graphic indicates the score points achieved by the networks under test in the modules “Voice” and “Data Services”
Operator
Total Score1000 Points
Shown total scores are rounded
Vodafone
580
362
942
Operator 2
571
359
930
Operator 3
562
344
906
VOICEmax. 400
DATAmax. 600
7
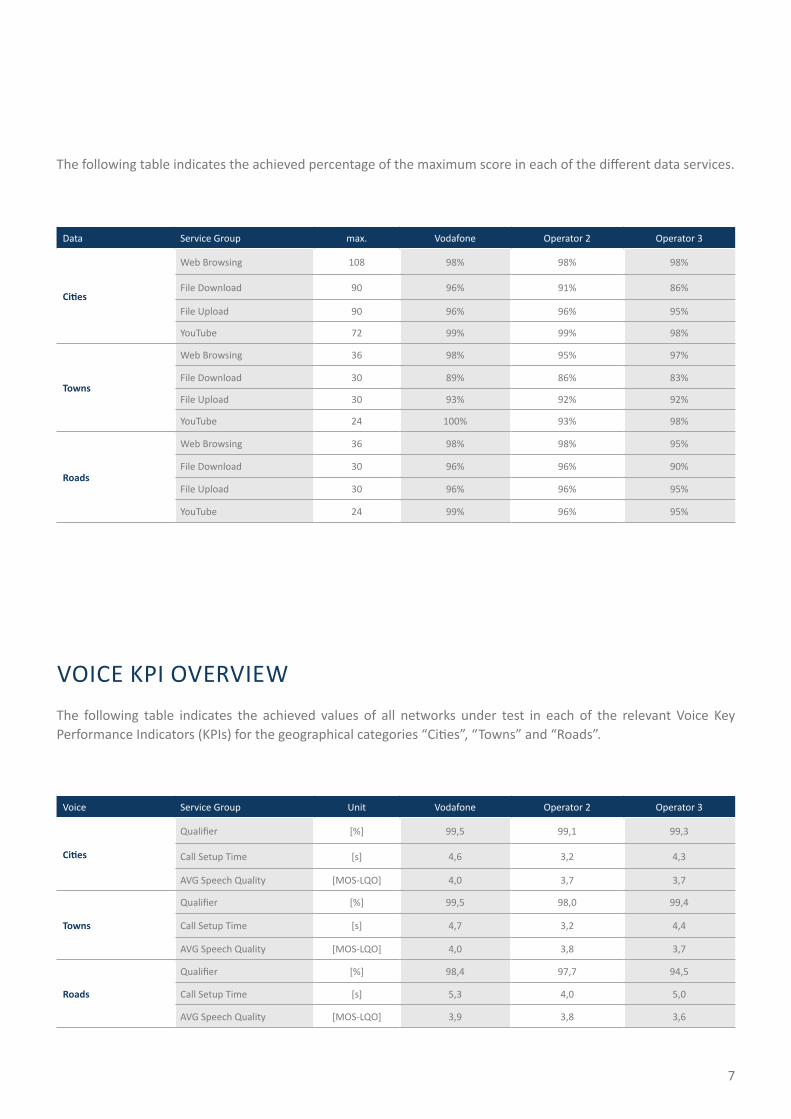
The following table indicates the achieved percentage of the maximum score in each of the different data services.
Data Service Group max. Vodafone Operator 2 Operator 3
Cities
Web Browsing 108 98% 98% 98%
File Download 90 96% 91% 86%
File Upload 90 96% 96% 95%
YouTube 72 99% 99% 98%
Towns
Web Browsing 36 98% 95% 97%
File Download 30 89% 86% 83%
File Upload 30 93% 92% 92%
YouTube 24 100% 93% 98%
Roads
Web Browsing 36 98% 98% 95%
File Download 30 96% 96% 90%
File Upload 30 96% 96% 95%
YouTube 24 99% 96% 95%
Voice Service Group Unit Vodafone Operator 2 Operator 3
Cities
Qualifier [%] 99,5 99,1 99,3
Call Setup Time [s] 4,6 3,2 4,3
AVG Speech Quality [MOS-LQO] 4,0 3,7 3,7
Towns
Qualifier [%] 99,5 98,0 99,4
Call Setup Time [s] 4,7 3,2 4,4
AVG Speech Quality [MOS-LQO] 4,0 3,8 3,7
Roads
Qualifier [%] 98,4 97,7 94,5
Call Setup Time [s] 5,3 4,0 5,0
AVG Speech Quality [MOS-LQO] 3,9 3,8 3,6
VOICE KPI OVERVIEWThe following table indicates the achieved values of all networks under test in each of the relevant Voice Key Performance Indicators (KPIs) for the geographical categories “Cities”, “Towns” and “Roads”.

8
DATA KPI OVERVIEWThe following table indicates the achieved values of all networks under test in each of the relevant Data Key Performance Indicators (KPIs) for the geographical categorie “Cities”.
Data Cities KPI Name Unit Vodafone Operator 2 Operator 3
HTTP Live Page DL
Qualifier [%] 99,9 99,7 99,9
Time to first Byte [ms] 377 363 391
KBytes first second [KB] 578 595 543
HTTP Static Page DLQualifier [%] 99,9 99,9 100,0
AVG Session Time [s] 1,0 1,0 1,1
HTTP file DL 3MB
Qualifier [%] 100,0 100,0 100,0
AVG Session Time [s] 0,9 1,1 1,6
90% faster than [kbit/s] 19791 12277 7763
10% faster than [kbit/s] 69707 73620 55944
HTTP file UL 1MB
Qualifier [%] 99,9 99,9 99,9
AVG Session Time [s] 0,9 0,8 0,8
90% faster than [kbit/s] 6.742 7.759 7.477
10% faster than [kbit/s] 19.527 19.802 17.762
HTTP DL FDTT 7s
Qualifier [%] 99,9 99,9 99,9
AVG throughput [kbit/s] 83788 74073 40480
90% faster than [kbit/s] 29895 16140 10369
10% faster than [kbit/s] 144072 139648 95738
HTTP UL FDTT 7s
Qualifier [%] 99,9 99,9 99,9
AVG throughput [kbit/s] 32.871 31.237 24.364
90% faster than [kbit/s] 13000 12034 13924
10% faster than [kbit/s] 53208 52712 43814
YouTube
Qualifier [%] 100,0 99,9 100,0
Start Time [s] 1,7 1,7 1,9
Playouts w/o interruptions [%] 99,9 99,9 99,7
AVG Resolution [p] 1079,7 1076,0 1076,8
9
Data Towns KPI Name Unit Vodafone Operator 2 Operator 3
HTTP Live Page DL
Qualifier [%] 99,9 99,4 99,8
Time to first Byte [ms] 381 383 404
KBytes first second [KB] 569 562 531
HTTP Static Page DLQualifier [%] 100,0 99,5 99,8
AVG Session Time [s] 1,0 1,1 1,1
HTTP file DL 3MB
Qualifier [%] 100,0 99,7 100,0
AVG Session Time [s] 1,1 1,6 1,7
90% faster than [kbit/s] 11578 7017 8385
10% faster than [kbit/s] 57554 67190 40844
HTTP file UL 1MB
Qualifier [%] 100,0 99,3 100,0
AVG Session Time [s] 1,0 1,0 0,9
90% faster than [kbit/s] 6.237 6.554 6.596
10% faster than [kbit/s] 16.849 16.553 14.790
HTTP DL FDTT 7s
Qualifier [%] 100,0 100,0 100,0
AVG throughput [kbit/s] 57473 54785 26901
90% faster than [kbit/s] 11849 8341 9403
10% faster than [kbit/s] 107246 127701 47671
HTTP UL FDTT 7s
Qualifier [%] 100,0 100,0 100,0
AVG throughput [kbit/s] 21.623 22.501 18.266
90% faster than [kbit/s] 8910 9272 10226
10% faster than [kbit/s] 36627 42439 22753
YouTube
Qualifier [%] 100,0 98,7 100,0
Start Time [s] 1,8 1,9 2,0
Playouts w/o interruptions [%] 100,0 99,7 99,7
AVG Resolution [p] 1.076,8 1.069,8 1.074,4
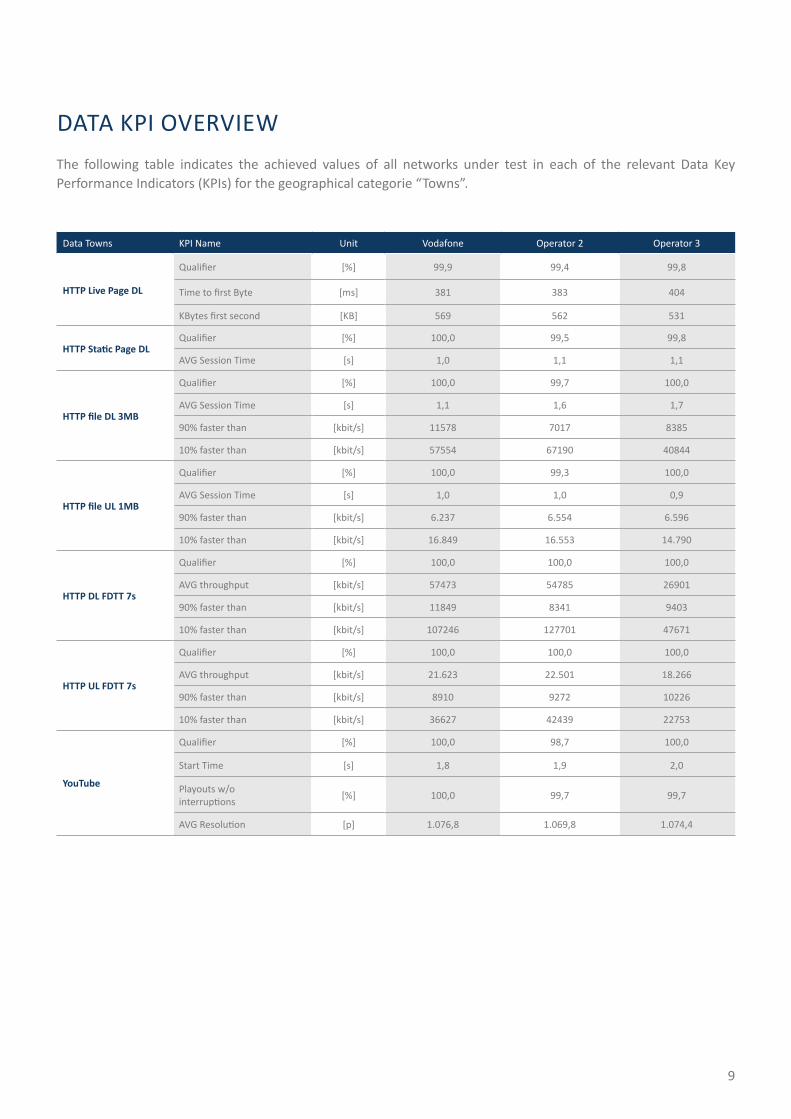
DATA KPI OVERVIEWThe following table indicates the achieved values of all networks under test in each of the relevant Data Key Performance Indicators (KPIs) for the geographical categorie “Towns”.

10
Data Roads KPI Name Unit Vodafone Operator 2 Operator 3
HTTP Live Page DL
Qualifier [%] 99,8 99,5 98,8
Time to first Byte [ms] 381 366 401
KBytes first second [KB] 566 578 527
HTTP Static Page DLQualifier [%] 99,9 99,7 99,4
AVG Session Time [s] 1,0 1,0 1,1
HTTP file DL 3MB
Qualifier [%] 100,0 99,8 99,6
AVG Session Time [s] 1,4 1,5 2,1
90% faster than [kbit/s] 9558 7929 7504
10% faster than [kbit/s] 51173 66262 42858
HTTP file UL 1MB
Qualifier [%] 99,6 99,2 99,8
AVG Session Time [s] 1,0 1,0 1,0
90% faster than [kbit/s] 6.014 6.813 6.224
10% faster than [kbit/s] 17.692 17.399 16.074
HTTP DL FDTT 7s
Qualifier [%] 100,0 100,0 99,4
AVG throughput [kbit/s] 40690 50158 26864
90% faster than [kbit/s] 9957 8498 8394
10% faster than [kbit/s] 86016 115158 51312
HTTP UL FDTT 7s
Qualifier [%] 99,8 99,4 99,3
AVG throughput [kbit/s] 21.963 21.833 18.025
90% faster than [kbit/s] 9520 8543 8690
10% faster than [kbit/s] 34600 40159 22449
YouTube
Qualifier [%] 99,8 99,1 98,7
Start Time [s] 1,9 1,9 2,0
Playouts w/o interruptions [%] 99,8 99,6 99,6
AVG Resolution [p] 1.077,5 1.073,5 1.072,5
DATA KPI OVERVIEWThe following table indicates the achieved values of all networks under test in each of the relevant Data Key Performance Indicators (KPIs) for the geographical categorie “Roads”.