zicom group limited - asx · zicom group limited abn 62 009 816 871 • asx code : zgl annu al...
TRANSCRIPT

Zicom Group LimitedABN 62 009 816 871 • ASX Code : ZGL
A N N U A L R E P O R T 2 0 1 5
Whatever you can do or dream you can,
Begin it. Boldness has genius, power and magic in it.
- Johann Wolfgang von Goethe
(1749 - 1832)
The Everest
For
per
sona
l use
onl
y
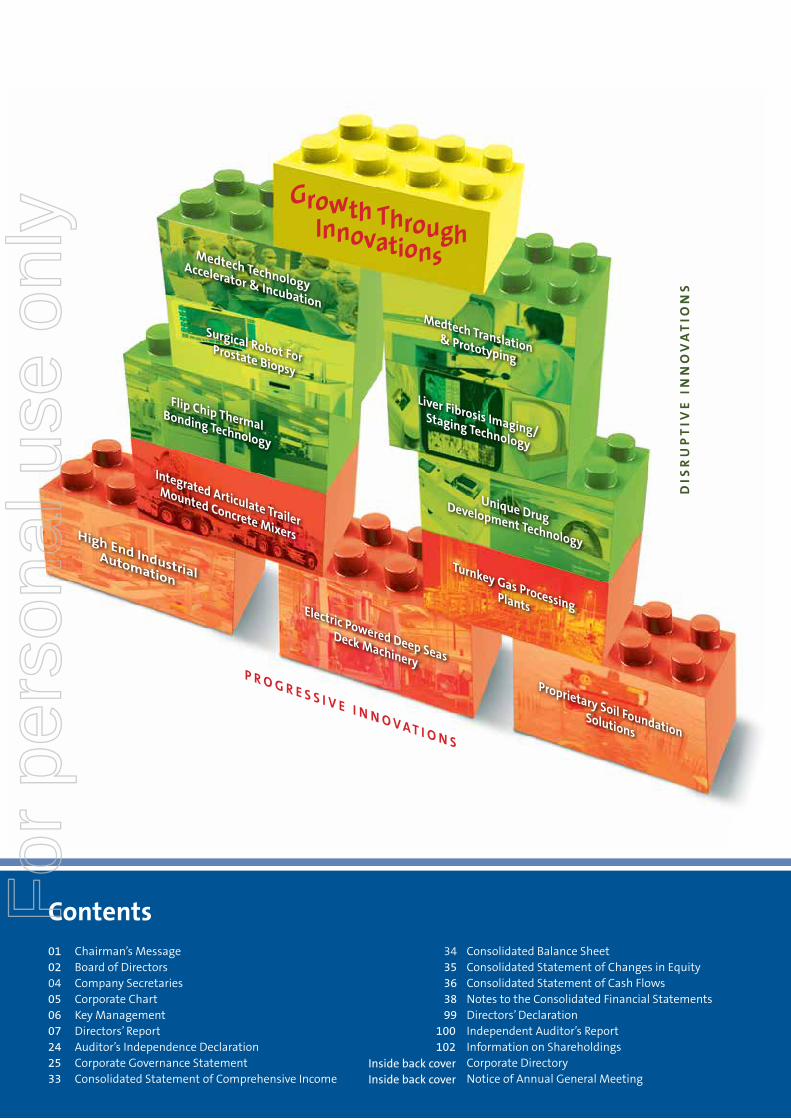
Medtech TechnologyAccelerator & Incubation
Flip Chip Thermal Bonding Technology
Surgical Robot For Prostate Biopsy
Turnkey Gas ProcessingPlants
High End IndustrialAutomation
Medtech Translation& Prototyping
Growth Through Innovations
Liver Fibrosis Imaging/Staging Technology
Unique Drug Development Technology
Integrated Articulate Trailer
Mounted Concrete Mixers
Electric Powered Deep Seas
Deck Machinery
Proprietary Soil FoundationSolutions
P R O G R E S S I V E I N N O V A T I O N S
DIS
RU
PT
IVE
IN
NO
VA
TIO
NS
01 Chairman’s Message 02 Board of Directors04 Company Secretaries05 Corporate Chart 06 Key Management07 Directors’ Report 24 Auditor’s Independence Declaration 25 Corporate Governance Statement 33 Consolidated Statement of Comprehensive Income
InsidebackcoverInsidebackcover
34 Consolidated Balance Sheet 35 Consolidated Statement of Changes in Equity 36 Consolidated Statement of Cash Flows 38 Notes to the Consolidated Financial Statements 99 Directors’ Declaration 100 Independent Auditor’s Report 102 Information on Shareholdings Corporate Directory Notice of Annual General Meeting
ContentsFor
per
sona
l use
onl
y
Chairman’s Message
Dear Shareholders,
Global competition and economic uncertainties have made growth more challenging than ever. Innovation has been the key plank enabling successful global growth companies to defy the laws of economic gravity.
INNOVATE TO GROWTo achieve long term sustainable growth, your Group decided a few years back to embrace innovation in both forms: progressive and disruptive innovations. Progressive innovations strengthen the Group’s core capabilities enabling its businesses to scale up the value chain and to stay ahead of the curve. Disruptive technologies as those in the medtech and semi-conductor related technologies that we have invested in, possess the capability to disrupt the existing market to create new market and value.
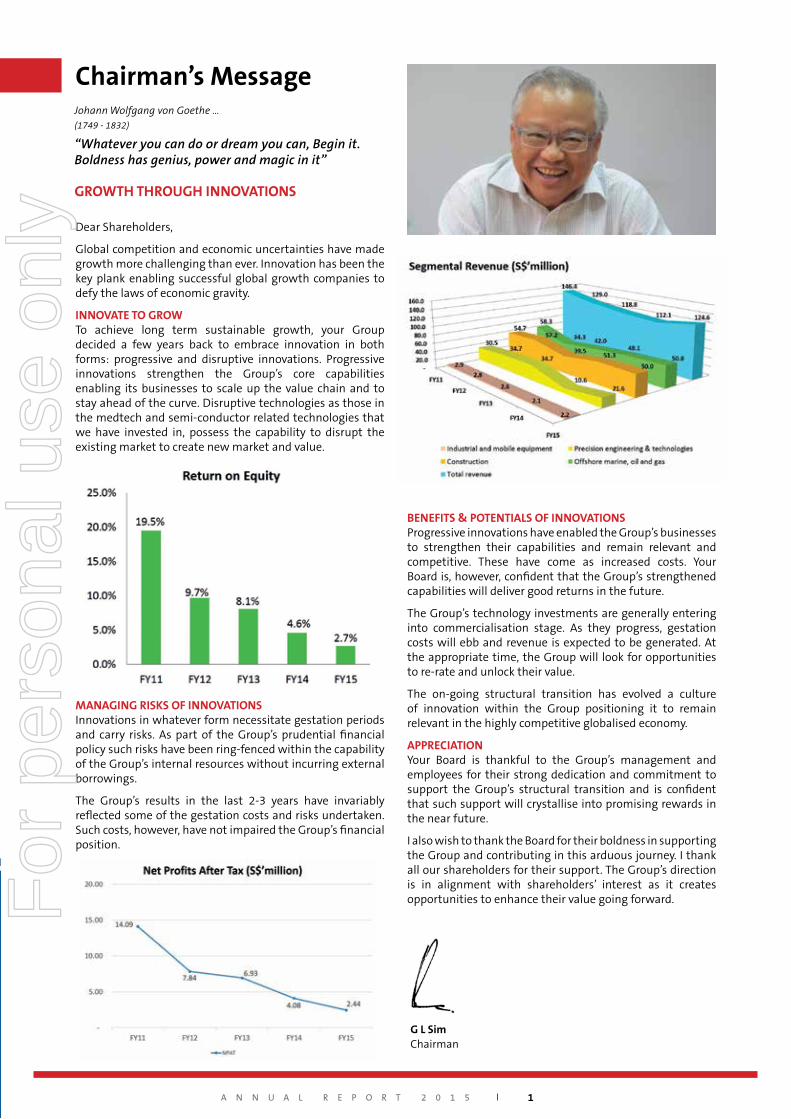
BENEFITS & POTENTIALS OF INNOVATIONSProgressive innovations have enabled the Group’s businesses to strengthen their capabilities and remain relevant and competitive. These have come as increased costs. Your Board is, however, confident that the Group’s strengthened capabilities will deliver good returns in the future.
The Group’s technology investments are generally entering into commercialisation stage. As they progress, gestation costs will ebb and revenue is expected to be generated. At the appropriate time, the Group will look for opportunities to re-rate and unlock their value.
The on-going structural transition has evolved a culture of innovation within the Group positioning it to remain relevant in the highly competitive globalised economy.
APPRECIATIONYour Board is thankful to the Group’s management and employees for their strong dedication and commitment to support the Group’s structural transition and is confident that such support will crystallise into promising rewards in the near future.
I also wish to thank the Board for their boldness in supporting the Group and contributing in this arduous journey. I thank all our shareholders for their support. The Group’s direction is in alignment with shareholders’ interest as it creates opportunities to enhance their value going forward.
G L SimChairman
MANAGING RISKS OF INNOVATIONSInnovations in whatever form necessitate gestation periods and carry risks. As part of the Group’s prudential financial policy such risks have been ring-fenced within the capability of the Group’s internal resources without incurring external borrowings.
The Group’s results in the last 2-3 years have invariably reflected some of the gestation costs and risks undertaken. Such costs, however, have not impaired the Group’s financial position.
Johann Wolfgang von Goethe …(1749 - 1832)
“Whatever you can do or dream you can, Begin it. Boldness has genius, power and magic in it”
GROWTH THROUGH INNOVATIONS
A N N U A L R E P O R T 2 0 1 5 1
For
per
sona
l use
onl
y
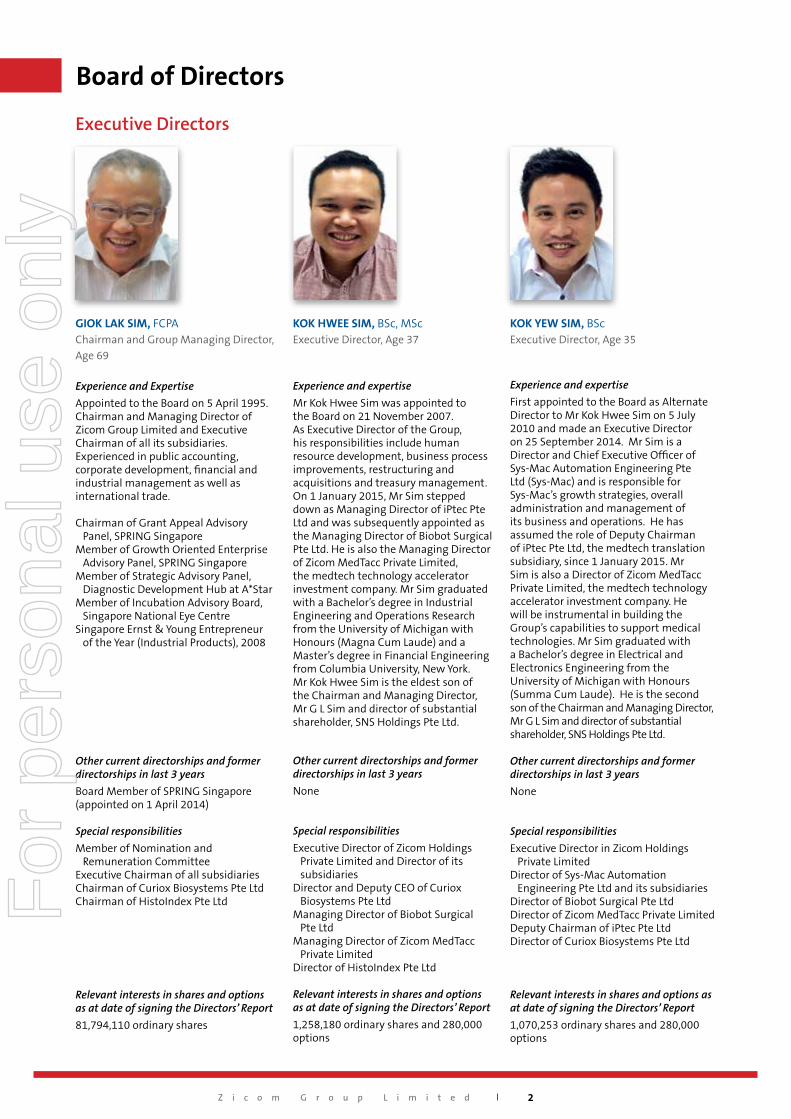
GIOK LAK SIM, FCPAChairman and Group Managing Director, Age 69
Experience and Expertise
Appointed to the Board on 5 April 1995. Chairman and Managing Director of Zicom Group Limited and Executive Chairman of all its subsidiaries. Experienced in public accounting, corporate development, financial and industrial management as well as international trade.
Chairman of Grant Appeal Advisory Panel, SPRING SingaporeMember of Growth Oriented Enterprise Advisory Panel, SPRING Singapore Member of Strategic Advisory Panel, Diagnostic Development Hub at A*StarMember of Incubation Advisory Board, Singapore National Eye CentreSingapore Ernst & Young Entrepreneur of the Year (Industrial Products), 2008
Other current directorships and former directorships in last 3 years
Board Member of SPRING Singapore (appointed on 1 April 2014)
Special responsibilities
Member of Nomination and Remuneration CommitteeExecutive Chairman of all subsidiariesChairman of Curiox Biosystems Pte LtdChairman of HistoIndex Pte Ltd
Relevant interests in shares and options as at date of signing the Directors’ Report
81,794,110 ordinary shares
Executive Directors
KOK YEW SIM, BScExecutive Director, Age 35
Experience and expertise
First appointed to the Board as Alternate Director to Mr Kok Hwee Sim on 5 July 2010 and made an Executive Director on 25 September 2014. Mr Sim is a Director and Chief Executive Officer of Sys-Mac Automation Engineering Pte Ltd (Sys-Mac) and is responsible for Sys-Mac’s growth strategies, overall administration and management of its business and operations. He has assumed the role of Deputy Chairman of iPtec Pte Ltd, the medtech translation subsidiary, since 1 January 2015. Mr Sim is also a Director of Zicom MedTacc Private Limited, the medtech technology accelerator investment company. He will be instrumental in building the Group’s capabilities to support medical technologies. Mr Sim graduated with a Bachelor’s degree in Electrical and Electronics Engineering from the University of Michigan with Honours (Summa Cum Laude). He is the second son of the Chairman and Managing Director, Mr G L Sim and director of substantial shareholder, SNS Holdings Pte Ltd.
Other current directorships and former directorships in last 3 years
None
Special responsibilities
Executive Director in Zicom Holdings Private LimitedDirector of Sys-Mac Automation Engineering Pte Ltd and its subsidiariesDirector of Biobot Surgical Pte LtdDirector of Zicom MedTacc Private LimitedDeputy Chairman of iPtec Pte LtdDirector of Curiox Biosystems Pte Ltd
Relevant interests in shares and options as at date of signing the Directors’ Report
1,070,253 ordinary shares and 280,000 options
KOK HWEE SIM, BSc, MScExecutive Director, Age 37
Experience and expertise
Mr Kok Hwee Sim was appointed to the Board on 21 November 2007. As Executive Director of the Group, his responsibilities include human resource development, business process improvements, restructuring and acquisitions and treasury management. On 1 January 2015, Mr Sim stepped down as Managing Director of iPtec Pte Ltd and was subsequently appointed as the Managing Director of Biobot Surgical Pte Ltd. He is also the Managing Director of Zicom MedTacc Private Limited, the medtech technology accelerator investment company. Mr Sim graduated with a Bachelor’s degree in Industrial Engineering and Operations Research from the University of Michigan with Honours (Magna Cum Laude) and a Master’s degree in Financial Engineering from Columbia University, New York. Mr Kok Hwee Sim is the eldest son of the Chairman and Managing Director, Mr G L Sim and director of substantial shareholder, SNS Holdings Pte Ltd.
Other current directorships and former directorships in last 3 years
None
Special responsibilities
Executive Director of Zicom Holdings Private Limited and Director of its subsidiariesDirector and Deputy CEO of Curiox Biosystems Pte LtdManaging Director of Biobot Surgical Pte LtdManaging Director of Zicom MedTacc Private LimitedDirector of HistoIndex Pte Ltd
Relevant interests in shares and options as at date of signing the Directors’ Report
1,258,180 ordinary shares and 280,000 options
Board of Directors
Z i c o m G r o u p L i m i t e d 2
For
per
sona
l use
onl
y
FRANK LEONG YEE YEW, MBA, FCA (ENGLAND & WALES), FCA (SINGAPORE)Independent Director, Age 72
Experience and expertise
Appointed to the Board on 24 July 2006. Extensive experience in auditing, financial management and corporate secretarial work, having practised as a partner in an audit firm and worked as a company secretary, finance manager and financial controller in a leading property development company and involved in acquisitions and major developments.
Other current directorships and former directorships in last 3 years
Independent Director of TTJ Holdings Limited (appointed 11 January 2010)
Special responsibilities
Member of Nomination and Remuneration CommitteeMember of Audit Committee Non-executive Director of Zicom Holdings Private Limited
Relevant interests in shares and options as at date of signing the Directors’ Report
624,364 ordinary shares
Independent Directors
IAN ROBERT MILLARD, FCA, FAICDIndependent Director, Age 76
Experience and expertise
Appointed to the Board on 23 November 2006. Extensive experience in public accounting and corporate secretarial work. Fellow of the Institute of Chartered Accountants with 30 years as a partner in major accounting firms in Queensland and a Fellow of the Australian Institute of Company Directors.
Other current directorships and former directorships in last 3 years
None
Special responsibilities
Chairman of Audit Committee
Relevant interests in shares and options as at date of signing the Directors’ Report
592,250 ordinary shares
SHAW PAO SZEIndependent Director, Age 71
Experience and expertise
Appointed to the Board on 19 February 2010. Mr Shaw Pao Sze holds a Master Foreign-Going Certificate of Competency and has extensive experiences in maritime industry from managing liner and ship chartering services, corporate planning in one of the world’s largest shipping lines and consultancy services for transport engineering, maritime and logistics planning for infrastructure projects.
Other current directorships and former directorships in last 3 years
Synergy Metals Ltd (Australia) (appointed 15 October 2010)
Special responsibilities
None
Relevant interests in shares and options as at date of signing the Directors’ Report
30,000 options
YIAN POH LIM, BSc, MScIndependent Director, Age 69
Experience and expertise
Appointed to the Board on 24 July 2006. Yian Poh Lim has more than 20 years of extensive experience in the banking and finance industry. In 1993, he set up Yian Poh Associates, a financial consultancy and investment firm. He has been an Honorary Commercial Advisor to The Administrative Committee of Jiaxing Economic Development Zone, China since 2000. He is also a member of the advisory panel of the Singapore Food Manufacturers’ Association.
Other current directorships and former directorships in last 3 years
Independent Director of Casa Holdings Limited (appointed 4 November 2008)Independent Director of TTJ Holdings Limited (appointed 5 July 1996)
Special responsibilities
Chairman of Nomination and Remuneration CommitteeMember of Audit CommitteeNon-executive Director of Zicom Holdings Private Limited
Relevant interests in shares and options as at date of signing the Directors’ Report
488,000 ordinary shares
A N N U A L R E P O R T 2 0 1 5 3
For
per
sona
l use
onl
y
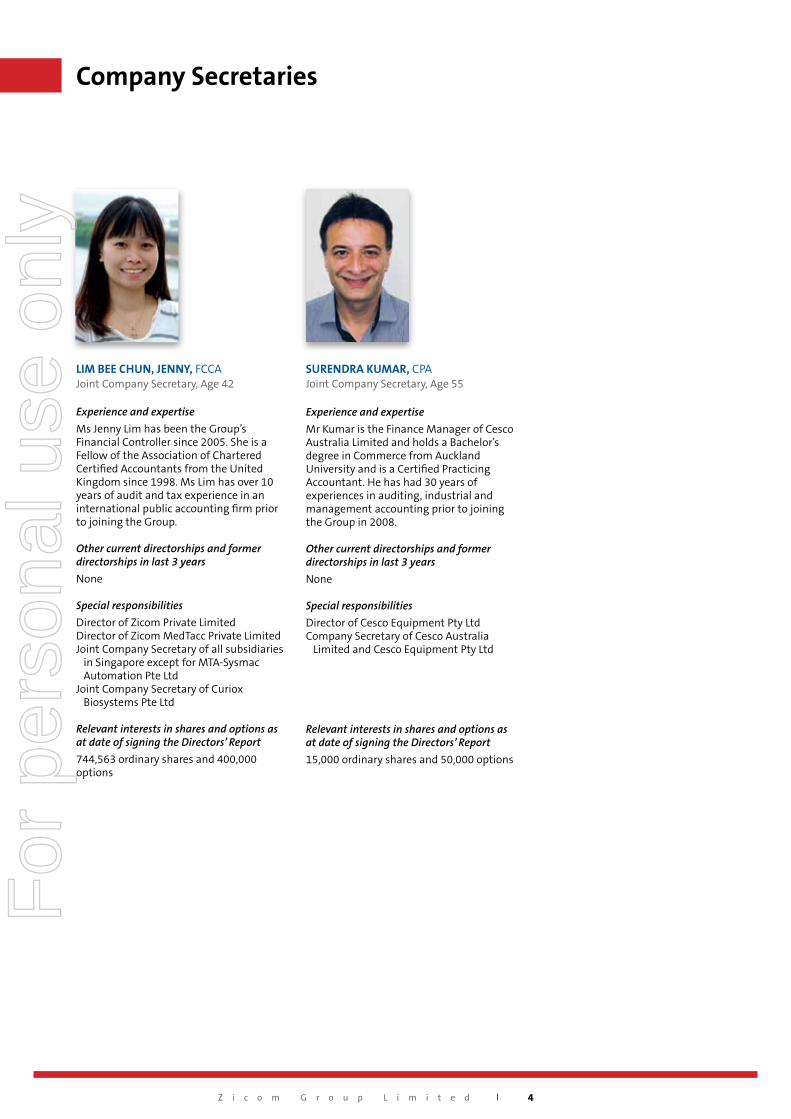
SURENDRA KUMAR, CPAJoint Company Secretary, Age 55
Experience and expertise
Mr Kumar is the Finance Manager of Cesco Australia Limited and holds a Bachelor’s degree in Commerce from Auckland University and is a Certified Practicing Accountant. He has had 30 years of experiences in auditing, industrial and management accounting prior to joining the Group in 2008.
Other current directorships and former directorships in last 3 years
None
Special responsibilities
Director of Cesco Equipment Pty LtdCompany Secretary of Cesco Australia Limited and Cesco Equipment Pty Ltd
Relevant interests in shares and options as at date of signing the Directors’ Report
15,000 ordinary shares and 50,000 options
LIM BEE CHUN, JENNY, FCCAJoint Company Secretary, Age 42
Experience and expertise
Ms Jenny Lim has been the Group’s Financial Controller since 2005. She is a Fellow of the Association of Chartered Certified Accountants from the United Kingdom since 1998. Ms Lim has over 10 years of audit and tax experience in an international public accounting firm prior to joining the Group.
Other current directorships and former directorships in last 3 years
None
Special responsibilities
Director of Zicom Private LimitedDirector of Zicom MedTacc Private Limited Joint Company Secretary of all subsidiaries in Singapore except for MTA-Sysmac Automation Pte Ltd Joint Company Secretary of Curiox Biosystems Pte Ltd
Relevant interests in shares and options as at date of signing the Directors’ Report
744,563 ordinary shares and 400,000 options
Company Secretaries
Z i c o m G r o u p L i m i t e d 4
For
per
sona
l use
onl
y
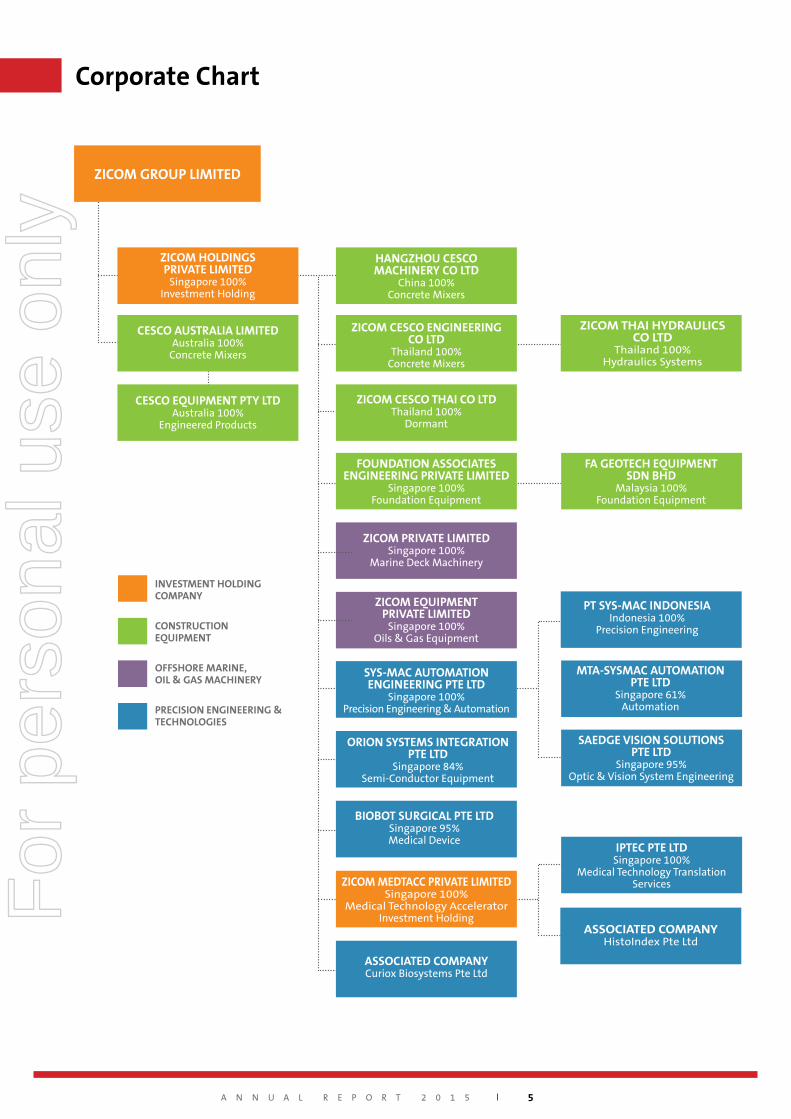
Corporate Chart
INVESTMENT HOLDING COMPANY
OFFSHORE MARINE, OIL & GAS MACHINERY
CONSTRUCTION EQUIPMENT
PRECISION ENGINEERING & TECHNOLOGIES
ZICOM GROUP LIMITED
ZICOM HOLDINGS PRIVATE LIMITED
Singapore100%InvestmentHolding
CESCO AUSTRALIA LIMITEDAustralia100%
ConcreteMixers
FOUNDATION ASSOCIATES ENGINEERING PRIVATE LIMITED
Singapore100%FoundationEquipment
ZICOM THAI HYDRAULICS CO LTD
Thailand100%HydraulicsSystems
FA GEOTECH EQUIPMENT SDN BHD
Malaysia100%FoundationEquipment
ZICOM PRIVATE LIMITEDSingapore100%
MarineDeckMachinery
CESCO EQUIPMENT PTY LTDAustralia100%
EngineeredProducts
HANGZHOU CESCO MACHINERY CO LTD
China100%ConcreteMixers
ZICOM CESCO ENGINEERING CO LTD
Thailand100%ConcreteMixers
ZICOM CESCO THAI CO LTD Thailand100%
Dormant
ZICOM EQUIPMENT PRIVATE LIMITED
Singapore100%Oils&GasEquipment
SYS-MAC AUTOMATION ENGINEERING PTE LTD
Singapore100%PrecisionEngineering&Automation
ORION SYSTEMS INTEGRATION PTE LTD
Singapore84%Semi-ConductorEquipment
BIOBOT SURGICAL PTE LTDSingapore95%MedicalDevice
ZICOM MEDTACC PRIVATE LIMITEDSingapore100%
MedicalTechnologyAcceleratorInvestmentHolding
ASSOCIATED COMPANYHistoIndexPteLtd
ASSOCIATED COMPANYCurioxBiosystemsPteLtd
PT SYS-MAC INDONESIA Indonesia100%
PrecisionEngineering
MTA-SYSMAC AUTOMATION PTE LTD
Singapore61%Automation
SAEDGE VISION SOLUTIONS PTE LTD
Singapore95%Optic&VisionSystemEngineering
IPTEC PTE LTDSingapore100%
MedicalTechnologyTranslationServices
A N N U A L R E P O R T 2 0 1 5 5
For
per
sona
l use
onl
y
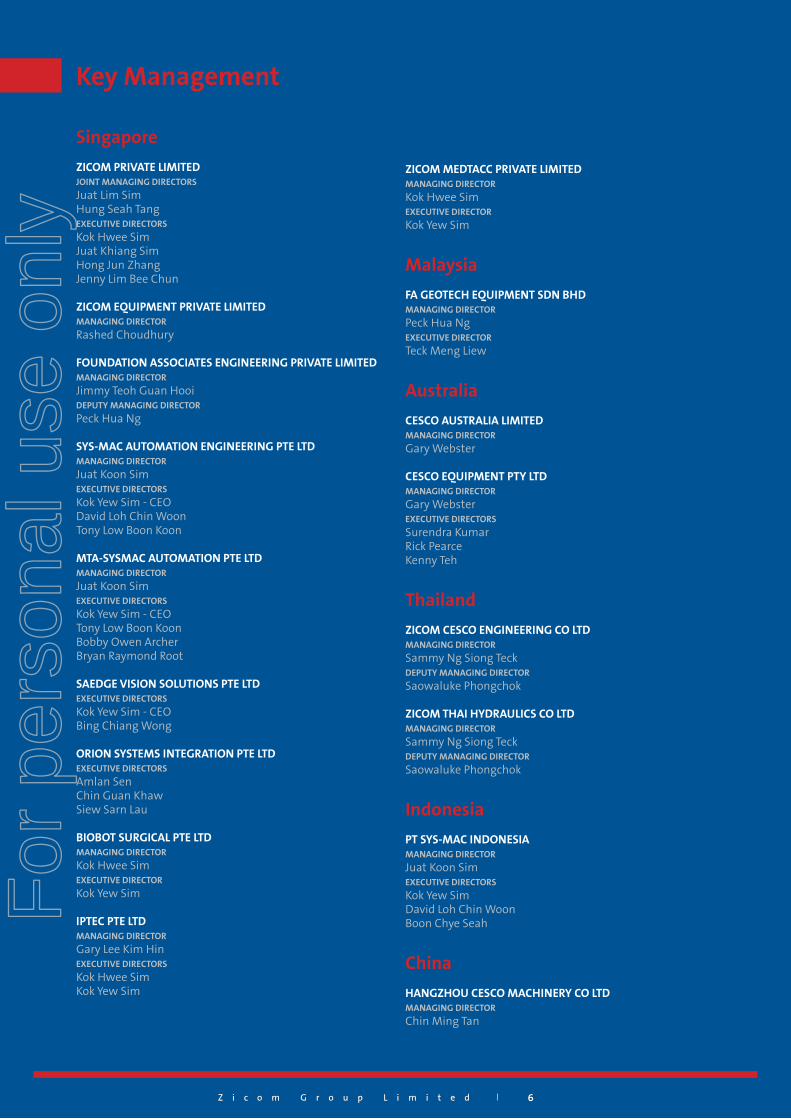
Singapore
ZICOM PRIVATE LIMITEDJOINT MANAGING DIRECTORS
Juat Lim SimHung Seah TangEXECUTIVE DIRECTORS
Kok Hwee SimJuat Khiang SimHong Jun ZhangJenny Lim Bee Chun
ZICOM EQUIPMENT PRIVATE LIMITEDMANAGING DIRECTOR
Rashed Choudhury
FOUNDATION ASSOCIATES ENGINEERING PRIVATE LIMITEDMANAGING DIRECTOR
Jimmy Teoh Guan HooiDEPUTY MANAGING DIRECTOR
Peck Hua Ng
SYS-MAC AUTOMATION ENGINEERING PTE LTDMANAGING DIRECTOR
Juat Koon SimEXECUTIVE DIRECTORS
Kok Yew Sim - CEODavid Loh Chin WoonTony Low Boon Koon
MTA-SYSMAC AUTOMATION PTE LTDMANAGING DIRECTOR
Juat Koon SimEXECUTIVE DIRECTORS
Kok Yew Sim - CEOTony Low Boon KoonBobby Owen ArcherBryan Raymond Root
SAEDGE VISION SOLUTIONS PTE LTDEXECUTIVE DIRECTORS
Kok Yew Sim - CEOBing Chiang Wong
ORION SYSTEMS INTEGRATION PTE LTDEXECUTIVE DIRECTORS
Amlan SenChin Guan KhawSiew Sarn Lau
BIOBOT SURGICAL PTE LTDMANAGING DIRECTOR
Kok Hwee SimEXECUTIVE DIRECTOR
Kok Yew Sim
IPTEC PTE LTD MANAGING DIRECTOR
Gary Lee Kim HinEXECUTIVE DIRECTORS
Kok Hwee SimKok Yew Sim
ZICOM MEDTACC PRIVATE LIMITEDMANAGING DIRECTOR
Kok Hwee SimEXECUTIVE DIRECTOR
Kok Yew Sim
Malaysia
FA GEOTECH EQUIPMENT SDN BHDMANAGING DIRECTOR
Peck Hua NgEXECUTIVE DIRECTOR
Teck Meng Liew
Australia
CESCO AUSTRALIA LIMITEDMANAGING DIRECTOR
Gary Webster
CESCO EQUIPMENT PTY LTDMANAGING DIRECTOR
Gary WebsterEXECUTIVE DIRECTORS
Surendra KumarRick PearceKenny Teh
Thailand
ZICOM CESCO ENGINEERING CO LTDMANAGING DIRECTOR
Sammy Ng Siong TeckDEPUTY MANAGING DIRECTOR
Saowaluke Phongchok
ZICOM THAI HYDRAULICS CO LTDMANAGING DIRECTOR
Sammy Ng Siong TeckDEPUTY MANAGING DIRECTOR
Saowaluke Phongchok
Indonesia
PT SYS-MAC INDONESIAMANAGING DIRECTOR
Juat Koon SimEXECUTIVE DIRECTORS
Kok Yew SimDavid Loh Chin WoonBoon Chye Seah
China
HANGZHOU CESCO MACHINERY CO LTDMANAGING DIRECTOR
Chin Ming Tan
Key Management
Z i c o m G r o u p L i m i t e d 6Z i c o m G r o u p L i m i t e d 6
For
per
sona
l use
onl
y
A N N U A L R E P O R T 2 0 1 5 7
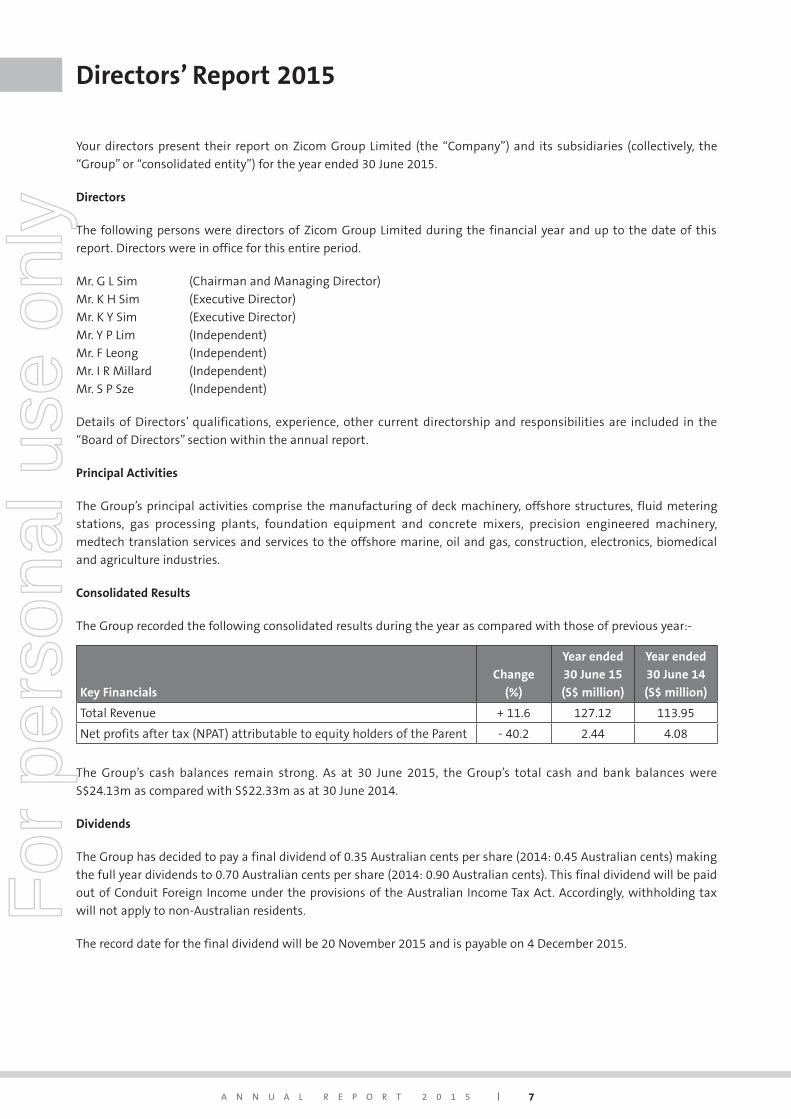
Directors’ Report 2015
Your directors present their report on Zicom Group Limited (the “Company”) and its subsidiaries (collectively, the
“Group” or “consolidated entity”) for the year ended 30 June 2015.
Directors
The following persons were directors of Zicom Group Limited during the financial year and up to the date of this
report. Directors were in office for this entire period.
Mr. G L Sim (Chairman and Managing Director)
Mr. K H Sim (Executive Director)
Mr. K Y Sim (Executive Director)
Mr. Y P Lim (Independent)
Mr. F Leong (Independent)
Mr. I R Millard (Independent)
Mr. S P Sze (Independent)
Details of Directors’ qualifications, experience, other current directorship and responsibilities are included in the
“Board of Directors” section within the annual report.
Principal Activities
The Group’s principal activities comprise the manufacturing of deck machinery, offshore structures, fluid metering
stations, gas processing plants, foundation equipment and concrete mixers, precision engineered machinery,
medtech translation services and services to the offshore marine, oil and gas, construction, electronics, biomedical
and agriculture industries.
Consolidated Results
The Group recorded the following consolidated results during the year as compared with those of previous year:-
Key Financials
Change
(%)
Year ended
30 June 15
(S$ million)
Year ended
30 June 14
(S$ million)
Total Revenue + 11.6 127.12 113.95
Net profits after tax (NPAT) attributable to equity holders of the Parent - 40.2 2.44 4.08
The Group’s cash balances remain strong. As at 30 June 2015, the Group’s total cash and bank balances were
S$24.13m as compared with S$22.33m as at 30 June 2014.
Dividends
The Group has decided to pay a final dividend of 0.35 Australian cents per share (2014: 0.45 Australian cents) making
the full year dividends to 0.70 Australian cents per share (2014: 0.90 Australian cents). This final dividend will be paid
out of Conduit Foreign Income under the provisions of the Australian Income Tax Act. Accordingly, withholding tax
will not apply to non-Australian residents.
The record date for the final dividend will be 20 November 2015 and is payable on 4 December 2015.
For
per
sona
l use
onl
y
8Z i c o m G r o u p L i m i t e d
Review of Operations
The Group’s consolidated revenue for the full year is S$127.12m as compared with S$113.95m in the previous year,
an increase of 11.6%. The Group’s full year net consolidated profits after tax attributable to members to 30 June
2015 are S$2.44m as compared with S$4.08m in the previous year, a decrease of 40.2%.
The net profit margin achieved for the full year is 2.0% as compared with 3.6% in the previous year, a drop of 1.6%.
Earnings per share dropped from Singapore 1.90 cents to 1.13 cents per share, a decrease of Singapore 0.77 cents.
Net tangible assets per share decreased slightly from Singapore 34.80 cents to 34.45 cents per share as a result of
translation loss arising from the depreciation in Australian dollar.
Return on equity, based on average of the opening and closing equity, for the year was 2.7% as compared to 4.6% in
2014.
The average rates for currency translation for transactions and cash flows are A$1 to S$1.0864 (2014: S$1.1521) for
the year ended 30 June 2015 and balances A$1 to S$1.0323 (2014: S$1.1739) as at 30 June 2015.
The results for the full year have been affected by cost overruns for the first time in projects undertaken involving
new processes by our precision engineering sector; dampened growth in the electronics sector, reduced margin
contributions by our construction equipment sector and timing delay in the recognition of oil and gas project
revenues.
The less than satisfactory results reflect an increased risk posture that the Group has taken in elevating its various
businesses up the value chain. The Group has established a strong engineering team imbued with various cross
disciplines and strong manufacturing capabilities. The Board believes that in order for the Group to achieve long
term sustainability in an age of dynamic changes globally, its businesses must scale up the value chain so as to
remain competitive and relevant. In doing so, the Group has, in recent years, forayed into medical technology and at
the same time assumed a higher risk exposure in its ongoing core businesses in participating in higher value projects
that come with higher rewards that are equally matched with higher risks.
The Group primarily positions the business for the long term benefit of its shareholders while it also hopes to meet
short term expectations. The Group adopts a calibrated approach and has always been measured and prudent in
its management of business risks. It ensures that all its investments in technologies that require some gestation
periods and projects with higher returns that inevitably come with increased risks are well covered by its internal
resources without being exposed to bank borrowings; hence its policy of holding strong cash balances with no bank
gearing.
In travelling this journey, the Group’s total capabilities continue to be enhanced and strengthened. The Group
therefore believes that the short-term setbacks suffered will strengthen the Group to climb up the value chain so as
to achieve higher and sustainable returns in the future.
Global economic uncertainties continue to reverberate, underscored by an imbalanced global economy that
is compounded by the Greek financial default that may well escalate in the Eurozone, the slowdown in the PRC’s
economy resulting in a recent Renminbi devaluation and rout in the share market, continuing deflation in Japan
and potential increase in interest rates. Although the Group’s businesses cannot escape from such global economic
impact, its focus therefore is to position and develop businesses and directions that can better withstand the impact
from such factors.
Directors’ Report 2015F
or p
erso
nal u
se o
nly
A N N U A L R E P O R T 2 0 1 5 9
Strategic Repositioning
The Group continues to focus in restructuring its businesses in line with global dynamics. It is continuously
reviewing its entire business activities and may potentially regroup its activities to unlock values. As a strategy, the
Group continues to manage its businesses as a matter of course to maintain stability. The Group adopts no fixed
timing to unlock value. It will do so only when the timing is suitable so as to maximise value.
The setbacks in the precision engineering sector represent a component of the journey embarked upon by the Group.
The Group therefore remains committed to strengthen the business structure and organisation in this sector. The
precision engineering business is critical in our quest to expand our investments into technology companies as it is
the engineering and manufacturing support base for these investments. Our investment in technology is aimed to
create a new and broader revenue stream for this sector transforming it into one based on product sales, which are
recurrent, instead of project sales which are typically more cyclical.
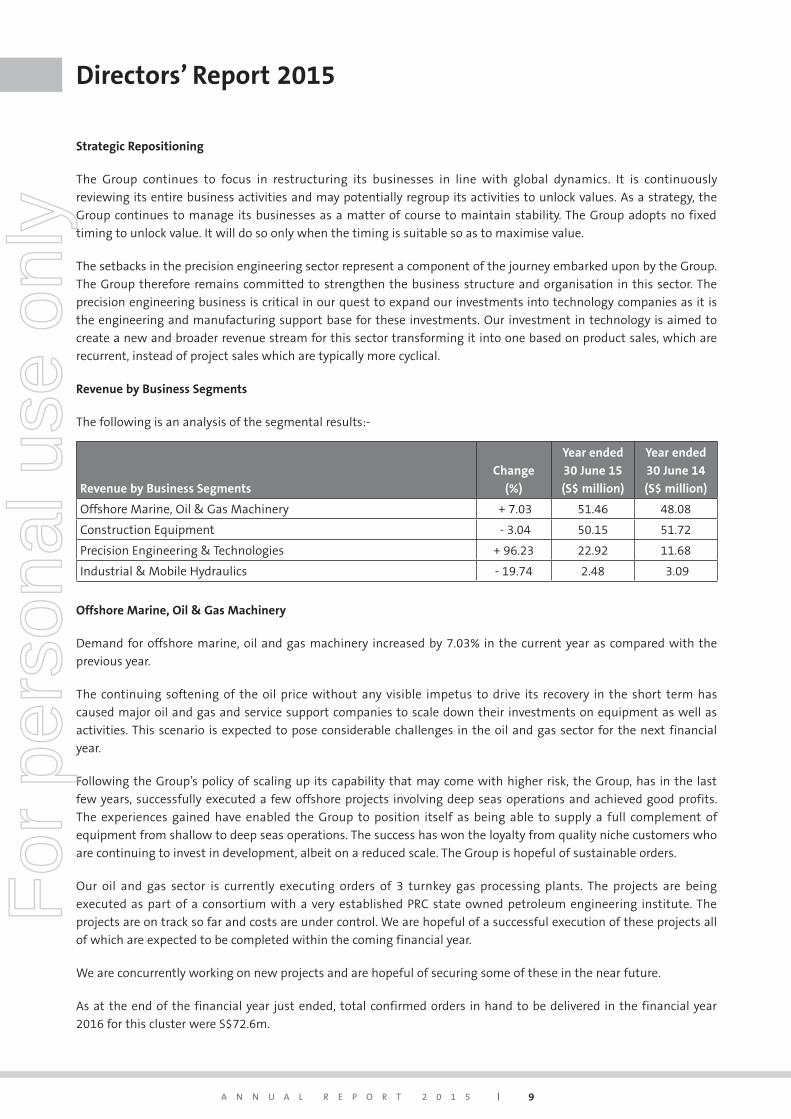
Revenue by Business Segments
The following is an analysis of the segmental results:-
Revenue by Business Segments
Change
(%)
Year ended
30 June 15
(S$ million)
Year ended
30 June 14
(S$ million)
Offshore Marine, Oil & Gas Machinery + 7.03 51.46 48.08
Construction Equipment - 3.04 50.15 51.72
Precision Engineering & Technologies + 96.23 22.92 11.68
Industrial & Mobile Hydraulics - 19.74 2.48 3.09
Offshore Marine, Oil & Gas Machinery
Demand for offshore marine, oil and gas machinery increased by 7.03% in the current year as compared with the
previous year.
The continuing softening of the oil price without any visible impetus to drive its recovery in the short term has
caused major oil and gas and service support companies to scale down their investments on equipment as well as
activities. This scenario is expected to pose considerable challenges in the oil and gas sector for the next financial
year.
Following the Group’s policy of scaling up its capability that may come with higher risk, the Group, has in the last
few years, successfully executed a few offshore projects involving deep seas operations and achieved good profits.
The experiences gained have enabled the Group to position itself as being able to supply a full complement of
equipment from shallow to deep seas operations. The success has won the loyalty from quality niche customers who
are continuing to invest in development, albeit on a reduced scale. The Group is hopeful of sustainable orders.
Our oil and gas sector is currently executing orders of 3 turnkey gas processing plants. The projects are being
executed as part of a consortium with a very established PRC state owned petroleum engineering institute. The
projects are on track so far and costs are under control. We are hopeful of a successful execution of these projects all
of which are expected to be completed within the coming financial year.
We are concurrently working on new projects and are hopeful of securing some of these in the near future.
As at the end of the financial year just ended, total confirmed orders in hand to be delivered in the financial year
2016 for this cluster were S$72.6m.
Directors’ Report 2015F
or p
erso
nal u
se o
nly
10Z i c o m G r o u p L i m i t e d
Construction Equipment
Revenue from sales and rental of construction equipment decreased by 3.04% in the current year as compared with
the previous year.
Demand for sales and rental of foundation equipment in Singapore and Malaysia remain healthy due to ongoing
construction activities in these markets. However, margins have decreased as there is a surplus of equipment
available in the market due to the slackened construction sector.
The weakening of the Australian dollar has dampened profit margin to some extent. Sales of concrete mixers in
Thailand have been steady and are expected to remain flat. Although government projects remain slow, demand
from the private sector, is however maintained. Demand for concrete mixers in Australia has increased and our
business in Australia is expected to improve.
As at the end of the financial year, total confirmed orders in hand to be delivered in the financial year 2016 for this
cluster were S$6.4m.
Precision Engineering & Technologies
Precision Engineering
The precision engineering sector experienced a significant increase in revenue of 96.23%. The sector secured
significant orders in automation projects from a consumer electronics customer that involved new processes. As
these projects involved new processes there is a development component in it which could benefit and enhance the
Group’s capability for future projects.
The new processes had required more engineering time and special materials not foreseen. As a result the increased
direct costs compounded by delays caused the Group to suffer significant cost overruns. This resulted in the projects
managing to achieve break-even only on its direct costs.
The major part of the revenue contribution in this sector is derived from our automation engineering and contract
manufacturing businesses as our new investments have only just started generating revenue and their contributions
are negligible.
Medtech Technology
The Group is focused to continue to grow its existing stable of medtech technology companies.
a) Biobot Surgical Pte Ltd (Biobot)
Our digital robotic platform for transperineal prostate biopsy has been accepted by several internationally
renowned key opinion leaders and hospitals. We are well positioned to commercialise this technology.
Apart from our Centers of Excellence in hospitals in New York, Tubingen, Germany and Singapore, we have
recently set up our first Australian Center of Excellence with the Epworth Hospital at Richmond Victoria. The
Epworth group is the largest private cluster in Victoria. We planned to set up 3 to 5 more Centers of Excellence
before December in Australia, the UK and Italy.
We have begun sales in Germany and our commercialisation efforts are expected to gain traction, as our
Centers of Excellence are fully activated acting as our local champions and training centers.
Directors’ Report 2015F
or p
erso
nal u
se o
nly
A N N U A L R E P O R T 2 0 1 5 11
b) Curiox Biosystems Pte Ltd (Curiox)
The Curiox’s DropArray technology which has proven to save the cost of development of drug assays by 60%
has been fully validated by the top 10 pharmaceutical companies.
However scalability of demand for our technology has proven more difficult with pharmaceutical companies.
The entire process of evaluation initiating from their research units which focus on high value assays with a
broad mix of protocols require a long gestation before our technology is adopted for high throughput usage
that generates volume.
With endorsement by the pharmaceutical companies we have redirected our immediate efforts to market our
technology to Contract Research Organisations (CRO). Although pricing to these CROs is lower, they consume
high volume of plates for their assays that involve lesser and standardised mix in protocols. Since then we
have successfully secured a 5 years’ contract from one of the top 5 global CROs in USA with the potential
of expanding into their international network. This success shows good promises for us to gain other CRO
accounts.
With the change in focus, we are confident that Curiox is likely to break-even within the next 6 months
and work towards profitability. We aim to re-engage with pharmaceutical companies to cater to their more
demanding and challenging higher value assays to achieve scalability in the value chain when these “low
hanging fruits” prove to be sustainable in generating revenue and a positive cash flow.
c) HistoIndex Pte Ltd (HistoIndex)
During the year the Group co-invested in a tissue imaging company, HistoIndex Pte Ltd, together with SPRING
Singapore, a Singapore government agency under an Accelerator Funding Scheme for which the Group
has been awarded. HistoIndex has commenced commercialisation to the research sector and is currently
collaborating with various world renowned institutions in PRC, Singapore and USA focused on refining their
analytic algorithms for liver fibrosis for which numerous scientific papers have been published. The business
is potentially geared towards the creation and operation of a web-based pathology platform to assist
pathologists in refining and staging liver fibrosis and cancer. We aim to achieve initial applications in this
domain within the next 12 months.
Semi-Conductor Equipment Investment
a) Orion Systems Integration Pte Ltd (Orion)
Orion’s fine pitch flip chip thermal bonder is used in downstream semi-conductor manufacturing. Due
to the dynamics of the industry, the chip industry has been undergoing very rapid changes with different
configurations by manufacturers to differentiate from each other causing varying demands on the
development of our machine to meet their needs during evaluation.
We have reached a stage where the various demands have been reduced to some common denominators
and we are in a position to offer a modular machine that can meet basic needs as well as to accommodate
customised needs of the key manufacturers.
We have during the last 6 months appointed an established distributor to handle our distribution for Asia
while our team focused on development and after sales service. We are hopeful to secure orders in the
coming financial year.
As at the end of the financial year, total confirmed orders in hand to be delivered in the financial year 2016 for this
cluster were S$6.3m.
Directors’ Report 2015F
or p
erso
nal u
se o
nly
12Z i c o m G r o u p L i m i t e d
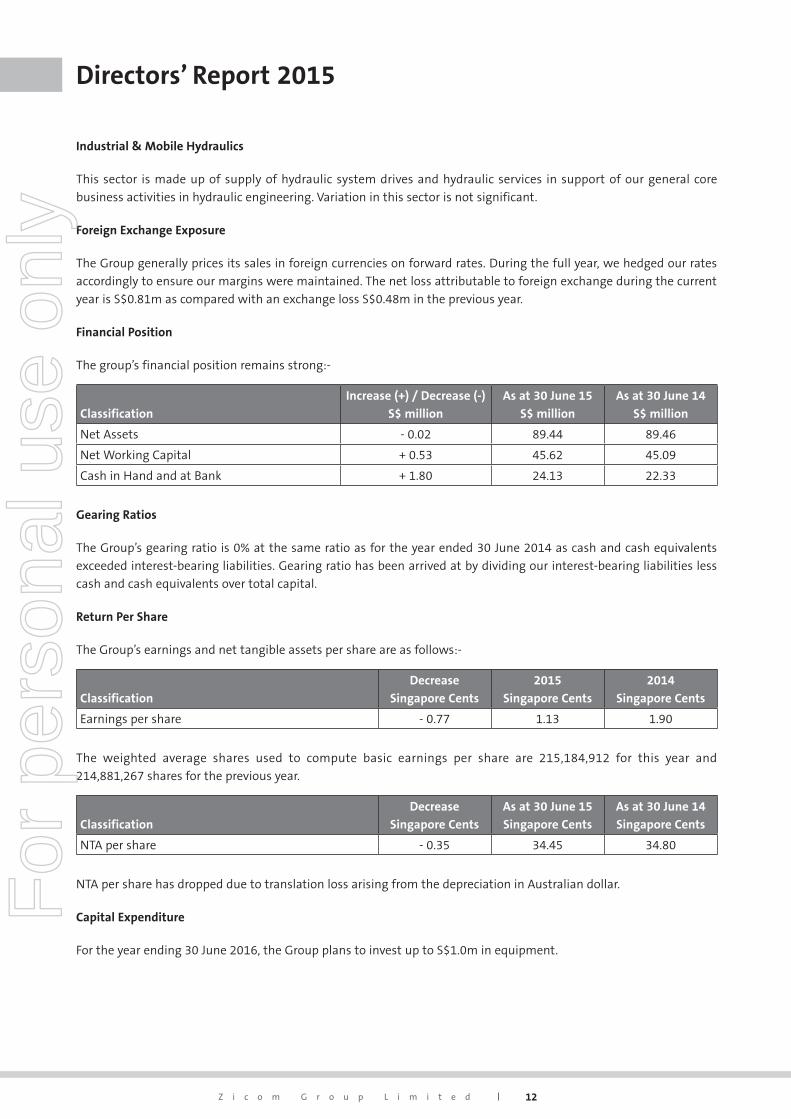
Industrial & Mobile Hydraulics
This sector is made up of supply of hydraulic system drives and hydraulic services in support of our general core
business activities in hydraulic engineering. Variation in this sector is not significant.
Foreign Exchange Exposure
The Group generally prices its sales in foreign currencies on forward rates. During the full year, we hedged our rates
accordingly to ensure our margins were maintained. The net loss attributable to foreign exchange during the current
year is S$0.81m as compared with an exchange loss S$0.48m in the previous year.
Financial Position
The group’s financial position remains strong:-
Classification
Increase (+) / Decrease (-)
S$ million
As at 30 June 15
S$ million
As at 30 June 14
S$ million
Net Assets - 0.02 89.44 89.46
Net Working Capital + 0.53 45.62 45.09
Cash in Hand and at Bank + 1.80 24.13 22.33
Gearing Ratios
The Group’s gearing ratio is 0% at the same ratio as for the year ended 30 June 2014 as cash and cash equivalents
exceeded interest-bearing liabilities. Gearing ratio has been arrived at by dividing our interest-bearing liabilities less
cash and cash equivalents over total capital.
Return Per Share
The Group’s earnings and net tangible assets per share are as follows:-
Classification
Decrease
Singapore Cents
2015
Singapore Cents
2014
Singapore Cents
Earnings per share - 0.77 1.13 1.90
The weighted average shares used to compute basic earnings per share are 215,184,912 for this year and
214,881,267 shares for the previous year.
Classification
Decrease
Singapore Cents
As at 30 June 15
Singapore Cents
As at 30 June 14
Singapore Cents
NTA per share - 0.35 34.45 34.80
NTA per share has dropped due to translation loss arising from the depreciation in Australian dollar.
Capital Expenditure
For the year ending 30 June 2016, the Group plans to invest up to S$1.0m in equipment.
Directors’ Report 2015F
or p
erso
nal u
se o
nly
A N N U A L R E P O R T 2 0 1 5 13
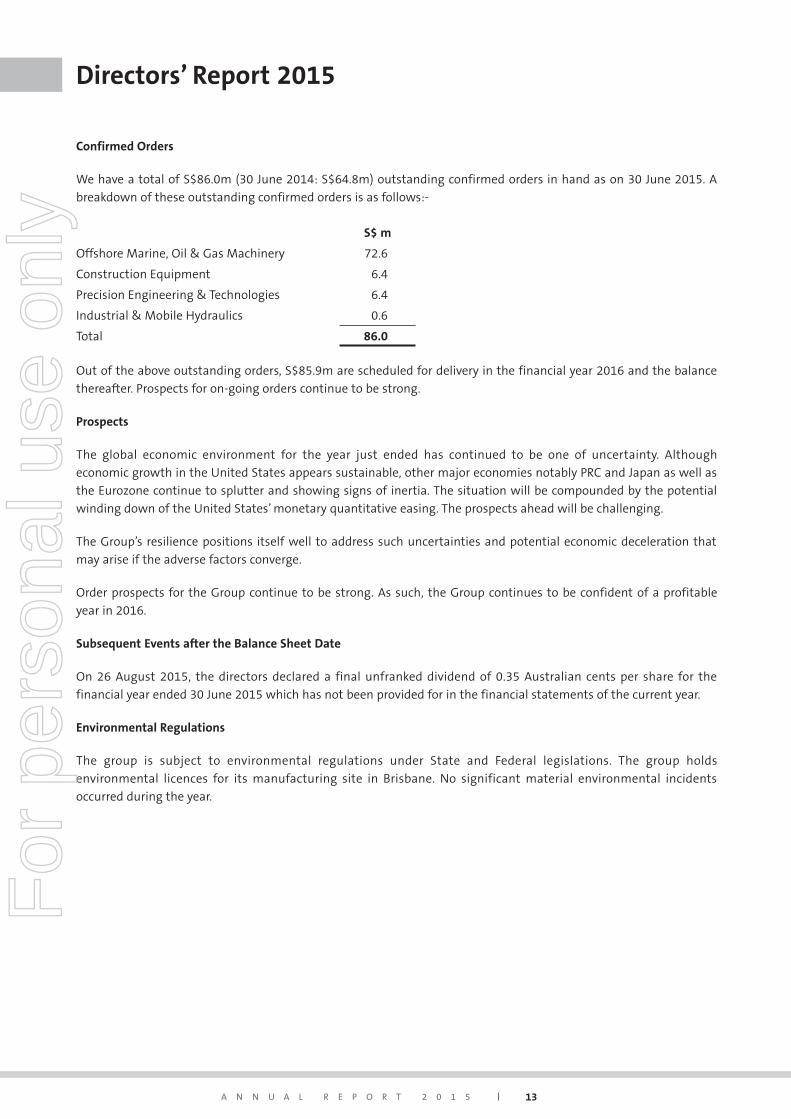
Confirmed Orders
We have a total of S$86.0m (30 June 2014: S$64.8m) outstanding confirmed orders in hand as on 30 June 2015. A
breakdown of these outstanding confirmed orders is as follows:-
S$ m
Offshore Marine, Oil & Gas Machinery 72.6
Construction Equipment 6.4
Precision Engineering & Technologies 6.4
Industrial & Mobile Hydraulics 0.6
Total 86.0
Out of the above outstanding orders, S$85.9m are scheduled for delivery in the financial year 2016 and the balance
thereafter. Prospects for on-going orders continue to be strong.
Prospects
The global economic environment for the year just ended has continued to be one of uncertainty. Although
economic growth in the United States appears sustainable, other major economies notably PRC and Japan as well as
the Eurozone continue to splutter and showing signs of inertia. The situation will be compounded by the potential
winding down of the United States’ monetary quantitative easing. The prospects ahead will be challenging.
The Group’s resilience positions itself well to address such uncertainties and potential economic deceleration that
may arise if the adverse factors converge.
Order prospects for the Group continue to be strong. As such, the Group continues to be confident of a profitable
year in 2016.
Subsequent Events after the Balance Sheet Date
On 26 August 2015, the directors declared a final unfranked dividend of 0.35 Australian cents per share for the
financial year ended 30 June 2015 which has not been provided for in the financial statements of the current year.
Environmental Regulations
The group is subject to environmental regulations under State and Federal legislations. The group holds
environmental licences for its manufacturing site in Brisbane. No significant material environmental incidents
occurred during the year.
Directors’ Report 2015F
or p
erso
nal u
se o
nly
14Z i c o m G r o u p L i m i t e d
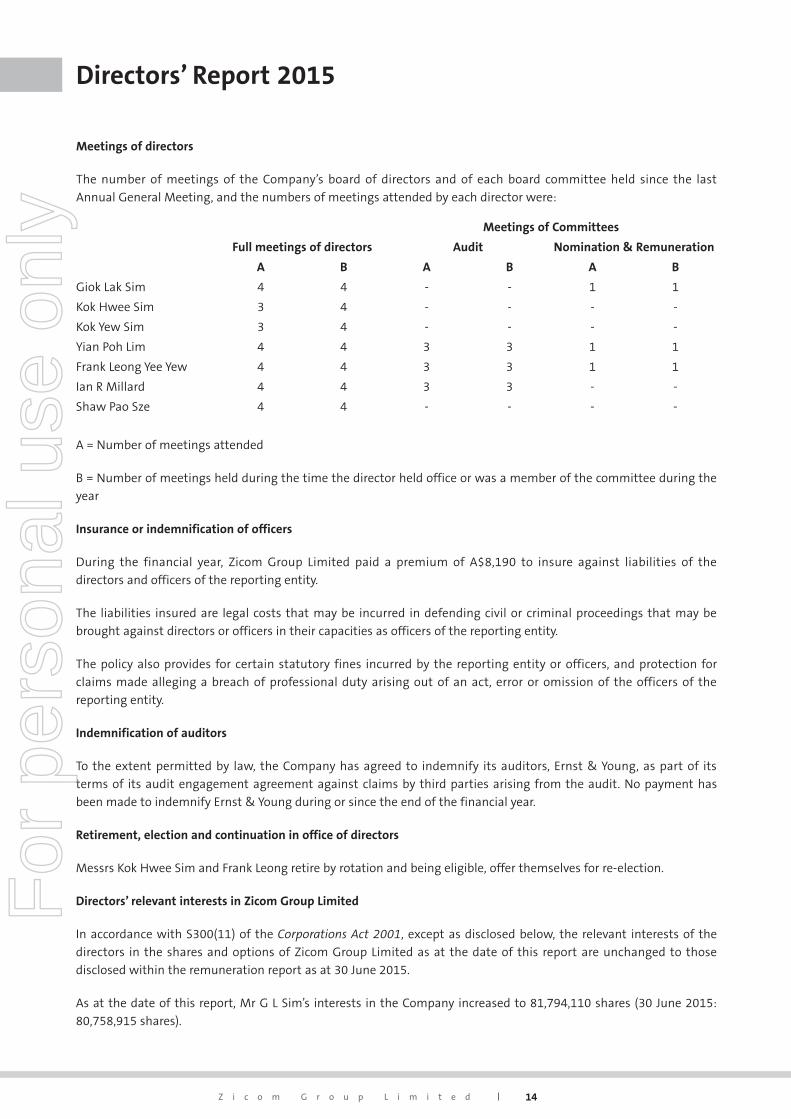
Meetings of directors
The number of meetings of the Company’s board of directors and of each board committee held since the last
Annual General Meeting, and the numbers of meetings attended by each director were:
Meetings of Committees
Full meetings of directors Audit Nomination & Remuneration
A B A B A B
Giok Lak Sim 4 4 - - 1 1
Kok Hwee Sim 3 4 - - - -
Kok Yew Sim 3 4 - - - -
Yian Poh Lim 4 4 3 3 1 1
Frank Leong Yee Yew 4 4 3 3 1 1
Ian R Millard 4 4 3 3 - -
Shaw Pao Sze 4 4 - - - -
A = Number of meetings attended
B = Number of meetings held during the time the director held office or was a member of the committee during the
year
Insurance or indemnification of officers
During the financial year, Zicom Group Limited paid a premium of A$8,190 to insure against liabilities of the
directors and officers of the reporting entity.
The liabilities insured are legal costs that may be incurred in defending civil or criminal proceedings that may be
brought against directors or officers in their capacities as officers of the reporting entity.
The policy also provides for certain statutory fines incurred by the reporting entity or officers, and protection for
claims made alleging a breach of professional duty arising out of an act, error or omission of the officers of the
reporting entity.
Indemnification of auditors
To the extent permitted by law, the Company has agreed to indemnify its auditors, Ernst & Young, as part of its
terms of its audit engagement agreement against claims by third parties arising from the audit. No payment has
been made to indemnify Ernst & Young during or since the end of the financial year.
Retirement, election and continuation in office of directors
Messrs Kok Hwee Sim and Frank Leong retire by rotation and being eligible, offer themselves for re-election.
Directors’ relevant interests in Zicom Group Limited
In accordance with S300(11) of the Corporations Act 2001, except as disclosed below, the relevant interests of the
directors in the shares and options of Zicom Group Limited as at the date of this report are unchanged to those
disclosed within the remuneration report as at 30 June 2015.
As at the date of this report, Mr G L Sim’s interests in the Company increased to 81,794,110 shares (30 June 2015:
80,758,915 shares).
Directors’ Report 2015F
or p
erso
nal u
se o
nly
A N N U A L R E P O R T 2 0 1 5 15
Remuneration report (Audited)
This remuneration report outlines the remuneration arrangements of the Group in accordance with the
requirements of the Corporations Act 2001 and its Regulations. This information has been audited as required by
section 308(3C) of the Act.
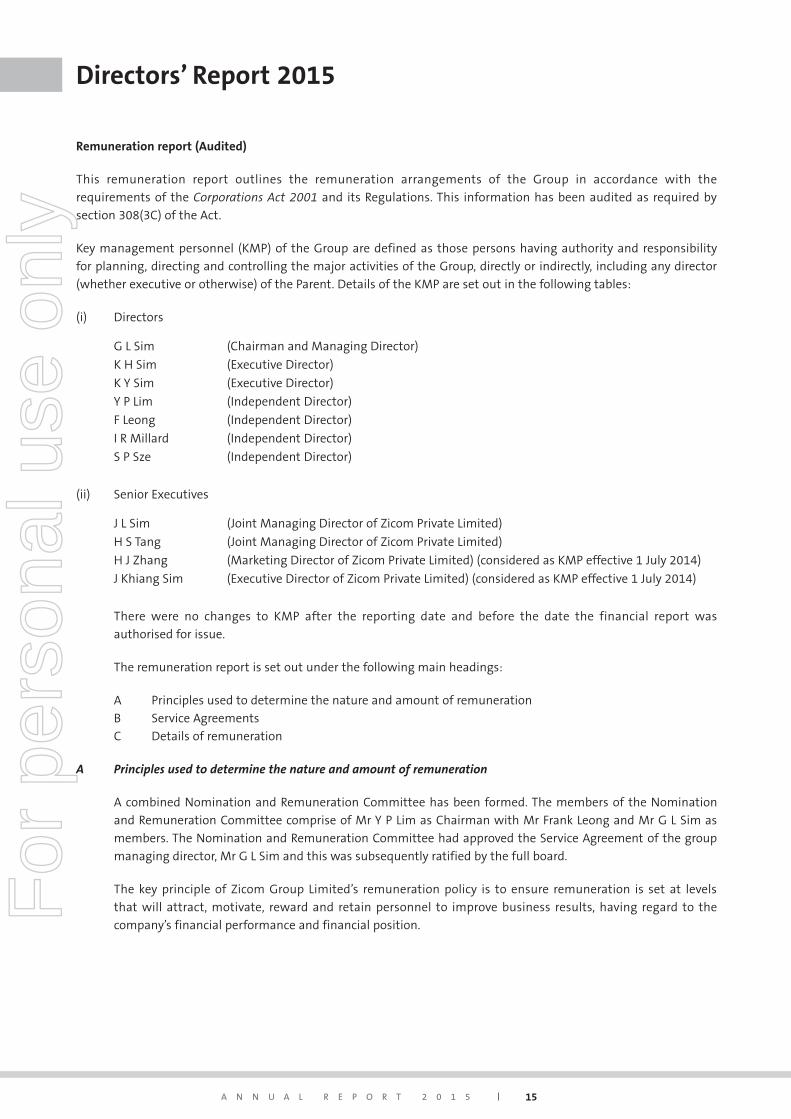
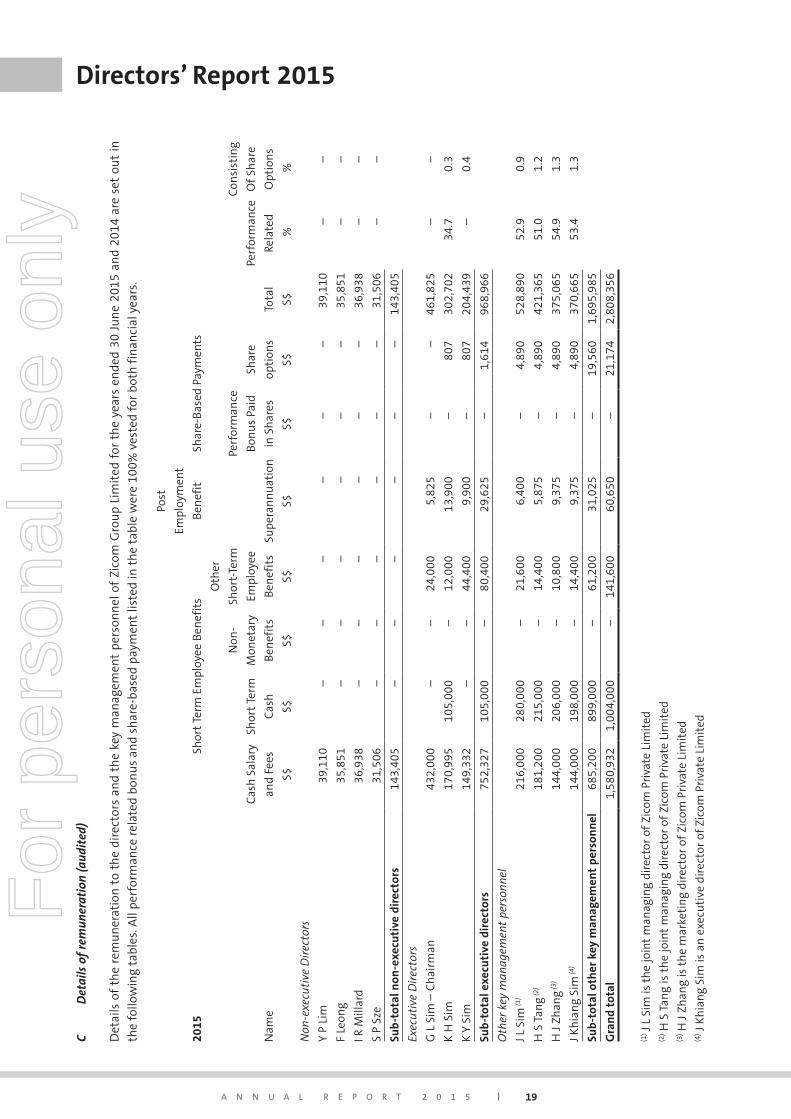
Key management personnel (KMP) of the Group are defined as those persons having authority and responsibility
for planning, directing and controlling the major activities of the Group, directly or indirectly, including any director
(whether executive or otherwise) of the Parent. Details of the KMP are set out in the following tables:
(i) Directors
G L Sim (Chairman and Managing Director)
K H Sim (Executive Director)
K Y Sim (Executive Director)
Y P Lim (Independent Director)
F Leong (Independent Director)
I R Millard (Independent Director)
S P Sze (Independent Director)
(ii) Senior Executives
J L Sim (Joint Managing Director of Zicom Private Limited)
H S Tang (Joint Managing Director of Zicom Private Limited)
H J Zhang (Marketing Director of Zicom Private Limited) (considered as KMP effective 1 July 2014)
J Khiang Sim (Executive Director of Zicom Private Limited) (considered as KMP effective 1 July 2014)
There were no changes to KMP after the reporting date and before the date the financial report was
authorised for issue.
The remuneration report is set out under the following main headings:
A Principles used to determine the nature and amount of remuneration
B Service Agreements
C Details of remuneration
A Principlesusedtodeterminethenatureandamountofremuneration
A combined Nomination and Remuneration Committee has been formed. The members of the Nomination
and Remuneration Committee comprise of Mr Y P Lim as Chairman with Mr Frank Leong and Mr G L Sim as
members. The Nomination and Remuneration Committee had approved the Service Agreement of the group
managing director, Mr G L Sim and this was subsequently ratified by the full board.
The key principle of Zicom Group Limited’s remuneration policy is to ensure remuneration is set at levels
that will attract, motivate, reward and retain personnel to improve business results, having regard to the
company’s financial performance and financial position.
Directors’ Report 2015F
or p
erso
nal u
se o
nly
16Z i c o m G r o u p L i m i t e d
Non-executive directors
Remuneration of non-executive directors is determined by the directors within the maximum amount
approved by the shareholders. Each non-executive director receives a base fee of A$25,000 for being a director
of the Group. An additional fee of A$2,000 is paid for each Board Committee of which a non-executive
director sits and A$5,000 if the director is a Chair of a Board Committee. The payment of additional fees for
serving on committees recognises the additional time commitment and responsibilities of the non-executive
directors who serve on one or more sub committees. There is also an attendance fee of A$1,000 for each
meeting attended by the non-executive director.
Non-executive directors are eligible to participate in the Zicom Employee Share and Option Plan (“ZESOP”).
The Board considers that there should be an appropriate mix of remuneration comprising cash and securities
for all directors to link the remuneration of the directors to the financial performance of the Company and
to align the interests of shareholders and all directors. No options were granted to non-executive directors
during the financial year and none are proposed for consideration at the 2015 Annual General Meeting.
The board recommends that total directors’ fees for non-executive directors for the financial year ending
30 June 2016 be fixed at a maximum sum of A$150,000 (S$153,000) at the same level as the previous year.
Executive directors and senior executives
All remuneration paid to executive directors and senior executives comprises of the following components:
l Base pay and benefits;
l Short term incentives;
l Other remuneration such as superannuation,
l Participation in the Zicom Employee Share and Option Plan.
Base pay
The level of base pay is set so as to provide a level of remuneration which is appropriate to the position and is
competitive in the market. The remuneration of the executive directors is reviewed annually by the board and
the remuneration of senior executives is reviewed annually or on promotion by the managing director(s).
Benefits
Senior executives receive benefits including health and disability insurance and car allowances.
Short term incentives
The objective of short term incentives is to reward the senior executives of the group with performance bonus
tied to a minimum profit threshold of the group companies. Such bonuses are paid within 90 days after the
year end and completion of audit. The minimum profit threshold is the lower of S$500,000 or 15% of total
shareholder funds as at the reporting date.
Directors’ Report 2015F
or p
erso
nal u
se o
nly
A N N U A L R E P O R T 2 0 1 5 17
B ServiceAgreements
Group Managing Director
The group managing director, Mr G L Sim is directly employed by Zicom Holdings Private Limited (“ZHPL”)
and has renewed his service agreement with ZHPL for another 5 years with effect from 1 July 2011. The
group and Mr Sim are required to give each other at least 6 months’ notice in the termination of the service
agreement. Under the terms of his service agreement, Mr Sim continues to be appointed as the Zicom Group
Limited (“ZGL”) Group Managing Director and Chairman as well as the Executive Chairman of all the operating
subsidiaries.
Mr Sim is entitled to an annual review of his monthly salary if the company’s results exceed 15% return
on shareholders’ funds. Mr Sim has frozen his monthly salary since 2007. Mr Sim will continue to draw the
monthly salary at the 2007 level for the next 5 years from 1 July 2011 and waive all salary increments. Apart
from this, all other benefits, terms and conditions in his service agreement remain unchanged.
Mr Sim is paid a monthly salary and a car allowance. Mr Sim is entitled to a performance bonus not exceeding
5% of the pre-tax consolidated profits of ZHPL upon achieving agreed minimum profit targets, being the only
criterion for his entitlement. Mr Sim is entitled to convert part of his performance bonus up to no more than
50% of the amount payable into shares of ZGL at the average of the closing prices of the last 5 trading days
before the end of the relevant financial year. However, such entitlement must be exercised within 7 working
days after the financial year end. For the financial year just ended, Mr Sim was not entitled to any bonus as
the minimum profit target was not achieved.
Mr Sim is not paid any salary or fees by ZGL, Cesco Australia Limited (“CAL”) or any other group companies. In
the event CAL achieves the minimum pre-tax profits, Mr Sim will be paid a bonus not exceeding 5% of CAL’s
profits. During the financial year just ended, Mr Sim was not paid any bonus by CAL as the profit target was
not achieved.
Senior Executives (directors of group companies)
Senior executives in key decision making are employed under rolling contracts. The company and these
senior executives are required to give each other 6 months’ notice to terminate the service contracts. The
senior executives are entitled to a monthly salary and a car allowance. Each year, each of the subsidiary
companies, allocates 10% of their pre-tax profits upon achieving agreed minimum profit targets, being the
only criterion for allocation of bonus to its eligible executives, as a “bonus pool”. The maximum entitlement
capped for eligible executives ranges from 2.5% to 5% of the pre-tax profits. Each year, the Nomination and
Remuneration Committee will decide the proportion payable to each of these eligible executives based on
the number of eligible executives entitled to the pool and any recommendation by management to reward
any outstanding senior executives who are otherwise not eligible contractually, to be specially rewarded.
The decisions made by the Committee are deemed to be 100% of their entitlement for the respective eligible
executive for the relevant financial year.
These senior executives are also entitled to convert part of their performance bonus, up to no more than 50%
of the amount payable, into shares in ZGL at the average of the closing prices of the last 5 trading days before
the end of the relevant financial year. However, such entitlement must be exercised within 7 working days
after the financial year end. For the financial year just ended, none of the executives exercised the option to
convert part of their performance bonus into ZGL shares.
Directors’ Report 2015F
or p
erso
nal u
se o
nly
18Z i c o m G r o u p L i m i t e d
Zicom Employee Share and Option Plan
Options are granted under the Zicom Employee Share and Option Plan (“ZESOP”) which was approved by
shareholders on 23 November 2006.
A person is eligible to participate in ZESOP if he or she is a director or an employee of a group company.
Approved share options are first allocated to each group company based on its profit contribution to
the Group for the past 3 years adjusted by factors such as potential contribution to the Group and past
conversion rates. These options are then granted to employees based on individual performance and those
with potentials in that group company. This initiative strengthens the Group’s position to retain and attract
talent so as to expand and grow to improve the Group’s performance and enhance shareholders’ value.
The board may at any time make invitations to eligible employees to participate in the ZESOP. The invitation
will specify the total number of options each eligible employee may acquire, the exercise price, period and
exercise conditions. All options shall lapse upon the expiry of the exercise period as determined by the board
or 10 years after grant of the option whichever is earlier.
If an eligible participant ceases to be employed by any member of the group his or her options shall lapse.
In the event an eligible participant, who, by reason of death, or physical or mental incapacity or such other
reasons as the Board may approve, ceases to be an eligible participant before the participant has exercised all
vested options under ZESOP, then those options shall continue to be capable of being exercised in accordance
with the rules.
Options granted under ZESOP carry no voting rights or entitlement to dividends.
Options are granted at no cost to employees. When exercised, each option is convertible into one ordinary
share which shall be credited as fully paid up and rank equally with all other fully paid ordinary shares.
During the current financial year, 2,150,000 share options (2014: nil) were granted. In the same period,
employees exercised options to acquire 555,000 (2014: 195,000) fully paid ordinary shares in Zicom Group
Limited at a weighted average exercise price of A$0.17 per share. 240,000 (2014: 275,000) share options
expired during the financial year.
As at the date of this report, there were 5,660,000 unissued ordinary shares under options (7,440,000 at the
reporting date).
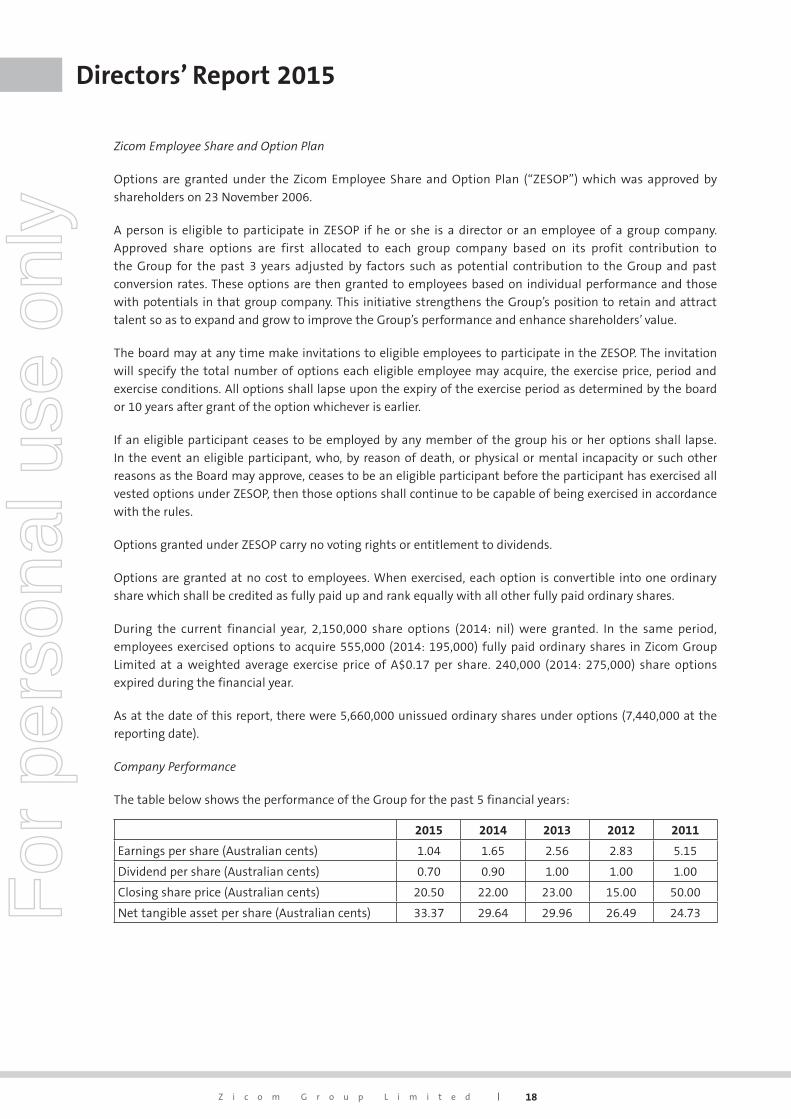
Company Performance
The table below shows the performance of the Group for the past 5 financial years:
2015 2014 2013 2012 2011
Earnings per share (Australian cents) 1.04 1.65 2.56 2.83 5.15
Dividend per share (Australian cents) 0.70 0.90 1.00 1.00 1.00
Closing share price (Australian cents) 20.50 22.00 23.00 15.00 50.00
Net tangible asset per share (Australian cents) 33.37 29.64 29.96 26.49 24.73
Directors’ Report 2015F
or p
erso
nal u
se o
nly
A N N U A L R E P O R T 2 0 1 5 19
CD
etai
lso
fre
mun
erat
ion
(aud
ited
)
Det
ails
of
the
rem
un
erat
ion
to
the
dire
ctor
s an
d th
e ke
y m
anag
emen
t pe
rson
nel
of
Zico
m G
rou
p Li
mit
ed f
or t
he
year
s en
ded
30 J
un
e 20
15 a
nd
2014
are
set
ou
t in
the
follo
win
g ta
bles
. All
perf
orm
ance
rel
ated
bon
us
and
shar
e-ba
sed
paym
ent
liste
d in
th
e ta
ble
wer
e 10
0% v
este
d fo
r bo
th f
inan
cial
yea
rs.
2015
Shor
t Te
rm E
mpl
oyee
Ben
efit
s
Post
Empl
oym
ent
Ben
efit
Shar
e-Ba
sed
Paym
ents
Nam
e
Cas
h S
alar
y
and
Fees
Shor
t Te
rm
Cas
h
Non
-
Mon
etar
y
Ben
efit
s
Oth
er
Shor
t-Te
rm
Empl
oyee
Ben
efit
sSu
pera
nn
uat
ion
Perf
orm
ance
Bon
us
Paid
in S
har
es
Shar
e
opti
ons
Tota
l
Perf
orm
ance
Rela
ted
Con
sist
ing
Of
Shar
e
Opt
ion
s
S$S$
S$S$
S$S$
S$S$
% %
Non
-exe
cuti
ve D
irec
tors
Y P
Lim
39,1
10–
––
––
–39
,110
––
F Le
ong
35,8
51–
––
––
–35
,851
––
I R M
illar
d36
,938
––
––
––
36,9
38–
–
S P
Sze
31
,506
––
––
––
31,5
06–
–
Sub
-tot
al n
on-e
xecu
tive
dir
ecto
rs14
3,40
5–
––
––
–14
3,40
5
Exec
utiv
e D
irec
tors
G L
Sim
– C
hai
rman
432,
000
––
24,0
005,
825
––
461,
825
––
K H
Sim
17
0,99
510
5,00
0–
12,0
0013
,900
–80
730
2,70
234
.70.
3
K Y
Sim
14
9,33
2–
–44
,400
9,90
0–
807
204,
439
–0.
4
Sub
-tot
al e
xecu
tive
dir
ecto
rs75
2,32
710
5,00
0–
80,4
0029
,625
–1,
614
968,
966
Oth
er k
ey m
anag
emen
t pe
rson
nel
J L S
im (1
)21
6,00
028
0,00
0–
21,6
006,
400
–4,
890
528,
890
52.9
0.9
H S
Tan
g (2)
181,
200
215,
000
–14
,400
5,87
5–
4,89
042
1,36
551
.01.
2
H J
Zhan
g (3)
144,
000
206,
000
–10
,800
9,37
5–
4,89
037
5,06
554
.91.
3
J Kh
ian
g Si
m (4
)14
4,00
019
8,00
0–
14,4
009,
375
–4,
890
370,
665
53.4
1.3
Sub
-tot
al o
ther
key
man
agem
ent
pers
onn
el68
5,20
089
9,00
0–
61,2
0031
,025
–19
,560
1,69
5,98
5
Gra
nd
tota
l1,
580,
932
1,00
4,00
0–
141,
600
60,6
50–
21,1
742,
808,
356
(1) J
L Si
m is
th
e jo
int
man
agin
g di
rect
or o
f Zi
com
Pri
vate
Lim
ited
(2
) H S
Tan
g is
th
e jo
int
man
agin
g di
rect
or o
f Zi
com
Pri
vate
Lim
ited
(3
) H J
Zhan
g is
th
e m
arke
tin
g di
rect
or o
f Zi
com
Pri
vate
Lim
ited
(4) J
Kh
ian
g Si
m is
an
exe
cuti
ve d
irec
tor
of Z
icom
Pri
vate
Lim
ited
Directors’ Report 2015F
or p
erso
nal u
se o
nly
20Z i c o m G r o u p L i m i t e d
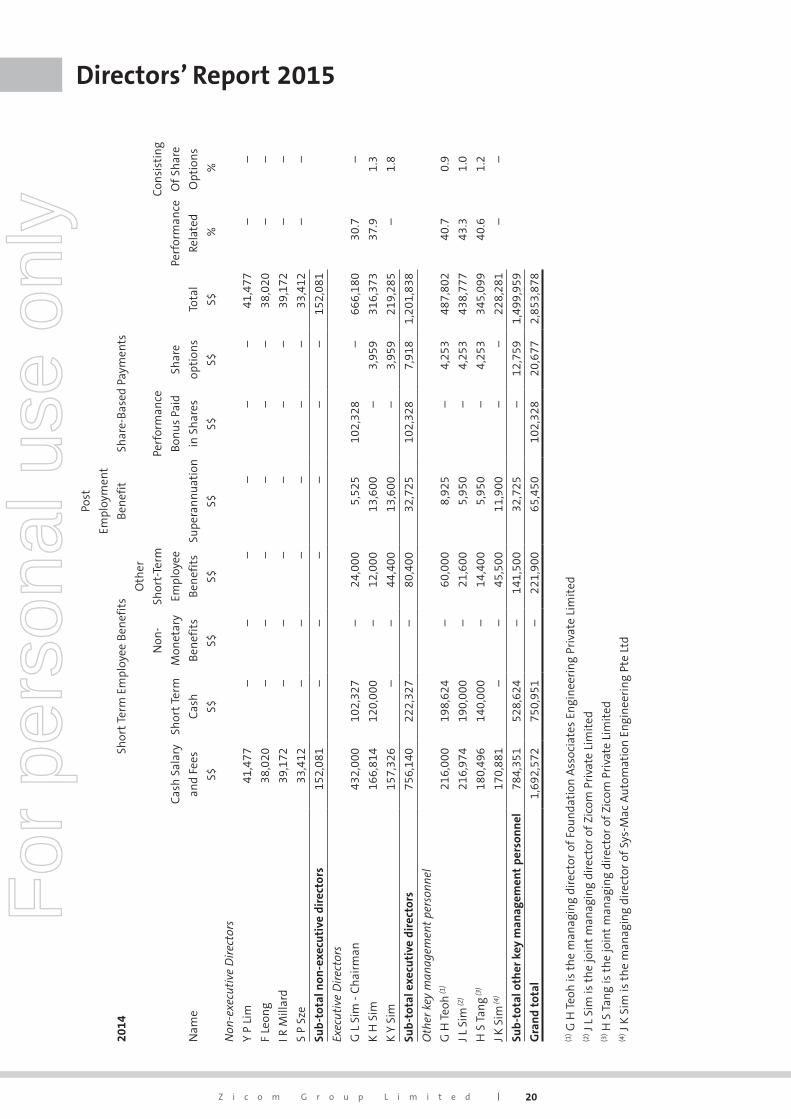
2014
Shor
t Te
rm E
mpl
oyee
Ben
efit
s
Post
Empl
oym
ent
Ben
efit
Shar
e-Ba
sed
Paym
ents
Nam
e
Cas
h S
alar
y
and
Fees
Shor
t Te
rm
Cas
h
Non
-
Mon
etar
y
Ben
efit
s
Oth
er
Shor
t-Te
rm
Empl
oyee
Ben
efit
sSu
pera
nn
uat
ion
Perf
orm
ance
Bon
us
Paid
in S
har
es
Shar
e
opti
ons
Tota
l
Perf
orm
ance
Rela
ted
Con
sist
ing
Of
Shar
e
Opt
ion
s
S$S$
S$S$
S$S$
S$S$
% %
Non
-exe
cuti
ve D
irec
tors
Y P
Lim
41,4
77–
––
––
–41
,477
––
F Le
ong
38,0
20–
––
––
–38
,020
––
I R M
illar
d39
,172
––
––
––
39,1
72–
–
S P
Sze
33,4
12–
––
––
–33
,412
––
Sub
-tot
al n
on-e
xecu
tive
dir
ecto
rs15
2,08
1–
––
––
–15
2,08
1
Exec
utiv
e D
irec
tors
G L
Sim
- C
hai
rman
432,
000
102,
327
–24
,000
5,52
510
2,32
8–
666,
180
30.7
–
K H
Sim
16
6,81
412
0,00
0–
12,0
0013
,600
–3,
959
316,
373
37.9
1.3
K Y
Sim
15
7,32
6–
–44
,400
13,6
00–
3,95
921
9,28
5–
1.8
Sub
-tot
al e
xecu
tive
dir
ecto
rs75
6,14
022
2,32
7–
80,4
0032
,725
102,
328
7,91
81,
201,
838
Oth
er k
ey m
anag
emen
t pe
rson
nel
G H
Teo
h (1
)21
6,00
019
8,62
4–
60,0
008,
925
–4,
253
487,
802
40.7
0.9
J L S
im (2
)21
6,97
419
0,00
0–
21,6
005,
950
–4,
253
438,
777
43.3
1.0
H S
Tan
g (3)
180,
496
140,
000
–14
,400
5,95
0–
4,25
334
5,09
940
.61.
2
J K S
im (4
)17
0,88
1–
–45
,500
11,9
00–
–22
8,28
1–
–
Sub
-tot
al o
ther
key
man
agem
ent
pers
onn
el78
4,35
152
8,62
4–
141,
500
32,7
25–
12,7
591,
499,
959
Gra
nd
tota
l1,
692,
572
750,
951
–22
1,90
065
,450
102,
328
20,6
772,
853,
878
(1) G
H T
eoh
is t
he
man
agin
g di
rect
or o
f Fo
un
dati
on A
ssoc
iate
s En
gin
eeri
ng
Priv
ate
Lim
ited
(2) J
L Si
m is
th
e jo
int
man
agin
g di
rect
or o
f Zi
com
Pri
vate
Lim
ited
(3) H
S T
ang
is t
he
join
t m
anag
ing
dire
ctor
of
Zico
m P
riva
te L
imit
ed(4
) J K
Sim
is t
he
man
agin
g di
rect
or o
f Sy
s-M
ac A
uto
mat
ion
En
gin
eeri
ng
Pte
Ltd
Directors’ Report 2015F
or p
erso
nal u
se o
nly
A N N U A L R E P O R T 2 0 1 5 21
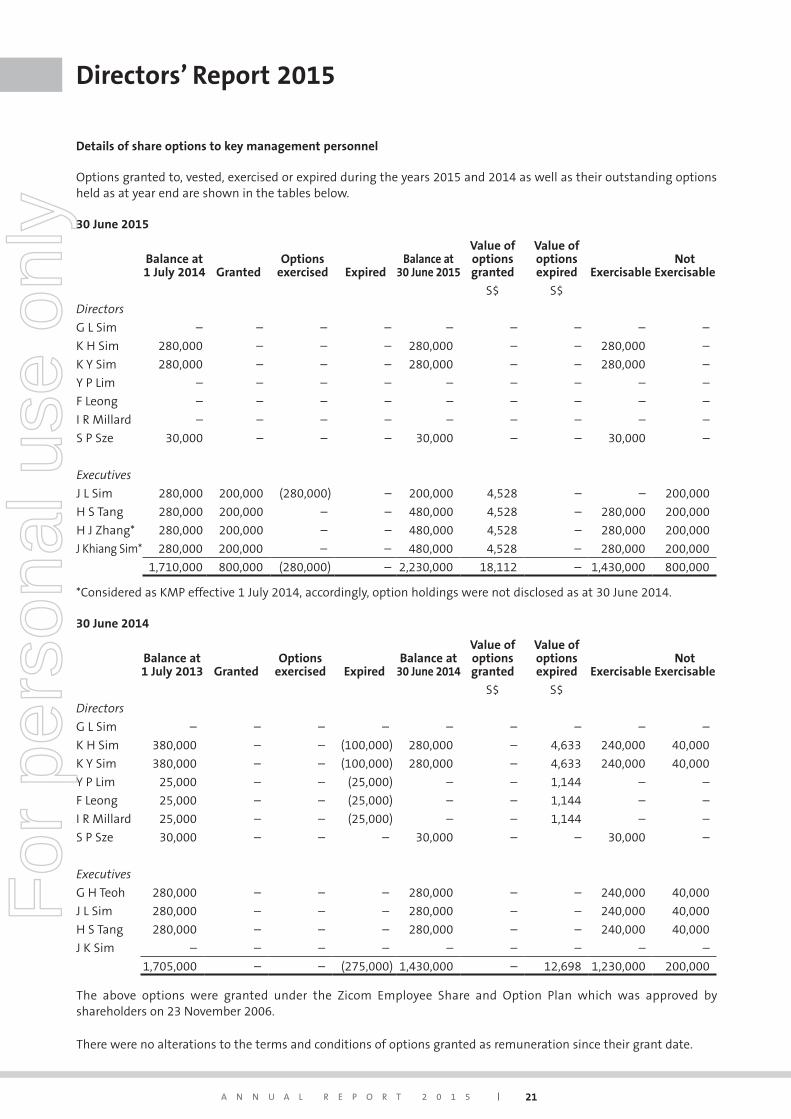
Details of share options to key management personnel
Options granted to, vested, exercised or expired during the years 2015 and 2014 as well as their outstanding options held as at year end are shown in the tables below.
30 June 2015
Balance at 1 July 2014 Granted
Options exercised Expired
Balance at30 June 2015
Value of options granted
Value of options expired Exercisable
Not Exercisable
S$ S$
Directors
G L Sim – – – – – – – – –
K H Sim 280,000 – – – 280,000 – – 280,000 –
K Y Sim 280,000 – – – 280,000 – – 280,000 –
Y P Lim – – – – – – – – –
F Leong – – – – – – – – –
I R Millard – – – – – – – – –
S P Sze 30,000 – – – 30,000 – – 30,000 –
Executives
J L Sim 280,000 200,000 (280,000) – 200,000 4,528 – – 200,000
H S Tang 280,000 200,000 – – 480,000 4,528 – 280,000 200,000
H J Zhang* 280,000 200,000 – – 480,000 4,528 – 280,000 200,000
J Khiang Sim* 280,000 200,000 – – 480,000 4,528 – 280,000 200,000
1,710,000 800,000 (280,000) – 2,230,000 18,112 – 1,430,000 800,000
*Considered as KMP effective 1 July 2014, accordingly, option holdings were not disclosed as at 30 June 2014.
30 June 2014
Balance at 1 July 2013 Granted
Options exercised Expired
Balance at30 June 2014
Value of options granted
Value of options expired Exercisable
Not Exercisable
S$ S$
Directors
G L Sim – – – – – – – – –
K H Sim 380,000 – – (100,000) 280,000 – 4,633 240,000 40,000
K Y Sim 380,000 – – (100,000) 280,000 – 4,633 240,000 40,000
Y P Lim 25,000 – – (25,000) – – 1,144 – –
F Leong 25,000 – – (25,000) – – 1,144 – –
I R Millard 25,000 – – (25,000) – – 1,144 – –
S P Sze 30,000 – – – 30,000 – – 30,000 –
Executives
G H Teoh 280,000 – – – 280,000 – – 240,000 40,000
J L Sim 280,000 – – – 280,000 – – 240,000 40,000
H S Tang 280,000 – – – 280,000 – – 240,000 40,000
J K Sim – – – – – – – – –
1,705,000 – – (275,000) 1,430,000 – 12,698 1,230,000 200,000
The above options were granted under the Zicom Employee Share and Option Plan which was approved by shareholders on 23 November 2006.
There were no alterations to the terms and conditions of options granted as remuneration since their grant date.
Directors’ Report 2015F
or p
erso
nal u
se o
nly
22Z i c o m G r o u p L i m i t e d
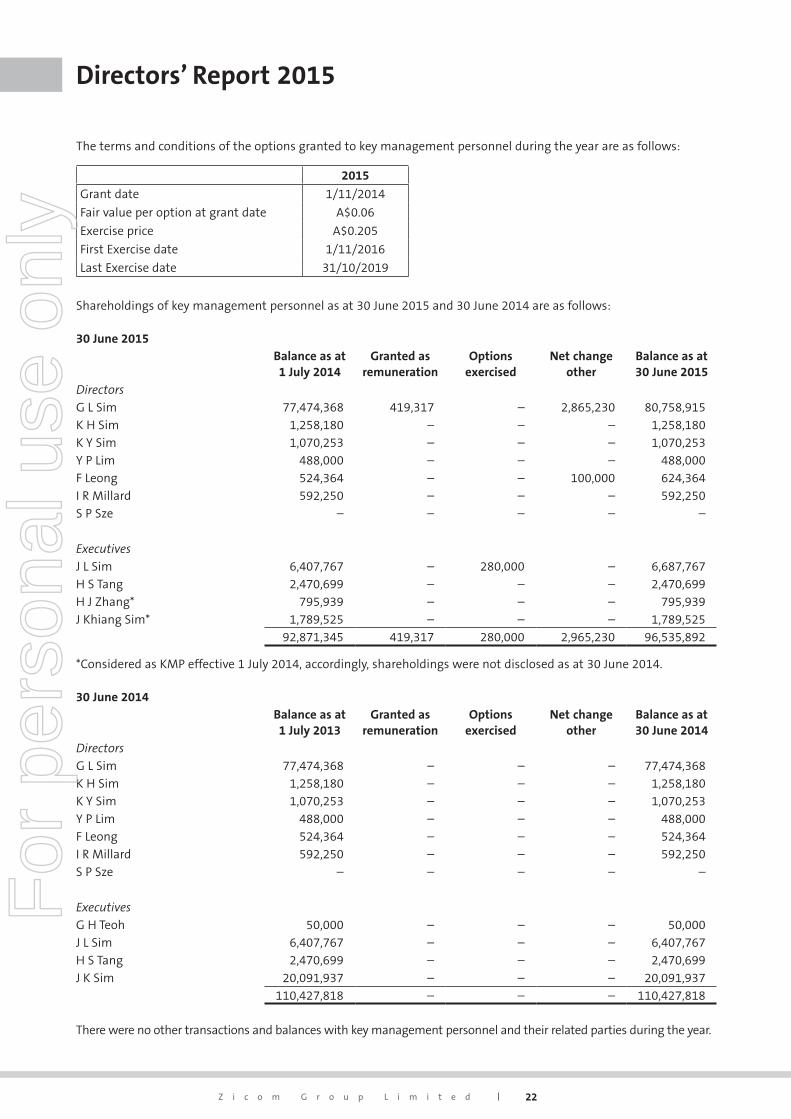
The terms and conditions of the options granted to key management personnel during the year are as follows:
2015
Grant date 1/11/2014
Fair value per option at grant date A$0.06
Exercise price A$0.205
First Exercise date 1/11/2016
Last Exercise date 31/10/2019
Shareholdings of key management personnel as at 30 June 2015 and 30 June 2014 are as follows:
30 June 2015Balance as at 1 July 2014
Granted as remuneration
Options exercised
Net changeother
Balance as at 30 June 2015
DirectorsG L Sim 77,474,368 419,317 – 2,865,230 80,758,915K H Sim 1,258,180 – – – 1,258,180K Y Sim 1,070,253 – – – 1,070,253Y P Lim 488,000 – – – 488,000F Leong 524,364 – – 100,000 624,364I R Millard 592,250 – – – 592,250S P Sze – – – – –
ExecutivesJ L Sim 6,407,767 – 280,000 – 6,687,767H S Tang 2,470,699 – – – 2,470,699H J Zhang* 795,939 – – – 795,939J Khiang Sim* 1,789,525 – – – 1,789,525
92,871,345 419,317 280,000 2,965,230 96,535,892
*Considered as KMP effective 1 July 2014, accordingly, shareholdings were not disclosed as at 30 June 2014.
30 June 2014Balance as at 1 July 2013
Granted as remuneration
Options exercised
Net changeother
Balance as at 30 June 2014
DirectorsG L Sim 77,474,368 – – – 77,474,368K H Sim 1,258,180 – – – 1,258,180K Y Sim 1,070,253 – – – 1,070,253Y P Lim 488,000 – – – 488,000F Leong 524,364 – – – 524,364I R Millard 592,250 – – – 592,250S P Sze – – – – –
ExecutivesG H Teoh 50,000 – – – 50,000J L Sim 6,407,767 – – – 6,407,767H S Tang 2,470,699 – – – 2,470,699J K Sim 20,091,937 – – – 20,091,937
110,427,818 – – – 110,427,818
There were no other transactions and balances with key management personnel and their related parties during the year.
Directors’ Report 2015F
or p
erso
nal u
se o
nly
A N N U A L R E P O R T 2 0 1 5 23
Legal Proceedings
No person has applied for leave of Court to bring proceedings on behalf of the consolidated entity or to intervene in
any proceedings to which the consolidated entity is a party for the purpose of taking responsibility on behalf of the
consolidated entity for all or any part of those proceedings.
Auditor’s Independence Declaration
A copy of the auditor’s signed independence declaration as required under Section 307C of the Corporations Act 2001
is attached to this report.
Non-Audit Services
There were no non-audit services provided by the entity’s auditor and related practices of the entity auditor, Ernst &
Young, during the year.
Rounding of Amounts
The Company is an entity to which the Class Order 98/100 applies and accordingly, amounts in the financial
statements and directors’ report have been rounded to the nearest S$1,000 unless otherwise stated.
This report was made in accordance with a resolution of the board of directors.
GL Sim
Chairman/Managing Director
29 September 2015
Directors’ Report 2015F
or p
erso
nal u
se o
nly
24Z i c o m G r o u p L i m i t e d
In relation to our audit of the financial report of Zicom Group Limited for the financial year ended 30 June 2015, to
the best of my knowledge and belief, there have been no contraventions of the auditor independence requirements
of the Corporations Act 2001 or any applicable code of professional conduct.
Ernst & Young
Ric Roach
Partner
29 September 2015
Auditor’s Independence Declaration to the Directors of Zicom Group Limited
For
per
sona
l use
onl
y
A N N U A L R E P O R T 2 0 1 5 25
Introduction
The Board of Directors is responsible for the Corporate Governance of Zicom Group Limited and its controlled
entities (referred to in this document as “the Company”). The Directors are focused on fulfilling their responsibilities
individually and as a Board to all of the Company’s stakeholders. This involves recognition of and a need to adopt
principles of good corporate governance having regard to the ASX Corporate Governance Council (CGC) published
guidelines as well as its corporate governance principles and recommendations.
The Company has reviewed its Corporate Governance procedures over the past year to ensure compliance with the
principles of good corporate governance.
A description of the Company’s practices in complying with the principles is set out below.
Principle 1: Laying Solid Foundations for Management and Oversight
Role of Board and management
The role of the Board is to lead and oversee the management and direction of the Company and its controlled
entities.
After appropriate consultation with executive management the Board:
- defines and sets the business and strategic objectives. It monitors performance and achievement of
these Company’s objectives;
- oversees the reporting on matters of compliance with corporate policies and laws, takes responsibility
for risk management processes and reviews executive management of the Company;
- monitors and approves business plans, financial performance and budgets, available resources, major
capital expenditure, capital raising, acquisition and divestment of Company’s assets;
- maintains liaison with the Company’s auditor; and
- reports to Shareholders.
Candidates for election or re-election as a Director
The Company is guided by the Board for the selection, nomination and appointment of Directors. As part of this
process the Board ascertain the qualifications and experience that a potential candidate possesses. Background
checks, as appropriate, are carried out before a person is appointed by the Board. In addition, the Board will continue
to provide Shareholders with all material information in its possession relevant to any decision to elect or re-elect a
Director by inclusion in the Notice of Meeting.
Written agreements with Directors
The Executive Chairman, Executive Directors and Senior Executives have letters of appointments or service contracts
describing their terms of office, duties, rights and responsibilities.
The other Directors do not have contracts with the Company that give them any form of certain tenure. One third of
the Directors retire annually and are free to seek re-election by Shareholders.
Company Secretaries
The Joint Company Secretaries are directly accountable to the Board through the Chairman.
Corporate Governance StatementF
or p
erso
nal u
se o
nly
26Z i c o m G r o u p L i m i t e d
Diversity Policy
The Company does not have a written diversity policy but recognises the importance of benefitting from all available
talent regardless of gender, age, ethnicity and cultural background. The Company promotes an environment
conducive to the appointment of well qualified employees, senior management and board candidates so that there
is appropriate diversity to maximise the achievement of corporate goals.
The Company has employees including executives from diversified cultural background and nationalities such
as Australians, Bangladeshis, Chinese, Indians, Indonesians, Filipinos, Malaysians, Burmese, New Zealanders,
Singaporeans and Thais. In addition, approximately 20% of the Company’s workforce is made up of female
employees.
Performance Review
The Chairman is responsible for evaluating the performance of its committees and individual Directors. The review
process is currently informal, generally done through a meeting with the Chairman of the Board. The performance
is reviewed regularly against both measureable and qualitative indicators. The performance criteria against which
directors and executives are assessed are aligned with the financial and non-financial objectives of Zicom Group
Limited. Directors whose performance is consistently unsatisfactory may be asked to retire.
The review process as disclosed above was undertaken in the current reporting period.
Principle 2: Structure the Board to Add Value
Composition of Board
The names of the Directors of the Company in office at the date of this annual report are set out in the Directors’
Report on page 7.
Details of the members of the Board, their experience, expertise, qualifications, term of office and independent
status are included in the “Board of Directors” section within the annual report.
The composition of the Board has been determined so as to provide the Company with a broad base of industry,
business, technical, administrative and corporate skill and experience considered necessary to represent
Shareholders and fulfil the business objectives of the Company.
Nomination and Remuneration Committee
A combined Nomination and Remuneration Committee has been established comprising the following members:
l Mr Y P Lim (Chairman)
l Mr G L Sim
l Mr Frank Leong
The Committee is responsible for the selection, nomination and appointment of Directors, monitoring the skills
and expertise of current Board members, consider succession planning issues, assessing the independence of Non-
Executive Directors and identifying the likely order of retirement by rotation of Non-Executive Directors. In addition
the committee formulates the remuneration policies for the Board Members and Managing Director of the Group.
Details on the number of meetings of the Nomination and Remuneration Committee held during the year and the
attendees at those meetings are set out in the Directors’ Report on page 14.
Corporate Governance StatementF
or p
erso
nal u
se o
nly
A N N U A L R E P O R T 2 0 1 5 27
Board Skills Matrix
The Board seeks to ensure as a minimum the Board’s skills matrix includes:
(a) Each Director must be capable of making a valuable contribution to the effective operations of the
Company and Board deliberations and processes;
(b) Directors must collectively have the necessary skills, knowledge and experience to understand the
risks of the Company and to ensure that the Company is managed in an appropriate way taking into
account these risks; and
(c) All Directors must be able to read and understand fundamental financial statements.
The Board believes that it has adequate representation of the necessary skills and requirement noted above.
Independence
Majority of the Company’s Board of directors are independent. An independent director is one who:
- does not hold an executive position;
- is not a substantial shareholder of the Company or an officer of, or otherwise associated directly with,
a substantial shareholder of the Company;
- has not within the last three years been employed in an executive capacity by the Company or other
group member, or been a director after ceasing to hold any such employment;
- is not a principal of a significant professional adviser or a significant consultant of the Company or
other group member, or an employee materially associated with the service provided;
- is not a significant supplier or customer of the Company or other group member, or an officer of, or
otherwise associated directly or indirectly with a significant supplier or customer;
- has no significant contractual relationship with the Company or other group member other than as a
Director of the Company;
- is free from any interest and any business or other relationship which could, or could reasonably be
perceived to, materially interfere with the Director’s ability to act in the best interests of the Company;
and
- has been a director of the entity for such a period that his or her independence may have been
compromised.
Materiality thresholds in determining the independence of non-executive directors are:
- A relationship that accounts for more than 10% of the Director’s gross income (other than director’s
fees paid by the company).
- Where the relationship is with a firm, company or entity, in respect of which the Director (or any
associate) has more than a 20% shareholding if a private company or 2% if a listed company.
Mr Frank Leong has no relationships or interests that would affect his role as an independent director.
Mr Y P Lim has no relationships or interests that would affect his role as an independent director.
Mr Ian R Millard has no relationships or interests that would affect his role as an independent director.
Mr S P Sze has no relationships or interests that would affect his role as an independent director.
Corporate Governance StatementF
or p
erso
nal u
se o
nly
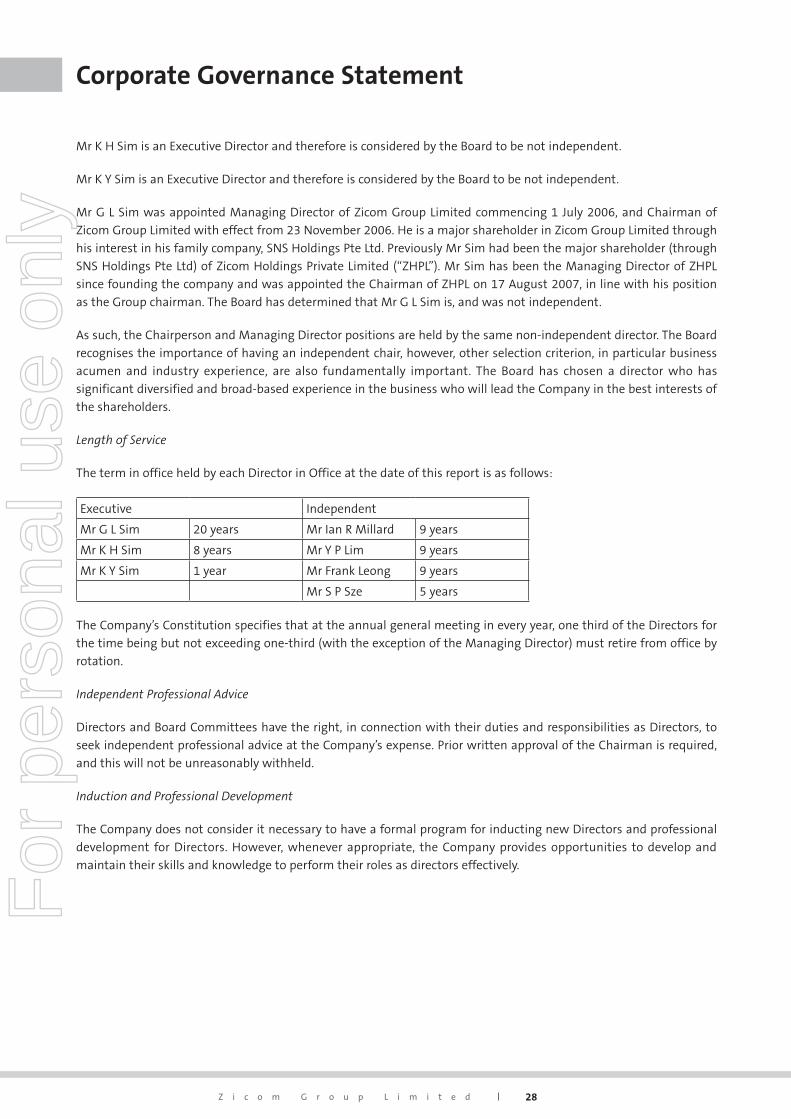
28Z i c o m G r o u p L i m i t e d
Mr K H Sim is an Executive Director and therefore is considered by the Board to be not independent.
Mr K Y Sim is an Executive Director and therefore is considered by the Board to be not independent.
Mr G L Sim was appointed Managing Director of Zicom Group Limited commencing 1 July 2006, and Chairman of
Zicom Group Limited with effect from 23 November 2006. He is a major shareholder in Zicom Group Limited through
his interest in his family company, SNS Holdings Pte Ltd. Previously Mr Sim had been the major shareholder (through
SNS Holdings Pte Ltd) of Zicom Holdings Private Limited (“ZHPL”). Mr Sim has been the Managing Director of ZHPL
since founding the company and was appointed the Chairman of ZHPL on 17 August 2007, in line with his position
as the Group chairman. The Board has determined that Mr G L Sim is, and was not independent.
As such, the Chairperson and Managing Director positions are held by the same non-independent director. The Board
recognises the importance of having an independent chair, however, other selection criterion, in particular business
acumen and industry experience, are also fundamentally important. The Board has chosen a director who has
significant diversified and broad-based experience in the business who will lead the Company in the best interests of
the shareholders.
Length of Service
The term in office held by each Director in Office at the date of this report is as follows:
Executive Independent
Mr G L Sim 20 years Mr Ian R Millard 9 years
Mr K H Sim 8 years Mr Y P Lim 9 years
Mr K Y Sim 1 year Mr Frank Leong 9 years
Mr S P Sze 5 years
The Company’s Constitution specifies that at the annual general meeting in every year, one third of the Directors for
the time being but not exceeding one-third (with the exception of the Managing Director) must retire from office by
rotation.
Independent Professional Advice
Directors and Board Committees have the right, in connection with their duties and responsibilities as Directors, to
seek independent professional advice at the Company’s expense. Prior written approval of the Chairman is required,
and this will not be unreasonably withheld.
Induction and Professional Development
The Company does not consider it necessary to have a formal program for inducting new Directors and professional
development for Directors. However, whenever appropriate, the Company provides opportunities to develop and
maintain their skills and knowledge to perform their roles as directors effectively.
Corporate Governance StatementF
or p
erso
nal u
se o
nly
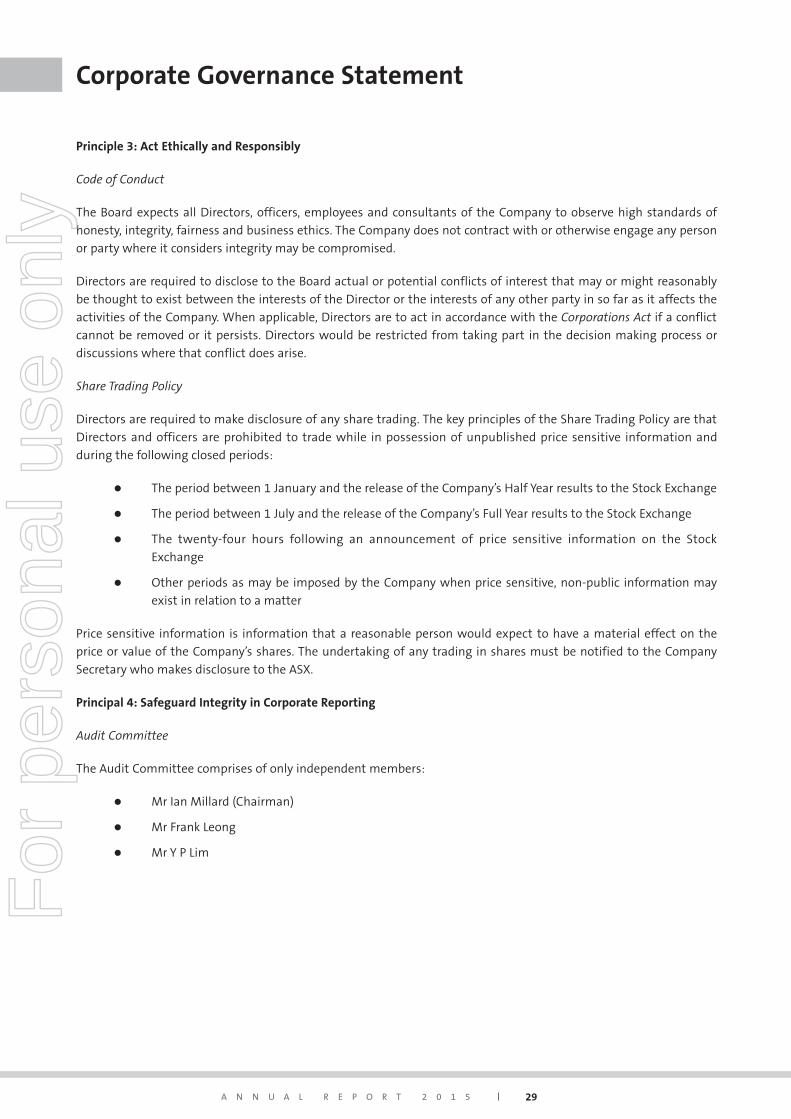
A N N U A L R E P O R T 2 0 1 5 29
Principle 3: Act Ethically and Responsibly
Code of Conduct
The Board expects all Directors, officers, employees and consultants of the Company to observe high standards of
honesty, integrity, fairness and business ethics. The Company does not contract with or otherwise engage any person
or party where it considers integrity may be compromised.
Directors are required to disclose to the Board actual or potential conflicts of interest that may or might reasonably
be thought to exist between the interests of the Director or the interests of any other party in so far as it affects the
activities of the Company. When applicable, Directors are to act in accordance with the Corporations Act if a conflict
cannot be removed or it persists. Directors would be restricted from taking part in the decision making process or
discussions where that conflict does arise.
Share Trading Policy
Directors are required to make disclosure of any share trading. The key principles of the Share Trading Policy are that
Directors and officers are prohibited to trade while in possession of unpublished price sensitive information and
during the following closed periods:
l The period between 1 January and the release of the Company’s Half Year results to the Stock Exchange
l The period between 1 July and the release of the Company’s Full Year results to the Stock Exchange
l The twenty-four hours following an announcement of price sensitive information on the Stock
Exchange
l Other periods as may be imposed by the Company when price sensitive, non-public information may
exist in relation to a matter
Price sensitive information is information that a reasonable person would expect to have a material effect on the
price or value of the Company’s shares. The undertaking of any trading in shares must be notified to the Company
Secretary who makes disclosure to the ASX.
Principal 4: Safeguard Integrity in Corporate Reporting
Audit Committee
The Audit Committee comprises of only independent members:
l Mr Ian Millard (Chairman)
l Mr Frank Leong
l Mr Y P Lim
Corporate Governance StatementF
or p
erso
nal u
se o
nly
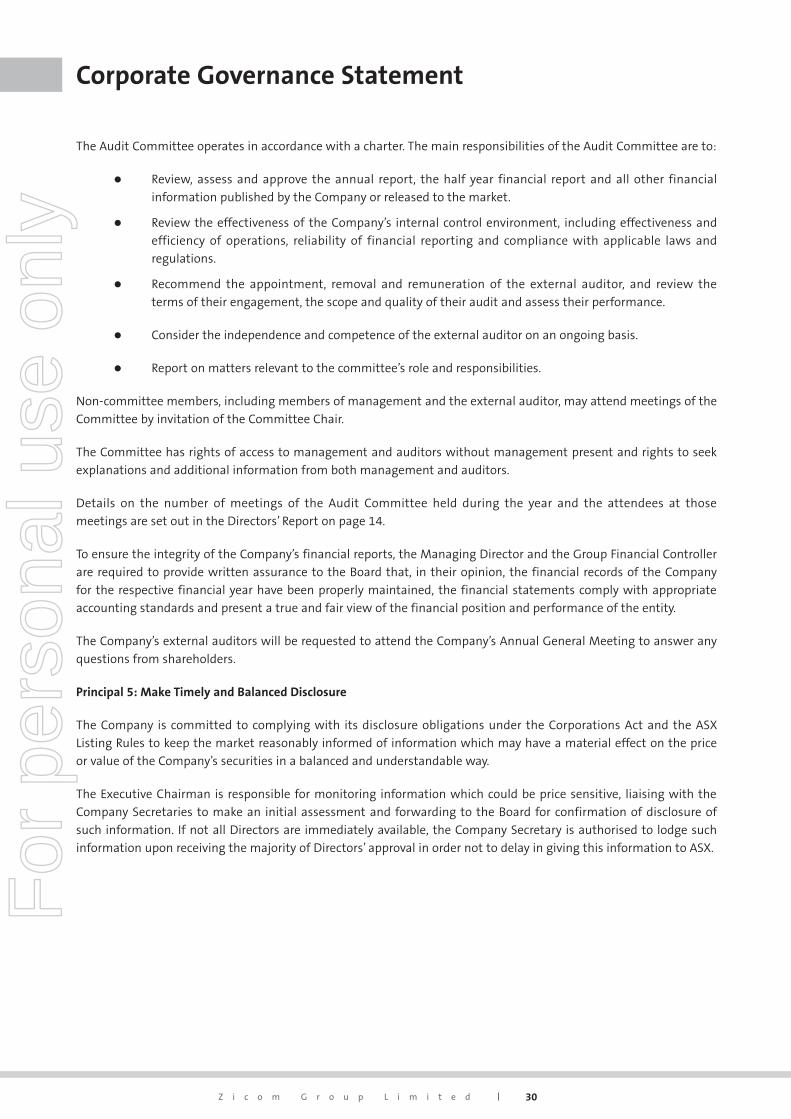
30Z i c o m G r o u p L i m i t e d
The Audit Committee operates in accordance with a charter. The main responsibilities of the Audit Committee are to:
l Review, assess and approve the annual report, the half year financial report and all other financial
information published by the Company or released to the market.
l Review the effectiveness of the Company’s internal control environment, including effectiveness and
efficiency of operations, reliability of financial reporting and compliance with applicable laws and
regulations.
l Recommend the appointment, removal and remuneration of the external auditor, and review the
terms of their engagement, the scope and quality of their audit and assess their performance.
l Consider the independence and competence of the external auditor on an ongoing basis.
l Report on matters relevant to the committee’s role and responsibilities.
Non-committee members, including members of management and the external auditor, may attend meetings of the
Committee by invitation of the Committee Chair.
The Committee has rights of access to management and auditors without management present and rights to seek
explanations and additional information from both management and auditors.
Details on the number of meetings of the Audit Committee held during the year and the attendees at those
meetings are set out in the Directors’ Report on page 14.
To ensure the integrity of the Company’s financial reports, the Managing Director and the Group Financial Controller
are required to provide written assurance to the Board that, in their opinion, the financial records of the Company
for the respective financial year have been properly maintained, the financial statements comply with appropriate
accounting standards and present a true and fair view of the financial position and performance of the entity.
The Company’s external auditors will be requested to attend the Company’s Annual General Meeting to answer any
questions from shareholders.
Principal 5: Make Timely and Balanced Disclosure
The Company is committed to complying with its disclosure obligations under the Corporations Act and the ASX
Listing Rules to keep the market reasonably informed of information which may have a material effect on the price
or value of the Company’s securities in a balanced and understandable way.
The Executive Chairman is responsible for monitoring information which could be price sensitive, liaising with the
Company Secretaries to make an initial assessment and forwarding to the Board for confirmation of disclosure of
such information. If not all Directors are immediately available, the Company Secretary is authorised to lodge such
information upon receiving the majority of Directors’ approval in order not to delay in giving this information to ASX.
Corporate Governance StatementF
or p
erso
nal u
se o
nly
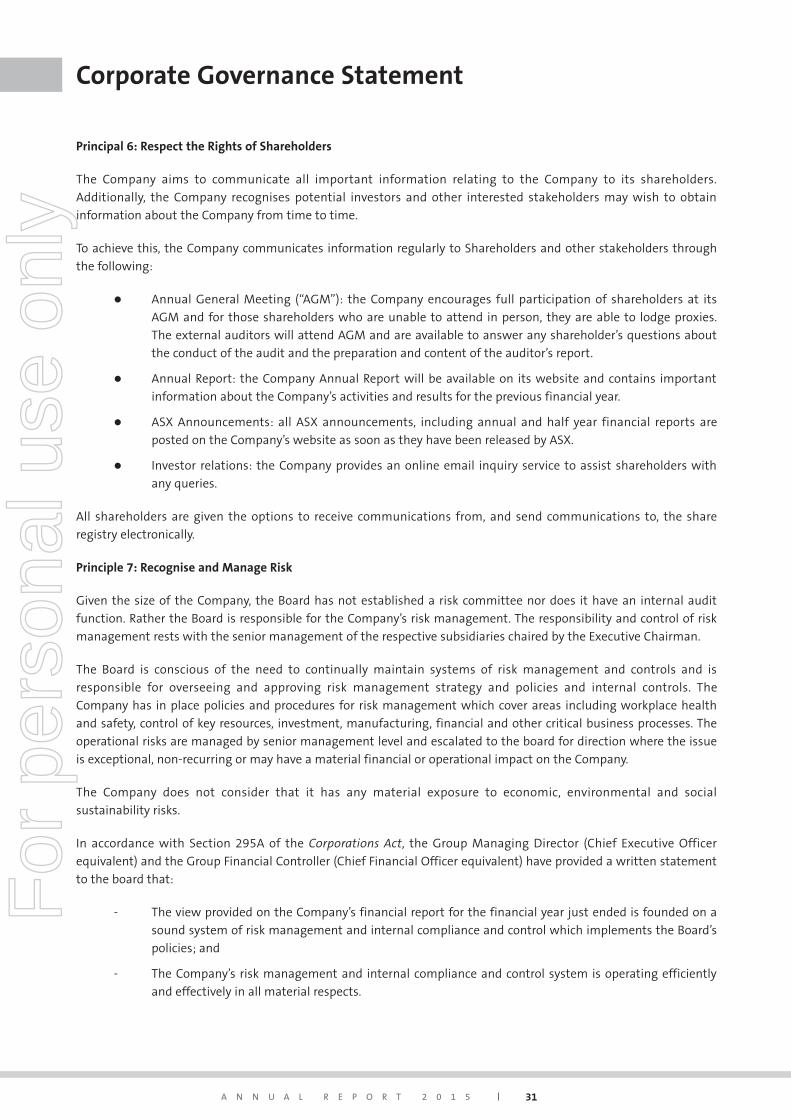
A N N U A L R E P O R T 2 0 1 5 31
Principal 6: Respect the Rights of Shareholders
The Company aims to communicate all important information relating to the Company to its shareholders.
Additionally, the Company recognises potential investors and other interested stakeholders may wish to obtain
information about the Company from time to time.
To achieve this, the Company communicates information regularly to Shareholders and other stakeholders through
the following:
l Annual General Meeting (“AGM”): the Company encourages full participation of shareholders at its
AGM and for those shareholders who are unable to attend in person, they are able to lodge proxies.
The external auditors will attend AGM and are available to answer any shareholder’s questions about
the conduct of the audit and the preparation and content of the auditor’s report.
l Annual Report: the Company Annual Report will be available on its website and contains important
information about the Company’s activities and results for the previous financial year.
l ASX Announcements: all ASX announcements, including annual and half year financial reports are
posted on the Company’s website as soon as they have been released by ASX.
l Investor relations: the Company provides an online email inquiry service to assist shareholders with
any queries.
All shareholders are given the options to receive communications from, and send communications to, the share
registry electronically.
Principle 7: Recognise and Manage Risk
Given the size of the Company, the Board has not established a risk committee nor does it have an internal audit
function. Rather the Board is responsible for the Company’s risk management. The responsibility and control of risk
management rests with the senior management of the respective subsidiaries chaired by the Executive Chairman.
The Board is conscious of the need to continually maintain systems of risk management and controls and is
responsible for overseeing and approving risk management strategy and policies and internal controls. The
Company has in place policies and procedures for risk management which cover areas including workplace health
and safety, control of key resources, investment, manufacturing, financial and other critical business processes. The
operational risks are managed by senior management level and escalated to the board for direction where the issue
is exceptional, non-recurring or may have a material financial or operational impact on the Company.
The Company does not consider that it has any material exposure to economic, environmental and social
sustainability risks.
In accordance with Section 295A of the Corporations Act, the Group Managing Director (Chief Executive Officer
equivalent) and the Group Financial Controller (Chief Financial Officer equivalent) have provided a written statement
to the board that:
- The view provided on the Company’s financial report for the financial year just ended is founded on a
sound system of risk management and internal compliance and control which implements the Board’s
policies; and
- The Company’s risk management and internal compliance and control system is operating efficiently
and effectively in all material respects.
Corporate Governance StatementF
or p
erso
nal u
se o
nly
32Z i c o m G r o u p L i m i t e d
The board acknowledges that such internal control assurance are not absolute and can only be provided on a
reasonable basis after having made due enquiries. This is due to factors such as the need for judgement and the
inherent limitations in internal controls and therefore is not and cannot be designed to detect all weaknesses in
control procedures.
Principle 8: Remunerate Fairly and Responsibly
As stated above, a combined Nomination and Remuneration Committee has been established by the board
comprising the Executive Chairman and two independent directors.
Details on the number of meetings of the Nomination and Remuneration Committee held during the year and the
attendees at those meetings are set out in the Directors’ Report on page 14.
Details of the remuneration for Directors and Key Management Personnel can be found in the Directors Report
within the Annual Report.
The Group Managing Director and Group Executive Directors receive performance based remuneration. In addition,
the Group Managing Director has renewed his service agreement with the Group for a term of another 5 years from
1 July 2011. The other Directors do not receive any performance based remuneration and do not have contracts with
the Company that give them any form of certain tenure. One third of the Directors retire annually and are free to
seek re-election by Shareholders.
Each member of the Board has committed to spending sufficient time to enable them to carry out their duties as a
Director of the Company.
A maximum amount of remuneration for non-executive Directors is fixed by Shareholders in general meeting
and can be varied in the same manner. In determining the allocation (if any) the Board must take account of the
time demands on the Directors together with such factors as fees paid to other corporate directors and to the
responsibilities undertaken by them.
The Directors with the exception of Mr G L Sim were granted options after it was approved by the shareholders in
an Extraordinary General Meeting on 28 August 2008. The Board considers that there should be an appropriate mix
of remuneration comprising cash and securities for all Directors to link the remuneration of the Directors to the
financial performance of the Company. The Directors consider this remuneration policy to be a sensible and balanced
policy which aligns the interests of shareholders and all Directors. Transactions which limit the economic risk in
participating in unvested entitlement under equity-based remuneration schemes are not allowed.
Corporate Governance StatementF
or p
erso
nal u
se o
nly
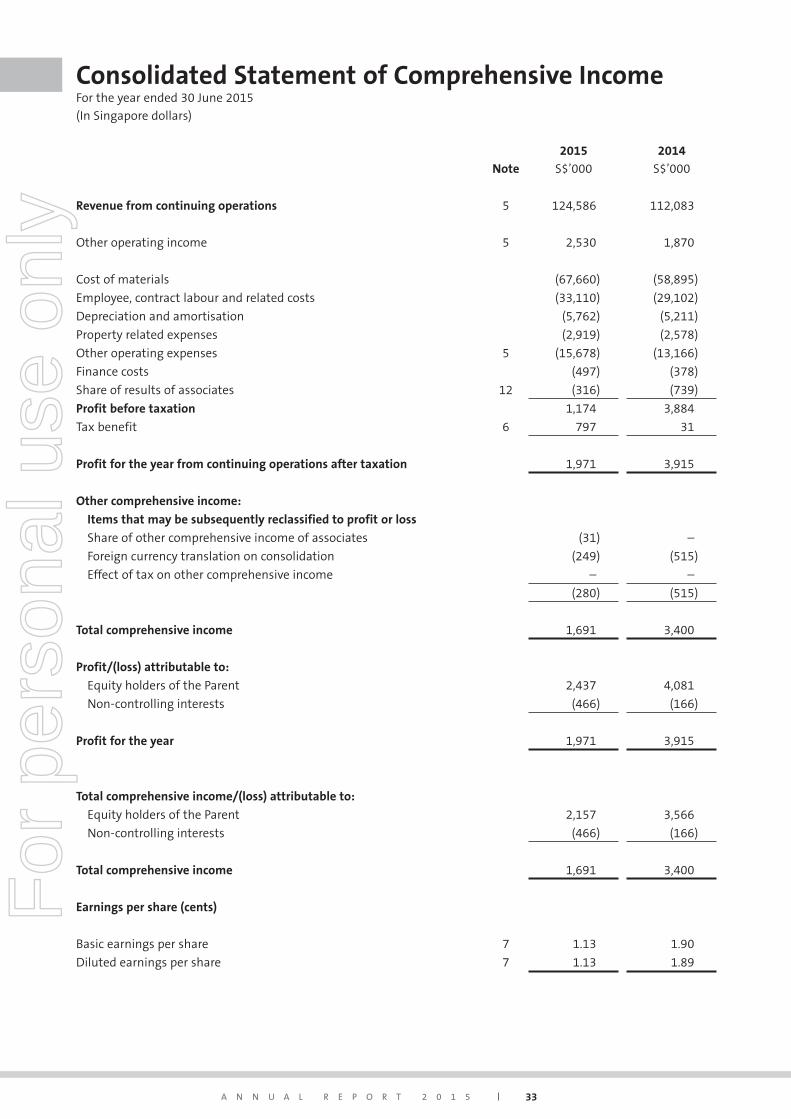
A N N U A L R E P O R T 2 0 1 5 33
Note
2015
S$’000
2014
S$’000
Revenue from continuing operations 5 124,586 112,083
Other operating income 5 2,530 1,870
Cost of materials (67,660) (58,895)
Employee, contract labour and related costs (33,110) (29,102)
Depreciation and amortisation (5,762) (5,211)
Property related expenses (2,919) (2,578)
Other operating expenses 5 (15,678) (13,166)
Finance costs (497) (378)
Share of results of associates 12 (316) (739)
Profit before taxation 1,174 3,884
Tax benefit 6 797 31
Profit for the year from continuing operations after taxation 1,971 3,915
Other comprehensive income:
Items that may be subsequently reclassified to profit or loss
Share of other comprehensive income of associates (31) –
Foreign currency translation on consolidation (249) (515)
Effect of tax on other comprehensive income – –
(280) (515)
Total comprehensive income 1,691 3,400
Profit/(loss) attributable to:
Equity holders of the Parent 2,437 4,081
Non-controlling interests (466) (166)
Profit for the year 1,971 3,915
Total comprehensive income/(loss) attributable to:
Equity holders of the Parent 2,157 3,566
Non-controlling interests (466) (166)
Total comprehensive income 1,691 3,400
Earnings per share (cents)
Basic earnings per share 7 1.13 1.90
Diluted earnings per share 7 1.13 1.89
Consolidated Statement of Comprehensive IncomeFor the year ended 30 June 2015
(In Singapore dollars)
For
per
sona
l use
onl
y
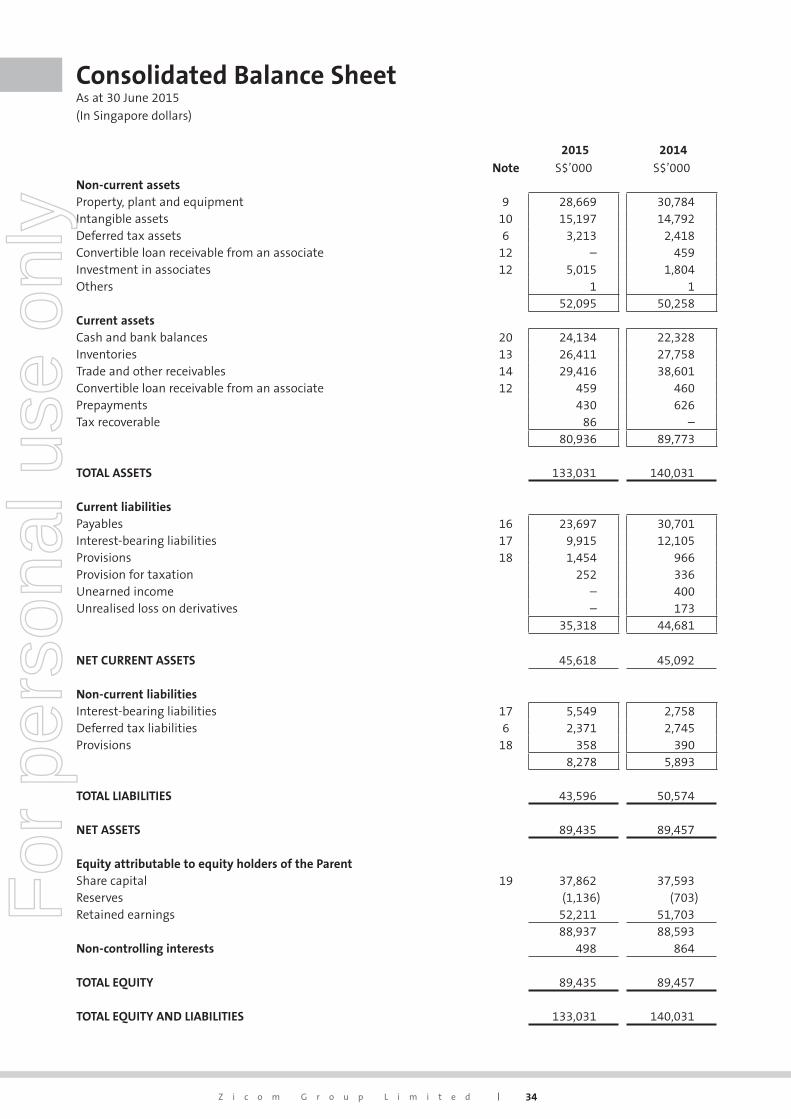
34Z i c o m G r o u p L i m i t e d
Note
2015
S$’000
2014
S$’000Non-current assetsProperty, plant and equipment 9 28,669 30,784Intangible assets 10 15,197 14,792Deferred tax assets 6 3,213 2,418Convertible loan receivable from an associate 12 – 459Investment in associates 12 5,015 1,804Others 1 1
52,095 50,258Current assetsCash and bank balances 20 24,134 22,328Inventories 13 26,411 27,758Trade and other receivables 14 29,416 38,601Convertible loan receivable from an associate 12 459 460Prepayments 430 626Tax recoverable 86 –
80,936 89,773
TOTAL ASSETS 133,031 140,031
Current liabilitiesPayables 16 23,697 30,701Interest-bearing liabilities 17 9,915 12,105Provisions 18 1,454 966Provision for taxation 252 336Unearned income – 400Unrealised loss on derivatives – 173
35,318 44,681
NET CURRENT ASSETS 45,618 45,092
Non-current liabilitiesInterest-bearing liabilities 17 5,549 2,758Deferred tax liabilities 6 2,371 2,745Provisions 18 358 390
8,278 5,893
TOTAL LIABILITIES 43,596 50,574
NET ASSETS 89,435 89,457
Equity attributable to equity holders of the ParentShare capital 19 37,862 37,593Reserves (1,136) (703)Retained earnings 52,211 51,703
88,937 88,593Non-controlling interests 498 864
TOTAL EQUITY 89,435 89,457
TOTAL EQUITY AND LIABILITIES 133,031 140,031
Consolidated Balance SheetAs at 30 June 2015
(In Singapore dollars)
For
per
sona
l use
onl
y
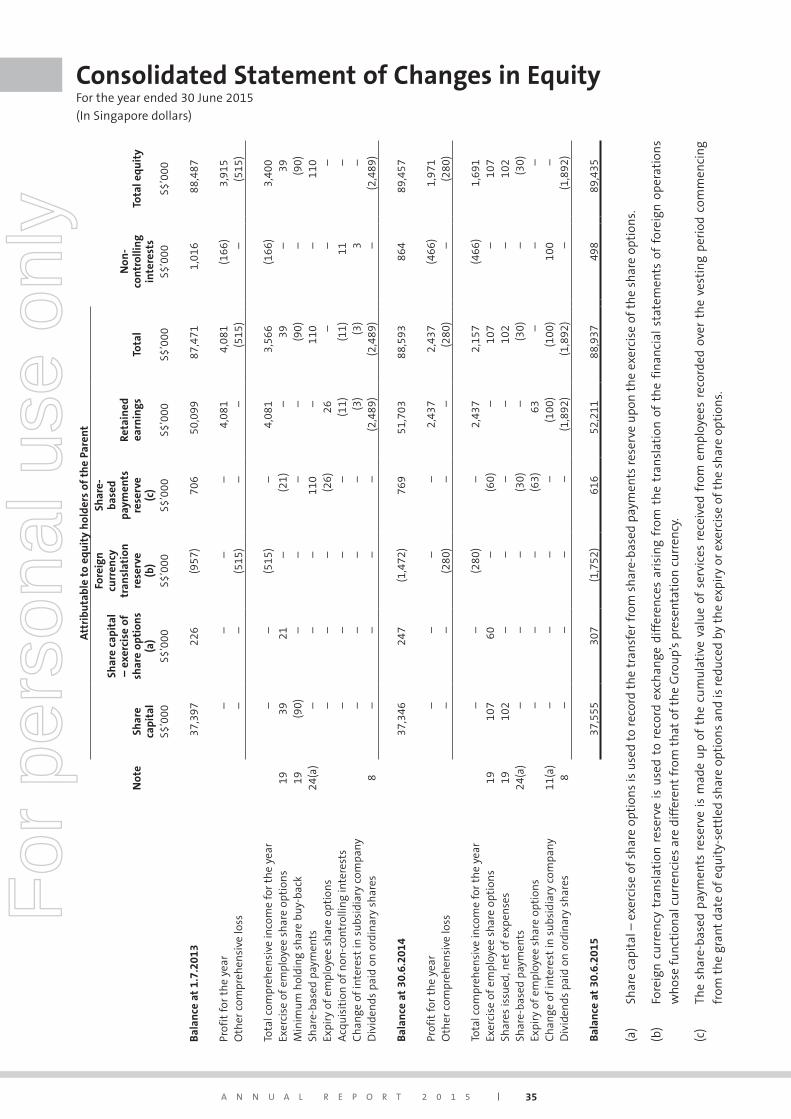
A N N U A L R E P O R T 2 0 1 5 35
Att
ribu
tabl
e to
equ
ity
hol
ders
of
the
Pare
nt
Not
eSh
are
capi
tal
Shar
e ca
pita
l –
exer
cise
of
shar
e op
tion
s(a
)
Fore
ign
cu
rren
cy
tran
slat
ion
re
serv
e(b
)
Shar
e-ba
sed
paym
ents
re
serv
e(c
)
Reta
ined
ea
rnin
gsTo
tal
Non
-co
ntro
llin
g in
tere
sts
Tota
l equ
ity
S$’0
00S$
’000
S$’0
00S$
’000
S$’0
00S$
’000
S$’0
00S$
’000
Bal
ance
at
1.7.
2013
37,3
9722
6(9
57)
706
50,0
9987
,471
1,01
688
,487
Prof
it f
or t
he
year
––
– –
4,08
14,
081
(166
)3,
915
Oth
er c
ompr
ehen
sive
loss
––
(515
)–
– (5
15)
–(5
15)
Tota
l com
preh
ensi
ve in
com
e fo
r th
e ye
ar–
–(5
15)
–4,
081
3,56
6(1
66)
3,40
0Ex
erci
se o
f em
ploy
ee s
har
e op
tion
s19
3921
–(2
1)–
39–
39M
inim
um
hol
din
g sh
are
buy-
back
19(9
0)–
––
–(9
0)–
(90)
Shar
e-ba
sed
paym
ents
24(a
)–
––
110
–11
0–
110
Expi
ry o
f em
ploy
ee s
har
e op
tion
s–
––
(26)
26–
––
Acq
uis
itio
n o
f n
on-c
ontr
ollin
g in
tere
sts
––
––
(11)
(11)
11–
Ch
ange
of
inte
rest
in s
ubs
idia
ry c
ompa
ny–
––
–(3
)(3
)3
–D
ivid
ends
pai
d on
ord
inar
y sh
ares
8–
––
–(2
,489
)(2
,489
)–
(2,4
89)
Bal
ance
at
30.6
.201
437
,346
247
(1,4
72)
769
51,7
0388
,593
864
89,4
57
Prof
it f
or t
he
year
––
––
2,43
72,
437
(466
)1,
971
Oth
er c
ompr
ehen
sive
loss
––
(280
)–
–(2
80)
–(2
80)
Tota
l com
preh
ensi
ve in
com
e fo
r th
e ye
ar–
–(2
80)
–2,
437
2,15
7(4
66)
1,69
1Ex
erci
se o
f em
ploy
ee s
har
e op
tion
s19
107
60–
(60)
–10
7–
107
Shar
es is
sued
, net
of
expe
nse
s19
102
––
––
102
–10
2Sh
are-
base
d pa
ymen
ts24
(a)
––
–(3
0)–
(30)
–(3
0)Ex
piry
of
empl
oyee
sh
are
opti
ons
––
–(6
3)63
––
–C
han
ge o
f in
tere
st in
su
bsid
iary
com
pany
11(a
)–
––
–(1
00)
(100
)10
0–
Div
iden
ds p
aid
on o
rdin
ary
shar
es8
––
––
(1,8
92)
(1,8
92)
–(1
,892
)
Bal
ance
at
30.6
.201
537
,555
307
(1,7
52)
616
52,2
1188
,937
498
89,4
35
(a)
Shar
e ca
pita
l – e
xerc
ise
of s
har
e op
tion
s is
use
d to
rec
ord
the
tran
sfer
fro
m s
har
e-ba
sed
paym
ents
res
erve
upo
n t
he
exer
cise
of
the
shar
e op
tion
s.
(b)
Fore
ign
cu
rren
cy t
ran
slat
ion
res
erve
is
use
d to
rec
ord
exch
ange
dif
fere
nce
s ar
isin
g fr
om t
he
tran
slat
ion
of
the
fin
anci
al s
tate
men
ts o
f fo
reig
n o
pera
tion
s
wh
ose
fun
ctio
nal
cu
rren
cies
are
dif
fere
nt f
rom
th
at o
f th
e G
rou
p’s
pres
enta
tion
cu
rren
cy.
(c)
The
shar
e-ba
sed
paym
ents
res
erve
is
mad
e u
p of
th
e cu
mu
lati
ve v
alu
e of
ser
vice
s re
ceiv
ed f
rom
em
ploy
ees
reco
rded
ove
r th
e ve
stin
g pe
riod
com
men
cin
g
from
th
e gr
ant
date
of
equ
ity-
sett
led
shar
e op
tion
s an
d is
red
uce
d by
th
e ex
piry
or
exer
cise
of
the
shar
e op
tion
s.
Consolidated Statement of Changes in EquityFor the year ended 30 June 2015
(In Singapore dollars)
For
per
sona
l use
onl
y
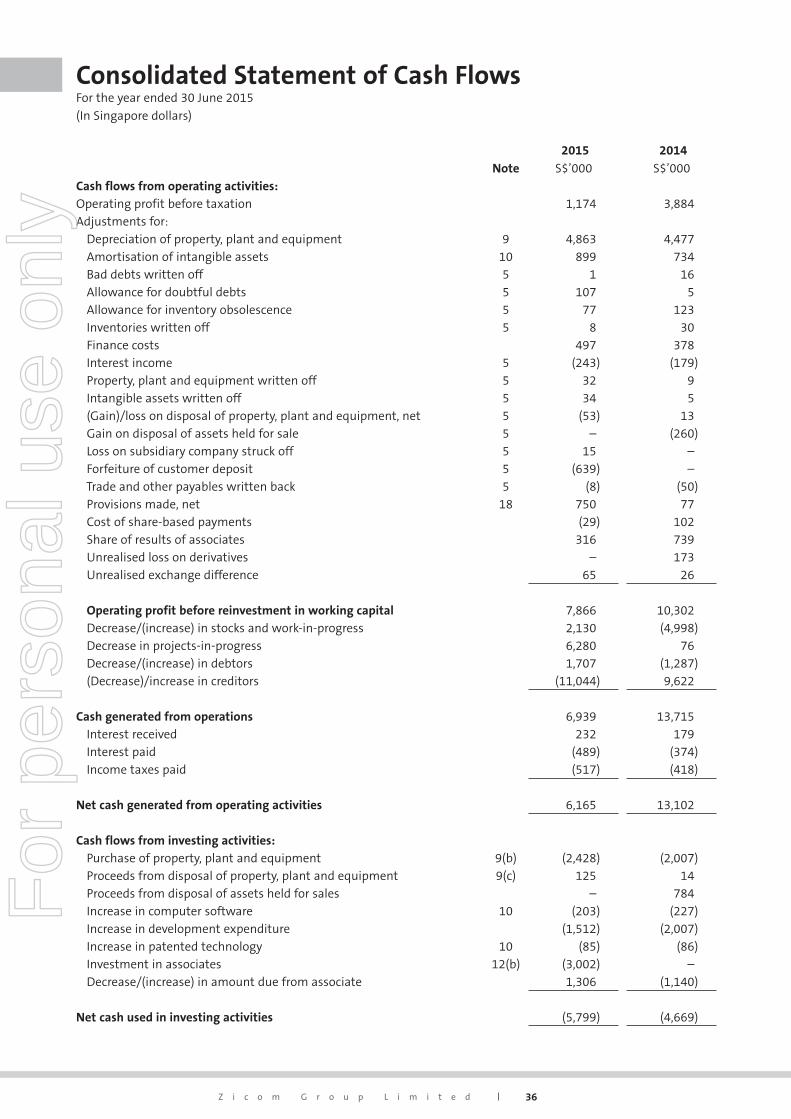
36Z i c o m G r o u p L i m i t e d
Note
2015
S$’000
2014
S$’000Cash flows from operating activities:Operating profit before taxation 1,174 3,884Adjustments for:
Depreciation of property, plant and equipment 9 4,863 4,477 Amortisation of intangible assets 10 899 734 Bad debts written off 5 1 16 Allowance for doubtful debts 5 107 5 Allowance for inventory obsolescence 5 77 123 Inventories written off 5 8 30 Finance costs 497 378 Interest income 5 (243) (179) Property, plant and equipment written off 5 32 9 Intangible assets written off 5 34 5 (Gain)/loss on disposal of property, plant and equipment, net 5 (53) 13 Gain on disposal of assets held for sale 5 – (260) Loss on subsidiary company struck off 5 15 – Forfeiture of customer deposit 5 (639) – Trade and other payables written back 5 (8) (50) Provisions made, net 18 750 77 Cost of share-based payments (29) 102 Share of results of associates 316 739 Unrealised loss on derivatives – 173 Unrealised exchange difference 65 26
Operating profit before reinvestment in working capital 7,866 10,302 Decrease/(increase) in stocks and work-in-progress 2,130 (4,998) Decrease in projects-in-progress 6,280 76 Decrease/(increase) in debtors 1,707 (1,287) (Decrease)/increase in creditors (11,044) 9,622
Cash generated from operations 6,939 13,715 Interest received 232 179 Interest paid (489) (374) Income taxes paid (517) (418)
Net cash generated from operating activities 6,165 13,102
Cash flows from investing activities: Purchase of property, plant and equipment 9(b) (2,428) (2,007) Proceeds from disposal of property, plant and equipment 9(c) 125 14 Proceeds from disposal of assets held for sales – 784 Increase in computer software 10 (203) (227) Increase in development expenditure (1,512) (2,007) Increase in patented technology 10 (85) (86) Investment in associates 12(b) (3,002) – Decrease/(increase) in amount due from associate 1,306 (1,140)
Net cash used in investing activities (5,799) (4,669)
Consolidated Statement of Cash FlowsFor the year ended 30 June 2015
(In Singapore dollars)
For
per
sona
l use
onl
y
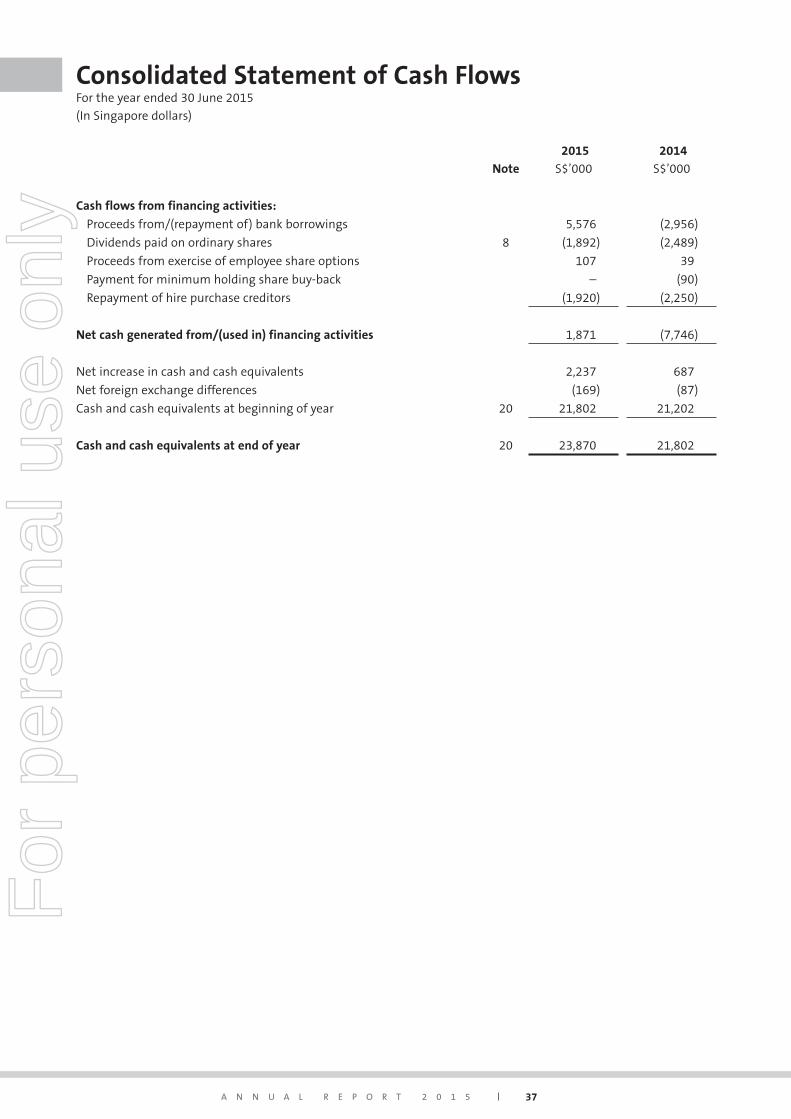
A N N U A L R E P O R T 2 0 1 5 37
Note
2015
S$’000
2014
S$’000
Cash flows from financing activities:
Proceeds from/(repayment of) bank borrowings 5,576 (2,956)
Dividends paid on ordinary shares 8 (1,892) (2,489)
Proceeds from exercise of employee share options 107 39
Payment for minimum holding share buy-back – (90)
Repayment of hire purchase creditors (1,920) (2,250)
Net cash generated from/(used in) financing activities 1,871 (7,746)
Net increase in cash and cash equivalents 2,237 687
Net foreign exchange differences (169) (87)
Cash and cash equivalents at beginning of year 20 21,802 21,202
Cash and cash equivalents at end of year 20 23,870 21,802
Consolidated Statement of Cash FlowsFor the year ended 30 June 2015
(In Singapore dollars)
For
per
sona
l use
onl
y
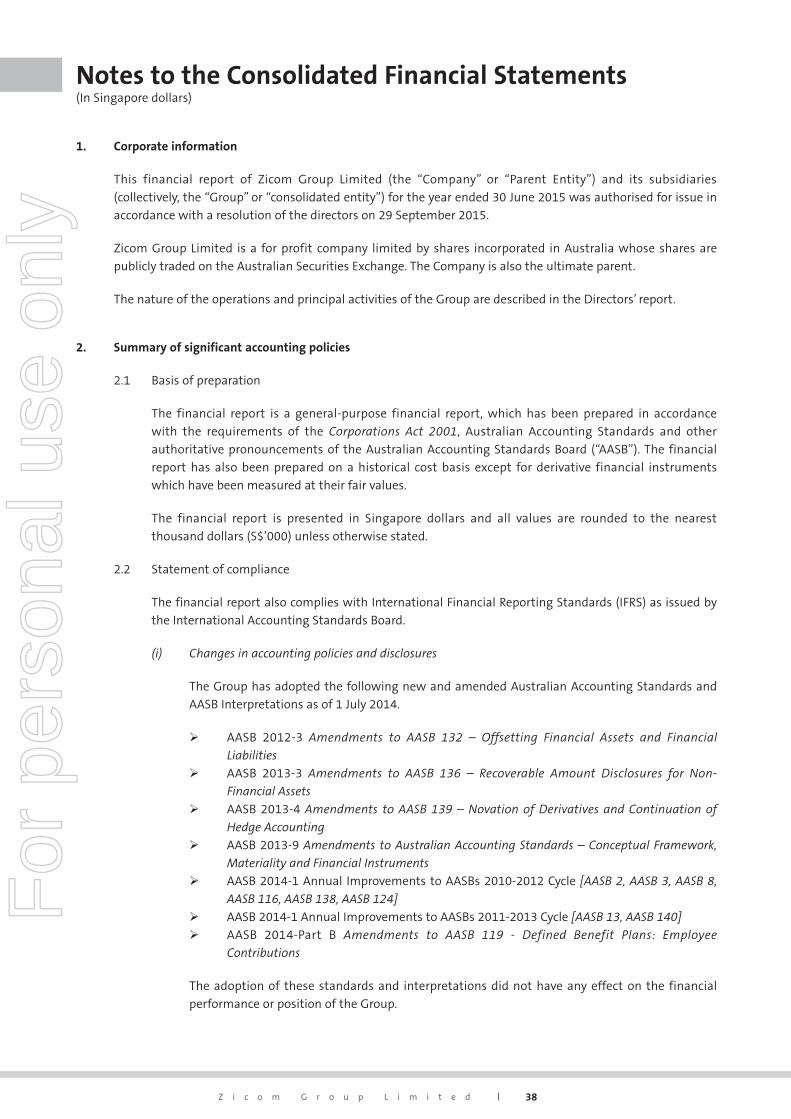
38Z i c o m G r o u p L i m i t e d
Notes to the Consolidated Financial Statements (In Singapore dollars)
1. Corporate information
This financial report of Zicom Group Limited (the “Company” or “Parent Entity”) and its subsidiaries
(collectively, the “Group” or “consolidated entity”) for the year ended 30 June 2015 was authorised for issue in
accordance with a resolution of the directors on 29 September 2015.
Zicom Group Limited is a for profit company limited by shares incorporated in Australia whose shares are
publicly traded on the Australian Securities Exchange. The Company is also the ultimate parent.
The nature of the operations and principal activities of the Group are described in the Directors’ report.
2. Summary of significant accounting policies
2.1 Basis of preparation
The financial report is a general-purpose financial report, which has been prepared in accordance
with the requirements of the Corporations Act 2001, Australian Accounting Standards and other
authoritative pronouncements of the Australian Accounting Standards Board (“AASB”). The financial
report has also been prepared on a historical cost basis except for derivative financial instruments
which have been measured at their fair values.
The financial report is presented in Singapore dollars and all values are rounded to the nearest
thousand dollars (S$’000) unless otherwise stated.
2.2 Statement of compliance
The financial report also complies with International Financial Reporting Standards (IFRS) as issued by
the International Accounting Standards Board.
(i) Changes in accounting policies and disclosures
The Group has adopted the following new and amended Australian Accounting Standards and
AASB Interpretations as of 1 July 2014.
AASB 2012-3 Amendments to AASB 132 – Offsetting Financial Assets and Financial
Liabilities
AASB 2013-3 Amendments to AASB 136 – Recoverable Amount Disclosures for Non-
Financial Assets
AASB 2013-4 Amendments to AASB 139 – Novation of Derivatives and Continuation of
Hedge Accounting
AASB 2013-9 Amendments to Australian Accounting Standards – Conceptual Framework,
Materiality and Financial Instruments
AASB 2014-1 Annual Improvements to AASBs 2010-2012 Cycle [AASB 2, AASB 3, AASB 8,
AASB 116, AASB 138, AASB 124]
AASB 2014-1 Annual Improvements to AASBs 2011-2013 Cycle [AASB 13, AASB 140]
AASB 2014-Part B Amendments to AASB 119 - Defined Benefit Plans: Employee
Contributions
The adoption of these standards and interpretations did not have any effect on the financial
performance or position of the Group.
For
per
sona
l use
onl
y
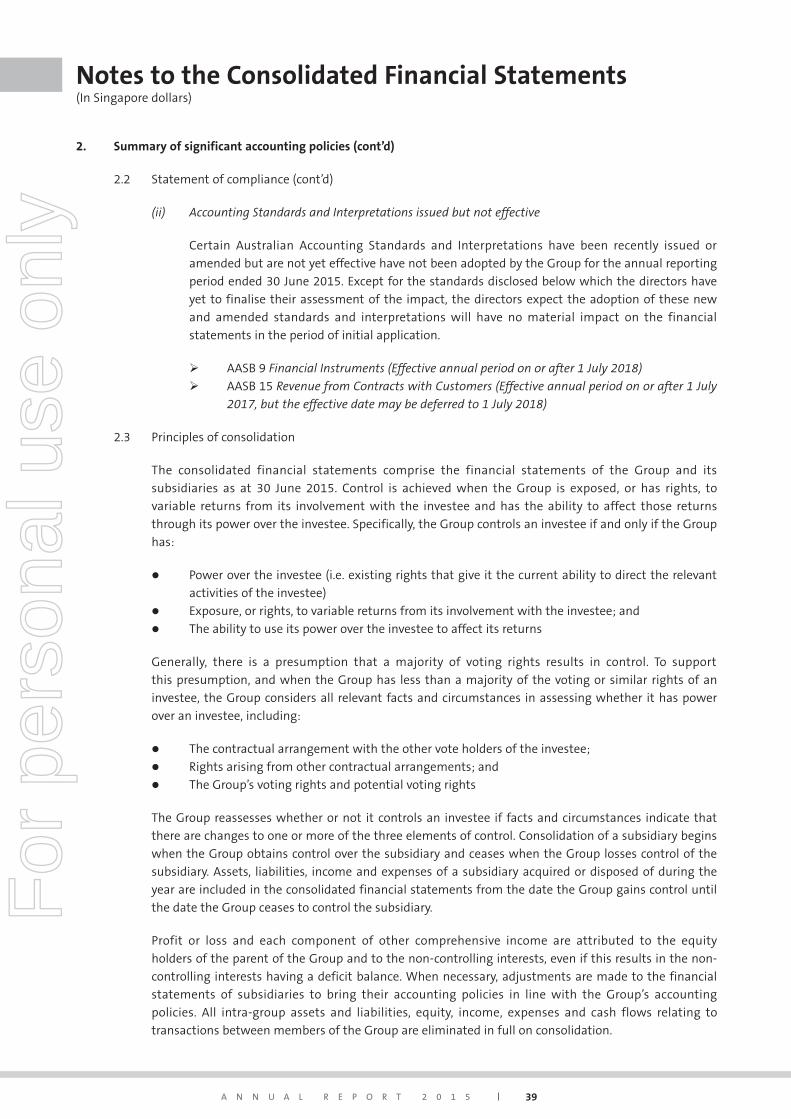
A N N U A L R E P O R T 2 0 1 5 39
Notes to the Consolidated Financial Statements (In Singapore dollars)
2. Summary of significant accounting policies (cont’d)
2.2 Statement of compliance (cont’d)
(ii) Accounting Standards and Interpretations issued but not effective
Certain Australian Accounting Standards and Interpretations have been recently issued or
amended but are not yet effective have not been adopted by the Group for the annual reporting
period ended 30 June 2015. Except for the standards disclosed below which the directors have
yet to finalise their assessment of the impact, the directors expect the adoption of these new
and amended standards and interpretations will have no material impact on the financial
statements in the period of initial application.
AASB 9 Financial Instruments (Effective annual period on or after 1 July 2018)
AASB 15 Revenue from Contracts with Customers (Effective annual period on or after 1 July
2017, but the effective date may be deferred to 1 July 2018)
2.3 Principles of consolidation
The consolidated financial statements comprise the financial statements of the Group and its
subsidiaries as at 30 June 2015. Control is achieved when the Group is exposed, or has rights, to
variable returns from its involvement with the investee and has the ability to affect those returns
through its power over the investee. Specifically, the Group controls an investee if and only if the Group
has:
l Power over the investee (i.e. existing rights that give it the current ability to direct the relevant
activities of the investee)
l Exposure, or rights, to variable returns from its involvement with the investee; and
l The ability to use its power over the investee to affect its returns
Generally, there is a presumption that a majority of voting rights results in control. To support
this presumption, and when the Group has less than a majority of the voting or similar rights of an
investee, the Group considers all relevant facts and circumstances in assessing whether it has power
over an investee, including:
l The contractual arrangement with the other vote holders of the investee;
l Rights arising from other contractual arrangements; and
l The Group’s voting rights and potential voting rights
The Group reassesses whether or not it controls an investee if facts and circumstances indicate that
there are changes to one or more of the three elements of control. Consolidation of a subsidiary begins
when the Group obtains control over the subsidiary and ceases when the Group losses control of the
subsidiary. Assets, liabilities, income and expenses of a subsidiary acquired or disposed of during the
year are included in the consolidated financial statements from the date the Group gains control until
the date the Group ceases to control the subsidiary.
Profit or loss and each component of other comprehensive income are attributed to the equity
holders of the parent of the Group and to the non-controlling interests, even if this results in the non-
controlling interests having a deficit balance. When necessary, adjustments are made to the financial
statements of subsidiaries to bring their accounting policies in line with the Group’s accounting
policies. All intra-group assets and liabilities, equity, income, expenses and cash flows relating to
transactions between members of the Group are eliminated in full on consolidation.
For
per
sona
l use
onl
y
40Z i c o m G r o u p L i m i t e d
Notes to the Consolidated Financial Statements (In Singapore dollars)
2. Summary of significant accounting policies (cont’d)
2.3 Principles of consolidation (cont’d)
A change in the ownership interest of a subsidiary, without a loss of control, is accounted for as an
equity transaction. If the Group loses control over a subsidiary, it derecognises the related assets
(including goodwill), liabilities, non-controlling interest and other components of equity while any
resultant gain or loss is recognised in profit or loss. Any investment retained is recognised at fair value.
In the Parent Entity’s separate financial statements, investments in subsidiaries are accounted for at
cost less impairment losses.
2.4 Business combinations and goodwill
Business combinations are accounted for using the acquisition method. The cost of an acquisition is
measured as the aggregate of the consideration transferred measured at acquisition date fair value
and the amount of any non-controlling interests in the acquiree. For each business combination, the
Group elects whether to measure the non-controlling interests in the acquiree at fair value or at the
proportionate share of the acquiree’s identifiable net assets. Acquisition-related costs are expensed as
incurred.
When the Group acquires a business, it assesses the financial assets and liabilities assumed for
appropriate classification and designation in accordance with the contractual terms, economic
circumstances and pertinent conditions as at the acquisition date. This includes the separation of
embedded derivatives in host contracts by the acquiree.
If the business combination is achieved in stages, any previously held equity interest is remeasured at
its acquisition date fair value and any resulting gain or loss is recognised in profit or loss.
Goodwill is initially measured at cost, being the excess of the aggregate of the consideration
transferred and the amount recognised for non-controlling interests, and any previously held interest,
over the net identifiable assets acquired and liabilities assumed. If the fair value of the net assets
acquired is in excess of the aggregate consideration transferred, the Group reassesses whether it
has correctly identified all of the assets acquired and all of the liabilities assumed and reviews the
procedures used to measure the amounts to be recognised at the acquisition date. If the reassessment
still results in an excess of the fair value of the net assets acquired over the aggregate consideration
transferred, then the gain is recognised in profit or loss.
After initial recognition, goodwill is measured at cost less any accumulated impairment losses. For the
purpose of impairment testing, goodwill acquired in a business combination is, from the acquisition
date, allocated to each of the Group’s cash-generating units that are expected to benefit from the
combination, irrespective of whether other assets or liabilities of the acquiree are assigned to those
units.
The cash-generating unit to which goodwill has been allocated is tested for impairment annually and
whenever there is an indication that the cash-generating unit may be impaired, by comparing the
carrying amount of the cash-generating unit, including the allocated goodwill, with the recoverable
amount of the cash-generating unit. Where the recoverable amount of the cash-generating unit is
less than the carrying amount, an impairment loss is recognised in profit or loss. Impairment losses
recognised for goodwill are not reversed in subsequent periods.
For
per
sona
l use
onl
y
A N N U A L R E P O R T 2 0 1 5 41
Notes to the Consolidated Financial Statements (In Singapore dollars)
2. Summary of significant accounting policies (cont’d)
2.4 Business combinations and goodwill (cont’d)
Where goodwill has been allocated to a cash-generating unit and part of the operation within that
unit is disposed of, the goodwill associated with the disposed operation is included in the carrying
amount of the operation when determining the gain or loss on disposal of the operation. Goodwill
disposed of in this circumstance is measured based on the relative fair values of the disposed operation
and the portion of the cash-generating unit retained.
2.5 Operating segments
An operating segment is a component of an entity that engages in business activities from which it
may earn revenues and incur expenses (including revenues and expenses relating to transactions with
other components of the same entity), whose operating results are regularly reviewed by the entity’s
chief operating decision makers to make decisions about resources to be allocated to the segment and
assess its performance and for which discrete financial information is available.
Operating segments have been identified based on the information provided to the chief operating
decision makers – being the executive management team.
The group aggregates two or more operating segments when they have similar economic
characteristics, and the segments are similar in each of the following respects.
l Nature of the products and services
l Type or class of customer for the products and services
l Methods used to distribute the products or provide the services, and
l Nature of the regulatory environment
Operating segments that meet the quantitative criteria as prescribed by AASB 8 are reported
separately. However, an operating segment that does not meet the quantitative criteria is still reported
separately where information about the segment would be useful to users of the financial statements.
Segment results include items directly attributable to a segment as well as those that can be allocated
on a reasonable basis. Unallocated items mainly comprise corporate assets, head office expenses,
and income tax assets and liabilities. Capital expenditure consists of additions of property, plant and
equipment and intangible assets.
2.6 Foreign currency translation
(a) Functional and presentation currency
The presentation currency of Zicom Group Limited is Singapore dollars (S$). Each subsidiary
in the Group determines its own functional currency and items included in the financial
statements of each subsidiary company are measured using that functional currency.For
per
sona
l use
onl
y
42Z i c o m G r o u p L i m i t e d
Notes to the Consolidated Financial Statements (In Singapore dollars)
2. Summary of significant accounting policies (cont’d)
2.6 Foreign currency translation (cont’d)
(b) Transactions and balances
Transactions in foreign currencies are initially recorded by the Group’s entities at their respective
functional currency spot rates ruling at the transaction dates. Monetary assets and liabilities
denominated in foreign currencies are translated at the rate of exchange ruling at the reporting
date. Non-monetary items that are measured in terms of historical cost in a foreign currency
are translated using the exchange rates as at the dates of the initial transaction. Non-monetary
items measured at fair value in a foreign currency are translated using the exchange rates at the
date when the fair value is determined.
Differences arising on the settlement or translation of monetary items are recognised in profit
or loss except for exchange differences arising on monetary items that form part of the Group’s
net investment in foreign operations. These are recognised initially in other comprehensive
income and accumulated under foreign currency translation reserve in equity, until the net
investment is disposed of, at which time, the cumulative amount is reclassified from equity to
profit or loss.
(c) Consolidated financial statements
On consolidation, the results and balance sheet of foreign operations are translated into
Singapore dollars using the following procedures:
l Assets and liabilities are translated at the closing rate prevailing at the reporting date;
and
l Income and expenses are translated at average exchange rate for the year, which
approximates the exchange rates at the dates of the transactions.
The exchange differences arising on the translation are recognised in other comprehensive
income. On disposal of a foreign operation, the component of other comprehensive income
relating to that particular foreign operation is recognised in profit or loss.
2.7 Property, plant and equipment
All items of property, plant and equipment are initially recorded at cost. The cost of an item of
property, plant and equipment is recognised as an asset if, and only if, it is probable that future
economic benefits associated with the item will flow to the Group and the cost of the item can be
measured reliably. Such cost includes the cost of replacing part of the property, plant and equipment
and borrowing costs for long-term construction projects if the recognition criteria are met. When
significant parts of property, plant and equipment are required to be replaced at intervals, the Group
depreciates them separately based on their specific useful lives. Likewise, when a major inspection is
performed, its costs is recognised in the carrying amount of the plant and equipment as a replacement
if the recognition criteria are satisfied. All other repair and maintenance costs are recognised in profit
or loss as incurred.
For
per
sona
l use
onl
y
A N N U A L R E P O R T 2 0 1 5 43
Notes to the Consolidated Financial Statements (In Singapore dollars)
2. Summary of significant accounting policies (cont’d)
2.7 Property, plant and equipment (cont’d)
Subsequent to recognition, property, plant and equipment are measured at cost less accumulated
depreciation and accumulated impairment losses.
Freehold land has an unlimited useful life and is therefore not depreciated. Depreciation of an asset
begins when it is available for use and is computed on the straight-line basis over the estimated useful
lives of the assets as follows:
Leasehold buildings over remaining period of the lease expiring years 2036 to 2042
Buildings 20 years
Machinery 10 years
Office furniture and equipment 5 years
Leasehold improvements 5 years
Motor vehicles 5 years
Computers 1 year
Machinery under installation are not depreciated as these assets are not yet available for use.
The carrying values of property, plant and equipment are reviewed for impairment when events or
changes in circumstances indicate that the carrying value may not be recoverable.
The residual value, useful life and depreciation method are reviewed at each financial year-end and
adjusted prospectively, if appropriate.
An item of property, plant and equipment is derecognised upon disposal or when no future economic
benefits are expected from its use. Any gain or loss on derecognition of the asset is included in profit or
loss in the year the asset is derecognised.
2.8 Intangible assets
Intangible assets acquired separately are measured on initial recognition at cost. The cost of an
intangible asset acquired in a business combination is its fair value as at the date of acquisition.
Following initial recognition, intangible assets are carried at cost less any accumulated amortisation
and any accumulated impairment losses. Internally generated intangibles, excluding capitalised
development and computer software costs, are not capitalised and the related expenditure is
recognised in profit or loss in the period in which such expenditure is incurred.
The useful lives of intangible assets are assessed to be either finite or indefinite.
Intangible assets with finite lives are amortised over their useful economic lives and assessed
for impairment whenever there is an indication that the intangible asset may be impaired. The
amortisation period and the amortisation method are reviewed at least at each financial year-
end. Changes in expected useful life or the expected pattern of consumption of future economic
benefits embodied in the asset are accounted for by changing the amortisation period or method, as
appropriate, and are treated as changes in accounting estimates and adjusted on a prospective basis.
For
per
sona
l use
onl
y
44Z i c o m G r o u p L i m i t e d
Notes to the Consolidated Financial Statements (In Singapore dollars)
2. Summary of significant accounting policies (cont’d)
2.8 Intangible assets (cont’d)
Intangible assets with indefinite useful lives or not yet available for use are not amortised, but are tested for impairment annually or more frequently if the events and circumstances indicate that the carrying value may be impaired either individually or at the cash-generating unit level. The assessment of indefinite useful life is reviewed annually to determine whether it continues to be supportable. If not, the change in useful life from indefinite to finite is made on a prospective basis.
Amortisation is calculated on a straight-line basis over the estimated useful lives of intangible assets as follows:
Computer software 5 years
Customer list 8 years
Developed technology 7 years
Development expenditure 5 – 10 years
Patented technology 10 – 20 years
Unpatented technology 7 – 14 years
Research and development costs
Research costs are expensed as incurred. Development expenditure on an individual project is recognised as an intangible asset only when the Group can demonstrate the technical feasibility of completing the intangible asset so that it will be available for use or sale, its intention to complete and its ability to use or sell the asset, how the asset will generate future economic benefits, the availability of resources to complete and the ability to measure reliably the expenditure during the development. Amortisation begins when the development is complete and the asset is available for use or sale. Any expenditure so capitalised is amortised over the period of expected benefit from the related project. During the period of development, the asset is tested for impairment annually.
Club membership
Club membership was acquired separately and is not amortised as it has an indefinite life.
Gains or losses from derecognition of an intangible asset are measured as the difference between the net disposal proceeds and the carrying amount of the asset and are recognised in profit or loss.
2.9 Impairment of non-financial assets
The Group assesses at each reporting date whether there is an indication that an asset may be impaired. If any indication exists, or when annual impairment testing for an asset is required, the Group estimates the asset’s recoverable amount.
An asset’s recoverable amount is the higher of an asset’s or cash-generating unit’s fair value less costs to sell and its value in use and is determined for an individual asset, unless the asset does not generate cash inflows that are largely independent of those from other assets or groups of assets. In assessing value in use, the estimated future cash flows are discounted to their present value using a pre-tax discount rate that reflects current market assessments of the time value of money and the risks specific to the asset. In determining fair value less cost to sell, recent market transactions are taken into account, if available. If no such transaction can be identified, an appropriate valuation model is used. These calculations are corroborated by valuation multiples, quoted share prices for publicly traded companies or other available fair value indicators. Where the carrying amount of an asset exceeds its recoverable amount, the asset is considered impaired and is written down to its recoverable amount. Impairment losses are recognised in profit or loss.
For
per
sona
l use
onl
y
A N N U A L R E P O R T 2 0 1 5 45
Notes to the Consolidated Financial Statements (In Singapore dollars)
2. Summary of significant accounting policies (cont’d)
2.9 Impairment of non-financial assets (cont’d)
The Group bases its impairment calculation on detailed budgets and forecast calculations which are
prepared separately for each of the Group’s cash-generating units to which the individual assets are
allocated. These budgets and forecast calculations are generally covering a period of five years. For
longer periods, a long-term growth rate is calculated and applied to project future cash flows after the
fifth year.
An assessment is made at each reporting date as to whether there is any indication that previously
recognised impairment losses for an asset other than goodwill may no longer exist or may have
decreased. If such indication exists, the recoverable amount is estimated. A previously recognised
impairment loss is reversed only if there has been a change in the assumptions used to determine
the asset’s recoverable amount since the last impairment loss was recognised. If that is the case,
the carrying amount of the asset is increased to its recoverable amount. That increased amount
cannot exceed the carrying amount that would have been determined, net of depreciation, had no
impairment loss been recognised for the asset in prior years. Reversal of an impairment loss is
recognised in profit or loss.
2.10 Associates
An associate is an entity over which the Group has power to participate in the financial and operating
policy decisions of the investee but does not have control or joint control over those policies.
The Group account for its investments in associates using the equity method from the date it becomes
an associate.
On acquisition of the investment, any excess of the cost of investment over the Group’s share of the
net fair value of the investee’s identifiable assets and liabilities is accounted for as goodwill and is
included in the carrying amount of the investment. Such goodwill is neither amortised nor tested for
impairment. Any excess of the Group’s share of the net fair value of the investee’s identifiable assets
and liabilities over the cost of investment is included as income in the determination of the entity’s
share of result of associate in the period in which the investment is acquired.
Under the equity method, investment in associate is carried in the balance sheet at cost plus post-
acquisition changes in the Group’s share of net assets of the associate. The profit or loss reflects the
Group’s share of the results of operations of the associate. Where there has been a change recognised
in other comprehensive income by the associate, the Group recognises its share of such changes in
other comprehensive income. Unrealised gains and losses resulting from transactions between the
Group and the associate are eliminated to the extent of the interest in the associate.
When the Group’s share of losses in an associate equals or exceeds its interest in the associate, the
Group does not recognise further losses, unless it has incurred obligations or made payments on behalf
of the associate.
After application of the equity method, the Group determines whether it is necessary to recognise an
additional impairment loss on its investment in its associate. The Group determines at each reporting
date whether there is any objective evidence that the investment in the associate is impaired. If this is
the case, the Group calculates the amount of impairment as the difference between the recoverable
amount of the associate and its carrying value and recognises the loss as “share of results of
associates” in profit or loss.
For
per
sona
l use
onl
y
46Z i c o m G r o u p L i m i t e d
Notes to the Consolidated Financial Statements (In Singapore dollars)
2. Summary of significant accounting policies (cont’d)
2.10 Associates (cont’d)
The financial statements of the associates are prepared for the same reporting period as the Group. Where necessary, adjustments are made to bring the accounting policies in line with those of the Group.
Upon loss of significant influence over the associate, the Group measures and recognises any retained investment at its fair value. Any difference between the aggregate of fair value of the retained interest and proceeds from disposal and the carrying amount of the investment at the date the equity method was discontinued is recognised in profit or loss.
2.11 Financial Instrument – Initial recognition and subsequent measurement
A financial instrument is any contract that gives rise to a financial asset of one entity and a financial liability or equity instrument of another entity.
(i) Financial assets
Initial recognition and measurement
Financial assets are classified, at initial recognition, as financial assets at fair value through profit or loss, loans and receivables, held-to-maturity investments, available-for-sale financial assets, or as derivatives designated as hedging instruments in an effective hedge, as appropriate.
All financial assets are recognised initially at fair value plus, in the case of financial assets not subsequently measured at fair value through profit or loss, transaction costs that are attributable to the acquisition of the financial asset.
Purchases or sales of financial assets that require delivery of assets within a time frame established by regulation or convention in the market place (regular way trades) are recognised on the trade date i.e., the date that the Group commits to purchase or sell the asset.
Subsequent measurement
For purpose of subsequent measurement, financial assets are classified in four categories:
l Financial assets at fair value through profit or lossl Loan and receivablesl Held-to-maturity investmentsl Available-for-sale financial assets
(a) Financial assets at fair value through profit or loss
Financial assets at fair value through profit or loss include financial assets held for trading and financial assets designated upon initial recognition at fair value through profit or loss. Financial assets are classified as held for trading if they are acquired for the purpose of selling or repurchasing in the near term. Derivatives, including separated embedded derivatives are also classified as held for trading unless they are designated as effective hedging instruments as defined by AASB 139.
The Group has not designated any financial assets at fair value though profit or loss. Financial assets at fair value through profit or loss are carried at fair value with net changes in fair value presented as finance costs or interest income in profit or loss.
For
per
sona
l use
onl
y
A N N U A L R E P O R T 2 0 1 5 47
Notes to the Consolidated Financial Statements (In Singapore dollars)
2. Summary of significant accounting policies (cont’d)
2.11 Financial Instrument – Initial recognition and subsequent measurement (cont’d)
(i) Financial assets (cont’d)
Subsequent measurement (cont’d)
(b) Loans and receivables
This category is the most relevant to the Group. Loan and receivables are non-derivative
financial assets with fixed or determinable payments that are not quoted in an active
market. After initial measurement, such financial assets are subsequently measured
at amortised cost using the effective interest rate method, less impairment. Gains and
losses are recognised in profit or loss when the loans and receivables are derecognised or
impaired, and through the amortisation process.
(c) Held-to-maturity investment
Non-derivative financial assets with fixed or determinable payments and fixed maturities
are classified as held-to-maturity when the Group has the positive intention and ability
to hold them to maturity. After initial measurement, held-to-maturity investments are
measures at amortised cost using the effective interest rate method, less impairment.
The Group did not have any held-to-maturity investments during the years ended
30 June 2015 and 2014.
(d) Available-for-sale (AFS) financial assets
AFS financial assets include equity investments and debt securities. Equity investments
classified as AFS are those that are neither classified as held for trading nor designated
at fair value through profit and loss. Debt securities in this category are those that are
intended to be held for an indefinite period of time and that may be sold in response to
needs for liquidity or changes in market conditions.
After initial measurement, AFS financial assets are subsequently measured at fair value
with unrealised gains or losses recognised as other comprehensive income and credited
in the AFS reserve until the investment is derecognised, at which time the cumulative
gain or loss is recognised in other operating income, or the investment is determined to
be impaired, when the cumulative loss is reclassified from the AFS reserve to profit or
loss. Interest earned while holding AFS financial assets is reported as interest income
using the effective interest rate method.
Investments in equity instruments whose fair value cannot be reliably measured are
measured at cost less impairment loss.For
per
sona
l use
onl
y
48Z i c o m G r o u p L i m i t e d
Notes to the Consolidated Financial Statements (In Singapore dollars)
2. Summary of significant accounting policies (cont’d)
2.11 Financial Instrument – Initial recognition and subsequent measurement (cont’d)
(i) Financial assets (cont’d)
Derecognition
A financial asset is derecognised where the contractual right to receive cash flows from the
asset has expired. On derecognition of a financial asset in its entirety, the difference between
the carrying amount and the sum of the consideration received and any cumulative gain or loss
that has been recognised in other comprehensive income is recognised in profit or loss.
(ii) Impairment of financial assets
The Group assesses, at each reporting date, whether there is objective evidence that a financial
asset or group of financial assets is impaired. An impairment exist if one or more events that
has occurred since the initial recognition of the asset (an incurred ‘loss event’) has an impact
on the estimated future cash flows of the financial asset or the group of financial assets that
can be reliably estimated. Evidence of impairment may include indications that the debtor
or a group of debtors is experiencing significant financial difficulty, default or delinquency in
interest or principal payments, the probability that they will enter bankruptcy or other financial
reorganisation and observable data indicating that there is a measurable decrease in the
estimated future cash flows, such as changes in arrears or economic conditions that correlate
with defaults.
For financial assets carried at amortised cost, the Group first assesses whether impairment
exists individually for financial assets that are individually significant, or collectively for financial
assets that are not individually significant. If the Group determines that no objective evidence
of impairment exists for an individually assessed financial asset, whether significant or not,
it includes the asset in a group of financial asset with similar credit risk characteristics and
collectively assesses them for impairment. Assets that are individually assessed for impairment
and for which an impairment loss is, or continues to be, recognised are not included in a
collective assessment of impairment.
The amount of any impairment loss identified is measured as the difference between the
asset’s carrying amount and the present value of estimated future cash flows discounted at the
financial asset’s original effective interest rate.
The carrying amount of the asset is reduced through the use of an allowance account and
the loss is recognised in profit or loss. If, in a subsequent year, the amount of the estimated
impairment loss increases or decreases because of an event occurring after the impairment was
recognised, the previously recognised impairment loss is increased or reduced by adjusting the
allowance account. If a write-off is later recovered, the recovery is recognised in profit or loss.For
per
sona
l use
onl
y
A N N U A L R E P O R T 2 0 1 5 49
Notes to the Consolidated Financial Statements (In Singapore dollars)
2. Summary of significant accounting policies (cont’d)
2.11 Financial Instrument – Initial recognition and subsequent measurement (cont’d)
(iii) Financial liabilities
Initial recognition and measurement
Financial liabilities are classified, at initial recognition, as financial liabilities at fair value
through profit or loss, loans and borrowings, payables, or as derivatives designated as hedging
instruments in an effective hedge, as appropriate. All financial liabilities are recognised initially
at fair value and, in the case of loans and borrowings and payables, net of directly attributable
transaction costs.
The Group’s financial liabilities include trade and other payables, loans and borrowings,
including bank overdrafts and derivative financial instruments.
Subsequent measurement
The measurement of financial liabilities depends on their classification, as described below:
Financial liabilities at fair value through profit or loss
Financial liabilities at fair value through profit or loss include financial liabilities held for trading
and financial liabilities designated upon initial recognition as at fair value through profit or loss.
Financial liabilities are classified as held for trading if they are incurred for the purpose of
repurchasing in the near term. This category also includes derivative financial instruments
entered into by the Group that are not designated as hedging instruments in hedge
relationships as defined by AASB 139. Separated embedded derivatives are also classified as held
for trading unless they are designated as effective hedging instruments.
Gains or losses on liabilities held for trading are recognised in profit or loss.
Financial liabilities designated upon initial recognition at fair value through profit or loss are
designated at the initial date of recognition, and only if the criteria in AASB 139 are satisfied.
The Group has not designated any financial liability as at fair value through profit or loss.
Loans and borrowings
This is the category most relevant to the Group. After initial recognition, interest-bearing loans
and borrowings are subsequently measured at amortised cost using the effective interest rate
method. Gains and losses are recognised in profit or loss when the liabilities are derecognised as
well as through the amortisation process.
Derecognition
A financial liability is derecognised when the obligation under the liability is discharged or
cancelled, or expires. When an existing financial liability is replaced by another from the same
lender on substantially different terms, or the terms of an existing liability are substantially
modified, such an exchange or modification is treated as a derecognition of the original liability
and the recognition of a new liability. The difference in the respective carrying amounts is
recognised in profit or loss.
For
per
sona
l use
onl
y
50Z i c o m G r o u p L i m i t e d
Notes to the Consolidated Financial Statements (In Singapore dollars)
2. Summary of significant accounting policies (cont’d)
2.11 Financial Instrument – Initial recognition and subsequent measurement (cont’d)
(iv) Offsetting of financial instruments
Financial assets and financial liabilities are offset and the net amount is reported on the
balance sheet if there is a currently enforceable legal right to offset the recognised amounts
and there is an intention to settle on a net basis, to realise the assets and settle the liabilities
simultaneously.
2.12 Derivative financial instruments
The Group uses derivative financial instruments such as forward currency contracts to hedge its foreign
currency risks. Such derivative financial instruments are initially recognised at fair value on the date on
which a derivative contract is entered into and are subsequently remeasured at fair value. Derivatives
are carried as financial assets when the fair value is positive and as financial liabilities when the fair
value is negative.
Any gains or losses arising from changes in fair value of derivatives are taken directly to profit or loss.
2.13 Cash and cash equivalents
Cash and cash equivalents comprise cash on hand, demand deposits, and short-term, highly liquid
investments that are readily convertible to known amounts of cash and which are subject to an
insignificant risk of changes in value. These also include bank overdrafts which forms an integral part
of the Group’s cash management. Bank overdrafts are included within interest-bearing liabilities under
current liabilities on the balance sheet.
2.14 Inventories
Inventories are stated at the lower of cost and net realisable value. Costs incurred in bringing the
inventories to their present location and condition are accounted for as follows:
l Raw materials and trading stocks: purchase costs on a first-in first-out basis; and
l Finished goods and work-in-progress: costs of direct materials and labour and a proportion of
manufacturing overheads based on normal operating capacity. These costs are assigned on a
first-in first-out basis.
When necessary, allowance is provided for damaged, obsolete and slow moving items to adjust the
carrying value of inventories to the lower of cost and net realisable value.
Net realisable value is the estimated selling price in the ordinary course of business less estimated
costs of completion and the estimated costs necessary to make the sale.For
per
sona
l use
onl
y
A N N U A L R E P O R T 2 0 1 5 51
Notes to the Consolidated Financial Statements (In Singapore dollars)
2. Summary of significant accounting policies (cont’d)
2.15 Construction contracts
The Group principally operates fixed price contracts. Contract revenue and contract costs are
recognised as revenue and expenses, respectively, by reference to the stage of completion of the
contract activity at the reporting date, when the outcome of a construction contract can be estimated
reliably.
The outcome of a construction contract can be estimated reliably when (i) total contract revenue can
be measured reliably; (ii) it is probable that the economic benefits associated with the contract will
flow to the entity; (iii) the costs to complete the contract and the stage of completion can be measured
reliably; and (iv) the contract costs attributable to the contract can be clearly identified and measured
reliably so that the actual costs incurred can be compared with prior estimates.
Where the contract outcome cannot be measured reliably (principally during the early stages of a
contract), both contract revenue and expenses are not recognised until the contract outcome can be
estimated reliably.
The stage of completion is measured by the proportion that contract costs incurred to date bear to the
estimated total contract cost. Only costs that reflect services performed are included in the estimated
total costs of the contract.
An expected loss on the construction contract is recognised as an expense immediately when it is
probable that total contract costs will exceed total contract revenue.
2.16 Fair value measurement
The Group measures financial instruments, such as forward currency options, at fair value at the
reporting date.
Fair value is the price that would be received to sell an asset or paid to transfer a liability in an orderly
transaction between market participants at the measurement date. The fair value measurement is
based on the presumption that the transaction to sell the asset or transfer the liability takes place
either:
i) In the principal market for the asset or liability, or
ii) In the absence of a principal market, in the most advantageous market for the asset or liability
The principal or the most advantageous market must be accessible by the Group.
The fair value of an asset or liability is measured using the assumptions that the market participants
would use when pricing the asset or liability, assuming that the market participants act in their
economic best interest.
A fair value measurement of a non-financial asset takes into account a market participant’s ability
to generate economic benefits by using the asset in its highest and best use by selling it to another
market participant that would use the asset in its highest and best use.
For
per
sona
l use
onl
y
52Z i c o m G r o u p L i m i t e d
Notes to the Consolidated Financial Statements (In Singapore dollars)
2. Summary of significant accounting policies (cont’d)
2.16 Fair value measurement (cont’d)
The Group uses valuation techniques that are appropriate in the circumstances and for which
sufficient data are available to measure fair value, maximising the use of relevant observable inputs
and minimising the use of unobservable inputs.
All assets and liabilities for which fair value is measured or disclosed in the financial statements are
categorised within the fair value hierarchy, described as follows, based on the lowest level input that is
significant to the fair value measurement as a whole:
l Level 1 – Quoted (unadjusted) market prices in active markets for identical assets or liabilities
l Level 2 – Valuation techniques for which the lowest level input that is significant to the fair
value measurement is directly or indirectly observable
l Level 3 – Valuation techniques for which the lowest level input that is significant to the fair
value measurement is unobservable
For assets and liabilities that are recognised in the financial statements on a recurring basis, the
Group determines whether transfers have occurred between levels in the hierarchy by re-assessing
categorisation (based on the lowest level of input that is significant to the fair value measurement as a
whole) at the end of each reporting period.
2.17 Provisions
General
Provisions are recognised when the Group has a present obligation (legal or constructive) as a result
of a past event, and it is probable that an outflow of resources embodying economic benefits will be
required to settle the obligation and the amount of the obligation can be estimated reliably.
Provisions are reviewed at each reporting date and adjusted to reflect the current best estimate. If it
is no longer probable that an outflow of economic resources will be required to settle the obligation,
the provision is reversed. If the effect of the time value of money is material, provisions are discounted
using a current pre-tax rate that reflects, when appropriate, the risks specific to the liability. When
discounting is used, the increase in the provision due to the passage of time is recognised as a finance
cost.
Warranty provisions
Provisions for warranty-related costs are recognised when the product is sold or service provided. Initial
recognition is based on historical experience. The initial estimate of warranty-related costs is reviewed
annually and revised, if necessary.
Wages and salaries, annual leave
Liabilities for wages and salaries, including annual leave expected to be settled within 12 months of
the reporting date are recognised in respect of employees’ services rendered up to the reporting date
and measured at the amounts expected to be paid when liabilities are settled.
For
per
sona
l use
onl
y
A N N U A L R E P O R T 2 0 1 5 53
Notes to the Consolidated Financial Statements (In Singapore dollars)
2. Summary of significant accounting policies (cont’d)
2.17 Provisions (cont’d)
Long service leave / retirement benefits
The liabilities for long service leave and retirement benefits, applicable to Australian and Thailand
subsidiaries respectively, are recognised in the provision for employee benefits and measured at the
present value of expected future payments to be made in respect of services provided by employees
up to the reporting date. Consideration is given to expected future wage and salary levels, experience
of employee departures and periods of service. Expected future payments are discounted using market
yields at the reporting date on national government bonds and corporate bond rates with terms to
maturity and currencies that match, as closely as possible, the estimated future cash outflows.
2.18 Government grants
Government grants are recognised where there is reasonable assurance that the grant will be received
and all attaching conditions will be complied with. When the grant relates to an expense item, it
is recognised as income on a systematic basis over the period that the related costs, for which it is
intended to compensate, are expensed. Where the grant relates to an asset, it is deducted in arriving at
the carrying amount of the asset.
2.19 Borrowing costs
Borrowing costs directly attributable to the acquisition, construction or production of an asset that
necessarily takes a substantial period of time to get ready for its intended use or sale are capitalised
as part of the cost of the asset. Capitalisation of borrowing costs commences when the activities to
prepare the asset for its intended use or sale are in progress and the expenditure and borrowing costs
are incurred. Borrowing costs are capitalised until the asset is substantially completed for its intended
use or sale. All other borrowing costs are expensed in the period in which they occur. Borrowing costs
consist of interest and other costs that an entity incurs in connection with the borrowing of funds.
2.20 Leases
The determination of whether an arrangement is, or contains a lease is based on the substance of the
arrangement at the inception of the lease. The arrangement is, or contains, a lease if fulfilment of the
arrangement is dependent on the use of a specific asset or assets or the arrangement conveys a right
to use the asset or assets, even if that right is not explicitly specified in the arrangement.
Group as a lessee
A lease is classified at the inception date as a finance lease or an operating lease. A lease that transfers
substantially all the risks and rewards incidental to ownership to the Group is classified as a finance
lease. An operating lease is a lease other than a finance lease.
Finance leases are capitalised at the commencement of the lease at the inception date at the fair value
of the leased asset or, if lower, at the present value of the minimum lease payments. Lease payments
are apportioned between the finance charges and reduction of the lease liability so as to achieve a
constant rate of interest on the remaining balance of the liability. Finance charges are charged to profit
or loss.
For
per
sona
l use
onl
y
54Z i c o m G r o u p L i m i t e d
Notes to the Consolidated Financial Statements (In Singapore dollars)
2. Summary of significant accounting policies (cont’d)
2.20 Leases (cont’d)
Group as a lessee (cont’d)
Capitalised leased assets are depreciated over the shorter of the estimated useful life of the asset or
the lease term if there is no reasonable certainty that the Group will obtain ownership by the end of
the lease term.
Operating lease payments are recognised as an expense in profit or loss on a straight-line basis over
the lease term.
Group as a lessor
Leases where the Group transfers substantially all the risks and rewards of ownership of the leased
asset is accounted for in accordance with the Group’s policy for sale of goods as set out in note 2.22.
Costs incurred in connection with negotiating and arranging the finance lease are recognised as an
expense when the selling profit is recognised.
Leases where the Group retains substantially all the risks and rewards of ownership of the asset are
classified as operating leases. Initial direct costs incurred in negotiating an operating lease are added to
the carrying amount of the leased asset and recognised over the lease term on the same basis as rental
income. The accounting policy for rental income is set out in note 2.22.
2.21 Employee benefits
(a) Defined contribution plans
The Group makes contributions to national pension schemes as defined by the laws of the
countries in which it has operations.
Contributions are made by the Group, for its Australian subsidiaries, to employee accumulation
superannuation funds.
The Group’s companies in Singapore make contributions to the Central Provident Fund scheme,
a defined contribution pension scheme.
The subsidiary company incorporated and operating in the People’s Republic of China (“PRC”)
is required to provide certain staff pension benefits to its employees under existing PRC
regulations. Pension contributions are provided at rates stipulated by PRC regulators and are
contributed to a pension fund managed by government agencies, which are responsible for
administering these amounts for the subsidiary’s employees.
Contributions to defined contribution pension schemes are recognised as an expense in the year
in which the related service is performed.For
per
sona
l use
onl
y
A N N U A L R E P O R T 2 0 1 5 55
Notes to the Consolidated Financial Statements (In Singapore dollars)
2. Summary of significant accounting policies (cont’d)
2.21 Employee benefits (cont’d)
(b) Employee share option plan
Employees (including key management personnel) of the Group receive remuneration in the
form of share options as consideration for service rendered. The cost of these equity-settled
share-based payment transactions with employees is measured by reference to the fair value
of the options at the date when the grant is made using an appropriate valuation model.
This cost is recognised in profit or loss, with a corresponding increase in the share-based
payments reserve, over the period in which service conditions are fulfilled (“vesting period”).
The cumulative expense recognised at each reporting date until the vesting date reflects the
extent to which the vesting period has expired and the Group’s best estimate of the number
of options that will ultimately vest. The charge or credit to profit or loss for a period represents
the movement in cumulative expense recognised as at beginning and end of that period and is
recognised in employee costs.
No expense is recognised for options that do not ultimately vest. The share-based payments
reserve is transferred to retained earnings upon expiry or forfeiture of the share options after its
vesting date. When the options are exercised, the share-based payments reserve is transferred
to share capital as new shares are issued.
2.22 Revenue recognition
Revenue is recognised to the extent that it is probable that the economic benefits will flow to the
Group and the revenue can be reliably measured, regardless of when the payment is received. Revenue
is measured at the fair value of the consideration received or receivable, net of returns and allowances,
trade discounts and volume rebates, taking into account contractually defined terms of payment and
excluding taxes or duty. The Group has concluded that it is acting as a principal in all of its revenue
arrangements. The specific recognition criteria described below must also be met before revenue is
recognised.
Sale of goods
Revenue from the sale of goods is recognised when the significant risks and rewards of ownership
of the goods have passed to the buyer, usually on delivery of the goods. Revenue is not recognised
to the extent where there are significant uncertainties regarding recovery of the consideration due,
associated costs or the possible return of goods.
Rendering of services
Revenue from services rendered are recognised upon performance of services and the delivery to
customers.
Revenue recognised on projects
Revenue on projects are recognised using the percentage of completion method. The stage of
completion is measured using the proportion of costs incurred to the estimated total costs to complete
the project. Losses, if any, are immediately recognised when their existence is foreseen.
For
per
sona
l use
onl
y
56Z i c o m G r o u p L i m i t e d
Notes to the Consolidated Financial Statements (In Singapore dollars)
2. Summary of significant accounting policies (cont’d)
2.22 Revenue recognition (cont’d)
Interest income
Interest income is recognised using the effective interest rate.
Dividends
Dividend income is recognised when the Group’s right to receive payment is established, which is generally when shareholders approve the dividends.
Rental income
Rental income is accounted for on a straight-line basis over the lease terms. The aggregate cost of incentives provided to lessees is recognised as a reduction of rental income over the lease term on a straight-line basis.
Commission income
Commission for services rendered is recognised on an accrual basis.
2.23 Taxation
(a) Current income tax
Current income tax assets and liabilities for the current and prior periods are measured at the amount expected to be recovered from or paid to the taxation authorities. The tax rates and tax laws used to compute the amount are those that are enacted or substantively enacted at the reporting date, in the countries where the Group operates and generates taxable income.
Current income taxes are recognised in profit or loss except to the extent that the tax relates to items recognised outside profit or loss, either in other comprehensive income or directly in equity. Management periodically evaluates positions taken in the tax returns with respect to situations in which applicable tax regulations are subject to interpretation and establishes provisions where appropriate.
(b) Deferred tax
Deferred tax is provided using the liability method on temporary differences at the end of the reporting period between the tax bases of assets and liabilities and their carrying amounts for financial reporting purposes.
Deferred tax liabilities are recognised for all temporary differences, except:
- When the deferred tax liability arises from the initial recognition of goodwill or of an asset or liability in a transaction that is not a business combination and, at the time of the transaction, affects neither the accounting profit nor taxable profit or loss; and
- In respect of taxable temporary differences associated with investments in subsidiaries, associates and interests in joint arrangements, when the timing of the reversal of the temporary differences can be controlled and it is probable that the temporary differences will not reverse in the foreseeable future.
For
per
sona
l use
onl
y
A N N U A L R E P O R T 2 0 1 5 57
Notes to the Consolidated Financial Statements (In Singapore dollars)
2. Summary of significant accounting policies (cont’d)
2.23 Taxation (cont’d)
(b) Deferred tax (cont’d)
Deferred tax assets are recognised for all deductible temporary differences, carry forward of
unused tax credits and unused tax losses to the extent that it is probable that taxable profit
will be available against which the deductible temporary differences, and the carry forward of
unused tax credits and unused tax losses can be utilised except:
- When the deferred tax asset relating to the deductible temporary difference arises
from the initial recognition of an asset or liability in a transaction that is not a business
combination and, at the time of the transaction, affects neither the accounting profit nor
taxable profit or loss; and
- In respect of deductible temporary differences associated with investments in
subsidiaries, associates and interests in joint arrangements, deferred tax assets are
recognised only to the extent that it is probable that the temporary differences will
reverse in the foreseeable future and taxable profit will be available against which the
temporary differences can be utilised.
The carrying amount of deferred tax assets is reviewed at each reporting date and reduced to
the extent that it is no longer probable that sufficient taxable profit will be available to allow all
or part of the deferred tax asset to be utilised. Unrecognised deferred tax assets are reassessed
at each reporting date and are recognised to the extent that it has become probable that future
taxable profit will allow the deferred tax asset to be recovered.
Deferred tax assets and liabilities are measured at the tax rates that are expected to apply in
the year when the asset is realised or the liability is settled, based on tax rates and tax laws that
have been enacted or substantively enacted at the reporting date.
Deferred tax assets and deferred tax liabilities are offset, if a legally enforceable right exists to
set off current income tax assets against current income tax liabilities and the deferred taxes
relate to the same taxable entity and the same taxation authority.
(c) Goods and service tax
Revenues, expenses and assets are recognised net of the amount of goods and services tax
except:
- When the goods and services tax incurred on a sale or purchase of assets or services is
not payable to or recoverable from the taxation authority, in which case the goods and
services tax is recognised as part of the revenue or the expense item or part of the cost of
acquisition of the asset, as applicable; and
- When receivables and payables that are stated with the amount of goods and services
tax included.
The net amount of goods and services tax recoverable from, or payable to, the taxation
authority is included as part of receivables or payables on the balance sheet.
For
per
sona
l use
onl
y
58Z i c o m G r o u p L i m i t e d
Notes to the Consolidated Financial Statements (In Singapore dollars)
2. Summary of significant accounting policies (cont’d)
2.24 Share capital and share issuance expenses
Ordinary shares are classified as share capital in equity. Incremental costs directly attributable to the
issuance of new shares are deducted against share capital.
3. Significant accounting judgements, estimates and assumptions
The preparation of the Group’s consolidated financial statements requires management to make judgements,
estimates and assumptions that affect the reported amounts of revenues, expenses, assets and liabilities, and
disclosures made. Uncertainty about these assumptions and estimates could result in outcomes that require
a material adjustment to the carrying amount of the asset or liability affected in future periods.
(a) Judgements made in applying accounting policies
(i) Determination of control over investees
As at 30 June 2015, the Group holds 68.55% (2014: 46.49%) equity interest in Curiox Biosystems
Pte Ltd (“Curiox”) and 459,326 convertible loan stocks which could potentially convert into a
further 1.76% interest in Curiox but currently not exercisable. Although the Group holds the
majority of voting rights in Curiox, it has been assessed that the Group does not have the
practical ability to direct the relevant activities of Curiox unilaterally but has significant
influence over its financial and operating policy decisions. Hence, the investment in Curiox is
treated as an associate as opposed to being a subsidiary company.
As at 30 June 2015, the Group holds 4.1% equity interest in HistoIndex Pte Ltd (“HistoIndex”).
The Group considers HistoIndex as an associate as the Group has the ability to exercise
significant influence through both its shareholdings and the Chairman’s active participation on
HistoIndex Board of Directors.
(b) Key sources of estimation uncertainty
The key assumptions concerning the future and other key sources of estimation uncertainty at the
reporting date, that have a significant risk of causing a material adjustment to the carrying amounts of
assets and liabilities in future periods, are described below.
(i) Impairment of non-financial assets
The Group assesses whether there are any indicators of impairment for all non-financial assets
at each reporting date. Goodwill and other intangibles with indefinite lives are tested for
impairment annually and at other times when such indicators exist. Other non-financial assets
are tested for impairment when there are indicators that the carrying amounts may not be
recoverable.
When value in use calculations are undertaken, management must estimate the expected
future cash flows from the asset or cash-generating unit and choose a suitable discount rate in
order to calculate the present value of those cash flows. The key assumptions used to determine
the recoverable amount for the different cash generating units are disclosed in note 10 to the
financial statements.
For
per
sona
l use
onl
y
A N N U A L R E P O R T 2 0 1 5 59
Notes to the Consolidated Financial Statements (In Singapore dollars)
3. Significant accounting judgements, estimates and assumptions
(b) Key sources of estimation uncertainty (cont’d)
(ii) Impairment of loans and receivables
The Group assesses at the end of each reporting period whether there is any objective
evidence that a financial asset is impaired. To determine whether there is objective evidence
of impairment, the Group considers factors such as the probability of insolvency or significant
financial difficulties of the debtor and default or significant delay in payments.
Where there is objective evidence of impairment, the amount and timing of future cash
flows are estimated based on historical loss experience for assets with similar credit risk
characteristics. The carrying amount of the Group’s loans and receivable at the reporting date is
disclosed in note 21 to the financial statements.
(iii) Construction contracts
The Group recognises contract revenue by reference to the stage of completion of the contract
activity at the reporting date, when the outcome of a construction contract can be estimated
reliably. The stage of completion is measured by reference to the proportion that contract
costs incurred for work performed to date to the estimated total contract costs. Significant
assumptions are required to estimate the total contract costs which will affect the stage
of completion. In making these estimates, management has relied on past experience and
knowledge of the project engineers. The carrying amounts of assets and liabilities arising
from construction contracts at the balance sheet date are disclosed in note 15 to the financial
statements.
(iv) Development expenditure
The Group capitalises development expenditure in accordance with its accounting policy
as set out in note 2.8. Initial capitalisation of costs is based on management’s judgement
that technological and economic feasibility is confirmed. In determining the amount to be
capitalised, management makes assumptions regarding the expected future cash generation
of the project, discount rates to be applied and the expected period of benefits. As at 30 June
2015, the carrying amount of capitalised development expenditure was S$4,789,000 (2014:
S$3,754,000).
(v) Taxes
The Group has exposure to income taxes in numerous jurisdictions. Significant judgement
is involved in determining the provision for income taxes. The Group recognises liabilities for
expected tax issues based on estimates of whether additional taxes will be due. The Group
recognises deferred tax assets for all unused tax losses to the extent that it is probable that
taxable profit will be available against which the losses can be utilised. Significant judgement
is required to determine the amount of deferred tax assets that can be recognised, based on
likely timing and level of future taxable profits. Where the final tax outcome is different from
the amounts that were initially recognised, such differences will impact the income tax and
deferred tax provisions in the period in which such determination is made.
For
per
sona
l use
onl
y
60Z i c o m G r o u p L i m i t e d
Notes to the Consolidated Financial Statements (In Singapore dollars)
3. Significant accounting judgements, estimates and assumptions
(b) Key sources of estimation uncertainty (cont’d)
(v) Taxes (cont’d)
The carrying amount of the Group’s current tax payables and deferred tax liabilities at 30 June
2015 was S$252,000 (2014: S$336,000) and S$2,371,000 (2014: S$2,745,000) respectively. The
Group also has deferred tax assets of S$3,213,000 (2014: S$2,418,000) as at 30 June 2015.
4. Segment information
Businesssegments
Identification of reportable segments
The group has identified its operating segments based on internal reports that are reviewed and used by
the chief operating decision maker and the executive management team in assessing performance and in
determining the allocation of resources. The operating segments are identified based on products and
services as follows:
l Offshore Marine, Oil & Gas Machinery – manufacture and supply of deck machinery, gas metering
stations, gas processing plants, offshore structures for underwater robots and related equipment, parts
and services.
l Construction Equipment – manufacture and supply of concrete mixers and foundation equipment,
including equipment rental, parts and related services.
l Precision Engineering & Technologies – manufacture of precision and automation equipment, medtech
equipment and products, medtech translation and engineering services.
l Industrial & Mobile Hydraulics – supply of hydraulic drive systems, parts and services.
Inter-segment sales
Inter-segment sales are recognised based on internally set transfer price at arm’s length basis.
Unallocated revenue and expenses
Unallocated revenue comprises mainly non-segmental revenue. Unallocated expenses comprise mainly of
non-segmental expenses such as head office expenses.
For
per
sona
l use
onl
y
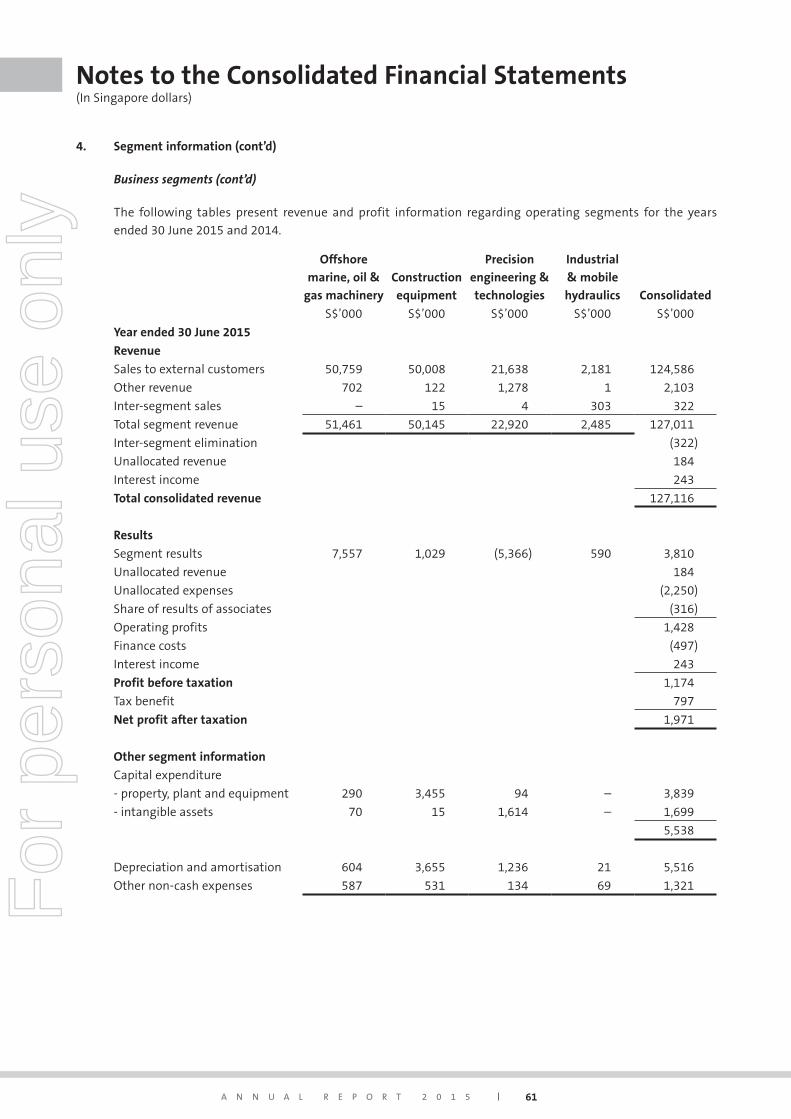
A N N U A L R E P O R T 2 0 1 5 61
Notes to the Consolidated Financial Statements (In Singapore dollars)
4. Segment information (cont’d)
Businesssegments(cont’d)
The following tables present revenue and profit information regarding operating segments for the years
ended 30 June 2015 and 2014.
Offshore
marine, oil &
gas machinery
Construction
equipment
Precision
engineering &
technologies
Industrial
& mobile
hydraulics Consolidated
S$’000 S$’000 S$’000 S$’000 S$’000
Year ended 30 June 2015
Revenue
Sales to external customers 50,759 50,008 21,638 2,181 124,586
Other revenue 702 122 1,278 1 2,103
Inter-segment sales – 15 4 303 322
Total segment revenue 51,461 50,145 22,920 2,485 127,011
Inter-segment elimination (322)
Unallocated revenue 184
Interest income 243
Total consolidated revenue 127,116
Results
Segment results 7,557 1,029 (5,366) 590 3,810
Unallocated revenue 184
Unallocated expenses (2,250)
Share of results of associates (316)
Operating profits 1,428
Finance costs (497)
Interest income 243
Profit before taxation 1,174
Tax benefit 797
Net profit after taxation 1,971
Other segment information
Capital expenditure
- property, plant and equipment 290 3,455 94 – 3,839
- intangible assets 70 15 1,614 – 1,699
5,538
Depreciation and amortisation 604 3,655 1,236 21 5,516
Other non-cash expenses 587 531 134 69 1,321For
per
sona
l use
onl
y
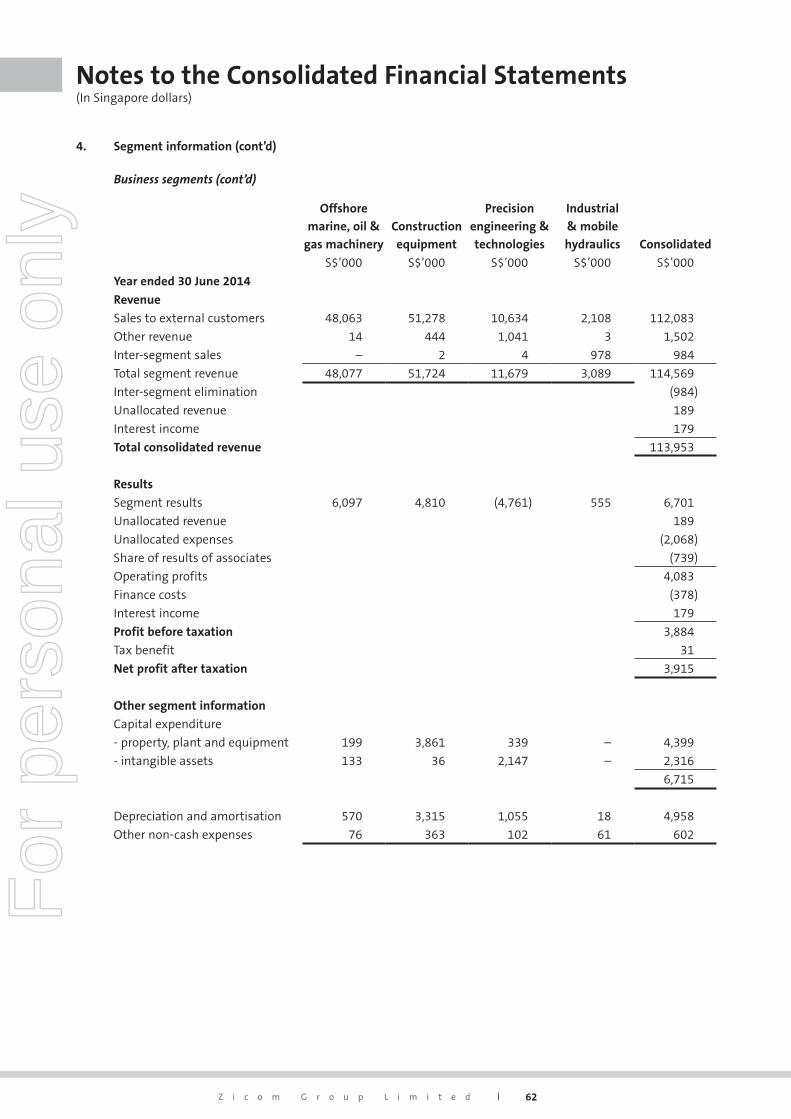
62Z i c o m G r o u p L i m i t e d
Notes to the Consolidated Financial Statements (In Singapore dollars)
4. Segment information (cont’d)
Businesssegments(cont’d)
Offshore
marine, oil &
gas machinery
Construction
equipment
Precision
engineering &
technologies
Industrial
& mobile
hydraulics Consolidated
S$’000 S$’000 S$’000 S$’000 S$’000
Year ended 30 June 2014
Revenue
Sales to external customers 48,063 51,278 10,634 2,108 112,083
Other revenue 14 444 1,041 3 1,502
Inter-segment sales – 2 4 978 984
Total segment revenue 48,077 51,724 11,679 3,089 114,569
Inter-segment elimination (984)
Unallocated revenue 189
Interest income 179
Total consolidated revenue 113,953
Results
Segment results 6,097 4,810 (4,761) 555 6,701
Unallocated revenue 189
Unallocated expenses (2,068)
Share of results of associates (739)
Operating profits 4,083
Finance costs (378)
Interest income 179
Profit before taxation 3,884
Tax benefit 31
Net profit after taxation 3,915
Other segment information
Capital expenditure
- property, plant and equipment 199 3,861 339 – 4,399
- intangible assets 133 36 2,147 – 2,316
6,715
Depreciation and amortisation 570 3,315 1,055 18 4,958
Other non-cash expenses 76 363 102 61 602
For
per
sona
l use
onl
y
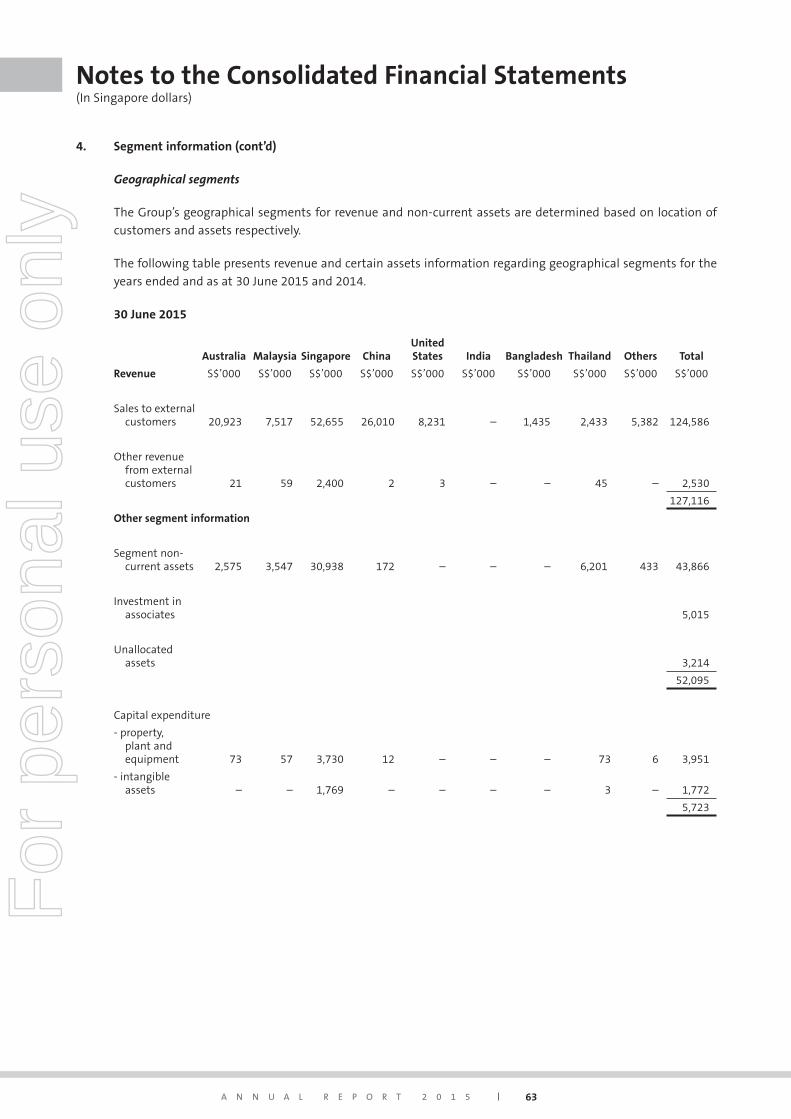
A N N U A L R E P O R T 2 0 1 5 63
Notes to the Consolidated Financial Statements (In Singapore dollars)
4. Segment information (cont’d)
Geographicalsegments
The Group’s geographical segments for revenue and non-current assets are determined based on location of
customers and assets respectively.
The following table presents revenue and certain assets information regarding geographical segments for the
years ended and as at 30 June 2015 and 2014.
30 June 2015
Australia Malaysia Singapore ChinaUnitedStates India Bangladesh Thailand Others Total
Revenue S$’000 S$’000 S$’000 S$’000 S$’000 S$’000 S$’000 S$’000 S$’000 S$’000
Sales to external customers 20,923 7,517 52,655 26,010 8,231 – 1,435 2,433 5,382 124,586
Other revenue from external customers 21 59 2,400 2 3 – – 45 – 2,530
127,116
Other segment information
Segment non-current assets 2,575 3,547 30,938 172 – – – 6,201 433 43,866
Investment in associates 5,015
Unallocated assets 3,214
52,095
Capital expenditure
- property, plant and equipment 73 57 3,730 12 – – – 73 6 3,951
- intangible assets – – 1,769 – – – – 3 – 1,772
5,723
For
per
sona
l use
onl
y
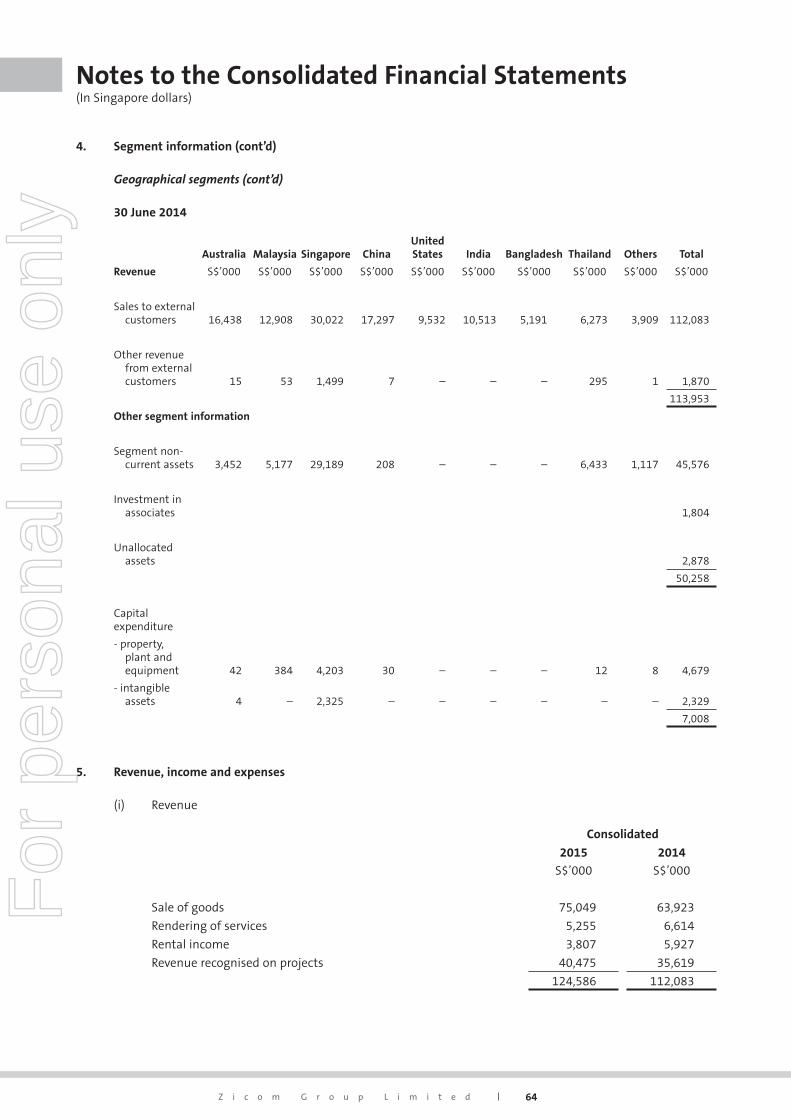
64Z i c o m G r o u p L i m i t e d
Notes to the Consolidated Financial Statements (In Singapore dollars)
4. Segment information (cont’d)
Geographicalsegments(cont’d)
30 June 2014
Australia Malaysia Singapore ChinaUnitedStates India Bangladesh Thailand Others Total
Revenue S$’000 S$’000 S$’000 S$’000 S$’000 S$’000 S$’000 S$’000 S$’000 S$’000
Sales to external customers 16,438 12,908 30,022 17,297 9,532 10,513 5,191 6,273 3,909 112,083
Other revenue from external customers 15 53 1,499 7 – – – 295 1 1,870
113,953
Other segment information
Segment non-current assets 3,452 5,177 29,189 208 – – – 6,433 1,117 45,576
Investment in associates 1,804
Unallocated assets 2,878
50,258
Capitalexpenditure
- property, plant and equipment 42 384 4,203 30 – – – 12 8 4,679
- intangible assets 4 – 2,325 – – – – – – 2,329
7,008
5. Revenue, income and expenses
(i) Revenue
Consolidated
2015
S$’000
2014
S$’000
Sale of goods 75,049 63,923
Rendering of services 5,255 6,614
Rental income 3,807 5,927
Revenue recognised on projects 40,475 35,619
124,586 112,083
For
per
sona
l use
onl
y
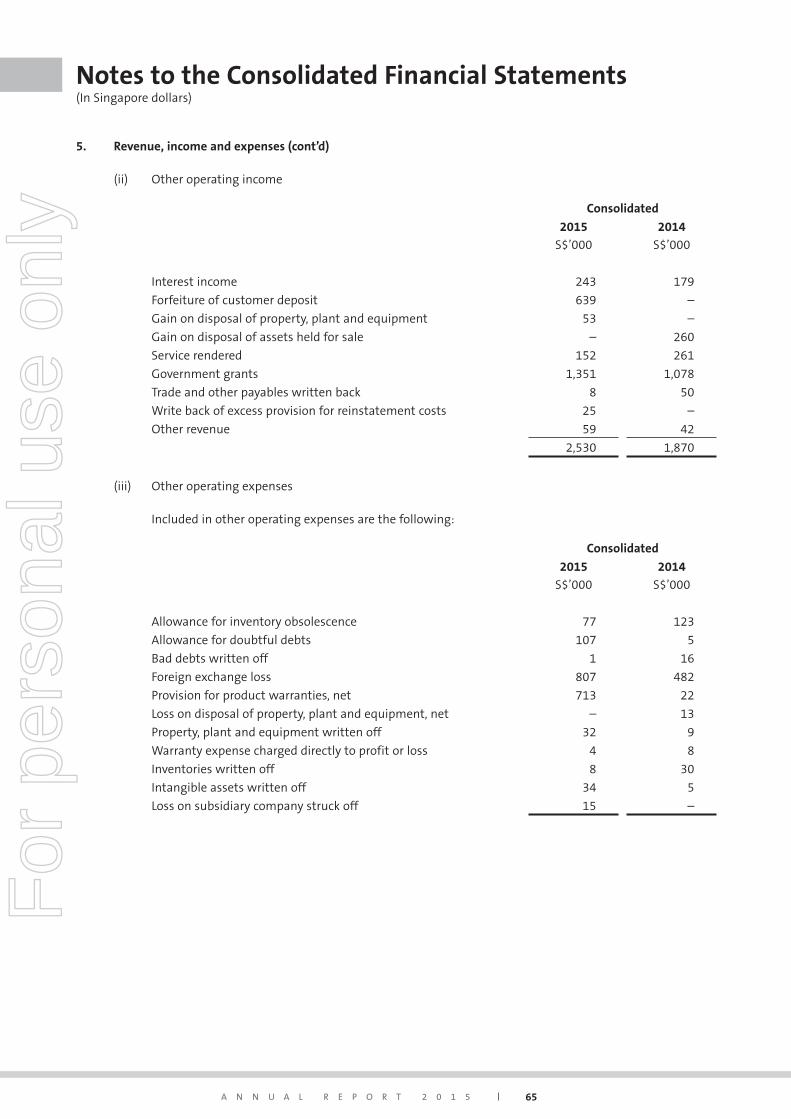
A N N U A L R E P O R T 2 0 1 5 65
Notes to the Consolidated Financial Statements (In Singapore dollars)
5. Revenue, income and expenses (cont’d)
(ii) Other operating income
Consolidated
2015
S$’000
2014
S$’000
Interest income 243 179
Forfeiture of customer deposit 639 –
Gain on disposal of property, plant and equipment 53 –
Gain on disposal of assets held for sale – 260
Service rendered 152 261
Government grants 1,351 1,078
Trade and other payables written back 8 50
Write back of excess provision for reinstatement costs 25 –
Other revenue 59 42
2,530 1,870
(iii) Other operating expenses
Included in other operating expenses are the following:
Consolidated
2015
S$’000
2014
S$’000
Allowance for inventory obsolescence 77 123
Allowance for doubtful debts 107 5
Bad debts written off 1 16
Foreign exchange loss 807 482
Provision for product warranties, net 713 22
Loss on disposal of property, plant and equipment, net – 13
Property, plant and equipment written off 32 9
Warranty expense charged directly to profit or loss 4 8
Inventories written off 8 30
Intangible assets written off 34 5
Loss on subsidiary company struck off 15 –
For
per
sona
l use
onl
y
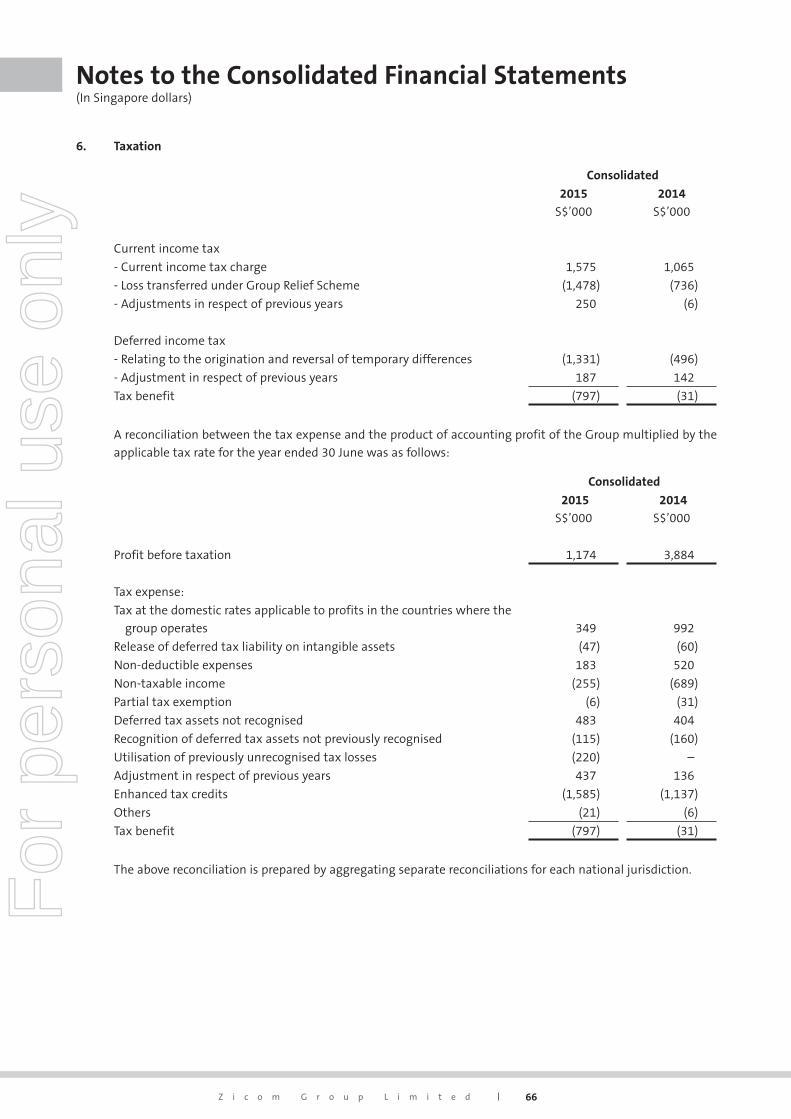
66Z i c o m G r o u p L i m i t e d
Notes to the Consolidated Financial Statements (In Singapore dollars)
6. Taxation
Consolidated
2015
S$’000
2014
S$’000
Current income tax
- Current income tax charge 1,575 1,065
- Loss transferred under Group Relief Scheme (1,478) (736)
- Adjustments in respect of previous years 250 (6)
Deferred income tax
- Relating to the origination and reversal of temporary differences (1,331) (496)
- Adjustment in respect of previous years 187 142
Tax benefit (797) (31)
A reconciliation between the tax expense and the product of accounting profit of the Group multiplied by the
applicable tax rate for the year ended 30 June was as follows:
Consolidated
2015
S$’000
2014
S$’000
Profit before taxation 1,174 3,884
Tax expense:
Tax at the domestic rates applicable to profits in the countries where the
group operates 349 992
Release of deferred tax liability on intangible assets (47) (60)
Non-deductible expenses 183 520
Non-taxable income (255) (689)
Partial tax exemption (6) (31)
Deferred tax assets not recognised 483 404
Recognition of deferred tax assets not previously recognised (115) (160)
Utilisation of previously unrecognised tax losses (220) –
Adjustment in respect of previous years 437 136
Enhanced tax credits (1,585) (1,137)
Others (21) (6)
Tax benefit (797) (31)
The above reconciliation is prepared by aggregating separate reconciliations for each national jurisdiction.
For
per
sona
l use
onl
y
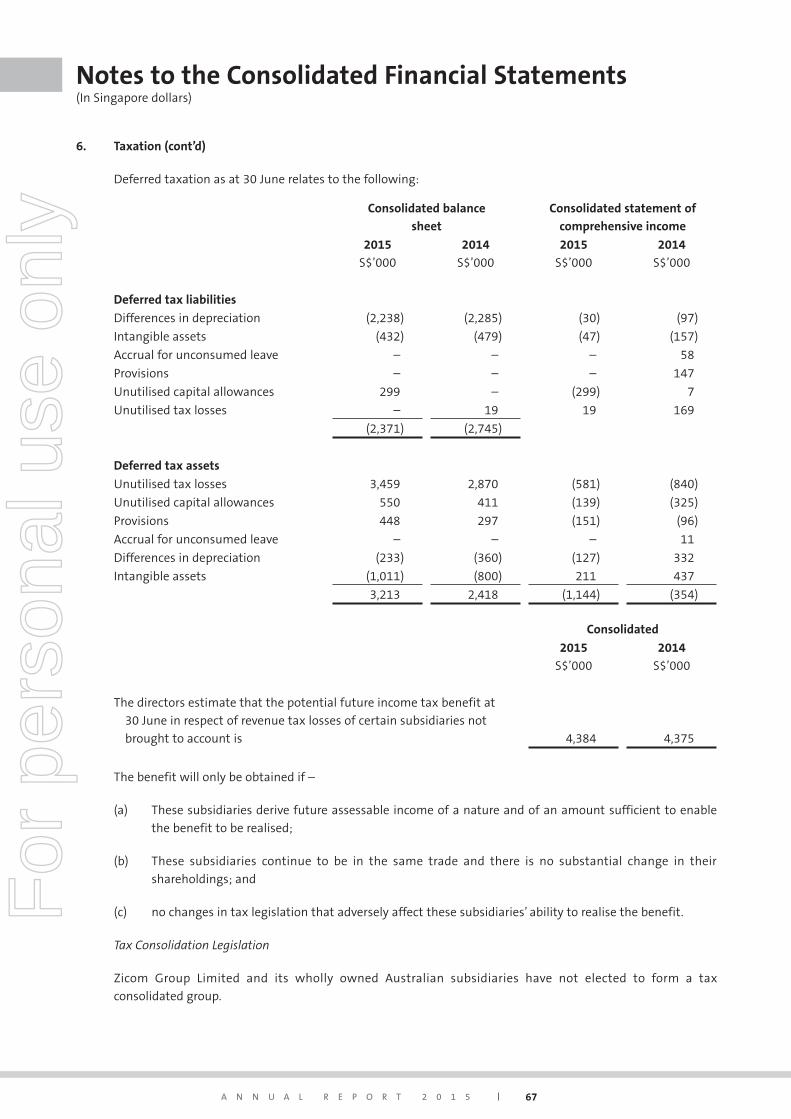
A N N U A L R E P O R T 2 0 1 5 67
Notes to the Consolidated Financial Statements (In Singapore dollars)
6. Taxation (cont’d)
Deferred taxation as at 30 June relates to the following:
Consolidated balance
sheet
Consolidated statement of
comprehensive income
2015
S$’000
2014
S$’000
2015
S$’000
2014
S$’000
Deferred tax liabilities
Differences in depreciation (2,238) (2,285) (30) (97)
Intangible assets (432) (479) (47) (157)
Accrual for unconsumed leave – – – 58
Provisions – – – 147
Unutilised capital allowances 299 – (299) 7
Unutilised tax losses – 19 19 169
(2,371) (2,745)
Deferred tax assets
Unutilised tax losses 3,459 2,870 (581) (840)
Unutilised capital allowances 550 411 (139) (325)
Provisions 448 297 (151) (96)
Accrual for unconsumed leave – – – 11
Differences in depreciation (233) (360) (127) 332
Intangible assets (1,011) (800) 211 437
3,213 2,418 (1,144) (354)
Consolidated
2015
S$’000
2014
S$’000
The directors estimate that the potential future income tax benefit at
30 June in respect of revenue tax losses of certain subsidiaries not
brought to account is 4,384 4,375
The benefit will only be obtained if –
(a) These subsidiaries derive future assessable income of a nature and of an amount sufficient to enable
the benefit to be realised;
(b) These subsidiaries continue to be in the same trade and there is no substantial change in their
shareholdings; and
(c) no changes in tax legislation that adversely affect these subsidiaries’ ability to realise the benefit.
Tax Consolidation Legislation
Zicom Group Limited and its wholly owned Australian subsidiaries have not elected to form a tax
consolidated group.
For
per
sona
l use
onl
y
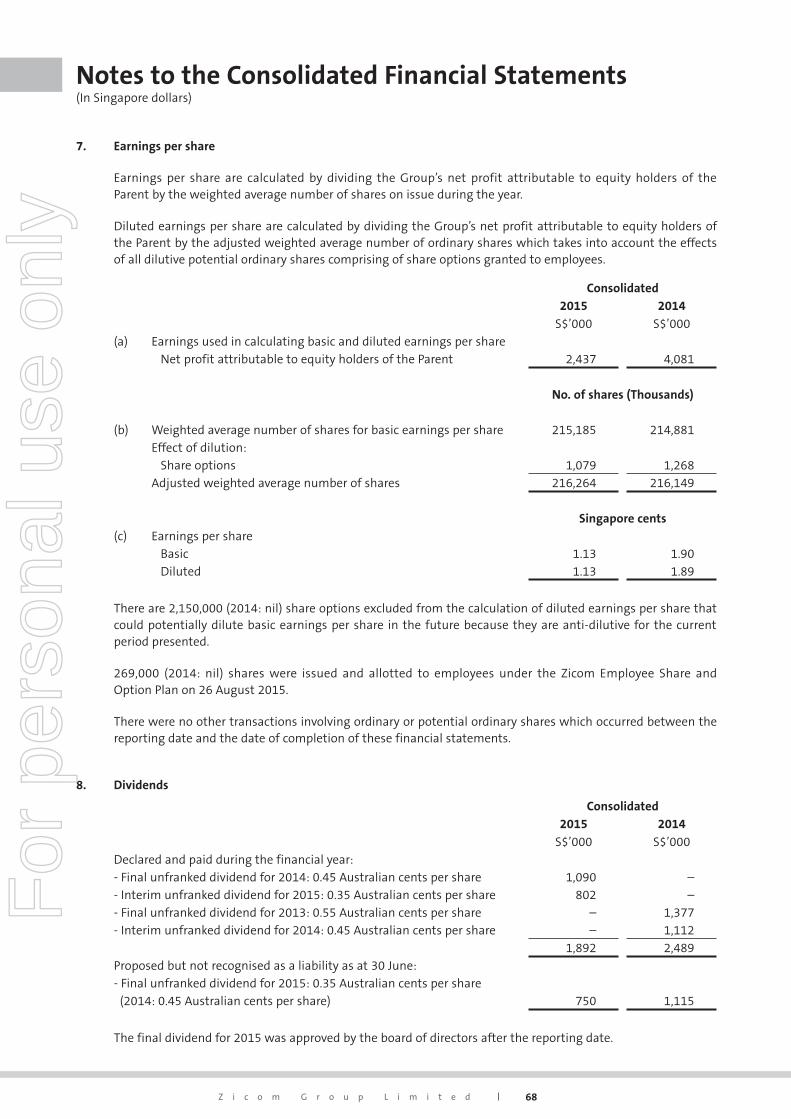
68Z i c o m G r o u p L i m i t e d
Notes to the Consolidated Financial Statements (In Singapore dollars)
7. Earnings per share
Earnings per share are calculated by dividing the Group’s net profit attributable to equity holders of the Parent by the weighted average number of shares on issue during the year.
Diluted earnings per share are calculated by dividing the Group’s net profit attributable to equity holders of the Parent by the adjusted weighted average number of ordinary shares which takes into account the effects of all dilutive potential ordinary shares comprising of share options granted to employees.
Consolidated2015
S$’000
2014
S$’000(a) Earnings used in calculating basic and diluted earnings per share
Net profit attributable to equity holders of the Parent 2,437 4,081
No. of shares (Thousands)
(b) Weighted average number of shares for basic earnings per share 215,185 214,881Effect of dilution: Share options 1,079 1,268Adjusted weighted average number of shares 216,264 216,149
Singapore cents(c) Earnings per share
Basic 1.13 1.90 Diluted 1.13 1.89
There are 2,150,000 (2014: nil) share options excluded from the calculation of diluted earnings per share that could potentially dilute basic earnings per share in the future because they are anti-dilutive for the current period presented.
269,000 (2014: nil) shares were issued and allotted to employees under the Zicom Employee Share and Option Plan on 26 August 2015.
There were no other transactions involving ordinary or potential ordinary shares which occurred between the reporting date and the date of completion of these financial statements.
8. Dividends
Consolidated2015
S$’000
2014
S$’000Declared and paid during the financial year:- Final unfranked dividend for 2014: 0.45 Australian cents per share 1,090 –- Interim unfranked dividend for 2015: 0.35 Australian cents per share 802 –- Final unfranked dividend for 2013: 0.55 Australian cents per share – 1,377- Interim unfranked dividend for 2014: 0.45 Australian cents per share – 1,112
1,892 2,489Proposed but not recognised as a liability as at 30 June:- Final unfranked dividend for 2015: 0.35 Australian cents per share (2014: 0.45 Australian cents per share) 750 1,115
The final dividend for 2015 was approved by the board of directors after the reporting date.
For
per
sona
l use
onl
y
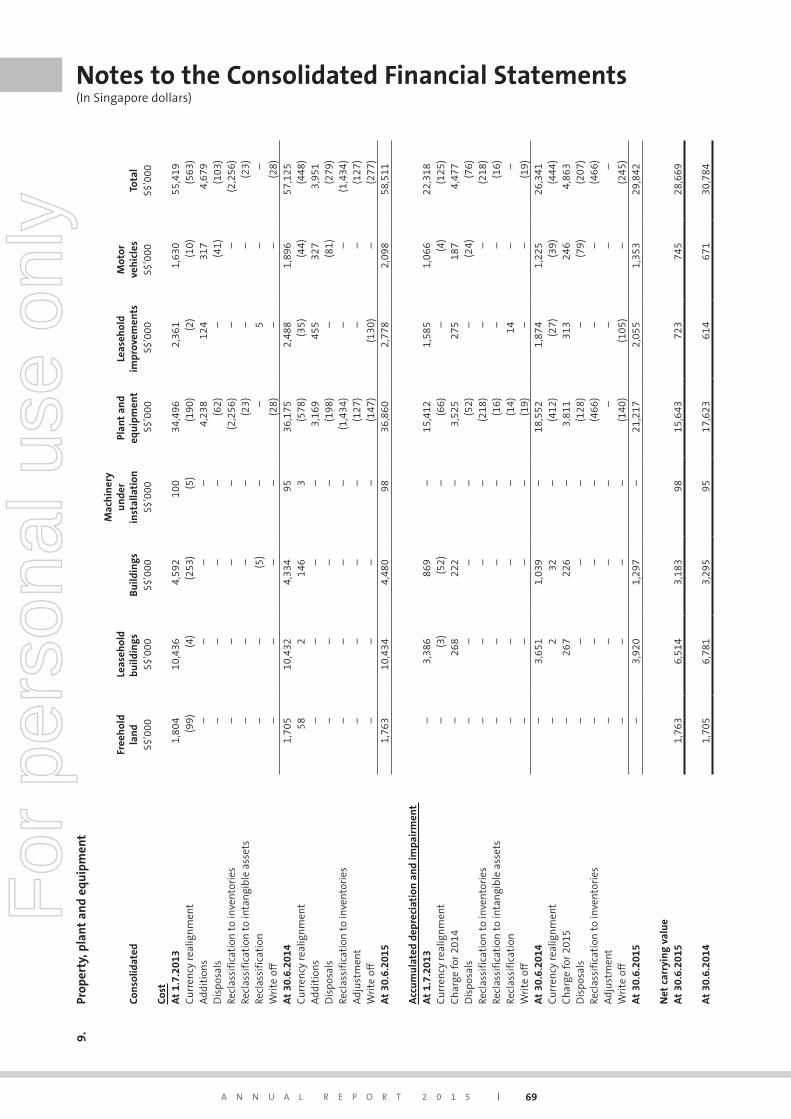
A N N U A L R E P O R T 2 0 1 5 69
Notes to the Consolidated Financial Statements (In Singapore dollars)
9.
Prop
erty
, pla
nt a
nd
equ
ipm
ent
Con
solid
ated
Free
hol
dla
nd
Lea
seh
old
build
ings
Bu
ildin
gs
Mac
hin
ery
un
der
inst
alla
tion
Plan
t an
deq
uip
men
tLe
aseh
old
impr
ovem
ents
Mot
orve
hic
les
Tota
lS$
’000
S$’
000
S$’
000
S$’0
00 S
$’00
0 S
$’00
0S$
’000
S$’0
00Co
stA
t 1.
7.20
131,
804
10,4
364,
592
100
34,4
962,
361
1,63
055
,419
Cu
rren
cy r
ealig
nm
ent
(99)
(4)
(253
)(5
)(1
90)
(2)
(10)
(563
)A
ddit
ion
s–
– –
– 4,
238
124
317
4,67
9D
ispo
sals
– –
– –
(62)
– (4
1)(1
03)
Recl
assi
fica
tion
to
inve
ntor
ies
– –
– –
(2,2
56)
– –
(2,2
56)
Recl
assi
fica
tion
to
inta
ngi
ble
asse
ts–
– –
– (2
3)–
– (2
3)Re
clas
sifi
cati
on–
– (5
)–
– 5
– –
Wri
te o
ff–
– –
– (2
8)–
– (2
8)A
t 30
.6.2
014
1,70
510
,432
4,33
495
36,1
752,
488
1,89
657
,125
Cu
rren
cy r
ealig
nm
ent
582
146
3(5
78)
(35)
(44)
(448
)A
ddit
ion
s–
– –
– 3,
169
455
327
3,95
1D
ispo
sals
– –
– –
(198
)–
(81)
(279
)Re
clas
sifi
cati
on t
o in
vent
orie
s–
– –
– (1
,434
)–
– (1
,434
)A
dju
stm
ent
– –
– –
(127
)–
– (1
27)
Wri
te o
ff–
– –
– (1
47)
(130
)–
(277
)A
t 30
.6.2
015
1,76
310
,434
4,48
098
36,8
602,
778
2,09
858
,511
Acc
um
ula
ted
depr
ecia
tion
an
d im
pair
men
t A
t 1.
7.20
13–
3,38
686
9–
15,4
121,
585
1,06
622
,318
Cu
rren
cy r
ealig
nm
ent
– (3
)(5
2)–
(66)
– (4
)(1
25)
Ch
arge
for
201
4–
268
222
– 3,
525
275
187
4,47
7D
ispo
sals
– –
– –
(52)
– (2
4)(7
6)Re
clas
sifi
cati
on t
o in
vent
orie
s–
– –
– (2
18)
– –
(218
)Re
clas
sifi
cati
on t
o in
tan
gibl
e as
sets
– –
– –
(16)
– –
(16)
Recl
assi
fica
tion
–
– –
– (1
4)14
–
– W
rite
off
– –
– –
(19)
– –
(19)
At
30.6
.201
4–
3,65
11,
039
– 18
,552
1,87
41,
225
26,3
41C
urr
ency
rea
lign
men
t–
232
– (4
12)
(27)
(39)
(444
)C
har
ge f
or 2
015
– 26
722
6–
3,81
131
324
64,
863
Dis
posa
ls–
– –
– (1
28)
– (7
9)(2
07)
Recl
assi
fica
tion
to
inve
ntor
ies
– –
– –
(466
)–
– (4
66)
Adj
ust
men
t–
– –
– –
– –
– W
rite
off
– –
– –
(140
)(1
05)
– (2
45)
At
30.6
.201
5–
3,92
01,
297
– 21
,217
2,05
51,
353
29,8
42
Net
car
ryin
g va
lue
At
30.6
.201
51,
763
6,51
43,
183
9815
,643
723
745
28,6
69
At
30.6
.201
41,
705
6,78
13,
295
9517
,623
614
671
30,7
84
For
per
sona
l use
onl
y
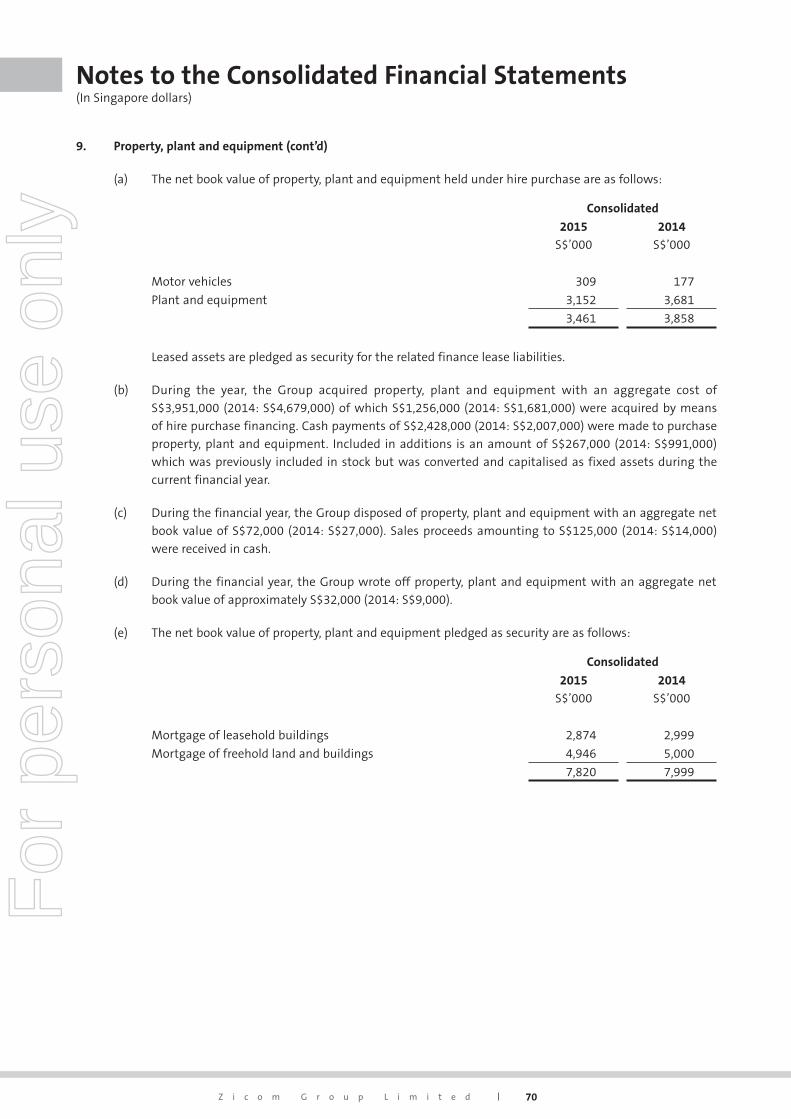
70Z i c o m G r o u p L i m i t e d
Notes to the Consolidated Financial Statements (In Singapore dollars)
9. Property, plant and equipment (cont’d)
(a) The net book value of property, plant and equipment held under hire purchase are as follows:
Consolidated
2015
S$’000
2014
S$’000
Motor vehicles 309 177
Plant and equipment 3,152 3,681
3,461 3,858
Leased assets are pledged as security for the related finance lease liabilities.
(b) During the year, the Group acquired property, plant and equipment with an aggregate cost of
S$3,951,000 (2014: S$4,679,000) of which S$1,256,000 (2014: S$1,681,000) were acquired by means
of hire purchase financing. Cash payments of S$2,428,000 (2014: S$2,007,000) were made to purchase
property, plant and equipment. Included in additions is an amount of S$267,000 (2014: S$991,000)
which was previously included in stock but was converted and capitalised as fixed assets during the
current financial year.
(c) During the financial year, the Group disposed of property, plant and equipment with an aggregate net
book value of S$72,000 (2014: S$27,000). Sales proceeds amounting to S$125,000 (2014: S$14,000)
were received in cash.
(d) During the financial year, the Group wrote off property, plant and equipment with an aggregate net
book value of approximately S$32,000 (2014: S$9,000).
(e) The net book value of property, plant and equipment pledged as security are as follows:
Consolidated
2015
S$’000
2014
S$’000
Mortgage of leasehold buildings 2,874 2,999
Mortgage of freehold land and buildings 4,946 5,000
7,820 7,999
For
per
sona
l use
onl
y
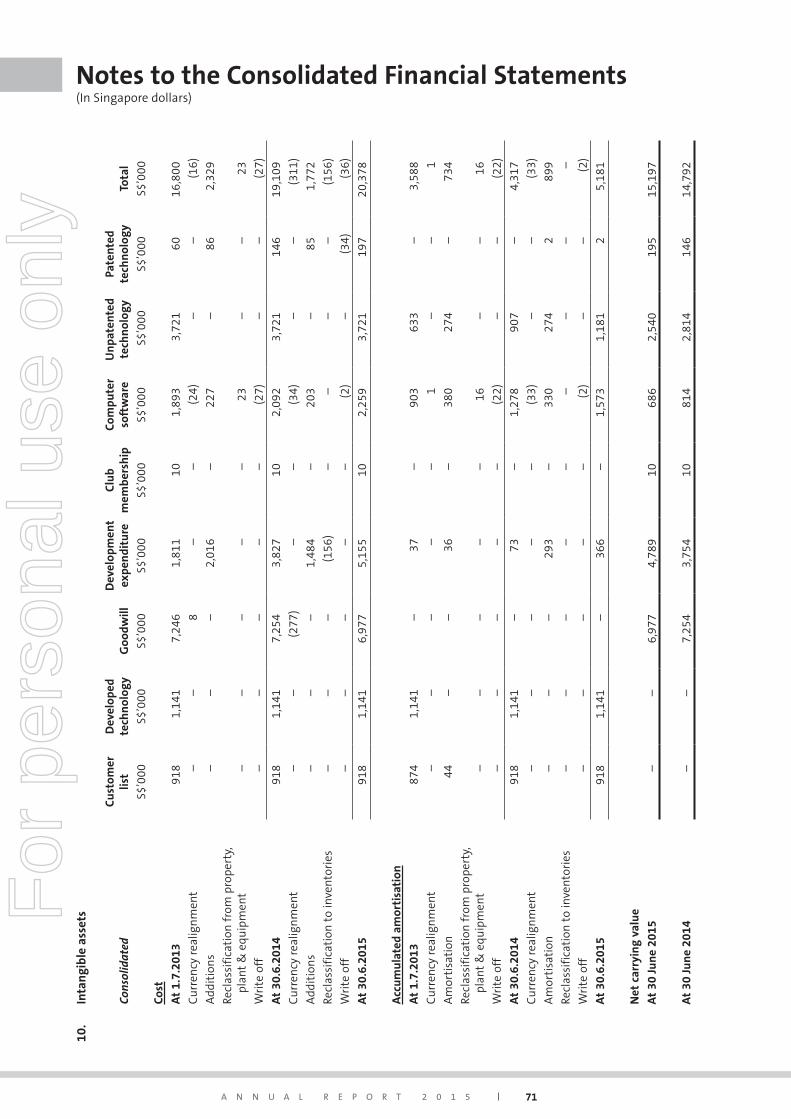
A N N U A L R E P O R T 2 0 1 5 71
Notes to the Consolidated Financial Statements (In Singapore dollars)
10.
Inta
ngi
ble
asse
ts
Cons
olid
ated
Cust
omer
list
Dev
elop
edte
chn
olog
yG
oodw
illD
evel
opm
ent
expe
ndi
ture
Clu
bm
embe
rsh
ipCo
mpu
ter
soft
war
e U
npa
tent
edte
chn
olog
yPa
tent
ed
tech
nol
ogy
Tota
l
S$’0
00S$
’000
S$’0
00S$
’000
S$’0
00S$
’000
S$’
000
S$’0
00S$
’000
Cost
At
1.7.
2013
918
1,14
17,
246
1,81
110
1,89
33,
721
6016
,800
Cu
rren
cy r
ealig
nm
ent
– –
8 –
–(2
4)–
– (1
6)
Add
itio
ns
– –
– 2,
016
– 22
7–
862,
329
Recl
assi
fica
tion
fro
m p
rope
rty,
pl
ant
& e
quip
men
t–
– –
– –
23–
– 23
Wri
te o
ff–
– –
– –
(27)
– –
(27)
At
30.6
.201
491
81,
141
7,25
43,
827
102,
092
3,72
114
619
,109
Cu
rren
cy r
ealig
nm
ent
– –
(277
)–
–(3
4)–
– (3
11)
Add
itio
ns
– –
– 1,
484
– 2
03–
851,
772
Recl
assi
fica
tion
to
inve
ntor
ies
– –
– (1
56)
– –
– –
(156
)
Wri
te o
ff–
– –
– –
(2)
– (3
4)(3
6)
At
30.6
.201
591
81,
141
6,97
75,
155
102,
259
3,72
1 19
720
,378
Acc
um
ula
ted
amor
tisa
tion
At
1.7.
2013
874
1,14
1–
37–
903
633
– 3,
588
Cu
rren
cy r
ealig
nm
ent
– –
– –
– 1
– –
1
Am
orti
sati
on44
– –
36
– 38
027
4–
734
Recl
assi
fica
tion
fro
m p
rope
rty,
pl
ant
& e
quip
men
t–
– –
– –
16–
– 16
Wri
te o
ff–
– –
– –
(22)
– –
(22)
At
30.6
.201
491
81,
141
– 73
– 1,
278
907
– 4,
317
Cu
rren
cy r
ealig
nm
ent
– –
– –
– (3
3)–
– (3
3)
Am
orti
sati
on–
– –
293
– 33
027
42
899
Recl
assi
fica
tion
to
inve
ntor
ies
– –
– –
– –
– –
–
Wri
te o
ff–
– –
– –
(2)
– –
(2)
At
30.6
.201
591
81,
141
– 36
6–
1,57
31,
181
25,
181
Net
car
ryin
g va
lue
At
30 J
un
e 20
15–
– 6,
977
4,78
910
686
2,54
019
515
,197
At
30 J
un
e 20
14–
– 7,
254
3,75
410
814
2,81
414
614
,792
For
per
sona
l use
onl
y
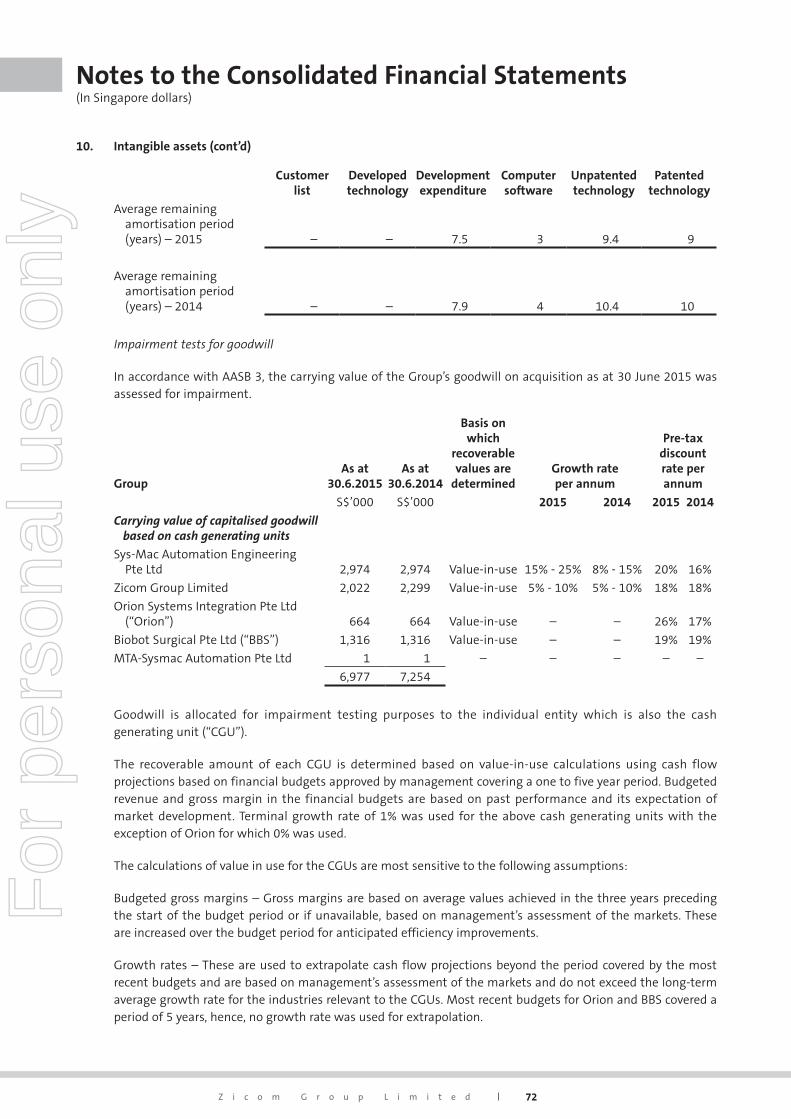
72Z i c o m G r o u p L i m i t e d
Notes to the Consolidated Financial Statements (In Singapore dollars)
10. Intangible assets (cont’d)
Customerlist
Developedtechnology
Developmentexpenditure
Computer software
Unpatentedtechnology
Patented technology
Average remaining amortisation period (years) – 2015 – – 7.5 3 9.4 9
Average remaining amortisation period (years) – 2014 – – 7.9 4 10.4 10
Impairment tests for goodwill
In accordance with AASB 3, the carrying value of the Group’s goodwill on acquisition as at 30 June 2015 was assessed for impairment.
GroupAs at
30.6.2015As at
30.6.2014
Basis on which
recoverable values are
determinedGrowth rateper annum
Pre-taxdiscountrate perannum
S$’000 S$’000 2015 2014 2015 2014
Carryingvalueofcapitalisedgoodwillbasedoncash generatingunits
Sys-Mac Automation Engineering Pte Ltd 2,974 2,974 Value-in-use 15% - 25% 8% - 15% 20% 16%
Zicom Group Limited 2,022 2,299 Value-in-use 5% - 10% 5% - 10% 18% 18%
Orion Systems Integration Pte Ltd (“Orion”) 664 664 Value-in-use – – 26% 17%
Biobot Surgical Pte Ltd (“BBS”) 1,316 1,316 Value-in-use – – 19% 19%
MTA-Sysmac Automation Pte Ltd 1 1 – – – – –
6,977 7,254
Goodwill is allocated for impairment testing purposes to the individual entity which is also the cash generating unit (“CGU”).
The recoverable amount of each CGU is determined based on value-in-use calculations using cash flow projections based on financial budgets approved by management covering a one to five year period. Budgeted revenue and gross margin in the financial budgets are based on past performance and its expectation of market development. Terminal growth rate of 1% was used for the above cash generating units with the exception of Orion for which 0% was used.
The calculations of value in use for the CGUs are most sensitive to the following assumptions:
Budgeted gross margins – Gross margins are based on average values achieved in the three years preceding the start of the budget period or if unavailable, based on management’s assessment of the markets. These are increased over the budget period for anticipated efficiency improvements.
Growth rates – These are used to extrapolate cash flow projections beyond the period covered by the most recent budgets and are based on management’s assessment of the markets and do not exceed the long-term average growth rate for the industries relevant to the CGUs. Most recent budgets for Orion and BBS covered a period of 5 years, hence, no growth rate was used for extrapolation.
For
per
sona
l use
onl
y
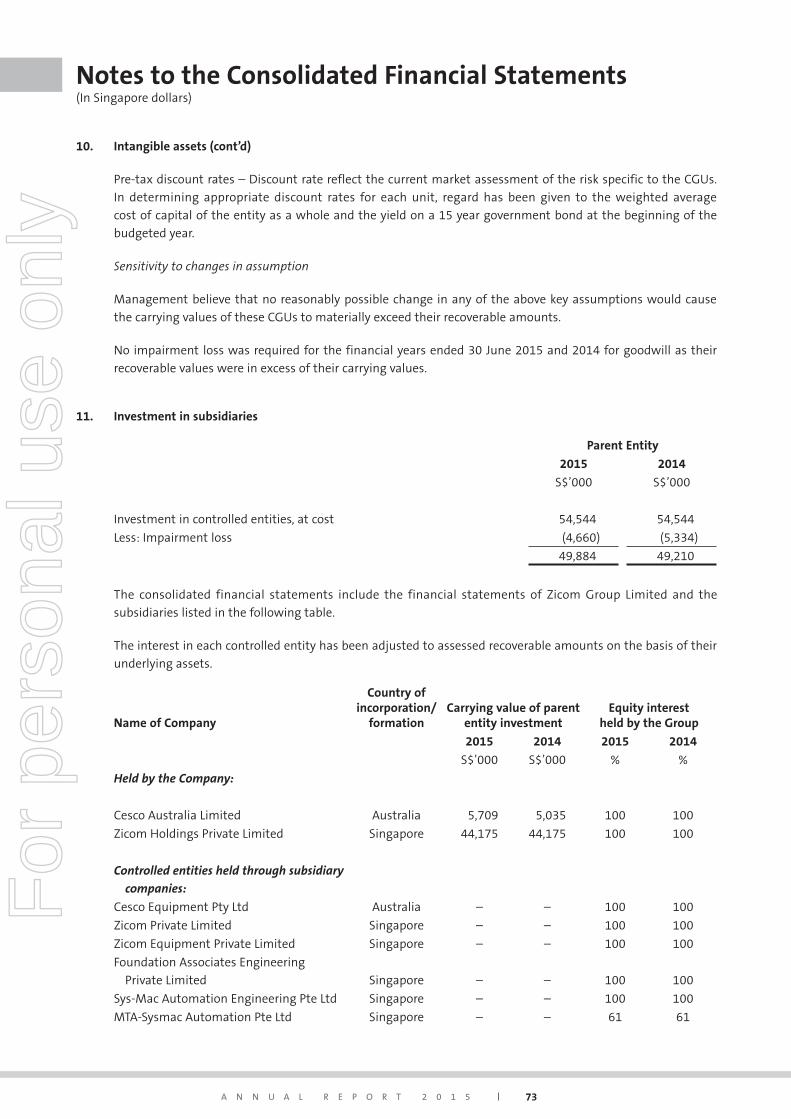
A N N U A L R E P O R T 2 0 1 5 73
Notes to the Consolidated Financial Statements (In Singapore dollars)
10. Intangible assets (cont’d)
Pre-tax discount rates – Discount rate reflect the current market assessment of the risk specific to the CGUs.
In determining appropriate discount rates for each unit, regard has been given to the weighted average
cost of capital of the entity as a whole and the yield on a 15 year government bond at the beginning of the
budgeted year.
Sensitivity to changes in assumption
Management believe that no reasonably possible change in any of the above key assumptions would cause
the carrying values of these CGUs to materially exceed their recoverable amounts.
No impairment loss was required for the financial years ended 30 June 2015 and 2014 for goodwill as their
recoverable values were in excess of their carrying values.
11. Investment in subsidiaries
Parent Entity
2015 2014
S$’000 S$’000
Investment in controlled entities, at cost 54,544 54,544
Less: Impairment loss (4,660) (5,334)
49,884 49,210
The consolidated financial statements include the financial statements of Zicom Group Limited and the
subsidiaries listed in the following table.
The interest in each controlled entity has been adjusted to assessed recoverable amounts on the basis of their
underlying assets.
Name of Company
Country of incorporation/
formationCarrying value of parent
entity investmentEquity interest
held by the Group
2015 2014 2015 2014
S$’000 S$’000 % %
HeldbytheCompany:
Cesco Australia Limited Australia 5,709 5,035 100 100
Zicom Holdings Private Limited Singapore 44,175 44,175 100 100
Controlledentitiesheldthroughsubsidiary
companies:
Cesco Equipment Pty Ltd Australia – – 100 100
Zicom Private Limited Singapore – – 100 100
Zicom Equipment Private Limited Singapore – – 100 100
Foundation Associates Engineering
Private Limited Singapore – – 100 100
Sys-Mac Automation Engineering Pte Ltd Singapore – – 100 100
MTA-Sysmac Automation Pte Ltd Singapore – – 61 61
For
per
sona
l use
onl
y
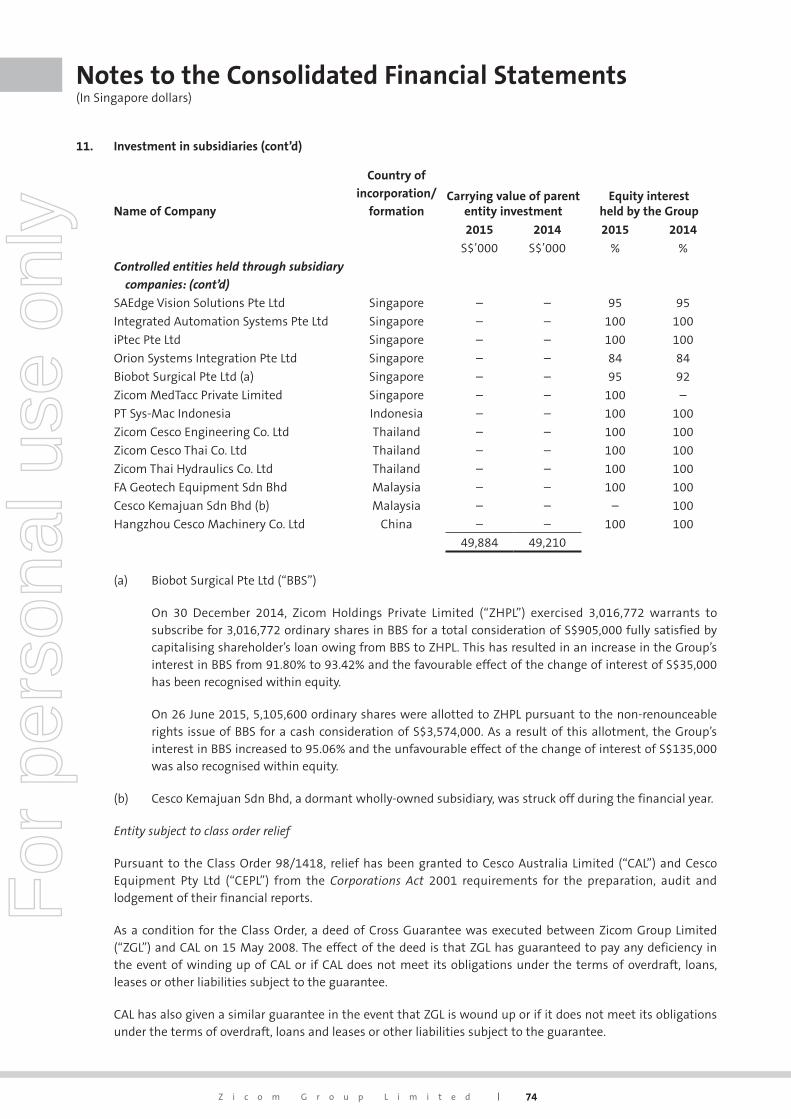
74Z i c o m G r o u p L i m i t e d
Notes to the Consolidated Financial Statements (In Singapore dollars)
11. Investment in subsidiaries (cont’d)
Name of Company
Country of
incorporation/
formationCarrying value of parent
entity investmentEquity interest
held by the Group
2015 2014 2015 2014
S$’000 S$’000 % %
Controlledentitiesheldthroughsubsidiary
companies:(cont’d)
SAEdge Vision Solutions Pte Ltd Singapore – – 95 95
Integrated Automation Systems Pte Ltd Singapore – – 100 100
iPtec Pte Ltd Singapore – – 100 100
Orion Systems Integration Pte Ltd Singapore – – 84 84
Biobot Surgical Pte Ltd (a) Singapore – – 95 92
Zicom MedTacc Private Limited Singapore – – 100 –
PT Sys-Mac Indonesia Indonesia – – 100 100
Zicom Cesco Engineering Co. Ltd Thailand – – 100 100
Zicom Cesco Thai Co. Ltd Thailand – – 100 100
Zicom Thai Hydraulics Co. Ltd Thailand – – 100 100
FA Geotech Equipment Sdn Bhd Malaysia – – 100 100
Cesco Kemajuan Sdn Bhd (b) Malaysia – – – 100
Hangzhou Cesco Machinery Co. Ltd China – – 100 100
49,884 49,210
(a) Biobot Surgical Pte Ltd (“BBS”)
On 30 December 2014, Zicom Holdings Private Limited (“ZHPL”) exercised 3,016,772 warrants to subscribe for 3,016,772 ordinary shares in BBS for a total consideration of S$905,000 fully satisfied by capitalising shareholder’s loan owing from BBS to ZHPL. This has resulted in an increase in the Group’s interest in BBS from 91.80% to 93.42% and the favourable effect of the change of interest of S$35,000 has been recognised within equity.
On 26 June 2015, 5,105,600 ordinary shares were allotted to ZHPL pursuant to the non-renounceable rights issue of BBS for a cash consideration of S$3,574,000. As a result of this allotment, the Group’s interest in BBS increased to 95.06% and the unfavourable effect of the change of interest of S$135,000 was also recognised within equity.
(b) Cesco Kemajuan Sdn Bhd, a dormant wholly-owned subsidiary, was struck off during the financial year.
Entity subject to class order relief
Pursuant to the Class Order 98/1418, relief has been granted to Cesco Australia Limited (“CAL”) and Cesco Equipment Pty Ltd (“CEPL”) from the Corporations Act 2001 requirements for the preparation, audit and lodgement of their financial reports.
As a condition for the Class Order, a deed of Cross Guarantee was executed between Zicom Group Limited (“ZGL”) and CAL on 15 May 2008. The effect of the deed is that ZGL has guaranteed to pay any deficiency in the event of winding up of CAL or if CAL does not meet its obligations under the terms of overdraft, loans, leases or other liabilities subject to the guarantee.
CAL has also given a similar guarantee in the event that ZGL is wound up or if it does not meet its obligations under the terms of overdraft, loans and leases or other liabilities subject to the guarantee.
For
per
sona
l use
onl
y
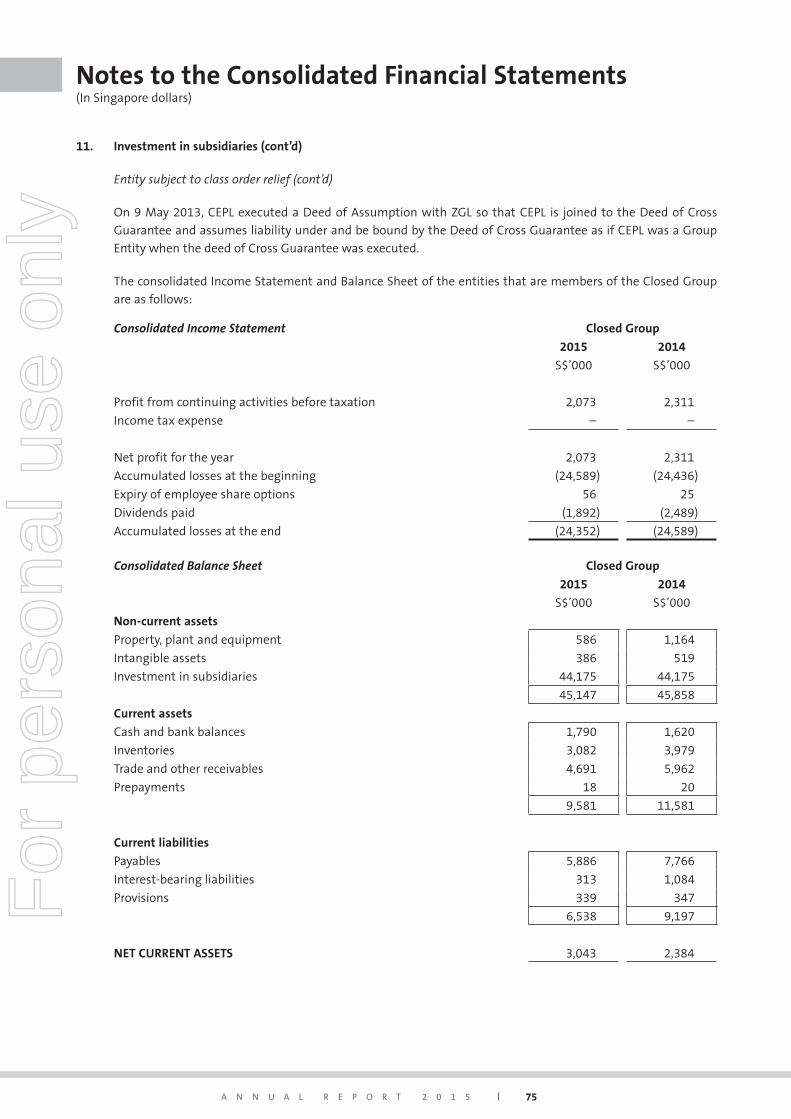
A N N U A L R E P O R T 2 0 1 5 75
Notes to the Consolidated Financial Statements (In Singapore dollars)
11. Investment in subsidiaries (cont’d)
Entity subject to class order relief (cont’d)
On 9 May 2013, CEPL executed a Deed of Assumption with ZGL so that CEPL is joined to the Deed of Cross
Guarantee and assumes liability under and be bound by the Deed of Cross Guarantee as if CEPL was a Group
Entity when the deed of Cross Guarantee was executed.
The consolidated Income Statement and Balance Sheet of the entities that are members of the Closed Group
are as follows:
ConsolidatedIncomeStatement Closed Group
2015 2014
S$’000 S$’000
Profit from continuing activities before taxation 2,073 2,311
Income tax expense – –
Net profit for the year 2,073 2,311
Accumulated losses at the beginning (24,589) (24,436)
Expiry of employee share options 56 25
Dividends paid (1,892) (2,489)
Accumulated losses at the end (24,352) (24,589)
ConsolidatedBalanceSheet Closed Group
2015 2014
S$’000 S$’000
Non-current assets
Property, plant and equipment 586 1,164
Intangible assets 386 519
Investment in subsidiaries 44,175 44,175
45,147 45,858
Current assets
Cash and bank balances 1,790 1,620
Inventories 3,082 3,979
Trade and other receivables 4,691 5,962
Prepayments 18 20
9,581 11,581
Current liabilities
Payables 5,886 7,766
Interest-bearing liabilities 313 1,084
Provisions 339 347
6,538 9,197
NET CURRENT ASSETS 3,043 2,384
For
per
sona
l use
onl
y
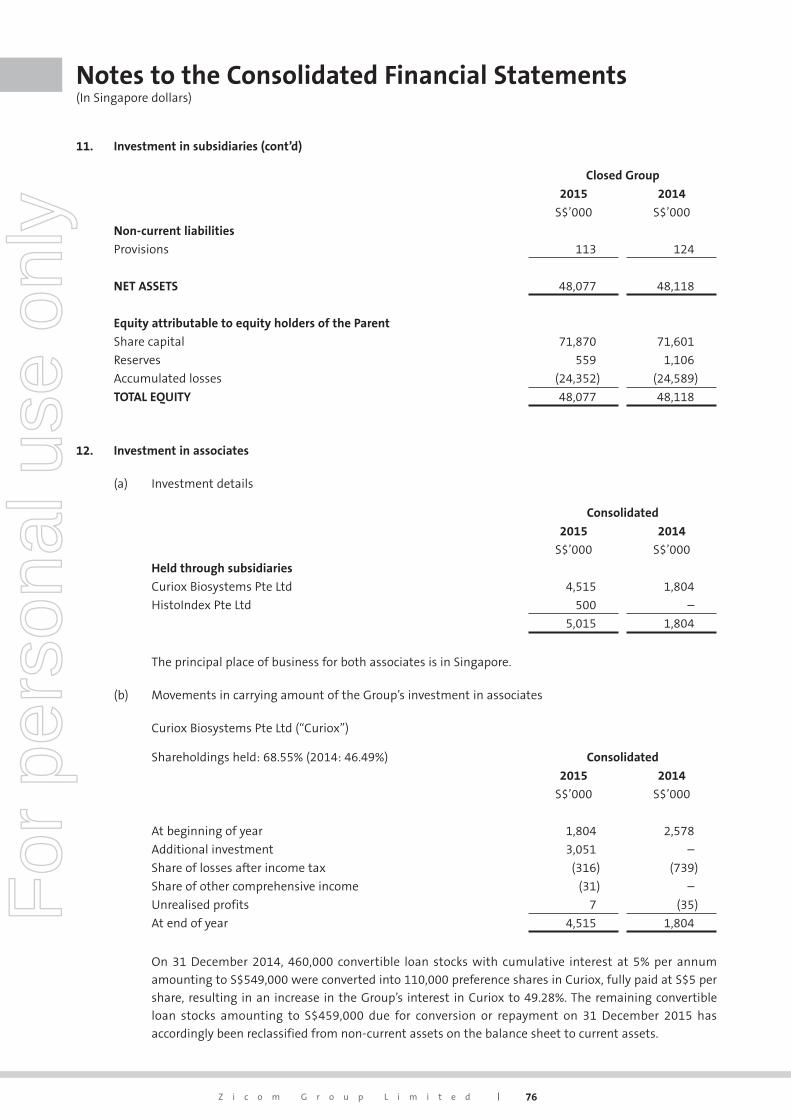
76Z i c o m G r o u p L i m i t e d
Notes to the Consolidated Financial Statements (In Singapore dollars)
11. Investment in subsidiaries (cont’d)
Closed Group
2015 2014
S$’000 S$’000
Non-current liabilities
Provisions 113 124
NET ASSETS 48,077 48,118
Equity attributable to equity holders of the Parent
Share capital 71,870 71,601
Reserves 559 1,106
Accumulated losses (24,352) (24,589)
TOTAL EQUITY 48,077 48,118
12. Investment in associates
(a) Investment details
Consolidated
2015 2014
S$’000 S$’000
Held through subsidiaries
Curiox Biosystems Pte Ltd 4,515 1,804
HistoIndex Pte Ltd 500 –
5,015 1,804
The principal place of business for both associates is in Singapore.
(b) Movements in carrying amount of the Group’s investment in associates
Curiox Biosystems Pte Ltd (“Curiox”)
Shareholdings held: 68.55% (2014: 46.49%) Consolidated
2015 2014
S$’000 S$’000
At beginning of year 1,804 2,578
Additional investment 3,051 –
Share of losses after income tax (316) (739)
Share of other comprehensive income (31) –
Unrealised profits 7 (35)
At end of year 4,515 1,804
On 31 December 2014, 460,000 convertible loan stocks with cumulative interest at 5% per annum
amounting to S$549,000 were converted into 110,000 preference shares in Curiox, fully paid at S$5 per
share, resulting in an increase in the Group’s interest in Curiox to 49.28%. The remaining convertible
loan stocks amounting to S$459,000 due for conversion or repayment on 31 December 2015 has
accordingly been reclassified from non-current assets on the balance sheet to current assets.
For
per
sona
l use
onl
y
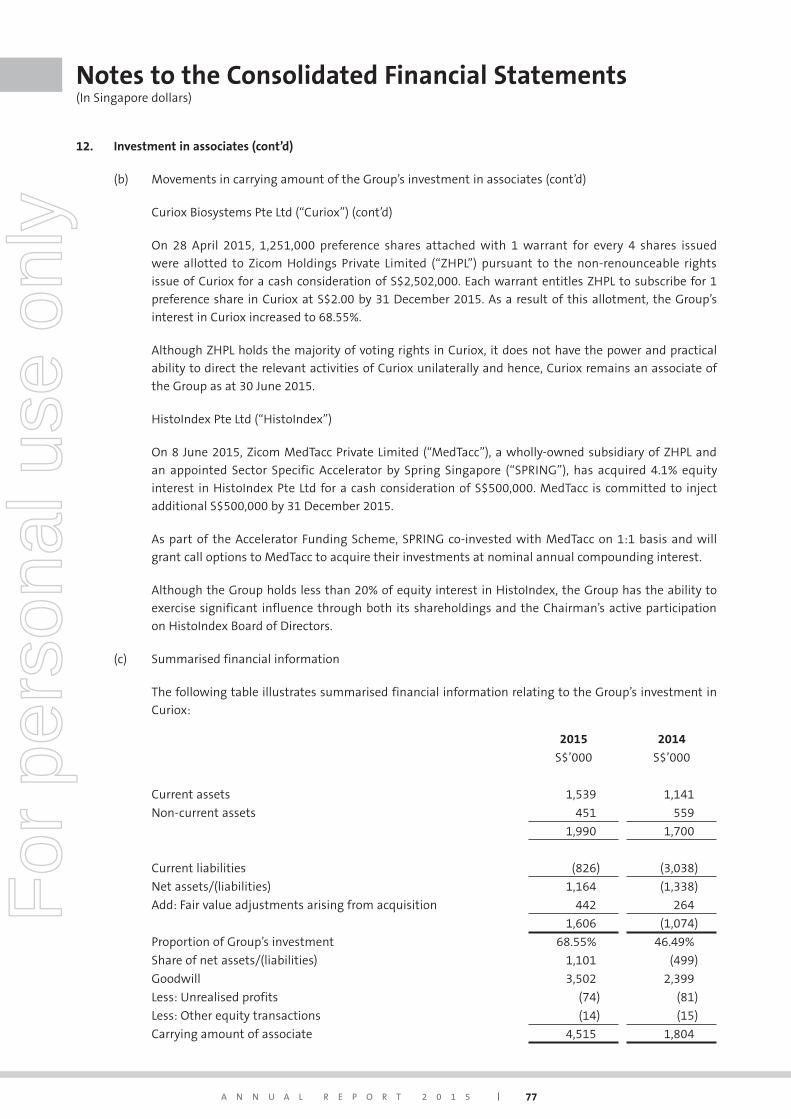
A N N U A L R E P O R T 2 0 1 5 77
Notes to the Consolidated Financial Statements (In Singapore dollars)
12. Investment in associates (cont’d)
(b) Movements in carrying amount of the Group’s investment in associates (cont’d)
Curiox Biosystems Pte Ltd (“Curiox”) (cont’d)
On 28 April 2015, 1,251,000 preference shares attached with 1 warrant for every 4 shares issued
were allotted to Zicom Holdings Private Limited (“ZHPL”) pursuant to the non-renounceable rights
issue of Curiox for a cash consideration of S$2,502,000. Each warrant entitles ZHPL to subscribe for 1
preference share in Curiox at S$2.00 by 31 December 2015. As a result of this allotment, the Group’s
interest in Curiox increased to 68.55%.
Although ZHPL holds the majority of voting rights in Curiox, it does not have the power and practical
ability to direct the relevant activities of Curiox unilaterally and hence, Curiox remains an associate of
the Group as at 30 June 2015.
HistoIndex Pte Ltd (“HistoIndex”)
On 8 June 2015, Zicom MedTacc Private Limited (“MedTacc”), a wholly-owned subsidiary of ZHPL and
an appointed Sector Specific Accelerator by Spring Singapore (“SPRING”), has acquired 4.1% equity
interest in HistoIndex Pte Ltd for a cash consideration of S$500,000. MedTacc is committed to inject
additional S$500,000 by 31 December 2015.
As part of the Accelerator Funding Scheme, SPRING co-invested with MedTacc on 1:1 basis and will
grant call options to MedTacc to acquire their investments at nominal annual compounding interest.
Although the Group holds less than 20% of equity interest in HistoIndex, the Group has the ability to
exercise significant influence through both its shareholdings and the Chairman’s active participation
on HistoIndex Board of Directors.
(c) Summarised financial information
The following table illustrates summarised financial information relating to the Group’s investment in
Curiox:
2015 2014
S$’000 S$’000
Current assets 1,539 1,141
Non-current assets 451 559
1,990 1,700
Current liabilities (826) (3,038)
Net assets/(liabilities) 1,164 (1,338)
Add: Fair value adjustments arising from acquisition 442 264
1,606 (1,074)
Proportion of Group’s investment 68.55% 46.49%
Share of net assets/(liabilities) 1,101 (499)
Goodwill 3,502 2,399
Less: Unrealised profits (74) (81)
Less: Other equity transactions (14) (15)
Carrying amount of associate 4,515 1,804
For
per
sona
l use
onl
y
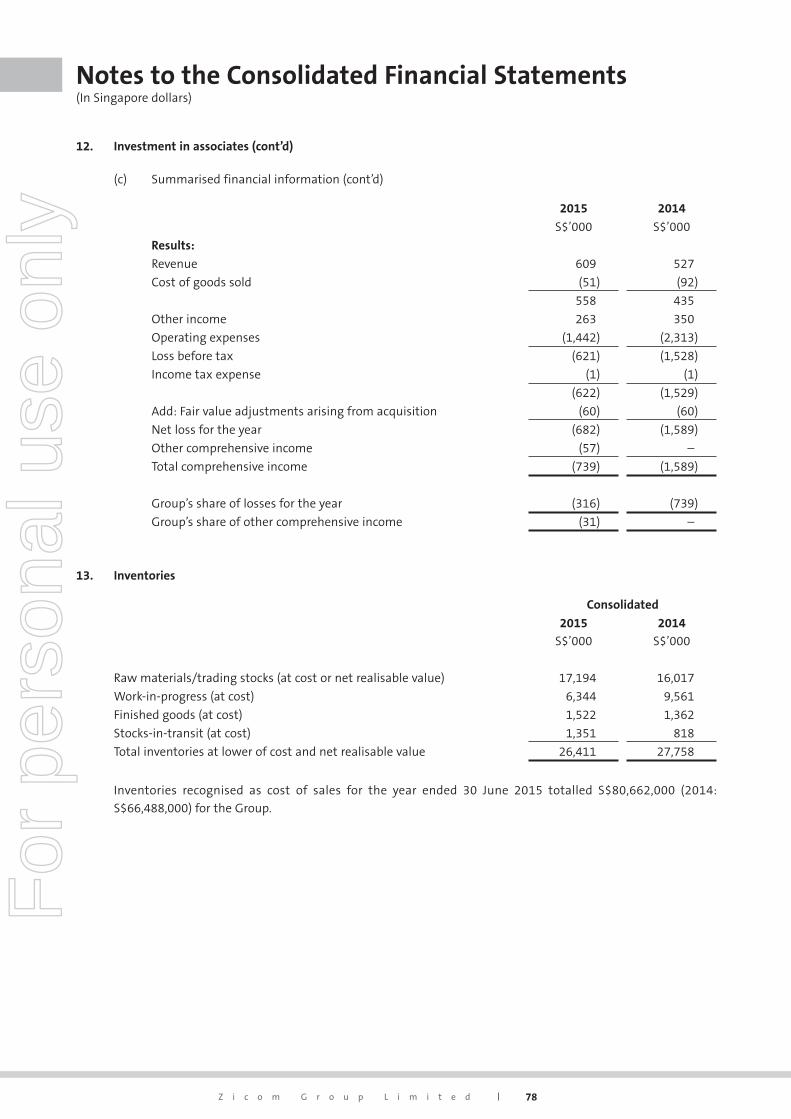
78Z i c o m G r o u p L i m i t e d
Notes to the Consolidated Financial Statements (In Singapore dollars)
12. Investment in associates (cont’d)
(c) Summarised financial information (cont’d)
2015 2014
S$’000 S$’000
Results:
Revenue 609 527
Cost of goods sold (51) (92)
558 435
Other income 263 350
Operating expenses (1,442) (2,313)
Loss before tax (621) (1,528)
Income tax expense (1) (1)
(622) (1,529)
Add: Fair value adjustments arising from acquisition (60) (60)
Net loss for the year (682) (1,589)
Other comprehensive income (57) –
Total comprehensive income (739) (1,589)
Group’s share of losses for the year (316) (739)
Group’s share of other comprehensive income (31) –
13. Inventories
Consolidated
2015
S$’000
2014
S$’000
Raw materials/trading stocks (at cost or net realisable value) 17,194 16,017
Work-in-progress (at cost) 6,344 9,561
Finished goods (at cost) 1,522 1,362
Stocks-in-transit (at cost) 1,351 818
Total inventories at lower of cost and net realisable value 26,411 27,758
Inventories recognised as cost of sales for the year ended 30 June 2015 totalled S$80,662,000 (2014:
S$66,488,000) for the Group.
For
per
sona
l use
onl
y
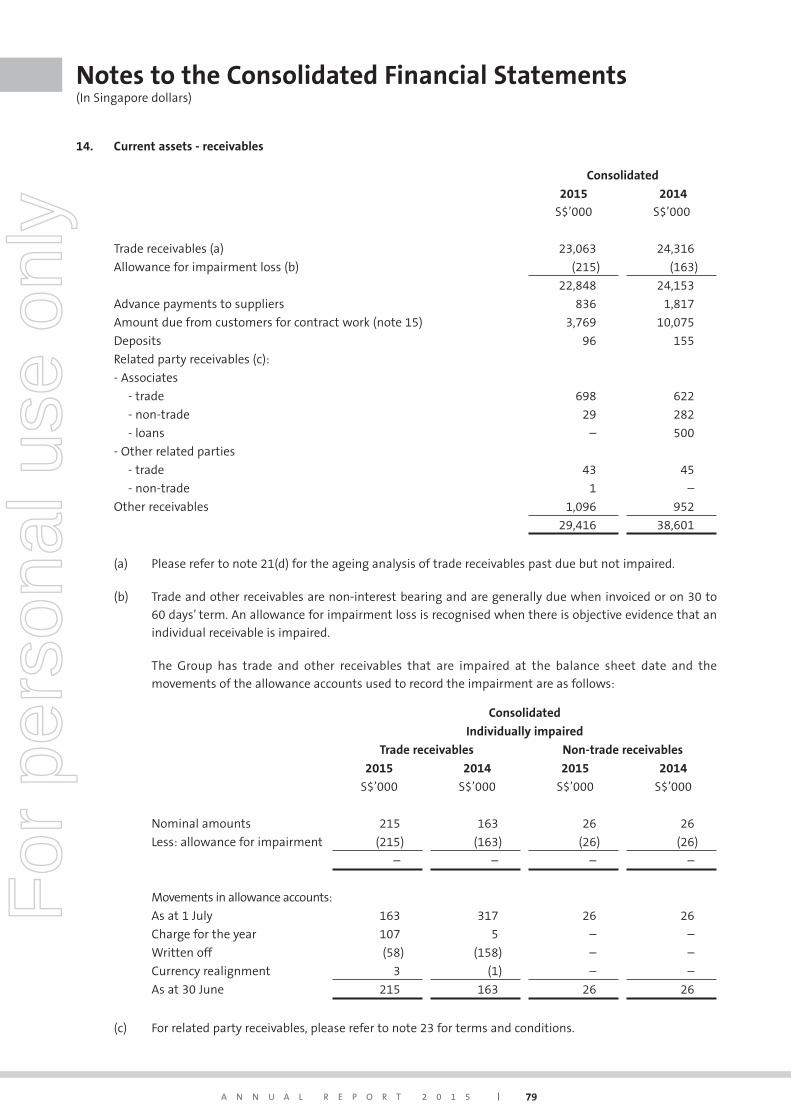
A N N U A L R E P O R T 2 0 1 5 79
Notes to the Consolidated Financial Statements (In Singapore dollars)
14. Current assets - receivables
Consolidated
2015
S$’000
2014
S$’000
Trade receivables (a) 23,063 24,316
Allowance for impairment loss (b) (215) (163)
22,848 24,153
Advance payments to suppliers 836 1,817
Amount due from customers for contract work (note 15) 3,769 10,075
Deposits 96 155
Related party receivables (c):
- Associates
- trade 698 622
- non-trade 29 282
- loans – 500
- Other related parties
- trade 43 45
- non-trade 1 –
Other receivables 1,096 952
29,416 38,601
(a) Please refer to note 21(d) for the ageing analysis of trade receivables past due but not impaired.
(b) Trade and other receivables are non-interest bearing and are generally due when invoiced or on 30 to
60 days’ term. An allowance for impairment loss is recognised when there is objective evidence that an
individual receivable is impaired.
The Group has trade and other receivables that are impaired at the balance sheet date and the
movements of the allowance accounts used to record the impairment are as follows:
Consolidated
Individually impaired
Trade receivables Non-trade receivables
2015 2014 2015 2014
S$’000 S$’000 S$’000 S$’000
Nominal amounts 215 163 26 26
Less: allowance for impairment (215) (163) (26) (26)
– – – –
Movements in allowance accounts:
As at 1 July 163 317 26 26
Charge for the year 107 5 – –
Written off (58) (158) – –
Currency realignment 3 (1) – –
As at 30 June 215 163 26 26
(c) For related party receivables, please refer to note 23 for terms and conditions.
For
per
sona
l use
onl
y
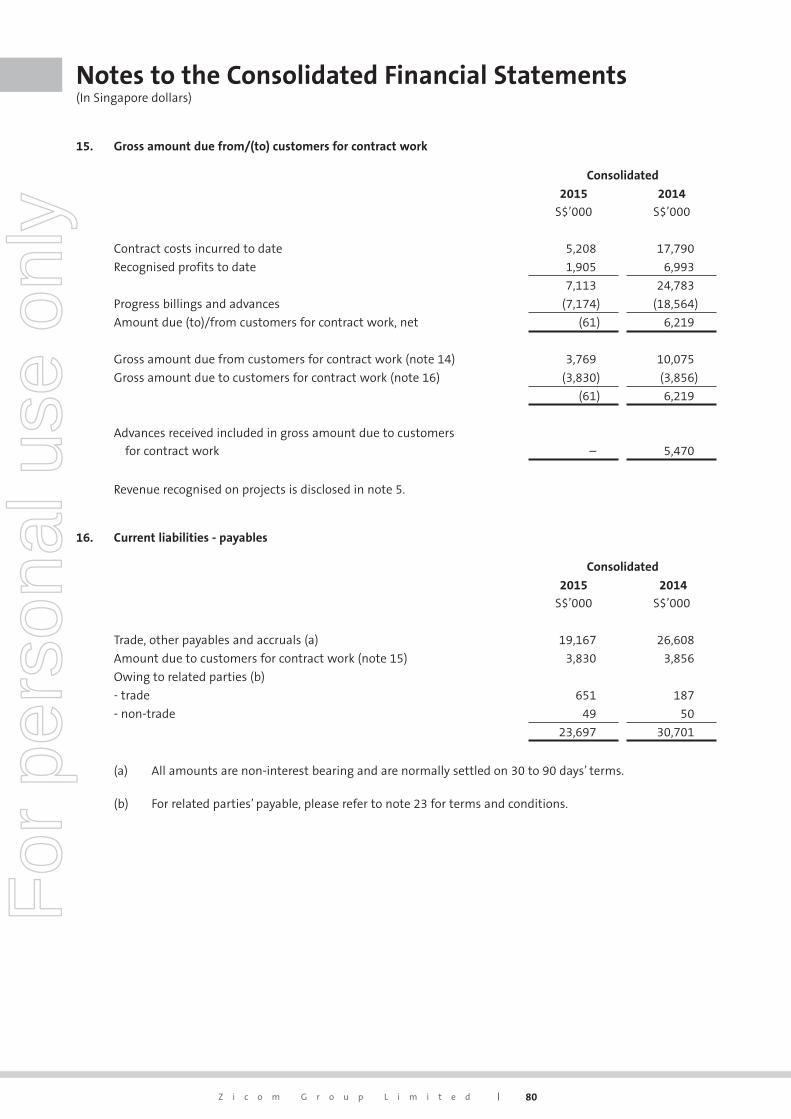
80Z i c o m G r o u p L i m i t e d
Notes to the Consolidated Financial Statements (In Singapore dollars)
15. Gross amount due from/(to) customers for contract work
Consolidated
2015
S$’000
2014
S$’000
Contract costs incurred to date 5,208 17,790
Recognised profits to date 1,905 6,993
7,113 24,783
Progress billings and advances (7,174) (18,564)
Amount due (to)/from customers for contract work, net (61) 6,219
Gross amount due from customers for contract work (note 14) 3,769 10,075
Gross amount due to customers for contract work (note 16) (3,830) (3,856)
(61) 6,219
Advances received included in gross amount due to customers
for contract work – 5,470
Revenue recognised on projects is disclosed in note 5.
16. Current liabilities - payables
Consolidated
2015
S$’000
2014
S$’000
Trade, other payables and accruals (a) 19,167 26,608
Amount due to customers for contract work (note 15) 3,830 3,856
Owing to related parties (b)
- trade 651 187
- non-trade 49 50
23,697 30,701
(a) All amounts are non-interest bearing and are normally settled on 30 to 90 days’ terms.
(b) For related parties’ payable, please refer to note 23 for terms and conditions.
For
per
sona
l use
onl
y
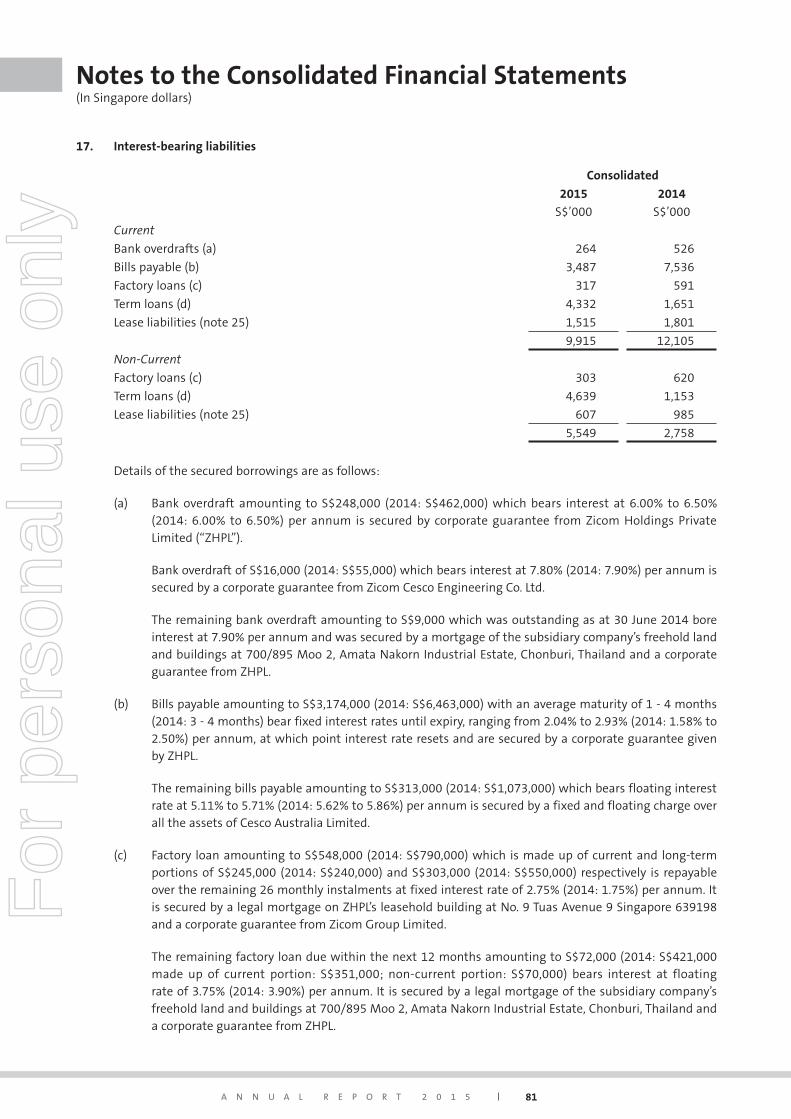
A N N U A L R E P O R T 2 0 1 5 81
Notes to the Consolidated Financial Statements (In Singapore dollars)
17. Interest-bearing liabilities
Consolidated
2015
S$’000
2014
S$’000
Current
Bank overdrafts (a) 264 526
Bills payable (b) 3,487 7,536
Factory loans (c) 317 591
Term loans (d) 4,332 1,651
Lease liabilities (note 25) 1,515 1,801
9,915 12,105
Non-Current
Factory loans (c) 303 620
Term loans (d) 4,639 1,153
Lease liabilities (note 25) 607 985
5,549 2,758
Details of the secured borrowings are as follows:
(a) Bank overdraft amounting to S$248,000 (2014: S$462,000) which bears interest at 6.00% to 6.50% (2014: 6.00% to 6.50%) per annum is secured by corporate guarantee from Zicom Holdings Private Limited (“ZHPL”).
Bank overdraft of S$16,000 (2014: S$55,000) which bears interest at 7.80% (2014: 7.90%) per annum is secured by a corporate guarantee from Zicom Cesco Engineering Co. Ltd.
The remaining bank overdraft amounting to S$9,000 which was outstanding as at 30 June 2014 bore interest at 7.90% per annum and was secured by a mortgage of the subsidiary company’s freehold land and buildings at 700/895 Moo 2, Amata Nakorn Industrial Estate, Chonburi, Thailand and a corporate guarantee from ZHPL.
(b) Bills payable amounting to S$3,174,000 (2014: S$6,463,000) with an average maturity of 1 - 4 months (2014: 3 - 4 months) bear fixed interest rates until expiry, ranging from 2.04% to 2.93% (2014: 1.58% to 2.50%) per annum, at which point interest rate resets and are secured by a corporate guarantee given by ZHPL.
The remaining bills payable amounting to S$313,000 (2014: S$1,073,000) which bears floating interest rate at 5.11% to 5.71% (2014: 5.62% to 5.86%) per annum is secured by a fixed and floating charge over all the assets of Cesco Australia Limited.
(c) Factory loan amounting to S$548,000 (2014: S$790,000) which is made up of current and long-term portions of S$245,000 (2014: S$240,000) and S$303,000 (2014: S$550,000) respectively is repayable over the remaining 26 monthly instalments at fixed interest rate of 2.75% (2014: 1.75%) per annum. It is secured by a legal mortgage on ZHPL’s leasehold building at No. 9 Tuas Avenue 9 Singapore 639198 and a corporate guarantee from Zicom Group Limited.
The remaining factory loan due within the next 12 months amounting to S$72,000 (2014: S$421,000 made up of current portion: S$351,000; non-current portion: S$70,000) bears interest at floating rate of 3.75% (2014: 3.90%) per annum. It is secured by a legal mortgage of the subsidiary company’s freehold land and buildings at 700/895 Moo 2, Amata Nakorn Industrial Estate, Chonburi, Thailand and a corporate guarantee from ZHPL.
For
per
sona
l use
onl
y
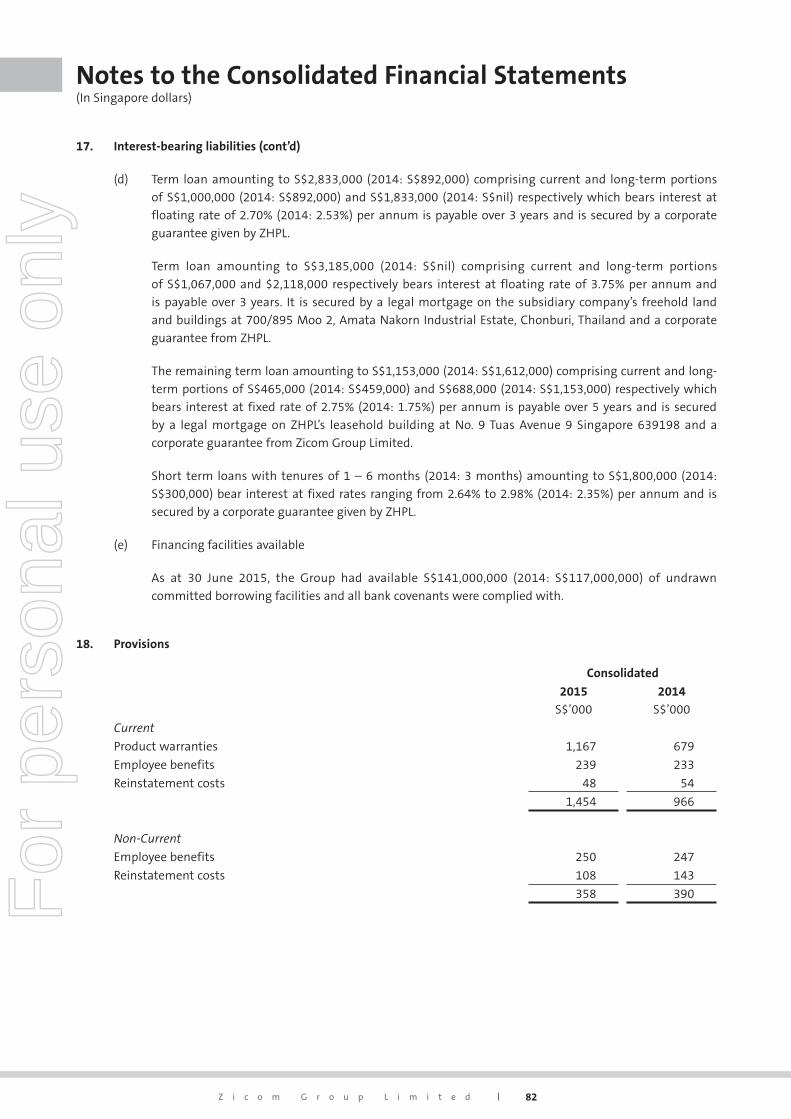
82Z i c o m G r o u p L i m i t e d
Notes to the Consolidated Financial Statements (In Singapore dollars)
17. Interest-bearing liabilities (cont’d)
(d) Term loan amounting to S$2,833,000 (2014: S$892,000) comprising current and long-term portions
of S$1,000,000 (2014: S$892,000) and S$1,833,000 (2014: S$nil) respectively which bears interest at
floating rate of 2.70% (2014: 2.53%) per annum is payable over 3 years and is secured by a corporate
guarantee given by ZHPL.
Term loan amounting to S$3,185,000 (2014: S$nil) comprising current and long-term portions
of S$1,067,000 and $2,118,000 respectively bears interest at floating rate of 3.75% per annum and
is payable over 3 years. It is secured by a legal mortgage on the subsidiary company’s freehold land
and buildings at 700/895 Moo 2, Amata Nakorn Industrial Estate, Chonburi, Thailand and a corporate
guarantee from ZHPL.
The remaining term loan amounting to S$1,153,000 (2014: S$1,612,000) comprising current and long-
term portions of S$465,000 (2014: S$459,000) and S$688,000 (2014: S$1,153,000) respectively which
bears interest at fixed rate of 2.75% (2014: 1.75%) per annum is payable over 5 years and is secured
by a legal mortgage on ZHPL’s leasehold building at No. 9 Tuas Avenue 9 Singapore 639198 and a
corporate guarantee from Zicom Group Limited.
Short term loans with tenures of 1 – 6 months (2014: 3 months) amounting to S$1,800,000 (2014:
S$300,000) bear interest at fixed rates ranging from 2.64% to 2.98% (2014: 2.35%) per annum and is
secured by a corporate guarantee given by ZHPL.
(e) Financing facilities available
As at 30 June 2015, the Group had available S$141,000,000 (2014: S$117,000,000) of undrawn
committed borrowing facilities and all bank covenants were complied with.
18. Provisions
Consolidated
2015
S$’000
2014
S$’000
Current
Product warranties 1,167 679
Employee benefits 239 233
Reinstatement costs 48 54
1,454 966
Non-Current
Employee benefits 250 247
Reinstatement costs 108 143
358 390For
per
sona
l use
onl
y
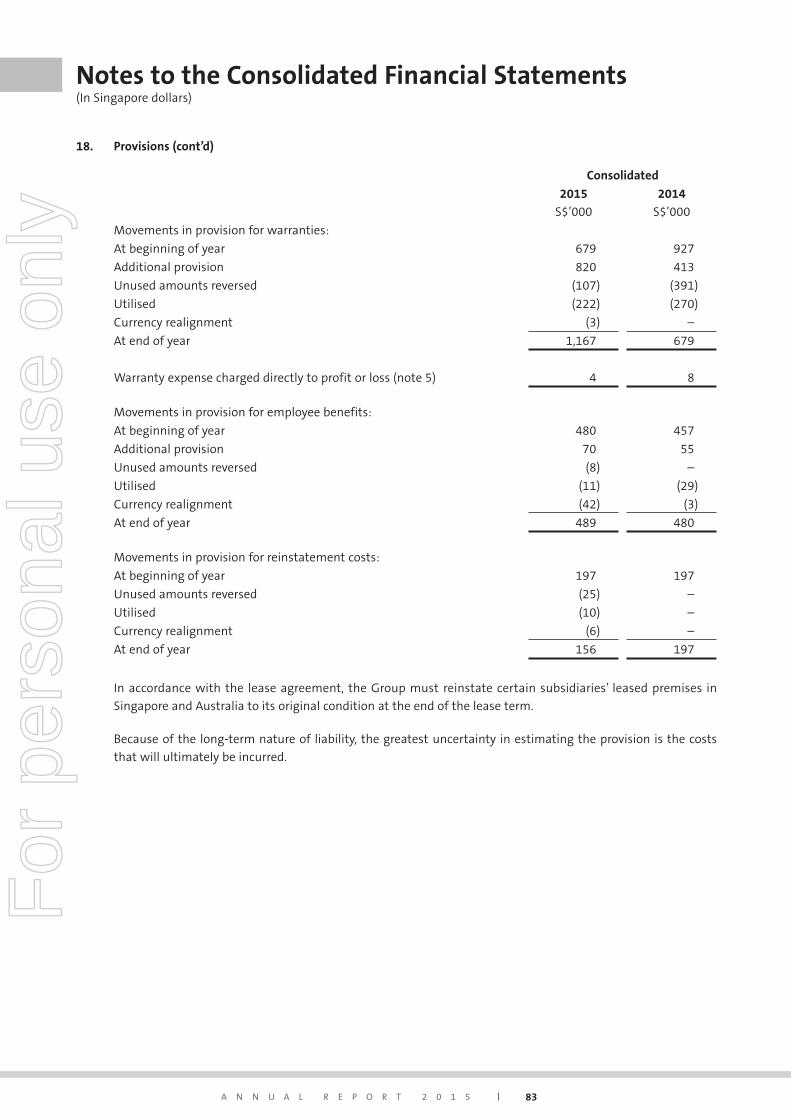
A N N U A L R E P O R T 2 0 1 5 83
Notes to the Consolidated Financial Statements (In Singapore dollars)
18. Provisions (cont’d)
Consolidated
2015
S$’000
2014
S$’000
Movements in provision for warranties:
At beginning of year 679 927
Additional provision 820 413
Unused amounts reversed (107) (391)
Utilised (222) (270)
Currency realignment (3) –
At end of year 1,167 679
Warranty expense charged directly to profit or loss (note 5) 4 8
Movements in provision for employee benefits:
At beginning of year 480 457
Additional provision 70 55
Unused amounts reversed (8) –
Utilised (11) (29)
Currency realignment (42) (3)
At end of year 489 480
Movements in provision for reinstatement costs:
At beginning of year 197 197
Unused amounts reversed (25) –
Utilised (10) –
Currency realignment (6) –
At end of year 156 197
In accordance with the lease agreement, the Group must reinstate certain subsidiaries’ leased premises in
Singapore and Australia to its original condition at the end of the lease term.
Because of the long-term nature of liability, the greatest uncertainty in estimating the provision is the costs
that will ultimately be incurred.
For
per
sona
l use
onl
y
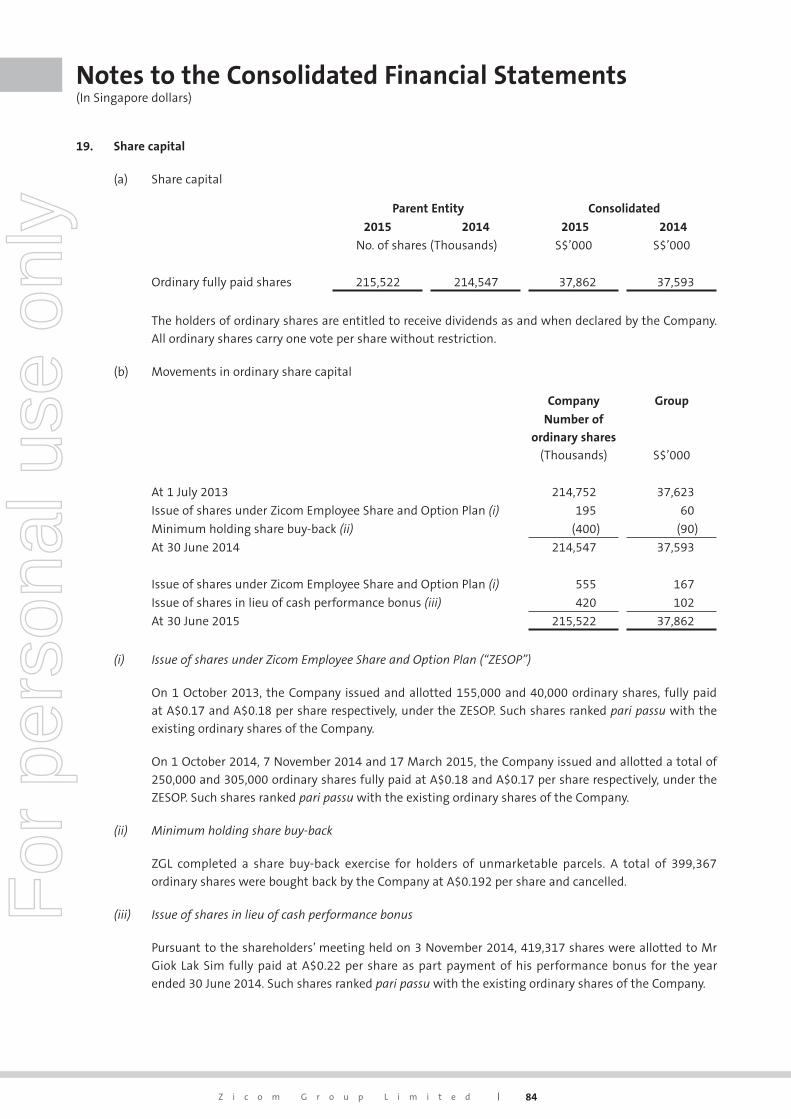
84Z i c o m G r o u p L i m i t e d
Notes to the Consolidated Financial Statements (In Singapore dollars)
19. Share capital
(a) Share capital
Parent Entity Consolidated
2015 2014 2015 2014
No. of shares (Thousands) S$’000 S$’000
Ordinary fully paid shares 215,522 214,547 37,862 37,593
The holders of ordinary shares are entitled to receive dividends as and when declared by the Company.
All ordinary shares carry one vote per share without restriction.
(b) Movements in ordinary share capital
Company Group
Number of
ordinary shares
(Thousands) S$’000
At 1 July 2013 214,752 37,623
Issue of shares under Zicom Employee Share and Option Plan (i) 195 60
Minimum holding share buy-back (ii) (400) (90)
At 30 June 2014 214,547 37,593
Issue of shares under Zicom Employee Share and Option Plan (i) 555 167
Issue of shares in lieu of cash performance bonus (iii) 420 102
At 30 June 2015 215,522 37,862
(i) Issue of shares under Zicom Employee Share and Option Plan (“ZESOP”)
On 1 October 2013, the Company issued and allotted 155,000 and 40,000 ordinary shares, fully paid
at A$0.17 and A$0.18 per share respectively, under the ZESOP. Such shares ranked pari passu with the
existing ordinary shares of the Company.
On 1 October 2014, 7 November 2014 and 17 March 2015, the Company issued and allotted a total of
250,000 and 305,000 ordinary shares fully paid at A$0.18 and A$0.17 per share respectively, under the
ZESOP. Such shares ranked pari passu with the existing ordinary shares of the Company.
(ii) Minimum holding share buy-back
ZGL completed a share buy-back exercise for holders of unmarketable parcels. A total of 399,367
ordinary shares were bought back by the Company at A$0.192 per share and cancelled.
(iii) Issue of shares in lieu of cash performance bonus
Pursuant to the shareholders’ meeting held on 3 November 2014, 419,317 shares were allotted to Mr
Giok Lak Sim fully paid at A$0.22 per share as part payment of his performance bonus for the year
ended 30 June 2014. Such shares ranked pari passu with the existing ordinary shares of the Company.
For
per
sona
l use
onl
y
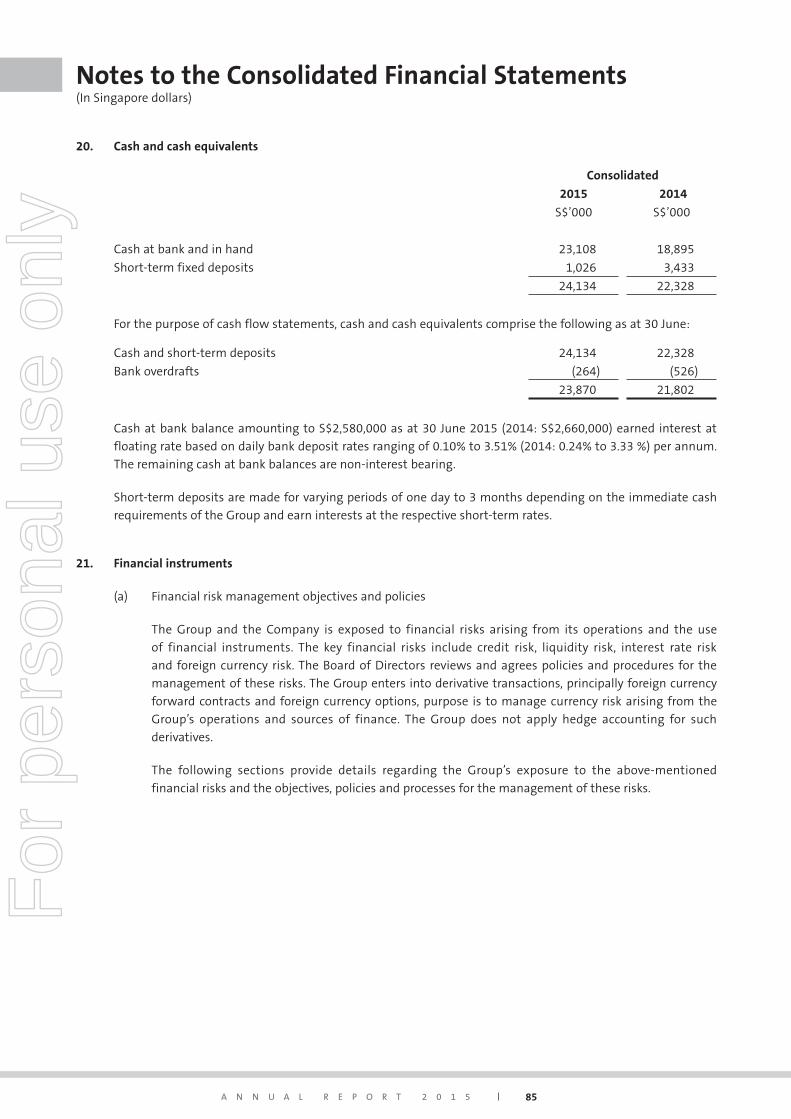
A N N U A L R E P O R T 2 0 1 5 85
Notes to the Consolidated Financial Statements (In Singapore dollars)
20. Cash and cash equivalents
Consolidated
2015 2014
S$’000 S$’000
Cash at bank and in hand 23,108 18,895
Short-term fixed deposits 1,026 3,433
24,134 22,328
For the purpose of cash flow statements, cash and cash equivalents comprise the following as at 30 June:
Cash and short-term deposits 24,134 22,328
Bank overdrafts (264) (526)
23,870 21,802
Cash at bank balance amounting to S$2,580,000 as at 30 June 2015 (2014: S$2,660,000) earned interest at
floating rate based on daily bank deposit rates ranging of 0.10% to 3.51% (2014: 0.24% to 3.33 %) per annum.
The remaining cash at bank balances are non-interest bearing.
Short-term deposits are made for varying periods of one day to 3 months depending on the immediate cash
requirements of the Group and earn interests at the respective short-term rates.
21. Financial instruments
(a) Financial risk management objectives and policies
The Group and the Company is exposed to financial risks arising from its operations and the use
of financial instruments. The key financial risks include credit risk, liquidity risk, interest rate risk
and foreign currency risk. The Board of Directors reviews and agrees policies and procedures for the
management of these risks. The Group enters into derivative transactions, principally foreign currency
forward contracts and foreign currency options, purpose is to manage currency risk arising from the
Group’s operations and sources of finance. The Group does not apply hedge accounting for such
derivatives.
The following sections provide details regarding the Group’s exposure to the above-mentioned
financial risks and the objectives, policies and processes for the management of these risks.
For
per
sona
l use
onl
y
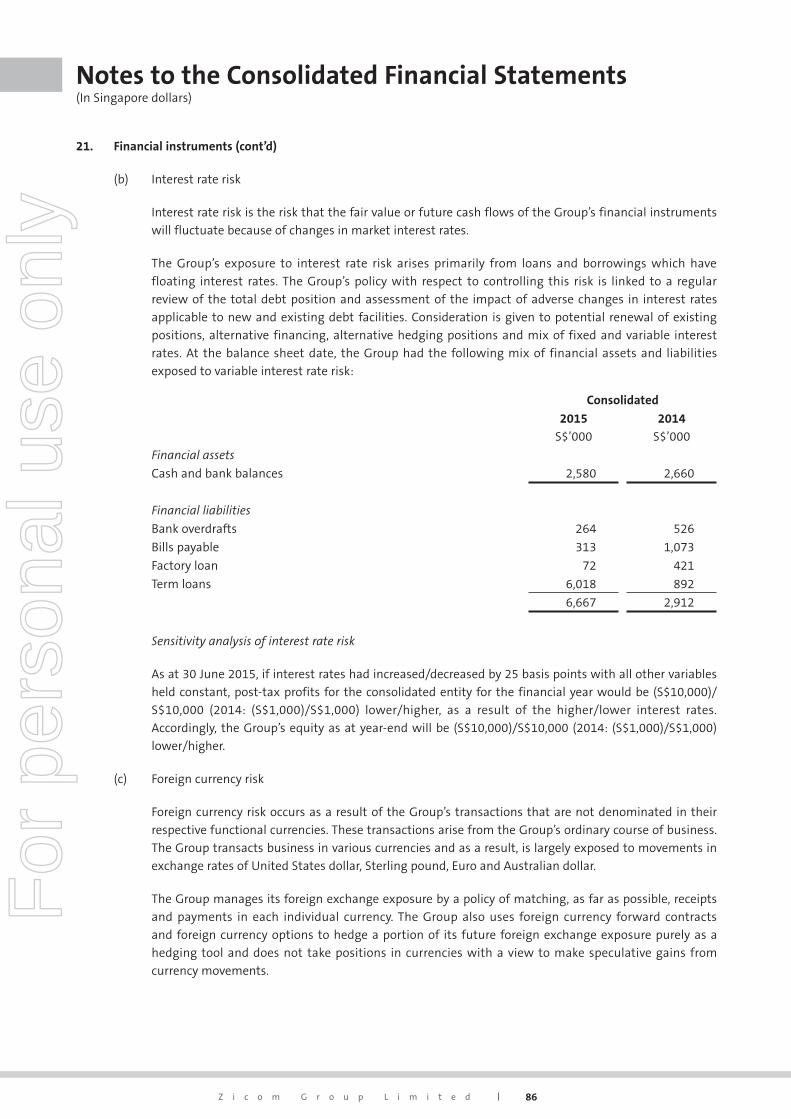
86Z i c o m G r o u p L i m i t e d
Notes to the Consolidated Financial Statements (In Singapore dollars)
21. Financial instruments (cont’d)
(b) Interest rate risk
Interest rate risk is the risk that the fair value or future cash flows of the Group’s financial instruments
will fluctuate because of changes in market interest rates.
The Group’s exposure to interest rate risk arises primarily from loans and borrowings which have
floating interest rates. The Group’s policy with respect to controlling this risk is linked to a regular
review of the total debt position and assessment of the impact of adverse changes in interest rates
applicable to new and existing debt facilities. Consideration is given to potential renewal of existing
positions, alternative financing, alternative hedging positions and mix of fixed and variable interest
rates. At the balance sheet date, the Group had the following mix of financial assets and liabilities
exposed to variable interest rate risk:
Consolidated
2015
S$’000
2014
S$’000
Financial assets
Cash and bank balances 2,580 2,660
Financial liabilities
Bank overdrafts 264 526
Bills payable 313 1,073
Factory loan 72 421
Term loans 6,018 892
6,667 2,912
Sensitivity analysis of interest rate risk
As at 30 June 2015, if interest rates had increased/decreased by 25 basis points with all other variables
held constant, post-tax profits for the consolidated entity for the financial year would be (S$10,000)/
S$10,000 (2014: (S$1,000)/S$1,000) lower/higher, as a result of the higher/lower interest rates.
Accordingly, the Group’s equity as at year-end will be (S$10,000)/S$10,000 (2014: (S$1,000)/S$1,000)
lower/higher.
(c) Foreign currency risk
Foreign currency risk occurs as a result of the Group’s transactions that are not denominated in their
respective functional currencies. These transactions arise from the Group’s ordinary course of business.
The Group transacts business in various currencies and as a result, is largely exposed to movements in
exchange rates of United States dollar, Sterling pound, Euro and Australian dollar.
The Group manages its foreign exchange exposure by a policy of matching, as far as possible, receipts
and payments in each individual currency. The Group also uses foreign currency forward contracts
and foreign currency options to hedge a portion of its future foreign exchange exposure purely as a
hedging tool and does not take positions in currencies with a view to make speculative gains from
currency movements.
For
per
sona
l use
onl
y
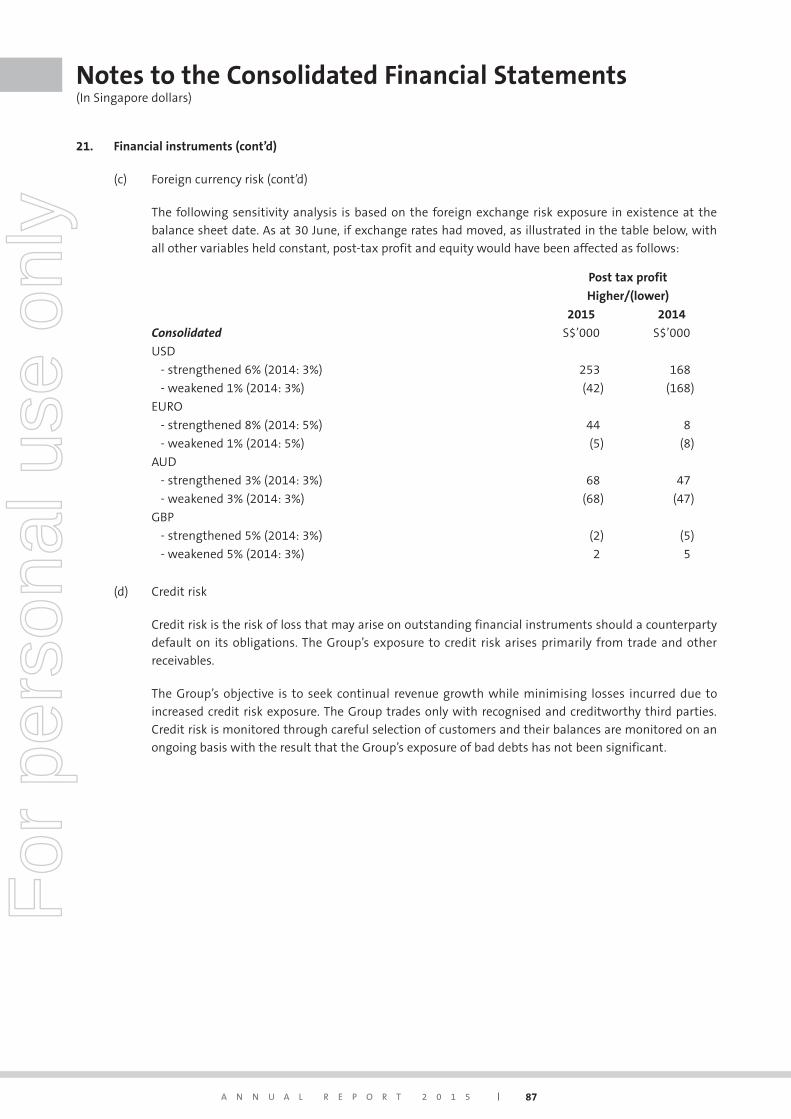
A N N U A L R E P O R T 2 0 1 5 87
Notes to the Consolidated Financial Statements (In Singapore dollars)
21. Financial instruments (cont’d)
(c) Foreign currency risk (cont’d)
The following sensitivity analysis is based on the foreign exchange risk exposure in existence at the
balance sheet date. As at 30 June, if exchange rates had moved, as illustrated in the table below, with
all other variables held constant, post-tax profit and equity would have been affected as follows:
Post tax profit
Higher/(lower)
2015 2014
Consolidated S$’000 S$’000
USD
- strengthened 6% (2014: 3%) 253 168
- weakened 1% (2014: 3%) (42) (168)
EURO
- strengthened 8% (2014: 5%) 44 8
- weakened 1% (2014: 5%) (5) (8)
AUD
- strengthened 3% (2014: 3%) 68 47
- weakened 3% (2014: 3%) (68) (47)
GBP
- strengthened 5% (2014: 3%) (2) (5)
- weakened 5% (2014: 3%) 2 5
(d) Credit risk
Credit risk is the risk of loss that may arise on outstanding financial instruments should a counterparty
default on its obligations. The Group’s exposure to credit risk arises primarily from trade and other
receivables.
The Group’s objective is to seek continual revenue growth while minimising losses incurred due to
increased credit risk exposure. The Group trades only with recognised and creditworthy third parties.
Credit risk is monitored through careful selection of customers and their balances are monitored on an
ongoing basis with the result that the Group’s exposure of bad debts has not been significant.
For
per
sona
l use
onl
y
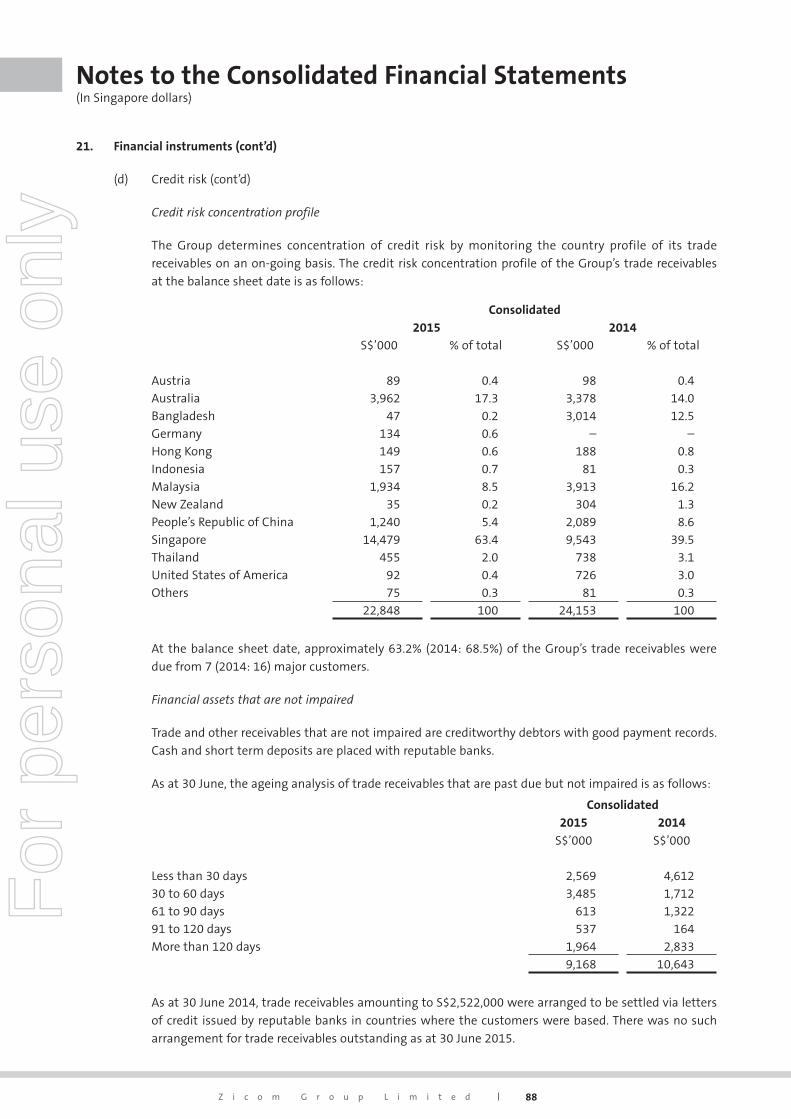
88Z i c o m G r o u p L i m i t e d
Notes to the Consolidated Financial Statements (In Singapore dollars)
21. Financial instruments (cont’d)
(d) Credit risk (cont’d)
Credit risk concentration profile
The Group determines concentration of credit risk by monitoring the country profile of its trade
receivables on an on-going basis. The credit risk concentration profile of the Group’s trade receivables
at the balance sheet date is as follows:
Consolidated2015 2014
S$’000 % of total S$’000 % of total
Austria 89 0.4 98 0.4Australia 3,962 17.3 3,378 14.0Bangladesh 47 0.2 3,014 12.5Germany 134 0.6 – – Hong Kong 149 0.6 188 0.8Indonesia 157 0.7 81 0.3Malaysia 1,934 8.5 3,913 16.2New Zealand 35 0.2 304 1.3People’s Republic of China 1,240 5.4 2,089 8.6Singapore 14,479 63.4 9,543 39.5Thailand 455 2.0 738 3.1United States of America 92 0.4 726 3.0Others 75 0.3 81 0.3
22,848 100 24,153 100
At the balance sheet date, approximately 63.2% (2014: 68.5%) of the Group’s trade receivables were
due from 7 (2014: 16) major customers.
Financial assets that are not impaired
Trade and other receivables that are not impaired are creditworthy debtors with good payment records.
Cash and short term deposits are placed with reputable banks.
As at 30 June, the ageing analysis of trade receivables that are past due but not impaired is as follows:
Consolidated2015
S$’000
2014
S$’000
Less than 30 days 2,569 4,61230 to 60 days 3,485 1,71261 to 90 days 613 1,32291 to 120 days 537 164More than 120 days 1,964 2,833
9,168 10,643
As at 30 June 2014, trade receivables amounting to S$2,522,000 were arranged to be settled via letters
of credit issued by reputable banks in countries where the customers were based. There was no such
arrangement for trade receivables outstanding as at 30 June 2015.
For
per
sona
l use
onl
y
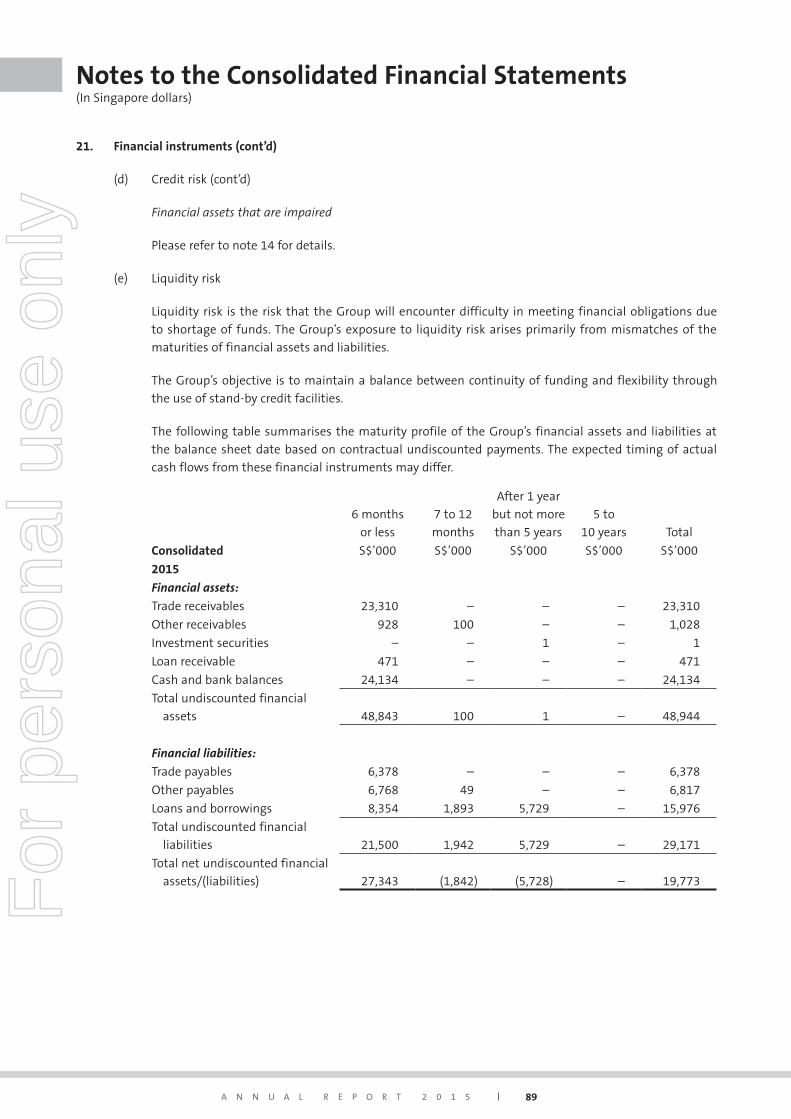
A N N U A L R E P O R T 2 0 1 5 89
Notes to the Consolidated Financial Statements (In Singapore dollars)
21. Financial instruments (cont’d)
(d) Credit risk (cont’d)
Financial assets that are impaired
Please refer to note 14 for details.
(e) Liquidity risk
Liquidity risk is the risk that the Group will encounter difficulty in meeting financial obligations due
to shortage of funds. The Group’s exposure to liquidity risk arises primarily from mismatches of the
maturities of financial assets and liabilities.
The Group’s objective is to maintain a balance between continuity of funding and flexibility through
the use of stand-by credit facilities.
The following table summarises the maturity profile of the Group’s financial assets and liabilities at
the balance sheet date based on contractual undiscounted payments. The expected timing of actual
cash flows from these financial instruments may differ.
6 months
or less
7 to 12
months
After 1 year
but not more
than 5 years
5 to
10 years Total
Consolidated S$’000 S$’000 S$’000 S$’000 S$’000
2015
Financialassets:
Trade receivables 23,310 – – – 23,310
Other receivables 928 100 – – 1,028
Investment securities – – 1 – 1
Loan receivable 471 – – – 471
Cash and bank balances 24,134 – – – 24,134
Total undiscounted financial
assets 48,843 100 1 – 48,944
Financialliabilities:
Trade payables 6,378 – – – 6,378
Other payables 6,768 49 – – 6,817
Loans and borrowings 8,354 1,893 5,729 – 15,976
Total undiscounted financial
liabilities 21,500 1,942 5,729 – 29,171
Total net undiscounted financial
assets/(liabilities) 27,343 (1,842) (5,728) – 19,773For
per
sona
l use
onl
y
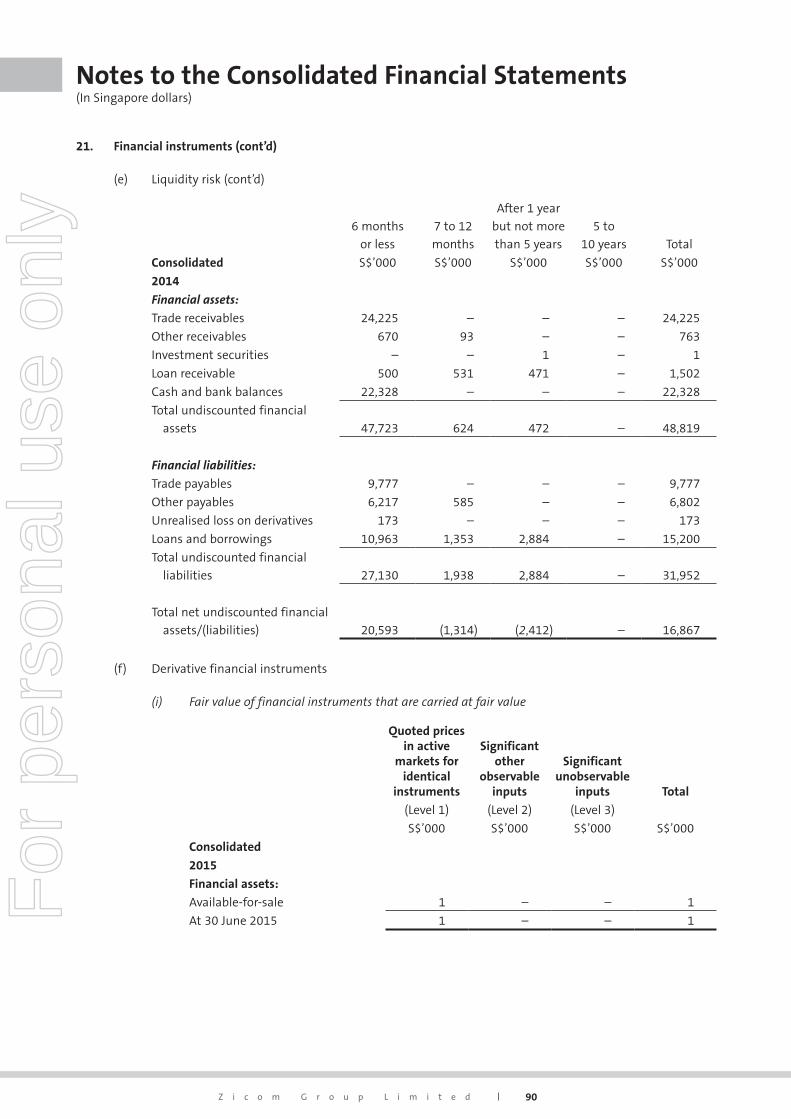
90Z i c o m G r o u p L i m i t e d
Notes to the Consolidated Financial Statements (In Singapore dollars)
21. Financial instruments (cont’d)
(e) Liquidity risk (cont’d)
6 months
or less
7 to 12
months
After 1 year
but not more
than 5 years
5 to
10 years Total
Consolidated S$’000 S$’000 S$’000 S$’000 S$’000
2014
Financialassets:
Trade receivables 24,225 – – – 24,225
Other receivables 670 93 – – 763
Investment securities – – 1 – 1
Loan receivable 500 531 471 – 1,502
Cash and bank balances 22,328 – – – 22,328
Total undiscounted financial
assets 47,723 624 472 – 48,819
Financialliabilities:
Trade payables 9,777 – – – 9,777
Other payables 6,217 585 – – 6,802
Unrealised loss on derivatives 173 – – – 173
Loans and borrowings 10,963 1,353 2,884 – 15,200
Total undiscounted financial
liabilities 27,130 1,938 2,884 – 31,952
Total net undiscounted financial
assets/(liabilities) 20,593 (1,314) (2,412) – 16,867
(f) Derivative financial instruments
(i) Fair value of financial instruments that are carried at fair value
Quoted prices in active
markets for identical
instruments
Significant other
observable inputs
Significant unobservable
inputs Total
(Level 1) (Level 2) (Level 3)
S$’000 S$’000 S$’000 S$’000
Consolidated
2015
Financial assets:
Available-for-sale 1 – – 1
At 30 June 2015 1 – – 1For
per
sona
l use
onl
y
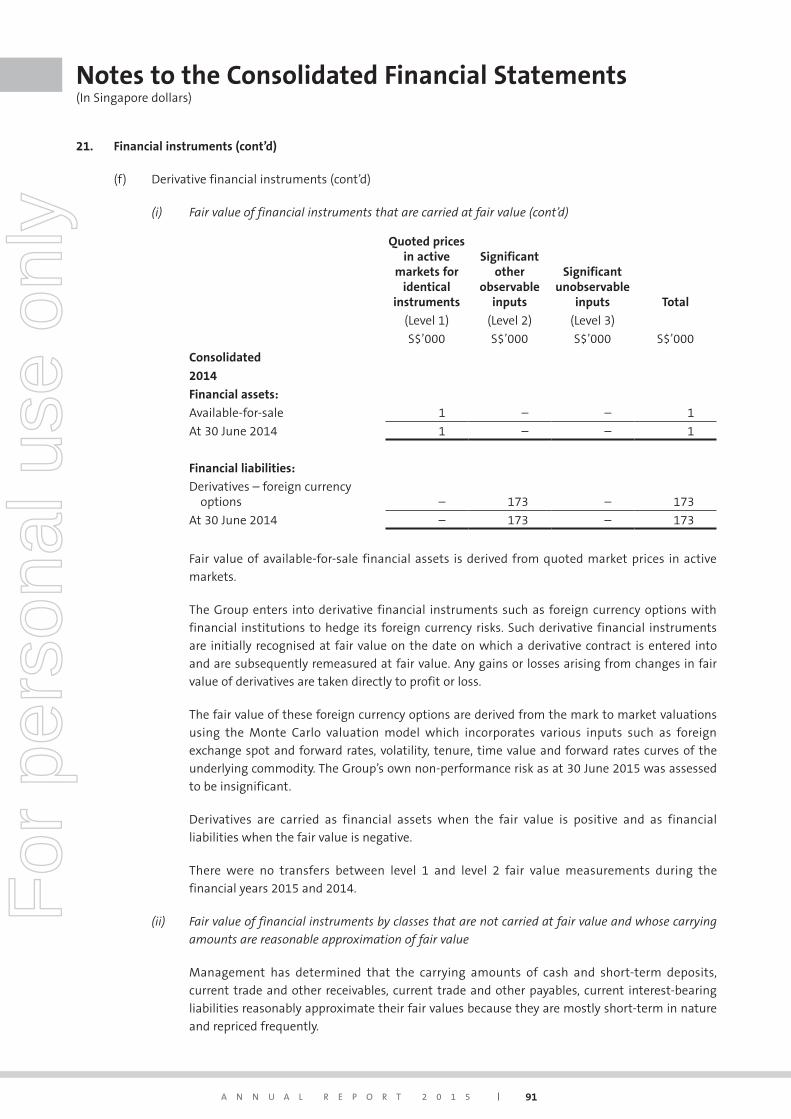
A N N U A L R E P O R T 2 0 1 5 91
Notes to the Consolidated Financial Statements (In Singapore dollars)
21. Financial instruments (cont’d)
(f) Derivative financial instruments (cont’d)
(i) Fair value of financial instruments that are carried at fair value (cont’d)
Quoted prices in active
markets for identical
instruments
Significant other
observable inputs
Significant unobservable
inputs Total
(Level 1) (Level 2) (Level 3)
S$’000 S$’000 S$’000 S$’000
Consolidated
2014
Financial assets:
Available-for-sale 1 – – 1
At 30 June 2014 1 – – 1
Financial liabilities:
Derivatives – foreign currency options – 173 – 173
At 30 June 2014 – 173 – 173
Fair value of available-for-sale financial assets is derived from quoted market prices in active
markets.
The Group enters into derivative financial instruments such as foreign currency options with
financial institutions to hedge its foreign currency risks. Such derivative financial instruments
are initially recognised at fair value on the date on which a derivative contract is entered into
and are subsequently remeasured at fair value. Any gains or losses arising from changes in fair
value of derivatives are taken directly to profit or loss.
The fair value of these foreign currency options are derived from the mark to market valuations
using the Monte Carlo valuation model which incorporates various inputs such as foreign
exchange spot and forward rates, volatility, tenure, time value and forward rates curves of the
underlying commodity. The Group’s own non-performance risk as at 30 June 2015 was assessed
to be insignificant.
Derivatives are carried as financial assets when the fair value is positive and as financial
liabilities when the fair value is negative.
There were no transfers between level 1 and level 2 fair value measurements during the
financial years 2015 and 2014.
(ii) Fair value of financial instruments by classes that are not carried at fair value and whose carrying
amounts are reasonable approximation of fair value
Management has determined that the carrying amounts of cash and short-term deposits,
current trade and other receivables, current trade and other payables, current interest-bearing
liabilities reasonably approximate their fair values because they are mostly short-term in nature
and repriced frequently.
For
per
sona
l use
onl
y
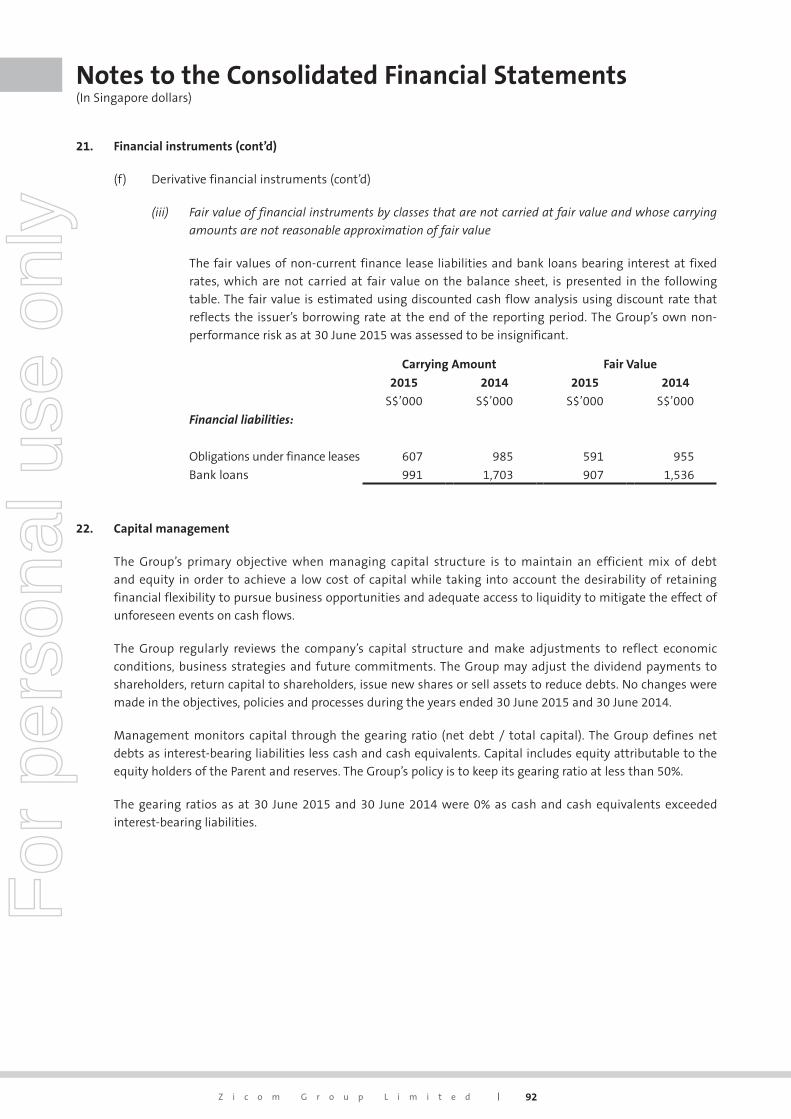
92Z i c o m G r o u p L i m i t e d
Notes to the Consolidated Financial Statements (In Singapore dollars)
21. Financial instruments (cont’d)
(f) Derivative financial instruments (cont’d)
(iii) Fair value of financial instruments by classes that are not carried at fair value and whose carrying
amounts are not reasonable approximation of fair value
The fair values of non-current finance lease liabilities and bank loans bearing interest at fixed
rates, which are not carried at fair value on the balance sheet, is presented in the following
table. The fair value is estimated using discounted cash flow analysis using discount rate that
reflects the issuer’s borrowing rate at the end of the reporting period. The Group’s own non-
performance risk as at 30 June 2015 was assessed to be insignificant.
Carrying Amount Fair Value
2015 2014 2015 2014
S$’000 S$’000 S$’000 S$’000
Financialliabilities:
Obligations under finance leases 607 985 591 955
Bank loans 991 1,703 907 1,536
22. Capital management
The Group’s primary objective when managing capital structure is to maintain an efficient mix of debt
and equity in order to achieve a low cost of capital while taking into account the desirability of retaining
financial flexibility to pursue business opportunities and adequate access to liquidity to mitigate the effect of
unforeseen events on cash flows.
The Group regularly reviews the company’s capital structure and make adjustments to reflect economic
conditions, business strategies and future commitments. The Group may adjust the dividend payments to
shareholders, return capital to shareholders, issue new shares or sell assets to reduce debts. No changes were
made in the objectives, policies and processes during the years ended 30 June 2015 and 30 June 2014.
Management monitors capital through the gearing ratio (net debt / total capital). The Group defines net
debts as interest-bearing liabilities less cash and cash equivalents. Capital includes equity attributable to the
equity holders of the Parent and reserves. The Group’s policy is to keep its gearing ratio at less than 50%.
The gearing ratios as at 30 June 2015 and 30 June 2014 were 0% as cash and cash equivalents exceeded
interest-bearing liabilities.
For
per
sona
l use
onl
y
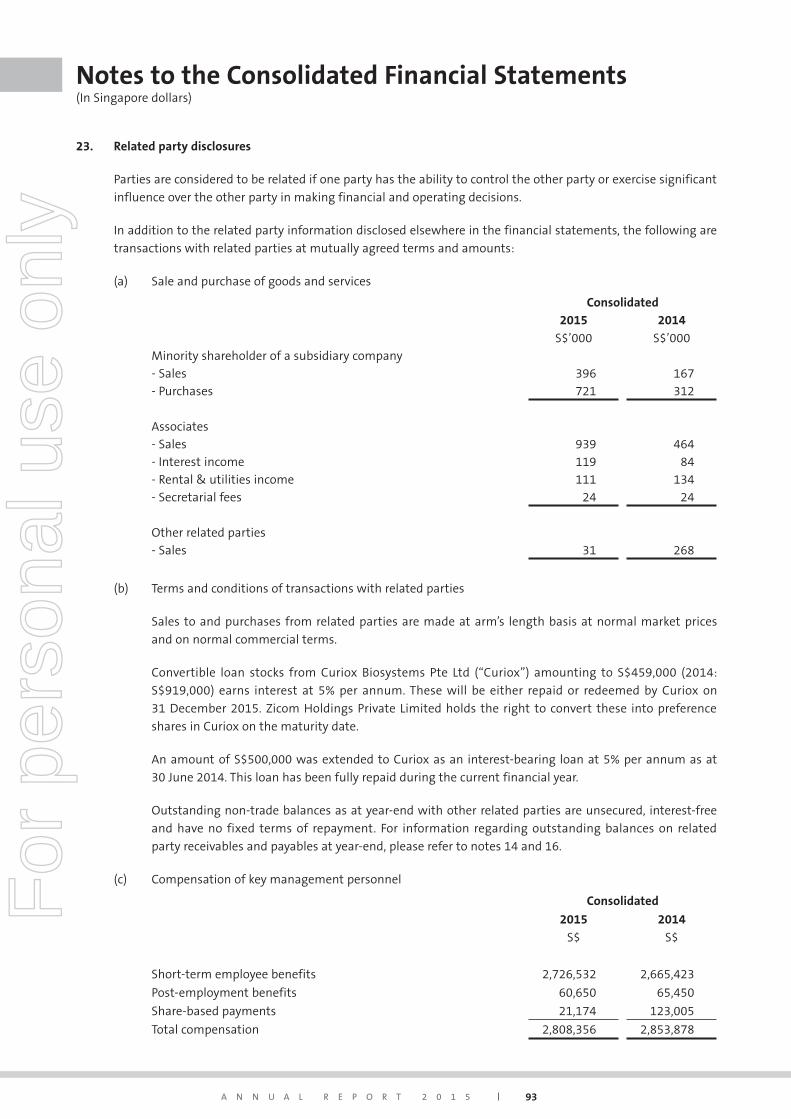
A N N U A L R E P O R T 2 0 1 5 93
Notes to the Consolidated Financial Statements (In Singapore dollars)
23. Related party disclosures
Parties are considered to be related if one party has the ability to control the other party or exercise significant
influence over the other party in making financial and operating decisions.
In addition to the related party information disclosed elsewhere in the financial statements, the following are
transactions with related parties at mutually agreed terms and amounts:
(a) Sale and purchase of goods and services
Consolidated2015
S$’000
2014
S$’000Minority shareholder of a subsidiary company- Sales 396 167- Purchases 721 312
Associates- Sales 939 464- Interest income 119 84- Rental & utilities income 111 134- Secretarial fees 24 24
Other related parties- Sales 31 268
(b) Terms and conditions of transactions with related parties
Sales to and purchases from related parties are made at arm’s length basis at normal market prices
and on normal commercial terms.
Convertible loan stocks from Curiox Biosystems Pte Ltd (“Curiox”) amounting to S$459,000 (2014:
S$919,000) earns interest at 5% per annum. These will be either repaid or redeemed by Curiox on
31 December 2015. Zicom Holdings Private Limited holds the right to convert these into preference
shares in Curiox on the maturity date.
An amount of S$500,000 was extended to Curiox as an interest-bearing loan at 5% per annum as at
30 June 2014. This loan has been fully repaid during the current financial year.
Outstanding non-trade balances as at year-end with other related parties are unsecured, interest-free
and have no fixed terms of repayment. For information regarding outstanding balances on related
party receivables and payables at year-end, please refer to notes 14 and 16.
(c) Compensation of key management personnel
Consolidated
2015
S$
2014
S$
Short-term employee benefits 2,726,532 2,665,423
Post-employment benefits 60,650 65,450
Share-based payments 21,174 123,005
Total compensation 2,808,356 2,853,878
For
per
sona
l use
onl
y
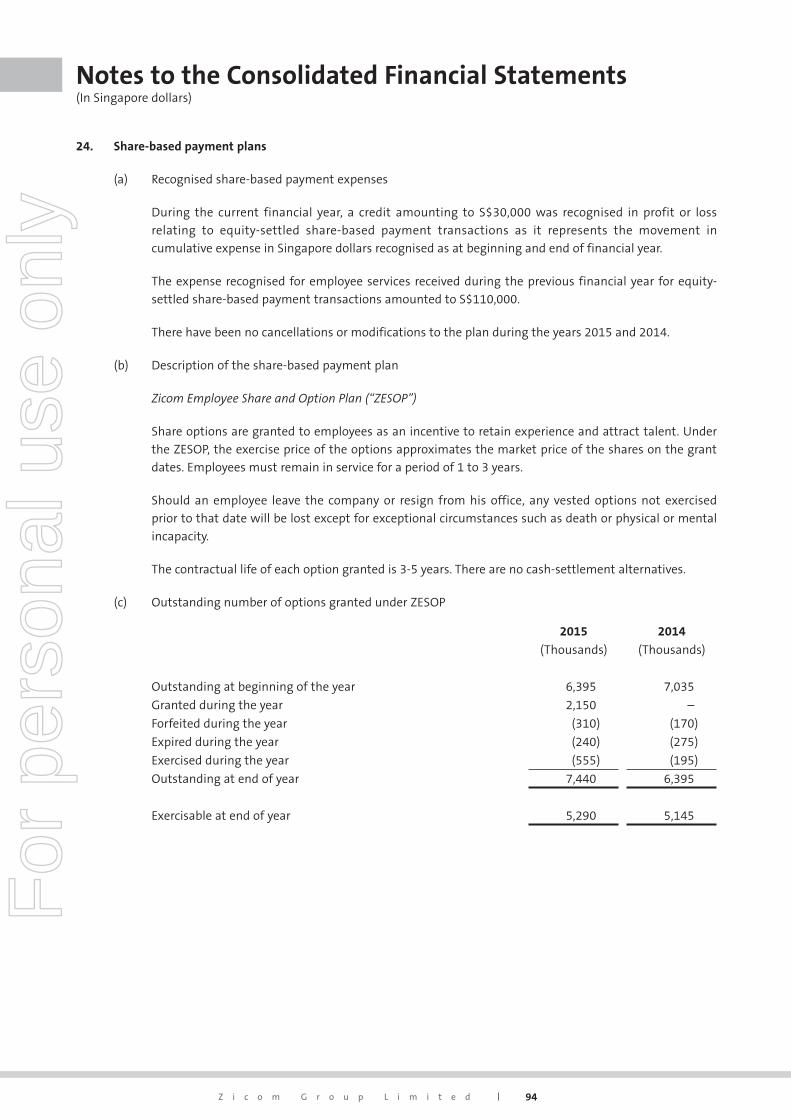
94Z i c o m G r o u p L i m i t e d
Notes to the Consolidated Financial Statements (In Singapore dollars)
24. Share-based payment plans
(a) Recognised share-based payment expenses
During the current financial year, a credit amounting to S$30,000 was recognised in profit or loss
relating to equity-settled share-based payment transactions as it represents the movement in
cumulative expense in Singapore dollars recognised as at beginning and end of financial year.
The expense recognised for employee services received during the previous financial year for equity-
settled share-based payment transactions amounted to S$110,000.
There have been no cancellations or modifications to the plan during the years 2015 and 2014.
(b) Description of the share-based payment plan
Zicom Employee Share and Option Plan (“ZESOP”)
Share options are granted to employees as an incentive to retain experience and attract talent. Under
the ZESOP, the exercise price of the options approximates the market price of the shares on the grant
dates. Employees must remain in service for a period of 1 to 3 years.
Should an employee leave the company or resign from his office, any vested options not exercised
prior to that date will be lost except for exceptional circumstances such as death or physical or mental
incapacity.
The contractual life of each option granted is 3-5 years. There are no cash-settlement alternatives.
(c) Outstanding number of options granted under ZESOP
2015 2014
(Thousands) (Thousands)
Outstanding at beginning of the year 6,395 7,035
Granted during the year 2,150 –
Forfeited during the year (310) (170)
Expired during the year (240) (275)
Exercised during the year (555) (195)
Outstanding at end of year 7,440 6,395
Exercisable at end of year 5,290 5,145
For
per
sona
l use
onl
y
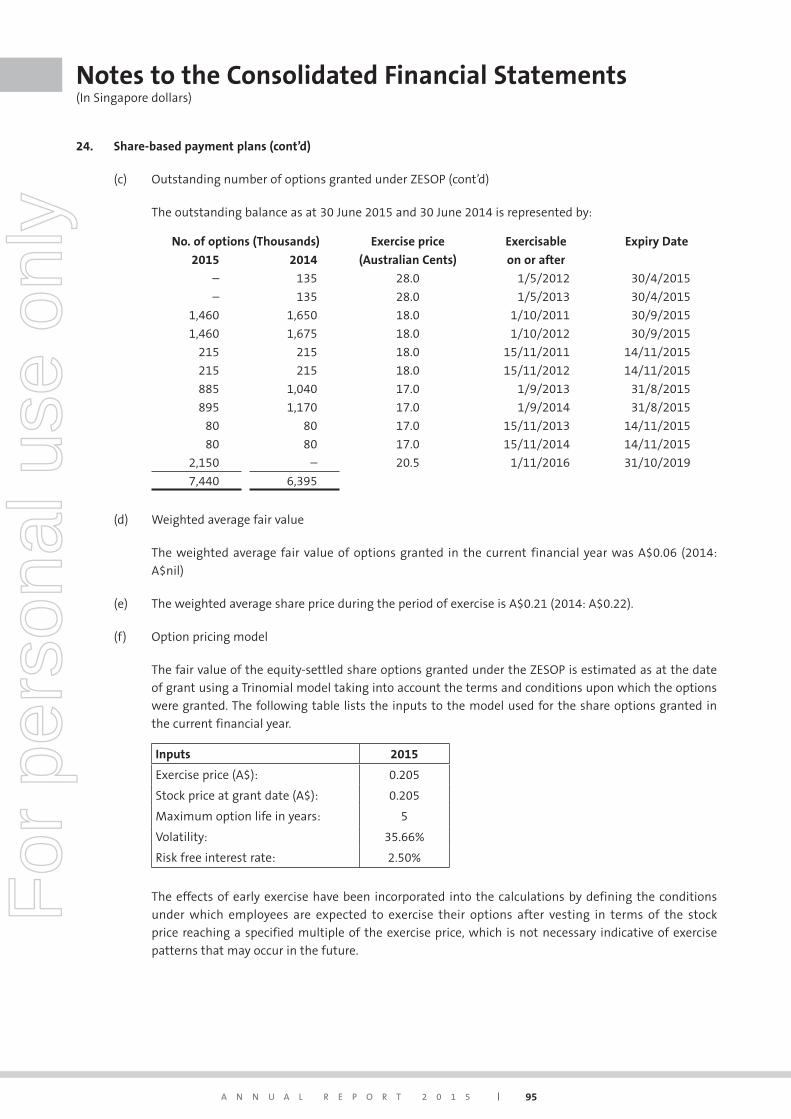
A N N U A L R E P O R T 2 0 1 5 95
Notes to the Consolidated Financial Statements (In Singapore dollars)
24. Share-based payment plans (cont’d)
(c) Outstanding number of options granted under ZESOP (cont’d)
The outstanding balance as at 30 June 2015 and 30 June 2014 is represented by:
No. of options (Thousands) Exercise price Exercisable Expiry Date
2015 2014 (Australian Cents) on or after
– 135 28.0 1/5/2012 30/4/2015
– 135 28.0 1/5/2013 30/4/2015
1,460 1,650 18.0 1/10/2011 30/9/2015
1,460 1,675 18.0 1/10/2012 30/9/2015
215 215 18.0 15/11/2011 14/11/2015
215 215 18.0 15/11/2012 14/11/2015
885 1,040 17.0 1/9/2013 31/8/2015
895 1,170 17.0 1/9/2014 31/8/2015
80 80 17.0 15/11/2013 14/11/2015
80 80 17.0 15/11/2014 14/11/2015
2,150 – 20.5 1/11/2016 31/10/2019
7,440 6,395
(d) Weighted average fair value
The weighted average fair value of options granted in the current financial year was A$0.06 (2014:
A$nil)
(e) The weighted average share price during the period of exercise is A$0.21 (2014: A$0.22).
(f) Option pricing model
The fair value of the equity-settled share options granted under the ZESOP is estimated as at the date
of grant using a Trinomial model taking into account the terms and conditions upon which the options
were granted. The following table lists the inputs to the model used for the share options granted in
the current financial year.
Inputs 2015
Exercise price (A$): 0.205
Stock price at grant date (A$): 0.205
Maximum option life in years: 5
Volatility: 35.66%
Risk free interest rate: 2.50%
The effects of early exercise have been incorporated into the calculations by defining the conditions
under which employees are expected to exercise their options after vesting in terms of the stock
price reaching a specified multiple of the exercise price, which is not necessary indicative of exercise
patterns that may occur in the future.
For
per
sona
l use
onl
y
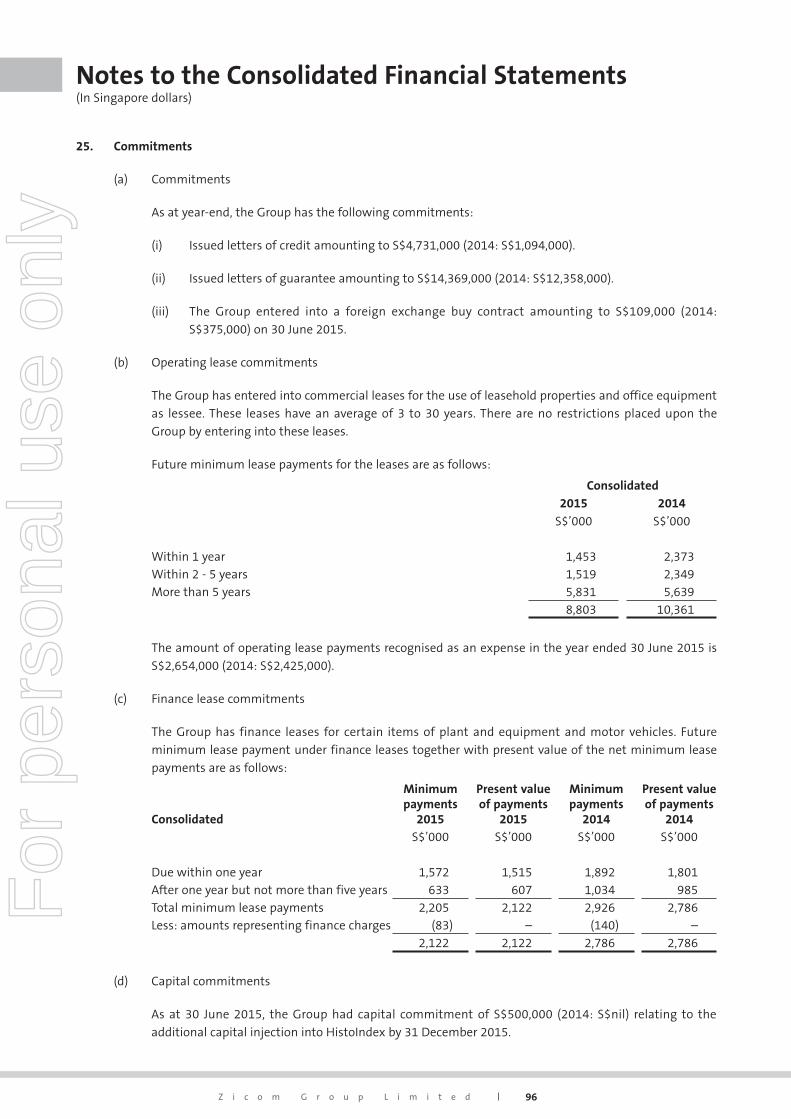
96Z i c o m G r o u p L i m i t e d
Notes to the Consolidated Financial Statements (In Singapore dollars)
25. Commitments
(a) Commitments
As at year-end, the Group has the following commitments:
(i) Issued letters of credit amounting to S$4,731,000 (2014: S$1,094,000).
(ii) Issued letters of guarantee amounting to S$14,369,000 (2014: S$12,358,000).
(iii) The Group entered into a foreign exchange buy contract amounting to S$109,000 (2014:
S$375,000) on 30 June 2015.
(b) Operating lease commitments
The Group has entered into commercial leases for the use of leasehold properties and office equipment
as lessee. These leases have an average of 3 to 30 years. There are no restrictions placed upon the
Group by entering into these leases.
Future minimum lease payments for the leases are as follows:
Consolidated2015
S$’000
2014
S$’000
Within 1 year 1,453 2,373Within 2 - 5 years 1,519 2,349More than 5 years 5,831 5,639
8,803 10,361
The amount of operating lease payments recognised as an expense in the year ended 30 June 2015 is
S$2,654,000 (2014: S$2,425,000).
(c) Finance lease commitments
The Group has finance leases for certain items of plant and equipment and motor vehicles. Future
minimum lease payment under finance leases together with present value of the net minimum lease
payments are as follows:
Consolidated
Minimum payments
2015
Present value of payments
2015
Minimum payments
2014
Present value of payments
2014S$’000 S$’000 S$’000 S$’000
Due within one year 1,572 1,515 1,892 1,801After one year but not more than five years 633 607 1,034 985Total minimum lease payments 2,205 2,122 2,926 2,786Less: amounts representing finance charges (83) – (140) –
2,122 2,122 2,786 2,786
(d) Capital commitments
As at 30 June 2015, the Group had capital commitment of S$500,000 (2014: S$nil) relating to the
additional capital injection into HistoIndex by 31 December 2015.
For
per
sona
l use
onl
y
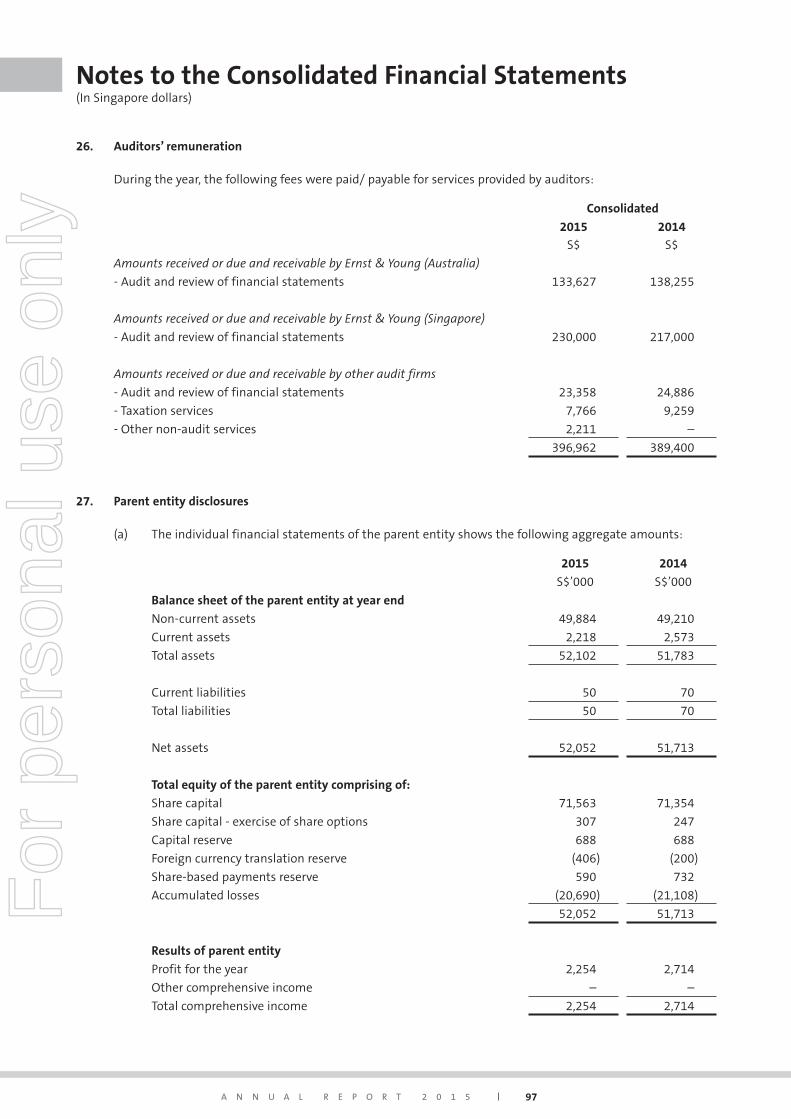
A N N U A L R E P O R T 2 0 1 5 97
Notes to the Consolidated Financial Statements (In Singapore dollars)
26. Auditors’ remuneration
During the year, the following fees were paid/ payable for services provided by auditors:
Consolidated
2015
S$
2014
S$
Amounts received or due and receivable by Ernst & Young (Australia)
- Audit and review of financial statements 133,627 138,255
Amounts received or due and receivable by Ernst & Young (Singapore)
- Audit and review of financial statements 230,000 217,000
Amounts received or due and receivable by other audit firms
- Audit and review of financial statements 23,358 24,886
- Taxation services 7,766 9,259
- Other non-audit services 2,211 –
396,962 389,400
27. Parent entity disclosures
(a) The individual financial statements of the parent entity shows the following aggregate amounts:
2015 2014
S$’000 S$’000
Balance sheet of the parent entity at year end
Non-current assets 49,884 49,210
Current assets 2,218 2,573
Total assets 52,102 51,783
Current liabilities 50 70
Total liabilities 50 70
Net assets 52,052 51,713
Total equity of the parent entity comprising of:
Share capital 71,563 71,354
Share capital - exercise of share options 307 247
Capital reserve 688 688
Foreign currency translation reserve (406) (200)
Share-based payments reserve 590 732
Accumulated losses (20,690) (21,108)
52,052 51,713
Results of parent entity
Profit for the year 2,254 2,714
Other comprehensive income – –
Total comprehensive income 2,254 2,714
For
per
sona
l use
onl
y
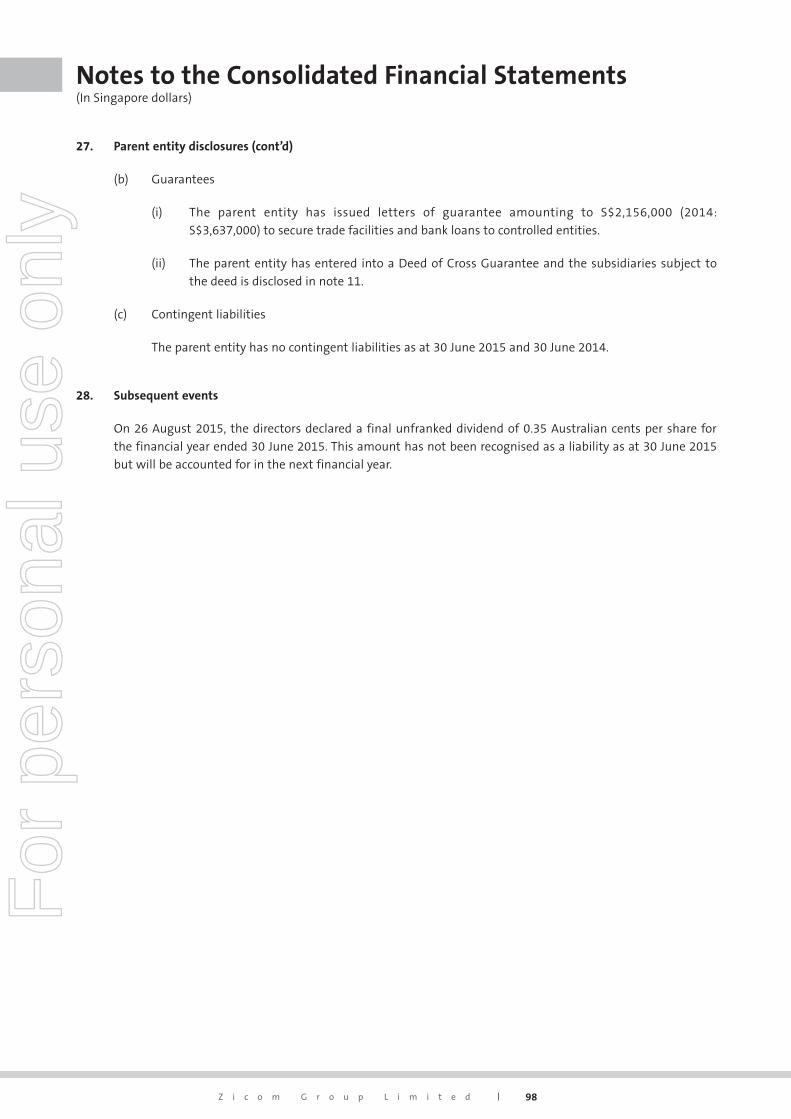
98Z i c o m G r o u p L i m i t e d
Notes to the Consolidated Financial Statements (In Singapore dollars)
27. Parent entity disclosures (cont’d)
(b) Guarantees
(i) The parent entity has issued letters of guarantee amounting to S$2,156,000 (2014:
S$3,637,000) to secure trade facilities and bank loans to controlled entities.
(ii) The parent entity has entered into a Deed of Cross Guarantee and the subsidiaries subject to
the deed is disclosed in note 11.
(c) Contingent liabilities
The parent entity has no contingent liabilities as at 30 June 2015 and 30 June 2014.
28. Subsequent events
On 26 August 2015, the directors declared a final unfranked dividend of 0.35 Australian cents per share for
the financial year ended 30 June 2015. This amount has not been recognised as a liability as at 30 June 2015
but will be accounted for in the next financial year.
For
per
sona
l use
onl
y
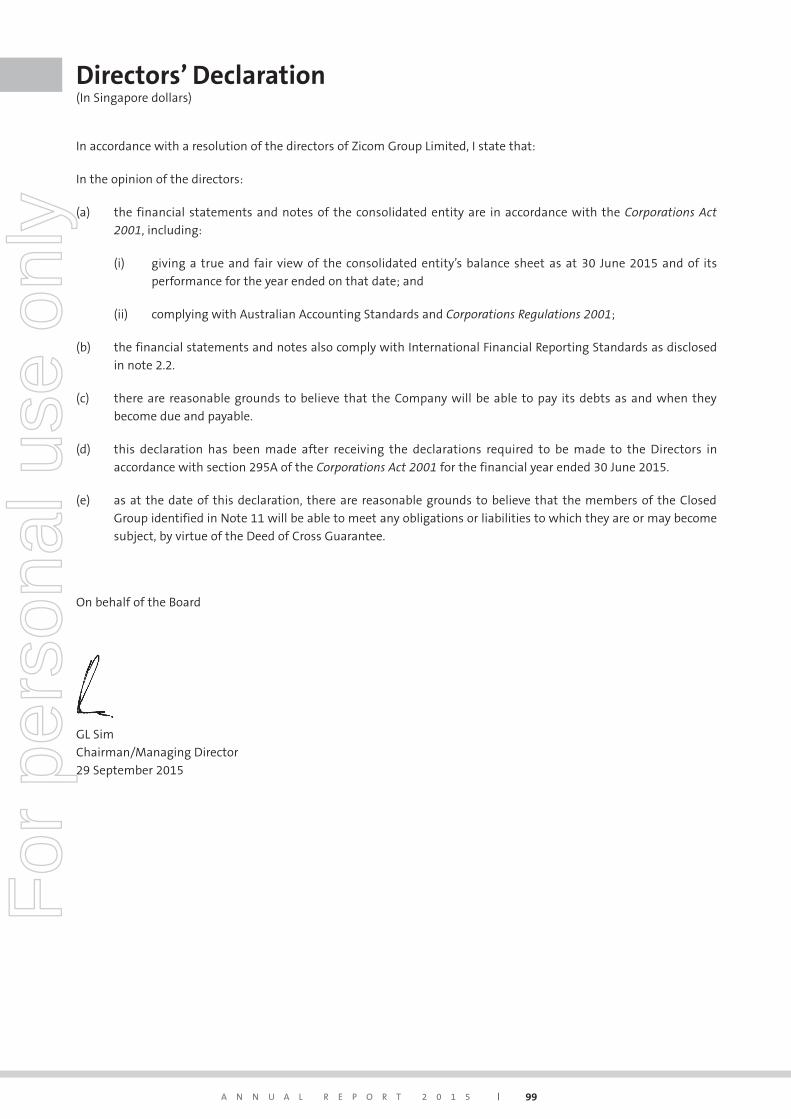
A N N U A L R E P O R T 2 0 1 5 99
In accordance with a resolution of the directors of Zicom Group Limited, I state that:
In the opinion of the directors:
(a) the financial statements and notes of the consolidated entity are in accordance with the Corporations Act
2001, including:
(i) giving a true and fair view of the consolidated entity’s balance sheet as at 30 June 2015 and of its
performance for the year ended on that date; and
(ii) complying with Australian Accounting Standards and Corporations Regulations 2001;
(b) the financial statements and notes also comply with International Financial Reporting Standards as disclosed
in note 2.2.
(c) there are reasonable grounds to believe that the Company will be able to pay its debts as and when they
become due and payable.
(d) this declaration has been made after receiving the declarations required to be made to the Directors in
accordance with section 295A of the Corporations Act 2001 for the financial year ended 30 June 2015.
(e) as at the date of this declaration, there are reasonable grounds to believe that the members of the Closed
Group identified in Note 11 will be able to meet any obligations or liabilities to which they are or may become
subject, by virtue of the Deed of Cross Guarantee.
On behalf of the Board
GL Sim
Chairman/Managing Director
29 September 2015
Directors’ Declaration(In Singapore dollars)
For
per
sona
l use
onl
y
100Z i c o m G r o u p L i m i t e d
Report on the financial report
We have audited the accompanying financial report of Zicom Group Limited, which comprises the consolidated
balance sheet as at 30 June 2015, the consolidated statement of comprehensive income, the consolidated statement
of changes in equity and the consolidated statement of cash flows for the year then ended, notes comprising a
summary of significant accounting policies and other explanatory information, and the directors’ declaration of the
consolidated entity comprising the company and the entities it controlled at the year’s end or from time to time
during the financial year.
Directors’responsibilityforthefinancialreport
The directors of the company are responsible for the preparation of the financial report that gives a true and fair
view in accordance with Australian Accounting Standards and the Corporations Act 2001 and for such internal
controls as the directors determine are necessary to enable the preparation of the financial report that is free from
material misstatement, whether due to fraud or error. In Note 2.2, the directors also state, in accordance with
Australian Accounting Standard AASB 101 Presentation of Financial Statements, that the financial statements comply
with International Financial Reporting Standards.
Auditor’sresponsibility
Our responsibility is to express an opinion on the financial report based on our audit. We conducted our audit
in accordance with Australian Auditing Standards. Those standards require that we comply with relevant ethical
requirements relating to audit engagements and plan and perform the audit to obtain reasonable assurance about
whether the financial report is free from material misstatement.
An audit involves performing procedures to obtain audit evidence about the amounts and disclosures in the financial
report. The procedures selected depend on the auditor’s judgment, including the assessment of the risks of material
misstatement of the financial report, whether due to fraud or error. In making those risk assessments, the auditor
considers internal controls relevant to the entity’s preparation and fair presentation of the financial report in order
to design audit procedures that are appropriate in the circumstances, but not for the purpose of expressing an
opinion on the effectiveness of the entity’s internal controls. An audit also includes evaluating the appropriateness
of accounting policies used and the reasonableness of accounting estimates made by the directors, as well as
evaluating the overall presentation of the financial report.
We believe that the audit evidence we have obtained is sufficient and appropriate to provide a basis for our audit
opinion.
Independence
In conducting our audit we have complied with the independence requirements of the Corporations Act 2001. We
have given to the directors of the company a written Auditor’s Independence Declaration, a copy of which is included
in the directors’ report.
Independent Auditor’s Reportto the members of Zicom Group Limited
For
per
sona
l use
onl
y
A N N U A L R E P O R T 2 0 1 5 101
Opinion
In our opinion:
a. the financial report of Zicom Group Limited is in accordance with the Corporations Act 2001, including:
i giving a true and fair view of the consolidated entity’s financial position as at 30 June 2015 and of its
performance for the year ended on that date; and
ii complying with Australian Accounting Standards and the Corporations Regulations 2001; and
b. the financial report also complies with International Financial Reporting Standards as disclosed in Note 2.2.
Report on the remuneration report
We have audited the Remuneration Report included in the directors’ report for the year ended 30 June 2015.
The directors of the company are responsible for the preparation and presentation of the Remuneration Report
in accordance with section 300A of the Corporations Act 2001. Our responsibility is to express an opinion on the
Remuneration Report, based on our audit conducted in accordance with Australian Auditing Standards.
Opinion
In our opinion, the Remuneration Report of Zicom Group Limited for the year ended 30 June 2015 complies with
section 300A of the Corporations Act 2001.
Ernst & Young
Ric Roach
Partner
Brisbane
29 September 2015
Independent Auditor’s Reportto the members of Zicom Group Limited
For
per
sona
l use
onl
y
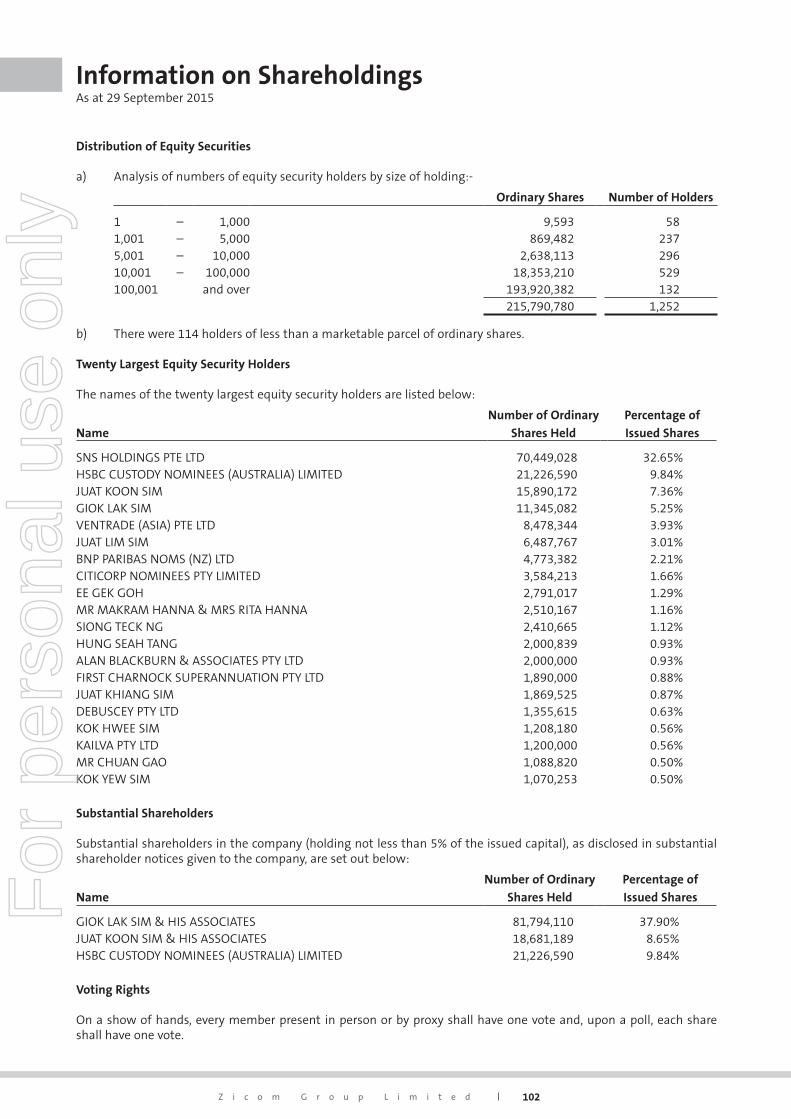
102Z i c o m G r o u p L i m i t e d
Distribution of Equity Securities
a) Analysis of numbers of equity security holders by size of holding:-
Ordinary Shares Number of Holders
1 – 1,000 9,593 581,001 – 5,000 869,482 2375,001 – 10,000 2,638,113 29610,001 – 100,000 18,353,210 529100,001 and over 193,920,382 132
215,790,780 1,252
b) There were 114 holders of less than a marketable parcel of ordinary shares.
Twenty Largest Equity Security Holders
The names of the twenty largest equity security holders are listed below:
Name
Number of Ordinary
Shares Held
Percentage of
Issued Shares
SNS HOLDINGS PTE LTD 70,449,028 32.65%HSBC CUSTODY NOMINEES (AUSTRALIA) LIMITED 21,226,590 9.84%JUAT KOON SIM 15,890,172 7.36%GIOK LAK SIM 11,345,082 5.25%VENTRADE (ASIA) PTE LTD 8,478,344 3.93%JUAT LIM SIM 6,487,767 3.01%BNP PARIBAS NOMS (NZ) LTD 4,773,382 2.21%CITICORP NOMINEES PTY LIMITED 3,584,213 1.66%EE GEK GOH 2,791,017 1.29%MR MAKRAM HANNA & MRS RITA HANNA 2,510,167 1.16%SIONG TECK NG 2,410,665 1.12%HUNG SEAH TANG 2,000,839 0.93%ALAN BLACKBURN & ASSOCIATES PTY LTD 2,000,000 0.93%FIRST CHARNOCK SUPERANNUATION PTY LTD 1,890,000 0.88%JUAT KHIANG SIM 1,869,525 0.87%DEBUSCEY PTY LTD 1,355,615 0.63%KOK HWEE SIM 1,208,180 0.56%KAILVA PTY LTD 1,200,000 0.56%MR CHUAN GAO 1,088,820 0.50%KOK YEW SIM 1,070,253 0.50%
Substantial Shareholders
Substantial shareholders in the company (holding not less than 5% of the issued capital), as disclosed in substantial shareholder notices given to the company, are set out below:
Name
Number of Ordinary
Shares Held
Percentage of
Issued Shares
GIOK LAK SIM & HIS ASSOCIATES 81,794,110 37.90%JUAT KOON SIM & HIS ASSOCIATES 18,681,189 8.65%HSBC CUSTODY NOMINEES (AUSTRALIA) LIMITED 21,226,590 9.84%
Voting Rights
On a show of hands, every member present in person or by proxy shall have one vote and, upon a poll, each share shall have one vote.
Information on ShareholdingsAs at 29 September 2015
For
per
sona
l use
onl
y
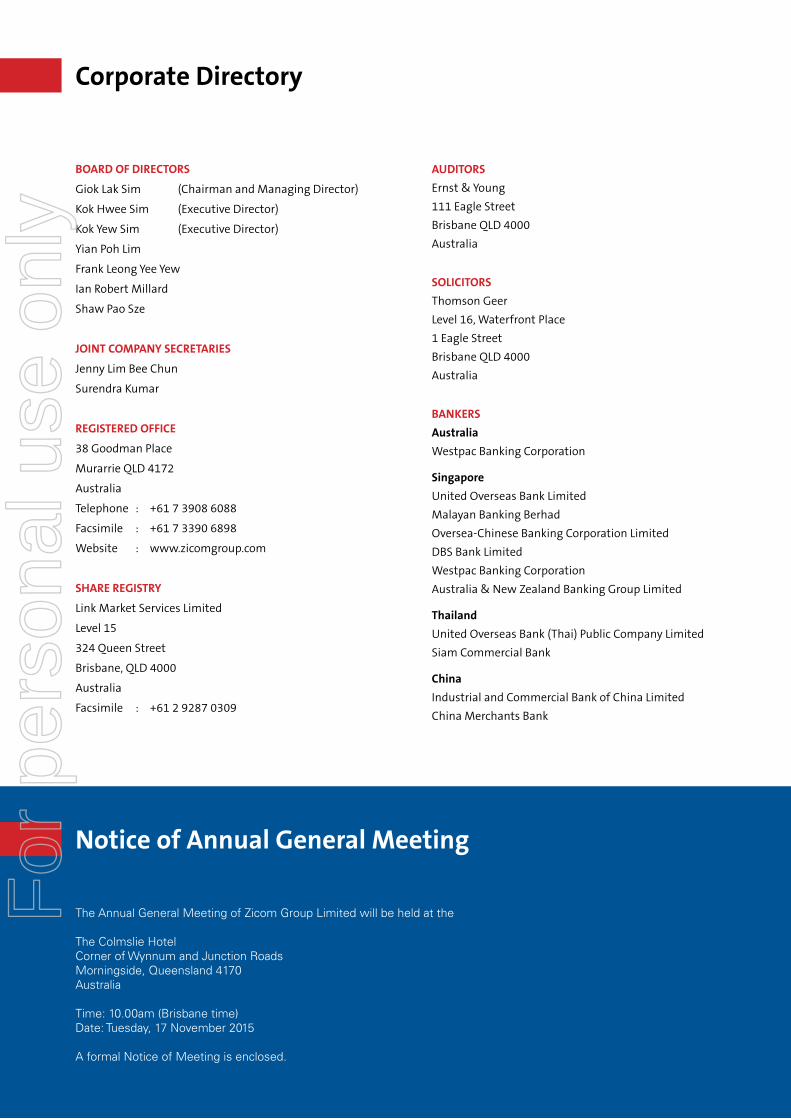
BOARD OF DIRECTORS
Giok Lak Sim (Chairman and Managing Director)
Kok Hwee Sim (Executive Director)
Kok Yew Sim (Executive Director)
Yian Poh Lim
Frank Leong Yee Yew
Ian Robert Millard
Shaw Pao Sze
JOINT COMPANY SECRETARIES
Jenny Lim Bee Chun
Surendra Kumar
REGISTERED OFFICE
38 Goodman Place
Murarrie QLD 4172
Australia
Telephone : +61 7 3908 6088
Facsimile : +61 7 3390 6898
Website : www.zicomgroup.com
SHARE REGISTRY
Link Market Services Limited
Level 15
324 Queen Street
Brisbane, QLD 4000
Australia
Facsimile : +61 2 9287 0309
AUDITORS
Ernst & Young
111 Eagle Street
Brisbane QLD 4000
Australia
SOLICITORS
Thomson Geer
Level 16, Waterfront Place
1 Eagle Street
Brisbane QLD 4000
Australia
BANKERS
Australia
Westpac Banking Corporation
Singapore
United Overseas Bank Limited
Malayan Banking Berhad
Oversea-Chinese Banking Corporation Limited
DBS Bank Limited
Westpac Banking Corporation
Australia & New Zealand Banking Group Limited
Thailand
United Overseas Bank (Thai) Public Company Limited
Siam Commercial Bank
China
Industrial and Commercial Bank of China Limited
China Merchants Bank
Corporate Directory
Notice of Annual General Meeting
The Annual General Meeting of Zicom Group Limited will be held at the
The Colmslie HotelCorner of Wynnum and Junction RoadsMorningside, Queensland 4170Australia
Time: 10.00am (Brisbane time)Date: Tuesday, 17 November 2015
A formal Notice of Meeting is enclosed.
For
per
sona
l use
onl
y

Zicom Group Limited38 Goodman Place, Murarrie QLD 4172 Australia
Telephone: +61 7 3908 6088Facsimile: +61 7 3390 6898
www.zicomgroup.com
ZIC
OM
GR
OU
P LIM
ITE
D A
NN
UA
L RE
PO
RT
2015
For
per
sona
l use
onl
y