zuchuan li, nicolas cassar division of earth and ocean sciences nicholas school of the environment...
TRANSCRIPT
Zuchuan Li, Nicolas Cassar
Division of Earth and Ocean SciencesNicholas School of the Environment
Duke University
Estimation of Net Community Production (NCP) Using O2/Ar Measurements and Satellite
Observations
Overall objective
• Develop an independent estimate of global Net Community Production (NCP)
1. A large independent training dataset : O2/Ar-derived NCP
2. Satellite observations
3. Statistical methods:
Support Vector Regression
Genetic Programming
• Compare to current algorithms of export production
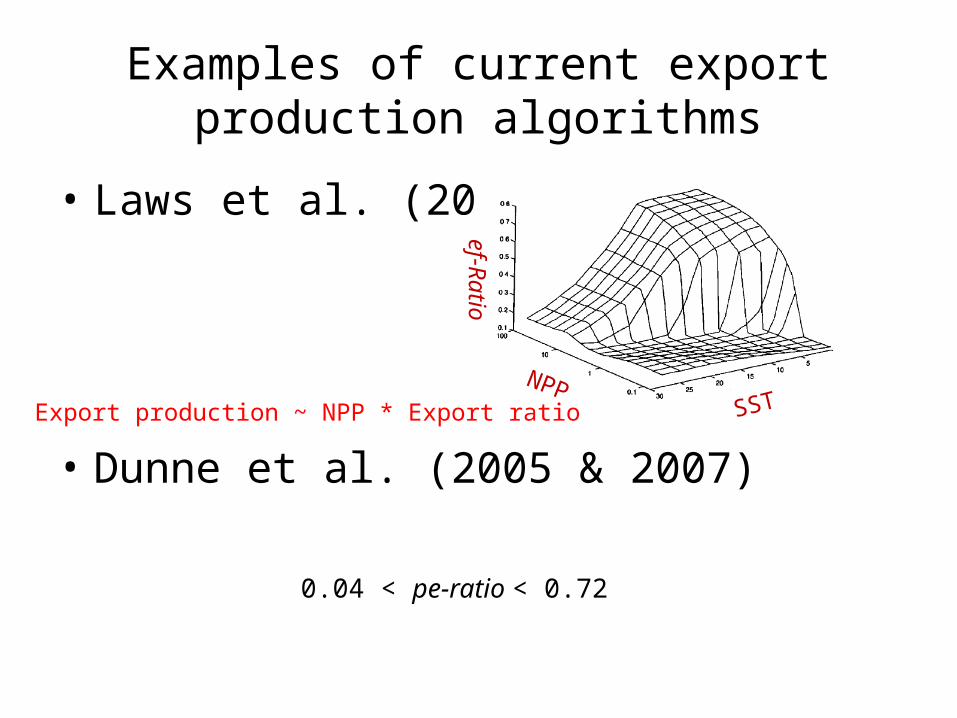
Examples of current export production algorithms
• Laws et al. (2000)
• Dunne et al. (2005 & 2007)
0.04 < pe-ratio < 0.72
SSTNPP
ef-Ratio
Export production ~ NPP * Export ratio
Base of the mixed layer
Atmosphere
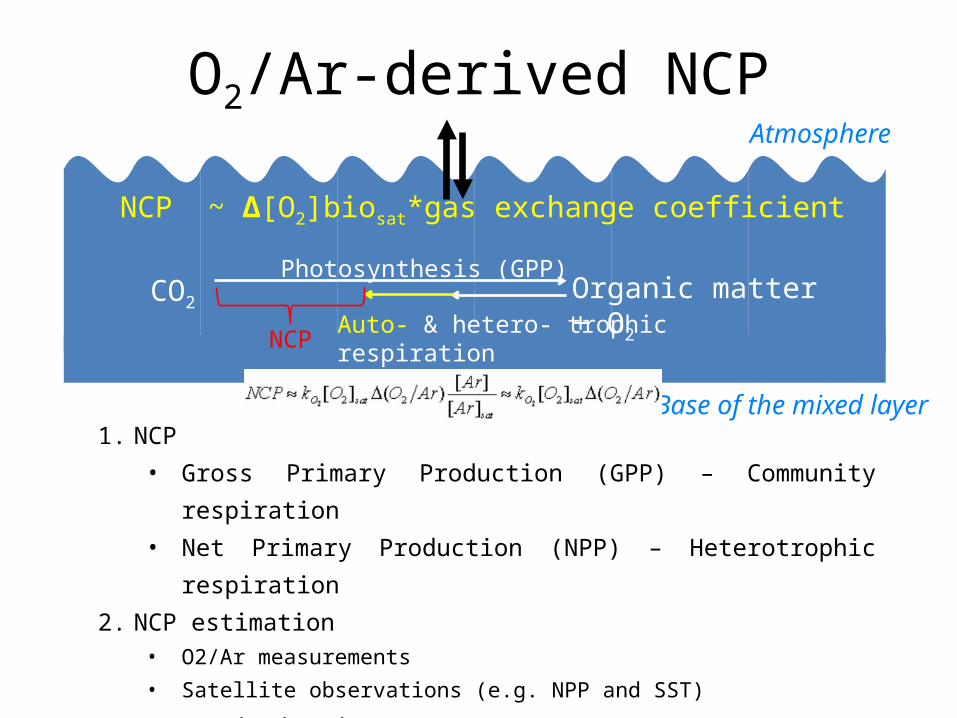
O2/Ar-derived NCP
NCP ~ Δ[O2]biosat*gas exchange coefficient
1. NCP
• Gross Primary Production (GPP) – Community respiration
• Net Primary Production (NPP) – Heterotrophic respiration
2. NCP estimation• O2/Ar measurements
• Satellite observations (e.g. NPP and SST)
3. Uncertainties in O2/Ar measurements
• See Reuer et al. 2007, Cassar et al. 2011, Jonsson et al.
2013
Photosynthesis (GPP)
Auto- & hetero- trophic respirationNCP
CO2Organic matter + O2
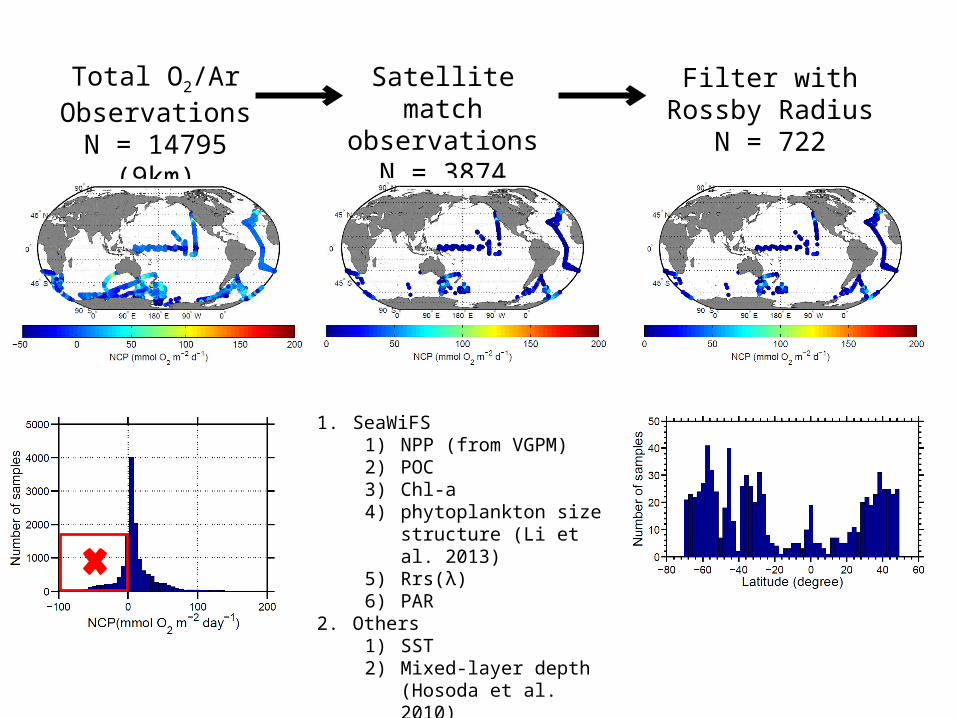
Total O2/Ar ObservationsN = 14795
(9km)
Satellite match observations
N = 3874
1. SeaWiFS1) NPP (from VGPM)2) POC3) Chl-a4) phytoplankton size
structure (Li et al. 2013)
5) Rrs(λ)6) PAR
2. Others1) SST2) Mixed-layer depth
(Hosoda et al. 2010)
Filter with Rossby Radius
N = 722
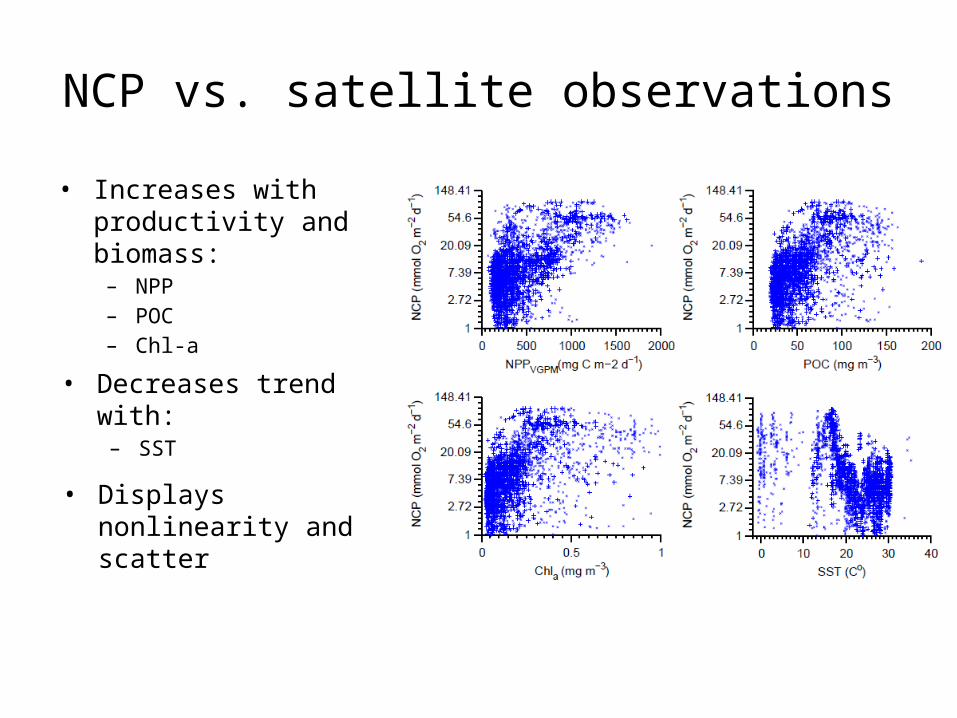
NCP vs. satellite observations• Increases with
productivity and biomass:– NPP– POC– Chl-a
• Decreases trend with:– SST
• Displays nonlinearity and scatter
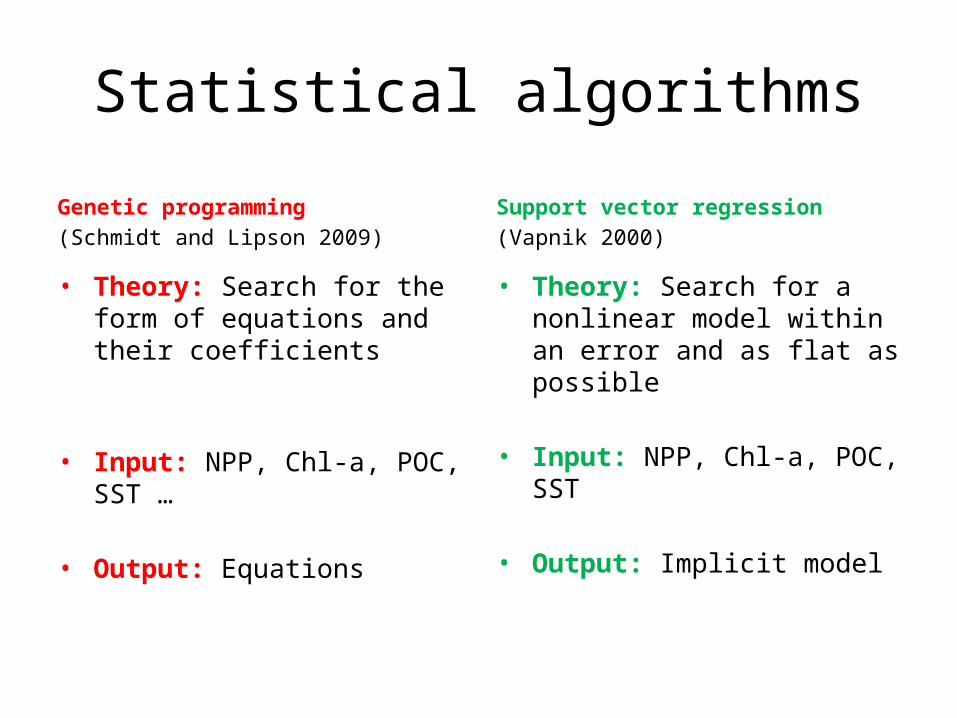
Statistical algorithms
Genetic programming(Schmidt and Lipson 2009)
• Theory: Search for the form of equations and their coefficients
• Input: NPP, Chl-a, POC, SST …
• Output: Equations
Support vector regression(Vapnik 2000)
• Theory: Search for a nonlinear model within an error and as flat as possible
• Input: NPP, Chl-a, POC, SST
• Output: Implicit model
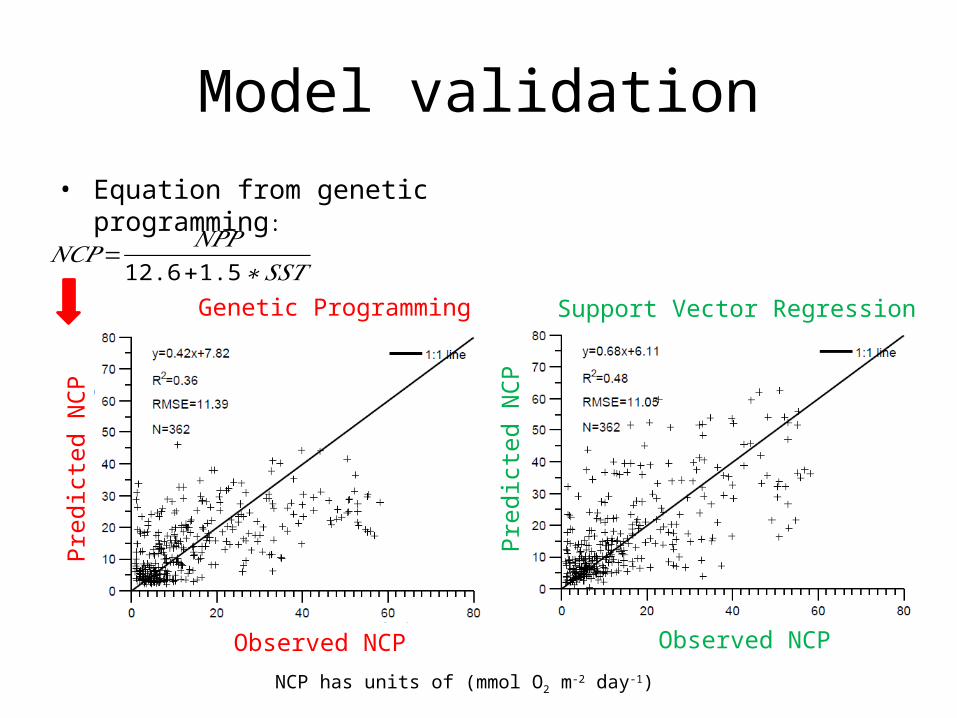
Model validation• Equation from genetic
programming:
Observed NCP
Pred
icte
d N
CP
𝑁𝐶𝑃=𝑁𝑃𝑃
12.6+1.5∗𝑆𝑆𝑇Genetic Programming
Observed NCP
Pred
icte
d N
CP
Support Vector Regression
Observed NCP
Pred
icte
d N
CP
NCP has units of (mmol O2 m-2 day-1)
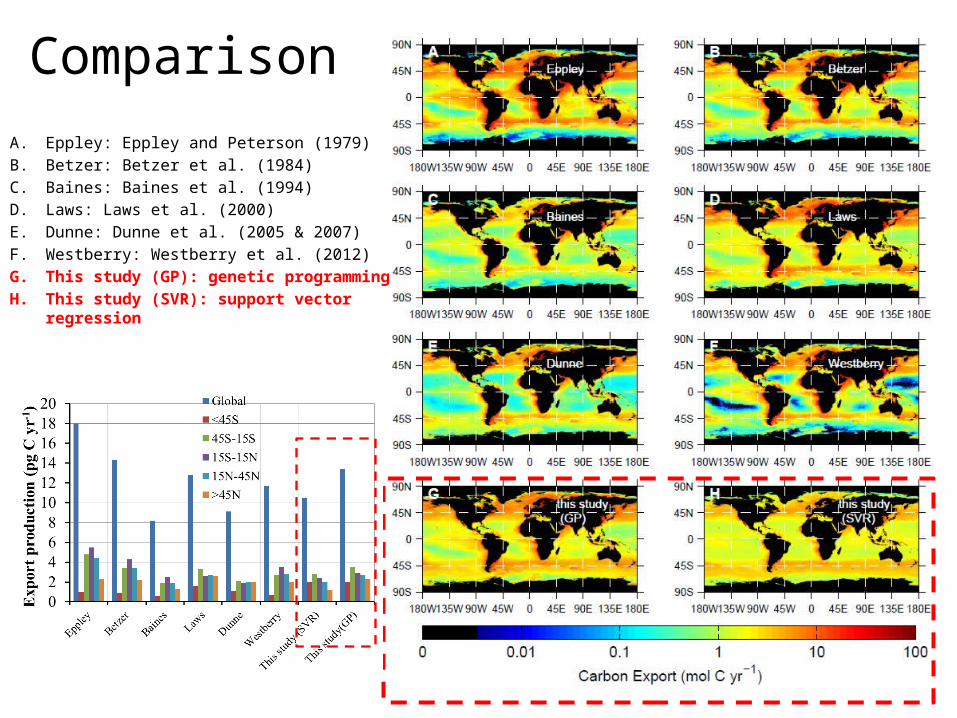
ComparisonA. Eppley: Eppley and Peterson (1979)B. Betzer: Betzer et al. (1984)C. Baines: Baines et al. (1994)D. Laws: Laws et al. (2000)E. Dunne: Dunne et al. (2005 & 2007)F. Westberry: Westberry et al. (2012)G. This study (GP): genetic programmingH. This study (SVR): support vector
regression
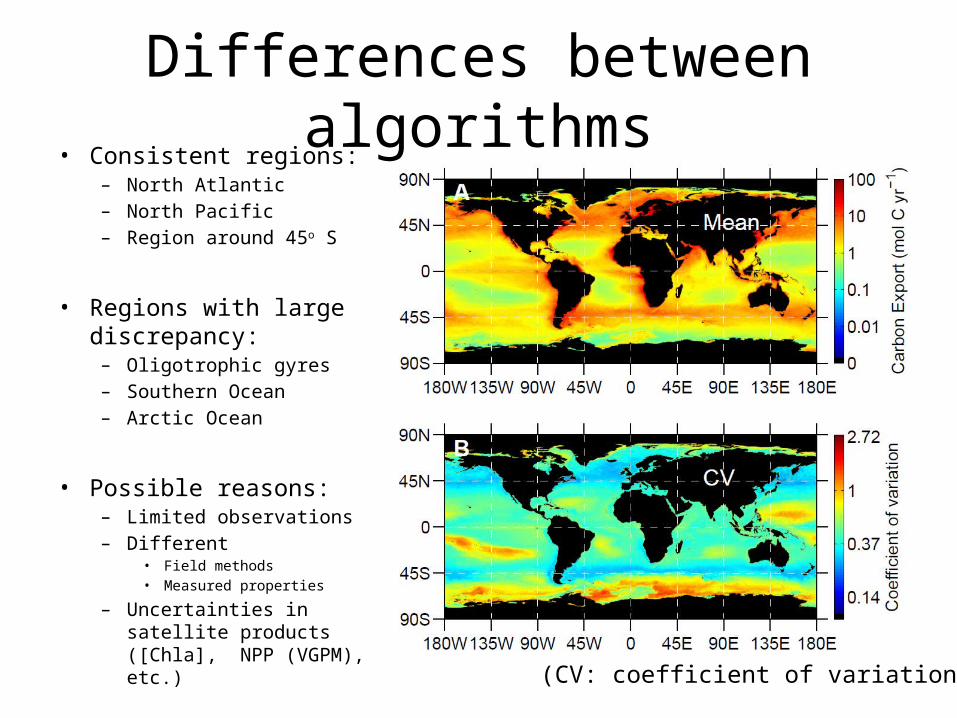
Differences between algorithms• Consistent regions:
– North Atlantic– North Pacific– Region around 45o S
• Regions with large discrepancy:– Oligotrophic gyres– Southern Ocean– Arctic Ocean
• Possible reasons:– Limited observations– Different
• Field methods• Measured properties
– Uncertainties in satellite products ([Chla], NPP (VGPM), etc.)
(CV: coefficient of variation)
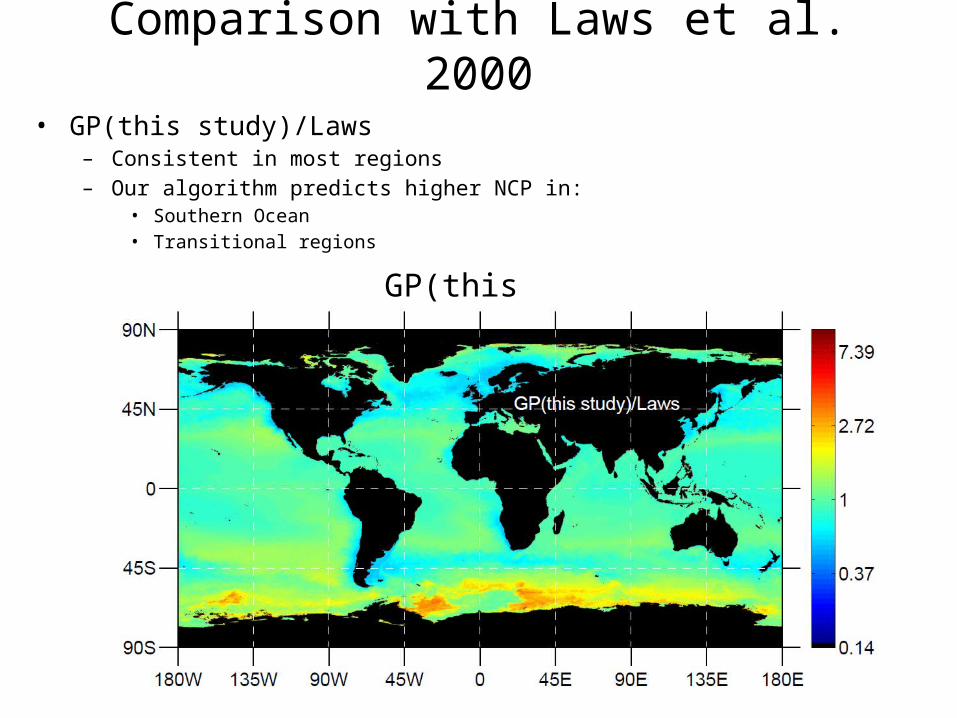
Comparison with Laws et al. 2000• GP(this study)/Laws
– Consistent in most regions– Our algorithm predicts higher NCP in:
• Southern Ocean• Transitional regions
GP(this study)/Laws
Conclusions• Our method shows a relatively good agreement to other models
– With a completely independent training dataset and scaling methods
• However:– Our algorithms predict more uniform carbon fluxes in the world’s oceans
– Discrepancies are observed in some regions, such as Southern Ocean where our algorithms generally predict higher NCP
• Work in progress…– Develop region specific algorithms
– Test consistency of the genetic programming solutions and transferability
– Test with additional datasets
Acknowledgements
• All of our O2/Ar collaborators for providing the field observations
Thank you!
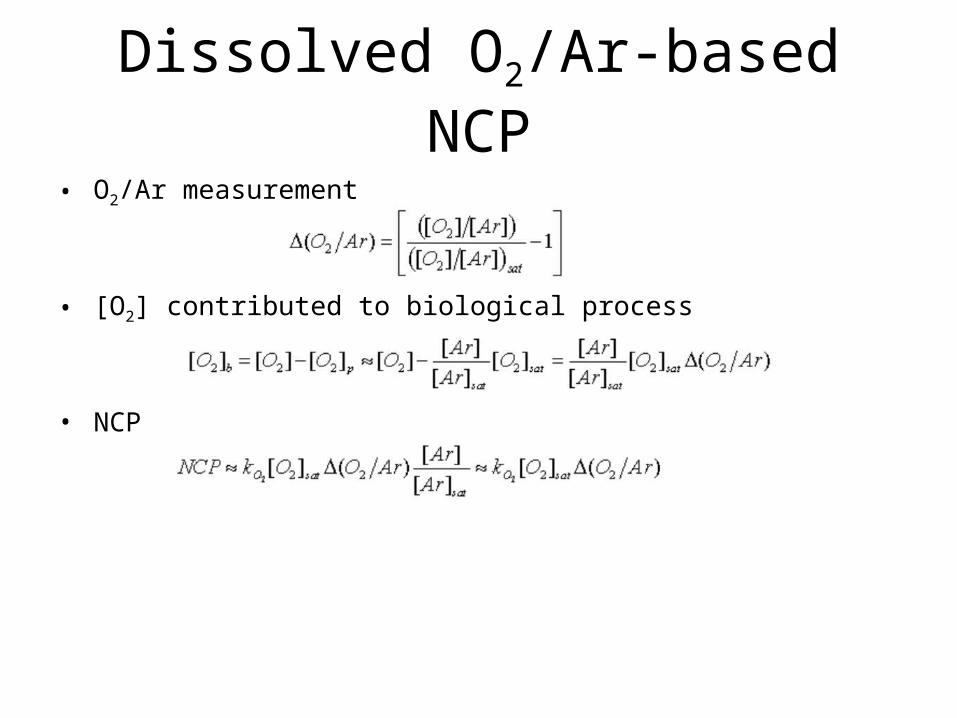
Dissolved O2/Ar-based NCP
• O2/Ar measurement
• [O2] contributed to biological process
• NCP
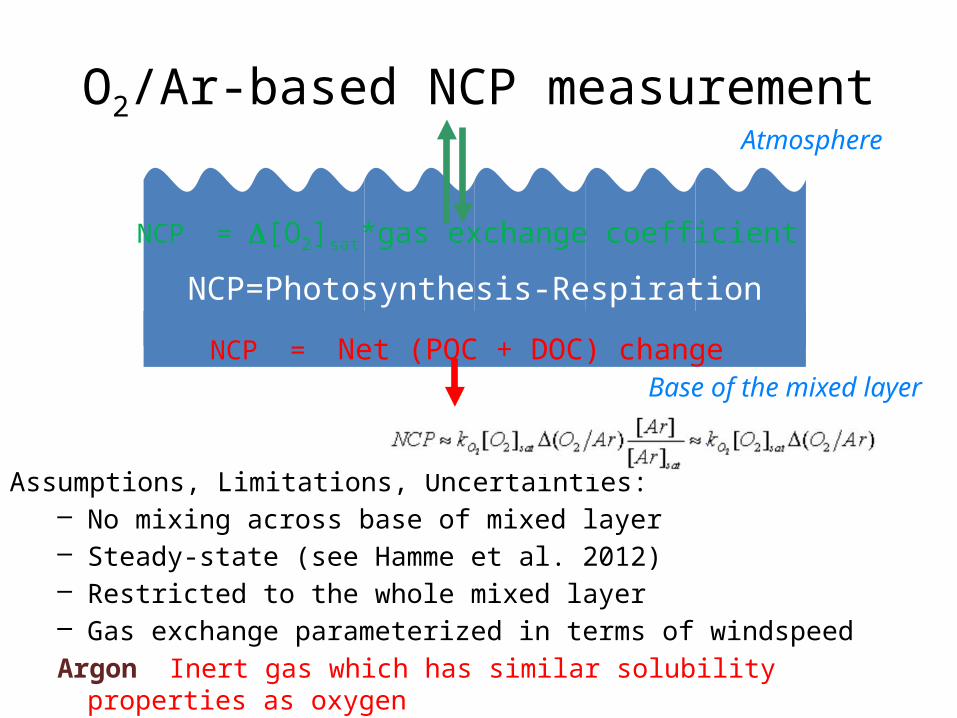
Base of the mixed layer
NCP = D[O2]sat*gas exchange coefficient
NCP = Net (POC + DOC) change
Atmosphere
NCP=Photosynthesis-Respiration
Assumptions, Limitations, Uncertainties:– No mixing across base of mixed layer– Steady-state (see Hamme et al. 2012)– Restricted to the whole mixed layer– Gas exchange parameterized in terms of windspeed
Argon: Inert gas which has similar solubility properties as oxygen
O2/Ar-based NCP measurement

Validation• Genetic programming
– A: – B: – C: