© 2005 the mcgraw-hill companies, inc., all rights reserved mcgraw-hill/irwin slide 1 chapter...
TRANSCRIPT
© 2005 The McGraw-Hill Companies, Inc., All Rights ReservedMcGraw-Hill/Irwin
Slide 1
CHAPTER ELEVEN
INVESTMENT ANALYSIS AND TAXATION OF INCOME
PROPERTIES
© 2005 The McGraw-Hill Companies, Inc., All Rights ReservedMcGraw-Hill/Irwin
Slide 2
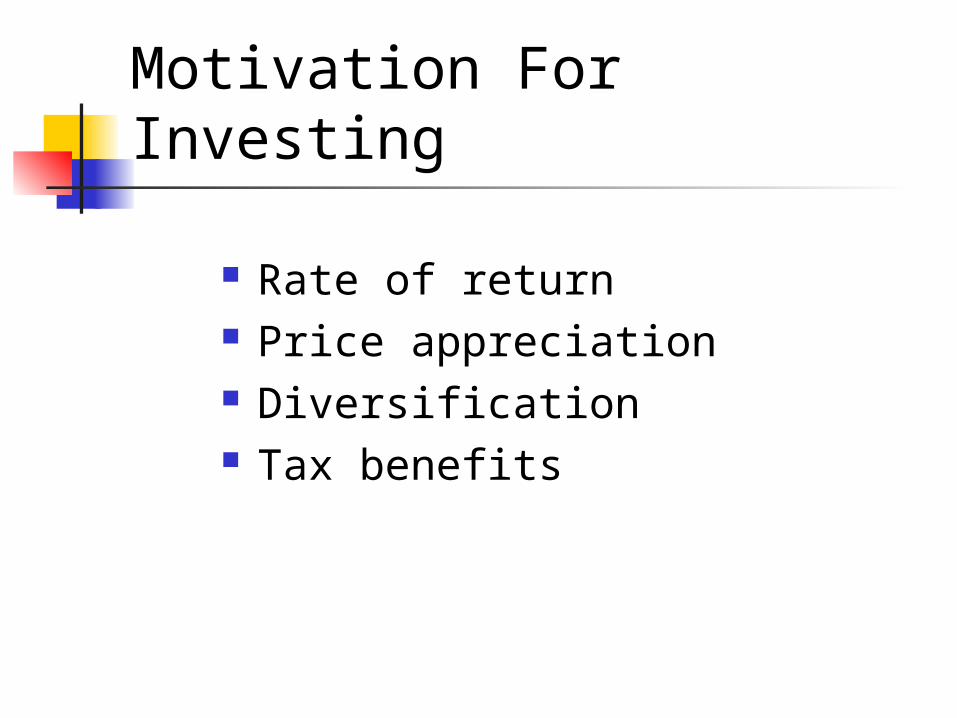
Motivation For Investing
Rate of return Price appreciation Diversification Tax benefits
© 2005 The McGraw-Hill Companies, Inc., All Rights ReservedMcGraw-Hill/Irwin
Slide 3
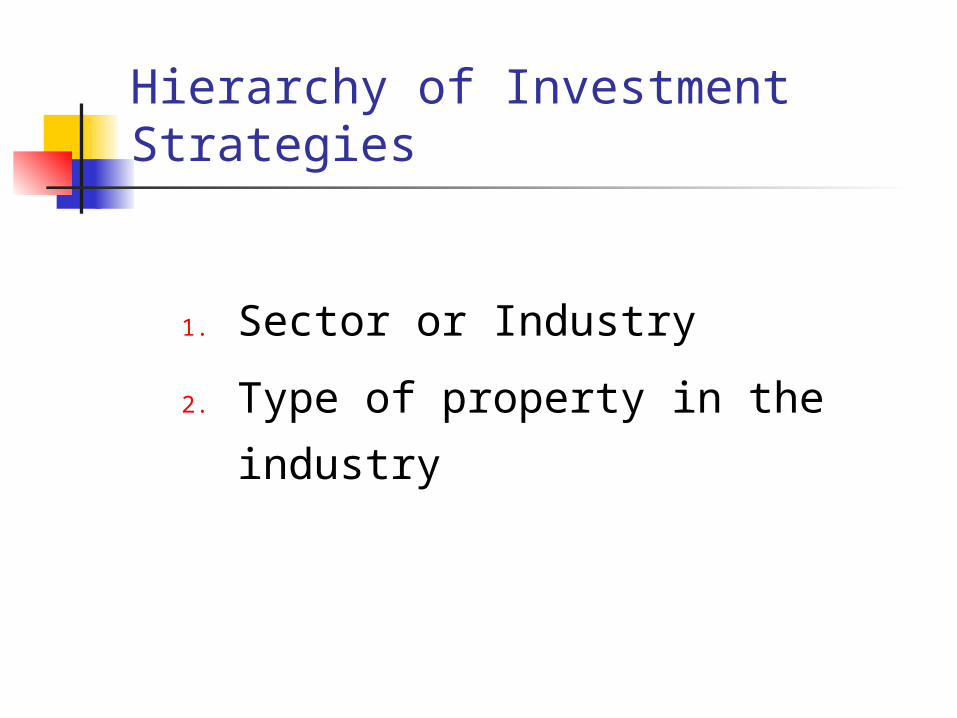
Hierarchy of Investment Strategies
1. Sector or Industry
2. Type of property in the industry
© 2005 The McGraw-Hill Companies, Inc., All Rights ReservedMcGraw-Hill/Irwin
Slide 4
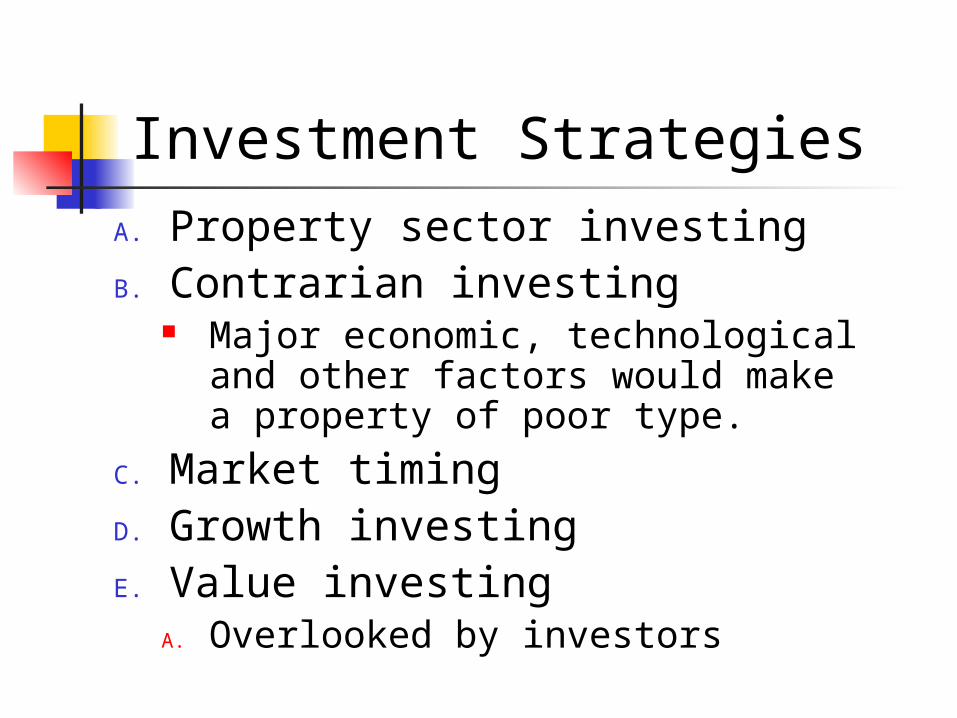
Investment StrategiesA. Property sector investingB. Contrarian investing
Major economic, technological and other factors would make a property of poor type.
C. Market timingD. Growth investingE. Value investing
A. Overlooked by investors

© 2005 The McGraw-Hill Companies, Inc., All Rights ReservedMcGraw-Hill/Irwin
Slide 5
Investment Strategies
F. Size of property
G. Strategy as to tenants
H. Arbitrage investing
I. Turn around/ special situation
J. Blue chip properties

© 2005 The McGraw-Hill Companies, Inc., All Rights ReservedMcGraw-Hill/Irwin
Slide 6
Real Estate Investment Analysis
Investment Strategy Investment philosophy
Investment objectives
Investment policies
© 2005 The McGraw-Hill Companies, Inc., All Rights ReservedMcGraw-Hill/Irwin
Slide 7
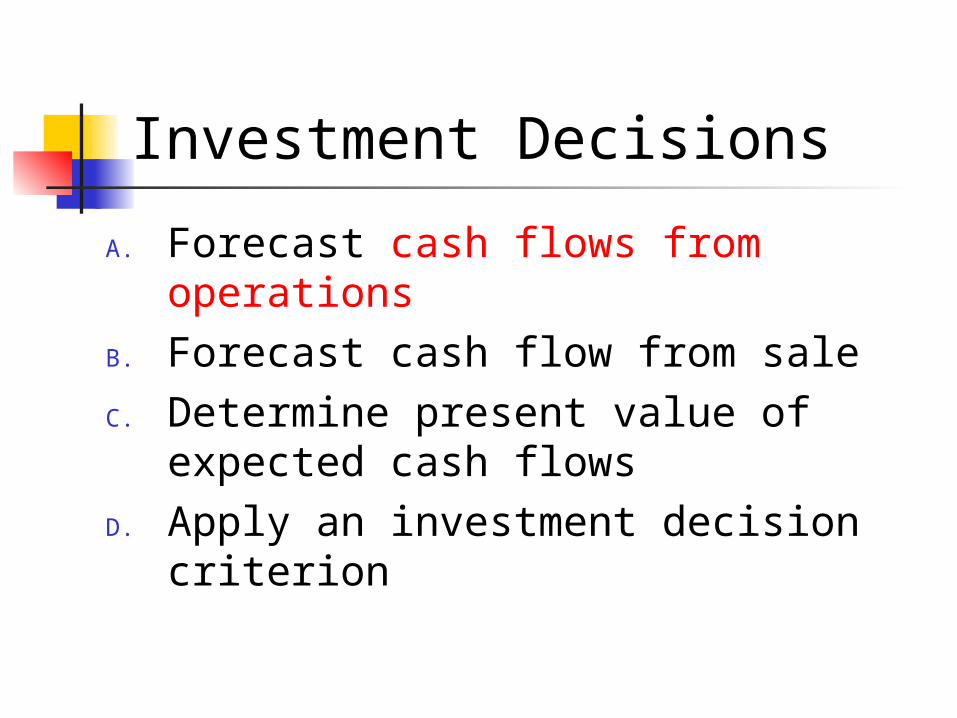
Investment Decisions
A. Forecast cash flows from operations
B. Forecast cash flow from saleC. Determine present value of
expected cash flowsD. Apply an investment decision
criterion
© 2005 The McGraw-Hill Companies, Inc., All Rights ReservedMcGraw-Hill/Irwin
Slide 8
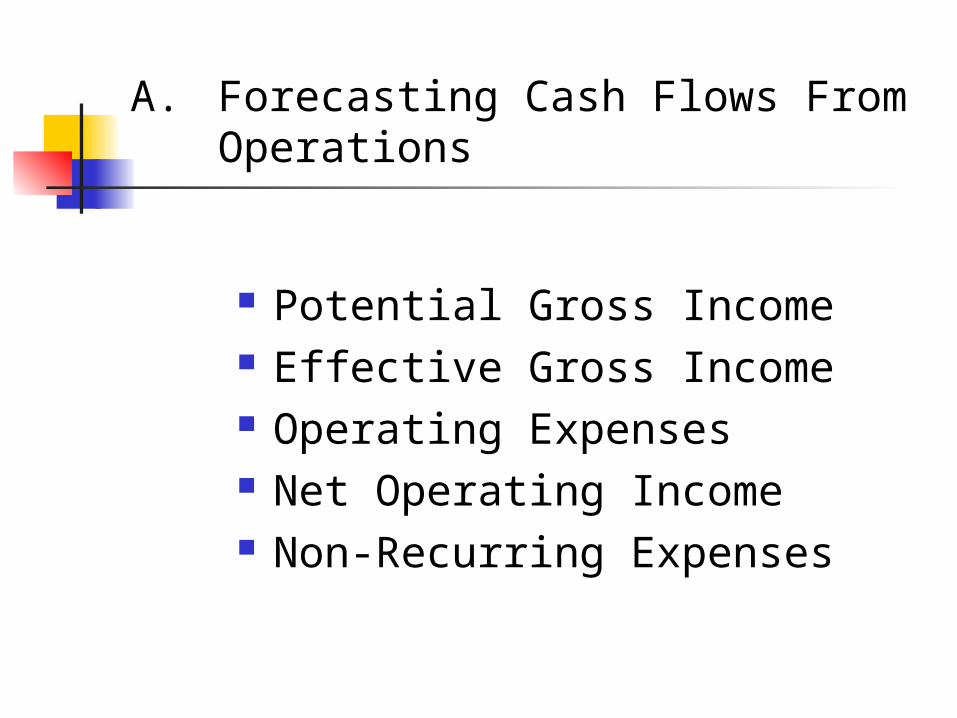
A. Forecasting Cash Flows From Operations
Potential Gross Income Effective Gross Income Operating Expenses Net Operating Income Non-Recurring Expenses
© 2005 The McGraw-Hill Companies, Inc., All Rights ReservedMcGraw-Hill/Irwin
Slide 9
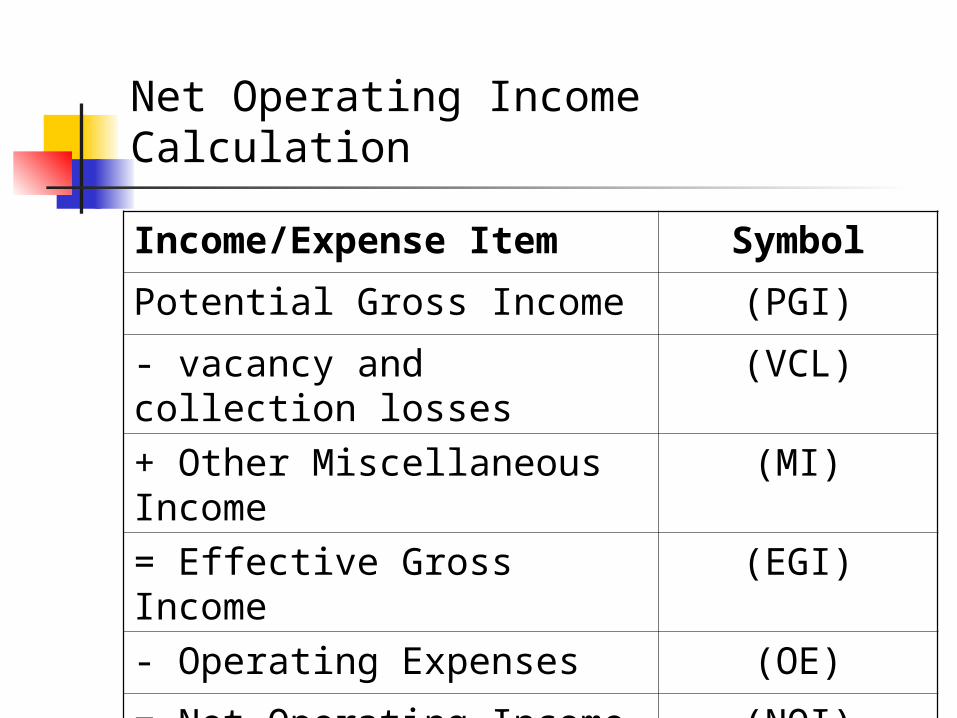
Net Operating Income Calculation
Income/Expense Item Symbol
Potential Gross Income (PGI)
- vacancy and collection losses
(VCL)
+ Other Miscellaneous Income
(MI)
= Effective Gross Income (EGI)
- Operating Expenses (OE)
= Net Operating Income (NOI)
© 2005 The McGraw-Hill Companies, Inc., All Rights ReservedMcGraw-Hill/Irwin
Slide 10
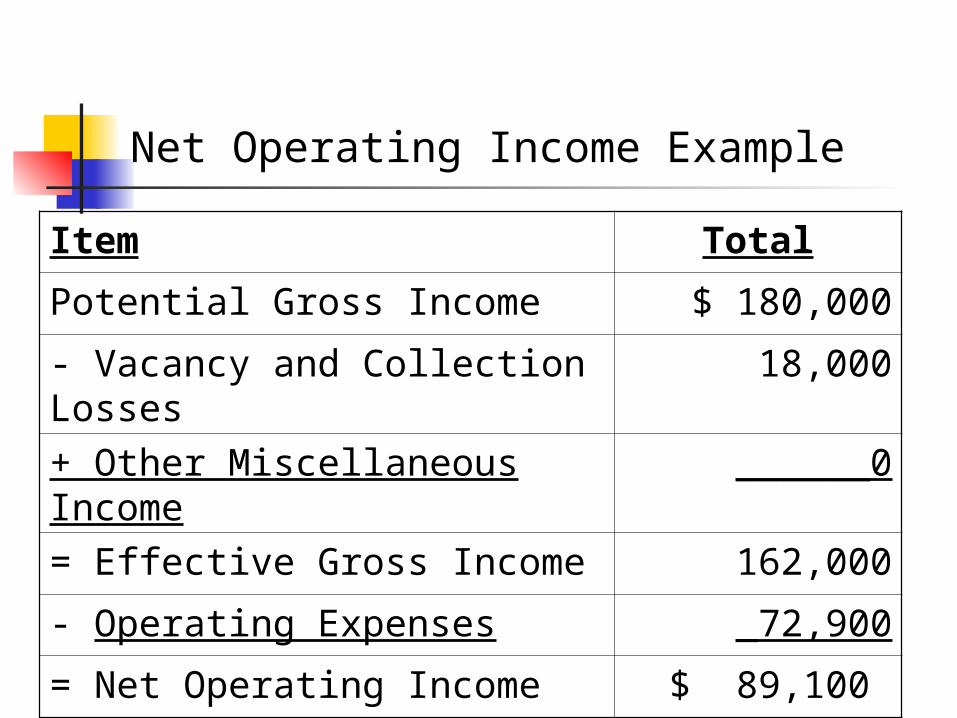
Net Operating Income Example
Item Total
Potential Gross Income $ 180,000
- Vacancy and Collection Losses
18,000
+ Other Miscellaneous Income
______0
= Effective Gross Income 162,000
- Operating Expenses _72,900
= Net Operating Income $ 89,100
© 2005 The McGraw-Hill Companies, Inc., All Rights ReservedMcGraw-Hill/Irwin
Slide 11
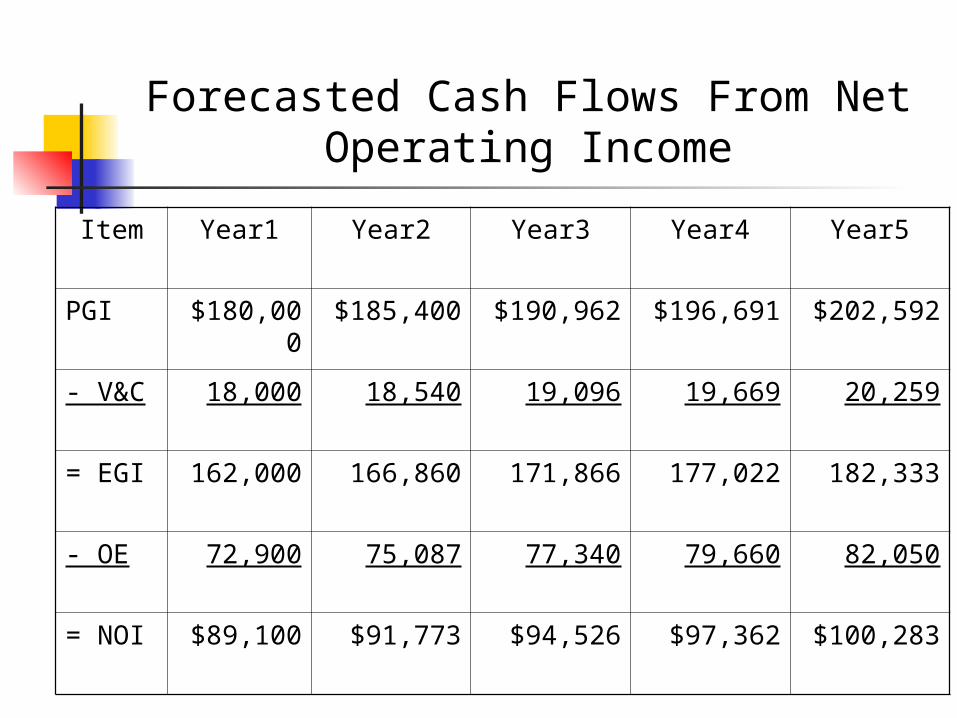
Forecasted Cash Flows From Net Operating Income
Item Year1 Year2 Year3 Year4 Year5
PGI $180,000
$185,400 $190,962 $196,691 $202,592
- V&C 18,000 18,540 19,096 19,669 20,259
= EGI 162,000 166,860 171,866 177,022 182,333
- OE 72,900 75,087 77,340 79,660 82,050
= NOI $89,100 $91,773 $94,526 $97,362 $100,283
© 2005 The McGraw-Hill Companies, Inc., All Rights ReservedMcGraw-Hill/Irwin
Slide 12
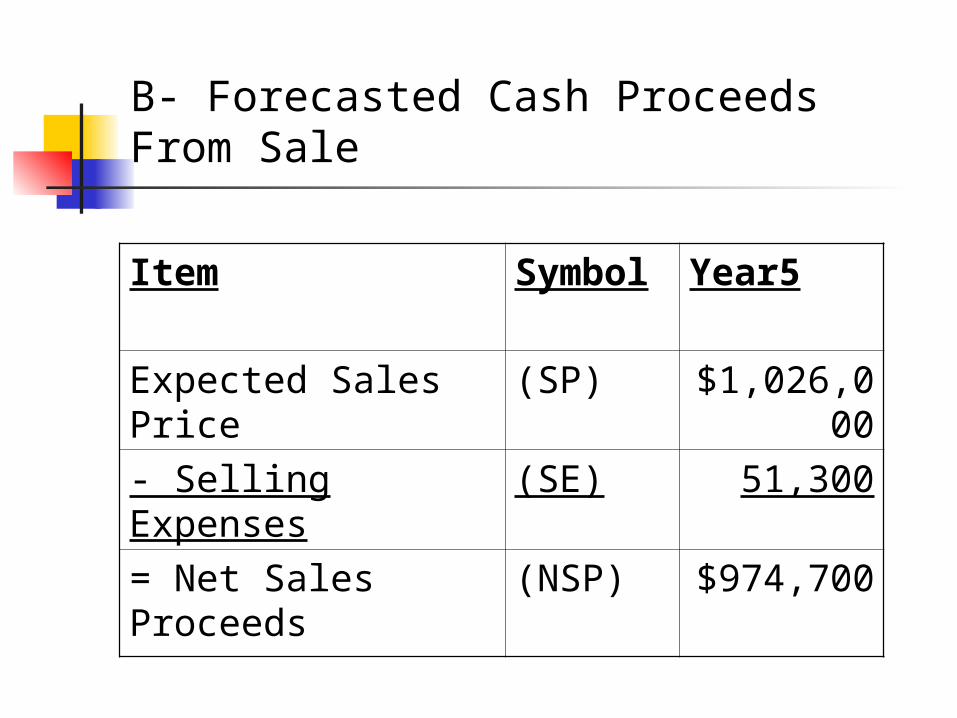
B- Forecasted Cash Proceeds From Sale
Item Symbol Year5
Expected Sales Price
(SP) $1,026,000
- Selling Expenses (SE) 51,300
= Net Sales Proceeds
(NSP) $974,700
© 2005 The McGraw-Hill Companies, Inc., All Rights ReservedMcGraw-Hill/Irwin
Slide 13
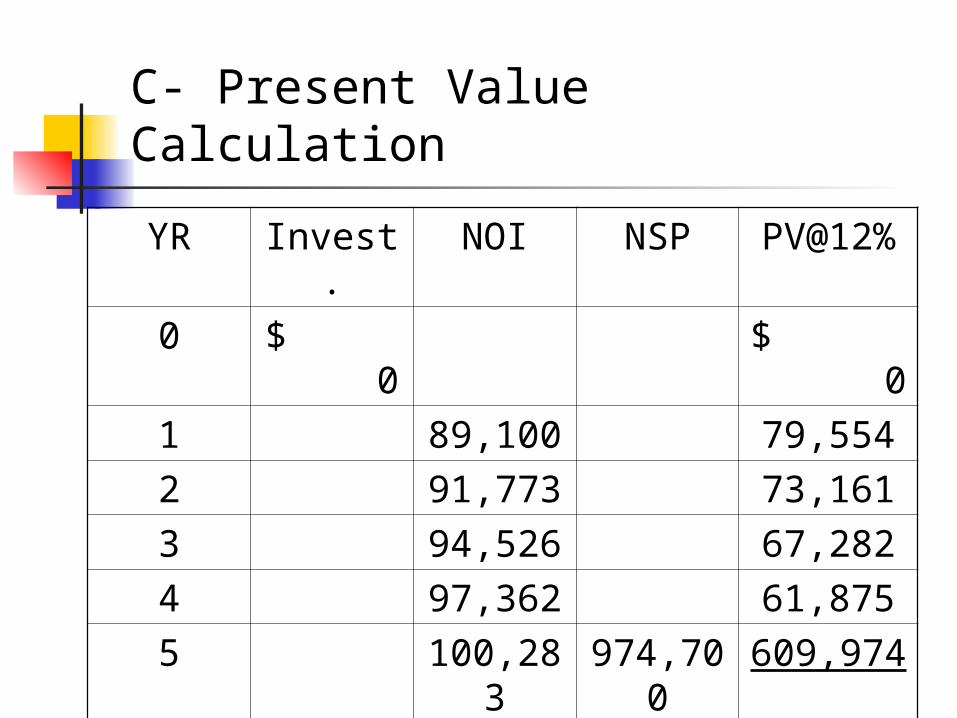
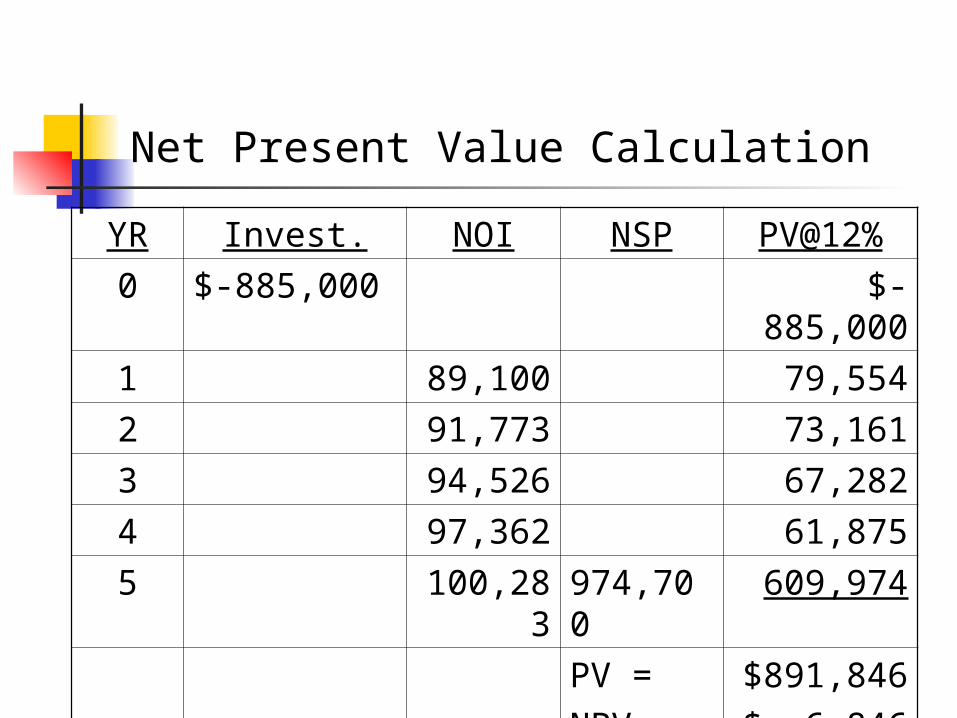
C- Present Value Calculation
YR Invest. NOI NSP PV@12%
0 $ 0
$ 0
1 89,100 79,554
2 91,773 73,161
3 94,526 67,282
4 97,362 61,875
5 100,283
974,700
609,974
PV= $891,846
© 2005 The McGraw-Hill Companies, Inc., All Rights ReservedMcGraw-Hill/Irwin
Slide 14
Net Present Value (NPV)
The net present value is the present value of a project’s cash inflows, minus the present value of the cash outflows.
The cash flows are discounted at the investor’s required rate of return– in the example 12 percent.
© 2005 The McGraw-Hill Companies, Inc., All Rights ReservedMcGraw-Hill/Irwin
Slide 15
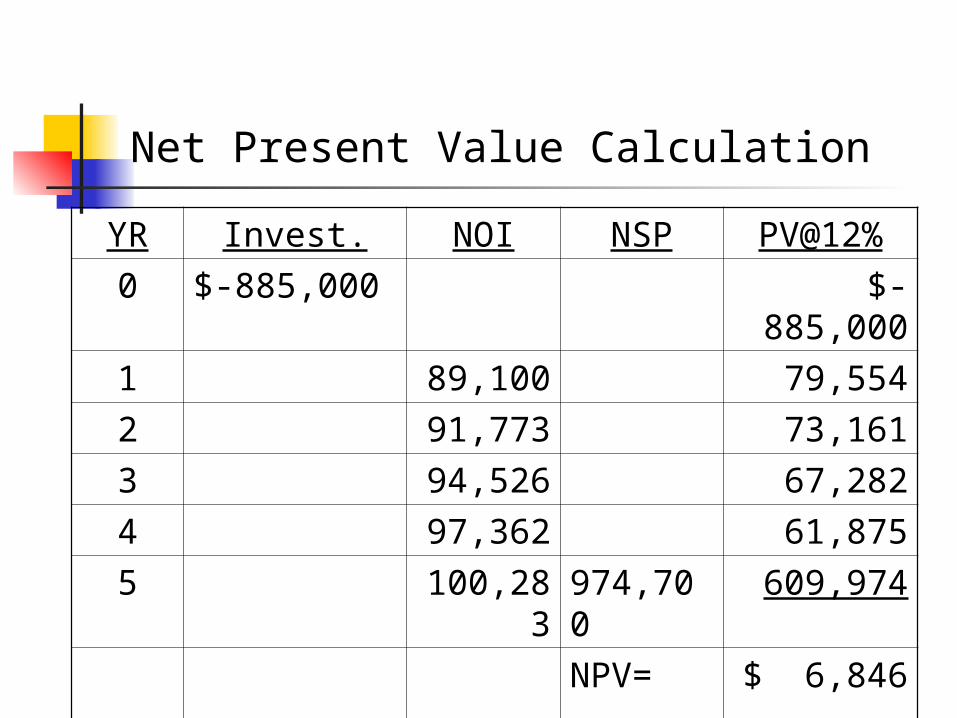
Net Present Value Calculation
YR Invest. NOI NSP PV@12%
0 $-885,000 $-885,000
1 89,100 79,554
2 91,773 73,161
3 94,526 67,282
4 97,362 61,875
5 100,283
974,700 609,974
PV = NPV=
$891,846$ 6,846
© 2005 The McGraw-Hill Companies, Inc., All Rights ReservedMcGraw-Hill/Irwin
Slide 16
Net Present Value Calculation
YR Invest. NOI NSP PV@12%
0 $-885,000 $-885,000
1 89,100 79,554
2 91,773 73,161
3 94,526 67,282
4 97,362 61,875
5 100,283
974,700 609,974
NPV= $ 6,846
© 2005 The McGraw-Hill Companies, Inc., All Rights ReservedMcGraw-Hill/Irwin
Slide 17
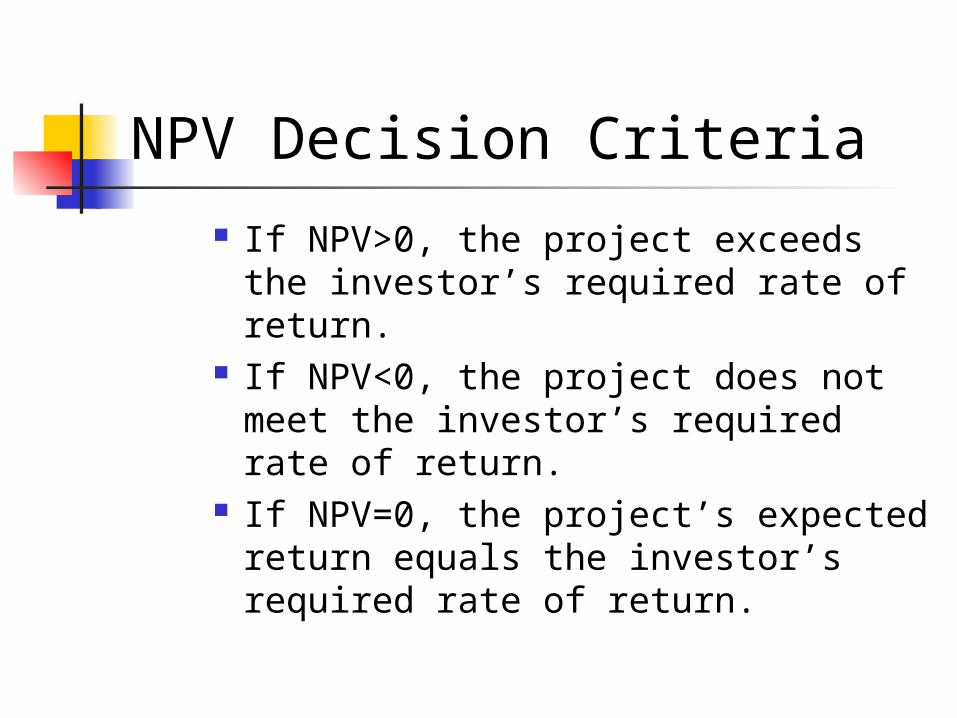
NPV Decision Criteria
If NPV>0, the project exceeds the investor’s required rate of return.
If NPV<0, the project does not meet the investor’s required rate of return.
If NPV=0, the project’s expected return equals the investor’s required rate of return.
© 2005 The McGraw-Hill Companies, Inc., All Rights ReservedMcGraw-Hill/Irwin
Slide 18
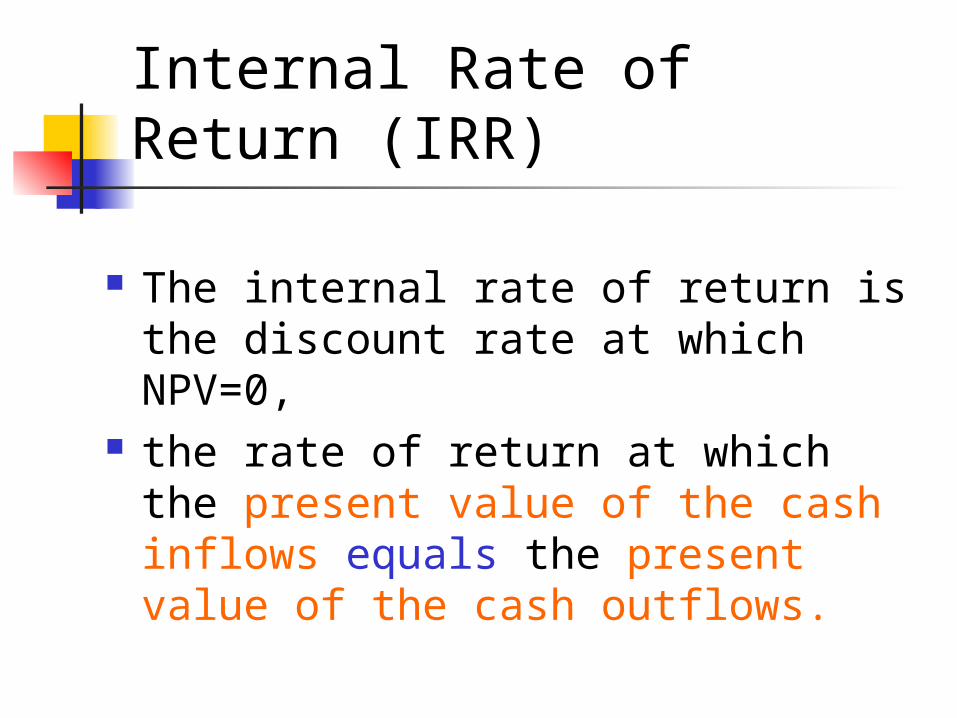
Internal Rate of Return (IRR)
The internal rate of return is the discount rate at which NPV=0,
the rate of return at which the present value of the cash inflows equals the present value of the cash outflows.
© 2005 The McGraw-Hill Companies, Inc., All Rights ReservedMcGraw-Hill/Irwin
Slide 19
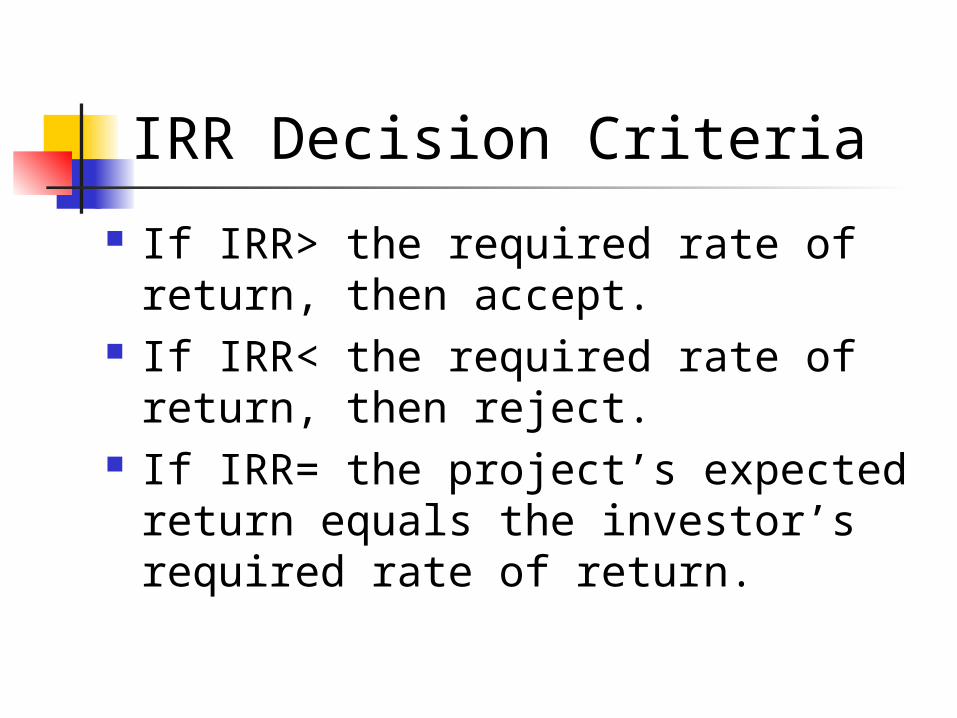
IRR Decision Criteria
If IRR> the required rate of return, then accept.
If IRR< the required rate of return, then reject.
If IRR= the project’s expected return equals the investor’s required rate of return.
© 2005 The McGraw-Hill Companies, Inc., All Rights ReservedMcGraw-Hill/Irwin
Slide 20
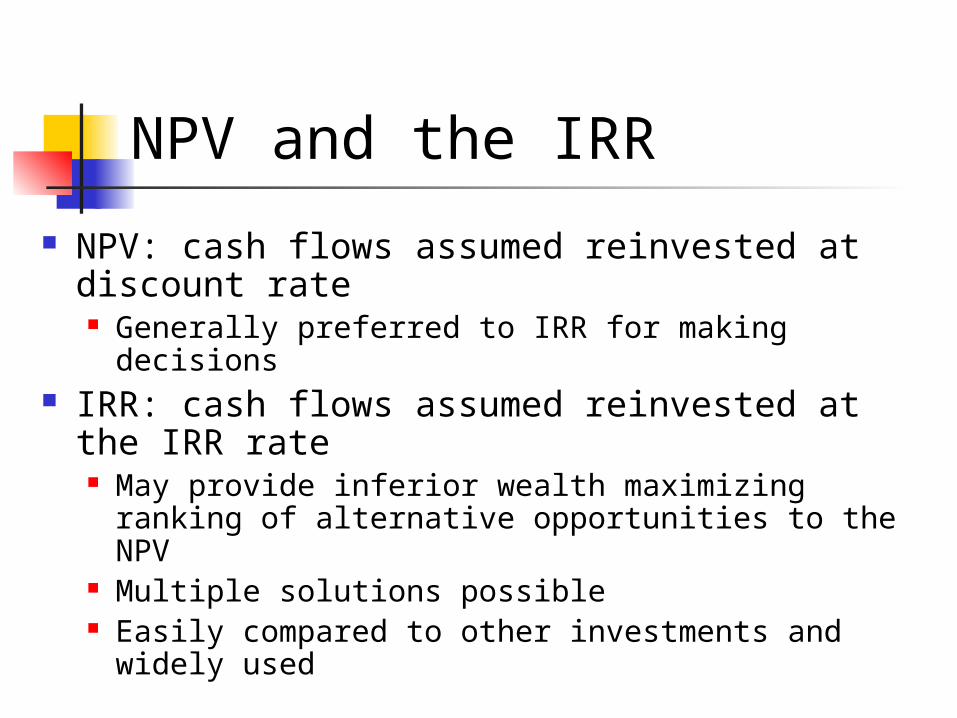
NPV and the IRR
NPV: cash flows assumed reinvested at discount rate Generally preferred to IRR for making decisions
IRR: cash flows assumed reinvested at the IRR rate May provide inferior wealth maximizing ranking of
alternative opportunities to the NPV Multiple solutions possible Easily compared to other investments and widely
used
© 2005 The McGraw-Hill Companies, Inc., All Rights ReservedMcGraw-Hill/Irwin
Slide 21
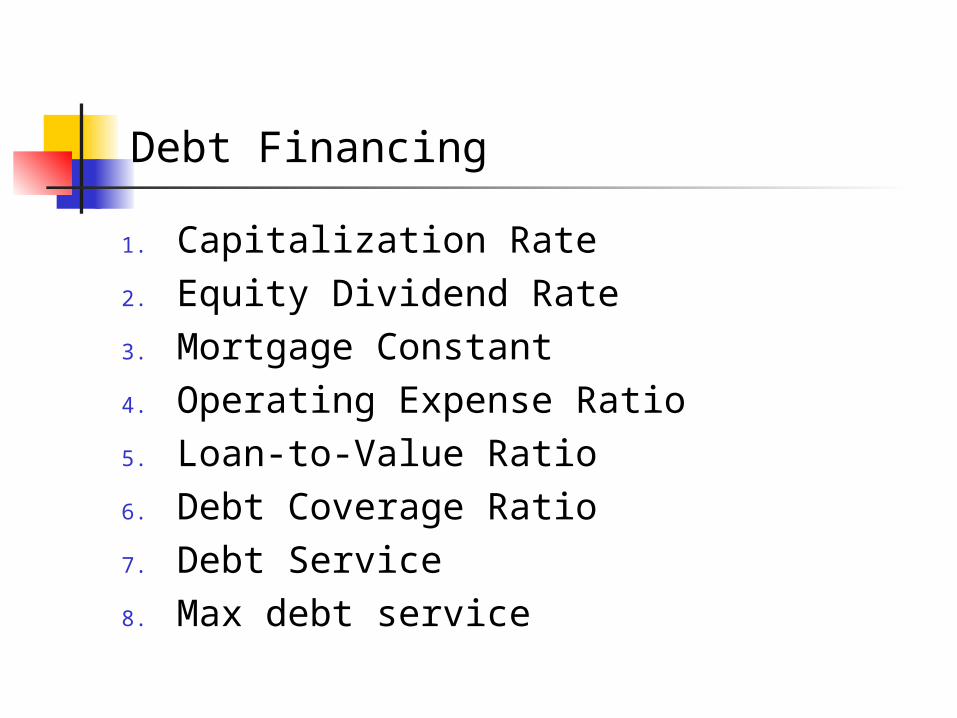
Debt Financing
1. Capitalization Rate2. Equity Dividend Rate3. Mortgage Constant4. Operating Expense Ratio5. Loan-to-Value Ratio6. Debt Coverage Ratio7. Debt Service8. Max debt service
© 2005 The McGraw-Hill Companies, Inc., All Rights ReservedMcGraw-Hill/Irwin
Slide 22
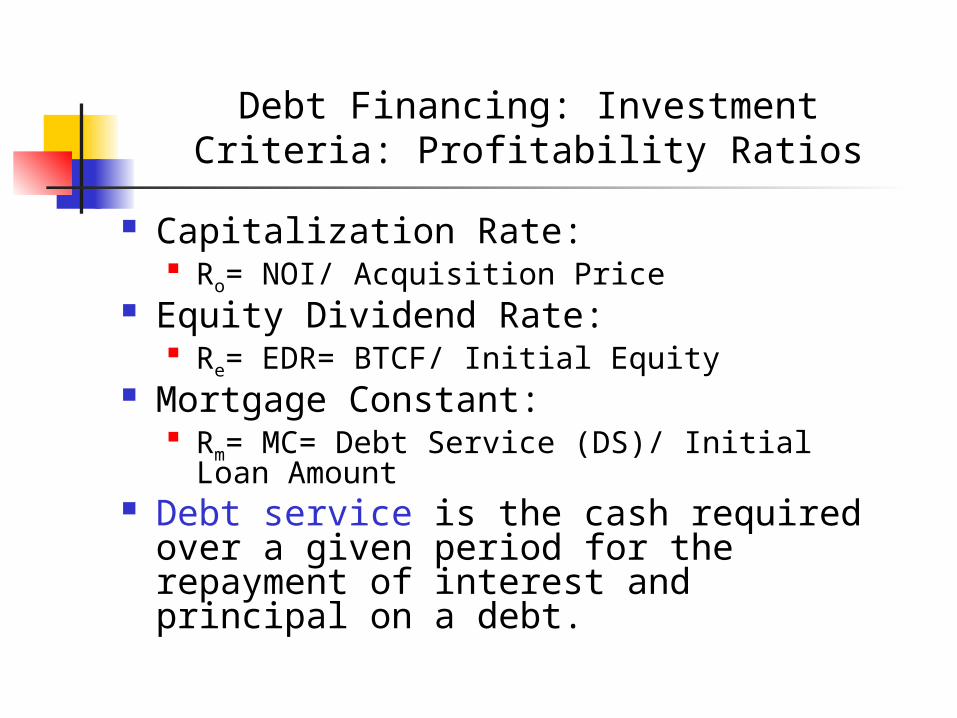
Debt Financing: Investment Criteria: Profitability Ratios
Capitalization Rate: Ro= NOI/ Acquisition Price
Equity Dividend Rate: Re= EDR= BTCF/ Initial Equity
Mortgage Constant: Rm= MC= Debt Service (DS)/ Initial Loan
Amount Debt service is the cash required over
a given period for the repayment of interest and principal on a debt.
© 2005 The McGraw-Hill Companies, Inc., All Rights ReservedMcGraw-Hill/Irwin
Slide 23
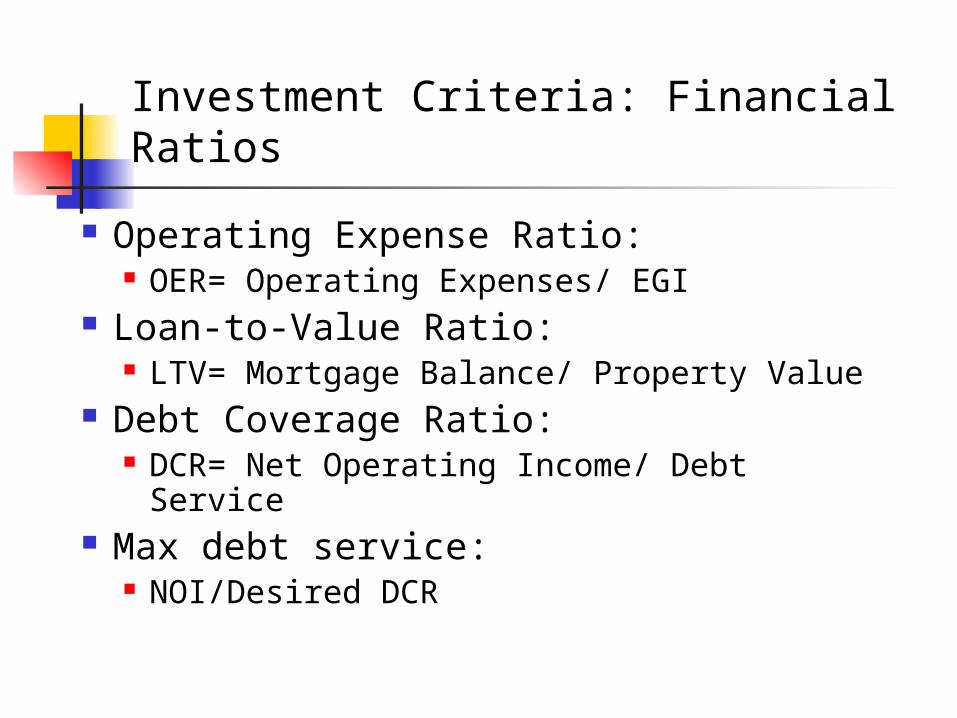
Investment Criteria: Financial Ratios
Operating Expense Ratio: OER= Operating Expenses/ EGI
Loan-to-Value Ratio: LTV= Mortgage Balance/ Property Value
Debt Coverage Ratio: DCR= Net Operating Income/ Debt
Service Max debt service:
NOI/Desired DCR

© 2005 The McGraw-Hill Companies, Inc., All Rights ReservedMcGraw-Hill/Irwin
Slide 24
End of chapter!