© 2006 population reference bureau female genital cutting, by age prevalence among younger and...
TRANSCRIPT

© 2006 Population Reference Bureau
Female Genital Cutting, by Age
Prevalence Among Younger and Older WomenPercent
13
76
46
9791
71
1724
83
46
9891
69
28
Benin 2001
BurkinaFaso 2003
Chad 2004
Egypt 2000
Mali 2001
Mauritania2000/2001
Nigeria2003
Ages 20-24 Ages 45-49
Source: ORC Macro, Demographic and Health Surveys.

© 2006 Population Reference Bureau
Female Genital Cutting, by Level of Education
Prevalence Among Women 15 to 49 Percent
99
22
92
72
50
78
9890
69
31
9
77
94
64
87
31
5
58
Benin 2001
BurkinaFaso 2003
Chad 2004
Egypt 2000
Mali 2001
Mauritania2000/2001
No Education Primary Secondary or Higher
Source: ORC Macro, Demographic and Health Surveys.

© 2006 Population Reference Bureau
Female Genital Cutting, by Residence
Prevalence Among Women 15 to 49 Living in Urban, Rural AreasPercent
13
75
47
9590
65
2820
77
44
9993
77
14
Benin 2001
BurkinaFaso 2003
Chad 2004
Egypt 2000
Mali 2001
Mauritania2000/2001
Nigeria2003
Urban Rural
Source: ORC Macro, Demographic and Health Surveys.
© 2006 Population Reference Bureau
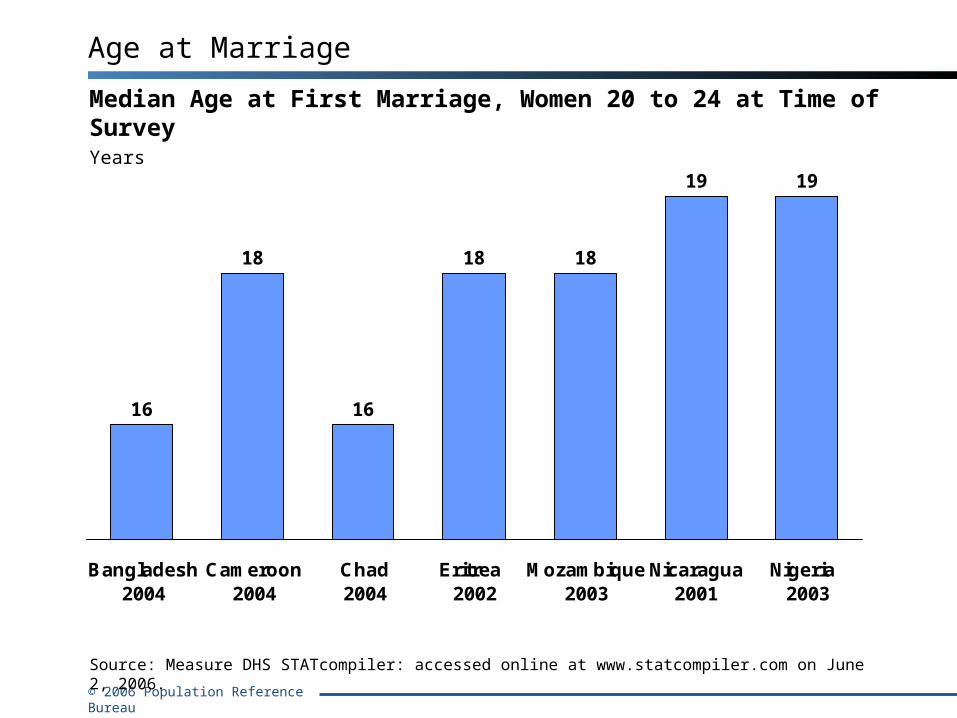
Age at Marriage
Median Age at First Marriage, Women 20 to 24 at Time of SurveyYears
16
18
16
18 18
19 19
Bangladesh2004
Cameroon2004
Chad 2004
Eritrea 2002
Mozambique2003
Nicaragua2001
Nigeria 2003
Source: Measure DHS STATcompiler: accessed online at www.statcompiler.com on June 2, 2006.
© 2006 Population Reference Bureau
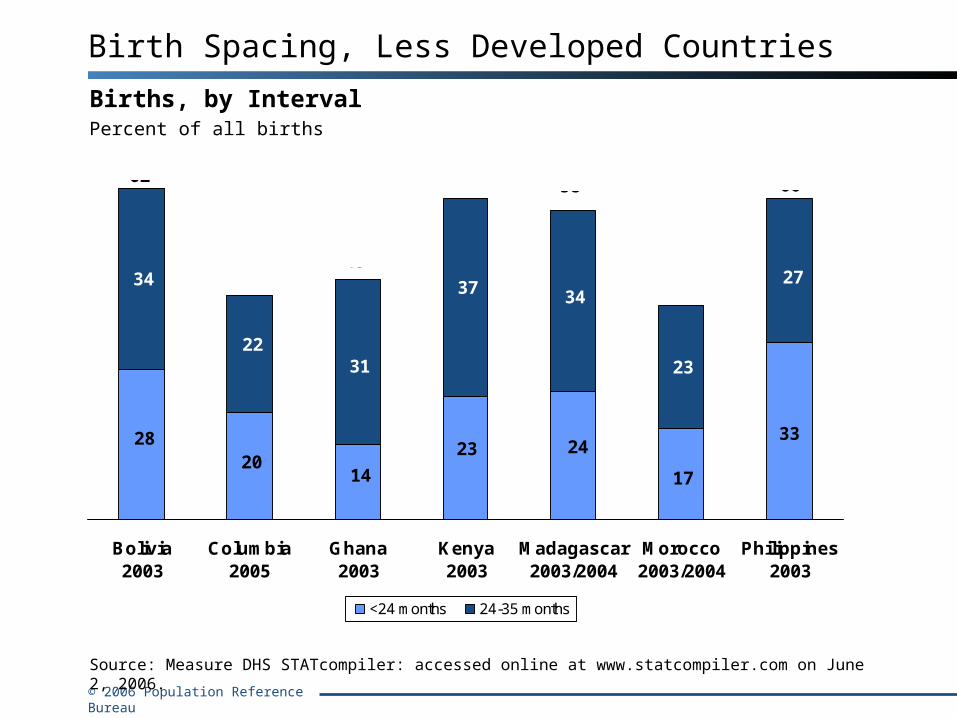
332428
2014
23
17
2737
3122
3434
23
Bolivia 2003
Columbia2005
Ghana 2003
Kenya 2003
Madagascar2003/2004
Morocco2003/2004
Philippines2003
<24 months 24-35 months
62
4542
60 58
40
60
Birth Spacing, Less Developed Countries
Births, by IntervalPercent of all births
Source: Measure DHS STATcompiler: accessed online at www.statcompiler.com on June 2, 2006.

© 2006 Population Reference Bureau
2000Maternal deaths per 100,000 Live Births
Map of Maternal Mortality, Worldwide
Source: WHO, UNICEF, and UNFPA, Maternal Mortality in 2000: Estimates Developed by WHO, UNICEF, and UNFPA, 2004.

© 2006 Population Reference Bureau
2000 EstimatesPregnancy and childbirth-related deaths per 100,000 live births
Maternal Mortality, by Region
13
110
190 220
560
940
MoreDevelopedCountries
East Asiaand thePacific
LatinAmerica
and theCaribbean
Middle Eastand North
Africa
South Asia Sub-Saharan
Africa
Source: WHO, UNICEF, and UNFPA, Maternal Mortality in 2000: Estimates Developed by WHO, UNICEF, and UNFPA, 2004.
© 2006 Population Reference Bureau
Notes on Maternal Mortality, by Region
•Over 99 percent of maternal deaths occur in less developed countries, particularly in Asia and Africa.•While high-quality, accessible health care has made maternal death a rare event in more developed countries, the lack of such health care has fatal consequences for pregnant women in less developed countries.
© 2006 Population Reference Bureau
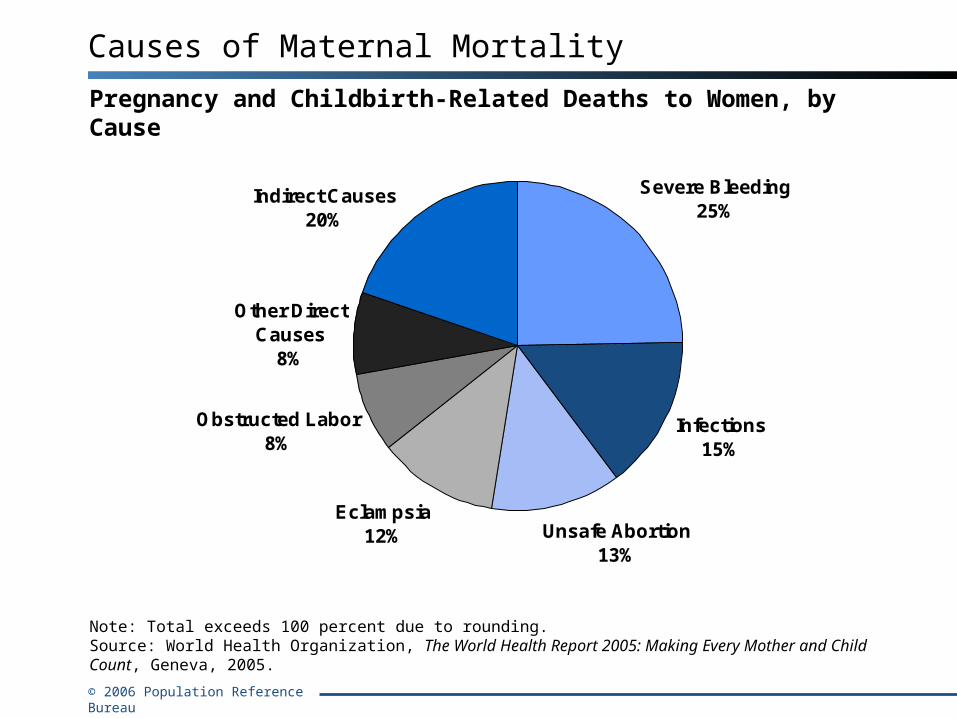
Infections15%
Unsafe Abortion13%
Eclampsia12%
Obstructed Labor8%
Other Direct Causes
8%
Severe Bleeding25%
Indirect Causes20%
Pregnancy and Childbirth-Related Deaths to Women, by Cause
Causes of Maternal Mortality
Note: Total exceeds 100 percent due to rounding.Source: World Health Organization, The World Health Report 2005: Making Every Mother and Child Count, Geneva, 2005.

© 2006 Population Reference Bureau
• Over three-quarters of maternal deaths are due to direct complications of pregnancy and childbirth, such as severe bleeding, infection, unsafe abortion, hypertensive disorders (eclampsia), and obstructed labor.• Women also die of indirect causes aggravated by pregnancy, such as malaria, diabetes, hepatitis, and anemia.
Notes on Causes of Maternal Mortality

© 2006 Population Reference Bureau
Births in 2004, and Births Attended by Skilled Personnel 1996-2004
10 12
28 3037
76
87
42
86
36
Middle East andNorth Africa
Latin Americaand the
Caribbean
Sub-SaharanAfrica
East Asia andthe Pacific
South Asia
Births in millions, 2004 Percent of births attended by skilled personnel, 1996-2004
Births and Assisted Deliveries Worldwide
Source: UNICEF End of Decade Databases—Delivery Care (http://childinfo.org/areas/deliverycare).

© 2006 Population Reference Bureau
• The areas of the world in which deliveries are least likely to be attended by skilled personnel, South Asia and sub-Saharan Africa, account for nearly half of all births worldwide (37 million and 28 million, respectively, out of a total of 133 million in 2004).
Notes on Births and Assisted Deliveries Worldwide

© 2006 Population Reference Bureau
86
42
36
76
87
93
190
220
560
940
110
64Percent of births assisted by skilled attendants, 1996-2004
Number of maternal deaths per 100,000 live births, 2000
Skilled Care at Delivery and Maternal Deaths
Regional Comparisons, 1996-2004
Sub-Saharan Africa
South Asia
East Asiaand the Pacific
Middle East and North Africa
Latin America and the Caribbean
Central, EasternEurope/ Baltics/ CIS*
* Commonwealth of Independent States (former Soviet Union). Source: UNICEF End of Decade Databases—Maternal Health (http://childinfo.org/eddb/maternal.htm).

© 2006 Population Reference Bureau
59
37
646060
40
51
35
69
56
29
71
30
51
BurkinaFaso 2003
Cameroon2004
Ghana 2003
Kenya 2003
Mozambique2003
Nigeria 2003
Zambia2001/2002
Female Male
Respondents With Symptoms Who Sought Treatment, by SexPercent
Awareness of Sexually Transmitted Infections
Note: The figure presents the percentage of respondents reporting symptoms suggestive of STIs in the last 12 months who sought care from a clinic, hospital, or private doctor.Source: DHS HIV/AIDS Survey Indicators Database: accessed online at www.statcompiler.com on June 2, 2006.

© 2006 Population Reference Bureau
•Treatment-seeking for a sexually transmitted infection is a measure of knowledge of infections such as syphilis, gonorrhea, and chlamydia—knowledge of the symptoms and knowledge that they require prompt medical treatment. Symptoms typically appear early in males, whereas STIs are less likely to produce symptoms in women and are therefore more difficult to diagnose until serious problems develop. •STIs cause long-term health complications. For example, the association between human papillomavirus and cervical cancer is well established. STIs are one of the most important preventable causes of low birth weight/prematurity, congenital infection, stillbirth, and postpartum infection.
Notes on Awareness of Sexually Transmitted Infections
© 2006 Population Reference Bureau
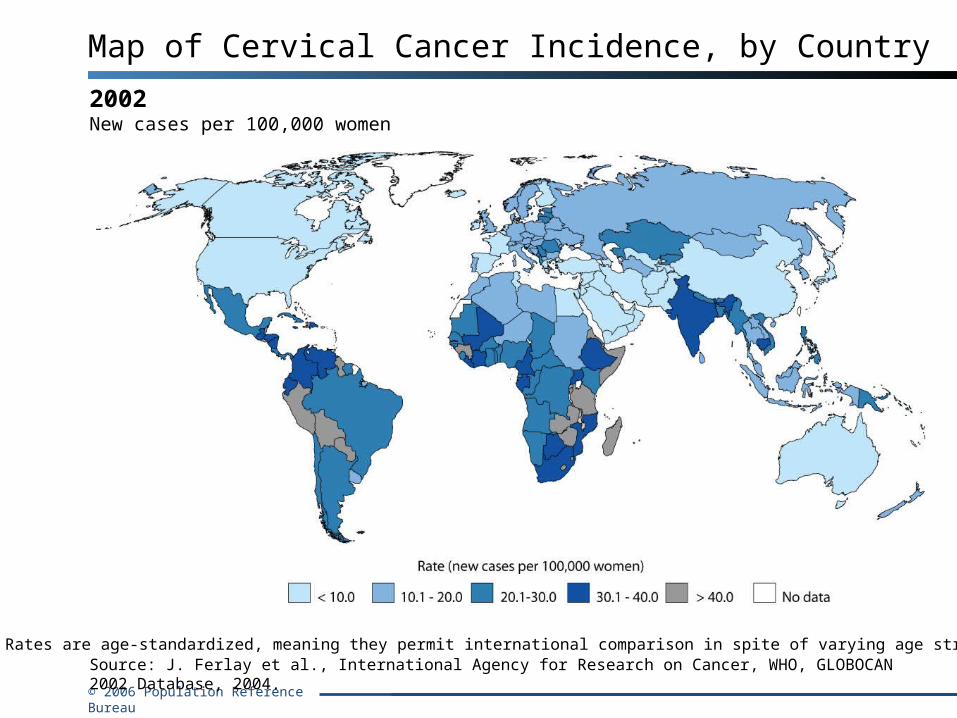
2002New cases per 100,000 women
Map of Cervical Cancer Incidence, by Country
Source: J. Ferlay et al., International Agency for Research on Cancer, WHO, GLOBOCAN 2002 Database, 2004.Note: Rates are age-standardized, meaning they permit international comparison in spite of varying age structures.
© 2006 Population Reference Bureau
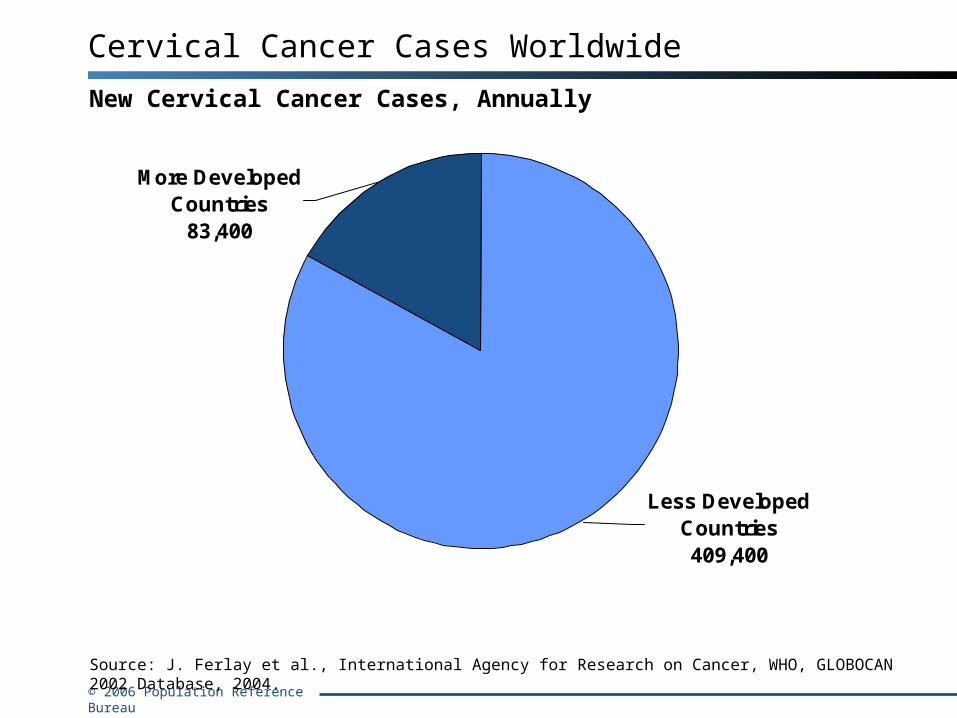
Less Developed Countries 409,400
More Developed Countries
83,400
New Cervical Cancer Cases, Annually
Cervical Cancer Cases Worldwide
Source: J. Ferlay et al., International Agency for Research on Cancer, WHO, GLOBOCAN 2002 Database, 2004.

© 2006 Population Reference Bureau
16
10
19
4
11
9
World More Developed Countries Less Developed Countries
Incidence Deaths
Rates per 100,000 women
Cervical Cancer, by World Region
Note: Rates are age-standardized, meaning they permit international comparison in spite of varying age structures.Source: J. Ferlay et al., International Agency for Research on Cancer, WHO, GLOBOCAN 2002 Database, 2004.

© 2006 Population Reference Bureau
8
3331
29
8
3
16 1513
2
Canada Caribbean Central America South America United States
Incidence Deaths
Rates per 100,000 women
Cervical Cancer in the Americas
Note: Rates are age-standardized, meaning they permit international comparison in spite of varying age structures.Source: J. Ferlay et al., International Agency for Research on Cancer, WHO, GLOBOCAN 2002 Database, 2004.

© 2006 Population Reference Bureau
47
31
31
87
31
46
31
22
55
22
12
17
48
24
17
17
12
30
Nicaragua
Jamaica
Honduras
Haiti
Guatemala
El Salvador
Dominican Republic
Costa Rica
Bolivia
Incidence Deaths
Rates per 100,000 women
Cervical Cancer, Latin America/Caribbean
Note: Rates are age-standardized, meaning they permit international comparison in spite of varying age structures.Source: J. Ferlay et al., International Agency for Research on Cancer, WHO, GLOBOCAN 2002 Database, 2004.