富邦金控簡介 - mzcan.com fhc... · 2 公司聲明 本 ... 獲利 能力及資產 ......
TRANSCRIPT

2015.2.9
富邦金控簡介

2
公司聲明
本文件可能包含「前瞻性陳述」,包括但不限於所有本公司對未來可能發生的業務活動、
事件或發展的陳述。該等陳述係基於本公司對未來營運之假設,及種種本公司無法控制之
政治、經濟、市場等因素所做成,故實際經營結果可能與該等陳述有重大差異。
本文件中所揭露之財務資訊未完全經會計師核閱。
本文件不得視為買賣有價證券或其他金融商品的要約或要約之引誘。

富邦金控競爭策略優勢
台灣地區業務領先
現金股利配發穩定
在競爭環境下股東權益報酬率穩定提升
唯一兩岸三地擁有銀行子行台資之金融機構
掌握佈局大中華地區保險及證券業務的機會
經驗豐富的團隊具堅定持續成長業務的信念
透過有紀律且成功的併購持續成長 業務持續成長
大中華區布局領先
股利配發穩定
3
旗下銀行、證劵、人壽、產險的業務排名皆領先同業
獲利能力及資產規模優於台灣上市櫃金控

國內版圖最完整的金控公司
• 2009年合併
安泰人壽
• 承保及投資皆
位居市場
領先地位
• 1992成立富邦銀行
• 2002年台北銀行換
股成為富邦金控子
公司
• 2005年台北銀行與
富邦銀行正式合併
• 大台北地區民營銀
行分行市占率第一
名
• 經紀業務市占率第三名
• 子公司富邦投信首家參股大陸基金公司
富邦金控
富邦證券
合併總資產: NT$5.4兆
股東權益: NT$4,085億
員工人數:33,938人
• 市場佔有率
第一名
• ECFA後首家
於大陸廈門設立財產保險子公司之台資企業
富邦人壽 富邦產險 1961 1993
台北富邦銀行 1992
• 首家併購香港地區銀行
• 首家參股大陸銀行 (2008參股廈門銀行)
富邦銀行(香港)
2003&2011 1988
2001年成立
富邦華一銀行 2014
• 首家台資金融機構併購大陸銀行
• 兩岸三地銀行佈局領先台灣金融同業
註:1. 合併總資產、股東權益計算至2014.12.31,員工人數更新至2014.11.30
2. 富邦金控除上述子公司外,尚有富邦金控創投、富邦行銷、富邦資產管理、富邦投信、富邦期貨、富邦投顧等子公司 4 4

發展歷程
2002 2004 2000 2009 2014 2008
富邦證券七合一
5
透過策略性併購拓展業務
• $803億台幣
• 2002年富邦金
控以換股方式
取得台北銀行
100%股權
• 2005年正式合
併成為台北富
邦銀行,分行
數達119家,
為當時資產最
大的民營銀行
• $4.15億美元
• 富邦金控以直
接收購的方式
取得港基銀行
75%股權,
2005年更名
為富邦銀行(
香港),成為
首家跨海至香
港併購銀行的
台灣金融機構
• $108億台幣
• 富邦證券以
換股方式合
併環球、中
日、金山、
世霖、華信
及快樂等六
家證券商,
「七合一」
案創下台灣
證劵史上最
大合併案
• $64.5億人民幣
• 台北富邦銀行與
富邦金控合計取
得華一銀行80%
控制性股權,
2014年1月份完
成交割
• 富邦為唯一兩岸
三地都有子行台
資金融機構,為
富邦金控在大陸
長期佈局跨出關
鍵性的一大步
• $6億美元
• 2008年宣布
取得安泰人
壽100%股權
• 2009年6月完
成合併,成
為台灣第二
大壽險公司
• $2.3億人民幣
• 透過富邦銀行(
香港)參股廈門
銀行,成為首
家參股登陸台
資金融機構

管理階層經驗豐富
Daniel Tsai
Chairman, Fubon Financial
• 34 years of industry experience
• Master of Comparative Law, Georgetown University
Richard Tsai
Vice Chairman, Fubon Financial
• 34 years of industry experience
• MBA, New York University
• 資深管理階層皆於金融服務產業領域有超過三十年的經驗
Oliver Cheng
President, Fubon Life
• 42 years of industry
experience
• Joined Fubon in 1973
• BA of Law, National
Taiwan University
Life Insurance Financial Holding Company
Jerry Harn
President, Taipei Fubon Bank
• 26 years of industry
experience
• Joined Fubon in 2005
• MBA, Ohio State University
Taipei Fubon Bank
Victor Kung
Chairman, Fubon Insurance
• 34 years of industry
experience
• Joined Fubon in 2000
• MBA, New York
University / M.A. in
Economics, New York
University
P&C Insurance
6
Vivien Hsu
President, Fubon Funancial
• 37 years of industry experience
• Joined Fubon in 2013
• MBA, University of New South
Wales
Fubon Securities
Samuel Hsu
Chairman, Fubon Securities
• 34 years of industry experience
• Joined Fubon in 2013
• MBA, Chinese Culture
University

公司治理廣獲肯定
獨立董事架構: 13席董事中4席為獨立董事、7席為非執行董事
公司治理獲獎紀錄:
「亞洲地區最佳公司治理」, 亞洲公司治理雜誌 , 2009~2014
富邦金控董事長蔡明忠: 「亞洲企業領袖成就獎」, 亞洲公司治理雜誌, 2010~2014
「台灣最佳企業社會責任」, 亞洲公司治理雜誌, 2011~2014
「公司治理白金獎」, 財資雜誌 , 2011~2014
「台灣企業永續獎-企業社會責任報告書-金融業金獎」, 2014
「天下企業公民-大型企業組前十名, 」 天下雜誌, 2014
「綠色品牌大調查─金融服務業特優」, 數位時代, 2014
7

注: (1) 為民營銀行排名 (2) 前十大發卡行排名;以有效卡為基礎
(3) 房貸餘額統記時間為2014年1~11月,其他資料統計時間為2014年1~12月
市場排名 市占率/金額
聯貸金額 (1) 1 9.2%
匯率類衍生性金融商品名目本金餘額 2 11.7%
房貸餘額 (1) 2 5.1%
信用卡每月簽帳金額 (2) 2 NT$8,102
市場排名 市占率
銀保通路 (首年度保費基礎) 1 17.3%
經代通路 (首年度保費基礎) 1 19.5%
首年度保費 2 16.3%
總保費收入 2 15.3%
業務通路 (首年度保費基礎) 3 14.6%
市場排名 市占率
IPO承銷募資金額 1 24.2%
證券經紀單點 2 0.1%
興櫃交易金額 2 18.6%
證券經紀業務 3 5.7%
市場排名 市占率/金額
直接簽單保費收入 1 22.10%
個人保險業績 1 21.30%
企業保險業績 1 24.10%
員工每人生產力 1 NT$11.7百萬元
市場地位名列前茅
人壽 銀行
產險 證劵
8

5.0
10.3 4.2
4.4
1.0 4.3
台北富邦銀行 富邦人壽 富邦產險 富邦證劵 重疊客戶 富邦金控
金融百貨模式提供多元產品與通路
多元通路提供良好跨售帄台
服務台灣客戶數超過一千萬
註: 台北富邦銀行共127家分行、富邦銀行(香港)共25家分行、 華一銀行共14家分行 (上述資料日期為 2014/12/31)
電子帄台: Fubon.com, Fubon e01電子下單系統, 518fb產險電子帄台等
(百萬人)
台北富邦銀行 富邦人壽 富邦產險 富邦證劵
328 個業務通訊處
30,712 位業務員
72 個業務通訊處
57 個證劵營業據點
616 個ATM
845 位理財顧問
127 家分行
1,016 位業務員 45 家合作保代
16,681 位業務員

海外佈局
註:富邦金控旗下子公司於大陸、菲律賓、馬來西亞、印尼等地設有
辦事處
香港
重慶
越南
福建
台灣
遼寧
泰國
印尼
江蘇
北京
廣東
公司 服務據點
銀行
台北富邦銀行 5處海外分行:香港、洛杉磯、胡志明市、帄陽及河內
富邦銀行(香港) 香港23間分行、 2間證劵服務中心、1間私人貸款中心
廈門銀行 48 間分支行:廈門、福建及重慶
富邦華一銀行 14 間分支行:上海、蘇州、天津及深圳
保險
富邦財險 31處據點: 廈門、福建、重慶、大連、遼寧
越南富邦產險 6處據點: 胡志明市、河內、峴港、帄陽、同奈及海防
越南富邦人壽 2處據點: 河內和胡志明市
證劵
富邦證劵 香港子公司
方正富邦基金 北京
天津
上海
10
菲律賓

臺北富邦銀行,
18.0 , 30%
富邦人壽,
35.5 , 59%
富邦產險,
2.8 , 5%
富邦證劵,
1.4 , 2%
富邦銀行
(香港), 2.3 ,
4% 其他, 0.2 , 0%
11
金控及各子公司獲利成長 獲利貢獻
註:富邦金控和臺北富邦銀行合計持有富邦華一銀行80%股權;
富邦華一銀行獲利貢獻約佔金控2.4%
NT$十億元 NT$十億元
11
註: 2013為反映投資性不動產採公允價值之擬制性數據
各子公司獲利表現
38.5
12.2
25.0
3.2 1.4 1.6
60.2
18.00
35.47
2.8 1.4 2.3
富邦
金控
台北富邦
銀行
富邦
人壽
富邦
產險
富邦
證劵
富邦銀行
(香港)
2013 2014

60,192
49,800
40,547
30,199
16,538 14,076 13,191 12,968 10,850 10,501 10,374 7,794 2,441 1,733 1,570
富邦金 國泰金 中信金 兆豐金 元大金 第一金 華南金 永豐金 開發金 玉山金 合庫金 新光金 日盛金 國票金 台新金
5.88
3.94
2.66 2.43
1.63 1.55 1.52 1.45 1.41 1.13 0.76 0.73 0.69 0.66
0.08
富邦金 國泰金 中信金 兆豐金 元大金 玉山金 第一金 永豐金 華南金 合庫金 日盛金 開發金 新光金 國票金 台新金
12
2014年稅後淨利
2014年每股盈餘
NT$百萬元
獲利表現超越同業
NT$/元
註: 為各家金控公布之全年自結獲利

獲利表現持續領先同業
13 13
每股盈餘
2009 2010 2011
2012 2013 2014
Note: Based on top 5 FHCs of average EPS during 2009 to 2014. 2014 data are preliminary basis.
NT$元
2.5
1.3 1.3 1.1
0.2
Fubon Mega Taishin Cathay CTBC
2.3
1.4 1.3 1.1
0.5
Fubon Mega CTBC Taishin Cathay
3.4
1.6 1.6 1.3 1.1
Fubon CTBC Mega Taishin Cathay
3.1
1.9 1.7 1.6
1.3
Fubon Mega CTBC Cathay Taishin
3.3
2.5
2.0 1.7
1.5
Fubon Cathay Mega Taishin CTBC
5.9
3.9
2.7 2.4
0.1
Fubon Cathay CTBC Mega Taishin

1.2
1.6 1.7
1.2 1.0
1.5
0.0
2.0
1.0 1.0 1.0
1.5
2002 2003 2004 2005 2006 2007 2008 2009 2010 2011 2012 2013
現金股利與股東權益報酬率
14 14
現金股利
NT$元
股東權益報酬率
6.3%
9.8% 9.9%
6.8% 5.3%
8.8%
7.0%
11.3%
9.3%
13.5%
10.8% 10.1%
16.2%
2002 2003 2004 2005 2006 2007 2008 2009 2010 2011 2012 2013 6M14

2014.11.27
富邦金控2014年前九月
法人說明會

16
公司聲明
本文件可能包含「前瞻性陳述」,包括但不限於所有本公司對未來可能發生的業務活動、
事件或發展的陳述。該等陳述係基於本公司對未來營運之假設,及種種本公司無法控制之
政治、經濟、市場等因素所做成,故實際經營結果可能與該等陳述有重大差異。
本文件中所揭露之財務資訊未完全經會計師核閱。
本文件不得視為買賣有價證券或其他金融商品的要約或要約之引誘。

17
子公司營運摘要
• 富邦人壽
• 富邦證劵
富邦金控營運摘要
• 富邦產險
簡報大綱
• 台北富邦銀行
• 海外銀行業務

18
富邦金控 - 2014年前9月營運摘要
台北富邦銀行
富邦人壽
富邦產險
富邦證券
稅後獲利NT$536億元,年成長率78%
初年度等價保費成長率超越市場,來自分期繳貢獻提升
投資績效持續優異
簽單保費市佔率業界第一
承保績效持續優異
收益來源均持續成長
財富管理表現優異,帶動手續費收入成長
各項業務市佔穩定提升

30.1
53.6
9M13 9M14
3.39 3.07
3.90
2011 2012 2013
30.7 29.1
38.5
2011 2012 2013
3.09
5.24
9M13 9M14
19
富邦金控 - 獲利摘要
稅後淨利
每股盈餘
NT$
+78%
+70%
NT$bn
註: (1) *投資性不動產於2014年9月採公允價值模式,9M13和2013年以擬制性基礎反映其影響
(2) 2011年和2012年分別認列出售富邦媒體科技獲利NT$80億和NT$8億
(3) 2012~2014年財務數字為T-IFRS基礎,2011年為ROC GAAP基礎
1.8 5.8
3.2
0.33
0.18 0.59
*
*
*
*

20
富邦金控 - 各子公司獲利表現
金控及各子公司獲利成長 獲利貢獻
註: 9M13為反映投資性不動產採公允價值之擬制性數據,對富邦金控、
台北富邦銀行、富邦人壽、富邦產險、富邦證劵的影響數分別為
32億、0.3億、33億、2億、0.1億
NT$bn NT$bn
註:富邦金控和台北富邦銀行合計持有富邦華一銀行80%股權;
富邦華一銀行獲利貢獻約佔金控2%
台北富邦銀行,
16.6 , 31%
富邦人壽,
31.3 , 58%
富邦產險, 2.4 ,
5%
富邦證劵, 1.2 ,
2%
其他, 2.1 ,
4%
30.1
9.2
19.9
2.7 1.1
53.6
16.6
31.3
2.4 1.2
富邦
金控
台北富邦
銀行
富邦
人壽
富邦
產險
富邦
證劵
9M13 9M14

3,623 4,106
4,597
2011 2012 2013
4,440
5,207
9M13 9M14
324
371
9M13 9M14
21
富邦金控 - 資產與淨值
總資產
淨值
+17%
+14%
NT$bn
NT$bn
註: * 9M13和2013年為反映投資性不動產採公允價值之擬制性數據
234
306 342
2011 2012 2013
23.7
22.6
29.0
27.3
26.4
25.2
*
*
*
*

22
富邦金控 - 資產報酬率與股東權益報酬率
資產報酬率 (ROA)
股東權益報酬率 (ROE)
0.94%
1.46%
9M13 9M14
12.36%
20.05%
9M13 9M14
0.87%
0.75%
0.88%
2011 2012 2013
13.54%
10.71% 11.54%
2011 2012 2013
0.10%
0.57%
0.04%
0.87%
0.13%
1.04%
註: *9M13和2013年為反映投資性不動產採公允價值之擬制性數據
*
*
*
*

不動產增值利益影響數
23
對淨值和損益影響數
對 ROA、ROE和每股淨值的影響數 (2014/9/30)
NT$m 淨值 (2014/9/30) 稅後淨利 (2014年1~9月)
調整前 調整後 差異數 調整前 調整後 差異數
富邦金控 343,752 371,074 27,322 51,786 53,582 1,796
台北富邦銀行 147,975 149,009 1,034 16,537 16,577 40
富邦人壽 168,667 192,537 23,870 29,803 31,253 1,450
富邦產險 20,682 26,235 5,553 2,272 2,372 100
富邦證劵 30,714 31,080 366 1,254 1,246 (8)
ROE ROA 每股淨值
調整前 調整後 差異數 調整前 調整後 差異數 調整前 調整後 差異數
富邦金控 20.92% 20.05% -0.87% 1.42% 1.46% 0.04% 33.59 36.26 2.67
台北富邦銀行 15.68% 15.61% -0.07% 1.14% 1.15% 0.01% 16.59 16.71 0.12
富邦人壽 25.11% 22.98% -2.13% 1.57% 1.64% 0.07% 38.35 43.78 5.43
富邦產險 13.91% 11.59% -2.32% 4.11% 3.97% -0.14% 65.07 82.54 17.47
富邦證劵 5.50% 5.40% -0.10% 2.70% 2.67% -0.03% 18.45 18.67 0.22
註:已扣除合併主體間沖銷金額

24
子公司營運摘要
• 富邦人壽
• 富邦證劵
富邦金控營運摘要
• 富邦產險
簡報大綱
• 台北富邦銀行
• 富邦華一銀行

13.9 14.6 15.8
8.1 8.3 8.4
3.4
6.3
9.4
2011 2012 2013
* Note: Disposal gains of NT$984m from VISA and MasterCard investment in 2Q13
25
台北富邦銀行 - 營收成長
台北富邦銀行營收組成
NT$bn
註: 合併基礎;富邦華一銀行自2014年1月7日計入
營收多元成長
財富管理業務帶動淨手續費收入強勁成長
25.5
29.2
33.6
11.6 12.9
6.1
8.2
7.9
9.2
3.8
9M13 9M14
富邦華一銀行
衍生性商品、外匯與其他收入
淨手續費收入
淨利息收入 34.2
25.5

182.7 140.0
518.5 565.1
39.9 65.6
356.5 376.0
47.0 43.9 7.2 6.9
Sep-13 Sep-14
信用卡循環餘額
其他消金放款
房貸
遠期信用狀買斷及應收帳款承購
企業放款
政府
26
台北富邦銀行 - 授信組成
放款及應收帳款餘額組成
NT$bn YoY +4.0% (放款及應收帳款)
YoY +1.8% (放款)
YoY -4.2%
YoY -6.6%
YoY +5.5%
YoY +9.0%
YoY +64.4%
YoY -23.4%
註: 第12-17頁均為個體基礎
1,151.9 1,197.5
放款成長趨緩主因政府部門還款
排除政府相關之放款年成長率6.8%,含應收帳款類年成長率9.1%
27
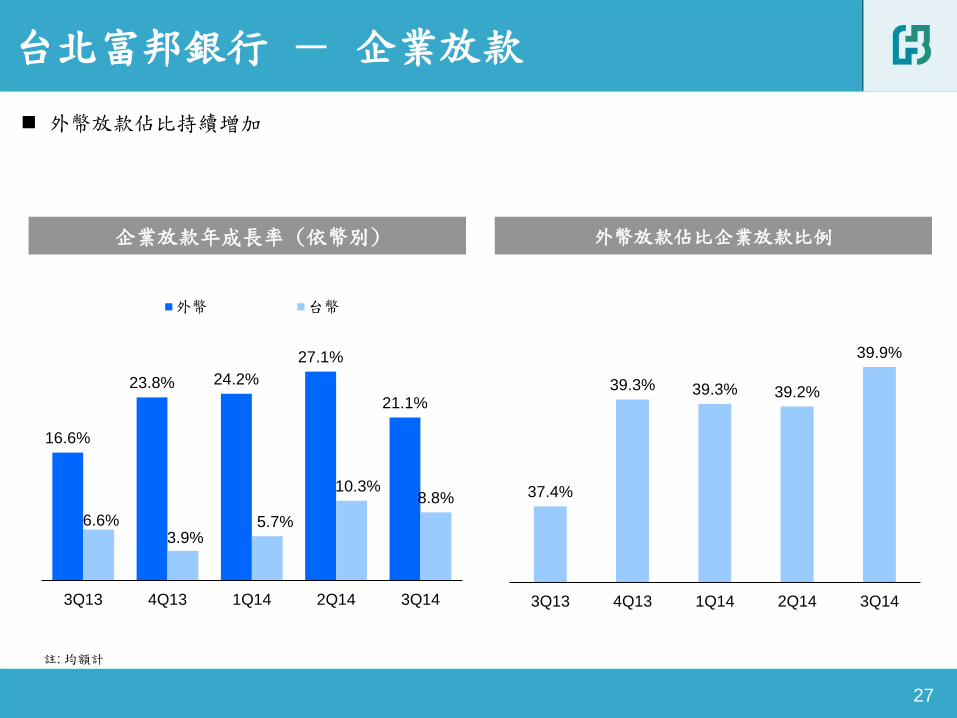
台北富邦銀行 - 企業放款
企業放款年成長率 (依幣別) 外幣放款佔比企業放款比例
註: 均額計
16.6%
23.8% 24.2%
27.1%
21.1%
6.6% 3.9%
5.7%
10.3% 8.8%
3Q13 4Q13 1Q14 2Q14 3Q14
外幣 台幣
37.4%
39.3% 39.3% 39.2%
39.9%
3Q13 4Q13 1Q14 2Q14 3Q14
外幣放款佔比持續增加

28
台北富邦銀行 - 放款利率與收益率
淨利差與存放利差
放款利率與存款利率
註: 放款利率計算包含信用卡循環息
1.98% 2.06% 2.04%
0.64% 0.73% 0.71%
2011 2012 2013
放款利率 存款利率
0.99% 1.01% 1.05%
1.34% 1.33% 1.33%
2011 2012 2013
淨利差 (NIM) 存放利差
1.04% 1.10%
1.34% 1.27%
9M13 9M14
2.04% 2.06%
0.71% 0.79%
9M13 9M14

29
台北富邦銀行 - 存款與存放比
台幣存放比與淨利差 台幣存款組合
外幣存款組合
NT$bn
NT$bn
1,014 988
308 376
註: 期末餘額計
外幣存放比與淨利差
1.02% 1.02%
1.12% 1.30%
NIM
NIM
89.2% 91.0%
Sep-13 Sep-14
70.7% 63.5%
Sep-13 Sep-14
48.9% 53.3%
51.1% 46.7%
Sep-13 Sep-14
定存
活存
46.6% 38.4%
53.4% 61.6%
Sep-13 Sep-14
定存
活存

708 663 774 984 1,007 986 1,290 87 80 79
85 90 71
65 806 831 514
616 797 807
875 197 204 423 228
268 393
373
1Q13 2Q13 3Q13 4Q13 1Q14 2Q14 3Q14
結構式商品與其他
共同基金
信託
銀行保險
30
台北富邦銀行 - 手續費收入與財富管理業務
手續費收入來源
財管業務收益
1,778 1,789 1,912
2,162
NT$m
NT$m
財管業務成長動能強勁,帶動全行手續費收入年成長31.5%
註: 資料包含台北富邦銀行及北富銀人身保代
2,256
1,798
6,269
4,526
813 314
8,249
6,408
862 438
手續費收入 財富管理 信用卡 聯貸
9M13 9M14
2,603

3,639
41
9M13 9M14
福聚能放款提列50%呆帳準備(10
月底達80%),為其他放款回收所抵消
為達正常放款1%提存,增加NT$37億元提存
0.0%
0.2%
0.4%
0.6%
Sep-11 Mar-13 Sep-14
企業放款 房貸
31
台北富邦銀行 - 資產品質
逾放比
法金放款與房貸逾放比 提存金額
備抵呆帳覆蓋率
0.30%
0.02%
1068.2%
589.5%
Sep-13 Sep-14
0.11%
0.20%
Sep-13 Sep-14
福聚能NT$11.4億元放款轉列逾放
NT$m

32
子公司營運摘要
• 富邦人壽
• 富邦證劵
富邦金控營運摘要
• 富邦產險
簡報大綱
• 台北富邦銀行
• 富邦華一銀行

222.8 249.7
212.9
145.4
171.0 207.2
2011 2012 2013
初年度保費 續年度保費
33 33
368.2
420.7
NT$bn
富邦人壽 - 總保費收入
420.1
初年度續年度保費成長帶動總保費年成長9%
149.8 160.2
150.3 167.0
9M13 9M14
300.1 327.3

初年度保費收入組成
34
富邦人壽 - 初年度保費(FYP)收入
初年度保費收入年成長7%
傳統型分期繳貢獻提升
NT$bn 9M13 % 9M14 % YoY
傳統壽險:分期繳 22.9 15.3% 40.8 25.4% 77.7%
傳統壽險:躉繳 77.1 51.5% 98.0 61.2% 27.1%
利變年金險 38.6 25.8% 5.8 3.6% -85.0%
投資型保單 7.3 4.9% 11.6 7.2% 58.1%
健康險、傷害險和其他 3.8 2.5% 4.0 2.5% 7.0%
合計 149.8 100.0% 160.2 100.0% 7.0%

8.2% 8.2% 9.5%
4.3% 2.7% 10.3% 1.0% 0.8%
1.8%
22.6% 25.2% 20.1%
63.9%
63.1%
58.3%
2011 2012 2013
傳統壽險:分期繳
傳統壽險:躉繳
投資型保單
利變年金險
健康險、傷害險和其他
35
54.2
68.6
62.3
NT$bn
富邦人壽 - 初年度等價保費(FYPE)收入
39.1
46.9
初年度等價保費收入成長20.1%, 超越市場同期成長率12.9%
追求分期繳儲蓄型商品及高利潤商品持續成長

初年度保費依通路別
36
NT$bn
富邦人壽 - 銷售通路分佈
銀行通路 – 初年度保費收入
NT$bn
業務員人數
14,800
16,297
Sep-13 Sep-14
89.2 70.7
8.3 23.5
9M13 9M14
分期繳壽險
躉繳壽險 & 利變年金
業務員通路保費收入穩定成長,組織人數持續增加
銀行通路持續加強傳統型商品銷售,分期繳比重大幅提升
34.1 47.2
71.2 67.1
26.4 27.2
18.3 18.7
9M13 9M14
其他
銀行保代:台北富邦銀行
銀行保代:外部銀行
業務員通路

37 37
經常性收益為投資收益主要來源
利得收益創造佳績
富邦人壽 - 投資收益組成
NT$bn 9M13 9M14 YoY 2011 2012 2013
經常性投資收益 57.2 67.5 18.0% 52.0 62.7 74.4
債劵類投資利得 7.8 10.6 36.3% 2.6 7.9 8.0
股票類投資利得 3.3 12.1 264.6% 5.2 4.7 4.0
外匯及其他 -4.3 -5.9 36.5% -5.1 -6.6 -6.3
投資性不動產公允價值變動 * 2.9 1.3 -56.3%
總投資收入 66.9 85.6 28.0% 54.7 68.6 80.2
總投資資產 2130.3 2466.1 15.8% 1573.2 1932.3 2203.7
註: *9M13為反映投資性不動產採公允價值之擬制性數據

38 38
投資資產規模年成長15.8%
海外股債佔比提升
國際板債劵投資達總投資資產2.1%
富邦人壽 - 投資組合
2013/9/30 2014/9/30
NT$bn
現金及約當現金 112.2 5.3% 132.8 5.4%
國內債券 612.2 28.7% 631.5 25.6%
國外債券 897.8 42.1% 1,072.9 43.5%
國內股票 233.2 10.9% 256.2 10.4%
國外股票 63.7 3.0% 119.3 4.8%
房貸 48.9 2.3% 65.9 2.7%
保單貸款 48.0 2.3% 50.3 2.0%
不動產 114.2 5.4% 137.1 5.6%
總投資資產 2,130.3 100.0% 2,466.1 100.0%
國內 1,168.8 54.9% 1,273.9 51.7%
國外 961.5 45.1% 1,192.2 48.3%
39
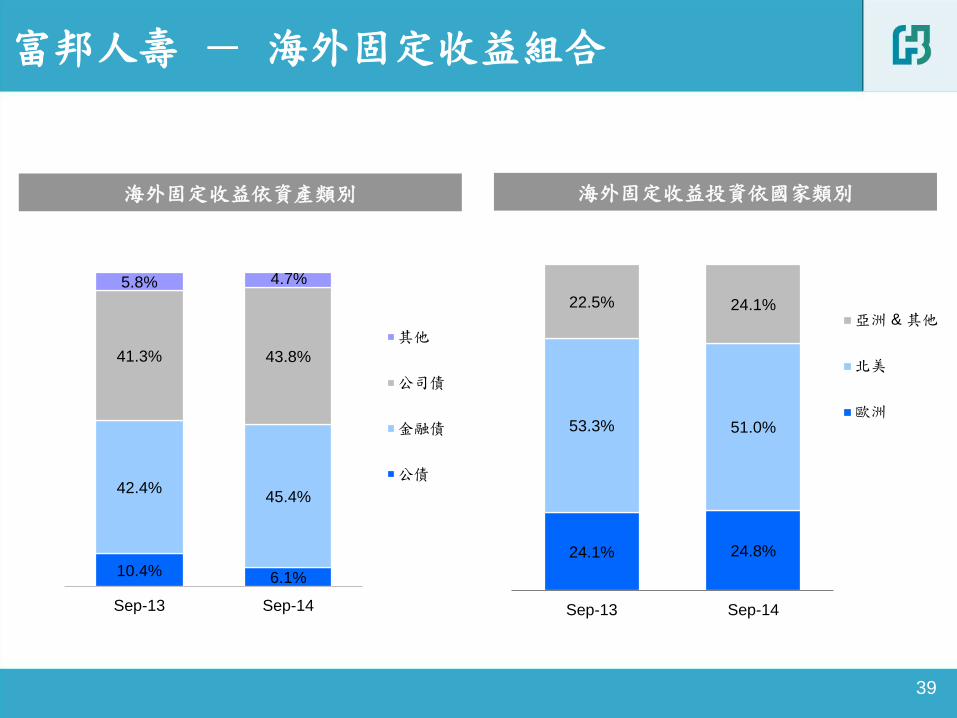
海外固定收益依資產類別
富邦人壽 - 海外固定收益組合
海外固定收益投資依國家類別
10.4% 6.1%
42.4% 45.4%
41.3% 43.8%
5.8% 4.7%
Sep-13 Sep-14
其他
公司債
金融債
公債
24.1% 24.8%
53.3% 51.0%
22.5% 24.1%
Sep-13 Sep-14
亞洲 & 其他
北美
歐洲

40 40
避險成本 & 外匯損益 外幣資產
67 bps 72 bps
持續性收益 (避險前)
富邦人壽 - 避險組合
-41
-60
-26
-12
9M13 9M14
-41
-60
-26
-12
9M13 9M14
外匯損益 & 準備
金淨提存
經常性避險成本
-41
-60
-26
-12
9M13 9M14
外匯損益 & 準備
金淨提存
經常性避險成本
完全避險,
75.8%
美元部位,
9.9%
其他幣別
部位,
2.4%
股票/共同
基金,
11.9%
3.87% 3.97%
3.64% 3.62%
9M13 9M14
避險前
避險後

4.01% 3.89%
4.57%
5.02%
Sep-13 Sep-14
負債成本 投資報酬率
41 41
投資利差
投資利差持續改善,提升公司獲利
經常性投資收益率大於損益兩帄點,持續創造公司穩定獲利來源
富邦人壽 - 投資利差持續改善
損益兩帄點與經常性收益率
損益兩帄點 = (稅前淨利– 投資收入) / 帄均投資資產
*
註: *9M13為反映投資性不動產採公允價值之擬制性數據
3.05% 2.90%
3.64% 3.62%
Sep-13 Sep-14
損益兩帄點 經常性投資收益率
0.22%
0.07%

70.8
31.0
8.4 12.0
19.4
Jun-14 Sep-14
42 42
富邦人壽淨值
NT$bn
NT$bn
備供出售金融資產未實現損益變動 備供出售金融資產未實現損益
156.0 170.2 171.3
191.6 192.5
Sep-13 Dec-13 Mar-14 Jun-14 Sep-14
實現利得
股票投資之
股息收入 評價影響
19.8 22.4
23.9
* *
NT$bn
富邦人壽 - 資本水準
註: *9M13和2013年為反映投資性不動產採公允價值之擬制性數據

43
子公司營運摘要
• 富邦人壽
• 富邦證劵
富邦金控營運摘要
• 富邦產險
簡報大綱
• 台北富邦銀行
• 富邦華一銀行

52.5% 53.5%
34.7% 34.4%
9M13 9M14
淨費用率
淨損失率
9.7 10.3
4.2 4.3
1.4 1.3 0.9 0.8
2.8 3.1
2.0 2.1
9M13 9M14
其他
健康/傷害險
工程險
水險
火險
車險
44
自留綜合率
44
NT$bn
20.9 21.9
87.2% 87.9%
簽單保費市佔率業界第一
核保利潤表現優異
註:為個體報表基礎 註:不包括汽車強制險,強制險係為無盈無虧之經營
富邦產險 - 營運摘要
險種別直接簽單保費

45
子公司營運摘要
• 富邦人壽
• 富邦證劵
富邦金控營運摘要
• 富邦產險
簡報大綱
• 台北富邦銀行
• 富邦華一銀行

46
富邦證劵 - 營運摘要
市場排名
營業收入
NT$m
各項業務市佔穩定提升
承銷業務市佔率第一
稅後淨利
1,142
1,246
9M13 9M14
4,232
4,642
9M13 9M14
9M14 市場排名 9M13 市場排名
經紀市佔率 5.81% 第3名 5.48% 第3名
經紀單點市佔率 0.10% 第2名 0.09% 第3名
興櫃交易金額市佔率 18.94% 第2名 17.45% 第2名
承銷募資金額市佔率 7.37% 第4名 5.68% 第5名
初次上櫃承銷金額市佔率 29.29% 第1名 13.25% 第3名

47
子公司營運摘要
• 富邦人壽
• 富邦證劵
富邦金控營運摘要
• 富邦產險
簡報大綱
• 台北富邦銀行
• 富邦華一銀行

48
富邦華一銀行 - 資產負債摘要
資產
存款 放款
淨值
RMB$m
28,506
31,278
Sep-13 Sep-14
40,200 38,920
Sep-13 Sep-14
44,268
56,620
Sep-13 Sep-14
3,228
4,433
Sep-13 Sep-14

49
富邦華一銀行 - 營運摘要
資產報酬率 & 股東權益報酬率
淨利差 稅後淨利
逾放比 & 備抵呆帳覆蓋率
RMB$m
資產品質及淨利差均改善
416
329
Sep-13 Sep-14
1.25% 0.83%
18.29%
11.70%
Sep-13 Sep-14
ROAA ROAE
2.44%
1.74% 1.86%
Sep-13 Jun-14 Sep-14
0.37%
1.48%
0.94% 476.2%
154.8%
264.7%
Sep-13 Jun-14 Sep-14
逾放比 呆帳覆蓋率

2013年富邦人壽隱含價值

2013年彙整
項目 2012 2013 年增率 差異 影響
淨值 (帳面價值 ) 165.6 147.8 -10.8% -17.9
調整後淨值 101.1 133.8 32.4% 32.7
有效契約價值 (不含資本成本 ) 175.1 229.9 31.3% 54.8
資本成本 (58.4) (68.0) -16.5% -9.6
有效契約價值 (含資本成本 ) 116.8 161.9 38.7% 45.1
隱含價值 (Embedded Value) 217.9 295.7 35.7% 77.9
初年度保費 (FYP) 249.7 212.9 -14.8% -36.9
初年度等價保費 (FYPE) 68.6 54.2 -21.1% -14.5
新契約年化等價保費 (APE) 71.7 54.5 -24.0% -17.2
新契約價值 (VNB, V1NB) 31.7 31.8 0.3% 0.1
新契約價值利潤率 (VNB/FYP) 12.7% 15.0% 17.7% 2.2%
新契約價值利潤率 (VNB/FYPE) 46.2% 58.8% 27.1% 12.5%
新契約價值利潤率 (VNB/APE) 44.2% 58.4% 32.0% 14.2%
新契約乘數 8.84 8.84 0.0% 0.0
精算評估價值 (Appraisal Value) 498.4 577.2 15.8% 78.7
在外流通股數 (金控 ) 9.5 10.2 7.3% 0.7
每股隱含價值 22.8 28.9 26.5% 6.0
每股精算評估價值 52.3 56.4 7.9% 4.1
Inforce
Value Creation
New Sales
Value Creation
Appraisal Value
(20 year NB)
Value per FHC
share
NT$bn
51

Unit: NT$ BN
% of change + 0.8% -23.3% + 11.6% -10.8%
Adjust.% + 1.0% -10.3% -0.1% -9.4%
(38.5) (15.2) 133.8
(0.2)1.5165.6
1.3 19.2
147.8
- 40.0
10.0
60.0
110.0
160.0
Statutory Net
Worth@Dec.
31, 2012
IFRS adj Un-realized
capital gain
Earning Statutory Net
Worth@Dec.
31, 2013
Special
Reserve
(FX and RE
Appraisal)
Adjust Market
Value of
(AFS) Fixed
Income Asset
to Book
Value
Goodwill Adjusted Net
Worth@Dec.
31, 2013
因四捨五入,數字可能無法加總
價值變動分析: 從淨值 (帳面價值)至調整後淨值
52

價值變動分析: 有效契約價值 (不含資本成本)
Unit: NT$ BN
註:
2012年有效契約價值的等價投資報酬率為4.45% ,反映rolling over效果,增加為4.51%。
2013年有效契約價值的等價投資報酬率為4.57% 。
2013年新契約價值(含資本成本) 為 318 億元
% of change -9.6% + 12.2% + 2.0% + 5.1% + 1.0% + 20.6% + 31.3%
229.9
36.0
1.79.03.521.4
175.1 (16.9)
- 20.0
30.0
80.0
130.0
180.0
230.0
2012 VIF
(before CoC)
Existing
business -
transfer to net
worth
Required
return on
existing
business
Model & Data
Change
Eco.
Assumption
Change
Non-eco.
Assumption
Change
2013
VNB(before
CoC)
2013
VIF(before
CoC)
53

Unit: NT$ BN
註:
2012年新契約價值的等價投資報酬率為4.41%,反映rolling over效果及2013年新銷售保單,等價投資報酬率下降為4.23% 。
2013年新契約價值的等價投資報酬率為4.50%。
價值變動分析: 新契約價值
% of change -24.0% + 7.9% + 12.6% + 3.8% + 0.3%
VNB/APE 44.2% 0.0% + 4.6% + 7.3% + 2.2% 58.4%
31.7
1.2
(7.6)
2.5
4.0
31.8
- 8.0
- 6.0
- 4.0
- 2.0
0.0
2.0
4.0
6.0
8.0
10.0
12.0
14.0
16.0
18.0
20.0
22.0
24.0
26.0
28.0
30.0
32.0
34.0
36.0
38.0
40.0
2012 VNB Sales Volume Product Mix Econ. Change Non-Econ. Change 2013 VNB
54

經濟假設
• 外匯價格準備金於2012年3月實施,其相關成本反映於投資報酬率假設。
Year 2012 Year 2013
投資報酬率假設
有效契約價值
台幣保單:
2013年 至 2051年為3.88%~5.32%(2052+)
美元保單 :
2013年 至 2017年為5.16%~5.18%(2018+)
一年新契約價值
台幣保單:
2013年 至 2051年為3.39%~5.32%(2052+)
美元保單 :
2013年 至 2020年為4.83%~5.18%(2021+)
利變年金
帄均利差益約為 100bps
有效契約價值
台幣保單 :
2014年 至 2051年為3.94%~5.32%(2052+)
美元保單 :
2014 至 2036年為5.16%~5.94%(2037+)
一年新契約價值
台幣保單:
2014年 至 2048年為3.74%~5.32%(2049+)
美元保單 :
2014年 至 Year 2032年為5.14%~5.94%(2033+)
利變年金
帄均利差益約為 100bps.
貼現率 11% for VIF; 10.5% for V1NB 11% for VIF; 10.5% for V1NB
等價投資報酬率 有效契約價值 : 4.45% (rolling over to 2013: 4.51%)
新契約價值 : 4.41% (rolling over to 2013: 4.23%)
有效契約價值 : 4.57%
新契約價值 : 4.50 %
評價日之殖利率
(10 年期)期初 / 長期
台幣: 1.29% / 3.50%
美元 : 1.84% / 5.25%
台幣: 1.72% / 3.50%
美元 : 3.09% / 5.25%
55

經濟假設: 有效契約投資報酬率
56

經濟假設: 一年新契約投資報酬率
57

經濟假設: 貼現率
富邦人壽 2012/12/31 2013/12/31
無風險利率 1.29%~3.5% 1.72%~3.5%
股票及國家風險溢酬 7.00% 6.50%
BETA值 1.2 1.2
風險貼現率估計 9.7%~11.9% 9.5%~11.3%
價值評估使用之風險貼現率 有效契約價值:11.0%
一年新契約價值:10.5% 有效契約價值:11.0%
一年新契約價值:10.5%
• 風險貼現率: 依資本資產定價模型 (CAPM, Capital Asset Pricing Model)訂定;
風險貼現率 = 無風險利率 + BETA值 * 股票及國家風險溢酬。
58

資本成本
資本成本估算
資本成本主要係依據法定最低要求200%RBC之計算基礎估算而來, 並考慮下述因子:
1) K 值: 2013年貣上升至0.5,之後維持不變;
2) 加計前一年度傳統型商品C3調整後之風險資本額總計的10%
(除了投資型商品以外之所有商品) ;
3) 反映公司目前經營狀況以及未來營運策略。
2013年風險資本(RBC)法規變動與調整:
1) 修改C1集中度風險計算基礎(將國外投資總額拆分至六項分類)
2) 調整C1s分類(將股票型基金併入C1s)
3) 修改投資性不動產素地展延次數之計算基礎。
59

敏感度分析: 投資報酬率
註:調整後淨值不受投資報酬率假設影響
-17.5% 17.5% -26.6% 26.6%
-14.6% 14.6% -13.6% 13.6%
(40.2)
229.9
40.2
Return - 0.25% Base Return + 0.25%
43.1(43.1)
295.7
Return - 0.25% Base Return + 0.25%
43.1
161.9
(43.1)
Return - 0.25% Base Return + 0.25%
4.3
(4.3)
31.8
Return - 0.25% Base Return + 0.25%
VIF (before CoC) VIF
EV VNB
NT$bn
60

8.2% -6.9% 14.3% -12.0%
7.8% -6.6% 13.9% -11.8%
18.8
229.9
(15.8)
RDR - 1% Base RDR + 1%
23.1
295.7
(19.4)
RDR - 1% Base RDR + 1%
(19.4)
161.9
23.1
RDR - 1% Base RDR + 1%
31.8
4.4(3.8)
RDR - 1% Base RDR + 1%
VIF (before CoC) VIF
EV VNB
敏感度分析: 貼現率
註:調整後淨值不受貼現率假設影響
NT$bn
61

7.2%
8.7%8.0%
12.7%12.6%
15.0%
EV2008 EV2009 EV2010 EV2011 EV2012 EV2013
CAGR: 16% (2.1x)
11.8
17.9
24.8
28.031.831.7
EV2008 EV2009 EV2010 EV2011 EV2012 EV2013
CAGR: 22% (2.7x)
38.552.5
73.688.7
116.8
161.9
EV2008 EV2009 EV2010 EV2011 EV2012 EV2013
CAGR: 33% (4.2x)
77.7
128.8155.5
176.0
217.9
295.7
EV2008 EV2009 EV2010 EV2011 EV2012 EV2013
CAGR: 31% (3.8x)
2013彙整: 富邦人壽歷年隱含價值相關數值
新契約價值
有效契約價值
新契約獲利率 (VNB / FYP)
隱含價值
NT$bn
62

允當的投資報酬率假設
3.68
3.87 3.883.97
4.06
3.78 3.80
4.01 4.05
EV2009 EV2010 EV2011 EV2012 EV2013
Assumption Actual
63

德勤精算顧問審閱意見
The Engagement
• Deloitte Actuarial and Insurance Solutions (Hong Kong) Limited (“Deloitte Actuarial”) were retained by Fubon
Life to perform an independent review of the Embedded Value (EV) as at 31 December 2013 and the Value
of One Year’s New Business (V1NB) written over the period of 1 January 2013 to 31 December 2013.
Scope of Deloitte Actuarial’s Involvement
• Review and opine on the reasonableness of the EV and V1NB as calculated by the Company;
• Review of the reasonableness of the assumptions used in the calculations, taking into consideration both the
Company’s recent experience and the experience of the Taiwanese life insurance market;
• Review, at a high-level, model changes to the actuarial projection model since the previous valuation date;
• Review of the Company’s projection approach of the Cost of Capital;
• Review of the data put through the model compared to the policy data on the Company’s policy
administration systems to judge the extent to which the business has been valued in the financial model and
to identify the portion (if any) omitted and how that was valued;
• Review of the approach used to determine the Adjusted Net Worth (“ANW”), in particular, the adjustments
made in deriving the ANW, and any other adjustments made outside of the actuarial projection model;
• Review of the Company's analysis of change in the Value of In-Force Business (“VIF”) between 31 December
2012 and 31 December 2013.
Deloitte Actuarial
64

65 65
Risk Adjusted Discount Rates
Fubon Life calculated the EV and V1NB at Risk Adjusted Discount Rates (“RDR”) of 11.0%
and 10.5% respectively.
RFR based on current government
bond yield
RFR based on Company’s long-
term view
Equivalent RFR for New Business
Equivalent RFR for In-Force Business
Risk Free Rate (“RFR”) 1.72% 3.50% 2.66% 2.78%
Equity and Country Risk Premium 6.50% 6.50% 6.50% 6.50%
Beta 1.20 1.20 1.20 1.20
Calculated Risk Discount Rate 9.52% 11.30% 10.46% 10.58%
Risk Discount Rate used in the Valuation for VIF
11.00%
Risk Discount Rate used in the Valuation for V1NB
10.50%
Reference – RDR based on Capital Asset Pricing Model (CAPM):
RDR = RFR + Beta * Equity and Country Risk Premium

66 66
Comments on the Risk Adjusted Discount Rates
Deloitte Actuarial independently derived a range of RDRs using the CAPM approach:
The low end of the RDR is developed based on the current yield on 10-year Taiwan government bonds.
The high end of the RDR is developed based on the Company’s view of the 10-year Taiwan government
bond in the future.
The equivalent RFR is the RFR equivalent to using a set of graded-up RFR from 1.72% to 3.50% that
derives the same VIF and V1NB.
The Equity and Country Risk Premium was developed based on the Country Default Spreads and Risk
Premiums research published by New York University.
The Beta of 1.2 was set using a risk profiling approach which considers risks related to the product range,
distribution diversification/vulnerability, regulatory intervention and investments. Note that this beta value
is consistent with that used in previous valuations.
The RDR assumption applied by Fubon Life in the valuation lies within the range of RDR that we derived.
In particular, we feel comfortable with different RDRs being used for the valuation of the in-force and new
business, given the specific market conditions in Taiwan: it is well-known that the legacy business has a
much riskier profile than the current new business, and hence it is reasonable for shareholders to be
expecting a higher rate of return for the higher risk level. We feel that Fubon Life has taken a good
approach in splitting up the RDR assumption for the two distinctively different blocks of business.
Deloitte Actuarial

67 67
Comments on Investment Return (1)
A set of rising investment return assumption has been used in this valuation which is
considered reasonable for the present market conditions.
Deloitte Actuarial
Fubon Life’s derivation of the investment return assumption is featured by the following:
• Derivation methodology is consistent with that applied in previous valuations;
• The methodology involves:
For VIF, the investment return assumption was derived from a combination of the investment
return generated by the run-off of the existing asset portfolio and of that from future purchases
of new assets;
For V1NB, the new business is not supported by returns on existing assets and the
investment return was derived from future purchases of new assets;
• New assets are purchased at the prevailing new money rates, which are set to equal to the expected
future risk free rates plus a risk margin for each asset type;
• Future risk free rates are set starting off with the actual yield curves as at the valuation date and are
assumed to rise to a long-term level over a 10-year period. For New Taiwan Dollar and US Dollar
respectively, the initial risk free rates are 1.72% and 3.09% and a long-term risk free rate of 3.50%
and 5.25% is assumed.
• Different assumptions were derived for different types of business, which were assumed to have a
different long-term asset allocation.
• For some business lines, the investment return assumption derived in the above-mentioned manner
was capped at a certain level for conservative reasons.

68 68
Comments on Investment Return (2)
It is in Deloitte Actuarial’s view that:
Methodology
• Fubon Life’s derivation methodology for the investment return assumption is reasonable and
consistent with the way that the ANW is calculated;
Economic Assumptions
• The expected long-term risk-free rate for New Taiwan Dollar yield and US Dollar yield are
maintained at 3.5% and 5.25% respectively.
• We note that taking a view on the future capital market is not uncommon under the traditional
Embedded Value methodology. On a macro-economic level the arguments put forward for
rising interest rates are plausible, and we note that the expected future rise in yields is spread
out over a reasonably long period of 10 years.
• Readers should be aware that capital market conditions are subject to the impact of many
forces. Yields and prices of financial instruments can move dramatically in a short period of
time. As a result, it is difficult to predict the interest rate level in the future with great certainty.
Readers should refer to the sensitivity tests to develop a broader understanding of the impact of
the investment return assumption on the assessment of the economic value of Fubon Life.
• Overall, the economic assumptions appear to be reasonable.
Deloitte Actuarial

69 69
Comments on EV and V1NB Results
Deloitte Actuarial
Deloitte Actuarial have reviewed the Embedded Value and Value of One
Year’s New Business results at a high-level under the generally accepted
method for calculating traditional embedded values in Taiwan:
•Review of the changes in the VIF relative to the assumption changes and model
changes from 2012 to 2013;
•Review of the changes in the new business profit margin relative to that in 2012 based
on information on changes in sales mix, sales volume and valuation assumptions;
•Review of the sensitivities relative to the base case results.
The Embedded Value and Value of One Year’s New Business results
appear to be reasonable within the above context.
Deloitte Actuarial’s detailed opinion can be found in their opinion letter.

70 70
Comments on Non-Economic Assumptions
Non-Economic Assumptions
• The non-economic assumptions reflect Fubon Life’s best estimate of future operating
experience, and are appropriately supported by the company’s historical operating experience.
Deloitte Actuarial

謝謝