0+ 1)#2+&'3/(45&'&6+5(768350(9'3/,:+: ( - chevron...
TRANSCRIPT

Chevron Refinery Multi-‐Regional Economic Impact Analysis
Examining the Economic Impact of the Chevron Refinery on Richmond, West Contra Costa County, and the State of California
Commissioned by Presented by

BEACONECONOMICS
This publica on was prepared by:
Beacon Economics, LLC
Christopher Thornberg, Ph.D. Jordan G. LevineFounding Partner Economist & Director of Economic Research310.571.3399 [email protected] [email protected]
And by:
Dus n SchraderSenior Research Associate424.646.4652Dus [email protected]
For further informa on about Beacon Economics, please contact:
Victoria Pike BondDirector of Communica [email protected]
Or visit our website at www.BeaconEcon.com.
Reproduc on of this document or any por on therein is prohibited without the expressed wri en permission of Beacon Eco-
nomics. Copyright ©2013 by Beacon Economics LLC.

Contents
Execu ve Summary 1Report Highlights 2Total Expenditures 4Economic Impact: City of Richmond 5Economic Impact: West Contra Costa County 10Economic Impact: State of California 12Conclusion 15Appendix 16

B E
Executive Summary
59.1
76.583.5
59.1
81.989.6
59.1
107.9
118.8
0102030405060708090
100110120130
Tota
l Out
put (
$ M
illion
s)
Richmond West Contra Costa County California
Source: IMPLAN; Calculations by Beacon Economics
Expenditures and Charitable Contributions, 2012Chevron Output Impacts
Direct Effect Indirect & Induced EffectsCharitable Contributions
366
465540
366
506
587
366
679
772
0
100
200
300
400
500
600
700
800
Tota
l Em
ploy
men
t
Richmond West Contra Costa County California
Source: IMPLAN; Calculations by Beacon Economics
Expenditures and Charitable Contributions, 2012Chevron Employment Impacts
Direct Effect Indirect & Induced EffectsCharitable Contributions
Chevron's expenditures generate tens of millions of dollars in revenue for businesses in the City of Richmond andmuch more revenue for businesses throughout the state each year. Based on Chevron's 2012 expenditures, BeaconEconomics es mates that the company generates an impact of:
$76.5 million in total output in the City of Richmond per year, which produces $16.3 million in local and state taxrevenue in Richmond per year
$81.9 million in total output in West Contra Costa County per year, which produces $18.3 million in local andstate tax revenue in West Contra Costa County per year
$107.9 million in total output in the State of California per year, which produces $24.4 million in local and statetax revenue in the State of California per year
Chevron's expenditures also support thousands of jobs at businesses in the City of Richmond and throughout Califor-nia each year. Based on Chevron's 2012 expenditures, Beacon Economics es mates that the company supports:
465 jobs in the City of Richmond per year
506 jobs in West Contra Costa County per year
679 jobs in the State of California per year
This is in addi on to 2,154 employees and 1,795 contractors at Chevron facili es
Chevron and its employees' charitable contribu ons generate not only an important social impact, but a significantamount of revenue and jobs at businesses in the city, the West Contra Costa County region, and the whole state.Chevron and its employees' local charitable contribu ons in 2012 generated an impact of:
$7.0 million in total output and 75 jobs supported in the City of Richmond
$7.7 million in total output and 81 jobs supported in West Contra Costa County
$10.9 million in total output and 93 jobs supported in the State of California
Economic Development Impact Analysis 1
B E
Report Highlights
1,739
2,218
1,739
2,420
1,739
3,247
0
500
1,000
1,500
2,000
2,500
3,000
3,500
Tota
l Em
ploy
men
t
Richmond West Contra Costa County California
Source: IMPLAN; Calculations by Beacon Economics
2009 - 2013Employment Impacts of Chevron Expenditures
Direct Effect Indirect & Induced Effects
62
75
62
81
62
93
0
20
40
60
80
100
Tota
l Em
ploy
men
t
Richmond West Contra Costa County California
Source: IMPLAN; Calculations by Beacon Economics
Employment Impacts of Chevron Charitable Contributions, 2012
Direct Effect Indirect & Induced Effects
288.0
372.3
288.0
399.1
288.0
525.7
0
100
200
300
400
500
600
Tota
l Out
put (
$ M
illion
s)
Richmond West Contra Costa County California
Source: IMPLAN; Calculations by Beacon Economics
2009 - 2013Output Impacts of Chevron Expenditures
Direct Effect Indirect & Induced Effects
5.1
7.0
5.1
7.7
5.1
10.9
0
2
4
6
8
10
12To
tal O
utpu
t ($
Milli
ons)
Richmond West Contra Costa County California
Source: IMPLAN; Calculations by Beacon Economics
Output Impacts of Chevron Charitable Contributions, 2012
Direct Effect Indirect & Induced Effects
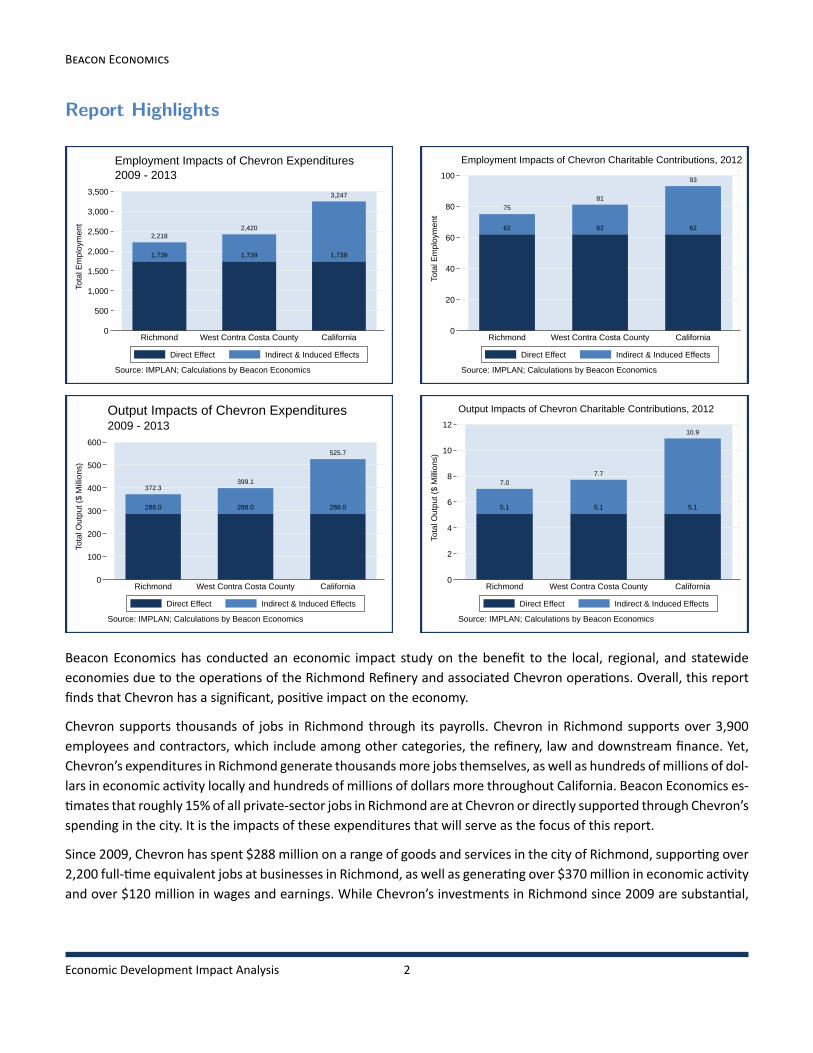
Beacon Economics has conducted an economic impact study on the benefit to the local, regional, and statewideeconomies due to the opera ons of the Richmond Refinery and associated Chevron opera ons. Overall, this reportfinds that Chevron has a significant, posi ve impact on the economy.
Chevron supports thousands of jobs in Richmond through its payrolls. Chevron in Richmond supports over 3,900employees and contractors, which include among other categories, the refinery, law and downstream finance. Yet,Chevron’s expenditures in Richmond generate thousandsmore jobs themselves, as well as hundreds ofmillions of dol-lars in economic ac vity locally and hundreds of millions of dollars more throughout California. Beacon Economics es-mates that roughly 15% of all private-sector jobs in Richmond are at Chevron or directly supported through Chevron’s
spending in the city. It is the impacts of these expenditures that will serve as the focus of this report.
Since 2009, Chevron has spent $288 million on a range of goods and services in the city of Richmond, suppor ng over2,200 full- me equivalent jobs at businesses in Richmond, as well as genera ng over $370million in economic ac vityand over $120 million in wages and earnings. While Chevron’s investments in Richmond since 2009 are substan al,
Economic Development Impact Analysis 2
B E
the total economic impact for Richmond beyond these investments was much larger, suppor ng jobs and increasingwages and earnings for local workers far down the supply chain.
During 2012 alone, Chevron made nearly $60 million in opera ng expenditures at local vendors within the Richmondarea. These annual expenditures support 465 jobs, and create $17.4 million in secondary effects. This represents alower bound to the ongoing economic impact of Chevron opera ons on the local and regional economy each year.
In addi on, expanding the locus of study from the city of Richmond to the larger West Contra Costa County regionincreases the overall impact, as spending in Richmond generates an impact on suppliers in West Contra Costa Countybut outside of Richmond. Expand the focus to the whole state of California, and the impact grows even more.
This study will examine the economic impacts of Chevron’s $288 million in expenditures from 2009 to May 2013 andover $5 million in charitable contribu ons from the company and its employees in 2012 from the perspec ve of eachof the areas described above: Richmond,West Contra Costa County, and the state of California. It will show that the ex-penditures of $288 million between 2009 and 2013 support over 3,200 full- me jobs in California, as well as generateover $525 million in statewide economic ac vity and over $25 million in tax revenues for state and local governmentin California, among other impacts. This is on top of the average of $58 million per year in taxes paid to the City ofRichmond each year.
This study will also show that Chevron and its employees’ 2012 investments in Richmond non-profits and schoolshave not only generated social benefits in the community, but important economic impacts throughout the state. Forexample, the $5.1 million in local contribu ons:
support 93 full- me equivalent jobs in California,
produce $10.9 million in economic ac vity,
increase wages and earnings for California workers by $5.7 million,
add $7.1 million in value to the state economy, and
generate nearly $0.5 million in state and local tax revenue.
Indeed, by employing an addi onal 1,000 individuals for Chevron's Richmond Refinery Moderniza on Project, thecompany could generate an es mated $209.0 million in addi onal economic ac vity in the City of Richmond, $223.8million in economic ac vity in the larger West Contra Costa County region, and $294.8 million in economic ac vitystatewide. These jobs would generate an overall economic impact that could support an es mated 1,270 total jobs inthe City of Richmond, 1,383 jobs in West Contra Costa County, and 1,855 jobs in the State of California each year forthe dura on of the project.
This is not to overlook the important local impact that these contribu ons have had. This study will take a closer lookat some of the specific organiza ons that Chevron and its employees’ have supported in the Richmond community,such as the East Bay Center for the Performing Arts, the Community Housing Development Corpora on, and RichmondHigh School.
Chevron’s expenditures in Richmond since 2009, including construc on projects and real estate, as well as servicessuch as IT and engineering consul ng, have supported thousands of full- me equivalent jobs in California, includingover 2,000 in the Richmond community alone and generated over $0.5 billion in economic ac vity throughout the
Economic Development Impact Analysis 3

B E
state. This $0.5 billion in economic ac vity is roughly equivalent to the annual revenues of California’s en re satel-lite telecommunica ons industry, according to the U.S. Economic Census. The combined effects of direct spendingon goods and services in Richmond and the secondary impacts this spending generates for suppliers of these goodsand services, in turn, provides a substan al boost to the local, regional, and state economies and labor markets. Thesupport that Chevron and its employees’ contribu ons provide to non-profits and schools in Richmond serves as keysupplement to this new economic ac vity. In all, Chevron’s opera ons in Richmond are an important driver of eco-nomic ac vity not only locally, but throughout the whole state of California.
Total Expenditures
Top Chevron Expenditures by Category
Expenditure (as % of total) 2009 2010 2011 2012 2013
Construc on of Other New Nonresiden al Structures 33.9 34.3 34.6 36.2 39.6Architectural, Engineering, and Related Services 25.7 19.3 27.0 19.3 22.2All Other Basic Inorganic Chemical Manufacturing 22.0 23.4 17.1 19.6 10.7Real Estate 9.0 11.1 8.8 10.0 7.7Wholesale Trade 3.2 4.5 4.8 4.0 3.6
Source: Chevron, Calcula ons by Beacon Economics
75,800,000
60,300,000 58,500,000 58,000,000
23,300,000
0
10,000,000
20,000,000
30,000,000
40,000,000
50,000,000
60,000,000
70,000,000
80,000,000
Tota
l Spe
ndin
g ($
)
2009 2010 2011 2012 2013Source: Chevron; 2013 represents January-May 2013 spending.
2009 - 2013Total Chevron Spending by Year
Chevron’s expenditures in Richmond spanned busi-nesses across dozens of industries, but five cate-gories consistently received the most investment. Asnoted above, Chevron invested heavily in construc-on projects, and thus it is unsurprising that the Con-
struc on of Other NewNonresiden al Structures cat-egory received the greatest amount of investmenteach year from 2009 to the present. Expendituresin this category represented at least one-third of allChevron expenditures in each of those years, from alow of 33.9% of total expenditures in the 2009 fiscalyear to a high of 39.6% in the 2013 fiscal year. Ar-chitectural, Engineering, and Related Services, whichincludes consul ng services in these areas and areclosely ed to Chevron’s construc on investmentssince 2009, also received a sizable percentage of Chevron’s total investments. Expenditures in this category wereat a low of 19.3% of all expenditures in the 2010 and 2012 fiscal years and reached a high of 27.0% of all expendi-tures in fiscal year 2011. All Other Basic Inorganic Chemical Manufacturing represents a substan al but diminishingpropor on of total investment, from a high of 23.4% of all expenditures in fiscal year 2010 to a low of 10.7% of allexpenditures in fiscal year 2013.
Economic Development Impact Analysis 4

B E
Chevron’s total expenditures reached their peak in fiscal year 2009, at $75.8 million, and they have decreased eachconsecu ve year therea er, even as expenditures in each category remained generally consistent on a propor onalbasis. Expenditures in some categories have diminished over me—such as Transit and Ground Passenger Transporta-on, which represented 0.7% of all expenditures in fiscal year 2009 and 0.6% of all expenditures in fiscal year 2010 but
0.0% of all expenditures in fiscal years 2012 and 2013. On the other hand, some new expenditures have emerged overme, such as Retail – Motor and Vehicle Parts, which represented 0.0% of expenditures from 2009 to 2011, but 2.4%
and 0.2% of expenditures in fiscal years 2012 and 2013, respec vely. In general, though, categories of expendituresreceived a fairly consistent propor on of overall Chevron spending, but from a smaller total sum of expenditures.
Economic Impact: City of Richmond
Impact from Expenditures
Impacts from Chevron's Expenditures in the City of Richmond, 2009 - May 2013
Impact Direct Effect Indirect Effect Induced Effect Total Effect
Employment (# of jobs) 1,739 233 247 2,218
Output (Millions of $) 288.0 45.6 38.8 372.3Value Added (Millions of $) 155.6 22.7 24.7 203.0Labor Income (Millions of $) 120.8 14.1 12.3 147.2
Employee Compensa on (Millions of $) 95.5 11.2 10.1 116.8Proprietor Income (Millions of $) 25.3 2.9 2.2 30.4
State and Local Taxes
Employee Compensa on Tax on Produc on & Imports Households Corpora ons Total(Millions of $) (Millions of $) (Millions of $) (Millions of $) (Millions of $)
0.3 10.2 5.7 0.2 16.3
Source: IMPLAN, Calcula ons by Beacon EconomicsFigures have been rounded.
As shown in the table above, Chevron’s investment of $288million generates substan al indirect and induced impactsin the City of Richmond. The $288 million of expenditures between 2009 and the present generates $45.6 million inindirect impacts, through economic ac vity from Chevron’s suppliers, and $38.8 million in induced impacts, througheconomic ac vity from, among others, workers whose wages and earnings increase as a result of Chevron’s spending.Thus, the total value of economic output that has been supported by the ongoing opera ons of Chevron in the Cityof Richmond over the past five years is $372.3 million. This represents a substan al amount of demand for goods andservices at businesses within the City limits that is a ributable to the opera ons of Chevron.
However, spending by Chevron at local businesses not only creates addi onal economic output, it also supports a largenumber of employment opportuni es at both Chevron and at businesses throughout the City of Richmond. This anal-ysis finds that Chevron’s spending in the City of Richmond supports 1,739 jobs at businesses throughout Richmonddirectly. Many of these jobs come from Chevron’s spending on construc on projects—718 in all—as construc on is ahighly labor-intensive industry. Yet, Chevron’s spending in some less labor-intensive and more capital-intensive cate-
Economic Development Impact Analysis 5

B E
gories, such as Architectural, Engineering, and Related Services, was substan al, as well, and thus supported many ofthese jobs (505 jobs in this category were supported directly through Chevron’s spending).
Similar to employment, Chevron’s local spending also supported a significant number of jobs at other local businessesaswell. Indeed, roughly 21.6%, or 480 in all, of the total number of jobs supportedbyChevron’s spending come throughindirect and induced effects. The biggest effects are in Architectural, Engineering, and Related Services, with 46 totaljobs supported through these effects. This is likely the result of the rela vely high wages that accrue to this sector de-spite it being less labor-intensive. As these workers earn above-average incomes, these wages are then pumped backinto the local economy via retail sales, rent andmortgage payments, dining out, and other entertainment, among otheritems. Thus, unsurprisingly, local Food Services and Drinking Establishments also benefit from spending by Chevronin the economy, with 28 total jobs supported through these effects. On top of the jobs generated through Chevron'sspending, the company also has a substan al direct employment base at its facili es: a total of 2,154 employees and1,795 contractors.
This sizable investment in the local economy is not only good solely for the economy, it is also good for individualsin Richmond. In fact, Chevron’s spending generates over $120 million in wages and earnings for Richmond workersdirectly, and generates a total of $147.2 million for these workers including indirect and induced effects. Most ofthese total wages and earnings, 79.3%, or $116.8 million, goes to employees, while the remainder goes to Richmondbusiness-owners or other establishment owners. As described above, because much of Chevron’s spending goes toindustries with lower average wages, much of the wages and earnings generated by this spending go to lower-wageworkers. This is a benefit to the many workers in lower-wage industries, such as construc on, that were badly hit bythe recession. For example, according to the California Employment Development Department, total employment inthe Construc on sector in the Oakland Metropolitan Division (Alameda and Contra Costa Coun es) fell from 72,700workers on a seasonally adjusted basis in March 2006 to a low of 45,700 workers in March 2011—a drop of 37.1%.Thus, Chevron is helping to alleviate some of the cyclical effects associated with the Great Recession by providingdemand for jobs and paying wages to workers that have been dispropor onately impacted by the recent economicdownturn.
Impacts from Chevron's Expenditures in the City of Richmond, 2012
Impact Direct Effect Indirect Effect Induced Effect Total Effect
Employment (# of jobs) 366 48 51 465
Output (Millions of $) 59.1 9.3 8.1 76.5Value Added (Millions of $) 32.5 4.6 5.1 42.3Labor Income (Millions of $) 25.2 2.9 2.6 30.6
Employee Compensa on (Millions of $) 19.9 2.3 2.1 24.3Proprietor Income (Millions of $) 5.3 0.6 0.5 6.3
State and Local Taxes
Employee Compensa on Tax on Produc on & Imports Households Corpora ons Total(Millions of $) (Millions of $) (Millions of $) (Millions of $) (Millions of $)
0.1 2.3 1.2 0.0 3.5
Source: IMPLAN, Calcula ons by Beacon EconomicsFigures have been rounded and es mated in 2013 dollars.
Economic Development Impact Analysis 6

B E
Such a steep declinewas a severe distress on the labormarket of the region, but evenmore severe for the tens of thou-sands of workers in the Construc on sector. Without Chevron’s tens of millions of dollars in spending on construc onprojects in Richmond throughout the recession and its a ermath, job losses in this sector would likely have been evengreater. For workers in Richmond’s Construc on sector whose technical skill sets are not easily transferrable to someother industries, Chevron’s construc on projects may have served as a crucial source of employment in the face ofotherwise substan al job cuts.
Based on an analysis of the economic impact of Chevron’s spending last year, $58 million (its lowest level of annualspending since 2009), Chevron’s expenditures support 465 or more jobs annually in Richmond. These expendituresgenerate $76.5 million in economic ac vity in the city, as well as $30.6 million in wages and earnings for workers atRichmond businesses.
In addi on, Chevron has contributed substan ally to Richmond’s revenue base through local taxes. Es mated local taxpayments as a result of Chevron’s opera ons¹—that is, taxes that are not directly a ributable to Chevron’s spending,whichwill be described in the State of California sec on below—to Richmond from 2009 to 2013 range between $53.6million and $68.9 million, primarily in the form of property taxes, u lity user taxes, and business license taxes. For ex-ample, Chevron paid $26.8 million in u lity user taxes to the City of Richmond in fiscal year 2012, which represents58.3% of all u lity user tax revenues for the City of Richmond that year. U lity user taxes that year represented 26.8%of all general fund revenues for the city. Consequently, Chevron’s u lity user tax payments in 2012 represented 15.6%of all general fund revenues for the city.²
0
10,000,000
20,000,000
30,000,000
40,000,000
50,000,000
60,000,000
70,000,000
80,000,000
Tax
Paym
ents
($)
2009 2010 2011 2012 2013
Source: Chevron; 2013 represents estimated tax payments.
Fiscal Years 2009 - 2013Chevron Annual Local Tax Payments
City of Richmond County of Contra Costa
¹Tax payments for fiscal year 2013 have been es mated.²City of Richmond, California Finance Department. Comprehensive Annual Financial Report for the Fiscal Year Ended June 30, 2012.
Economic Development Impact Analysis 7
B E
Thus, the ongoing opera ons of Chevron and its spending on goods and services at local businesses has a sizable im-pact on the City of Richmond. Not only does Chevron’s spending generate thousands of jobs and hundreds of millionsof dollars in demand at local businesses, it also contributes to a substan al volume of take-home pay that can berecirculated back into the economy, and to tax revenues for the City of Richmond’s General Fund.
Impact from Charitable Contributions
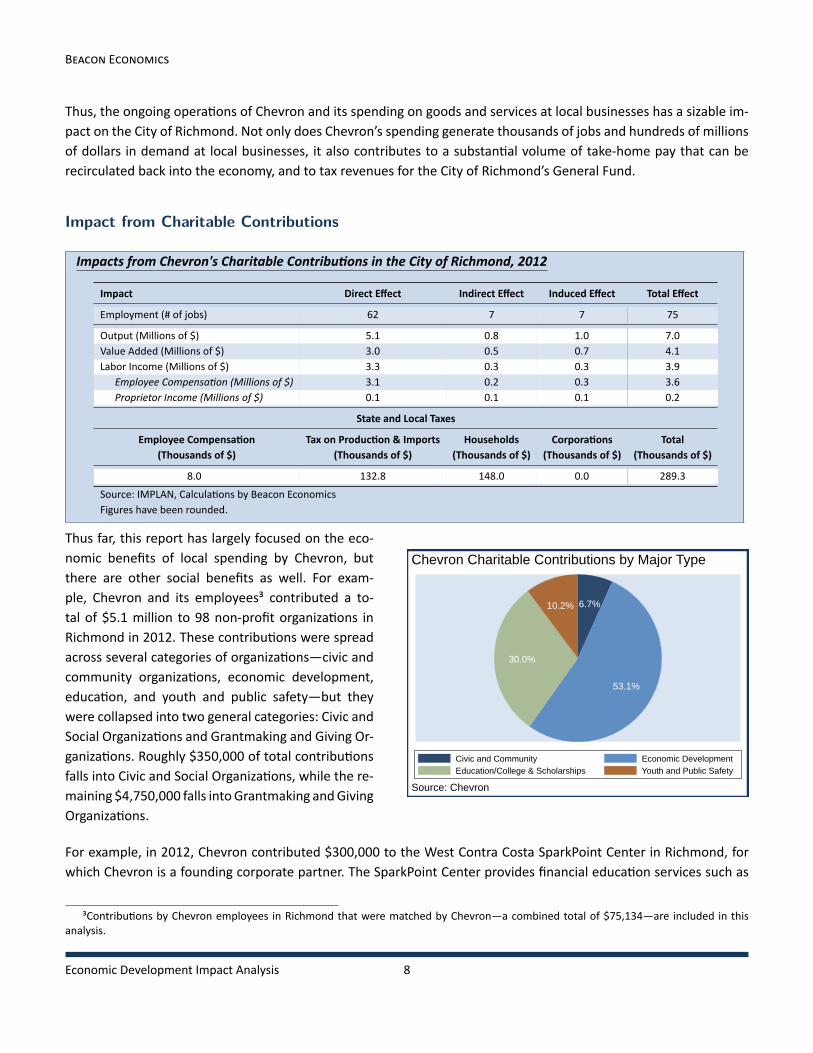
Impacts from Chevron's Charitable Contribu ons in the City of Richmond, 2012
Impact Direct Effect Indirect Effect Induced Effect Total Effect
Employment (# of jobs) 62 7 7 75
Output (Millions of $) 5.1 0.8 1.0 7.0Value Added (Millions of $) 3.0 0.5 0.7 4.1Labor Income (Millions of $) 3.3 0.3 0.3 3.9
Employee Compensa on (Millions of $) 3.1 0.2 0.3 3.6Proprietor Income (Millions of $) 0.1 0.1 0.1 0.2
State and Local Taxes
Employee Compensa on Tax on Produc on & Imports Households Corpora ons Total(Thousands of $) (Thousands of $) (Thousands of $) (Thousands of $) (Thousands of $)
8.0 132.8 148.0 0.0 289.3
Source: IMPLAN, Calcula ons by Beacon EconomicsFigures have been rounded.
6.7%
53.1%
30.0%
10.2%
Civic and Community Economic DevelopmentEducation/College & Scholarships Youth and Public Safety
Source: Chevron
Chevron Charitable Contributions by Major TypeThus far, this report has largely focused on the eco-nomic benefits of local spending by Chevron, butthere are other social benefits as well. For exam-ple, Chevron and its employees³ contributed a to-tal of $5.1 million to 98 non-profit organiza ons inRichmond in 2012. These contribu ons were spreadacross several categories of organiza ons—civic andcommunity organiza ons, economic development,educa on, and youth and public safety—but theywere collapsed into two general categories: Civic andSocial Organiza ons and Grantmaking and Giving Or-ganiza ons. Roughly $350,000 of total contribu onsfalls into Civic and Social Organiza ons, while the re-maining $4,750,000 falls intoGrantmaking andGivingOrganiza ons.
For example, in 2012, Chevron contributed $300,000 to the West Contra Costa SparkPoint Center in Richmond, forwhich Chevron is a founding corporate partner. The SparkPoint Center provides financial educa on services such as
³Contribu ons by Chevron employees in Richmond that were matched by Chevron—a combined total of $75,134—are included in thisanalysis.
Economic Development Impact Analysis 8

B E
debt management and job training, as well as offers free tax prepara on for struggling individuals and families in theEast Bay.⁴ The La na Center, an organiza on that seeks to improve the quality of life and health of La no communi esby providing personal and leadership development opportuni es to all La nas and their families, received $130,000in support from Chevron just last year. Many other organiza ons, from religious groups to women’s organiza ons tohomelessness causes and many more, Chevron is making a significant social contribu on to complement its sizableeconomic benefits it brings to the City of Richmond.
Importantly, although these are largely socially-focused contribu ons aimed at improving the quality of life and eco-nomic prospects for the community in which Chevron operates, they do generate strong economic impacts. To illus-trate, those $5.1 million in contribu ons have generated an addi onal $1.8 million in economic ac vity in Richmond.That is, 25.7% of the economic ac vity these contribu ons generate is not the effect of direct contribu ons, but rathernew output that is generated as a result of $5.1 million in new investment these organiza ons can make as a result ofChevron and its employees’ contribu ons. Organiza ons such as the Richmond Chamber of Commerce help to bringbusiness to the city, while organiza ons such as City of Richmond YouthWORKS improve the quality of life for its resi-dents, which encourages in-migra on and promotes a be er business climate. Thus, support for non-profits does notonly provide a social benefit to the Richmond community but an economic benefit, as well.
These contribu ons support a total of 75 jobs in Richmond and provide a total of $3.9 million in wages and earningsfor workers at non-profit organiza ons and schools. Unsurprisingly, because these ins tu ons are not profit-seeking,most of the $3.3 million in direct wages and earnings go to employees, rather than the ins tu ons’ founders. At thesame me, indirect wages and earnings went predominantly to employees, as well, asmost of the secondary effects ofthese contribu ons flowed to industries like Other Private Educa onal Services or Environmental and Technical Con-sul ng Services that may not operate on as high of profit margins as many other industries. Ul mately, while Chevronand its employees’ contribu ons have supported dozens of jobs in Richmond, the impact of these contribu ons onthe wage base in Richmond is especially pronounced.
The charitable contribu ons of Chevron and its employees in 2012 were consistent with their contribu ons in pre-ceding years. In 2009, Chevron and its employees contributed over $3.4 million to local organiza ons, including theBay Area Rescue Mission and Rubicon Programs. In 2010, Chevron and its employees contributed over $3.7 millionto local organiza ons, including the Neighborhood House of North Richmond and the Community Housing Develop-ment Corpora on. In 2011, Chevron and its employees contributed over $3.3 million to local organiza ons, includingCommunity Services of North Richmond and the Richmond Community Founda on. Consequently, the economic andsocial impacts of Chevron and its employees' charitable contribu ons are truly ongoing.
⁴SparkPoint Services. http://sparkpointcenters.org/financial-services.
Economic Development Impact Analysis 9

B E
Economic Impact: West Contra Costa County
Impact from Expenditures
Impacts from Chevron's Richmond Expenditures in West Contra Costa County, 2009 - May 2013
Impact Direct Effect Indirect Effect Induced Effect Total Effect
Employment (# of jobs) 1,739 328 353 2,420
Output (Millions of $) 288.0 60.3 50.8 399.1Value Added (Millions of $) 155.6 31.7 32.7 220.1Labor Income (Millions of $) 120.8 19.9 16.6 157.4
Employee Compensa on (Millions of $) 95.5 15.9 13.7 125.2Proprietor Income (Millions of $) 25.3 4.0 2.9 32.2
State and Local Taxes
Employee Compensa on Tax on Produc on & Imports Households Corpora ons Total(Millions of $) (Millions of $) (Millions of $) (Millions of $) (Millions of $)
0.3 11.4 6.3 0.4 18.3
Source: IMPLAN, Calcula ons by Beacon EconomicsFigures have been rounded.
Expanding the scope of analysis from the city of Richmond to West Contra Costa County, which includes ci es suchas Kensington, El Sobrante, and El Cerrito, the total impact of Chevron’s spending in Richmond grows larger. Directinvestment of $288 million from 2009 to 2013 generates a total economic output of $399.1 million in West ContraCosta County. Not surprisingly, indirect and induced output is greatest in Petroleum Refineries, at $14.5 million, withArchitectural, Engineering, and Related Services next at $8.8 million.
By taking the total output generated by Chevron’s spending and removing the value of intermediate inputs—that is,purchases of goods and services that are imported—we find that Chevron’s spending generates a total of $220.1 mil-lion in value for theWest Contra Costa County economy, of which $203million is concentrated in Richmond, as shownin the table above. Of this $220.1 million, $157.4 million comes from wages and earnings generated for workers inthe region. Construc on of Other New Nonresiden al Structures receives the greatest increase in this labor income,at $58.0 million, while Architectural, Engineering, and Related Services receives the greatest increase in labor incomethrough indirect and induced effects, at $5.2 million (and $41.1 million in total). Offices of Physicians, Den sts, andOther Health Prac oners receives an increase of $1.7 million in labor income, nearly all of which comes throughinduced effects. As workers see their wages and earnings rise, they are able to spend more of their income on healthand dental care, which increases the income of workers in the health care sector, in turn.
Chevron’s spending supports 2,420 jobs inWest Contra Costa County, 681 (or 28.1%) of which, come from indirect andinduced effects. As with output, much of these effects come in Architectural, Engineering, and Related Services, or 73jobs in all. Food Services and Drinking Establishments received a large benefit, as well, with 59 jobs supported throughindirect and induced effects. As wages and earnings increase for workers in West Contra Costa County, much of thisextra spending will go to restaurants and bars, encouraging these establishments to hire more employees. While mostof these jobs are concentrated in Richmond—2,218, as shown above—over 200 jobs are supported in other areas ofWest Contra Costa County.
Economic Development Impact Analysis 10

B E
Impacts from Chevron's Richmond Expenditures in West Contra Costa County, 2012
Impact Direct Effect Indirect Effect Induced Effect Total Effect
Employment (# of jobs) 366 67 73 506
Output (Millions of $) 59.1 12.2 10.6 81.9Value Added (Millions of $) 32.5 6.5 6.8 45.8Labor Income (Millions of $) 25.2 4.0 3.5 32.7
Employee Compensa on (Millions of $) 19.9 3.2 2.8 26.0Proprietor Income (Millions of $) 5.3 0.8 0.6 6.7
State and Local Taxes
Employee Compensa on Tax on Produc on & Imports Households Corpora ons Total(Millions of $) (Millions of $) (Millions of $) (Millions of $) (Millions of $)
0.1 2.5 1.3 0.1 3.9
Source: IMPLAN, Calcula ons by Beacon EconomicsFigures have been rounded and es mated in 2013 dollars.
Based on an analysis of spending in 2012, Chevron’s expenditures support a total of 506 jobs per year in West Con-tra Costa County. In addi on to the $76.5 million in economic output generated in the City of Richmond each year,these expenditures generate an addi onal $5.4 million annually in economic output in other parts of West ContraCosta County, for a total of $81.9 million. Furthermore, while Chevron’s expenditures generate an es mated $30.6million in labor income for workers in the City of Richmond each year, these expenditures generate an addi onal $2.1million for workers in other parts of West Contra Costa County, for a total of $32.7 million. Because Chevron’s 2012expenditures in 2012were the lowest in the 2009-2012 period, these es mates represent a lower bound of the annualimpacts of Chevron’s spending.
Lastly, as they have for the City of Richmond, Chevron’s opera ons also generate substan al tax revenues for theCounty of Contra Costa. Since 2009, Chevron’s opera ons have contributed an es mated $67.9 million, or an averageof $13.6 million per year, to the County of Contra Costa’s tax base.
Impact from Charitable Contributions
Impacts from Chevron's Charitable Contribu ons in West Contra Costa County, 2012
Impact Direct Effect Indirect Effect Induced Effect Total Effect
Employment (# of jobs) 62 10 9 81
Output (Millions of $) 5.1 1.2 1.3 7.7Value Added (Millions of $) 3.0 0.7 0.9 4.6Labor Income (Millions of $) 3.3 0.4 0.4 4.1
Employee Compensa on (Millions of $) 3.1 0.4 0.4 3.9Proprietor Income (Millions of $) 0.1 0.1 0.1 0.3
State and Local Taxes
Employee Compensa on Tax on Produc on & Imports Households Corpora ons Total(Thousands of $) (Thousands of $) (Thousands of $) (Thousands of $) (Thousands of $)
10.5 166.1 163.5 1.7 341.8
Source: IMPLAN, Calcula ons by Beacon EconomicsFigures have been rounded.
Economic Development Impact Analysis 11
B E
Chevron and its employees’ 2012 contribu ons to non-profit organiza ons and schools in Richmond generate a totalof $7 million in economic output for the city of Richmond, but an addi onal $700,000 for other areas of West ContraCosta County. Of the $7.7 million in economic output generated by these contribu ons, over 32%, or $2.5 million,comes from indirect and induced effects, as those contribu ons s mulate economic ac vity in sectors such as RealEstate (approximately $270,000 in indirect and induced effects) andManagement, Scien fic, and Technical Consul ngServices (approximately $150,000 in indirect and induced effects).
Outside of the $3.6 million in labor income that is generated in the city of Richmond, and addi onal $500,000 in la-bor income is generated in West Contra Costa County from Chevron and its employees’ charitable contribu ons. Aswith Richmond, nearly all of these wages and earnings come in the form of employee compensa on—approximatelyapproximately $3.9 million—rather than income for business-owners.
Charitable contribu ons in 2012 support an addi onal six jobs in West Contra Costa County beyond the 75 jobs sup-ported in Richmond. Most of the 81 total jobs supported by those contribu ons are in Grantmaking and Giving Or-ganiza ons and Civic and Social Organiza ons, although those contribu ons also support some jobs in Food Servicesand Drinking Establishments, Other Private Educa onal Services, Real Estate, among other sectors.
Economic Impact: State of California
Impact from Expenditures
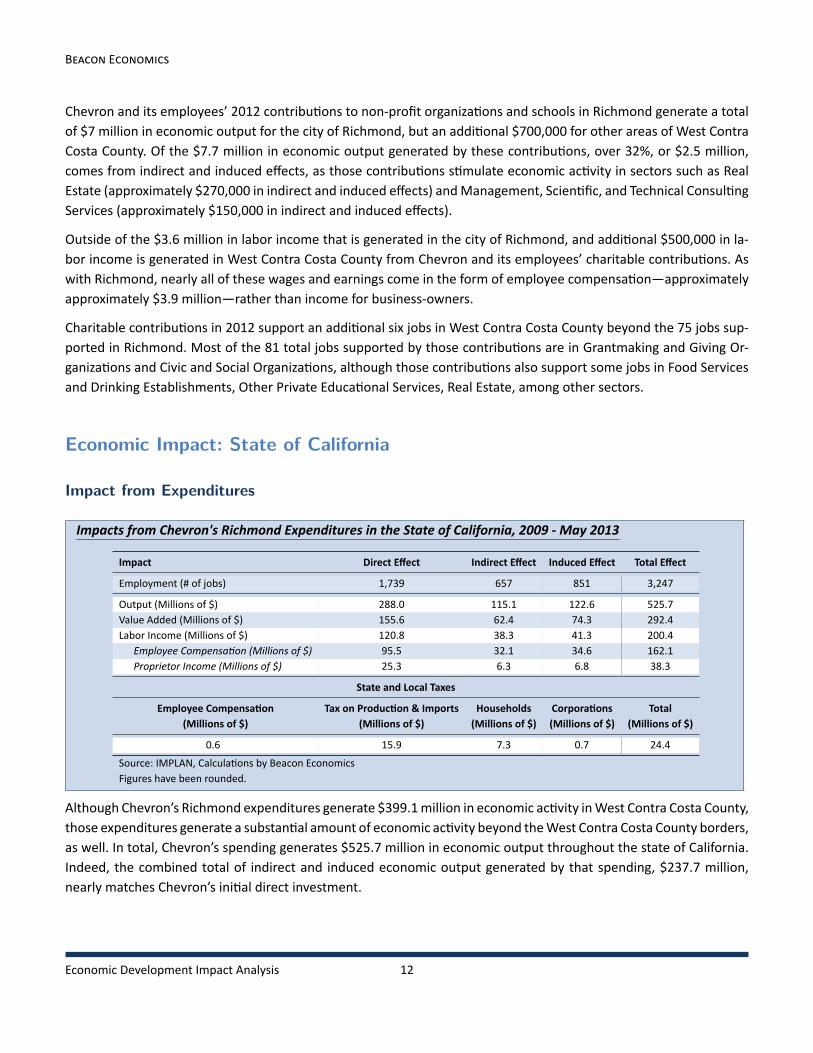
Impacts from Chevron's Richmond Expenditures in the State of California, 2009 - May 2013
Impact Direct Effect Indirect Effect Induced Effect Total Effect
Employment (# of jobs) 1,739 657 851 3,247
Output (Millions of $) 288.0 115.1 122.6 525.7Value Added (Millions of $) 155.6 62.4 74.3 292.4Labor Income (Millions of $) 120.8 38.3 41.3 200.4
Employee Compensa on (Millions of $) 95.5 32.1 34.6 162.1Proprietor Income (Millions of $) 25.3 6.3 6.8 38.3
State and Local Taxes
Employee Compensa on Tax on Produc on & Imports Households Corpora ons Total(Millions of $) (Millions of $) (Millions of $) (Millions of $) (Millions of $)
0.6 15.9 7.3 0.7 24.4
Source: IMPLAN, Calcula ons by Beacon EconomicsFigures have been rounded.
Although Chevron’s Richmond expenditures generate $399.1million in economic ac vity inWest Contra Costa County,those expenditures generate a substan al amount of economic ac vity beyond theWest Contra Costa County borders,as well. In total, Chevron’s spending generates $525.7 million in economic output throughout the state of California.Indeed, the combined total of indirect and induced economic output generated by that spending, $237.7 million,nearly matches Chevron’s ini al direct investment.
Economic Development Impact Analysis 12
B E
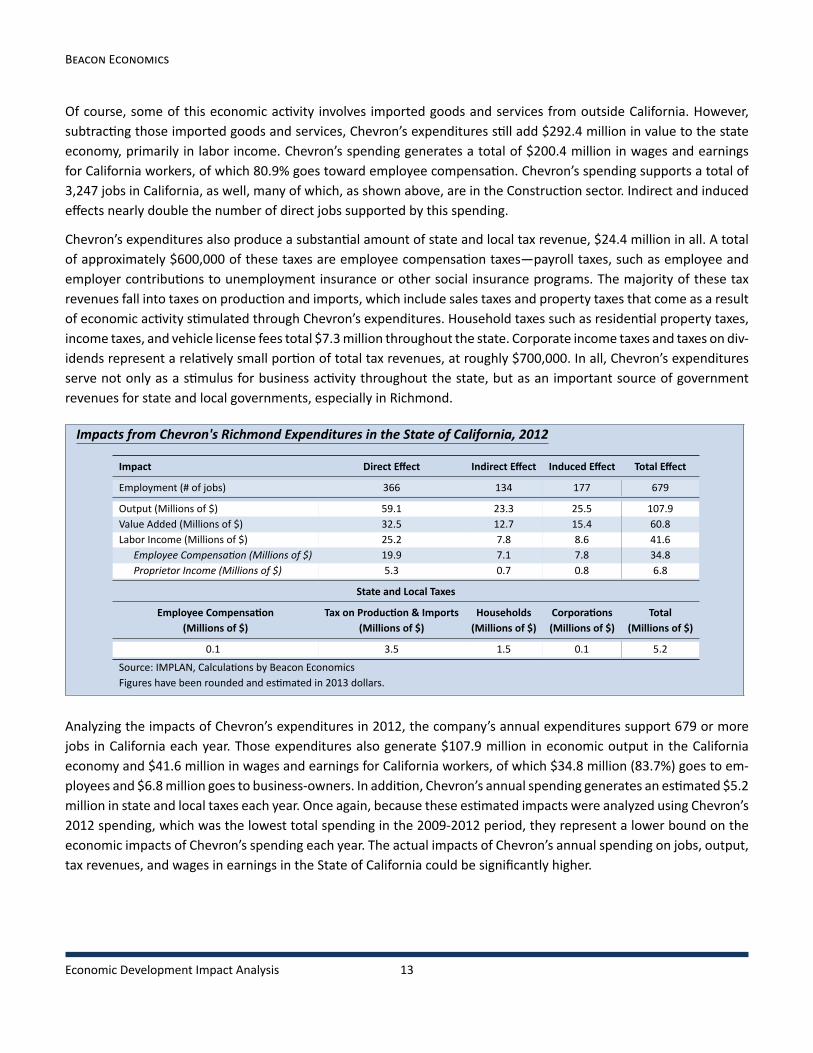
Of course, some of this economic ac vity involves imported goods and services from outside California. However,subtrac ng those imported goods and services, Chevron’s expenditures s ll add $292.4 million in value to the stateeconomy, primarily in labor income. Chevron’s spending generates a total of $200.4 million in wages and earningsfor California workers, of which 80.9% goes toward employee compensa on. Chevron’s spending supports a total of3,247 jobs in California, as well, many of which, as shown above, are in the Construc on sector. Indirect and inducedeffects nearly double the number of direct jobs supported by this spending.
Chevron’s expenditures also produce a substan al amount of state and local tax revenue, $24.4 million in all. A totalof approximately $600,000 of these taxes are employee compensa on taxes—payroll taxes, such as employee andemployer contribu ons to unemployment insurance or other social insurance programs. The majority of these taxrevenues fall into taxes on produc on and imports, which include sales taxes and property taxes that come as a resultof economic ac vity s mulated through Chevron’s expenditures. Household taxes such as residen al property taxes,income taxes, and vehicle license fees total $7.3million throughout the state. Corporate income taxes and taxes on div-idends represent a rela vely small por on of total tax revenues, at roughly $700,000. In all, Chevron’s expendituresserve not only as a s mulus for business ac vity throughout the state, but as an important source of governmentrevenues for state and local governments, especially in Richmond.
Impacts from Chevron's Richmond Expenditures in the State of California, 2012
Impact Direct Effect Indirect Effect Induced Effect Total Effect
Employment (# of jobs) 366 134 177 679
Output (Millions of $) 59.1 23.3 25.5 107.9Value Added (Millions of $) 32.5 12.7 15.4 60.8Labor Income (Millions of $) 25.2 7.8 8.6 41.6
Employee Compensa on (Millions of $) 19.9 7.1 7.8 34.8Proprietor Income (Millions of $) 5.3 0.7 0.8 6.8
State and Local Taxes
Employee Compensa on Tax on Produc on & Imports Households Corpora ons Total(Millions of $) (Millions of $) (Millions of $) (Millions of $) (Millions of $)
0.1 3.5 1.5 0.1 5.2
Source: IMPLAN, Calcula ons by Beacon EconomicsFigures have been rounded and es mated in 2013 dollars.
Analyzing the impacts of Chevron’s expenditures in 2012, the company’s annual expenditures support 679 or morejobs in California each year. Those expenditures also generate $107.9 million in economic output in the Californiaeconomy and $41.6 million in wages and earnings for California workers, of which $34.8 million (83.7%) goes to em-ployees and $6.8million goes to business-owners. In addi on, Chevron’s annual spending generates an es mated $5.2million in state and local taxes each year. Once again, because these es mated impacts were analyzed using Chevron’s2012 spending, which was the lowest total spending in the 2009-2012 period, they represent a lower bound on theeconomic impacts of Chevron’s spending each year. The actual impacts of Chevron’s annual spending on jobs, output,tax revenues, and wages in earnings in the State of California could be significantly higher.
Economic Development Impact Analysis 13

B E
Impact from Charitable Contributions
Impacts from Chevron's Charitable Contribu ons in the State of California, 2012
Impact Direct Effect Indirect Effect Induced Effect Total Effect
Employment (# of jobs) 62 12 20 93
Output (Millions of $) 5.1 2.2 3.6 10.9Value Added (Millions of $) 3.0 1.6 2.5 7.1Labor Income (Millions of $) 3.3 1.0 1.4 5.7
Employee Compensa on (Millions of $) 3.1 0.9 1.2 5.3Proprietor Income (Millions of $) 0.1 0.1 0.2 0.4
State and Local Taxes
Employee Compensa on Tax on Produc on & Imports Households Corpora ons Total(Thousands of $) (Thousands of $) (Thousands of $) (Thousands of $) (Thousands of $)
18.3 264.4 205.5 1.1 489.3
Source: IMPLAN, Calcula ons by Beacon EconomicsFigures have been rounded.
Outside of the 81 jobs supported by Chevron and its employees’ charitable contribu ons inWest Contra Costa County,those contribu ons support an addi onal 12 jobs in other areas of the state, or 93 total. The $5.1 million in direct out-put generated by those contribu ons more than doubles through indirect and induced effects, for a total effect of$10.9 million. The contribu ons support more economic ac vity throughout the California economy than is gener-ated directly through Chevron and its employees’ own contribu ons.
Once again, the increase in labor income for workers down the supply chain plays a large role. Induced output—thatoutput which comes from an increase in spending in the California economy as a byproduct of an increase in wagesand earnings—exceeds indirect output, which is the increase in spending by organiza ons and schools that receivedcharitable contribu ons from Chevron and its employees in 2012.
Although these contribu ons went to tax exempt ins tu ons, the economic ac vity they generated s ll yields a sub-stan al amount of tax revenue for the State of California and local governments. Once again, the largest share of totalrevenues came from taxes on produc on and imports, such as sales taxes, at $264,000, while household taxes, suchas personal income taxes, totaled roughly $206,000. Altogether, the over $489,000 in state and local taxes Chevronand its employees’ contribu ons generated is a substan al, if unexpected, boost to the state budget and municipalbudgets in California.
Economic Development Impact Analysis 14

B E
Conclusion
Summary of Impacts from Chevron's Expenditures, 2009 - May 2013
Employment Labor Income Value Added Output State & Local Taxes(# of Jobs) (Millions of $) (Millions of $) (Millions of $) (Millions of $)
Direct Effect 1,739 120.8 155.6 288.0 N/A
Richmond Total Effect 2,218 147.2 203.0 372.3 16.3West Contra Costa County Total Effect 2,420 157.4 220.1 399.1 18.3State of California Total Effect 3,247 200.4 292.4 525.7 25.2
Source: IMPLAN, Calcula ons by Beacon EconomicsFigures have been rounded.
Summary of Impacts from Chevron's Charitable Contribu ons, 2012
Employment Labor Income Value Added Output State & Local Taxes(# of Jobs) (Millions of $) (Millions of $) (Millions of $) (Thousands of $)
Direct Effect 62 3.3 3.0 5.1 N/A
Richmond Total Effect 75 3.9 4.1 7.0 289.3West Contra Costa County Total Effect 81 4.1 4.6 7.7 341.8State of California Total Effect 93 5.7 7.1 10.9 489.3
Source: IMPLAN, Calcula ons by Beacon EconomicsFigures have been rounded.
Chevron’s ongoing opera ons in Richmond generate a significant impact on the city, as Chevron employs over 3,900workers in refinery and non-refinery jobs, but Chevron also generates a substan al impact in Richmond through itslocal spending. Chevron’s spending supports over 1,700 workers directly at businesses throughout the city, and thatspending supports close to 500 more workers in Richmond through its indirect and induced effects. This spendingtranslates into 465 or more jobs each year for the City of Richmond. It generates over $372 million in demand in theRichmond economy, or over $76.5 million in demand annually, and generates over $147million in wages and earningsfor Richmond workers, a large majority of which goes to employees rather than business-owners. These impacts spilloutside of the City of Richmond, as well. Over 200 jobs in West Contra Costa County outside of Richmond and over800 more jobs are supported in the rest of California through Chevron’s spending. In all, this spending generates over$525 million in economic ac vity in California—or over $107 million each year—as well as over $200 million in wagesand earnings for California workers, or over $41 million each year.
Chevron and its employees’ charitable contribu ons not only support organiza ons such as the West Contra CostaSparkPoint Center or the La na Center, which provide crucial skills and resources to local residents, but they also pro-vide a significant economic impact in Richmond, West Contra Costa County, and other parts of the state. In all, $5.1million in charitable contribu ons in 2012 support 93 jobs in California, including 75 jobs in Richmond. Those contri-bu ons generate $10.9 million in economic ac vity in the state, and $5.7 million in wages and earnings for Californiaworkers, as well as provide nearly $500,000 in tax revenues for the state and local governments in California. Throughits expenditures and the charitable contribu ons the company and its employees provide to Richmond organiza ons,Chevron serves not only as an important contributor to economic ac vity to the City of Richmond but to the en reState of California.
Economic Development Impact Analysis 15

B E
Appendix
Methodology
Chevron provided Beacon Economics with informa on on its expenditures from 2009 to May 2013 in Richmond, Cali-fornia, and its charitable contribu ons in Richmond in 2012. The expenditures, which cover a broad array of productsand services, total $288 million, while 2012 charitable contribu ons totaled approximately $5.1 million. On an annualbasis, Chevron’s local expenditures totaled almost $60 million which support jobs and output at Chevron itself as wellas at local vendors and suppliers throughout Richmond and the West Contra Costa County region.
Using the amounts Chevron invested in Richmond or provided to local non-profit organiza ons from 2009 to 2013,Beacon Economics es mated the economic impact of the proposed investments in three areas: Richmond, West Con-tra Costa County, and the state overall. This includes an analysis of the employment, output, value added, wage andearnings, and tax effects of the expenditures and contribu ons for each area. To do this, Beacon Economics employedthe IMPLANmodeling system. The IMPLAN system is an input/outputmodel that can be used to es mate the short-runimpact of changes in the economy through the use of mul pliers.
The IMPLAN modeling system combines the U.S. Bureau of Economic Analysis' Input-Output Benchmarks with otherdata to construct quan ta vemodels of trade flow rela onships between businesses, and between businesses and fi-nal consumers. From this data, we can examine the effects of a change in one or several economic ac vi es to predictits effect on a specific state, regional, or local economy (impact analysis). The IMPLAN input-output accounts cap-ture all monetary market transac ons for consump on in a given me period. The IMPLAN input-output accounts arebased on industry survey data collected periodically by the U.S. Bureau of Economic Analysis and follow a balancedaccount format recommended by the United Na ons.
IMPLAN's Regional Economic Accounts and the Social Accoun ng Matrices will be used to construct region-level mul-pliers that describe the response of the relevant regional economy to a change in demand or produc on as a result of
the ac vi es and expenditures of Chevron. Each industry that produces goods or services generates demand for othergoods and services, and this demand is mul plied through a par cular economy un l it dissipates through "leakage"to economies outside the specified area. IMPLANmodels discern and calculate leakage from local, regional, and stateeconomic areas based on workforce configura on, the inputs required by specific types of businesses, and the avail-ability of both inputs in the economic area. Consequently, economic impacts that accrue to other regions or states asa consequence of a change in demand are not counted as impacts within the economic area.
The model accounts for subs tu on and displacement effects by defla ng industry-specific mul pliers to levels wellbelow those recommended by the U.S. Bureau of Economic Analysis. In addi on, mul pliers are applied only to per-sonal disposable income to obtain a more realis c es mate of the mul plier effects from increased demand. Impor-tantly, IMPLAN's Regional Economic Accounts exclude imports to an economic area so the calcula on of economicimpacts iden fies only those impacts specific to the economic impact area, in this case as determined and definedby Chevron. IMPLAN calculates this dis nc on by applying the area's economic characteris cs described in terms ofactual trade flows within the area.
Impact studies operate under the basic assump on that any increase in spending has three effects: First, there isa direct effect on that industry itself. For example, the construc on, repair, refurbishment, and expansion of facili-
Economic Development Impact Analysis 16

B E
es in Richmond will require Chevron to commit its own labor and resources to the construc on projects. Second,there is a chain of indirect effects on all the industries whose outputs are used by the industry under observa on. Fora construc on project, indirect effects would include the demand and employment that is s mulated at firms thatprovide goods and services to this project, such as architectural/engineering services or suppliers of raw building ma-terials. Third, there are induced effects that arise when employment increases and household spending pa erns areexpanded. These induced effects arise because both Chevron and its suppliers will pay out wages to their employeesassociated with the construc on projects, and those wages will then be spent back into the local economy on house-hold items such as food, gas, cars, and housing. Ongoing opera ons follow a similar line of reasoning. Opera ons ofthe Chevron facili es in Richmond require labor inputs as well as goods and services from a variety of local providers.These generate addi onal demand/output and associated wages that will then be spent back into the local economygenera ng addi onal secondary effects.
It is clear that there are several aspects of the overall economic impact. First, there is an effect on value added—thetake-home pay of all the people affected will be supplemented by that amount. The secondary and ter ary effectsof the industry on the rest of the local economy are not very large. Second, the employment effect, with some jobscreated in the industry itself (either at Chevron or at its associated vendors), and the others spread throughout theCalifornia economy. Third, the output effect, where the difference between value added and output is that the formerconcentrates on individuals’ paychecks, whereas the la er includes the costs of intermediate inputs. Na onal incomeaccoun ng avoids double coun ng by excluding the costs of intermediate inputs.
It is also important to note that capital investments made on different types of investment can lead to different mul-pliers. Similarly, investments made within the same sector in different regions can generate different economic im-
pacts.Why domul plier effects differ across sectors? A sector can have a largemul plier if it induces economic ac vityin industries whose employees have a high propensity to spend from take-home pay. Also, if the sector does not im-port many materials from abroad or from out of state, then its mul plier effect on the local economy will be high. Inessence, some of the spending in the local economy may “leak out” into other states and countries.
This is why mul pliers even for the same industry can fluctuate from region to region, depending on the local avail-ability of inputs to that produc on process. If these inputs need to be more heavily imported into one region thananother region due to the structure of those regions’ economies, then a similar investment into this sector wouldgenerate smaller overall economic impacts, as a larger por on of these investments into the local sector will resultin a greater degree of economic ac vity leaking outside of the region. For instance, spending in manufacturing inWest Contra Costa County will likely generate a larger total impact than spending in manufacturing in Alpine County,as West Contra Costa County already has a larger base of businesses in which to provide the raw materials that gointo the manufacturing process than Alpine County given that the economy of Alpine County is primarily focused onagriculture. The same is true if a California business buys inputs from firms in different states.
In sum, our analysis using input-output accounts is based on three important assump ons. First, there are constantreturns to scale. This means that a 10% cut in spending will be ten mes as severe—across every sector in the econ-omy—as a one percent cut. Second, there are no supply constraints. This means that any marginal increase in outputcan be produced without having to worry about bo lenecks in labor markets, commodity markets, or necessary im-ports. This assump on is quite realis c in a free-market economy like California’s where there is some unemployment.It is even more realis c in mes of high unemployment, such as the current state of the labor market where there iss ll a significant por on of under- or un-u lized resources across the state. Third, the flow of commodi es between
Economic Development Impact Analysis 17

B E
industries is fixed. This means that it is not possible to subs tute in the short-run the many different inputs that gointo the target industry.
Thus, our analysis covers the primary areas of economic impact that will accrue due to expenditures and charitablecontribu ons by Chevron. First, the direct employment, output, and value added effects for each of our three areasa er accoun ng for "leakage" out of each area. Second, we es mate the indirect effects on all the industries whoseoutputs are used by the proposed investments as well as the induced effects arising when employment increases andhousehold spending pa erns are expanded.
Economic Development Impact Analysis 18
B E About Beacon Economics
About Beacon EconomicsBeacon Economics, LLC is a leading provider of economic research, forecas ng, industry analysis, and data services.By delivering independent, rigorous analysis we give our clients the knowledge they need to make the right strategicdecisions about investment, growth, revenue, and policy. Learn more at www.BeaconEcon.com.
Services ContactsEconomic, Revenue, & Occupa onalForecas ng
Economic Impact Analysis
Regional Economic Analysis
Economic Policy Analysis
Real Estate Market Analysis
Industry and Market Analysis
EB-5 Economic Analysis
Public Speaking
Expert Tes mony
Sherif HannaManaging Partner(424) [email protected]
Victoria Pike BondDirector of Communica ons(415) [email protected]
Economic Development Impact Analysis 19