002 tp econ methodology 06-10-06
TRANSCRIPT

REVISION 2
EPRI Guideline
Economic Assessment Methodology for Tidal In-Stream Power Plants
Project: EPRI North American Tidal Flow Power Feasibility Demonstration Project Phase: 1 – Project Definition Study Report: EPRI - TP- 002 NA, Revision 2 Authors: Roger Bedard and Omar Siddiqui Coauthor: Mirko Previsic and Brian Polagye Date: June 10, 2006

EPRI Economic Assessment Methodology for Tidal In-Stream Power Plants
_________________________________________________________________________ 2
DISCLAIMER OF WARRANTIES AND LIMITATION OF LIABILITIES This document was prepared by the organizations named below as an account of work sponsored or cosponsored by the Electric Power Research Institute Inc. (EPRI). Neither EPRI, any member of EPRI, any cosponsor, the organization (s) below, nor any person acting on behalf of any of them: (A) Makes any warranty or representation whatsoever, express or implied, (I) with respect to the use of any information, apparatus, method, process or similar item disclosed in this document, including merchantability and fitness for a particular purpose, or (II) that such use does not infringe on or interfere with privately owned rights, including any parties intellectual property, or (III) that this document is suitable to any particular user’s circumstance; or (B) Assumes responsibility for any damages or other liability whatsoever (including any consequential damages, even if EPRI or any EPRI representative has been advised of the possibility of such damages) resulting for your selection or use of this document or any other information, apparatus, method, process or similar item disclosed in this document. Organization(s) that prepared this document Electric Power Research Institute Global Energy Partners, LLC Mirko Previsic Consulting Brain Polagye Consulting1
1 PhD Student, Mechanical Engineering, University of Washington

EPRI Economic Assessment Methodology for Tidal In-Stream Power Plants
_________________________________________________________________________ 3
Table of Contents
1. Introduction ..........................................................................................................................4 2. Regulated Utility Generator (UG) and Municipal Generator (MG) Cost of Electricity Assessment Methodology and Assumptions............................................................................6
2.1. Cost Components ..........................................................................................................8 2.2. Income Taxation..........................................................................................................10 2.3. Incentives ....................................................................................................................12 2.4. Levelizing Costs ..........................................................................................................18 2.5. Constant Dollar vs. Current Dollar Energy Costs .......................................................19 2.6. Financing Assumptions ...............................................................................................19
3. Non Utility Generator (NUG) Cost of Electricity Assessment Methodology and............21 3.1. Development of an Economic Pro Forma for a NUG .................................................21 3.2. Income Statement ........................................................................................................22 3.3. Revenues .....................................................................................................................23 3.4. Cash Flow Statement...................................................................................................25 3.5. Economic Indicators....................................................................................................27
4. General Considerations ......................................................................................................29 4.1. Cost Accuracy .............................................................................................................29
5. Economic Comparisons.....................................................................................................28 5.1. Background .................................................................................................................28 5.2. Key Assumptions ........................................................................................................32 5.3. Form of Expected Results ...........................................................................................33
References
Appendices
Utility Generator (UG) Cost of Electricity (COE) Worksheet
Municipal Generator (MG) Cost of Electricity Worksheet
Non Utility Generator (NUG) Internal Rate of Return (IRR) Worksheet

EPRI Economic Assessment Methodology for Tidal In-Stream Power Plants
_________________________________________________________________________ 4
1. Introduction To evaluate the economics of tidal in-stream power plants, the Electric Power Research Institute (EPRI) proposes three standard economic assessment methodologies: one for a utility generator (UG), one for a municipal generator (MG), and one for a non-utility generator (NUG). The EPRI Project Team will use these methodologies, and their associated financial assumptions, to evaluate the economics of both a pilot demonstration plant (with a yearly energy produced of the order of 3,000 Mega Watt Hours Electric per Year (MWeh/yr) and a notional commercial scale size plant (sized to extract 15% of the total in stream kinetic energy available at the feasibility study sites). Taxable regulated utilities (independently owned utilities) are permitted to set electricity rates (i.e., collect revenue) that will cover operating costs and provide an opportunity to earn a reasonable rate of return on the property devoted to the business. This return must enable the UG to maintain its financial credit as well as to attract whatever capital may be required in the future for replacement, expansion and technological innovation and must be comparable to that earned by other businesses with corresponding risk. Non taxable municipal utilities also set electricity rates that will cover operating costs, however, utility projects are financed by issuing tax-exempt bonds, enabling local governments to access some of the lowest interest rates available Because the risks associated with private ownership are generally considered to be greater than utility ownership, the return on equity must be potentially higher in order to justify the investment. However, it is important to understand that there is no single right method to model an independently owned and operated NUG renewable power plant. Considerations such as an organization’s access to capital, project risks, and power purchase and contract terms determine project risks and therefore the cost of money.
This regulated UG and MG methodologies are based on a levelized cost approach using real (or constant) dollars with 2005 as the reference year and a 30-year book life. The purpose of this standard methodology is to provide a consistent, verifiable and replicable basis for computing the cost of electricity (COE) of a tidal energy generation project (i.e., a project to engineer, permit, procure, construct, operate and maintain a tidal energy power plant).
The MG methodology includes a special incentive for U.S. municipalities afforded under the Renewable Energy Production Incentive (REPI). This incentive was originally authorized under section 1212 of the Energy Policy Act of 1992, and updated by the Energy Policy Act of 2005, to promote increases in the generation and utilization of electricity from renewable energy sources and to further the advances of renewable energy technologies. REPI provides financial incentive payments for electricity produced and sold by new qualifying renewable energy generation facilities. Eligible electric production facilities are those owned by State and local government entities (such as municipal utilities) and not-for-profit electric cooperatives.

EPRI Economic Assessment Methodology for Tidal In-Stream Power Plants
_________________________________________________________________________ 5
The Energy Policy Act of 2005 (P.L. 109-58) provides electric cooperatives and public power systems with the ability to issue “Clean Renewable Energy Bonds” (“CREBs”). The CREBs program is further described in Internal Revenue Service (IRS) Notice 2005-98.
The NUG methodology is based on a cash flow analysis and projections of market electricity prices. This allows a NUG to estimate how quickly an initial investment is recovered and how returns change over time.
A small-scale pilot plant with little cumulative production experience cannot be expected to be economically competitive with large-scale commercial technologies with high cumulative production experience. Therefore, decisions on the economic viability of tidal power technology must be made on the basis of large-scale commercial plant economics. A cost estimate of the initial capital cost and the yearly operation and maintenance cost for a future envisioned future commercial plant at a specific site is the initial input into an economic feasibility assessment. The purpose of the commercial scale plant cost of electricity evaluation is to assess the economic viability of a large-scale commercial application of the tidal energy technology and to allow a comparison against other large-scale commercial renewable generation options.
The results of this economic evaluation will help government policy makers determine the public benefit of investing public funds into building the experience base of tidal energy to transform the market to the point where private investment will take over and sustain the market. Such technology support is typically done through funding R&D and through incentives for the deployment of targeted renewable technologies.
If the economics of the notional commercial scale tidal in-stream power plant is favorable with respect to alternative renewable generation options, a case can be made for pursuing the development of tidal flow energy conversion technology. If, however, even with the most optimistic assumptions, the economics of a commercial size tidal flow power plant is not favorable and cannot economically compete with the alternatives, a case can be made for not pursuing tidal flow energy conversion technology development.
Relative to the pilot demonstration plant, the decision of whether to fund the Phase II Detailed Design, Permitting and Construction Financing Task will be made at the conclusion of the Phase 1 Feasibility Study in the spring of 2006. A key factor in those decisions is the cost to design, build and test the pilot plant. The initial capital cost required to build the pilot plant will be estimated as part of this work. Of particular importance is our emphasis on identifying unique opportunities that will enable a pilot plant to be built at an affordable cost.
EPRI Economic Assessment Methodology for Tidal In-Stream Power Plants
_________________________________________________________________________ 6
2. Regulated Utility Generator (UG) and Municipal Generator (MG) Cost of Electricity Assessment Methodology and Assumptions The proposed UG and MG methodology is based on generally accepted regulated utility accounting practices. The COE is computed by levelizing a power plant’s annual revenue requirements over the service life of the plant and dividing it by the plant’s annual output. This makes it possible to compare alternative designs or technologies in terms of a single index – the levelized COE. It is important to understand that the underlying assumptions must be the same for the different technologies being compared fairly The methodology is implemented in an excel-spreadsheet solution which allows the analyst to input tidal power plant component costs, power production, and financing assumptions in order to calculate the COE. The following paragraphs provide a short outline of the steps and associated formulations used to calculate the COE: • Determine Annual Revenue Requirements
Annual revenue requirements are equal to the cost that the project incurs each year. We assume that the project will be financed with a debt/equity finance structure. Annual costs are determined by the following components: Debt Principal, Debt Interest, Return on Equity, State Taxes, Federal Taxes, State Tax Incentives, Federal Tax Incentives, Accelerated Depreciation, Property Taxes and Insurance. Over the life of the project, these revenue requirements change and need to be brought back to Net Present Value (NPV) in order to properly levelize the annual cost. In a regulated UG and MG framework, the annual cost to operate the power plant is defined as its “annual revenue requirement”, i.e., the equivalent in revenue that would make the project break-even. In a regulated market, the UG and MG can adjust its rates to provide cost recovery for its assets with a stipulated return.
• Levelizing Annual Revenue Requirements Annual incurred costs are levelized by summating the NPVs for each year. The NPV is calculated using a discount rate that is determined by the cost of money. In this case, it is the capital finance structure (i.e. mix of equity and debt) that is used to calculate the pre-tax discount rate applicable to this project. Using this pre-tax discount rate and the applicable composite tax rate (i.e., a single value for the combined state and federal tax), the after tax discount rate can be determined and is used to calculate the NPV.
• Calculating the Fixed Charge Rate
The fixed charge rate is the percentage of the total plant cost that is required over the project life per year to cover the minimal annual revenue requirements. This fixed charge

EPRI Economic Assessment Methodology for Tidal In-Stream Power Plants
_________________________________________________________________________ 7
rate concept can be compared to a fixed rate home mortgage where a fixed annual payment will pay off the principal and interest over a period of time. It is calculated in three steps:
1) Calculate Capital Recovery Factor (CRF) as follows:
CRF = Discount Rate _______ + Discount Rate (Equation 1) (1 + Discount Rate)Book Life - 1
Please note from the formula above that the capital recovery factor is a direct function of the Discount Rate (yearly cost of money) and the Book Life (Project Duration in number of years).
2) Calculate the levelized annual charges by simply multiplying the capital recovery
factor by the net present value. 3) Calculate the Levelized Annual Fixed Charge Rate by dividing the levelized annual
charges by the Total Plant Investment (Booked Cost).
• Calculating the Cost of Electricity The levelized cost of electricity is calculated by dividing the annual cost of the power plant by the Annual Energy Production. Because O&M and Levelized Overhaul and Replacement Costs were not previously considered, they are found in the formula below. The formula for computing the levelized cost of electricity (COE) is:
AEP
RLOMOTPIxFCRCOE )&()&()( ++= (Equation 2)
where: TPI = Total Plant Investment FCR = Fixed Charge Rate (percent) O&M = Annual Operating and Maintenance Cost LO&R = Periodic Levelized Overhaul and Replacement Cost AEP = Annual Energy Production at Busbar The annual energy production (AEP) calculation methodology is described in a separate specification (Reference 3). Since long-term tidal measurement data is averaged in order to come up with appropriate power generation values, the annual energy output is assumed to be constant over the life of the project.
The following sections discuss the core issues associated with this proposed methodology:
• Cost Components of a tidal power plant (section 2.1) • Taxation and Tax Incentives offered for renewable power plants (section 2.2) • Cost Levelizing Procedures (section 2.3)

EPRI Economic Assessment Methodology for Tidal In-Stream Power Plants
_________________________________________________________________________ 8
• Real and Nominal Energy Costs (section 2.4) • Financing Assumptions (section 2.5)
2.1. Cost Components
The elements of the cost breakdown for a typical tidal flow power plant are described in this section. All capital expenditures are defined as installed cost and expressed in constant dollars with 2005 as the reference year. They include shipping and commissioning cost. The first level cost breakdown structure outlined below allows comparing different generation alternatives and identifying sensibilities of a particular tidal power conversion design.
• Turbine: All components that are directly responsible for the extraction of energy from tidal flow energy, such as the rotor and its associated controls if any, and the main shaft
• Extractor Structure: All structural components such as housings ducts and any other structural components required
• Power Take Off: Converts the slow movement of the extraction turbine or similar device via gearing or hydraulics an generator into electricity at grid frequency (50Hz or 60Hz) and transmission voltage (the conversion may be done on shore)
• Foundation/Mooring/Anchoring: All components required for holding the tidal flow power conversion device in place.
• Electrical Interconnection: All cables required to interconnect the individual tidal flow power conversion units to a common interconnection point in/close to the tidal channel.
• Grid Interconnection: All cabling, switchgear, transmission lines and infrastructure required to connect from the common interconnection point of the tidal flow farm to a nearby land-based grid interconnection point.
• Substation to Substation Upgrade Cost: The initial capital cost for any required distribution/transmission substation to substation cost will be included in the cost estimate, however, since that cost is credited back with interest within the first 5 years of operation to the Interconnection Customer (Tidal Flow Power Plant in this case), for simplicity, that cost will not be factored into the cost of electricity or internal rate of return calculations.
• Communication, Command and Control: All equipment and infrastructure required to establish a two way link from land-based to tidal channel-based systems for purposes of communication, command and control.
EPRI Economic Assessment Methodology for Tidal In-Stream Power Plants
_________________________________________________________________________ 9
• Installation Cost: The costs required to transport the system from its safe harbor assembly location to its deployment site and complete all interconnections and checkout to the point where the system is ready to begin official commissioning procedures.
• Owner’s Development Cost = assume 5% of the costs through installation above
• Spares Provisioning: 2% of the hardware cost above
• General Facilities and Engineering: Engineering cost associated with the planning of a tidal flow farm and general facilities required for deploying and operating the power plant. This could include necessary dock modifications, maintenance shops, etc. for the deployment and maintenance of the tidal flow farm as well as mobilization of the O&M itself.
• Financial Fees: 2% of the 1st year of debt with the cost occurring in the 2nd year of the two year construction period.
• Commissioning: The process, inspection and testing required to turn over the system from the general contactor to the owner/operator.
• Total Plant Cost (TPC): This is the total installed and commissioned cost of the power plant and consists of the abovementioned cost elements.
• Interest during Construction: Interest paid for the two-year construction loan (assumes two loans, one at the beginning of each year)
• Total Plant Investment (TPI): Total Plant Investment is the amount of capital required to build the power plant. TPI = TPC + Interest during Construction (called allowance for funds used during construction (AFUDC) in the regulated world).
• Annual Scheduled O&M Cost: The components of O&M costs are insurance, labor and parts. Labor includes equipment such as barges, dive boats, etc. to carry out O&M operations. Parts are simply replacement items. The O&M costs do NOT include the infrequently incurred costs of major overhauls of tidal flow power conversion devices or other components. These costs are included in the levelized replacement cost (LRC). Expenses are annual payments associated with plant operations and maintenance (O&M), and include recurring O&M and non-recurring O&M (which is estimated for the economic analysis based on related infrastructure projects from the offshore industry). The majority of the O&M costs associated with the tidal flow power conversion devices can be grouped into three categories:
o Unscheduled maintenance to carry out repairs, typically occurring after a
violent storm o Scheduled preventive maintenance for the tidal flow power conversion turbine
and the power take off system

EPRI Economic Assessment Methodology for Tidal In-Stream Power Plants
_________________________________________________________________________ 10
o Scheduled major overhauls and subsystem replacements of the device
• Annual Unscheduled O&M Cost: A provision for unscheduled maintenance is estimated at x% of the annual scheduled O&M cost.
• Annual Insurance Cost: 1.5% of TPC
• Periodic Levelized Overhaul and Replacement Cost (LO&RC): Depending on the specific manufacturer’s design, major overhaul of the device and mooring system is scheduled to occur every 5, 10 or 15 years. These major overhauls may address gears, bearings, seals and other moving parts as well as the mooring cable and components. Because these costs are incurred at intervals of several years and not routinely during each year, correct accounting for their costs requires an annual accrual of funds. The objective of this accrual is to have the funds available when the need for overhaul or replacement occurs. The accrual involves a net present value calculation to level or apportion the overhaul and replacement costs to an annualized basis consistent with the other cost elements. Because they are treated as investments, they are eligible for investment tax credits.
2.2. Income Taxation
For this project, we assume a US federal rate of 35% and a state rate as shown in Table 1. The calculation of composite tax rate (i.e., federal and state) reflects the fact that state income taxes are deductible from federal taxes. Table 1: US State and Composite Income Tax Rates State State
Tax Rate Composite Rate
Assuming 35% Federal Rate [a] Alaska 9.40 % [b] 41.1 % California 8.84 % [c] 40.7 % Maine 8.93 % [d] 40.8 % Massachusetts 9.50 % [c] 41.2 % Washington 0.00 % [e] 35.0 %
[a] Since US state income taxes are deductible for federal income taxes purposes, composite rate calculated as follows: [Fed Rate + (State Rate x (1 – Fed Rate))] ((0.35+0.094*(1-0.35))*100 = 41.1%
[b] Assumes top tier tax rate (out of ten tiers) for annual income greater than $90,000 [c] Flat corporate rate [d] Assumes top tier tax rate (out of four tiers) for annual income greater than $250,000 [e] No state income tax in the state of Washington For participating Canadian provinces, we assume a Canadian federal corporate tax rate of 22% and provincial tax rates as shown in Table 2. Table 2: Canadian Province and Composite Income Tax Rates Province Provincial Canadian Federal Combined Rate [a]

EPRI Economic Assessment Methodology for Tidal In-Stream Power Plants
_________________________________________________________________________ 11
Tax Rate Tax Rate New Brunswick 16.0% [b] 22% 38.0% Nova Scotia 16.0% [b] 22% 38.0%
[a] Since provincial corporate income taxes are not deductible for federal corporate income tax purposes (or vice-versa), combined rate is simply Provincial Rate + Federal Rate.
[b] Source: http://www.fin.gc.ca/toce/2002/cantaxadv_e.html Power plants that generate electricity from renewable energy resources qualify under IRS guidelines for an accelerated cost recovery period under the Modified Accelerated Cost Recovery (MACR) depreciation schedule as shown in Table 3(Reference 4). Table 3: Applicable Accelerated Tax Depreciation Schedule
Depreciation Rate Year U.S. Canadian
(declining balance) 1 20.00 % 30% 2 32.00 % 21% 3 19.20 % 14.7% 4 11.52 % 9.4% 5 11.52 % 6.6% 6 5.76 % 4.6% etc
The US Internal Revenue Service explicitly mentions solar, wind, and geothermal as examples of qualifying renewable resources. Since the status of tidal in-stream energy as a renewable energy resource is self-evident, it is reasonable to assume that tidal conversion plants would be eligible for the same depreciation treatment, as well as investment and production tax credits as described in the next section. Tax-filing entities such as corporations are allowed to employ different tax depreciation assumptions for financial accounting (i.e. book) versus tax accounting purposes – so long as all assumptions conform to Generally Accepted Accounting Principles (GAAP). Accordingly, entities tend to apply more conservative depreciation assumptions (such as straight line depreciation) for financial accounting purposes to accentuate earnings, whereas they apply more accelerated depreciation assumptions for tax accounting to defray taxable income. This difference between the effective book and tax depreciation rates results in an annual variance between income taxes actually paid and those that would have been paid under book depreciation assumptions over the book life of the plant. The difference is referred to as deferred income tax. A utility is not allowed to earn a rate of return on deferred taxes. A renewable energy project will show negative taxes in the first couple of years of operation (mainly because of accelerated depreciation). If a renewable energy project were treated as individual entity, the negative values would need to be carried forward to future years (because there are no other tax obligations against which such deductions could be made in the present year). If a renewable energy project is a part of a utility’s generation assets, it is likely that tax deductions will have a significant net impact on the bottom-line of a utility or IPP in the early
EPRI Economic Assessment Methodology for Tidal In-Stream Power Plants
_________________________________________________________________________ 12
years of operation. For the purpose of this project, such tax incentives are treated as direct benefits to the project in the year they occur. Canadian tax law allows for accelerated depreciation on “electrical generating equipment using wind, solar of geothermal energy” under Capital Cost Allowance (CCA) class 43.1. Since the spirit of the law is to encourage the development of renewable energy resources, we can reasonably assume that tidal in-stream energy would qualify for the same accelerated depreciation treatment. This would allow an accelerated depreciation schedule of 30% declining balance, compared to the baseline depreciation rate of 4% declining balance for this category of equipment.2 This is referenced in Table 3 above. Natural Resources Canada provides, at no charge, prior opinions on the technical eligibility of proposed projects for this accelerated depreciation treatment. In addition, the government of Canada has defined Canadian Renewable and Conservation Expenses (CRCE), a category of fully deductible expenditures associated with the start-up of renewable energy and energy conservation projects for which at least 50% of the capital costs of the property would be described in Class 43.1. Under CRCE, eligible expenditures are 100% deductible in the year they are incurred or can be carried forward indefinitely for deduction in later years. Examples of intangible expenses that may be written off in this manner include:
• cost of pre-feasibility and feasibility studies of suitable sites and potential markets • for projects that will have equipment included in Class 43.1 • costs related to determining the extent, location and quality of energy resources • negotiation and site approval costs • certain site preparation costs that are not directly related to the installation of
equipment • service connection costs incurred to transmit power from the project to the electric
utility
2.3. Incentives U.S. and Canadian Federal and State/Provincial government organizations are providing incentives for renewable energy projects in the form of tax credits and renewable energy certificates. The three main categories that have an impact on the economic feasibility on a renewable power plant are:
• Renewable Energy Certificates (RECs) • Production tax credits • Investment tax credits
These incentives will be analyzed for the commercial scale power plant economics analysis. REC market values and investment and production tax credits for each of the states and provinces are shown in Table 4.
2 Source: Canadian Department of Finance (http://www.fin.gc.ca/taxexp/1999/taxexp99_5-2e.html)

EPRI Economic Assessment Methodology for Tidal In-Stream Power Plants
_________________________________________________________________________ 13
Table 4: Renewable Energy Certificates and Investment /Production Tax Credits (2005$)
Investment Tax Credit Production Tax Credit REC State Federal State Federal Alaska NA NA NA
California
The lesser of 7.5% or $4.50
per Watt of rated peak generating capacity [a]
Supplemental Energy Payments (SEPs) for costs above a market price referent [b]
Massachusetts $0.05/kWh for entire project
life
Installation cost deductible if installed in
Massachusetts
$0.06 per kWh for up to 3 years [c]
Maine $0.012/kW for entire project
life [h]
$50,000 grant [d]
1.7 - 6.4 cents per kWh [e]
Washington NA
10% of TPI
Sales and Use Tax Exemption [f]
1.8¢ per kWh for the first 10 years and an
EPRI asseumed escalation of 3% per year
Province Federal Province Federal
New Brunswick NA
NA
NA
Nova Scotia NA NA
35% up to the first $2 million
of qualified expenditures; 20% on any
excess amountNA
1.0 ¢ (Cdn.) per kWh for Wind for the first 10 years
[a] Corporate tax credit (SB 17x2) currently applies only to PV or wind technologies. Reference: http://www.dsireusa.org/library/includes/incentive2.cfm?Incentive_Code=CA33F&state=CA&CurrentPageID=1
[b] Subject to determination by the California Energy Commission. Tidal energy explicitly included as an eligible technology. Reference: http://www.dsireusa.org/library/includes/incentive2.cfm?Incentive_Code=CA22F&state=CA&CurrentPageID=1
[c] Mass Energy - Renewable Energy Certificate Incentive. However, PV is the only eligible technology. Reference: http://www.dsireusa.org/library/includes/incentive2.cfm?Incentive_Code=MA10F&state=MA&CurrentPageID=1 The above offer cited is a private offer and not a state program – If private offers are to be included then other products should also be included
[d] Renewable Resources Matching Fund Program provides a grant of up to $50,000 to support renewable resource R&D and community demonstration projects using renewable energy technologies. Eligible technologies include: Solar Thermal Electric, Photovoltaics, Wind, Biomass, Hydroelectric, Geothermal Electric, Fuel Cells, Municipal Solid Waste, and Tidal Energy. 100 MW max capacity limit. Reference: http://www.dsireusa.org/library/includes/incentive2.cfm?Incentive_Code=ME03F&state=ME&CurrentPageID=1
[e] Mainstay Energy Rewards Program - Green Tag Purchase Program provides 1.7 - 6.4 cents/kWh in incentives; which varies by technology, contract length, and payment plan. Intended for commercial and residential projects, not electrical generation facilities, though there is no explicit limit on system size or annual incentive amount. Eligible technologies include: Solar Thermal Electric, Photovoltaics, Wind, Biomass, Geothermal Electric, Small Hydroelectric, Renewable Fuels. Reference: http://www.dsireusa.org/library/includes/incentive2.cfm?Incentive_Code=ME02F&state=ME&CurrentPageID=1

EPRI Economic Assessment Methodology for Tidal In-Stream Power Plants
_________________________________________________________________________ 14
[f] H.B. 1859, singed into law by Governor on May 8, 2001, expanded the sales and use tax exemption for solar, wind, and landfill gas electric generating facilities to include fuel cells. Does not explicitly include tidal energy.
[g] REC range of $0.015 - $0.05/kWh applies to solar PV in the California wholesale market, and varies based on location and other site-specific attributes. (source: http://www.californiasolarcenter.org/pdfs/forum/2005.2.23-SolarForum_KChristy_SolarRECs_in_CA.pdf) The California RPS calls for renewables to account for 20% of energy by 2017; to be attained in increments of 1% each year beginning in 2003.
[h] Source: National Renewable Energy Lab and EAD Environmental http://www.eere.energy.gov/greenpower/markets/certificates.shtml?page=1
[i] Source: National Renewable Energy Lab and Bonneville Environmental Foundation http://www.eere.energy.gov/greenpower/markets/certificates.shtml?page=1
Renewable Portfolio Standard (RPS) and Renewable Energy Credits (REC)
A renewable portfolio standard (RPS) is a state-by-state requirement that a minimum percentage of each electricity generator's or supplier's resource portfolio derive from renewable energy. A RPS creates a minimum commitment to a sustainable energy future for a given state. It builds on and enhances the investment already made in sustainable energy, and it ensures that new electricity markets recognize that clean renewable electricity is worth more than polluting fossil fuel and nuclear electricity. Further, these goals can be accomplished using a market approach that provides the greatest amount of clean power for the lowest price and an ongoing incentive to drive down costs. By using tradable “renewable energy credits” (RECs) to achieve compliance at the lowest cost, the RPS would function much like the Clean Air Act credit-trading system, which permits lower-cost, market-based compliance with air pollution regulations.
Renewable Portfolio Standards (RPS) exist in nineteen states (and may soon exist at a national level) and act as a driver for a REC market. Basically, a generator of renewable non-polluting electricity can have two income streams; the first from the sale of the electricity generated and the second from the sale of renewable energy certificates which are accrued by generating electrical energy without emissions.
Massachusetts RPS - Established as part of the 1997 utility restructuring act, the Massachusetts RPS (225 CMR 14.00) was issued by the state's Division of Energy Resources (DOER). It promotes the deployment of clean energy technologies in a couple of ways. First, it requires all retail suppliers licensed in Massachusetts to buy renewable energy certificates (RECs) produced by generating facilities that meet certain criteria. Second, it creates a new revenue stream for facilities meeting RPS criteria. Facility owners can sell both electricity and RECs, either directly to consumers or to other suppliers. Each megawatt-hour (MWh) of clean energy produced is allocated one REC. These RECs are monitored and traded through the New England Generation Information System (NE-GIS). The value of RECs is currently between 4.5 and 5.0 cents/kWh.
Maine RPS - The State of Maine Public Utility Commission (PUC) adopted a Renewable Resource Portfolio Requirement rule on September 28, 1999 (effective November 4, 1999)

EPRI Economic Assessment Methodology for Tidal In-Stream Power Plants
_________________________________________________________________________ 15
pursuant to the state's 1997 electric utility restructuring law. The rule requires electric providers to supply at least 30% of their total retail electric sales in Maine with electricity from eligible renewable resources. Eligible resources must be a "small power production facility" that produces electricity using only a primary energy source of biomass, waste, renewable resources, or a combination of these resources and has a production capacity of 80 megawatts or less including any other facilities at the same site. A renewable resource may also be a generation facility of 100 MW or less that uses fuel cells, tidal power, solar arrays and installations, wind power installations, geothermal installations, hydroelectric generators, biomass generators, or generators fueled by municipal solid waste in conjunction with recycling. In addition to renewables, the portfolio standard can be met with "efficient resources," specifically, qualified cogeneration facilities. In June 2003 the PUC adopted an order (Docket No. 2002-494) amending the RPS rule to incorporate the use of NEPOOL Generation Information System certificates (renewable energy credits) to satisfy the portfolio requirement.
California RPS On September 12, 2002, Governor Gray Davis signed a bill (SB 1078) requiring California to generate 20 percent of its electricity from renewable energy no later than 2017. The 20 percent standard was the most stringent renewables portfolio standard (RPS) to date in the United States. The new law requires sellers of electricity at retail to increase their use of renewable energy by 1 percent per year. Since California already generates about 10 percent of its electricity consumption by renewables, the new law will nearly double the state's existing base of wind, geothermal, biomass and solar energy resources. An estimated 9,000 MW of renewables will be needed.
A June 2005 report for the Energy Commission contains the following update: The state's Energy Action Plan and the California Energy Commission's Integrated Energy Policy Report have since expressed a state goal of accelerating the implementation of the RPS such that the 20-percent goal is met seven years early—by 2010. The Governor has endorsed this accelerated schedule and has set a goal of achieving a 33-percent renewable energy share by 2020 for the state as a whole.
Nova Scotia RPS - The RPS for Nova Scotia calls for 5% of electricity generation from renewable resources by 2006 and 10% by 2011. The percentage is based upon actual power sold and is not based upon installed generation capacity.3 New Brunswick RPS - New Brunswick announced an RPS target of 10% additional RE by 2016 (33% in total). http://www.gnb.ca/cnb/news/ene/2005e0788en.htm Neither Alaska nor Washington have enacted a RPS.
Renewable Energy Credit (REC)
3 Source: http://naturalforces.ca/documents/WIND-energy%20submission%20Final.pdf

EPRI Economic Assessment Methodology for Tidal In-Stream Power Plants
_________________________________________________________________________ 16
The New England Interconnection System Operator (NE-ISO) has created a market for renewable energy certificates. The value of RECs is currently about 2.5 cents/kWh. This market applies to Massachusetts and Maine, but it does not apply to either New Brunswick or Nova Scotia which are outside the NE ISO territory.
Renewable Production Tax Credit (PTC)
The U.S. Federal Government provides a production tax credit (PTC) as an incentive for development of clean, renewable, domestic wind energy. Originally introduced through the Energy Policy Act of 1992, the PTC granted 1.5¢ per kilowatt-hour for the first ten years of operation to wind plants brought on line before June 30, 1999. The credit was then extended at 1.8¢ per kilowatt-hour for the first ten years of operation to wind plants brought on line before Dec 31, 2003. The PTC was again extended in late 2004 to Dec 31, 2005. We assume that the federal PTC for wind energy will be extended to ensure continued strong growth of America's renewable energy capabilities, and that tidal energy will be eligible for the PTC Canada provides a production incentive for wind power under the Wind Power Production Incentive (WPPI). The Federal Government announced a new program in the 2005 budget. It is the Renewable Power Production Incentive. There is also an expansion of WPPI and it will provide 1 cent (Cdn.) per kWh for the first ten years. For projects commissioned after March 31, 2006, this incentive would be 1 ¢ (Cdn.) per kWh for the first 10 years of production, representing in the estimate of the Canadian government about half of the estimated cost premium for wind energy in Canada for facilities with good wind sources. There is no similar explicit production incentive for tidal in-stream developments.4 Canada also provides the Scientific Research and Experimental Development (SR&ED) federal tax incentive program to encourage Canadian businesses to conduct research and development in Canada that will lead to new, improved, or technologically advanced products or processes. The SR&ED program is the largest single source of federal government support for industrial research and development. Applicants may claim SR&ED investment tax credits for expenditures such as wages, materials, machinery, equipment, some overhead, and SR&ED contracts. Generally, a Canadian-controlled private corporation can earn an investment tax credit of 35% up to the first $2 million of qualified expenditures for SR&ED carried out in Canada, and 20% on any excess amount. Other Canadian corporations, proprietorships, partnerships, and trusts can earn an investment tax credit of 20% of qualified expenditures for SR&ED carried out in Canada.5 To qualify for the SR&ED program, the project must advance the understanding of scientific relations or technologies, address scientific or technological uncertainty, and incorporate a
4 Source: Canada Ministry of Natural Resources (http://www.canren.gc.ca/programs/index.asp?CaId=107&PgId=622), http://www.fin.gc.ca/budget05/bp/bpc5e.htm#climate 5 Source: Canada Revenue agency (http://www.cra-arc.gc.ca/taxcredit/sred/aboutus-e.html)

EPRI Economic Assessment Methodology for Tidal In-Stream Power Plants
_________________________________________________________________________ 17
systematic investigation by qualified personnel. Work that qualifies for SR&ED tax credits includes:
• experimental development to achieve technological advancement to create new materials, devices, products, or processes, or improve existing ones
• applied research to advance scientific knowledge with a specific practical application in view
• basic research to advance scientific knowledge without a specific practical application in view
• support work in engineering, design, operations research, mathematical analysis, computer programming, data collection, testing, or psychological research, but only if the work is commensurate with, and directly supports, the eligible experimental development, or applied or basic research
It is reasonable to assume that a pilot-scale tidal in-stream development project would be eligible for the SR&ED tax incentive, and plausible that even the first commercial scale plant could be similarly eligible. However, a formal prior opinion from the Canada Revenue Agency would be advisable. Renewable Energy Production Incentive (REPI) for MGs
MG’s are eligible for a production incentive of 1.5 cents per kWh (based on 1993 dollars indexed to inflation) for the first ten years of operation for qualifying facilities installed between October 1, 2005 and October 1, 2016.
Qualifying facilities installed between October 1, 2005 and October 1, 2016 are eligible for annual incentive payments of 1.5 cents per kilowatt-hour (1993 dollars and indexed for inflation) for their first ten years of operation, subject to the availability of annual appropriations in each Federal fiscal year of operation. Criteria for qualifying facilities and application procedures are contained in the rulemaking for this program. Qualifying facilities must use solar, wind, geothermal (with certain restrictions as contained in the rulemaking), biomass (except for municipal solid waste combustion), or landfill gas generation technologies. Although the tidal energy is not explicitly included under the list of examples of qualifying facilities, tidal is explicitly referenced as a renewable resource elsewhere in the Energy Policy Act. It is reasonable to assume that a tidal power plant would be considered a qualifying facility.
Clean Renewable Energy Bonds (CREB) The Energy Policy Act of 2005 (P.L. 109-58) provides electric cooperatives and public power systems with the ability to issue “Clean Renewable Energy Bonds” (“CREBs”). The CREBs program is further described in Internal Revenue Service (IRS) Notice 2005-98. CREBs deliver an incentive comparable to the Production Tax Credit (“PTC”) that is available to private developers and investor owned utilities (“IOUs”). A CREB is a special type of bond, known as a “tax credit bond,” that offers cooperatives the equivalent of an interest-free loan for financing qualified energy projects for a limited term.
EPRI Economic Assessment Methodology for Tidal In-Stream Power Plants
_________________________________________________________________________ 18
Renewable energy projects that qualify for the PTC generally qualify for CREB financing. Specifically, these projects include wind, closed-loop biomass, open-loop biomass (including agricultural livestock waste), geothermal, solar, municipal solid waste (including landfill gas and trash combustion facilities), small irrigation power and hydropower. EPRI assumes that Ocean Tidal Power can be a subcategory under hydropower and therefore would apply. The electric cooperative or cooperative lender (“Issuer”) would issue the CREBs and sell them to bondholders. With a conventional bond, the Issuer must pay interest to the bondholder. But with a tax credit bond, the Issuer does not make interest payments. The federal government provides a tax credit to the bondholder in lieu of the Issuer paying interest to the bondholder. Treasury sets the rate of the credit on a daily basis, at a level that permits the issuance of the CREBs without discount and without interest cost to the Issuer. When the bondholder purchases the bond, the credit rate is locked in for the term of the bond. The credit accrues quarterly and is included in gross income of the bondholder (as if it were an interest payment on the bond). The bondholder takes the amount of the tax credit as a credit against its regular income tax liability and alternative minimum tax liability. Repayment of principal to the bondholder occurs on a “level annual repayment” basis, meaning equal payments each year of the term of the bond, commencing in the first year of issuance. The value of the CREB to a bondholder for any year is equal to the credit, less the amount of tax payable on the credit. For example, if the credit amount is $100 and the bondholder is in the 35 percent tax bracket, the credit provides a $65 benefit to the bondholder. Section 1303 of the Energy Tax Incentives Act of 2005, Pub. L. No. 109-58 (the Act), added section 54 to the Code. In general, section 54 authorizes up to $800,000,000 of tax credit bonds to be issued by qualified issuers to finance certain renewable energy projects described in section 45(d) of the Code. Section 54(j)(4) defines a “qualified issuer” as: (1) a clean renewable energy bond lender; (2) a cooperative electric company; or (3) a governmental body. Section 54(j)(2) provides that a “clean renewable energy bond lender” is a lender that is: (1) a cooperative that is owned by, or has outstanding loans to, 100 or more cooperative electric companies and was in existence on February 1, 2002; or (2) any affiliated entity controlled by such a lender. Section 54(j)(1) defines the term “cooperative electric company” as a mutual or cooperative electric company described in section 501(c)(12) or section 1381(a)(2)(C), or a not-for-profit electric utility that has received a loan or loan guarantee under the Rural Electrification Act. Section 54(j)(3) defines the term “governmental body” as any State, territory, possession of the United States, the District of Columbia, Indian tribal government, or any political subdivision thereof. Section 54(j)(5) provides that a “qualified borrower” is: (1) a mutual or cooperative electric company described in section 501(c)(12) or 1381(a)(2)(C); or (2) a governmental body.
2.4. Levelizing Costs
Levelized cost, which is intimately related to present value, is the uniform annual cost with the same present value as the actual annual cost.
EPRI Economic Assessment Methodology for Tidal In-Stream Power Plants
_________________________________________________________________________ 19
Book depreciation and periodic investment in replacement equipment will cause a project’s revenue requirements to change from year to year. The first step in calculating the levelized revenue requirement is to discount the time-varying cash flow for a particular reference year. The second step is to compute the equivalent payment (or annuity) that would have the same cumulative present value as the time-varying cash flow over the project’s life. Mathematical formulas for these two steps are described in any standard economics textbook. The discount rate is the cost of money needed to finance an investment project. In this analysis, we use the after-tax cost of money. The discount rate that is applicable to this analysis is based on a corporation’s access to the financial markets and will reflect a certain proportion of debt and equity financing for capital projects. This discount rate is dependent on whether ownership is a regulated utility or independent power producer.
2.5. Constant Dollar vs. Current Dollar Energy Costs
Energy costs can be computed in either constant dollars, which do not include the effects of inflation, or in current dollars, which do. Please note that when comparing different investment alternatives, the most economical option will not change regardless of whether constant or current dollars are used. Even so, when presenting the results of such studies, the type of dollar used should be indicated, as should the reference year for input cost data, and in the case of a current dollar analysis, the assumed inflation rate. When working with constant dollars, real interest rates are used, whereas when working with current dollars, nominal interest rates are used. As a simple example, if a homeowner’s fixed rate mortgage is a nominal rate of 6% and inflation is 3%, the real rate, i.e., adjusted for inflation is 2.9% ( real rate = (( 1 + nominal rate)/(1 + inflation rate)) - 1).
2.6. Financing Assumptions
The four key assumptions that underpin the calculation of levelized cost are:
(1) The period over which the annual costs are incurred; (2) The reference year dollar in which the annual costs are expressed; (3) Whether the levelized costs are in constant or current terms; (4) The discount rate, which is based on the capital structure (equity and/or debt) used to
finance the project as well as the perceived risk of the project. For this tidal in-stream energy project, we will use the following assumptions:
• 20 year plant life • All costs in real or constant January 2005 dollars • Commercial plant start date = January 2008 (plant design, permitting and financing in
2005, plant construction in 2006 and 2007)

EPRI Economic Assessment Methodology for Tidal In-Stream Power Plants
_________________________________________________________________________ 20
• Inflation rate of 3.0%, based on the U.S. Producer Price Index for 2003 6 Utility Generator (i.e., independently owned utility (IOU)) assumptions are
• Capital structure of 65% equity and 35% debt 7 • Distribution of equity: 52% common equity and 13 % preferred equity8 • Cost of common equity of 13% (nominal) 2 • Cost of debt before taxes of 7.5% (nominal) 2 • Cost of preferred equity (nominal) of 10.5%, representing the average of the cost of
common equity and cost of debt Table 5: Regulated UG Financing Assumption
Percent Nominal Rate
Real Rate(1)
Capital Structure (%) Common Equity Preferred Equity Long-Term Debt
52 13 35
13.0 % 10.5 % 7.5 %
9.7 % 7.3 % 4.4 %
Income Tax Rates Federal State (generic @ 4.0%) Composite (21)
35.0 % 4.0 % 37.6 %
35.0 % 4.0 % 37.6 %
Discount Rate (before tax)(3) 10.75 % 7.5 % Discount Rate (after tax) (4) 9.72 % 6.5 % (1) Real rate = ((( 1 + nominal rate)/(1 + inflation rate))-1) (2) State income tax is deductible, so the composite rate is (0.35+0.040*(1-0.35))*100 = 37.6% (2) The weighted cost of money or before-tax discount rate = Common equity share *interest rate + preferred equity share * interest rate + long-term debt share * interest rate (3) The after-tax discount rate = Common equity share *interest rate + preferred equity share * interest rate + long-term debt share * interest rate * (1-composite tax rate) Municipal Utility Generators issue tax-exempt bonds to finance utility projects, enabling local governments to access some of the lowest interest rates available. Financing assumptions are:
• Projects 100% financed by the Bond Market • Cost of capital = 5% nominal (2% real) • Not taxable
6 Source: U.S. Bureau of Labor Statistics, 2004 7 www.eere.energy.gov/consumerinfo/pfds/financial.pdf 8 Consistent with historical 4:1 ratio between common and preferred stock in the Composite Balance Sheet for Major U.S. Investor-Owned Electric Utilities, 1996 – 2000 compiled by the Energy Information Administration (http://www.eia.doe.gov/cneaf/electricity/invest/t8.txt).

EPRI Economic Assessment Methodology for Tidal In-Stream Power Plants
_________________________________________________________________________ 21
3. Non Utility Generator (NUG) Cost of Electricity Assessment Methodology and Assumptions The key differences between UG and NUGs are:
• Obligation to Serve – UG’s have traditionally had an obligation to serve and to provide reliable electric service. NUG’s develop a project for its potential economic rewards and have the option to sell their power on a wholesale basis to a utility, on a retail basis to the customer, or directly to a power pool.
• Rates/Prices – Rates for UGs are usually set using the revenue requirements approach. NUGs typically attempt to set the prices as high as the market will allow.
• Risks and benefits – Customers of UGs bear the risks associated with prudent investments. Since customer, not utilities, bear the risk, UGs earn a lower rate of return on investments associated with a monopoly. NUGs bear the risks associated with their investments but can mitigate them to an extent that they negotiate contracts for energy sales.
NUGs can be classified into different types; however, for purpose of this analysis, we assume that the NUG is a Merchant Power Plant. Merchant plants are generally characterized as those that have substantial commodity risks for electricity sales (i.e., a substantial portion of their electricity sales is not fully committed to long term power sales agreements). The power will either be sold on a spot market basis to a power pool or under contracts with varying terms to utilities.
3.1. Development of an Economic Pro Forma for a NUG
While there are a variety of methods to evaluate NUG power projects, all methods depend on calculating cash flows. The cash flows represent all revenues from the sale of electricity less the sum of all expenses, debt service and income taxes. The net cash flow represents cash available to equity holders.
Cost Components, Income Taxation, and Investment/Production Tax Credits
The cost component, income taxation and investment/production tax credits are the same for UGs as described in section 2.1, 2.2 and 2.3 respectively Constant Dollar vs. Current Dollar Energy Costs Energy costs can be computed in either constant dollars, which do not include the effects of inflation, or in current dollars, which do. Please note that when comparing different investment alternatives, the most economical option will not change regardless of whether real or nominal dollars are used. Even so, when presenting the results of such studies, the type of dollar used should be indicated, as should the reference year for input cost data.

EPRI Economic Assessment Methodology for Tidal In-Stream Power Plants
_________________________________________________________________________ 22
Financing Cost
• Capital structure of 30% equity and 70% debt 9 • Cost of equity of 17.0% (nominal), a premium over the utility cost of equity due to
higher inherent risk 4 • Cost of debt of 8% (nominal) 4 • Interest rate on construction loan assumed equivalent to cost of debt: 8% (interest) • Financial fees of 2% of the loan amount and • Debt service reserve of 6 months of debt service
Table 6: Example Independent Power Producer Financing Assumptions
Percent Rate Nominal
Rate Real
Scenario 2: Long-term (30 year) Capital Structure (%) Equity Debt
30 70
17.0 % 8.0 %
13.60 % 4.9 %
Income Tax Rates Federal State (generic @ 4.0%) Composite
35.0 % 4.0 % 37.6 %
35.0 % 4.0 % 37.6 %
Discount Rate (before tax) 10.7 % 7.5 % Discount Rate (after tax) 8.5 % 5.3 %
Development Cost
Development costs include a variety of costs that a NUG incurs to develop a project. Examples include security deposits, permitting (including construction permits and environmental permits), owner’s engineering and general and administrative costs, development fees, legal fees and easements and rights of way. These costs can vary widely depending on the specific project. For purposes of this analysis, we assume a cost allowance of 5% of the TPC.
3.2. Income Statement
The income statement summarizes the revenues and expenses for each year of the project. A layout of a typical income statement is shown in Table 7.
9 www.eere.energy.gov/consumerinfo/pfds/financial.pdf

EPRI Economic Assessment Methodology for Tidal In-Stream Power Plants
_________________________________________________________________________ 23
Table 7. NUG Income Statement
Year -2
……………. Year N
Total
REVENUES Capacity Payments Energy Payments Renewable Energy Certificates Federal Production Tax Credit TOTAL REVENUES Avg Electricity Revenues (cents/kWh) VARIABLE OPERATING EXPENSES Supplies and Consumables Unscheduled Operation and Maintenance TOTAL FIXED OPERATING EXPENSES Scheduled Operation and Maintenance Scheduled Overhaul/Replacement Insurance TOTAL TOTAL OPERATIG EXPENSES EARNINGS BEFORE INTEREST, DEPREC, TAXES, AND AMORTIZATION (EBIDTA)
INCOME TAX Tax Depreciation EARNINGS BEFORE INCOME / TAXES Interest paid Total Interest Received (5% per year) NET OPERATING INCOME (LOSS) TAXABLE EARNINGS State Tax Federal Tax TOTAL TAX OBLIGATION NET EARNINGS AFTER TAXES
3.3. Revenues
The forecast of revenues over the service life of a merchant power plant is one of the most critical aspects of the economic analysis. The analysis requires a forecast of market prices. In a deregulated market, prices need to be forecast by time-of-day and time of year and gets very
EPRI Economic Assessment Methodology for Tidal In-Stream Power Plants
_________________________________________________________________________ 24
complex very quickly. For simplicity of analysis and understanding, this methodology assumes only an energy component (the capacity component shown in Table 6 is zero) and an average power sales price as a function of state. Two electricity price indicators; industrial price and avoided cost, on a state-by-state basis, and one forecast model is used
Industrial Price
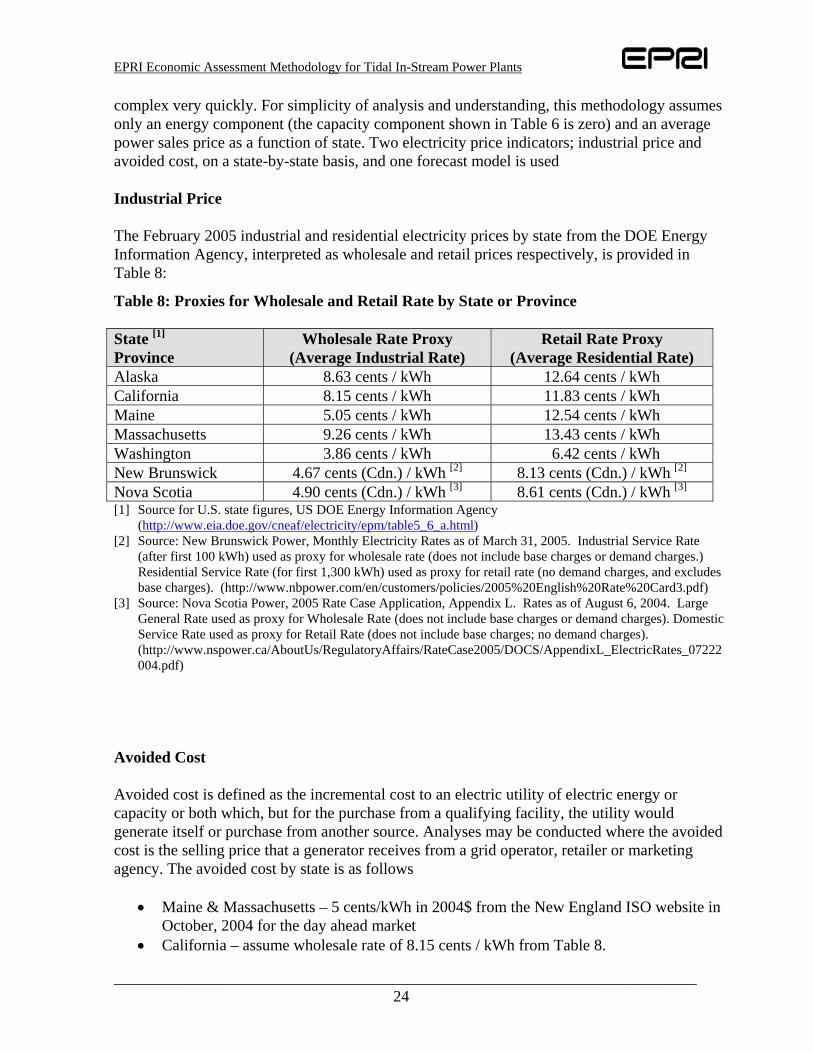
The February 2005 industrial and residential electricity prices by state from the DOE Energy Information Agency, interpreted as wholesale and retail prices respectively, is provided in Table 8:
Table 8: Proxies for Wholesale and Retail Rate by State or Province State [1] Province
Wholesale Rate Proxy (Average Industrial Rate)
Retail Rate Proxy (Average Residential Rate)
Alaska 8.63 cents / kWh 12.64 cents / kWh California 8.15 cents / kWh 11.83 cents / kWh Maine 5.05 cents / kWh 12.54 cents / kWh Massachusetts 9.26 cents / kWh 13.43 cents / kWh Washington 3.86 cents / kWh 6.42 cents / kWh New Brunswick 4.67 cents (Cdn.) / kWh [2] 8.13 cents (Cdn.) / kWh [2] Nova Scotia 4.90 cents (Cdn.) / kWh [3] 8.61 cents (Cdn.) / kWh [3] [1] Source for U.S. state figures, US DOE Energy Information Agency
(http://www.eia.doe.gov/cneaf/electricity/epm/table5_6_a.html) [2] Source: New Brunswick Power, Monthly Electricity Rates as of March 31, 2005. Industrial Service Rate
(after first 100 kWh) used as proxy for wholesale rate (does not include base charges or demand charges.) Residential Service Rate (for first 1,300 kWh) used as proxy for retail rate (no demand charges, and excludes base charges). (http://www.nbpower.com/en/customers/policies/2005%20English%20Rate%20Card3.pdf)
[3] Source: Nova Scotia Power, 2005 Rate Case Application, Appendix L. Rates as of August 6, 2004. Large General Rate used as proxy for Wholesale Rate (does not include base charges or demand charges). Domestic Service Rate used as proxy for Retail Rate (does not include base charges; no demand charges). (http://www.nspower.ca/AboutUs/RegulatoryAffairs/RateCase2005/DOCS/AppendixL_ElectricRates_07222004.pdf)
Avoided Cost Avoided cost is defined as the incremental cost to an electric utility of electric energy or capacity or both which, but for the purchase from a qualifying facility, the utility would generate itself or purchase from another source. Analyses may be conducted where the avoided cost is the selling price that a generator receives from a grid operator, retailer or marketing agency. The avoided cost by state is as follows
• Maine & Massachusetts – 5 cents/kWh in 2004$ from the New England ISO website in October, 2004 for the day ahead market
• California – assume wholesale rate of 8.15 cents / kWh from Table 8.

EPRI Economic Assessment Methodology for Tidal In-Stream Power Plants
_________________________________________________________________________ 25
• Washington – assume wholesale rate of 3.86 cents / kWh from Table 8. • New Brunswick – assume wholesale rate of 4.67 cents (Cdn.) / kWh from Table 8. • Nova Scotia – assume wholesale rate of 4.90 cents (Cdn.) / kWh from Table 8.
Electricity Price Forecast
The electricity price forecast from the EIA (Reference 8) is shown graphically in Figure 1 and is as follows "Average U.S. electricity prices, in real 2003 dollars, are expected to decline by 11 percent, from 7.4 cents per kilowatthour in 2003 to 6.6 cents in 2011 then rise to 7.3 cents per kilowatthour in 2025. Prices follow the trend of the generation cost component of price, which makes up 65 percent of the total price of electricity and changes mainly in response to changes in natural gas prices.”
Figure 1. EIA U.S. Retail Electricity Price and Forecast, 1970 – 2025 (2003 Base Year; cents per kilowatt hour)
Most would probably view this 10% increase in electricity prices in constant dollars from 2011 to 2025 to be a conservative forecast. We have chosen to use this forecast as it is consistent with our philosophy throughout the EPRI Ocean Energy feasibility studies of avoiding assumptions which might cause reviewers of this work to perceive EPRI as attempting to make renewable ocean energy look more favorable that it really is.
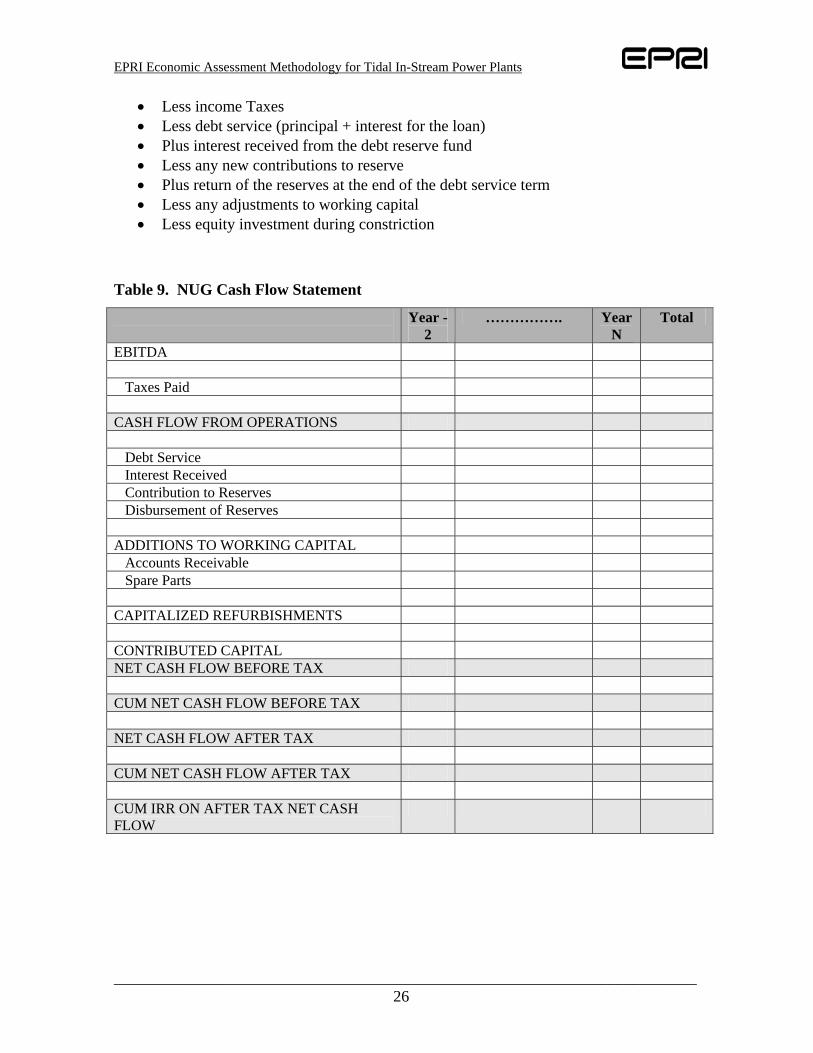
3.4. Cash Flow Statement
A cash flow statement calculates the after tax net cash flow for the project. A layout of a typical cash flow statement is shown in Table 9. The cash flow statement begins with the EBITDA as brought forward from Table 6 and includes the following adjustments:
EPRI Economic Assessment Methodology for Tidal In-Stream Power Plants
_________________________________________________________________________ 26
• Less income Taxes • Less debt service (principal + interest for the loan) • Plus interest received from the debt reserve fund • Less any new contributions to reserve • Plus return of the reserves at the end of the debt service term • Less any adjustments to working capital • Less equity investment during constriction
Table 9. NUG Cash Flow Statement
Year -2
……………. Year N
Total
EBITDA Taxes Paid CASH FLOW FROM OPERATIONS Debt Service Interest Received Contribution to Reserves Disbursement of Reserves ADDITIONS TO WORKING CAPITAL Accounts Receivable Spare Parts CAPITALIZED REFURBISHMENTS CONTRIBUTED CAPITAL NET CASH FLOW BEFORE TAX CUM NET CASH FLOW BEFORE TAX NET CASH FLOW AFTER TAX CUM NET CASH FLOW AFTER TAX CUM IRR ON AFTER TAX NET CASH FLOW

EPRI Economic Assessment Methodology for Tidal In-Stream Power Plants
_________________________________________________________________________ 27
3.5. Economic Indicators
The net present value (NPV) and the internal rate of return (IRR) are economic measures of the project that reflect the present worth of profit over the service life and the profitability of the project, respectively.
Net Present Value
The net present value represents the present value of profit using the time value of money. This calculation results from discounting the net cash flows at the minimum acceptable rate of return for the equity investor. The method is also referred to as the discounted cash flow method. The net present value must be defined at a certain point in time. Frequently, the NPV is calculated at the commercial operation date. In this case, the total capital requirement (at the commercial operation date) is subtracted from the net cash flows that are brought back to the same date.
Internal Rate of Return
The internal rate of return (IRR) addresses the profitability of a project. Mathematically, the IRR is defined as the discount rate that sets the present worth of the net cash flows over the service life equal to the equity investment at the commercial operating date.
An IRR of 20% does not necessarily mean that the net cash flows will represent 20% of the equity investment for each and every year of the service life. However, an IRR of 20% does mean that the equity investor will earn an equivalent of 20% of the outstanding balance each year. The balance will be reduced in some fashion over the life of the plant.
Many companies have a minimally acceptable IRR that must be met before a potential project is seriously considered. The minimum acceptable rate is known as the hurdle rate. It can be used to screen potential projects based on their IRR.
There are several caveats to be aware of when calculating the IRR:
• The IRR solution is a trial and error solution that is typically solved by a convergence routine available in spreadsheet software
• The solution is based on solving an “n-th” degree polynomial that may have multiple real positive roots. More that one change in the sign of the coefficients of the net cash flows is an indication of multiple positive roots. A standard engineering economics should be consulted for situations where multiple roots are suspected.
• Changes in the IRR are not scalar and a small change in the cash flows can have a large effect on the IRR
• Comparisons of the IRR may be misleading. While the IRR allows investors to rank options based on their potential rate of return, it does not take into account a project’s size. For example, it does not allow an analyst to capture a $1 million project with a

EPRI Economic Assessment Methodology for Tidal In-Stream Power Plants
_________________________________________________________________________ 28
25% IRR and a $10 million alternative having a 20% IRR. An incremental analysis may be required. A standard engineering economics should be consulted for these situations.
Discounted Payback Period
The discounted payback period (DPP) represents the number of years for the present worth of net cash flows to recover the capital investment. Time value of money considerations are considered (as opposed to a simple payback period in which the time value of money is not considered).

EPRI Economic Assessment Methodology for Tidal In-Stream Power Plants
_________________________________________________________________________ 29
4. General Considerations
4.1. Cost Accuracy
Since commercial-scale demonstration of a tidal in-stream power plant has not been accomplished to date, the economics associated with future tidal power are uncertain. Furthermore, we do not know whether tidal in-stream power will ever become cost competitive relative to other energy sources. However, we do believe that tidal in-stream power is an energy resource that is too important to overlook and therefore needs to be developed to the point where the economics are well enough understood so there can be a determination of future cost competitiveness. In order to quantify the accuracy of the cost estimates to be made in this project, we use the accuracy versus cost estimate rating and stage of development relationship as shown in the following table:
Table 10: Accuracy Range for Cost Data Cost Estimate Rating
A Mature
B Commercial
C Demonstration
D Pilot
E Conceptual
(Idea or Lab)
A. Actual 0 - - - - B. Detailed -5 to +5 -10 to +10 -15 to +20 - - C. Preliminary -10 to +10 -15 to +15 -20 to +20 -25 to +30 -30 to +50 D. Simplified -15 to +15 -20 to _20 -25 to +30 -30 to +30 -30 to +80 E. Goal - -30 to +70 -30 to +80 -30 to +100 -30 to +200
• A – Actual – Data on detailed process and mechanical designs with historical data from
existing units • B – Detailed – Detailed process and mechanical design and cost estimate but no
historical data • C – Preliminary – Preliminary process and mechanical design • D- Simplified - Simplified process and mechanical design • E – Goal – Technical design/cost goal or cost estimate developed from literature data
Using this table, the accuracy of the cost estimates for this project during the Phase 1. Project Definition Study are expected to be:
• Initial capital cost = -30 to +30% accurate based on the existence of prototypes and the simplified cost estimate level of detail for this project
• Replacement and overhaul capital cost and O&M = -30 to +80% accurate based on the lack of existence of any experience with periodic replacement and overhaul and O&M
The estimates will have a relatively high degree of uncertainty, particularly in the O&M and LO&RC area. EPRI will evaluate the economic competitiveness at both the optimistic and pessimistic ends of the uncertainty spectrum.

EPRI Economic Assessment Methodology for Tidal In-Stream Power Plants
_________________________________________________________________________ 30
5. Economic Comparisons The purpose of this section is to describe how EPRI will compare the economics of Tidal In- Stream Energy Conversion (TISEC) plants to other alternatives such as coal, natural gas, nuclear and other renewable technologies such as wind, solar and geothermal.
5.1. Background
The current capital and O&M costs of commercial scale TISEC plant designs will be estimated in the 2005 EPRI North America Collaborative In Stream Tidal Feasibility Study for sites in New Brunswick, Nova Scotia, Maine, Massachusetts, Alaska, Washington and San Francisco (CA) by the EPRI Project Team. Note that the current capital and O&M costs of commercial scale Wave Energy Conversion (WEC) plant designs were estimated in the 2004 EPRI U.S Collaborative Feasibility Study for sites in Maine, Massachusetts, Hawaii, Oregon and San Francisco (CA) by the EPRI Project Team (see Reference 10). The current comparative costs of different generation technologies are given in Table 11a for 2010 and Table 11b for 2020 (both in 2004$). Capital costs are given in $/kW. They have wide ranges that depend on the size of the plant and other conditions such as environmental controls for coal and quality of the resource for geothermal. We are using generally accepted average numbers and ranges from EPRI sources (Reference 11). Table 11a: COE for Alternative Energy Technologies - 2010
2010: Economic Outlook for Various Technologies Efficiency
(%) Capacity
Factor (%)
Overnight Capital Cost(1)
($/kW)
Cost of Electricity (COE)(1)
($/MWhr)
CO2 Emissions
(lbs per MWhr )
Coal(2) PC USC 39 80 1250 41 1757 Coal(2) PC USC w/ CO2 capture
30 80 2100 67 115 (95% Removal)
Coal(2) CFB 36 80 1370 49 1914 IGCC(2) GE – Quench W/O CO2 capture
37 80 1380 47 1887
IGCC(2) GE - Quench w/ CO2 capture
30 80 1780 60 344(3) (85% Removal)
NGCC(4) ( @ $7/MM Btu)
46 80(5) 460 63 863
NGCC(4) ( @ $5/MM Btu)
46 80(5) 460 47 863

EPRI Economic Assessment Methodology for Tidal In-Stream Power Plants
_________________________________________________________________________ 31
Nuclear Evolutionary (ABWR)
N/A 85-90 1600 46 – 49 None
Nuclear Passive (ESBWR / AP 1000)
N/A 85-90 1400 – 1700 41 - 47 None
Wind (Class 3 to Class 6)
N/A 30-42 1100 46 - 64 None
Solar Thermal (Parabolic Trough)
N/A 33 3150 180 None
Biomass CFB 28 85 2000 62 264(6)
Notes: 1) All costs in 2004$; COE in levelized constant 2004$ and includes capital cost. Capital Cost is
overnight, W/O Owner, AFUDC costs. 2) All fossil units about 600 MW capacity; Pittsburgh#8 coal for PC, CFB, IGCC. 3) Based on Gas Turbine technology limitations to handle hydrogen 4) NGCC unit based on GE 7F machine or equivalent by other vendors 5) Represents technology capability 6) Recent market data based on 2004 operation 67) Value shown is 10% emission of total. The remainder is assumed to be absorbed by the biomass
plant crop growth cycle Table 11b: COE for Alternative Energy Technologies - 2020 2020: Economic Outlook for Various Technologies Efficiency
(%) Goal
Capacity Factor
(%)
Overnight Capital Cost(1)
($/kW)
Cost of Electricity (COE)(1) ($/MWhr
CO2 Emissions
(lbs per MWhr )
Coal(2) PC First of a Kind USC
46-48 80 1200 – 1500 37 -42 1250 – 1300
Coal(2) PC USC w/ CO2 capture
37-39 80 1600-1900 48-53 85 (95% Removal)
Coal(2) CFB 45-47 80 1250-1550 42-48 1350-1400 IGCC(2) GE Quench W/O CO2 capture
42 80 1130 38 1662
IGCC(2) GE Quench W/ CO2 capture
37 80 1350 50 100 (95% Removal)
NGCC(3) Advanced ( @ $7/MM Btu)
54 80(4) 500 – 740 56- 60 660
NGCC(3) Advanced @ $5/MM Btu)
54 80(4) 500 – 740 39-43 660
Nuclear First of a kind (Generation IV)
N/A 70-90 1600 - 1800 46-60 None
Fuel Cell GT Hybrid First of Kind
50 – 55 60-80 1500 - 2000 50-70 600
Wind
N/A 40 660 32 None

EPRI Economic Assessment Methodology for Tidal In-Stream Power Plants
_________________________________________________________________________ 32
Solar Thermal (Parabolic Trough)
N/A 35 2800 160 None
Biomass CFB 34 80 1200 43 220(6)
Notes: 1) All costs in 2004$; COE in levelized constant 2004$ and includes capital cost. Capital Cost is
overnight, W/O Owner, AFUDC costs 2) All fossil units about 600 MW capacity; Pittsburgh#8 coal for PC, CFB, IGCC. Advancements in
CFB in larger sizes and higher efficiency are being carried out. PC USC is 5000 psi 1112-1292F 3) NGCC unit based on GE H Type or equivalent by other vendors 4) Represents technology capability 5) Recent market data based on 2004 operation 6) Value shown is 10% emission of total. The remainder is assumed to be absorbed by the biomass
plant crop growth cycle The fuel cost for coal and natural gas (NG) is the price of fuel (in $ per Mbtu), times the heat rate (BTUs needed to generate a kWh of electricity – 10,000 for PC Coal, 9,000 for IGCC, 12,000 for Gas CT and 7,000 for NG CC), divided by 10,000. New Brunswick Power expects any new coal plants after 2010 will use super critical technologies; therefore the heat rates and efficiencies should be better than those shown in the previous paragraph. In addition, climate change initiatives will push New Brunswick Power to use the best new technologies available after 2008; therefore, New Brunswick Power expects to use the best new technologies available after 2010 and CO2 capture will happen after 2012/2013. (Currently IGCC capture is ready)
5.2. Key Assumptions
All costs are calculated without government subsidies or incentives. The following is a list of the key assumptions, which form the basis of the numbers stated in this report.
1. 2005 base year – expressed in current year dollars 2. Book life/Tax life 3. Federal Tax rate 4. State Tax rates 5. Depreciation schedule 6. Government incentives applied (should be none) 7. Capital financing structure (% common equity, preferred equity and debt) 8. Financing rates (common equity, preferred equity and debt) – expressed in nominal
rates)

EPRI Economic Assessment Methodology for Tidal In-Stream Power Plants
_________________________________________________________________________ 33
Table 12: Assumptions forming the Basis for COE for Alternative Energy Technologies Book
Life/ Tax life)
Fed Tax Rate
State Tax Rate
Dep Sch
% Equity UG/ NUG/ Public
Equity Disc’t Rate (Real) UG/NUG
% Debt UG/ NUG/ Public
Debt Disc’t Rate (Real)UG/NUG/ Public
InflationRate
Coal(2) PC First of a Kind USC
30/ 20
35 6.5 ACRS
45/ 30/ 0
11.5/ 13/ N/A
55/ 70/ 100
6/5 8/ 4.5
2
Coal(2) PC USC w/ CO2 capture
30/ 20
35 6.5 ACRS
45/ 30/ 0
11.5/ 13/ N/A
55/ 70/ 100
6/5 8/ 4.5
2
Coal(2) CFB 30/ 20
35 6.5 ACRS
45/ 30/ 0
11.5/ 13/ N/A
55/ 70/ 100
6/5 8/ 4.5
2
IGCC(2) GE Quench W/O CO2 capture
30/ 20
35 6.5 ACRS
45/ 30/ 00
11.5/ 13/ N/A
55/ 70/ 100
6/5 8/ 4.5
2
NGCC(3) Advanced ( @ $7/MM Btu)
30/ 20
35 6.5 ACRS
45/ 30/ 00
11.5/ 13/ N/A
55/ 70/ 100
6/5 8/ 4.5
2
NGCC(3) Advanced @ $5/MM Btu)
30/ 20
35 6.5 ACRS
45/ 30/ 0
11.5/ 13/ N/A
55/ 70/ 100
6/5 8/ 4.5
2
Nuclear First of a kind (Gen IV)
30/ 20
35 6.5 ACRS
45/ 30/ 0
11.5/ 13/ N/A
55/ 70/ 100
6/5 8/ 4.5
2
Fuel Cell GT Hybrid First of Kind
30/ 20
35 6.5 MACRS
45/ 30/ 0
11.5/ 13/ N/A
55/ 70/ 100
6/5 8/ 4.5
2
Wind 30/ 20
35 6.5 MACRS
45/ 30/ 0
11.5/ 13/ N/A
55/ 70/ 100
6/5 8/ 4.5
2
Solar Thermal (Parabolic Trough)
30/ 20
35 6.5 MACRS
45/ 30/ 0
11.5/ 13/ N/A
55/ 70/ 100
6/5 8/ 4.5
2
Biomass CFB 30/ 20
35 6.5 MACRS
45/ 30/ 0
11.5/ 13/ N/A
55/ 70/ 100
6/5 8/ 4.5
2
Wave (1) 20/ 20
35 8.93 (2)
MACRS
65/ 30
9.4/ 13.6
35/ 70
4.4/ 4.9
3
(1) EPRI 2004 Wave Energy Feasibility Definition Study (2) Maine
5.3. Form of Expected Results
As described in section 4.2 on learning curves, there is a negative exponential relationship between price and the total amount of cumulative capacity sold. In other words, with each

EPRI Economic Assessment Methodology for Tidal In-Stream Power Plants
_________________________________________________________________________ 34
doubling of cumulative capacity, the cost drops a fixed amount: the 32nd cumulative MW of say, PV capacity installed will be x% cheaper than the 16th, and the 64th cumulative MW will be x% cheaper than the 32nd. This relationship is found to apply to most power technologies, both mature and emerging, but the progress quotient (value of “x”) differs among technologies, with fossil fuel technologies having a lower progress quotient than for renewable technologies. For this reason, it makes sense to compare the cost of an emerging power technology against each other and against mature technologies as a function of cumulative production volume. Fossil fuel technology cost have a fuel cost component whereas renewable technologies do not. Therefore, it makes sense to compare the COE of TISEC against the fossil fuel technologies as a function of the coal and NG fuel price. Lastly, as governments subsidize (by providing incentives such as investment tax credits, production tax credits and establishing a renewable energy certificate market driven by renewable portfolio standards) certain technologies deemed to be in the public good, it makes sense to analyze the effects of these incentives. The list of expected economic comparison is as follows:
1. TISEC COE vs Wind 2. TISEC COE vs Solar PV and Solar Thermal 3. TISEC COE vs PC Coal = function of fuel prices 4. TISEC COE vs IGCC Coal = function of fuel prices 5. TISEC COE vs NG CT = function of fuel prices 6. TISEC COE vs NG CC = function of fuel prices a 7. TISEC COE vs Geothermal 8. TISEC COE vs Nuclear 9. TISEC COE vs WEC 10. TISEC COE vs all alternatives = function of (subsidies and incentives) 11. TISEC COE vs all alternatives = function of (CO2 regulations)
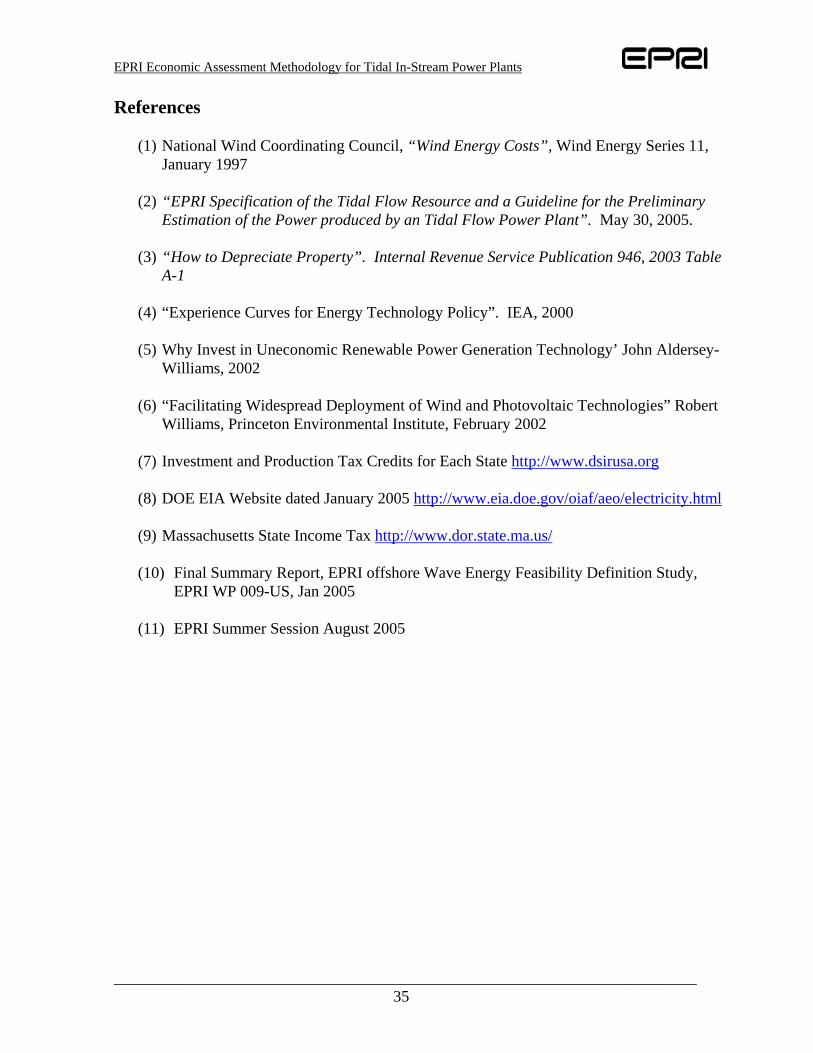
EPRI Economic Assessment Methodology for Tidal In-Stream Power Plants
_________________________________________________________________________ 35
References (1) National Wind Coordinating Council, “Wind Energy Costs”, Wind Energy Series 11,
January 1997
(2) “EPRI Specification of the Tidal Flow Resource and a Guideline for the Preliminary Estimation of the Power produced by an Tidal Flow Power Plant”. May 30, 2005.
(3) “How to Depreciate Property”. Internal Revenue Service Publication 946, 2003 Table
A-1
(4) “Experience Curves for Energy Technology Policy”. IEA, 2000
(5) Why Invest in Uneconomic Renewable Power Generation Technology’ John Aldersey-Williams, 2002
(6) “Facilitating Widespread Deployment of Wind and Photovoltaic Technologies” Robert
Williams, Princeton Environmental Institute, February 2002
(7) Investment and Production Tax Credits for Each State http://www.dsirusa.org (8) DOE EIA Website dated January 2005 http://www.eia.doe.gov/oiaf/aeo/electricity.html
(9) Massachusetts State Income Tax http://www.dor.state.ma.us/
(10) Final Summary Report, EPRI offshore Wave Energy Feasibility Definition Study,
EPRI WP 009-US, Jan 2005
(11) EPRI Summer Session August 2005
Appendix A UG Worksheet
The UG Economic Assessment Calculations are is implemented as an Excel Workbook with Nine (9) tabs or sheets and calculates the cost of electricity (COE) for a regulated utility generator (UG). The capital cost and O&M cost numbers shown in this worksheet are for illustrative purposes; they DO NOT represent the cost of a tidal plant in any particular state or province.
Instructions
Tab 1. Instructions
Tab 2. Total Production Cost (TPC) and Annual Operation and Maintenance Cost
Tab 3. Assumptions
Tab 4. Net present Value (NPV)
Tab 5. Capital Recovery Rate (CR)
Tab 6. Fixed Charge Rate (FCR)
Tab 7. Cost of Electricity (COE)

EPRI Economic Assessment Methodology for Tidal In-Stream Power Plants
_________________________________________________________________________ 37
INSTRUCTIONSIndicates Input Cell (either input or use default values)Indicates a Calculated Cell (do not input any values)
Sheet 1. TPC/TPI (Total Plant Cost/Total Plant Investment)a) Enter Component Unit Cost and No. of Units per Systemb) Worksheet sums component costs to get TPC c) Adds the value of the construction loan payments to get TPId) Enter Annual O&M Type including annualized overhaul and refit costc) Worksheet Calculates insurance cost and Total Annual O&M Cost
Sheet 2. Assumptions (Financial)a) Enter project and financial assumptions or leave default values
Sheet 3. NPV (Net Present Value)A Gross Book Value = TPIB Annual Book Depreciation = Gross Book Value/Book LifeC Cumulative DepreciationD MACRS 5 Year Depreciation Tax Schedule AssumptionE Deferred Taxes = (Gross Book Value X MACRS Rate - Annual
Book Depreciation) X Debt Financing RateF Net Book Value = Previous Year Net Book Value - Annual Book
Depreciation - Deferred Tax for that YearSheet 4. CRR (Capital Revenue Requirements)
A Net Book Value for Column F of NPV WorksheetB Common Equity = Net Book X Common Equity Financing
Share X Common Equity Financing RateC Preferred Equity = Net Book X Preferred Equity Financing
Share X Preferred Equity Financing RateD Debt = Net Book X Debt Financing Share X Debt Financing RateE Annual Book Depreciation = Gross Book Value/Book LifeF Income Taxes = (Return on Common Equity + Return of Preferred Equity -
Interest on Debt + Deferred Taxes) X (Comp Tax Rate/(1-Comp Tax RateG Property Taxes and Insurance Expense = H Calculates Investment and Production Tax Credit RevenuesI Capital Revenue Req'ts = Sum of Columns B through G
Sheet 5. FCR (Fixed Charge Rate)A Nominal Rates Capital Revenue Req'ts from Columnn H of Previous WorksheetB Nominal Rate Present Worth Factor = 1 / (1 + After Tax Discount Rate)C Nominal Rate Product of Columns A and B = A * BD Real Rates Capital Revenue Req'ts from Columnn H of Previous WorksheetE Real Rates Present Worth Factor = 1 / (1 + After Tax Discount Rate - Inflation Rate)F Real Rates Product of Columns A and B = A * B
Sheet 6. Calculates COE (Cost of Electricity)COE = ((TPI * FCR) + AO&M ) / AEPIn other words…The Cost of Electricity =
The Sum of the Levelized Plant Investment + Annual O&M Cost including Levelized Overhaul and Replacement Cost Divided by the Annual Electric Energy Consumption

EPRI Economic Assessment Methodology for Tidal In-Stream Power Plants
_________________________________________________________________________ 38
TOTAL PLANT COST (TPC) - 2005$
Procurement Power Conversion System 40 $799,712 $31,988,480 Structural Elements 40 $747,281 $29,891,240 Subsea Cables Lot $2,984,000 $2,984,000 Turbine Installation 40 $358,862 $14,354,480 Subsea Cable Installation Lot $10,492,000 $10,492,000 Onshore Grid Interconnection Lot $500,000 $500,000
TOTAL $90,210,200
TOTAL PLANT INVESTMENT (TPI) - 2005 $
End of Year
Total Cash Expended
TPC (2005$)
Before Tax Construction Loan Cost at
Debt Financing
Rate
2005 Value of Construction
Loan Payments
TOTAL PLANT INVESTMENT
2005$2007 $45,105,100 $3,382,883 $2,758,033 $47,863,1332008 $45,105,100 $3,382,883 $2,490,323 $47,595,423Total $90,210,200 $6,765,765 $5,248,356 $95,458,556
ANNUAL OPERATING AND MAINTENANCE COST (AO&M) - 2005$
Costs Yrly Cost AmountLabor and Parts $2,212,644 $2,212,644Insurance (1.5% of TPC) $1,353,153 $1,353,153
Total $3,565,797
TPC Component Unit Unit Cost Total Cost (2005$)

EPRI Economic Assessment Methodology for Tidal In-Stream Power Plants
_________________________________________________________________________ 39
FINANCIAL ASSUMPTIONS (default assumptions in pink background - without line numbers are calculated values)
1 Rated Plant Capacity © 40 MW2 Annual Electric Energy Production (AEP) 131,500 MWeh/yr
Therefore, Capacity Factor 37.50 %3 Year Constant Dollars 2005 Year4 Federal Tax Rate 35 %5 State Example State6 State Tax Rate 8.84 %
Composite Tax Rate (t) 0.40746t/(1-t) 0.6876
7 Book Life 20 Years8 Construction Financing Rate 7.59 Common Equity Financing Share 52 %10 Preferred Equity Financing Share 13 %11 Debt Financing Share 35 %12 Common Equity Financing Rate 13 %13 Preferred Equity Financing Rate 10.5 %14 Debt Financing Rate 7.5 %
Nominal Discount Rate Before-Tax 10.75 %Nominal Discount Rate After-Tax 9.68 %
15 Inflation Rate = 3% 3 %Real Discount Rate Before-Tax 7.52 %Real Discount Rate After-Tax 6.49 %
16 Federal Investment Tax Credit 10 % 1st year only17 Federal Production Tax Credit 0.018 $/kWh for 1st 10 years18 State Investment Tax Credit 7.5 % of TPI 19 State Investment Tax Credit Limit None Credit - 1st year only for >
$10M plant20 Renewable Energy Certificate 0 $/kWh21 State Tax Depreciation 0 Installation Cost
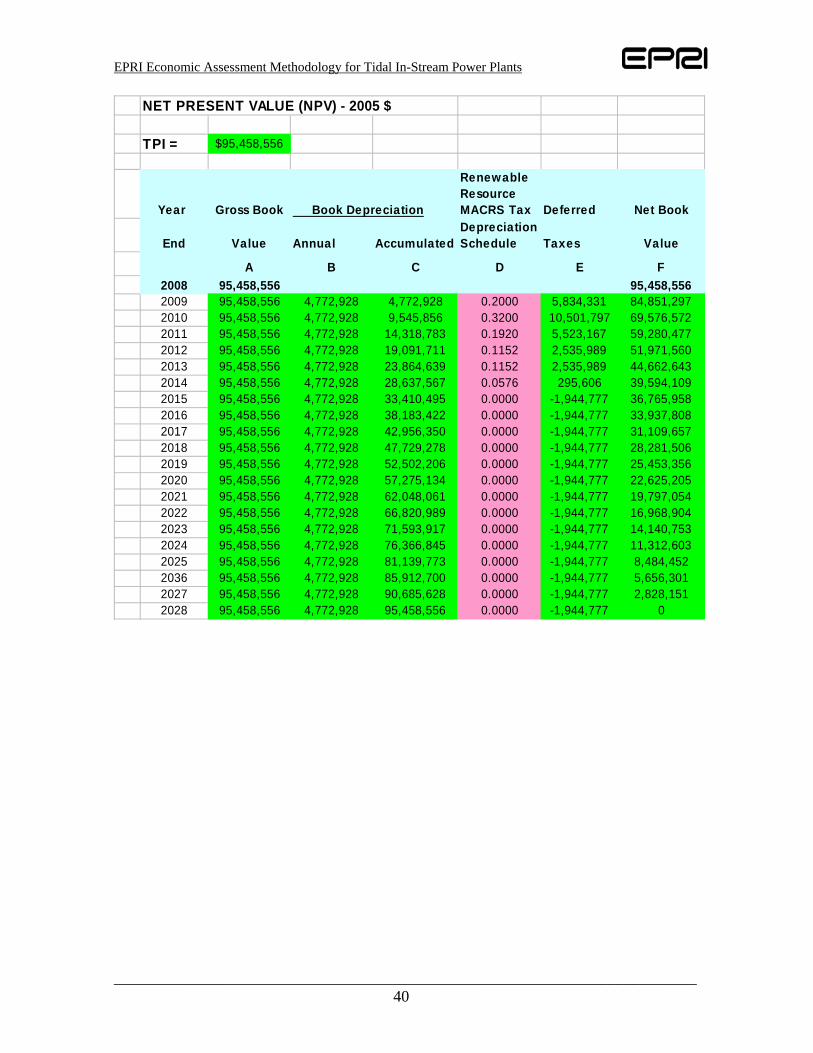
EPRI Economic Assessment Methodology for Tidal In-Stream Power Plants
_________________________________________________________________________ 40
NET PRESENT VALUE (NPV) - 2005 $
TPI = $95,458,556
Year Gross Book Book Depreciation
Renewable Resource MACRS Tax Deferred Net Book
End Value Annual AccumulatedDepreciation Schedule Taxes Value
A B C D E F2008 95,458,556 95,458,5562009 95,458,556 4,772,928 4,772,928 0.2000 5,834,331 84,851,2972010 95,458,556 4,772,928 9,545,856 0.3200 10,501,797 69,576,5722011 95,458,556 4,772,928 14,318,783 0.1920 5,523,167 59,280,4772012 95,458,556 4,772,928 19,091,711 0.1152 2,535,989 51,971,5602013 95,458,556 4,772,928 23,864,639 0.1152 2,535,989 44,662,6432014 95,458,556 4,772,928 28,637,567 0.0576 295,606 39,594,1092015 95,458,556 4,772,928 33,410,495 0.0000 -1,944,777 36,765,9582016 95,458,556 4,772,928 38,183,422 0.0000 -1,944,777 33,937,8082017 95,458,556 4,772,928 42,956,350 0.0000 -1,944,777 31,109,6572018 95,458,556 4,772,928 47,729,278 0.0000 -1,944,777 28,281,5062019 95,458,556 4,772,928 52,502,206 0.0000 -1,944,777 25,453,3562020 95,458,556 4,772,928 57,275,134 0.0000 -1,944,777 22,625,2052021 95,458,556 4,772,928 62,048,061 0.0000 -1,944,777 19,797,0542022 95,458,556 4,772,928 66,820,989 0.0000 -1,944,777 16,968,9042023 95,458,556 4,772,928 71,593,917 0.0000 -1,944,777 14,140,7532024 95,458,556 4,772,928 76,366,845 0.0000 -1,944,777 11,312,6032025 95,458,556 4,772,928 81,139,773 0.0000 -1,944,777 8,484,4522036 95,458,556 4,772,928 85,912,700 0.0000 -1,944,777 5,656,3012027 95,458,556 4,772,928 90,685,628 0.0000 -1,944,777 2,828,1512028 95,458,556 4,772,928 95,458,556 0.0000 -1,944,777 0

EPRI Economic Assessment Methodology for Tidal In-Stream Power Plants
_________________________________________________________________________ 41
TPI = $95,458,556
End of
Year Net Book
Returns to Equity Common
Returns to Equity
PrefInterest on Debt
Book Dep
Income Tax on Equity Return
Fed PTC and REC
Capital Revenue
Req'ts
A B C D E F H I
2009 84,851,297 5,735,948 1,158,220 2,227,347 4,772,928 7,221,115 4,266,240 16,849,3182010 69,576,572 4,703,376 949,720 1,826,385 4,772,928 9,852,995 4,266,240 17,839,1652011 59,280,477 4,007,360 809,179 1,556,113 4,772,928 6,040,036 4,266,240 12,919,3752012 51,971,560 3,513,277 709,412 1,364,253 4,772,928 3,709,475 4,266,240 9,803,1062013 44,662,643 3,019,195 609,645 1,172,394 4,772,928 3,433,047 4,266,240 8,740,9692014 39,594,109 2,676,562 540,460 1,039,345 4,772,928 1,700,752 4,266,240 6,463,8062015 36,765,958 2,485,379 501,855 965,106 4,772,928 53,190 4,266,240 4,512,2182016 33,937,808 2,294,196 463,251 890,867 4,772,928 -53,773 4,266,240 4,101,2292017 31,109,657 2,103,013 424,647 816,628 4,772,928 -160,735 4,266,240 3,690,2412018 28,281,506 1,911,830 386,043 742,390 4,772,928 -267,698 4,266,240 3,279,2522019 25,453,356 1,720,647 347,438 668,151 4,772,928 -374,661 1,939,200 5,195,3032020 22,625,205 1,529,464 308,834 593,912 4,772,928 -481,624 1,939,200 4,784,3142021 19,797,054 1,338,281 270,230 519,673 4,772,928 -588,586 1,939,200 4,373,3252022 16,968,904 1,147,098 231,626 445,434 4,772,928 -695,549 1,939,200 3,962,3362023 14,140,753 955,915 193,021 371,195 4,772,928 -802,512 1,939,200 3,551,3472024 11,312,603 764,732 154,417 296,956 4,772,928 -909,475 1,939,200 3,140,3582025 8,484,452 573,549 115,813 222,717 4,772,928 -1,016,437 1,939,200 2,729,3692026 5,656,301 382,366 77,209 148,478 4,772,928 -1,123,400 1,939,200 2,318,3802027 2,828,151 191,183 38,604 74,239 4,772,928 -1,230,363 1,939,200 1,907,3912028 0 0 0 0 4,772,928 -1,337,326 1,939,200 1,496,402Sum of Annual Capital Revenue Requirem ents 121,657,203

EPRI Economic Assessment Methodology for Tidal In-Stream Power Plants
_________________________________________________________________________ 42
FIXED CHARGE RATE (FCR) - NOMINAL AND REAL LEVELIZED - 2005$
TPI = $95,458,556
End of
Capital Revenue
Req'tsPresent
Worth Factor
Product of Columns A
and B
Capital Revenue
Req'ts
Present Worth Factor
Product of Columns D
and EYear Nominal Nominal Real Real
A B C D E F
2009 16,849,318 0.6910 11,643,028 14,970,400 0.7777 11,643,0282010 17,839,165 0.6300 11,239,035 15,388,220 0.7304 11,239,0352011 12,919,375 0.5744 7,421,077 10,819,773 0.6859 7,421,0772012 9,803,106 0.5237 5,134,049 7,970,822 0.6441 5,134,0492013 8,740,969 0.4775 4,173,754 6,900,201 0.6049 4,173,7542014 6,463,806 0.4353 2,814,016 4,953,969 0.5680 2,814,0162015 4,512,218 0.3969 1,791,015 3,357,514 0.5334 1,791,0152016 4,101,229 0.3619 1,484,205 2,962,815 0.5009 1,484,2052017 3,690,241 0.3300 1,217,603 2,588,260 0.4704 1,217,6032018 3,279,252 0.3008 986,499 2,233,011 0.4418 986,4992019 5,195,303 0.2743 1,424,963 3,434,707 0.4149 1,424,9632020 4,784,314 0.2501 1,196,419 3,070,869 0.3896 1,196,4192021 4,373,325 0.2280 997,117 2,725,311 0.3659 997,1172022 3,962,336 0.2079 823,676 2,397,278 0.3436 823,6762023 3,551,347 0.1895 673,084 2,086,042 0.3227 673,0842024 3,140,358 0.1728 542,658 1,790,902 0.3030 542,6582025 2,729,369 0.1575 430,012 1,511,185 0.2846 430,0122026 2,318,380 0.1436 333,023 1,246,244 0.2672 333,0232027 1,907,391 0.1310 249,804 995,453 0.2509 249,8042028 1,496,402 0.1194 178,681 758,215 0.2357 178,681
121,657,203 54,753,718 92,161,195 54,753,718
Nominal $ Real $
54,753,718 54,753,7183% 3%
9.68% 6.49%
0.1149079 0.090654358
6,291,635 4,963,66395,458,556 95,458,556
0.0659 0.0520
1. The present value is at the beginning of 2006 and results from the sum of the products of the annual present value factors times the annual requirements
3. After Tax Discount Rate = i
5. The levelized annual charges (end of year) = Present Value (Item 1) * Capital Recovery Factor (Item 4)
7. The levelized annual fixed charge rate (levelized annual charges divided by the booked cost)
6. Booked Cost
2. Escalation Rate
4. Capital recovery factor value = i(1+i)n/(1+i)n-1 where book life = n and discount rate = i
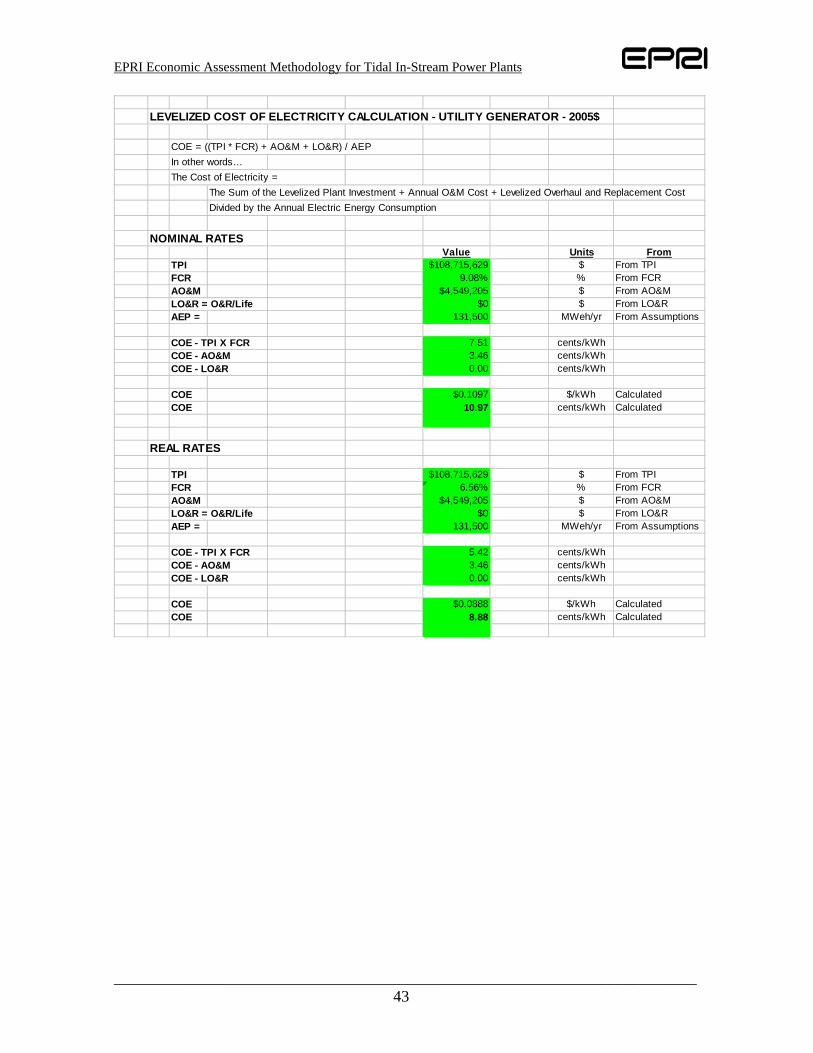
EPRI Economic Assessment Methodology for Tidal In-Stream Power Plants
_________________________________________________________________________ 43
LEVELIZED COST OF ELECTRICITY CALCULATION - UTILITY GENERATOR - 2005$
COE = ((TPI * FCR) + AO&M + LO&R) / AEPIn other words…The Cost of Electricity =
The Sum of the Levelized Plant Investment + Annual O&M Cost + Levelized Overhaul and Replacement CostDivided by the Annual Electric Energy Consumption
NOMINAL RATESValue Units From
TPI $108,715,629 $ From TPIFCR 9.08% % From FCRAO&M $4,549,205 $ From AO&MLO&R = O&R/Life $0 $ From LO&RAEP = 131,500 MWeh/yr From Assumptions
COE - TPI X FCR 7.51 cents/kWhCOE - AO&M 3.46 cents/kWhCOE - LO&R 0.00 cents/kWh
COE $0.1097 $/kWh CalculatedCOE 10.97 cents/kWh Calculated
REAL RATES
TPI $108,715,629 $ From TPIFCR 6.56% % From FCRAO&M $4,549,205 $ From AO&MLO&R = O&R/Life $0 $ From LO&RAEP = 131,500 MWeh/yr From Assumptions
COE - TPI X FCR 5.42 cents/kWhCOE - AO&M 3.46 cents/kWhCOE - LO&R 0.00 cents/kWh
COE $0.0888 $/kWh CalculatedCOE 8.88 cents/kWh Calculated

EPRI Economic Assessment Methodology for Tidal In-Stream Power Plants
_________________________________________________________________________ 44
Appendix B MG Worksheet
The MG Economic Assessment Calculations are is implemented as an Excel Workbook with Nine (9) tabs or sheets and calculates the cost of electricity (COE) for a regulated municipal generator (MG). The capital cost and O&M cost numbers shown in this worksheet are for illustrative purposes; they DO NOT represent the cost of a tidal plant in any particular state or province.
Instructions
Tab 1. Instructions
Tab 2. Total Production Cost (TPC) and Annual Operation and Maintenance Cost
Tab 3. Assumptions
Tab 4. Net present Value (NPV)
Tab 5. Capital Recovery Rate (CR)
Tab 6. Fixed Charge Rate (FCR)
Tab 7. Cost of Electricity (COE)

EPRI Economic Assessment Methodology for Tidal In-Stream Power Plants
_________________________________________________________________________ 45
INSTRUCTIONSIndicates Input Cell (either input or use default values)Indicates a Calculated Cell (do not input any values)
Sheet 1. TPC/TPI (Total Plant Cost/Total Plant Investment)a) Enter Component Unit Cost and No. of Units per Systemb) Worksheet sums component costs to get TPC c) Adds the value of the construction loan payments to get TPIa) Enter Labor Hrs and and Parts Cost by O&M inc overhaul and refitc) Worksheet Calculates Insurance and Total Annual O&M Cost
Sheet 3. O&R (Overhaul and Replacement Cost)a) Enter Year of Cost and O&R Cost per Itemb) Worksheets calculates the present value of the O&R costs
Sheet 4. Assumptions (Financial)a) Enter project and financial assumptions or leave default values
Sheet 5. NPV (Net Present Value)A Gross Book Value = TPIB Annual Book Depreciation = Gross Book Value/Book LifeC Cumulative DepreciationD MACRS 5 Year Depreciation Tax Schedule AssumptionE Deferred Taxes = (Gross Book Value X MACRS Rate - Annual
Book Depreciation) X Debt Financing RateF Net Book Value = Previous Year Net Book Value - Annual Book
Depreciation - Deferred Tax for that YearSheet 6. CRR (Capital Revenue Requirements)
A Net Book Value for Column F of NPV WorksheetB Common Equity = Net Book X Common Equity Financing
Share X Common Equity Financing RateC Preferred Equity = Net Book X Preferred Equity Financing
Share X Preferred Equity Financing RateD Debt = Net Book X Debt Financing Share X Debt Financing RateE Annual Book Depreciation = Gross Book Value/Book LifeF Income Taxes = (Return on Common Equity + Return of Preferred Equity -
Interest on Debt + Deferred Taxes) X (Comp Tax Rate/(1-Comp Tax Rate))G Property Taxes and Insurance Expense = H Calculates Investment and Production Tax Credit RevenuesI Capital Revenue Req'ts = Sum of Columns B through G
Sheet 7. FCR (Fixed Charge Rate)A Nominal Rates Capital Revenue Req'ts from Columnn H of Previous WorksheetB Nominal Rate Present Worth Factor = 1 / (1 + After Tax Discount Rate)C Nominal Rate Product of Columns A and B = A * BD Real Rates Capital Revenue Req'ts from Columnn H of Previous WorksheetE Real Rates Present Worth Factor = 1 / (1 + After Tax Discount Rate - Inflation Rate)F Real Rates Product of Columns A and B = A * B
Sheet 8. Calculates COE (Cost of Electricity)COE = ((TPI * FCR) + AO&M + LO&R) / AEPIn other words…The Cost of Electricity =
The Sum of the Levelized Plant Investment + Annual O&M Cost including Levelized Overhaul and Replacement Cost Divided by the Annual Electric Energy Consumption

EPRI Economic Assessment Methodology for Tidal In-Stream Power Plants
_________________________________________________________________________ 46
TOTAL PLANT COST (TPC) - 2005$
Procurement Power Conversion System 40 $799,712 $31,988,480 Structural Elements 40 $747,281 $29,891,240 Subsea Cables Lot $2,984,000 $2,984,000 Turbine Installation 40 $358,862 $14,354,480 Subsea Cable Installation Lot $10,492,000 $10,492,000 Onshore Grid Interconnection Lot $500,000 $500,000
TOTAL $90,210,200
TOTAL PLANT INVESTMENT (TPI) - 2005 $
End of Year
Total Cash Expended
TPC (2005$)
Before Tax Construction Loan Cost at
Debt Financing
Rate
2005 Value of Construction
Loan Payments
TOTAL PLANT INVESTMENT
2005$2007 $45,105,100 $2,255,255 $2,045,583 $47,150,6832008 $45,105,100 $2,255,255 $1,948,174 $47,053,274Total $90,210,200 $4,510,510 $3,993,757 $94,203,957
ANNUAL OPERATING AND MAINTENANCE COST (AO&M) - 2005$
Costs Yrly Cost AmountLabor and Parts $2,212,644 $2,212,644Insurance (1.5% of TPC) $1,353,153 $1,353,153
Total $3,565,797
TPC Component Unit Unit Cost Total Cost (2004$)

EPRI Economic Assessment Methodology for Tidal In-Stream Power Plants
_________________________________________________________________________ 47
FINANCIAL ASSUMPTIONS (default assumptions in pink background - without line numbers are calculated values)
1 Rated Plant Capacity © 45.7 MW2 Annual Electric Energy Production (AEP) 119,700 MWeh/yr
Therefore, Capacity Factor 29.88 %3 Year Constant Dollars 2004 Year4 Federal Tax Rate 0 %5 State Example State6 State Tax Rate 0 %
Composite Tax Rate (t) 0t/(1-t) 0.0000
7 Book Life 20 Years8 Construction Financing Rate 59 Common Equity Financing Share 0 %10 Preferred Equity Financing Share 0 %11 Debt Financing Share 100 %12 Common Equity Financing Rate 0 %13 Preferred Equity Financing Rate 0 %14 Debt Financing Rate 4.1 %
Nominal Discount Rate Before-Tax 4.1 %Nominal Discount Rate After-Tax 4.1 %
15 Inflation Rate = 3% 3 %Real Discount Rate Before-Tax 1.07 %Real Discount Rate After-Tax %
16 Federal Investment Tax Credit 0 % 1st year only17 Federal Production Tax Credit 0 $/kWh for 1st 10 years18 State Investment Tax Credit 0 % of TPI up to $2.5M19 State Investment Tax Credit Limit 0 Credit - 1st year only for > 20 State Production Tax Credit 0 $/kWh for 1st 10 years21 REPI or CREB 0.0173 $/kWh for 1st 10 years for U22 Renewable Energy Credit 0.0250 $/kWh
REPI Calculation Area
PPI Change in inflationhttp:/ /www.gpec.org/InfoCenter/Topics/Economy/USInf lat ion.html
REPI incentive1993 1.50 cents/kWh
1994 1.30% 1994 1.52 cents/kWh
1995 3.60% 1995 1.57 cents/kWh
1996 2.40% 1996 1.61 cents/kWh
1997 -0.10% 1997 1.61 cents/kWh
1998 -2.50% 1998 1.57 cents/kWh
1999 0.90% 1999 1.58 cents/kWh 2000 5.70% 2000 1.67 cents/kWh
2001 1.10% 2001 1.69 cents/kWh 2002 -2.30% 2002 1.65 cents/kWh 2003 5.30% 2003 1.74 cents/kWh 2004 -0.70% 2004 1.73 cents/kWhPost 2004, assume inflation rate of line 15

EPRI Economic Assessment Methodology for Tidal In-Stream Power Plants
_________________________________________________________________________ 48
NET PRESENT VALUE (NPV) - 2005 $
TPI = $94,203,957
Year Gross Book Book Depreciation
Renewable Resource MACRS Tax Deferred Net Book
End Value Annual AccumulatedDepreciation Schedule Taxes Value
A B C D E F2008 94,203,957 94,203,9572009 94,203,957 4,710,198 4,710,198 0 0 89,493,7592010 94,203,957 4,710,198 9,420,396 0 0 84,783,5612011 94,203,957 4,710,198 14,130,594 0 0 80,073,3632012 94,203,957 4,710,198 18,840,791 0 0 75,363,1652013 94,203,957 4,710,198 23,550,989 0 0 70,652,9682014 94,203,957 4,710,198 28,261,187 0 0 65,942,7702015 94,203,957 4,710,198 32,971,385 0 0 61,232,5722016 94,203,957 4,710,198 37,681,583 0 0 56,522,3742017 94,203,957 4,710,198 42,391,781 0 0 51,812,1762018 94,203,957 4,710,198 47,101,978 0 0 47,101,9782019 94,203,957 4,710,198 51,812,176 0 0 42,391,7812020 94,203,957 4,710,198 56,522,374 0 0 37,681,5832021 94,203,957 4,710,198 61,232,572 0 0 32,971,3852022 94,203,957 4,710,198 65,942,770 0 0 28,261,1872023 94,203,957 4,710,198 70,652,968 0 0 23,550,9892024 94,203,957 4,710,198 75,363,165 0 0 18,840,7912025 94,203,957 4,710,198 80,073,363 0 0 14,130,5942036 94,203,957 4,710,198 84,783,561 0 0 9,420,3962027 94,203,957 4,710,198 89,493,759 0 0 4,710,1982028 94,203,957 4,710,198 94,203,957 0 0 0

EPRI Economic Assessment Methodology for Tidal In-Stream Power Plants
_________________________________________________________________________ 49
CAPITAL REVENUE REQUIREMENTS - 2005$
TPI = $94,203,957
End of
Year Net Book
Returns to Equity Common
Returns to Equity
PrefInterest on Debt
Book Dep
Income Tax on Equity Return REPI
Capital Revenue
Req'ts
A B C D E F H I
2009 89,493,759 0 0 4,474,688 4,710,198 0 3,878,400 5,306,4862010 84,783,561 0 0 4,239,178 4,710,198 0 3,878,400 5,070,9762011 80,073,363 0 0 4,003,668 4,710,198 0 3,878,400 4,835,4662012 75,363,165 0 0 3,768,158 4,710,198 0 3,878,400 4,599,9562013 70,652,968 0 0 3,532,648 4,710,198 0 3,878,400 4,364,4462014 65,942,770 0 0 3,297,138 4,710,198 0 3,878,400 4,128,9362015 61,232,572 0 0 3,061,629 4,710,198 0 3,878,400 3,893,4262016 56,522,374 0 0 2,826,119 4,710,198 0 3,878,400 3,657,9172017 51,812,176 0 0 2,590,609 4,710,198 0 3,878,400 3,422,4072018 47,101,978 0 0 2,355,099 4,710,198 0 3,878,400 3,186,8972019 42,391,781 0 0 2,119,589 4,710,198 0 1,939,200 4,890,5872020 37,681,583 0 0 1,884,079 4,710,198 0 1,939,200 4,655,0772021 32,971,385 0 0 1,648,569 4,710,198 0 1,939,200 4,419,5672022 28,261,187 0 0 1,413,059 4,710,198 0 1,939,200 4,184,0572023 23,550,989 0 0 1,177,549 4,710,198 0 1,939,200 3,948,5472024 18,840,791 0 0 942,040 4,710,198 0 1,939,200 3,713,0372025 14,130,594 0 0 706,530 4,710,198 0 1,939,200 3,477,5282026 9,420,396 0 0 471,020 4,710,198 0 1,939,200 3,242,0182027 4,710,198 0 0 235,510 4,710,198 0 1,939,200 3,006,5082028 0 0 0 0 4,710,198 0 1,939,200 2,770,998Sum of Annual Capital Revenue Requirem ents 80,774,836

EPRI Economic Assessment Methodology for Tidal In-Stream Power Plants
_________________________________________________________________________ 50
FIXED CHARGE RATE (FCR) - NOMINAL AND REAL LEVELIZED - 2005$
TPI = $94,203,957
End of
Capital Revenue
Req'tsPresent
Worth Factor
Product of Columns A
and B
Capital Revenue
Req'ts
Present Worth Factor
Product of Columns D
and EYear Nominal Nominal Real Real
A B C D E F
2009 5,306,486 0.8227 4,365,659 4,714,744 0.9260 4,365,6592010 5,070,976 0.7835 3,973,242 4,374,268 0.9083 3,973,2422011 4,835,466 0.7462 3,608,299 4,049,627 0.8910 3,608,2992012 4,599,956 0.7107 3,269,103 3,740,185 0.8740 3,269,1032013 4,364,446 0.6768 2,954,029 3,445,334 0.8574 2,954,0292014 4,128,936 0.6446 2,661,549 3,164,486 0.8411 2,661,5492015 3,893,426 0.6139 2,390,226 2,897,075 0.8250 2,390,2262016 3,657,917 0.5847 2,138,708 2,642,557 0.8093 2,138,7082017 3,422,407 0.5568 1,905,724 2,400,407 0.7939 1,905,7242018 3,186,897 0.5303 1,690,079 2,170,122 0.7788 1,690,0792019 4,890,587 0.5051 2,470,079 3,233,254 0.7640 2,470,0792020 4,655,077 0.4810 2,239,172 2,987,917 0.7494 2,239,1722021 4,419,567 0.4581 2,024,655 2,754,128 0.7351 2,024,6552022 4,184,057 0.4363 1,825,490 2,531,423 0.7211 1,825,4902023 3,948,547 0.4155 1,640,703 2,319,355 0.7074 1,640,7032024 3,713,037 0.3957 1,469,375 2,117,493 0.6939 1,469,3752025 3,477,528 0.3769 1,310,644 1,925,423 0.6807 1,310,6442026 3,242,018 0.3589 1,163,697 1,742,744 0.6677 1,163,6972027 3,006,508 0.3418 1,027,774 1,569,074 0.6550 1,027,7742028 2,770,998 0.3256 902,157 1,404,042 0.6425 902,157
80,774,836 45,030,365 56,183,658 45,030,365
Nominal $ Real $
45,030,365 45,030,3653% 3%
5.00% 1.94%
0.08024259 0.060813464
3,613,353 2,738,45294,203,957 94,203,957
0.0384 0.0291
1. The present value is at the beginning of 2006 and results from the sum of the products of the annual present value factors times the annual requirements
3. Discount Rate = i
5. The levelized annual charges (end of year) = Present Value (Item 1) * Capital Recovery Factor (Item 4)
7. The levelized annual fixed charge rate (levelized annual charges divided by the booked cost)
6. Booked Cost
2. Escalation Rate
4. Capital recovery factor value = i(1+i)n/(1+i)n-1 where book life = n and discount rate = i

EPRI Economic Assessment Methodology for Tidal In-Stream Power Plants
_________________________________________________________________________ 51
LEVELIZED COST OF ELECTRICITY CALCULATION - MUNICIPAL GENERATOR - 2005$
COE = ((TPI * FCR) + AO&M ) / AEPIn other words…The Cost of Electricity =
The Sum of the Levelized Plant Investment + Annual O&M Cost + Levelized Overhaul and Replacement CostDivided by the Annual Electric Energy Consumption
NOMINAL RATESValue Units From
TPI $94,203,957 $ From TPIFCR 3.84% % From FCRAO&M $3,565,797 $ From AO&MAEP = 129,280 MWeh/yr From Assumptions
COE - TPI X FCR 2.79 cents/kWhCOE - AO&M 2.76 cents/kWh
COE $0.0555 $/kWh CalculatedCOE 5.55 cents/kWh Calculated
REAL RATES
TPI $94,203,957 $ From TPIFCR 2.91% % From FCRAO&M $3,565,797 $ From AO&MAEP = 129,280 MWeh/yr From Assumptions
COE - TPI X FCR 2.12 cents/kWhCOE - AO&M 2.76 cents/kWh
COE $0.0488 $/kWh CalculatedCOE 4.88 cents/kWh Calculated

EPRI Economic Assessment Methodology for Tidal In-Stream Power Plants
_________________________________________________________________________ 52
Appendix C NUG IRR Worksheet
The NUG Economic Assessment Calculations are is implemented as an Excel Workbook with seven (7) tabs or sheets and calculates the net internal rate of return (IRR) for a non regulated merchant non utility generator (NUG). The capital cost and O&M cost numbers shown in this worksheet are for illustrative purposes; they DO NOT represent the cost of a tidal plant in any particular state or province.
Instructions
Tab 1. Instructions
Tab 2. Total Production Cost (TPC) and Annual Operation and Maintenance Cost
Tab 3. Assumptions
Tab 4. Income
Tab 5. Cash Flow and Net Internal Rate of Return (IR)

EPRI Economic Assessment Methodology for Tidal In-Stream Power Plants
_________________________________________________________________________ 53
INSTRUCTIONS
Fill in first four worksheets (or use default values) - the last two worksheets are automatically
calculated. Refer to EPRI Economic Methodology Report 002
Indicates Input Cell (either input or use default values)
Indicates a Calculated Cell (do not input any values)Sheet 1. Total Plant Cost/Total Plant Investment (TPC/TPI) - 2005$
1 Enter Component Unit Cost and No. of Units per System2 Worksheet sums component costs to get TPC 3 Worksheet adds the value of the construction loan payments to get TPI
Sheet 2. AO&M (Annual Operation and Maintenance Cost) - 2005$1 Enter Labor Hrs and Cost by O&M Type)2 Enter Parts and Supplies Cost by O&M Type)3 Worksheet Calculates Total Annual O&M Cost
Sheet 3. O&R ( Overhaul and Replacement Cost) - 2005$1 Enter Year of Cost and O&R Cost per Item2 Worksheet calculates inflation to the year of the cost of the O&R
Sheet 4. Assumptions (Project, Financial and Others)1 Enter project, financial and other assumptions or leave default values
Sheet 5. Income Statement - Assuming no capacity factor income - Current $1 2008 1st Year Energy payments = AEP X 2005 wholesale price X 97.18% (to adjust price
from 2005 to 2008 (an 2.82% decline) X Inflation from 2005 to 20082009-2011 Energy payments = AEP X Previous Year Elec Price X Annual Price
de-escalation of -1.42% X Inflation2012-2025 Energy payments = AEP X Previous Year Elec Price X 0.72% Price
escalation X Inflation2 Calculates State Investment and Prodution tax credit3 Calculates Federal Investment and Production Tax Credit 4 Scheduled O&M from TPC worksheet with inflation5 Scheduled O&R from TPC worksheet with inflation8 Earnings before EBITDA = total revenues less total operating costs9 Tax Depreciation = Assumed MACRS rate X TPI10 Interest paid = Annual interest given assumed debt interest rate and life of loan11 Taxable earnings = Tax Depreciation + Interest Paid12 State Tax = Taxable Earnings x state tax rate13 Federal Tax = (Taxable earnings - State Tax) X Federal tax rate14 Total Tax Obligation = Total State + Federal Tax
Sheet 6. Cash Flow Statement - Current $1 EBITDA2 Taxes Paid3 Cash Flow From Operations = EBITDA - Taxes Paid4 Debt Service = Principal + Interest paid on the debt loan5 Net Cash Flow after Tax
Year of Start of Ops minus 1 = Equity amountYear of Start of Ops = Cash flow from ops - debt serviceYear of Start of Ops Plus 1 to N = Cash flow from ops - debt service
6 Cum Net Cash Flow After Taxes = previous year net cash flow + current year net cash flow7 Cum IRR on net cash Flow After Taxes = discount rate that sets the present worth
of the net cash flows over the book life equal to the equity investment at the commercial operations

EPRI Economic Assessment Methodology for Tidal In-Stream Power Plants
_________________________________________________________________________ 54
TOTAL PLANT COST (TPC) - 2005$
Procurement Power Conversion System 40 $799,712 $31,988,480 Structural Elements 40 $747,281 $29,891,240 Subsea Cables Lot $2,984,000 $2,984,000 Turbine Installation 40 $358,862 $14,354,480 Subsea Cable Installation Lot $10,492,000 $10,492,000 Onshore Grid Interconnection Lot $500,000 $500,000
TOTAL $90,210,200
TOTAL PLANT INVESTMENT (TPI) - 2005 $
End of Year
Total Cash Expended
TPC ($2005)
Before Tax Construction Loan Cost at
Debt Financing
Rate
2005 Value of Construction
Loan Payments
TOTAL PLANT INVESTMENT(TPC + Loan
Value) ($2005)
2006 $45,105,100 $4,059,459 $3,312,630 $48,417,7302007 $45,105,100 $4,059,459 $2,992,439 $48,097,539Total $90,210,200 $8,118,918 $6,305,069 $96,515,269
ANNUAL OPERATING AND MAINTENANCE COST (AO&M) - 2005$
Costs Yrly Cost AmountLabor and Parts $2,212,644 $2,212,644Insurance (1.5% of TPC) $1,353,153 $1,353,153
Total $3,565,797
TPC Component Notes and AssumptionsUnit Unit Cost Total Cost
(2005$)

EPRI Economic Assessment Methodology for Tidal In-Stream Power Plants
_________________________________________________________________________ 55
FINANCIAL ASSUMPTIONS (default assumptions in pink background - without line numbers are calculated values)
1 Rated Plant Capacity © 100 MW2 Annual Electric Energy Production (AEP) 300,000 MWeh/yr
Therefore, Capacity Factor 34.22 %3 Year Constant Dollars 2005 Year4 Federal Tax Rate 35 %5 State Example State6 State Tax Rate 9.5 %
Composite Tax Rate (t) 0.41175 %t/(1-t) 0.7000
7 Book Life 30 Years8 Construction Financing Rate 99 Common Equity Financing Share 30 %10 Preferred Equity Financing Share 0 %11 Debt Financing Share 70 %12 Common Equity Financing Rate 17 %13 Preferred Equity Financing Rate 0 %14 Debt Financing Rate 8 %
Current $ Discount Rate Before-Tax 10.7 %Current $ Discount Rate After-Tax 8.39 %
15 Inflation rate 3 %16 Federal Investment Tax Credit 10 % 1st year only17 Federal Production Tax Credit 0.019 $/kWh for 1st 10 yrs18 State Investment Tax Credit % 1st year only
% of TPI up to $2.5M19 State Production Tax Credit 020 Wholesale electricity price - 2005$ 0.0926 $/kWh21 Decline in wholesale elec. price from 2005 to 2008 4.20 %22 Annual decline in wholesale price, 2009 - 2011 1.42 %23 Annual increase in wholesale price, 2012 - 2025 0.72 %24 Yearly Unscheduled O&M 5 % of Sch O&M cost25 MACRS Year 1 0.200026 MACRS Year 2 0.320027 MACRS Year 3 0.192028 MACRS Year 4 0.115229 MACRS Year 5 0.115230 MACRS Year 6 0.057631 REC Rate 0.0576 $/kWh for Project LifeElectricity Price Forecast AreaThe electricity price forecast from the EIA (Doc 002, Reference 8): "Average U.S. electricity prices, in real 2003 dollars, are expected to decline by 11% from 7.4 cents/kWh in 2003 to 6.6 cents in 2011, then rise to 7.3 cents/kWh in 2025.”
2003 7.4 7.42004 7.29
Base 2005 7.192006 7.092007 6.992008 6.89 -4.20% Decline (2005 - 2008)2009 6.792010 6.72011 6.6 6.6 -1.42% Annual Decline (2009 - 2011)2012 6.652013 6.72014 6.742015 6.792016 6.842017 6.892018 6.942019 6.992020 7.042021 7.092022 7.142023 7.22024 7.252025 7.3 7.3 0.72% Annual Increase (2012 - 2025)
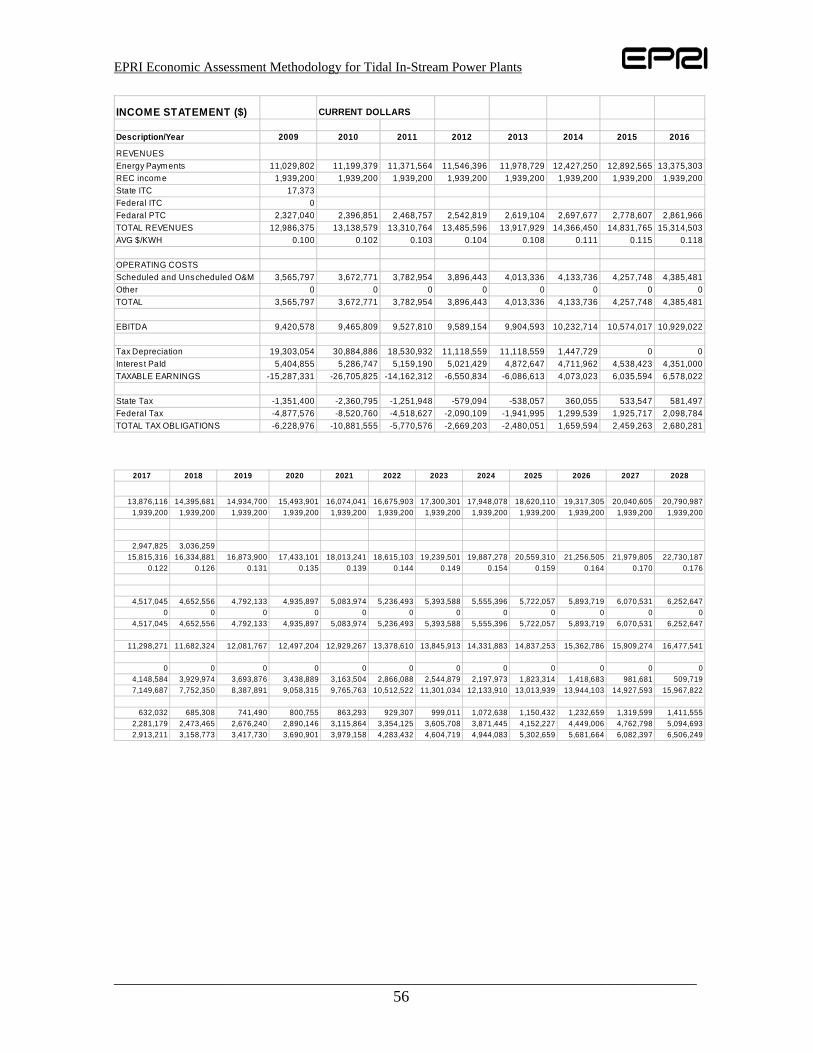
EPRI Economic Assessment Methodology for Tidal In-Stream Power Plants
_________________________________________________________________________ 56
INCOME STATEMENT ($) CURRENT DOLLARS
Description/Year 2009 2010 2011 2012 2013 2014 2015 2016
REVENUESEnergy Paym ents 11,029,802 11,199,379 11,371,564 11,546,396 11,978,729 12,427,250 12,892,565 13,375,303REC incom e 1,939,200 1,939,200 1,939,200 1,939,200 1,939,200 1,939,200 1,939,200 1,939,200State ITC 17,373Federal ITC 0Fedaral PTC 2,327,040 2,396,851 2,468,757 2,542,819 2,619,104 2,697,677 2,778,607 2,861,966TOTAL REVENUES 12,986,375 13,138,579 13,310,764 13,485,596 13,917,929 14,366,450 14,831,765 15,314,503AVG $/KWH 0.100 0.102 0.103 0.104 0.108 0.111 0.115 0.118
OPERATING COSTSScheduled and Unscheduled O&M 3,565,797 3,672,771 3,782,954 3,896,443 4,013,336 4,133,736 4,257,748 4,385,481Other 0 0 0 0 0 0 0 0TOTAL 3,565,797 3,672,771 3,782,954 3,896,443 4,013,336 4,133,736 4,257,748 4,385,481
EBITDA 9,420,578 9,465,809 9,527,810 9,589,154 9,904,593 10,232,714 10,574,017 10,929,022
Tax Depreciation 19,303,054 30,884,886 18,530,932 11,118,559 11,118,559 1,447,729 0 0Interes t PaId 5,404,855 5,286,747 5,159,190 5,021,429 4,872,647 4,711,962 4,538,423 4,351,000TAXABLE EARNINGS -15,287,331 -26,705,825 -14,162,312 -6,550,834 -6,086,613 4,073,023 6,035,594 6,578,022
State Tax -1,351,400 -2,360,795 -1,251,948 -579,094 -538,057 360,055 533,547 581,497Federal Tax -4,877,576 -8,520,760 -4,518,627 -2,090,109 -1,941,995 1,299,539 1,925,717 2,098,784TOTAL TAX OBLIGATIONS -6,228,976 -10,881,555 -5,770,576 -2,669,203 -2,480,051 1,659,594 2,459,263 2,680,281
2017 2018 2019 2020 2021 2022 2023 2024 2025 2026 2027 2028
13,876,116 14,395,681 14,934,700 15,493,901 16,074,041 16,675,903 17,300,301 17,948,078 18,620,110 19,317,305 20,040,605 20,790,9871,939,200 1,939,200 1,939,200 1,939,200 1,939,200 1,939,200 1,939,200 1,939,200 1,939,200 1,939,200 1,939,200 1,939,200
2,947,825 3,036,25915,815,316 16,334,881 16,873,900 17,433,101 18,013,241 18,615,103 19,239,501 19,887,278 20,559,310 21,256,505 21,979,805 22,730,187
0.122 0.126 0.131 0.135 0.139 0.144 0.149 0.154 0.159 0.164 0.170 0.176
4,517,045 4,652,556 4,792,133 4,935,897 5,083,974 5,236,493 5,393,588 5,555,396 5,722,057 5,893,719 6,070,531 6,252,6470 0 0 0 0 0 0 0 0 0 0 0
4,517,045 4,652,556 4,792,133 4,935,897 5,083,974 5,236,493 5,393,588 5,555,396 5,722,057 5,893,719 6,070,531 6,252,647
11,298,271 11,682,324 12,081,767 12,497,204 12,929,267 13,378,610 13,845,913 14,331,883 14,837,253 15,362,786 15,909,274 16,477,541
0 0 0 0 0 0 0 0 0 0 0 04,148,584 3,929,974 3,693,876 3,438,889 3,163,504 2,866,088 2,544,879 2,197,973 1,823,314 1,418,683 981,681 509,7197,149,687 7,752,350 8,387,891 9,058,315 9,765,763 10,512,522 11,301,034 12,133,910 13,013,939 13,944,103 14,927,593 15,967,822
632,032 685,308 741,490 800,755 863,293 929,307 999,011 1,072,638 1,150,432 1,232,659 1,319,599 1,411,5552,281,179 2,473,465 2,676,240 2,890,146 3,115,864 3,354,125 3,605,708 3,871,445 4,152,227 4,449,006 4,762,798 5,094,6932,913,211 3,158,773 3,417,730 3,690,901 3,979,158 4,283,432 4,604,719 4,944,083 5,302,659 5,681,664 6,082,397 6,506,249

EPRI Economic Assessment Methodology for Tidal In-Stream Power Plants
_________________________________________________________________________ 57
CASH FLOW STATEMENT
Description/Year 2007 2008 2009 2010 2011 2012 2013
EBITDA 9,420,578 9,465,809 9,527,810 9,589,154 9,904,593
Taxes Paid -6,228,976 -10,881,555 -5,770,576 -2,669,203 -2,480,051
CASH FLOW FROM OPS 15,649,554 20,347,364 15,298,386 12,258,357 12,384,645
Debt Service -6,881,205 -6,881,205 -6,881,205 -6,881,205 -6,881,205
NET CASH FLOW AFTER TAX -28,954,581 8,768,348 13,466,158 8,417,180 5,377,151 5,503,439CUM NET CASH FLOW -28,954,581 -20,186,232 -6,720,074 1,697,106 7,074,258 12,577,697
2014 2015 2016 2017 2018 2019 2020 2021
10,232,714 10,574,017 10,929,022 11,298,271 11,682,324 12,081,767 12,497,204 12,929,267
1,659,594 2,459,263 2,680,281 2,913,211 3,158,773 3,417,730 3,690,901 3,979,158
8,573,120 8,114,754 8,248,742 8,385,059 8,523,552 8,664,037 8,806,303 8,950,110
-6,881,205 -6,881,205 -6,881,205 -6,881,205 -6,881,205 -6,881,205 -6,881,205 -6,881,205
1,691,915 1,233,549 1,367,536 1,503,854 1,642,347 1,782,831 1,925,098 2,068,90414,269,612 15,503,161 16,870,697 18,374,551 20,016,898 21,799,729 23,724,827 25,793,731
2022 2023 2024 2025 2026 2027 2028
13,378,610 13,845,913 14,331,883 14,837,253 15,362,786 15,909,274 16,477,541
4,283,432 4,604,719 4,944,083 5,302,659 5,681,664 6,082,397 6,506,249
9,095,178 9,241,194 9,387,800 9,534,593 9,681,121 9,826,877 9,971,292
-6,881,205 -6,881,205 -6,881,205 -6,881,205 -6,881,205 -6,881,205 -6,881,205
2,213,973 2,359,988 2,506,594 2,653,388 2,799,916 2,945,672 3,090,08728,007,704 30,367,692 32,874,287 35,527,675 38,327,591 41,273,262 44,363,349
IRR ON NET CASH FLOW AFTER TAX 20.8%