01 - prelims - groundwork homepage futures - text.pdf · refining environmental injustice 173...
TRANSCRIPT

i
Toxic Futures

ii

iii
Toxic Futures
South Africa in the Crises of Energy,Environment and Capital
David Hallowes

iv
Published in 2011 by University of KwaZulu-Natal Press
Private Bag X01
Scottsville, 3209
South Africa
Email: [email protected]
Website: www.ukznpress.co.za
© 2011 groundWork
All rights reserved. No part of this publication may be reproduced or transmitted in any
form or by any means, electronic or mechanical, including photocopying, recording, or any
information storage and retrieval system, without prior permission in writing from
University of KwaZulu-Natal Press.
ISBN: 978-1-86914-211-7
Managing editor: Sally Hines
Editor: Jane Argall
Typesetter: Patricia Comrie
Proofreader: Alison Lockhart
Indexer: Christopher Merrett
Cover design: publicide
Cover photograph: South Africa’s biggest oil refinery operated by Shell and BP amongst
the residential neighbourhoods in south Durban during a plant upset in
October 2002 (by groundWork)
groundWork is a non-profit environmental justice service and development organisation
working primarily in South Africa but increasingly in Southern Africa.
groundWork seeks to improve the quality of life of people through assisting civil society
to have a greater impact on environmental governance. groundWork places particular
emphasis on assisting vulnerable and previously disadvantaged people who are most
affected by environmental injustices. groundWork is Friends of the Earth, South Africa.
Printed and bound by Interpak Books, Pietermaritzburg
v
Contents
Foreword by Nnimmo Bassey vii
Acknowledgements xi
Abbreviations xii
Introduction 1
Unequal South Africa 4
Carbon economy 8
The global scale of ecological debt 14
1 Elite crisis 19
Imperial crisis 20
Energy in crisis 30
Environmental crisis 37
Dust and ashes 41
2 The Vaal in South Africa 50
The concentration of power 51
Fronts of environmental injustice 55
Another Vaal 76
3 New South Africa 79
Negotiating the future 80
Environmental policy 91
Paint it green 104

vi
4 The toxic cradle of production 108
The sacrifice to mining 108
Steeling the future 119
Power to aluminium 123
Toxics to cement 127
Leaving ruin 131
5 Peak poison 133
Failing future 134
6 The chains of petro production 165
Africa’s oil rush 165
Refining environmental injustice 173
Chemicals and plastic 189
7 Power trip 195
Centralising power 197
Darkest Cape 202
The logic of an elite future 220
8 Future power 222
Things fall apart 223
Remaking the coal economy 230
Terminal logic 248
9 Driving climate change 251
False dealings 252
South Africa’s offer 264
10 Change coming 280
For people’s power 282
Notes 304
Select bibliography 324
Index 337

vii
Foreword
From its first publication in 2002, the annual groundWork reports have become
vital contributions to the unravelling and understanding of the swirl of predatory
forces striving to pull the disposed and marginalised into the societal black hole. It
is significant to note that the first issue came out in the year when the world marked
a decade after the Earth Summit in Rio in 1992. The anniversary was held in
Johannesburg and marked the receding of memories of a dream for a sustainable
future. The World Summit on Sustainable Development (WSSD) could best have
been described as a ‘corporate summit’. And so it was that as we stamped the path
from Alexandra to Sandton, official participants to the summit were circling a
mounted car, the sleek symbol of corporate power, perched conspicuously in the
courtyard of their conference venue.
It is fitting that Toxic Futures should be released on the eve of another pivotal
event dragging the world to South Africa – the 17th Conference of Parties (COP
17) to the United Nations Framework Convention on Climate Change. Many suspect
that with a thematic focus on ‘green economy’ and ‘poverty reduction’, Rio+20 or
the twentieth anniversary of the Earth Summit forthcoming in Rio in 2012 will
lean heavily on the planks erected by COP 17. The significance of the piggybacking
will be that the world would have set the course of the coming decades on a fabric
of false solutions, of negating sustainability, securing a tighter grip of the corporate
world on the political and economic spheres of life and placing the struggling
people of the world on a dicey battle for survival.
The groundWork reports are life jackets thrown into shark-infested murky
waters from which the disposed and the powerless yell for solidarity. As I read
through the chapters of this book, I get drawn into the stories and feel as though
I was standing on the fencelines with the fighters for environmental justice, be they
in south Durban, in the Vaal or in the Karoo. And I have met some of them in

viii
person and continue to meet with them as the assaults on their rights persist and
the resistance to the contrary waves require eternal vigilance.
I have been to south Durban communities where kids pack inhalers to survive
asthmatic attacks as though they were packing lunch boxes for school. Memories
of the South African police arresting people and confiscating posters of my poems
(including ‘We thought it was oil but it was blood’) during protests at the WSSD in
2002 remain as the most poignant reminder of the gravity of the challenges faced
by dissenters in a period when peoples thought freedom bells were ringing over
the tailings pits, the crammed townships and the acid drainages. This book may be
based on the South African context, but you will see the direct application in many
ways to the situation all over Africa.
Peak oil has not weaned the world from crude oil. Not yet. The decrease in
cheap oil has meant the clawing deeper into dirty energy sources. While sweet
crude has never been sweet, heavy crude is never too heavy for an industry whose
profits continue to soar because they continually externalise the costs to poor people
and their environments, while excluding the same marginalised people from the
decisions that promote how their territories are accessed and how their resources
are extracted and used.
Toxic economies suck the blood of the people – their labour, resources, their
well-being as well as their socio-political spaces. This is why one can see this book
as a handbook for direct struggles by environmental justice advocates, not just
across Africa but across the world. We are united by the attacks on our environments
and livelihoods. The struggles against environmental pollution, of land grabs, sea
grabs and sky grabs are all one. There are no legislated boundaries to ecological
problems. We are all on one planet.
We applaud groundWork and UKZN Press on the achievements accomplished
by this publication. David Hallowes’s keen insight into the interlinkages of issues
shine through and we all benefit from these. The holistic approach adopted in the
analyses of the environmental justice deficit in South Africa as presented here
gives users a quick guide to figuring out what is happening elsewhere on the
continent, from the Eastern to the Western, and from Northern to Southern regions.
Toxic Futures helps us to connect the dots between the many crises confronting the
world today. It also helps us to see why wars and violence are not inevitable
occurrences but are necessarily engineered to keep peoples dislocated, disunited
and open to further exploitation.
As an imperial force on the continent, South Africa provides examples of what
happens at both ends of the pipe of resource extraction and processes. The gold,

ix
coal, platinum and other mines show the damage and the levels of toxicity of the
sector and that the concept of sustainable mining is nothing but an oxymoron. It
also highlights the corruption (in every sense) that sustains the sector. The refining
and manufacturing prowess of South Africa has translated into serious health
breaches through pollution and at places this has saddled impacted communities
with the duties of regulation enforcements. This happens because official regulators
appear to have their hands ‘tied’ and are often unwilling to see or do what needs to
be done.
Toxic Futures urges us to understand that we are bound together by our humanity.
Competition, dispossession and accumulation will continue to fatten the pockets
of the polluters and emasculate the regulators while exposing our people to grave
dangers and deeper impoverishment. The fight for environmental justice is not
‘the other fight’ – it is our fight.
Nnimmo Bassey
Executive Director, Environmental Rights Action, Nigeria
Chair, Friends of the Earth

x

xi
Acknowledgements
This book is based on the groundWork reports, produced annually since 2002. The
first four of those reports were co-authored by Mark Butler and the next three by
Victor Munnik. This text uses their work as much as mine although they are not
responsible for what I have done with it here.
The groundWork reports had many helpers. Each carries detailed acknowledge-
ments. They were informed and inspired by people from fenceline organisations
and the wider environmental justice movement. Particular thanks are due to
members of the South Durban Community Environmental Alliance and the Vaal
Environmental Justice Alliance who showed us around their neighbourhoods and
shared their thinking with us.
It has been a pleasure to work with Bobby Peek, Gill Addison and the
groundWork team over the years. They have enabled a sustained documentation
of environmental injustice and people’s struggles for justice over the first decade
of the twenty-first century. They presented us with challenging topics and supported
the research process both intellectually and practically with the organisation of
workshops, meetings and visits. Best of all, they put these texts to work in their
campaigns and their engagement with allied organisations.
Thanks to Sally Hines and the team at UKZN Press for seeing this book through
to publication and giving me good advice along the way. Thanks also to the reviewers
whose comments and criticisms on the very long first draft were invaluable and
whose affirmation of the value of the work helped sustain me through a substantial
revision.
Finally, groundWork would like to thank the donors who have supported the
groundWork reports, particularly Hivos, Evangelischer Entwicklungsdienst and
Sigrid Rausing Trust.
xii
Abbreviations
AbM Abahlali baseMjondolo
AfDB African Development Bank
ANC African National Congress
AR4 Fourth Assessment Report
ASGISA Accelerated and Shared Growth Initiative for South Africa
ASPO Association for the Study of Peak Oil
b/d barrels a day
BEE Black Economic Empowerment
BOF basic oxygen furnace
CAER Community Awareness and Emergency Response
CBD central business district
CCPA Canadian Centre for Policy Alternatives
CCS carbon capture and storage
CDM Clean Development Mechanism
CEF Central Energy Fund
CER Certified Emissions Reduction
CFL compact fluorescent light
CONNEPP Consultative National Environmental Policy Process
COSATU Congress of South African Trade Unions
CSIR Council for Scientific and Industrial Research
CTL coal-to-liquid
DEAT Department of Environmental Affairs and Tourism
DEPP Developmental Electricity Pricing Programme
DME Department of Minerals and Energy
DOE Department of Energy
DRC Democratic Republic of Congo

xiii
DSM demand-side management
DTI Department of Trade and Industry
DWA Department of Water Affairs
DWAF Department of Water Affairs and Forestry
EAF electric arc furnace
EIA Environmental Impact Assessment
EIR Extractive Industries Review
EJNF Environmental Justice Networking Forum
EMCA environmental management co-operation agreement
EPWP Expanded Public Works Programme
ERMC Energy Risk Management Committee
EROEI energy return on energy invested
EU European Union
FAO Food and Agriculture Organisation
FTFA Food and Trees for Africa
GDP Gross Domestic Product
GEAR Growth, Employment and Redistribution
Gt billion tonnes
GTL gas-to-liquid
GWC Growth without Constraints
H:H high hazard
H:h low hazard
IDC Industrial Development Corporation
IDP Integrated Development Plan
IEA International Energy Agency
IGCC integrated gasification combined cycle
IMF International Monetary Fund
IPAP Industrial Policy Action Plan
IPC Integrated Pollution Control
IPCC Intergovernmental Panel on Climate Change
IPP independent power producer
IRP Integrated Resource Plan
kWh kilowatt-hour
LTMS Long-Term Mitigation Scenarios
mb/d million barrels a day
MEC Member of the Executive Committee
MEND Movement for the Emancipation of the Niger Delta

xiv
MERG Macro-Economic Research Group
mm³ million cubic metres
MOSOP Movement for the Survival of the Ogoni People
mt million tonnes
MTRM Medium-Term Risk Mitigation Plan
MW megawatt
MWh megawatt-hour
MYPD multi-year price determination
NEDLAC National Economic Development and Labour Council
NEMA National Environmental Management Act
NEPAD New Partnership for Africa’s Development
NERSA National Energy Regulator of South Africa
NERT National Electricity Response Team
NGO non-governmental organisation
NUMSA National Union of Metalworkers of South Africa
NWMS National Waste Management Strategy
OCGT Open Cycle Gas Turbine
OECD Organisation for Economic Cooperation and Development
OPEC Organisation of Petroleum Exporting Countries
PBC polychlorinated biphenyl
PFC perfluorocarbon
PFSA Plastics Federation of South Africa
PJ petajoules
PMT Provincial Monitoring Team
ppb parts per billion
PPC Pretoria Portland Cement
ppm parts per million
PV photovoltaic
PVC polyvinyl chloride
PWR pressurised water reactor
RBS Required by Science
RDP Reconstruction and Development Programme
RED Regional Electricity Distributor
REDD Reducing Emissions from Deforestation and Forest Degradation
SAPIA South African Petroleum Industry Association
SAQMC Sasolburg Air Quality Monitoring Committee
SCI Sasol Chemical Industries

xv
SD Scenarios Document
SDCEA South Durban Community Environmental Alliance
SDI Spatial Development Initiative
SDR Sustainable Development Report
SRES Special Report on Emissions Scenarios
Stats SA Statistics South Africa
SUV sport utility vehicle
TEEB The Economics of Ecosystems and Biodiversity
toe tonnes of oil equivalent
tpa tonnes per annum
TR Technical Report
TWh terawatt hour
UNEP United Nations Environment Programme
UNFCCC United Nations Framework Convention on Climate Change
VEJA Vaal Environmental Justice Alliance
VOC volatile organic compound
VRESAP Vaal River Eastern Sub-System Augmentation Project
WBCSD World Business Council for Sustainable Development
WEO World Energy Outlook
WSSD World Summit on Sustainable Development
WTO World Trade Organisation

xvi

1
Introduction
Introduction
IN THE BROADEST TERMS, environmental injustice in South Africa is evident
in that the rich receive the major benefits of development while the poor bear
the brunt of environmental degradation caused by development.
The groundWork reports (2002–2008) have identified three ways in which
environmental injustice is imposed on people. In the first place, people are polluted,
their environments are degraded and they are coerced into working for less than it
costs them to live. This is called externalisation because corporations get a free ride
by offloading costs on to communities, workers, the public purse and the
environment. Costs incurred in modern processes of production but not accounted
for within the market price are imposed on third parties who are not involved in,
and have no benefit from, the transaction.
In the second place, people are dispossessed and common resources or public
goods are privatised. This is called enclosure because it eliminates or subordinates
non-capitalist systems of production whether by direct force, by technological
superiority as when modern trawlers compete against traditional fishing techniques,
or by commodifying goods that were previously free.
Thirdly, people are excluded from the political and economic decisions that lead
to their being polluted or dispossessed. Given the weight of economic forces in
shaping broader social institutions and relations, political and economic exclusion
frequently reinforce each other. The institutions of the market are specifically
designed to remove decision making from the public sphere and so exclude all
who do not have an interest in profit. Thus, those who are dispossessed or who
carry the externalised costs of production are prevented from contesting the theft
or contamination of their resources.
These processes are central to the larger process of accumulation that defines
capitalist development. Social geographer David Harvey (2005) uses the term

2
Toxic Futures
‘accumulation by dispossession’, which effectively includes all three of these
mechanisms. This is a highly unequal process as is evident from the growing
inequality of people globally and in South Africa. Those who control development
do very well out of it and argue that it is for the benefit of all. The evidence does
not support this. Rather, as the rich are made richer, the poor are made poorer.
This book looks at how that happens. It is based on the groundWork reports.
groundWork is an environmental justice organisation that supports activist groups
in communities affected by industrial pollution. It was established in 1999 and
started working with people active on the fencelines of the major oil refineries and
of waste dumps and incinerators. The groundWork report has come out annually
since 2002 and documents the state of environmental injustice in relation to a
particular theme. The themes are chosen for their relevance to groundWork’s
mandate and to explore the context that shapes local struggles.
Thus, the first report came out in 2002, the year of the World Summit on
Sustainable Development (WSSD) hosted by the South African government in
Johannesburg. Big corporations wield inordinate power in all the fenceline areas,
and groundWork director Bobby Peek observed that ‘a single thread running through
all our community campaigns was the abuse by corporations dished out with
impunity from prosecution or penalties’.1 In the week ahead of the WSSD,
groundWork launched a campaign of resistance against corporate power at its
Corporate Accountability Week. The groundWork Report 2002 took up the theme in
relation to the petrochemical industry and air pollution. It focused on Durban
where the South Durban Community Environmental Alliance (SDCEA) was actively
challenging the regime of ‘negotiated non-compliance’ that characterised the
relationship of government regulators to industry.
Many environmental struggles take place around the end of the pipe. The
groundWork Report 2003: Forging the Future, examined the engine producing
environmental injustice with a critique of government’s newly minted industrial
manufacturing strategy. Alongside the environmental and social devastation of
industrial modernisation, the report showed that the engine of global growth was
running on empty. The appearance of economic solidity was testimony to the
power of an illusion. In South Africa, meanwhile, both government and corporates
were closing down the space for participation and dissent. People were denied
access to information and gagged by hostile court actions. ‘Where is our
Constitution?’ asked Peek. In response to the urgency of this question, the 2004
report, The Balance of Rights, looked at what the Constitution promised and why the
promise was not realised by and for the people.

3
Introduction
The World Petroleum Congress held its 2005 meeting in Johannesburg on the
agenda of ‘shaping the energy future’. This was the first World Petroleum Congress
meeting in Africa and the venue reflected the increasingly aggressive scramble for
African oil. The groundWork Report 2005: Whose Energy Future? was launched in
opposition to the oil elite’s agenda at a gathering of people from the fencelines of
the upstream oilfields and the downstream refineries. In the same year, groundWork
organised the first exchange visit of people from the South African refinery
fencelines to the Niger Delta. They were shown around by Environmental Rights
Action and they witnessed the unofficial war on people. The village of Odioma
had recently been razed to the ground by the Nigerian army while everywhere the
gas flares roared, and spilt oil saturated the ground and slicked over the waters of
the delta.
The focus was once more a local one in 2006. The Vaal Environmental Justice
Alliance (VEJA) was newly formed and the groundWork report looked at the
production of the Poisoned Spaces of the Vaal Triangle, using this as a lens on the
national and global production of environmental injustice. Energy was again in
question in 2007 following the Western Cape power blackouts and the growing
evidence that conventional oil production was reaching its global peak. Peak Poison
found that production was getting dirtier – politically and environmentally – as
energy resources were harder to come by. With the Waste Bill going through
parliament, the groundWork report returned to the end of the pipe in 2008. Wasting
the Nation looked at how capitalist production was making trash of people and
places.
People living on the fencelines are intensely aware that the industries that directly
pollute them are also major carbon sources. The groundWork reports approach
climate change in the context created by the themes. This book draws on some
shorter papers that address it directly. A Critique of the LTMS, written for Earthlife
Africa, Johannesburg, responded to the Long-Term Mitigation Scenarios, a study
commissioned by the Department of Environmental Affairs and Tourism (DEAT)
and published in 2007 to inform government climate policy. Eskom, the state-
owned power utility, was meanwhile building new coal-fired plants as fast as it
could. As the economy turned sour in 2009, it ran into funding difficulties and the
news was leaked that the World Bank would rescue it with a very large loan. A
groundWork paper, The World Bank and Eskom, fed into a campaign that opposed
both Eskom’s new build and the World Bank loan.
This is a moment of major and rapid historical change. Over the course of the
first decade of the twenty-first century, the groundWork reports have documented
the unfolding crisis and tried to draw the links to people’s experience of

4
Toxic Futures
environmental injustice. Going back to them for this book has, in some ways, felt
a bit like being Cassandra after the fall of Troy. The reports were written as the
economy boomed, energy demand pumped, carbon emissions intensified and global
inequality gaped ever wider. They anticipated the bust even as the managers of
global capital celebrated themselves. In one sense, the boom and the bust are really
part of the same moment but the bust also marks a tipping point, both an ending
and a beginning. Momentous as this is, the tearing of the planet’s ecology is even
more so, yet happens on a different time-scale. The ‘moment’ here is the three or
so centuries of imperial capitalism. Nevertheless, some major ecological tipping
points are fast approaching and, if not averted, the earth will become uninhabitable.
I wrote the first four reports with Mark Butler and the next three with Victor
Munnik. The original content of many of the passages in this book was written by
one or other of them. In particular, sections on mining and water come from
Victor’s pen and he also has the last word in this book with a meditation on ‘enough’.
Furthermore, the process of writing the reports involved intense conversations
and collaborative thinking that shaped the whole of each work and the series as a
whole. Thus, Mark and I developed the mechanisms of environmental injustice as
a tool for analysis and it has proved to be robust. We did not then have the benefit
of David Harvey’s concept of accumulation by dispossession but the mechanisms
are useful in separating out different moments in the process of dispossession.
We have also wanted the reports to be part of a dialogue with people. Albeit
somewhat unevenly, some more than others, they have been deeply informed by
conversations with people on the frontlines of the struggle for environmental justice.
It was our hope that the reports would ring true to them and contribute to their
discussions and debates. But words fall short of experience. As we put it in Poisoned
Spaces, the 2006 report on the Vaal Triangle:
This is not an easy story. It is filled with violence that is sometimes direct
and brutal but always also insidious – a slow atrocity that periodically
produces flashes that glare into publicity. We hope we have done some
justice to the history but believe that it is more cruel and more destructive
than we can describe (2006: 15).
UNEQUAL SOUTH AFRICA
South Africa remains one of the most unequal countries in the world although it is
a little less unequal than the world as a whole. Income inequality has intensified
since the first democratic elections in 1994. On the Gini measure – where 0.0

5
Introduction
means absolute equality and 1.0 means 1% of households take all income – it rose
from 0.68 to 0.73 between 1995 and 2000.2 Statistics South Africa (Stats SA) puts
the 2006 Gini at 0.72 and says, ‘If social grants and taxes are excluded, the Gini
coefficient . . . would be 0.80 . . .’ (2008: 3). Levels of poverty are extreme and
poverty is still defined by race, class, gender and geographical location. Thus the
poorest people are rural women living in the former Bantustans. Table 1 shows
that the richest 20% of South Africans took just short of 75% of household income
in 2008, up from 73.5% in 2000 and 71.6% in 1993, the last year of apartheid rule.
The poorest 20% increased their share of income between 1993 and 2000, mainly
as a result of the equalisation of pensions and other welfare grants. Between 2000
and 2008, the top 10% increased their share at the expense of everyone else
(Leibbrandt et al. 2010: 26). The bottom 60% received only 11.4% of all household
income in 2008 while the poorest 20% received a mere 1.4%.
These figures refer only to household inequality, to what the Constitution calls
‘natural persons’. It does not refer to ‘juristic persons’ – that is, to corporations.
Since 1994, South Africa’s biggest corporations have listed on the London and
New York stock exchanges, taking very large sums of capital with them, while
more foreign investors and speculators are taking home profits and royalties from
money made in South Africa. So part of the difference between global and South
African inequality is made up by South Africa’s contribution to the global rich.
In 2003 and 2008, the government published its own reviews of the first ten
and fifteen years of democracy. The ten-year review claimed a marked decrease in
inequality as a result of government’s social spending (Presidency 2003: 90). This
included increased welfare grants, such as pensions that are now targeted only at
the poor, and spending on housing, water, electricity, education and health care.
Taking this spending into account, it claimed that the Gini coefficient for 2000 was
0.35.3 Welfare grants have undoubtedly contributed to alleviating poverty but are
Table 1 Household inequality: share of income (percentage).
1993 2000 2008
Top 20% 71.6 73.5 74.6Second top 20% 15.8 14.8 13.9Middle 20% 7.5 6.9 6.4Second bottom 20% 3.9 3.7 3.6Bottom 20% 1.3 1.5 1.4
Source: Leibbrandt et al. 2010.

6
Toxic Futures
already included in the Gini as income. This figure therefore suggested massive
benefits to the poor from government spending on housing and service delivery.
The figure was met with academic derision while the extraordinary intensity of
protest indicates what poor people think of the value of what they have received.
Government’s fifteen-year review acknowledged increased inequality but claimed
reduced poverty: while the rich benefited most from higher economic growth,
‘individuals across the whole spectrum experience[d] positive income growth
between 1995 and 2005’ (Presidency 2008: 20). Sociologist Jeremy Seekings believes
that, although it ‘is premature to reach any precise conclusion on poverty trends in
the early 2000s’, it is ‘very likely that weak employment growth and a sharp increase
in . . . social assistance programmes did lead to a reduction in income poverty’
(2007: 10). Be that as it may, by 2007 escalating food and fuel prices had ripped into
any benefit from ‘positive income growth’ and, in 2008, economic depression
evaporated jobs.
Marketing environmental injustice
The gap between what government spends and its value to the poor, and particularly
poor women, is amplified by the neglect of environmental justice – or rather, by
compounding environmental injustice. Underlying this neglect is a consistent resort
to the logic of the market. In respect of its housing programme, government’s ten-
year review claimed that the value of a house to the occupant was equal to ‘the
replacement cost’ (Presidency 2003: 25). For the most part, however, the poor
remain crowded together far from public amenities or job opportunities on land
with little market value and many of the new houses are badly built. This is merely
reproducing slums.
Government’s water and electricity roll-out figures are particularly impressive.
Between 1994 and 2008, according to the South Africa Year Book, over eighteen
million people gained access to clean water, bringing the total to 88% of the
population (SAG 2009). The poor, however, are frequently cut off for want of
money to pay for the service, as described in Chapter 2. In many places, the water
supply has been erratic, whether or not it is paid for, as delivery systems break
down. The unpaid ‘ecological debts’ of past water use are also threatening the
supply. In 2003 to 2004 in Limpopo Province, for example, dams and wells ran dry
and this was attributed exclusively to drought. Yet it has as much to do with the
appropriation of water for irrigated agriculture, which, over several decades, has
dramatically lowered the water table.4 Many community water projects have simply
tapped into this diminishing resource. Despite ‘integrated’ water management
7
Introduction
policies, ‘market opportunity’ continues to drive development thinking in Limpopo.
The provincial government has supported water-intensive sugar projects in the
drought-prone Blyde River area while several dams, or dam extensions, are being
built ‘to cope with the increasing water demand generated by platinum mining
developments in Limpopo and Mpumalanga’ (SAG 2004: 660). Such developments
are aggravating the ecological debt.
Waste management and sanitation, by contrast, are scarcely registered as
priorities. The ten-year review did not mention waste but did promise to eradicate
the bucket toilet system by 2007. In 2008, the South African Municipal Workers’
Union commented that the ‘goalposts were shifted to say that this money was for
eradicating the bucket system in “formal” informal settlements only’.5 By 2009,
government claimed to have removed 90% of buckets from formal settlements
(SAG 2009: 558).
Meanwhile, poorly maintained sewage systems are breaking down across the
country and contaminating water that people use for drinking. In April 2008,
78 children died from diarrhoea in the Ukhahlamba district of the Eastern Cape.
The municipality did nothing until the deaths were made public. The provincial
government then noted other factors ‘including poverty, poor service delivery,
environmental health and human resource “challenges” ’.6 It is indeed poor people
who die. Yet, when government cites poverty as a cause, the sub-text seems to be
that poor people’s lives are less valuable.
The ten-year review did include a section on ‘preserving the environment’
under the social theme. It focused exclusively on nature conservation. Parks and
tourism were major themes but the document also recognised the contribution of
‘biological resources’ to local livelihood strategies and as a buffer against poverty. It
claimed that natural resource management has moved ‘squarely into an arena
concerned with human rights, equity and environmental sustainability’ (Presidency
2003: 30).
This is not always evident on the ground where people are increasingly subject
to market forces. In many black rural areas, cash crops have displaced diverse food
crops as sugar, cotton and forestry corporations have promoted outgrower schemes.
Land redistribution remains underfunded and focused on ‘fitting emerging black
farmers into the existing agricultural sector, without fundamentally restructuring
that sector’ (Lahiff 2003: 37). Most did not make it and, in 2003, government
introduced an agricultural support programme but within the same logic of ‘access’
to ‘a market dominated by established white producers and agribusinesses’
(Greenberg 2010: vii). Under the sign of the market, poor people will certainly be

8
Toxic Futures
excluded from land while a significant proportion of emerging farmers are likely
to be bankrupted. Production will be industrialised: it will be capital- and chemical-
intensive and will favour mono-cropping.
Neither review mentions the word ‘pollution’ although the fifteen-year review
does hint that environmental degradation may begin undermining economic growth
and poverty eradication. Climate change has moved up government’s agenda since
2003. It gets a couple of mentions in the fifteen-year review and has belatedly been
tagged on to the list of development indicators – curiously under the heading of
‘good governance’ right after ‘ease of doing business’ – that government uses to
measure its performance. It is the only avowedly environmental indicator out of
76.
Government rhetoric, in South Africa and elsewhere, habitually associates
economic growth, development and poverty eradication. Poverty is then represented
as the result of an absence of development and, as we will see in Chapter 3,
environmental concerns are constructed as getting in the way of development.
The groundWork reports have argued to the contrary that poverty and environmental
degradation are precisely the products of development as it has been shaped in
reality by the powers of state and capital. The next section looks at the defining
features of South Africa’s polluting economy.
CARBON ECONOMY
South Africa’s economy is dominated by the minerals-energy complex (Fine and
Rustomjee 1996). This has made for a highly concentrated economy – one in which
wealth and the power to direct development is held by a very few large corporations.
The concentration of economic power in South Africa has led to one of the most
energy- and carbon-intensive economies in the world and it has the dubious
distinction of hosting the single largest carbon dioxide emitter in the world, Sasol’s
coal-to-liquid (CTL) plant at Secunda. Its carbon intensity and high emissions result
from two fundamental and related reasons – its reliance on coal as its primary
energy source and its policy of supplying cheap electricity to industry.
Table 2 is based on the 2006 Digest of South African Energy Statistics7 and shows
where the energy comes from. Primary energy is the original source of energy.
Final energy is the form in which energy is actually used. The table shows both the
absolute amount of energy in petajoules (PJ)8 and the proportion of energy
(percentage) supplied from each source.
In 2004, South Africa’s total primary energy supply came to 5 241 PJ. Seventy-
three per cent of this energy came from coal, up from 64% in 2002 but down from
nearly 80% in 2000 according to the Digest. Coal is the dirtiest possible source of

9
Introduction
energy. It is used in three ways: it is converted into electricity by Eskom; it is
converted into liquid fuels and chemicals by Sasol; or it is used directly as ‘final
energy’ in industrial processes. The best quality coal is exported. Imported crude
oil is the next largest source of primary energy and South Africa’s largest import
item. Its share of the energy supply increased from 9.7% in 2000 to 22% in 2002
but then decreased to 14% in 2004 as oil prices surged. It will have lost more
ground to coal through to 2008. Oil is mostly converted into liquid fuels by the oil
refineries.
The final energy available for use comes to 2 718 PJ. This means that nearly
half the primary energy is lost in the process of converting it into electricity and
liquid fuels. A large proportion of the lost energy literally goes up in smoke through
the chimney stacks at the power stations and refineries.
Box 1 Greenwashing renewables
The figure given for renewable energy in Table 2 is deceptive. It is almost entirely
accounted for by biomass while the supply from wind and solar energy is minute.
Over half the biomass supply is from sugar and wood-pulp wastes used to
generate energy for sugar and pulp mills. Biomass is properly renewable only if
its production is sustainable. High-energy mono-crop sugar and plantation forestry
do not meet this criterion.
Table 2 Primary and final energy in South Africa in 2004.
Primary energy Final energy
Petajoules % Petajoules %
Coal 3 573 73.0 788 29.0Crude oil 1 017 14.0 n/a n/aRenewables 418 9.0 190 7.0Natural gas 84 1.0 54 2.0Nuclear 145 3.0 n/a n/aHydro 3 0 n/a n/aElectricity n/a n/a 815 30.0Liquid Fuels n/a n/a 870 32.0
Total 5 241 100.0 2 718 100.0
Compiled from DME 2006.

10
Toxic Futures
Cheap electricity has been central to South Africa’s industrial expansion strategies
throughout its history and was written into the 1928 law that established Eskom as
a state-owned power utility. Cheap electricity relies on the abundance of coal in
South Africa, cheap labour, extensive externalities and huge additional historical
and current subsidies. Industry uses the largest part of South Africa’s available
energy, as shown in Table 3, and this share will have increased with the commodities
boom through to 2008. Consistent with the concentration of economic power, the
36 members of the energy-intensive users group consume 40% of electricity. All
but six of the group are in mining and mineral processing or fuels and chemicals.
Within the industrial sector, the iron and steel (29%) and petrochemicals plants
(22%) are the two biggest users. Over 45% of the energy used in steelmaking
comes directly from coal and coke with a further 23% coming from electricity
(DME 2002: v). ArcelorMittal’s four South African plants consumed about 169 PJ
and the Vanderbijlpark plant alone consumed a massive 76 PJ in 2005.9 Other
metal smelters are also very intensive users. Aluminium is notable for the high
proportion of electricity in the energy mix. Bauxite is not mined in southern Africa
and BHP Billiton’s three smelters were located in the region specifically for the
low-priced electricity. In 2006, they consumed a total of 98 PJ of energy including
74 PJ of electric energy or about 11% of Eskom’s total production.10
Sasol’s coal-based processes are largely responsible for the extraordinary intensity
of energy use in the petrochemicals sector. Over 80% of the energy used to make
liquid fuels and chemicals is directly supplied by coal and Sasol is the only producer
that uses coal to drive its plants. Sasol’s global energy use is 443 PJ excluding coal,
oil or gas converted into liquid fuels and chemicals. Most of this energy is consumed
in its South African plants at Sasolburg and Secunda but Sasol’s Sustainable
Development Reports do not give separate figures for South Africa. The crude-oil
refineries are also intensive energy users by any measure other than comparison
The rest of the biomass supply is from firewood used for domestic consumption.
Information on this is very unreliable and the figures may be exaggerated. The
use of firewood is sustainable only if harvesting is balanced by new growth. In
many areas of rural South Africa, where people are starved of energy, this is not
so. The burden of collecting wood falls mainly on women who have to walk
further and further as supplies are depleted. This results from the unequal distribu-
tion of energy resources and the long history of repeated dispossession.
11
Introduction
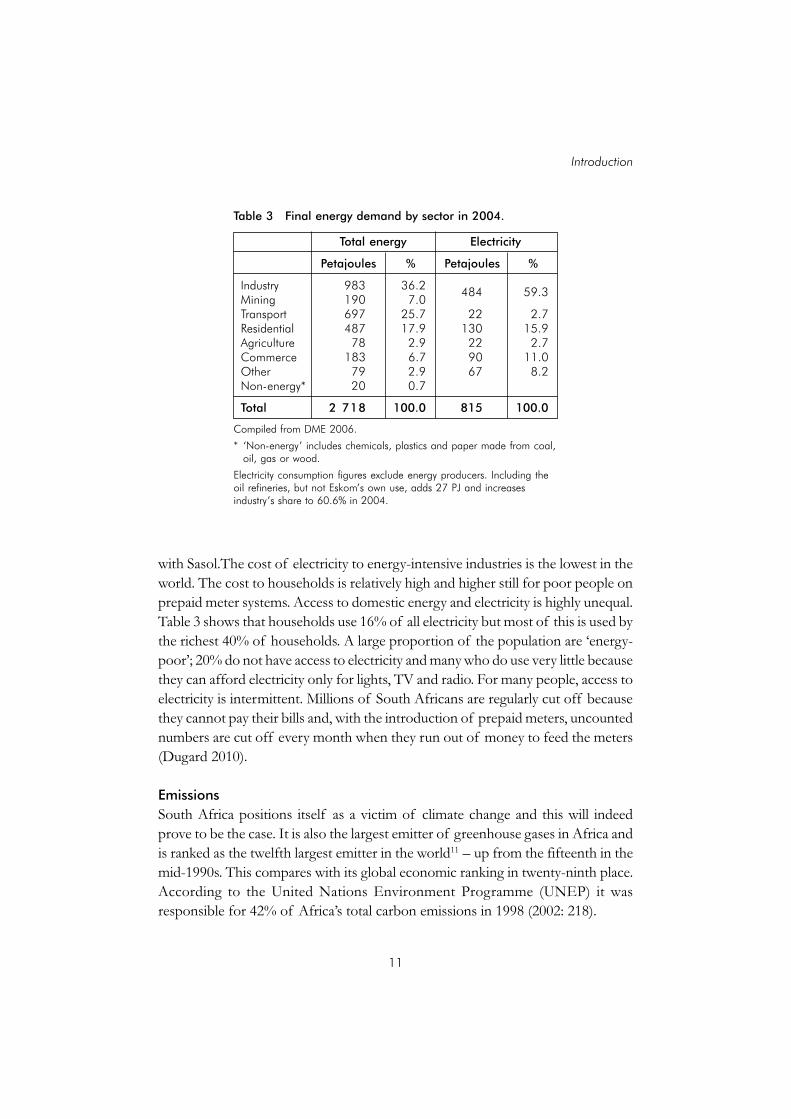
with Sasol.The cost of electricity to energy-intensive industries is the lowest in the
world. The cost to households is relatively high and higher still for poor people on
prepaid meter systems. Access to domestic energy and electricity is highly unequal.
Table 3 shows that households use 16% of all electricity but most of this is used by
the richest 40% of households. A large proportion of the population are ‘energy-
poor’; 20% do not have access to electricity and many who do use very little because
they can afford electricity only for lights, TV and radio. For many people, access to
electricity is intermittent. Millions of South Africans are regularly cut off because
they cannot pay their bills and, with the introduction of prepaid meters, uncounted
numbers are cut off every month when they run out of money to feed the meters
(Dugard 2010).
Emissions
South Africa positions itself as a victim of climate change and this will indeed
prove to be the case. It is also the largest emitter of greenhouse gases in Africa and
is ranked as the twelfth largest emitter in the world11 – up from the fifteenth in the
mid-1990s. This compares with its global economic ranking in twenty-ninth place.
According to the United Nations Environment Programme (UNEP) it was
responsible for 42% of Africa’s total carbon emissions in 1998 (2002: 218).
Table 3 Final energy demand by sector in 2004.
Total energy Electricity
Petajoules % Petajoules %
Industry 983 36.2484 59.3
Mining 190 7.0Transport 697 25.7 22 2.7Residential 487 17.9 130 15.9Agriculture 78 2.9 22 2.7Commerce 183 6.7 90 11.0Other 79 2.9 67 8.2Non-energy* 20 0.7
Total 2 718 100.0 815 100.0
Compiled from DME 2006.
* ‘Non-energy’ includes chemicals, plastics and paper made from coal,oil, gas or wood.
Electricity consumption figures exclude energy producers. Including theoil refineries, but not Eskom’s own use, adds 27 PJ and increasesindustry’s share to 60.6% in 2004.

12
Toxic Futures
The National Climate Response Strategy for South Africa, authored by the
DEAT in 2004, acknowledges the reality of climate change and emphasises the
dangers to South Africa’s economy over the next 50 years. Health experts expect
increased water-borne diseases including malaria and bilharzia. South Africa is a
semi-arid country and water resources will be increasingly stressed through reduced
rainfall and increased evaporation, desertification, droughts and flood events.
Rangelands will become drier and produce less food. Maize production, which
provides 70% of total grains, is expected to decrease by up to 20% while pests and
diseases are also likely to increase. Biodiversity will be dramatically diminished to
the detriment of tourism. The fynbos and karoo biomes as well as large parts of
the flagship Kruger National Park will have transformed unrecognisably by 2050,
according to science writer Leonie Joubert (2006).
The second set of threats that the response strategy identifies, is that South
Africa’s mining and energy industries are particularly vulnerable to climate change
mitigation measures. Exports of fossil fuels, especially coal, and carbon-intensive
products could in future be penalised. Table 4 puts the carbon intensity of the
South African economy into perspective although the latest figures indicate that it
is even worse than this.12
The per capita carbon intensity is misleading, first because of the unequal access to
domestic energy and second because of the intensity of industrial energy use. In
effect, South Africa exports energy and carbon embedded in minerals to the benefit
of capital but at the cost of the majority of people. The carbon intensity per unit
of production signifies South Africa’s structural location within the global economic
Table 4 Energy sector carbon dioxide emission intensity in 2002.
CO2 /cap CO
2 /GDP
Cumulative energy CO2
emissions from 1950 to 2000
t/capitakg/1995
Mt CO2
Proportion ofUS$ world total %
South Africa 6.65 1.65 10 165 1.29Africa 0.89 1.16 13 867 1.75Non-OECD 1.65 1.33 318 117 40.23OECD 10.96 0.44 472 635 59.77World 3.89 0.68 790 753 100.00
Source: Winkler 2007.
CO2 includes emissions from fossil-fuel use and cement manufacture but excludes industrial
process emissions.

13
Introduction
order. It is not about a phase of development through which the country will pass
to higher value production and reduced carbon intensity.
The energy sector leads on carbon and also pumps out pollutants that directly
affect people’s health. Eskom has consistently resisted installing pollution controls
and the results show in Table 5. In absolute terms, it stands out even in the company
of South Africa’s other world-class polluters. Sasol’s coal-based processes are largely
responsible for the extraordinary intensity of energy use in the petrochemicals
sector. In terms of usable energy produced, Sasol is more pollution-intensive than
Eskom. By any other standard of comparison, the crude-oil refineries are also
pollution-intensive.
Eskom and Sasol are particularly vulnerable to mitigation measures. Both have
committed to reducing their greenhouse gas emissions but neither has done so.
Both corporations expanded production through to 2008. At Eskom this was
accompanied by increased carbon intensity as will be discussed in Chapter 7. At
Sasol, increased production offset efficiency gains and these gains were reversed
when production declined on lower demand in 2009. We will take a closer look at
this in Chapter 6.
Air pollution is matched by ground and water pollution. No one actually knows
how much waste is produced, recycled or dumped. Developing a waste information
system has been consistently identified as a priority since the early 1990s and has as
consistently been neglected. Figures confidently given in the official Environment
Outlook (DEAT 2006) are recycled from a report produced by the Council for
Scientific and Industrial Research (CSIR) in 1992. There has been no update since
Table 5 Air emissions from main energy and chemical producers (tonnes) in 2006.
Pollutant Eskom Sasol global Durban refineries*
Carbon dioxide 203 700 000 60 009 000 1 860 774Sulphur dioxide 1 763 000 223 000 8 683Nitrogen oxide 877 000 162 000 3 236Particulates 55 760 7 560 –VOCs – 461 000 4 500Hydrogen sulphide – 78 000 –
Based on industry reporting.
* The Durban refineries are Sapref and Engen. The disgraceful Chevron Refinery in Cape Town gives nopublic account of its emissions. Blanks may indicate the absence of data rather than of pollution.

14
Toxic Futures
but the figures have been turned from cautious estimates to ‘facts’ even as they
have become increasingly meaningless.13 What can be said is that South Africa’s
mining and industrial corporations produce mountains of solid waste and rivers of
liquid waste, much of it toxic. In addition to the pollution of water used in
production, mining turns groundwater into toxic ‘acid mine drainage’, discussed in
Chapter 4. The large-scale destruction and contamination of aquifers, wetlands
and rivers now presents the immanent prospect of an environmental catastrophe
that will, for South Africa, be of the same order as catastrophic climate change.
THE GLOBAL SCALE OF ECOLOGICAL DEBT
While South Africa is one of the most unequal countries in the world, the world as
a whole is even more unequal. The richest 20% of the world’s people ‘account for
86% of total private consumption expenditure’ (UNEP 2002: 35). They consume
‘68% of all electricity, 84% of all paper, and own 87% of all automobiles’ (Sachs et
al. 2002: 19). It follows that they produce a similar proportion of polluting waste.
This creates an ecological debt owed by the rich to the poor.
Counting carbon emissions alone, Christian Aid (1999) calculated that this debt
is growing by $13 trillion per year using 1990 figures. Despite international
agreements to reduce emissions, the gap between rich and poor country emissions
continues to grow. Since the industrialised countries have been burning fossil fuels
for far longer than poor countries, the historical debt is obviously enormous.
Emissions from industrialising countries, particularly in East Asia, have grown
substantially over the last 50 years. Rich countries remain responsible for most of
the increased concentration of carbon in the air but a number of middle-income
countries, including South Africa, should now be accounted as debtors to the poor
countries. The poor, however, are most vulnerable to the consequences of climate
change:
Poor people in poor countries suffer first and worst from extreme weather
conditions linked to climate change. Today, 96% of all deaths from natural
disasters occur in developing countries. By 2025, over half of all people
living in developing countries will be ‘highly vulnerable’ to floods and storms
(Simms 2001).
The cost of production is thus much greater than the costs paid by producers and
consumers. It is, in short, externalised and so produces a form of ecological debt.

15
Introduction
Capitalism grew up alongside imperialism. Its development depended on
appropriating the resources of other people and other systems of production. In
the first place, the imperial powers took people’s land and labour. People were
forced to work either by being captured and sold as slaves, or because they were
dispossessed of any other means of survival. In most cases, those who were not
killed defending their resources then had to take work that paid them less than the
cost of living. This is the ecological debt from enclosure. The historical debt here
cannot be calculated because the process of enclosure involves putting a monetary
value on resources that were not previously valued by money.
The ecological debt is growing rapidly. The debtors, however, have no intention
of paying. The reason for this is simple. Even if the historical debt is cancelled,
capitalist production makes massive losses if it is held responsible for its year-on-
year ecological debt. The price of sustaining this form of production is that the
creditors, whether as poor countries or as poor people, must be impoverished.
Unsustainable development is visible not only in the extinction of species or the
melting of glaciers, but also in poverty and inequality. Conversely, sustainable
development is not possible except on the foundation of environmental justice.
Towards environmental justice
Environmental justice is both a battle-cry and a way of thinking about people in
their relationship to the environment. It contests the dominant discourses of
environmental management. The neo-liberal discourse – think ExxonMobil or
George Bush – disregards external costs, particularly when those costs are imposed
on anyone without the power to make a fuss. Ecological modernisation was
effectively endorsed by governmental negotiators at the United Nations Earth
Summit in 1992. It is promoted by the World Bank and the World Business Council
for Sustainable Development to proclaim that corporate capital is ‘part of the
solution’. It allows for state regulation to compensate for ‘market failures’ but
promotes the use of voluntary market mechanisms. It also advances the model of
stakeholder participation but in a way that obscures unequal relations of power
between social actors. Environmental justice is a rights- or values-based discourse
which locates environmental degradation within the relations of power that
determine development. It marks a point of resistance within the struggle for the
control of natural and labour resources that we call development.
Environmental injustice is thus produced through the social and economic
relations which constitute development and through the relation of development
to the environment. The call for justice is a call to change these relations. This

16
Toxic Futures
opens the question of what relations would produce environmental justice. The
groundWork reports’ working definition of environmental justice encompasses
the idea of empowered people in relations of solidarity and equity with each other
and in non-degrading and positive relationships with their environments.
Central to this working definition, and to the idea of environmental justice, is
the understanding that ‘environment’ is about relationships – it is not just something
‘out there’. People are part of the web of life. In April 2010 the People’s Conference
on Climate Change held in Cochabamba, Bolivia, adopted a draft Universal
Declaration of the Rights of Mother Earth claiming that ‘. . . we are all part of
Mother Earth, an indivisible, living community of interrelated and interdependent
beings with a common destiny’.
* * *
In putting together this book, I was reluctantly brought to realise that, short of
producing a tome at two or three times the length, I would have to leave out much
more of the groundWork reports than I put in. Some of the reports are merely
referred to in the text and none are fully covered. Each of the originals retains its
own value and interested readers can access them from groundWork’s website.
This book focuses on the contemporary crises. It is written in the conviction that
the world is changing willy-nilly and that the character of this change depends on
people’s actions.
The first chapter outlines three dimensions of the elite crisis: the crisis of
imperial capitalism; the crisis of energy resource depletion; and the environmental
crisis. It concludes with a section on the crisis in the lives of the poor seen in
relation to waste. Chapter 2 enters South Africa through the Vaal Triangle. It explores
this space at the polluting heart of South Africa’s economy in the company of the
people who are struggling on the fronts of environmental injustice. These fronts
are created by the powers of state and corporate capital, manifest in the minerals-
energy complex, which have defined development over the last 150 years but also
by peoples’ resistance to those powers.
The political transition to majority rule was full of hope for a fundamental
change in the relations of power and indeed the walls of secrecy erected under
apartheid did begin to crumble. Chapter 3, however, shows the post-apartheid
government managing economic and industrial development, and South Africa’s
re-entry into the ‘international community’, largely on the terms dictated by capital.
It contrasts this top-down imposition with the initially more open process, driven

17
Introduction
by a host of local struggles that shaped environmental policy. Nevertheless, the
environment has consistently been subordinated to economic development and
industrial policy has implicitly left environmental management to the self-regulation
of the market. The chapter concludes with an interrogation of the claims made for
green capitalism. It argues that the appearance of cleaner production in the North
results from a global restructuring of production that has concentrated the lower-
value and dirtier end of the production chain in the South. In South Africa, that
means the energy-intensive production of primary mineral resources and Chapter
4 focuses on the first two links in the value chain. It opens with mining and then
discusses selected industries at the next link in the chain: iron and steel, aluminium
and cement. It then relates the threatened environmental ruin to the conspicuous
consumption that is symptomatic of the contemporary crisis of capitalism.
The next four chapters are concerned with energy. Oil is the world’s premier
source of energy and Chapter 5 shows that peak oil marks the beginning of a
deepening energy crisis and the intensification of the environmental crisis. It
considers the implication for all the major energy sources and concludes by showing
why, in a capitalist economy, energy efficiency does not save the day. Chapter 6
then looks at the petrochemicals production chain. It opens with a brief account
of the scramble for Africa’s oil but focuses on refining and coal-to-liquids production
in South Africa and, further along the value/waste chain, plastics.
South Africa’s power tripped out first in the Western Cape in 2006 and then
nationally in 2009. Chapter 7 shows the root of the crisis in Eskom’s history and
then looks at how the crisis played out in the Western Cape, first in terms of the
politics of energy and second in terms of economic impact, focusing on the Cape’s
globally integrated agriculture. Finally, it draws some conclusions about the broader
implications of an overall decline in the energy system following peak oil. The
national crisis, described in Chapter 8, opened some space for public dissent but
also confirmed the deep-rooted instincts of state and capital. The chapter looks at
the immediate response to the crisis and locates it in relation to the larger crises of
the times into which South Africa also walks with eyes wide shut. The second part
looks at the future of power, now under construction, and at how it is being
contested. It concludes that this is not a viable future.
Chapter 9 is on the politics of climate change. It gives a brief critical review of
the history of the international negotiation process that staggered to its knees in
Copenhagen. Underlying the conflict between North and South, it finds a common
interest in a dysfunctional climate regime that avoids any challenge to economic
growth and the never-ending accumulation of capital. At Copenhagen, South Africa
18
Toxic Futures
made an offer to reduce carbon emissions and the second half of the chapter
looks at how that offer stacks up against the research that is said to underpin it. A
critique of that research, the Long-Term Mitigation Scenarios, wraps up the chapter.
The final chapter draws the conclusion that the global elites – what used to be
called the ruling classes – are incapable of confronting the crises into which they
have led the world. Another world is necessary if there is to be a liveable future for
the people of the Earth. If it is to be brought into being, new life must spring from
people’s creativity and their resistance to the economy of death presided over by
the lords of capital.
19
Elite crisis
1
Elite crisis
INDUSTRIAL DEVELOPMENT, ENERGY and pollution go together. In the
nineteenth century, Britain became the first properly industrial power and was
driven by coal. In the twentieth century, the US took the industrial lead and oil was,
and still is, the fuel of choice. The growth of industrial and economic power
throughout these two centuries has been staggering and the world is now made to
work on the assumption that growth is never ending.
The global regime of accumulation presided over by the US is now faltering
for both political and economic reasons. This is one of three dimensions of a
larger crisis that haunts the world of plenty. The second is ‘peak oil’, a global
energy crisis that has been deferred by the recessionary cut in demand but which
waits to blight any ‘green shoots’ of economic recovery. Third, climate change is
gathering momentum and is just one aspect of a broader environmental crisis. The
three dimensions of the crisis are profoundly interlinked: the extravagant use of
fossil energy has been essential to, and driven by, economic growth and accumulation
that is the foundation of capitalist and imperial power. This use of fossil energy is
also the primary cause of the increased concentration of greenhouse gases in the
earth’s atmosphere. The effects of climate change and peak oil will rebound in
very powerful ways on the economy. At the same time, each of the three dimensions
of crisis has its own logic. The ‘internal’ crisis of imperial capital is happening
irrespective of climate change and peak oil. Similarly, the coincidence of peak oil
and accelerating climate change is arbitrary. Even while the use of fossil fuels
drives climate change, the logic of peak oil works independently of the effect of
carbon emissions on the climate.
The industrial production of abundance has been accompanied by the
production of want on an even greater scale. If coal, oil and gas fuel industrial
growth, food remains the fundamental source of energy for people. Famine and
20
Toxic Futures
hunger marked the origin of Britain’s imperial capitalism as the market centralised
control and used a series of droughts in the nineteenth century to dispossess peasants
in the colonial world. Food was then linked to fossil energy through the steam
trains and ships. Merchants used the new railways to transport what grain was
produced in drought areas to central stores while ‘the telegraph ensured that price
hikes were coordinated’ across the empire. Famine spread even into areas where
rain had fallen while large quantities of grain were exported to Britain as the market
supplied those best able to pay (Davis 2002: 26). Industrial energy now saturates
the food chain, providing fuel or feedstocks for everything from farm to plate:
agricultural machinery, fertilizers, pesticides and herbicides, processing and
packaging, transport and refrigeration. The successive waves of modernisation in
the production of food and everything else have been accompanied by the ever
more intense concentration of market power in the hands of transnational
corporations. Industrial production ends in an abundance of waste. Following the
introduction of the dimensions of the elite crisis, this chapter ends in ‘dust and
ashes’ and the never-ending crisis in the lives of the poor.
IMPERIAL CRISIS
George W. Bush’s war on terror headed straight for the oil lands. Following the
break-up of the Soviet Union, the major oil corporations had already moved to cut
deals with the new republics surrounding the Caspian Sea. The US government
had also established a strong diplomatic presence in the area and military links with
countries such as Georgia. With the justification of the invasion of Afghanistan, it
consolidated its growing influence with military bases in Uzbekistan and Kyrgyzstan.
In the nineteenth century, these were the original oil lands of the Russian Empire.
To the south was Persia (now Iran), which Britain marked as within its sphere of
influence to keep Russia away from the Gulf Sea ports. That stand-off was about
control of trade routes to the east. But the border that it established between
‘West’ and ‘East’ remained essentially unchanged throughout the twentieth century,
even as the US supplanted Britain as the leading Western power and as the Russian
Empire was transformed into the Soviet Union. The US advance across this border
seemed to confirm its victory in the Cold War and to shift the longer-term
boundaries of international power established by the ‘great game’ of nineteenth-
century imperial rivalries. In 2008, however, the US made no response when Russia
invaded Georgia to reassert its primacy in the region.
The war on terror also provided the spurious justification for the invasion of
Iraq. There is little doubt that oil was central to the strategic calculations behind
21
Elite crisis
the invasion. The US moved quickly to secure the oil wells and preserved Iraq’s oil
administration while targeting the rest of the civil service – from health and
education to water, sewage and energy services – for destruction. The war profiteers
were led by oil services corporation Halliburton and were closely linked to Bush’s
administration.
The war on terror provided the justification for the US military moving in on
Africa too. In the process, it is displacing the former colonial powers as the primary
military ‘partner’ for most African countries. Various official reports and statements
emphasise the link with oil. For example, ‘the report of Vice-President Cheney’s
Energy Task Force stressed the importance of gaining and maintaining access to
African oil resources, which US Intelligence assessments expect to increase to as
much as 25% of US oil imports by the year 2020’.1
In the east, a major base in Djibouti was established in 2001 and overlooks the
Middle East. Other bases, such as in Uganda, Senegal and Botswana, are designed
to service a ‘rapid response’ strategy. The permanent US troop contingent is light
but maintains an infrastructure to enable a rapid build-up of troops when required.
At the same time, joint military exercises and training programmes in 43 African
nations provide for a regular US military presence across the continent. This is
backed by military aid funding to a more select group of countries. In 2003, the
top two recipients of this aid in sub-Saharan Africa were Nigeria and South Africa.
In 2007, a separate US military command – Africom – was established. African
countries have refused to host it and it remains headquartered at the European
Command in Germany. Nevertheless, taking the example of Somalia and noting
the scale of overt and covert co-operation, Ba Karang argues that African forces
are now sub-contracted to fight America’s wars on the continent.2
While spending in Africa has risen sharply, it is dwarfed by US military spending
in the rest of the world. Including the Iraq war budget of $82 billion, the Pentagon
spent $500 billion in 2005 – rising to $600 billion in 2008 – about the same as the
rest of the world put together.3 This spending has brought the US massive supremacy
in military technologies as well as a global military presence with troops and military
facilities located in foreign and supposedly sovereign countries around the world.
With the Soviet Union out of the way, US military power cannot be challenged and
successive US administrations have said they will keep things that way.
The war on terror was the legitimizing label given to the neo-conservatives
who came to power with George W. Bush after the spectacular 9/11 attacks on
New York and Washington in 2001. As sociologist Giovanni Arrighi notes, the
attacks ‘scared hell out of the American people’ and so served the same purpose as

22
Toxic Futures
the Cold War: justifying the US’s global role and, more immediately, providing a
reason for war ‘that made sense to the American public’(2005a: 54). The ‘neo-cons’
had already published their agenda before Bush’s election under the title of the
‘Project for a New American Century’.4 This project was rebranded as the war on
terror, a war without end and with no defined enemy, a declaration that any political
group or organisation or any country may be defined as outlaws at any time
convenient to the US.
Far from protecting liberty, this looks like a protection racket and the legitimacy
of US global leadership has eroded in the face of the naked self-interest of its
actions. Thus, the invasion of Iraq is widely and rightly seen as an oil grab. But it is
much more than this. As the anti-war Retort group argues (2005), big oil is articulated
with other ‘centres of capital’ with interests in war, most immediately the ‘military-
industrial’ complex, the giants of construction given corrupt contracts – largely
paid for with Iraqi money – for ‘reconstruction’ and, ‘not least, financial services
and banking capital’ looking for a flood of petrodollars from high-priced oil. War
provided an ‘ “extra-economic” restructuring of the conditions necessary for ex-
panded profitability – paving the way for new rounds of American-led dispossession
and capital accumulation . . . It was intended as the prototype for a new form of
military neo-liberalism’ (Retort 2005: 71, 72).
Disaster capitalism
Activist academic Naomi Klein calls it ‘disaster capitalism’. Iraq is not alone, nor
was it the first to be ‘reconstructed’ as a neo-liberal economy with a client
government tricked out in the rags of democracy. The same prescriptions are applied
both to ‘post-conflict’ societies and to countries hit by natural disasters: ‘disaster
capitalism really hit its stride with Hurricane Mitch’, which devastated Central
America in 1998. The International Monetary Fund (IMF) and World Bank
aggressively pushed the radical ‘opening’ of the domestic economies to foreign
capital and, according to The Wall Street Journal, made privatisation ‘a condition for
release of roughly $47 million in aid annually over three years and linking it to
about $4.4 billion in foreign debt relief for Nicaragua’.5 Reconstruction following
the Asian tsunami of 2004 was similarly used to appropriate local people’s beachfront
sites and fisheries and turn them over to transnational corporations. Shalmali Guttal
of Focus on the Global South argues that ‘failed states’ are now a structural
requirement of capitalism. ‘Poor governance’ is used to justify privatisation and
the contracting out of ‘reconstruction’ to transnational corporations. The structural
and historical causes of failure – the collusion of the imperial powers and their

23
Elite crisis
agencies with dictatorships and the ‘draining of national wealth through colonial
structures of production, debilitating debt repayment burdens and the structural
adjustment programmes’ – are ignored.6
Indeed, the conflict within failed states is frequently manufactured by the
imperial powers. Haiti’s elected president, Jean-Bertrand Aristide, was deposed
following US-sponsored agitation. A similar coup, plotted by the same US groups,
against Venezuela’s anti-imperialist president, Hugo Chávez, failed in 2002 when
the poor flooded on to the streets in support of him. Haiti provides a kind of
history of what might have been on a much larger scale in Venezuela. Guttal relates
that a client government, ‘hand-picked by an eight person “Council of Eminent
Persons” backed by the US’, was installed and adopted a social and economic
reconstruction plan drawn up ‘behind closed doors’ under direction from the World
Bank and US. According to the World Bank, ‘[t]he Transitional Government
provide[s] a window of opportunity for implementing economic governance
reforms . . . that may be hard for a future government to undo’.7 UN troops then
occupied Haiti to provide a multilateral cover for US interests and they systematically
attacked the poor in the slums of Cité Soleil and Bel Air, centres of support for
Aristide and of opposition to the occupation and the client government.
Capitalism is famously flexible. It is not merely that it has the capacity to adapt
to crisis but that it both creates and feeds off crisis. Disaster capitalism appears as
one of the ways that capital is able to respond to climate change, feeding from a
crisis it cannot address.
The great consumer
Apart from its sheer military power, the US retains immense power by virtue of its
economic dominance. It is by far the world’s biggest economy and its premier
market – the great consumer. Producers everywhere, most notably China, still rely
on it to buy their goods. Until 2008, the US managed a series of ‘bubbles’ by
passing them off on to foreigners and on to domestic consumer debt. In 2007,
according to Arrighi, its economy required $2.5 billion per day from the rest of the
world to keep afloat, up from an already unsustainable $1 billion a day in 2003.8
Much of it came from China, anxious to keep the consumption pump going. As
Walden Bello put it, the US and China are chained together in an unsustainable
relationship:
China’s breakneck growth has increasingly depended on the ability of
American consumers to continue their consumption of much of the output
24
Toxic Futures
of China’s production brought about by excessive investment. On the other
hand, America’s high consumption rate depends on Beijing’s lending the
US private and public sectors a significant portion of the trillion-plus dollars
it has accumulated from its yawning trade surplus with Washington.9
China’s production is subsidised by cheap labour supplied from an enormous pool
of dispossessed peasants and by large-scale trashing of environments. Yet, while
China tries to create the jobs that will soak up those it has dispossessed, in 2006 it
was estimated that ‘75% of China’s industries are currently plagued by overcapacity’
– they were producing more than they could sell even as the bull markets roared.
Investments in over-producing industries accounted for ‘40–50% of China’s GDP
growth’ and much of it came from US and other transnational corporations
searching for higher profits, says Bello. America’s consumers, on the other hand,
have paid for the goods by mortgaging their mortgages.10 This was sustained by
rising house prices and hard-sell tactics by moneylenders who were themselves
encouraged by the US central bank. When the housing market crashed, people
were stranded in houses worth less than their debt. The poor in the US were the
first to feel the heat but they were joined by the ‘refugees of the middle class,
drowning in debt, and frequently wondering how they fell so far so fast’.11
The subsidy to America was and is supplemented by the windfall of petrodollars
created by the escalation of crude prices from 2004 to 2008. Yet this merely
compounds the problem for the root of the crisis lies in the logic of an over-
accumulation of capital – there is more money than there are safe and profitable
locations to invest in – resulting in declining profits. Since the 1970s this has resulted
in ‘financialisation’: a shift of power within global capital from production to finance
capital accompanied by a growing volatility of global markets. In this context,
production capital itself turned increasingly to financial instruments to show profit.
The collapse of US energy giant Enron was a symptom of this shift. It could
not make enough profit from producing energy to attract the investment from
finance capital necessary to keep it in the top rank of corporations. Instead, with
the collusion of the world’s top finance houses, it conjured profits – mostly illusory
– from financial dealing and trading. It received real money from California where
it engineered a series of blackouts and so created an energy crisis that boosted
profits from trading energy. It then blamed the California state regulators for the
blackouts and called for total ‘deregulation’ – meaning total power to regulate the
market in its own interest, provided it could maintain its position as the dominant
energy corporation. Controlling information was critical to its dominance. For the
25
Elite crisis
most part, Enron’s spin was what the financial press wanted to believe – Enron
embodied the virtues of privatised ‘wealth creation’. Once it lost control of
information, it collapsed in a matter of weeks.12
At the end of the American century
The US proclaimed its global leadership during the twentieth century under the
banner of The American Century. At the dawn of the twenty-first century, it remains
without question the leading power in the world. Indeed, the 1980s and 1990s saw
the defeat of its global rival for power, the collapse of Third World resistance to its
economic policies and the retreat of labour unions. At the same time, the political
and economic elite – the capitalist class – never had it so good. Everywhere the
rich got richer and nowhere more so than in America. The dramatic failure of the
Project for a New American Century seems to run against this endless flow of
accumulating wealth and power. But a longer historical view suggests that this is
not simply the aberration of a strategic error.
The US regime is the latest in a line of four global regimes of accumulation
that link territorial dominance with the economic power of capital. Arrighi (1994)
shows that, thus far, these regimes have followed a similar pattern of growth and
decline. In each case, a ‘golden period’ of growth is interrupted by a ‘signal crisis’,
which is the first symptom of over-accumulation. The economic power of the
centre is then revived through financialisation during what he calls the ‘belle epoch’,
a period of extravagant concentration of wealth in the hands of the rich and growing
inequality. Financialisation, however, merely masks the underlying problem of over-
accumulation and the regime is confronted with growing political and economic
instability that leads into a ‘terminal crisis’.
The signal crisis of the British regime of accumulation was the economic
depression that lasted from 1873 to 1896. From this time on, the growing power
of the US became increasingly evident. US power, however, developed within the
global order of capital commanded by Britain and was subordinate to it. At the
turn of the nineteenth century, the British regime enjoyed a resurgence that seemed
to guarantee its continued leadership. This belle epoch was followed by its terminal
crisis that extended from 1914 to 1945 and was marked by the two world wars,
with the great economic depression of the 1930s in between. Britain won the wars
but lost the world to its key ally as the US increasingly assumed leadership of the
global capitalist system and finally re-ordered that system in its own image.
The signal crisis of the US regime came with its defeat in Vietnam, the economic
stagflation of the 1970s and the ‘oil shocks’ that ended the golden age of post-war

26
Toxic Futures
growth. The victory of a poor people over the world’s greatest military power gave
hope to the dispossessed of the world and encouraged the assertion of Third
World nationalism. The US and its First World allies were rudely confronted by
Third World states acting as if the legal sovereignty and equality of nations proffered
by US leadership was for real. For the first time, the Organisation of Petroleum
Exporting Countries (OPEC) states actually acted together to increase their share
of oil revenues and Arab producers subsequently went so far as to impose oil sanc-
tions on the West in support of Egypt in the 1973 Yom Kippur War with Israel.
The economic dimension of the crisis came in the form of a recession that
resulted from increasing competition between the dominant economies – the US,
Europe and Japan. After the Second World War, the economic growth in these
economies was mutually reinforcing. From the early 1970s, however, their combined
production had overtaken the growth in markets: they were producing more than
they could sell at a profit even as profits were squeezed by the successful demands
of Northern labour and the rising price of Third World commodities. This marks
the origin of over-accumulation and the oil shocks played into this crisis in two
ways. First, they stoked inflation because the rising price of petrol fed into all other
prices and second, the windfall profits to oil-producing countries created a glut of
petrodollars – more capital with nowhere to go. This was partly managed by laying
it off on to the Third World. Bankers, led by the World Bank, rushed to sell cheap
loans to Third World governments who were only too eager to take them. Oil
producers in particular spent on arms and prestige mega-projects which recycled
the money back into the profits of Northern corporations.
Imperial power was restored by economic means with the adoption of neo-
liberal policies – what came to be called the ‘Washington Consensus’ – in the early
1980s. It did so by engineering a recession on the principle pronounced by banker
Andrew Mellon earlier in the twentieth century: ‘In a depression, property returns
to its rightful owner.’ For Mellon, the rightful owner was finance capital. Chris
Sanders suggests another version of this business principle: ‘Making the other guy
pay.’13 The International Monetary Fund (IMF) and World Bank were turned into
enforcers of the new policies by acting as the global arm of the US Treasury
Department.14 Those made to pay were labour and the countries of the global
South who found that the easy money of the 1970s had turned into the debt trap
of the 1980s. The fabulous concentration of wealth in the hands of finance capital
is matched by growing inequality in the world and in all countries, including the US
and China. At the dawn of the twenty-first century, the resurgence of opposition
at all levels to imperial capitalism is contesting ‘rightful ownership’ while the crisis
of over-accumulation deepens.

27
Elite crisis
The crash
In July 2007, it was the bubble that returned to where it belongs. Several hedge
funds dealing in dodgy housing loans were revealed to be empty. These funds were
operated by major US finance houses and were at the heart of deals spun across
the world of high finance and tangled in such complexity that, even now, no one
really knows who owns what or who owes who. By August, banks in Europe and
the Far East were draining money. The financiers and dealers who had conjured
vast fortunes from the tangle at the expense of others, and who had insisted on the
rights of ‘the market’, then ran to the state central banks to bail them out. The
central banks did indeed come to their rescue with billions of dollars, pounds,
euros and yen. Nevertheless, the five Wall Street investment banks, the masters of
the universe, were either wiped out or forced to change their spots. In May 2008,
the US Federal Reserve handed Bear Stearns to JP Morgan which took it only on
condition that the Federal Reserve would guarantee its debts. In September, the
Federal Reserve let Lehman’s go bust. ‘The market’ was horrified as trillions of
dollars were written off the world’s stock exchanges. Merrill Lynch then sold itself
to Bank of America and only Goldman Sachs and Morgan Stanley were left standing.
They were effectively bailed out – along with the major European banks – when
the Federal Reserve took over insurance giant AIG the day after Lehman’s collapsed
and guaranteed massive payouts to AIG’s ‘counterparties’, including $13 billion to
Goldmans, from national taxes. Shortly thereafter, the two investment banks
redefined themselves as ordinary banks, so submitting to state regulation such as it
is but getting access to the Federal Reserve’s ‘liquidity support’.
Meanwhile, 57 smaller US banks failed between January 2008 and May 2009.
More failed in Europe and were effectively nationalised or merged with rivals on
the basis of the state guaranteeing the bad debts. All told, the IMF calculated in
2009 that ‘total support for the financial system from the governments and central
banks of the US, the Eurozone and the UK has amounted to $8,955 billion –
$1,950 billion in liquidity support, $2,525 billion in asset purchases and $4,480
billion in guarantees’.15Liquidity support is more or less free money from the central
bank ‘borrowing windows’. According to business columnist Jeremy Thomas,
Goldman Sachs used this money to puff up junk rated equities,16 the implication
being that it would dump them as soon as enough naïve investors were suckered by
the appearance of a bull run. That is, it is making a Ponzi scheme of the market
and, with fewer rivals on the scene, has more power to do so.
This, however, is precisely what the US Treasury and the Federal Reserve
themselves have been doing since the 1990s. They used low interest rates to pass

28
Toxic Futures
on the money lent by the rest of the world at virtually no cost, gnomic statements
to assure everyone of the imponderable wisdom of markets, and self-regulation as
the first article of faith in those markets. In December 2008, it was revealed that
Wall Street luminary Bernie Madoff, a key proponent of self-regulation, had been
running a Ponzi scheme, taking in $50 billion, for over two decades. He has since
been jailed. But the system that enabled this massive and sustained fraud was itself
systemically fraudulent. Sustaining the belle epoch of global finance capital required
a constant bull run to keep ‘compounding value’ and keep the suckers coming into
the pyramid base. With finance capital unmoored from production because the
latter could not provide the return on capital necessary for growth, this was the
other side of the coin of accumulation by dispossession and was necessary for
continued economic growth. Consequently central bankers, led by the US Federal
Reserve, blew up one bubble after another to absorb surplus capital, pump up
Northern (and Southern elite) consumption, and sustain the bullish sentiment on
stock markets.
It was to this end that state regulation was suspended in favour of market
regulation. Market functions that had been strictly demarcated were merged, even
in defiance of remaining laws, to provide one-stop diversified and innovative
financial services. As one financier declared: ‘What used to be a conflict of interest
is now a synergy’.17 The finance houses that commanded the world’s economy
competed with ever more innovations to give higher returns to ever more demanding
investors. They took to spinning financial assets based on debt through ever-more
complex derivatives through which the original debt could be sold off several
times over. The global value of ‘securities’ exceeded world production several times
over.18 Money begat money. Value became the creation of mathematical algorithms,
scarcely understood even by finance-house bosses, for calculating tradable risks.
The formulae themselves, however, were confined within the rationality of the
market, which took ever-expanding global values as axiomatic. Systemic risk – the
simultaneous popping of all major bubbles – was placed outside the bounds of
rationality. So the maths failed when the markets went down. Suddenly, nothing
could be valued. Meaning drained from the language of banking.
Despite appearances, the Wall Street era is not exactly over. The banks deemed
too big to fail are now bigger than ever following innumerable state-guaranteed
takeovers. They have found the ‘other guy’ in the world’s taxpayers (present and
future) and are still calling the shots in the halls of power. The revolving door
between the US Treasury, the Federal Reserve and Goldman Sachs is particularly
notorious, leading former IMF chief economist Simon Johnson to denounce the
regulatory capture of the US state by special interests.19 And the trillions of stimulus

29
Elite crisis
funding have not escaped the depleted logic that gave rise to the crisis. A satirical
headline in The Onion reads, ‘Recession-plagued nation demands new bubble to
invest in’.20 The world’s leaders are doing everything possible to provide it.
Meanwhile, China and others have been questioning the value of their holdings
in US dollars. Dollar devaluation amounts to defaulting on a large part of the debt.
This strategy is available only to the US because the dollar is the world’s reserve
currency and required for most international trade. Everyone else pays foreign
debt in dollars and cannot write off their debt through devaluation of their own
currencies. They are thus subject to US monetary policy, thereby expanding the
reach of US economic control as well as giving it considerable leverage over global
flows of oil and other commodities.
In 2000, Saddam Hussein announced that Iraq would trade its oil in euros.
There followed well-informed speculation that the US invasion was intended to
prevent the euro from usurping the dollar as the world’s premier reserve currency
by warning off any oil producer thinking to copy Iraq. It did not, however, have
this effect. To the contrary, Janet Bush (no relation) reported in 2004 that Arab
disapproval of the war was creating a growing ‘consensus for switching out of
dollars . . . OPEC has openly discussed the option and even Saudi Arabia, once
America’s staunchest Middle Eastern ally, is reported to be considering rejecting
the dollar’.21 Venezuela and Iran, both confronted with US hostility, declared that
they would no longer trade in dollars.
The run-down of the dollar over the next few years proved more significant
than anti-imperialist sentiment for big exporters with major dollar holdings and
currencies pegged to the dollar. China and Saudi Arabia both started diversifying
their investments, although cautious not to provoke a dollar rout. The massive
expansion of US debt in 2009 increased fears that, apart from yielding no return,
US Treasury bonds are no longer safe. In October 2009, journalist Robert Fisk
reported that secret meetings between the Gulf Arab states and China, Japan,
Russia, Brazil and France were aimed at ending the dollar regime for oil trades and
moving to a basket of currencies over the next decade.22 It seems unlikely that the
US would intentionally risk its imperial status through a default by stealth. More
likely, it no longer has the power to sustain it. It could restore the dollar by ramping
up interest rates as it did in the early 1980s but would then deepen the depression
and catch itself in a debt crunch. In 2010, it chose rather to launch a second round
of ‘quantitative easing’ – printing dollars that are immediately put into international
circulation – in what appears to be an attempt to pass the bill to China by forcing
the revaluation of its currency.

30
Toxic Futures
ENERGY IN CRISIS
The British regime of accumulation was the first to develop an industrial production
base and to do so it depended on a massive supply of cheap energy which it found
in coal. As the nineteenth-century economist William Jevons remarked, coal stands
‘entirely above all other commodities. It is . . . the universal aid, the factor in
everything we do’ (quoted in Yergin 1991: 543). For the American regime of
accumulation, oil is the universal aid that powers never-ending accumulation. Within
the next few years, however, global oil production will be in decline and there is no
alternative energy source available to compensate for that loss. This is the meaning
of ‘peak oil’.
The oil industry is the largest in the world and, for most countries, it is the
biggest single import item. Furthermore, power within the industry is highly
concentrated. Throughout the twentieth century it was dominated by a handful of
‘majors’ and, following a series of mergers, there are now just six ‘supermajors’.
Yet the meaning of ‘big oil’ is shifting as these corporations lose ground to large
state-owned corporations that control the bulk of reserves in producing countries.
For all their ideological differences and conflicting interests, however, they are as
likely to collude as to instigate war.
At the 2005 World Petroleum Congress in Johannesburg, the world’s oil elite
promised a future of abundant, cheap and clean energy. To start with ‘clean’: the
stench of blood, oil and corruption affronts the sky all along the production chain.
The cheap price of oil was always at the cost of the people who live on the fenceline
of production. In September 2007, there was yet another reminder of this when a
series of explosions ripped through the Island View chemical storage tanks at
Durban docks. Flames fed by a toxic mix of chemicals leapt high in the night sky
and melted eight tanks. Residents living across the road were left to evacuate
themselves. The very next morning, industry and government officials claimed
that there was minimal environmental impact. Three days later, dead fish floated to
the surface of the bay and reporters at the scene said the air was still thick with the
smell of chemicals.
Oil is no longer cheap. Through the 1990s, it traded at around $18 to the barrel,
dropping to $10 in 1999 following the ‘Asian crisis’. From 2000, the price started
rising and was then stoked by Bush’s wars. Even as war receded into background
noise for the market, the price remained high and volatile while the big-oil
corporations raked in record profits. As the financial markets tumbled in 2008, it
spiked to the record price of $145 before crashing precipitately to around $35 and
then pushing back up to swing between $60 and $85. In late 2010, the price broke
31
Elite crisis
through $90 and soon touched $100. The Arab spring uprisings then pushed it to a
high of $124. Oil in particular and fossil energy in general have been extravagantly
abundant for the world’s rich nations and people. Even the poor in most countries
have come to rely on what trickles down from this abundance: paraffin or coal for
cooking and often dangerous transport affordable to some. Growing abundance
has a limited future as declining oil production will not only overturn the cheap
energy regime, but will provoke a crisis of energy in general.
As an energy source, petroleum has unique qualities that are not easily replaced.
As Richard Heinberg (2005: 138) summarises: it is easier and cheaper to transport
– by pipeline, ship or road tanker – than any other energy source; it has a very
high-energy density, meaning that a little does a lot of work; it can be refined into
different fuels – gas, petrol, diesel, paraffin, etcetera, and these fuels can be put to
a range of uses, providing energy for transport, industrial processes, generating
electricity, cooking and heating. Besides energy, oil provides the basis for the massive
chemicals and plastics industries – the products of petroleum are all around us.
Peak oil
Oil is a finite resource. Peak oil is the moment when half of what can be pumped
from the earth has been used. It is, more importantly, also the point of maximum
production. Through most of the twentieth century, the consumption of oil
increased by leaps and bounds but potential production from the discovery of new
oilfields grew even faster. In other words, the potential supply was mostly far greater
than the demand. In this decade, the potential supply has been very little more
than demand, and demand rose rapidly through to 2008. After the peak, production
will decline so that potential demand on a rising market becomes greater than the
supply. Consumption must then be forcibly reduced.
Any individual oilfield goes through a typical pattern of production from
discovery to final closure. First, the rate of oil extraction accelerates, it then reaches
maximum – or peak – production when half the recoverable oil has been used,
after which production starts to decline until no more oil can be extracted and the
well is closed. In 1956, M. King Hubbert showed that the same pattern applies to
any oil-producing region and, by implication, to the world as a whole.
Hubbert, one of the top US oil geologists working at the Shell laboratory in
Texas, developed this model from an intensive study of geological and production
data and predicted that oil production in the mainland US would peak in 1971. In
fact, he was one year out. It peaked in 1970. His conclusion was not welcome. Shell
attempted to silence him and the US Geological Survey, under pressure from the
Department of Energy, ran a long campaign to discredit him. At one level, previous

32
Toxic Futures
predictions of scarcity had proved unfounded but generated panic in the oil markets.
The notion of peak oil thus suggested unwelcome instability. It also threatened the
industry’s power by indicating a limit to its ability to deliver cheap and reliable
energy into the future.
At another level, the dispute reflected an argument between geologists and
economists.23 For the former, physical constraints were the bottom-line reality. Oil
can only be found in specific geological formations and, once those are exploited,
there is no more. For the latter, the only admissible constraint was the level of
investment driven by anticipation of profit. Any shortage on the market would
raise prices and so drive investment. This would inevitably result in new finds and
better recovery from existing fields. However, in a paper for the US Department
of Energy, Hirsch, Bezdek and Wendling note that very substantial investments in
the US following the US peak yielded very modest returns and did not reverse the
overall pattern of declining production. They conclude that, once world oil
production peaks, ‘higher prices and improved technology are unlikely to yield
dramatically higher conventional oil production’ (2005: 17).
The theory of peak oil is no longer in dispute. What is now disputed is when it
will happen and whether it matters. Economists, along with the industry
establishment, argue that investment will secure a plentiful supply for decades and
the market will find alternatives when needed. Thus, the World Petroleum Congress
dismisses any notion of limits to the supply of energy. This position was well
summarised by Euan Baird of the Schlumberger oil services corporation:
Fossil fuels are the only credible candidate for cheap, clean energy, in the
required quantities, over the next 50 years. This will buy valuable time for
the world to move cost effectively to alternative energies as they become
competitive and as the cost of exploiting depleting reserves of oil and gas
increases (Baird 2003: 40).
Oil geologists working in Hubbert’s tradition formed the Association for the Study
of Peak Oil (ASPO) in 2001 and argue that peak oil is already upon us. There is
little time to develop alternatives and, because oil is the world’s largest source of
energy, the peak will create a more generalised energy crisis. This will be reflected
first in further steep increases in the price of oil that will then drag up the price of
gas, coal and other energy sources. The argument of the mid-twentieth century is
thus repeated in the early twenty-first century. Now, however, the stakes are higher
since it concerns the global peak and not just the US peak.

33
Elite crisis
Peaking production
The controversy on the timing of peak oil is fed by unreliable data. Whereas Hubbert
worked with reasonably reliable figures, oil corporations and producing countries
now tend to lie about how big their reserves are.24 In 2004, for example, Shell was
forced to admit that its oilfields had 25% less oil than it had claimed. It had inflated
its reserve figure in order to keep its share price up and it is likely that other big oil
corporations have similarly massaged their figures. For their part, the OPEC
countries treat their technical production data as state secrets. They have a vested
interest in inflating their reserve figures because OPEC production quotas are
linked to reserves. Despite pumping millions of barrels of oil every day, and without
finding new oilfields, most OPEC countries reported increases in their reserves in
the late 1980s. This was really a bidding war for quotas. OPEC was then trying to
restrict production to defend the price, but many individual OPEC countries were
in financial trouble and desperate to export more to compensate for the low price.
Jeremy Leggett (2005) cites evidence that OPEC reserves are over-stated by about
300 billion barrels – ten years’ worth of production at current rates.
In 2007, Hirsch listed a growing number of credible oil experts, inside and
outside of ASPO, who put peak oil within the next decade.25 Several of them
believed that peak had already occurred or was occurring. Several factors explain
why this might be possible without world markets noticing. Firstly, ‘experience
from oil fields and large oil producing regions demonstrates that maximum oil
production is sometimes characterised by a few-year-long gentle rollover’ (Hirsch
2007). Secondly, Hirsch, Bezdek and Wendling note that ‘geological realities are
clearest after the fact’ as was evident from the decline in US production after 1970
(2005: 36). Thirdly, there is a great deal of ‘noise’ in the evidence. For example,
peak oil is expected to be heralded by volatile prices, but this volatility cannot be
separated out from that caused by the broader context of political and economic
instability.26 Finally, production information may be smoke-screened. Thus, some
commentators believe that OPEC announced a cutback in October 2006 to cover
for its inability to maintain production. Saudi Arabia had already cut production
from 9.5 to 9.1 million barrels a day (mb/d), most of the reduction being in very
low-quality crude.27 The implication is that the Saudis were scraping the bottom
of the barrel even at a level of production well below their nominal capacity of
10.5 mb/d. Saudi Aramco has since developed new wells raising nominal capacity
to just over 12 mb/d but, with demand having dropped since mid-2008, its capacity
to produce at this level is yet to be tested.
ASPO analysts have used various techniques to correct the data but remain
open to revising their projections as new information becomes available. Colin

34
Toxic Futures
Campbell (2007), the doyen of peak oil studies, puts the peaking of ‘regular’ oil in
2005. Regular oil excludes very deep sea reserves, extra heavy oils, tar-sands and
other sources where production is very expensive and the energy return on energy
invested (EROEI) is low (see Box 1.1).
In 2007, Campbell predicted the peak of all oil production, including from non-
conventional sources, at 2011. And while he projected gas production expanding
until about 2045, this would not compensate for the decline in oil production.
Thus, he showed the peak of oil and gas combined also at 2011 as shown in
Figure 1.1. Andrew McKillop (2006), however, sees peak gas production riding
hard on the heels of peak oil. In this case, the impact of peak oil will be even more
dramatic as the ‘gas bridge’ to a post-oil energy future collapses. At the height of
the crude-oil market in mid-2008, Campbell revised his projection and put the
peak in 2008 at 85.3 mb/d.
In Figure 1.1, the dip in production from the late 1970s reflects temporary
declines in consumption resulting from economic recession as well as a modicum
of energy conservation in the 1980s. In June 2008, as the financial crisis gathered
momentum, the oil price topped out at $147 a barrel and then crashed. On top of
tight supply margins, the price was pushed up by speculators who saw commodities
and oil in particular as a better bet than equities. This was part opportunism and
part desperation as investors searched for safe havens. The crisis, however, was
moving beyond the financial sector to the ‘real economy’ and cutting into demand.
Supplies were no longer tight and the oil price crashed. Speculation in oil and other
Box 1.1 EROEI
EROEI is the acronym for ‘energy return on energy invested’. It is the measure of
how much energy is used in the production process as against how much energy
is contained in the product. Thus, a very high EROEI of 100 means that 1 unit of
energy is used to produce 100 units. An EROEI of 1 would mean that the product
contains only as much energy as was used to produce it. An EROEI of 0.5 means
that the product contains only half the energy used to produce it. By extension, if
production is based on non-renewables, a diminishing EROEI means higher
carbon emissions.

35
Elite crisis
commodities thus fed off the economic crisis even as escalating prices fed into it.
Until recently, the industry establishment has held a common position that
there were three or more decades to go before peak oil. This was the official
position of the International Energy Agency (IEA), which serves a membership
of rich OECD (Organisation for Economic Cooperation and Development)
countries. Nevertheless, its World Energy Outlook (WEO) 2006 warned that massive
energy investments – in oil, gas, coal, nuclear and renewables – would be needed
to avert an energy supply crisis. The then IEA boss Claude Mandil opened the
report by saying that the ‘energy future we are creating is unsustainable. If we
continue as before,’ he said, ‘the energy supply to meet the needs of the next
twenty five years is too vulnerable to failure from under-investment, environmental
catastrophe or sudden supply interruption’ (IEA 2006: 3).
Subsequent IEA pronouncements have been less and less confident. In June
2007, chief economist Fatih Birol said that unless Iraqi production rises
‘exponentially by 2015, we have a very big problem, even if Saudi Arabia fulfils all
Figure 1.1 ASPO production profiles – history and projections.
Source: Compiled by C.J. Campbell, Staball Hill, Ballydehob, Co. Cork, Ireland.

36
Toxic Futures
its promises’.28 Saudi Arabia’s promise was to invest $55 billion to raise production
capacity by 15 mb/d. ASPO analysts do not believe they can do it and Birol’s
phrasing hinted that the IEA itself was sceptical.
For WEO 2008, the IEA researched actual production and decline rates from
existing fields for the first time. It found that the global decline rate was nearly
twice as high as previously assumed and rising. WEO 2008 saw ‘higher energy
prices and slower economic growth’ reducing future demand and slashed its forecast
for oil demand in 2030 from 116 mb/d to 106. That is still 20 mb/d more than
demand in 2007. To meet this demand and replace the oil from declining fields
would require new production equivalent to six Saudi Arabias. Nevertheless,
assuming adequate investment, the IEA maintained that the supply would meet
demand: ‘Although global oil production is not expected to peak before 2030,
conventional oil production . . . is projected to level off . . . A growing share of
the increase in world output comes from non-conventional sources, mainly Canadian
oil sands, extra heavy oil, gas-to-liquids and coal-to-liquids’ (IEA 2008: 103).
In August 2009, Birol emphasised the risk of a ‘supply crunch’ from 2011
when he anticipated that global economic recovery will revive demand. Many new
oil projects had been delayed or cancelled following the price crash and new
production was unlikely to compensate for declining production from existing
wells. Further, he was reported by the Independent as saying ‘that the oil . . . is running
out far faster than previously predicted and that global production is likely to peak
in about 10 years – at least a decade earlier than most governments had estimated’.29
In fact, most governments have not made any estimates whatsoever. The IEA
subsequently said the 2020 date referred to conventional oil only and it anticipated
total production to peak ‘around 2030’.30
From 2005, the supermajors started making conflicting statements. Chevron
kicked off with an advertising campaign announcing the end of the cheap-oil era.
In January 2006, Shell boss Jeroen van der Veer said that ‘ “easy” oil has probably
passed its peak’.31 In June 2006, Total gave 2020 as the likely date for peak oil.32 A
couple of months earlier, Total had said there was enough oil in the ground but
that the demand forecast by the IEA to 2030 could not be met because the human
and technical resources could not be developed to keep up with the increase in
demand.33 These statements can, of course, be interpreted as attempts to justify
high prices and record corporate profits. Thus Retort, who are sceptical of peak
oil, note the history of ‘organised scarcity’ aimed at keeping ‘prices low enough for
capitalist growth . . . but high enough for corporate profitability . . .’ (2005: 60).
On the other hand, BP and Exxon together with the US Energy Information

37
Elite crisis
Administration maintain the position that there is plenty of oil – virtually unlimited
in Exxon’s view. These statements are also positioned by interest, being calculated
to increase political pressure for corporate access to reserves under national
management.
Either way, the consensus of the establishment has broken up. Contrary to its
earlier statements, WEO 2010 casually remarked that ‘crude oil output reaches an
undulating plateau of around 68–9 mb/d by 2020 but never regains its all-time
peak of 70 mb/d reached in 2006’ (IEA 2010: 6). Peak oil was suddenly in the past
tense. With demand forecast at 107 mb/d by 2035, natural gas liquids and
unconventional oil were made to cover the 37 mb/d difference along with oil yet
to be discovered. This last category, according to Campbell, is IEA code for
shortage.34
ENVIRONMENTAL CRISIS
Climate change is just one dimension of global ecological change forced by the
massive scale of fossil-fuelled industrialisation. The scale of change is such that
Steffen et al. conclude that ‘a new geological era, the Anthropocene, has begun’(2004:
6). That is, it is an era in which the basic functioning of earth’s ecological systems
is decisively influenced by human actions.
Troubled skies
Global warming and climate change are driven by the increasing concentration of
carbon dioxide in the atmosphere. Earth’s climate has never been stable. Over the
last million-odd years, it has fluctuated between cold ice ages and warmer temperate
periods that have defined the previous geological eras. The difference in average
global temperatures between an ice age and a temperate age has been around 5 ºC.
These fluctuations in temperature have been accompanied by the fluctuation of
carbon dioxide concentrations in the atmosphere, ranging from 180 parts per million
(ppm) during the cold periods to about 280 ppm in the warm periods. Concentrations
topped 390 ppm in 2010, well outside earth’s normal operating range. The rate of
increase is around 2 ppm a year and was higher than that in the boom years before
the 2008 economic meltdown (Levin and Pershing 2007: 2). Temperature rise lags
behind the rise in carbon dioxide concentrations. The earth is now 0.8 ºC warmer
than in 1900 and the pace of warming is accelerating. It now averages about 0.2 ºC
every decade. Because of the time lag, this probably reflects CO2 concentrations in
the 1980s or earlier and a further 0.6 ºC rise is still to come in response to past
industrial carbon emissions.
38
Toxic Futures
The effects are already evident. The melting of glaciers and polar ice is beginning
to raise sea levels and, once it gets going, ice melt can raise sea levels by ‘one metre
every twenty years for centuries’ (Hansen 2006).35 More extreme weather events
are experienced across the world and some areas, including much of Africa, are
becoming drier overall while others are becoming wetter. ‘By 2020, between 75
and 250 million people [in Africa] are projected to be exposed to an increase of
water stress’ while agriculture and food security ‘in many African countries and
regions is projected to be severely compromised,’ according to the Intergovern-
mental Panel on Climate Change (IPCC 2007b: 10). There is also a strong probability
that environmental systems will ‘flip’: the environment absorbs a variety of pressures
until a threshold is reached at which point very abrupt change takes place. In this
case, rainfall patterns are likely to change dramatically.
The ‘greenhouse gases’ are accompanied by a cocktail of industrial emissions
in the atmosphere. The impacts of sulphur dioxide (SO2), nitrogen oxides, hydrogen
sulphide, particulates, metals and the exotic mix of volatile organic compounds on
local people and their environments have been documented in successive
groundWork reports. At the regional scale, acid fallout acidifies seas, rivers and
land, and ‘soil acidification is a non-reversible change over anything other than
very long time scales’ (Steffen et al. 2004: 163). Even where the direct effects of
pollution remain regional, as in the case of sulphates, Ulrike Lohmann shows that
they can precipitate a ‘cascade [of effects] through the earth system’ (in Steffen et
al. 2004: 169). Thus, high sulphur dioxide emissions in Europe and North America
during the 1960s and 1970s produced regional cooling36 sufficient to change
atmospheric circulation patterns and is likely to have contributed to drought in
the African Sahel during those decades with severe consequences for peasant
agriculture.
Ruin on earth
Land change has a long history throughout the world. By the sixteenth century,
Europe was largely deforested for naval timber as well as clearance for cultivation.
Imperial expansion drove deforestation throughout the colonies. It also displaced
indigenous environmental management and production systems that relied on a
diversity of biological resources with capitalist production technologies and food
crops favoured in European markets. The scale of change increased dramatically
in the twentieth century: ‘[I]n little more than a century the amount of forest that
fell was equivalent to the entire previous historical conversion of forests over
thousands of years’ (Steffen et al. 2004: 96). Grasslands were ploughed up even

39
Elite crisis
faster, soils were destructured through mechanisation and massive chemical inputs,
and water resources were sucked out for irrigation while being polluted by chemical
run-off. During the twentieth century, cities began to sprawl across ever more
land, particularly in coastal areas, and the process is now accelerating with the
development of mega-cities. The scale of land disturbance by the extractive
industries – mining and oil – is locally devastating and increasingly significant
globally.
Fresh water hydrology has been modified on an equal scale. Land conversion
affects the rate of evaporation sufficiently to affect local climates and rainfall.
Groundwater aquifers have been depleted and wetlands, together with the ‘eco-
service’ they provide in filtering and cleaning water, are everywhere threatened. Up
to 45 000 large dams interrupt the flow of rivers and of sediments and nutrients
formerly deposited in estuaries, deltas and coasts. Two islands formed from the
sediment flow of the Ganges have been lost to the rising sea, creating 6 000
refugees.37 The loss of sediments to the Niger Delta has reduced the fecundity of
its fisheries and increased its vulnerability to sea level rise. Niger Delta fish, as well
as marine fish that have their nurseries in the Delta, are also poisoned by the appalling
pollution of the oil industry. In South Africa, the industrial pollution of rivers,
making them unfit even for industrial consumption, is part of the motivation
for building more dams upstream to capture clean water and transfer it across
watersheds.
Species extinction has accelerated rapidly during the industrial period, to the
point that ‘the earth is now in the middle of the sixth major extinction event in its
history’ (Steffen et al. 2004: 118). The previous five extinctions were caused by
natural events such as major volcanic eruptions and ice ages. This is the first to be
caused by the actions of a living species. Historically, the main cause was loss of
habitat as people turned more land over to cultivation. More recently, industrial
fishing has driven a number of marine species to the edge of extinction.
Climate change is now the most serious threat to species. On land, species are
migrating towards the poles to keep ahead of rising temperatures, but the pace of
change is so rapid that plants in particular cannot keep up. Others are running out
of space. The Western Cape fynbos, an entire floral kingdom, has nowhere to go.
At sea, the warming of the oceans is compounded by the fact that the oceans have
absorbed a large proportion of carbon dioxide emissions, making them more acid.
Corals that act as marine nurseries are gravely threatened and some populations of
plankton species at the bottom of the food chain are in sharp decline. Consequently,
whole ocean food chains may collapse, thus wiping out fisheries.

40
Toxic Futures
Valuing loss
The loss of eco-services from the degradation of forests alone comes to between
$2 trillion and $4.5 trillion a year, according to a study by The Economics of
Ecosystems and Biodiversity project (TEEB 2009). This is of the same order of
magnitude as the losses from the financial crisis but is not accounted for in GDP
figures, is imposed most directly on poor people who depend on forest services
and is repeated year after year. It could thus be taken as an indication of the scale
of the ecological debt from forest losses but it is a conservative estimate because
eco-services are not fully understood and many cannot be monetised.
The project sees economic trade-offs following from ethical choices. For
example, downstream subsistence farmers are exposed to flood and drought when
forests are destroyed. It would be ‘ethically difficult to justify destroying such a
forest watershed in order to release economic value which has utility for the agents
of destruction (for example profits from minerals and timber, related employment,
etcetera)’ if the cost to farming communities is ‘impossible to bear in human terms’
(TEEB 2008: 32). Their broad argument assumes that recognising the value of
eco-services will result in markets internalising costs that are presently externalised
and, in consideration of the Millennium Development Goals, that state policy will
protect both ecosystems and poor people’s rights in them.
In the act of costing the loss, however, ecological systems are framed within
the market. Eco-services are monetised, so making them available for sale. The
project cites the example of a private equity firm that ‘recently bought the rights to
environmental services generated by a 370 000 hectare rainforest reserve in Guyana
recognising that such services – water storage, biodiversity maintenance and rainfall
regulation – will eventually be worth something on international markets’ (TEEB
2008: 11).
This compounds the problem at the heart of capital’s relationship to people
and their environments. As analysed by Karl Polanyi, in a critique of conventional
economics written in the 1940s, ‘[a] market economy must comprise all elements
of industry, including labour, land, and money . . . But labour and land are no other
than the human beings themselves of which every society consists and the natural
surroundings in which it exists. To include them in the market mechanism means
to subordinate the substance of society itself to the laws of the market’ (2001: 75).
Labour, land (or ‘nature’), and money are not properly commodities in that they
are not produced for sale but precede all production. Capital nevertheless requires
that they be treated as commodities because they provide critical inputs that must
be subordinated to protect investments in increasingly expensive technologies of

41
Elite crisis
production. The end result in a self-regulated market driven by profit is the
destruction of society and nature. While TEEB’s initiative aims to conserve, it
ultimately puts ecological knowledge at the service of capital, opening ecological
systems to the deeper penetration of market logic.
Local communities get 80% of revenues from the Guyana deal according to
TEEB. This provides a justification for the enclosure of eco-services as private
property. But international markets will only find worth in that property when it is
sold, bought and sold again. The interests of the poor will then be appropriated,
for market economics flow not from ethics but from relations of power.
DUST AND ASHES
Waste used to be something of the past, a part of life turned to dust and ash. For
much of the nineteenth century, dust and ash was all that went into the domestic
dust bin. Everything else was separated and recycled in one way or another. Even
shit – politely known as ‘night soil’ – was taken out along with organic wastes to
fertilize fields. Or at least some of it was. The rest was thrown into the streets
where waste-pickers competed with dogs, pigs and crows for anything of value.
The business of waste was neither clean nor orderly. In the rapidly growing
cities of the industrialising world, the luxurious houses of the elite classes rose
above the filth and contrasted with the jerry-built tenements housing the mass of
working people. In Manchester, at the centre of imperial Britain’s industrial
revolution, about one-sixth of the population lived in cellars ‘with walls oozing
human waste from nearby cesspools’ (Pichtel 2005: 26). Such conditions were
replicated in the ‘old world’ of Europe and the ‘new world’ in America.
Waste-pickers, scavenging for bones, clothes and coal, were amongst the poorest.
Most did not have a secure roof over their heads and worked and lived in the filth
of the city, vulnerable to diseases and periodic epidemics of cholera and dysentery.
Epidemics were not confined to the poor, however, and once the link between
disease and dirt was made,38 middle-class activism demanded sanitary improvements
from city authorities. This marked the origins of modern waste management and
the construction of what US researcher Heather Rogers describes as ‘a border
separating the clean and useful from the unclean and dangerous’ (2005a: 3).
Moreover, cleanliness was found to be good for business. The middle classes no
longer deserted the city in the face of epidemics and clean streets enhanced property
prices, made for easier transport of goods and workers and for an altogether more
pleasurable shopping experience. From the start, cities prioritised the service to
business and middle-class areas and ‘left the poor, working class and immigrants to
live with a disproportionate amount of waste’ (2005a: 64).

42
Toxic Futures
In the twentieth century, the nature of waste was to change. The mass manu-
facture of plastic goods began to expand. Packaging started to displace the practice
of measuring out groceries such as sugar, flour and milk at the shop counter. The
shops themselves were reorganised as the forerunners of the modern supermarket
replaced the counter with check-out tills and channelled customers down aisles to
select pre-packaged items from the shelves. These changes took time but, by the
1930s, household bins were filling with rubbish that does not biodegrade. And
they positively bulged with plastic and paper when the packaging and marketing
industries took hold after the Second World War. Separation and recycling were
entirely abandoned as household goods flooded the market, things broken could
not be repaired or were not worth the effort, chemical fertilizers displaced organic
wastes on the fields and packaging was made for instant dumping.
Surveying England’s biggest tip, Andrew O’Hagan observes: ‘A dumped bath,
a heap of carpet, a thousand empty bottles of orange squash, a hundred thousand
legs of lamb, a million bottles of shampoo: it was all the stuff of life and it was all
evidence of death’ (2007). The business of burying or cremating39 the wastes of
consumer abundance was and is accompanied by the stench of industrial-scale rot
and decay. Writing for Greenpeace, industrial economist Robin Murray observes:
Throughout the twentieth century, waste was the terminus of industrial
production. Like night cleaners, the waste industry had the task of removing
the debris from the main stage of daily activity . . . The principle was to
keep it out of sight. Whereas consumer industries seek publicity, this post-
consumer industry prided itself on its invisibility (2002: 5).
The sheer scale of waste is staggering and this is just what we throw away. For
every bin of consumer waste, says Annie Leonard (2008), another seventy are
dumped by corporations in the process of production – from mining and extraction
to manufacture, distribution and marketing. This waste is kept on the other side of
the boundary between clean and unclean. It lies behind the bright new goods
displayed in bright clean shopping malls and must be concealed from the consumer.
Increasingly, the dirty part of the ‘value chain’ is located in ‘developing countries’
while the economies of ‘post-industrial’ nations are said to become cleaner as their
economies are ‘dematerialised’. The wastes of manufacturing at the lowest possible
cost fill the air and poison the water in the rapidly growing mega-cities of the East.
And upstream from manufacturing, mining waste is dumped right next to the mines,
smothering the land, choking the rivers and laying waste to the people who used
them and must be thrust aside.

43
Elite crisis
Meanwhile, what is thrown away and supposed to disappear overflows the dumps.
It leaches into the water; it blows on the wind; it contaminates the food chain. Every-
where, countries and municipalities are running out of space for landfills and both
landfills and incinerators are meeting with determined opposition from local
communities. Ultimately, says O’Hagan (2007), we find that ‘there is no such place
as “away” ’. What we throw away comes back to us, our past catches up with us.
Box 1.2 Sea trash
The sea is one kind of ‘away’. The North Pacific sub-tropical gyre is a vast area
of the ocean where the wind hardly blows. It is called a gyre because the
atmosphere and ocean circulate – very slowly – towards the centre. So things
that drift in to the edge – on the wind or in the sea – tend to get stuck in the
system. In the days of sail, it was known as the doldrums and terrified sailors who
feared being becalmed with never enough wind to sail out again. It remains
outside of the main shipping routes so hardly anyone goes there. In 1997, US
ocean researcher Charles Moore took his boat through the gyre. He expected to
see pristine ocean but ‘was confronted, as far as the eye could see, with the sight
of plastic . . . In the week it took to cross the subtropical high, no matter what
time of day I looked, plastic debris was floating everywhere: bottles, bottle caps,
wrappers, fragments’ (2003).
The gyre has become the world’s unseen dump as ever more rubbish
accumulates. Over time, the plastic breaks up into smaller pieces but, even
when microscopic in size, it is still plastic. The result is a plastic soup mixed up
with the plankton that is the basis of the ocean food chain. There is now more
plastic than plankton in the gyre.
The North Pacific gyre is the biggest of six subtropical gyres covering about
40% of the world’s oceans. All are accumulating trash. But sea trash is not
restricted to the gyres. Greenpeace (2006) reports that plastic can be found
floating everywhere in the world’s oceans, including the Arctic and Antarctic
seas, and litters the world’s coasts, even the coasts of remote and uninhabited
islands. Much of it does not float on the surface. It is either suspended in the
water or sinks into the sediments on the sea bed, particularly in coastal areas.
The trash enters the food chain via filter feeders and fish and birds that mistake
plastic objects for food. The toxicity is enhanced because plastic absorbs and
concentrates other chemicals polluting the seas. Toxicity is then further concen-
trated up the food chain until it returns to people in the fish on their plates.

44
Toxic Futures
Dumping on the poor
For industry and the middle classes, ‘away’ is mostly where poor people live.
Observing and fighting against this gave rise to the idea of environmental injustice
and racism in the US. As activist Dana Alston put it, ‘We have learned . . . that
communities of colour are targets for the siting of toxic waste dumps and most
hazardous industries’ not wanted in white, middle-class communities (1993: 188).
This targeting was accompanied by the promise of jobs in areas with high
unemployment. But ‘the few jobs that we did get were lower paying and more
hazardous jobs’ (1993: 189). The US environmental justice movement thus saw
‘putting it in black people’s back yards’ as the other side of the coin to ‘not in my
back yard’. The principle has now gone global as corporations export waste from
North to South in search of cheaper and less protected recycling labour or
unregulated dumping. In many cases, recycling is merely a cover for dumping.
South Africa’s apartheid planners similarly located poor and black communities
next to polluting mines, industries and waste dumps. Waste services were well
developed in white areas and the waste dumped in black areas, while basic services
for waste and sanitation and water and energy were systematically neglected in
black areas. Formal townships received partial and perfunctory services that were
not expanded even as population growth was stimulated by the policy of removals
from ‘white areas’. Removals also led to the creation of large and completely
unserviced settlements in rural areas or on the distant peripheries of the cities.
Human waste and garbage accumulated, smoke filled the air and water sources
were contaminated or difficult to access.
Poor people are still living with the dumps fed by the wastes of the rich and of
industry. Indeed, most dumps now have shack settlements alongside them because,
like other environmentally hazardous locations, this land has next to no value on
the market. It thus appears as open land on which poor people can establish a place
to live. Some also find the means of a bare livelihood by picking through the rubbish.
This pattern of injustice is not only a feature of societies with a history of
racist exclusion. It is part of the global ordering of power relations necessary for
the conduct of business. State investments in infrastructure are designed to defend
high-value locations, cleansed of dirt and poverty, in a global competition for private
sector investment, and both private and state investments are increasingly con-
centrated in wealthy areas. South Africa’s metropolitan municipalities are now all
focused on creating competitive ‘world-class cities’, producing ‘development
corridors’ linking prestigious industrial clusters, high-value residential enclaves and
airports, all wired up for global connection.

45
Elite crisis
In Bénit and Gervais-Lambony’s analysis, these spaces are produced as glittering
‘shop windows’ specifically designed to attract international investments. Thus
Johannesburg’s Security Strategy focuses on ‘areas which are visible to investors
and will have an impact on their perceptions’ (quoted in Bénit and Gervais-Lambony
2005: 6). As part of ‘cleaning up’ these visible areas, the poor are driven out to
spaces on the periphery where the language of ‘participatory democracy’ is invoked,
with more or less sincerity, to manage poverty in the decay at the ‘back of the
shop’. The wastes of these investments must also be cleaned away. In Cape Town,
taking residential wastes alone, the richest 16% of households40 produce over half
the waste while the dumps are located in poor areas (Swilling 2006). Dumps are
expensive but this is an investment that destroys value. The object then, is to invest
in removing the waste from wealthy areas and to invest as cheaply as possible in
disposing it at the back of the shop.
War on the poor
Yet the relation between poverty and waste goes deeper than this. Development
has, since the Second World War, been associated with geopolitical strategies. Thus,
the green revolution promised a better life for the rural poor in Third World countries
who might otherwise be inclined to revolt under the flag of the red revolution. For
the most part, it delivered new markets for corporate agri-business in alliance with
local elites while the dispossession of peasants and rural workers was naturalised in
the language of development as part of ‘the urban transition’. Policies that supported
the accumulation of wealth in urban areas would, it was promised, create industrial
jobs to absorb the flow of migrants. Nevertheless, permanent urban migration
was restricted in many countries, including South Africa, in order to subsidise low
wages for migrant workers with the shrinking product of peasant farming. Rural
insurgencies resisted dispossession across much of the Third World and were
contained by the deployment of counter-insurgency strategies framed in Cold War
terms. The defeat of this strategy in Vietnam was central to the crisis of US power
in the 1970s. The empire fought back. In the 1980s, the US used the economic
instruments of neo-liberalism to reclaim power and reframe development as a
function of ‘the market’.
There are now more people in the cities than in the country and one third of
them live in slums with little hope of secure work as economic growth yields fewer
jobs at lower wages. The urban poor are now at the centre of a development
discourse that expects them to create their own jobs through entrepreneurial
enterprise. This follows the World Bank’s prognosis that, throughout the ‘developing’

46
Toxic Futures
world, the informal sector will provide the jobs that the formal sector no longer
offers. In South Africa, it has been formalised in the language of the ‘two economies’
adopted by the Accelerated and Shared Growth Initiative for South Africa
(ASGISA). Even dump-picking is now counted as a job in employment statistics
and so contributes to government’s claims for employment growth. As urban scholar
Mike Davis comments, ‘it makes more obvious sense to consider most informal
workers as the “active” unemployed, who have no choice but to subsist by some
means or starve’ (2004: 25).
The poor have not gone quietly to the back of the shop. Across the world,
local resistance has manifested in protest actions: against removals from homes or
from street-trading sites, against restricted and unaffordable essential services, against
pollution by industries and waste dumps, against rising prices of energy and food,
against exclusion from decisions concerning their own futures. Confronted by armed
security deployed by the state, many protests turn into riots. They are not exclusively
urban but it is the urban terrain that is now given strategic significance. At global
level, the war on terror has replaced the Cold War as the organising principle of
violence directed at maintaining the conditions for capital accumulation. The US
Pentagon now draws on the theorists of ‘fourth generation war’ against ‘non-state
enemies’. These enemies may be international migrants or the urban poor who are
held to threaten state order and incubate or shelter terrorists. US battlefield training
grounds are therefore being made over, transformed from rural terrains for the
tanks to roll across to replicas of Third World slums – with a little help from
Hollywood set designers (Graham 2007).
The global sphere is not the sole reserve of the US nor even of the Northern
states in general. Raúl Zibechi, a Latin American researcher, notes that the Brazilian
army has admitted to using the same techniques in its occupation of Brazilian
favelas as it uses in its peacekeeping mission in Haiti. Zibechi comments that the
admission ‘largely explains the interest of Lula da Silva’s government in keeping
that country’s troops on the Caribbean island: to test, in the poor neighbourhoods
of Haiti’s capital, Port-au-Prince, containment strategies designed for application
in the slums of Rio de Janeiro, São Paulo, and other large cities’ (2007).
Force is not enough against non-state enemies. US commanders in Iraq see it
as one dimension of ‘total war’ in which traditionally civilian functions of service
delivery, political legitimacy and capitalist economic development are deployed. In
this context, Zibechi observes: ‘Electoral democracy and development are necessary
to prevent terrorism, but they are not objectives in and of themselves’. They are
rather the obverse of the walls built to contain those who refuse subordination.

47
Elite crisis
Gaza is the final image of the walled-in slum, cut off from all development and
made into a free-fire zone for the Israeli Army, which has specifically targeted its
capacity to deliver municipal services. Yet in much of the world, the walls are as
often symbolic as made of concrete and razor wire.
Control mechanisms – whether dressed in military garb, or as NGOs for
development, or promoting market economy and electoral democracy –
are interlaced and, in extreme cases like the suburbs of Baghdad, the slums
of Rio de Janeiro, or the shanty towns of Port-au-Prince, they are sub-
ordinated to military planning (Zibechi 2007).
In South Africa, Ashwin Desai and Richard Pithouse observe that the urban poor
have found themselves ‘under armed assault from the state’ (2004: 2). In Durban,
‘[t]he police that do this work are equipped and conduct themselves like soldiers
and are popularly known in fear as amaSosha . . .’ (Pithouse 2006: 8). Elsewhere, the
‘red ants’ have come to symbolise forced removals but are themselves impoverished
casual workers hired by firms contracted by local government. Even removals are
privatised. The objectives, observed in all South Africa’s cities, are to exclude the
poor from the centres where the cities hope to sell themselves to foreign investors
and to discipline their consumption of essentials. The scale of confrontation is
escalating. In 2007, over 10 000 protests were officially registered.
The people so excluded have been made the waste of the global economic
system as shown by the repeated use of the metaphor of cleansing to justify the
removals of street traders and poor residents. Robert Mugabe’s government in
Zimbabwe made the political stakes clear when it named its assault on people’s
livelihoods and dwelling places Operation Murambatsvina. This was given the
English title of ‘Operation Restore Order’ but was also known as ‘drive out the
rubbish’. The Zimbabwean government was widely condemned for the action,
including by institutions such as the World Bank. Yet this institution itself has been
widely associated with similar operations justified in the more moderate language
of globally sanctioned development.
People who are seen as waste understand it very well. At Sasolburg, the people
who pick waste from the dump told researcher Melanie Samson why the local
council did not consult them when it handed out a recycling contract to a private
company: ‘They say you are just people from the dumpsite. You are just scrap’
(Samson 2008: 27). This echoed the view of casualised workers in Johannesburg’s
waste system: ‘You are like the thing, which is inside that dustbin. You are just
stupid’ (Samson 2004: 1).
48
Toxic Futures
The Kennedy Road settlement in Durban is located next to the city’s Bisasar
Road dump. The people there initiated the formation of Durban’s shack-dwellers’
movement, Abahlali baseMjondolo (AbM), whose central demand is that they should
be addressed as equals, capable of expressing their own will, and should take the
central role in deciding their own future. They make the point that they are seen as
‘stupid, dirty, lazy, criminal and dangerous’ (Pithouse 2006: 21), a stereotyping that
associates them with waste – unclean and dangerous – and makes them appear
less than human and incapable of thinking and acting for themselves. Hence it is
used to exclude them from the city authority’s decision-making process which has
the intention to remove them from the central city. For several years the residents
of Kennedy Road acted within the official process. They moved to protesting both
the process and the agenda when the promises made to them were repeatedly
broken. Two things followed from this: first, the city authorities effectively branded
them as enemies of the state and, second, they started organising for effective
resistance within the settlement and other shack settlements across the city.
Since its inception, AbM has insisted on democratic practice and on people
thinking and speaking for themselves. In May 2008, people from other African
countries were subject to a series of xenophobic attacks by South African citizens.
The attacks took place mainly in poor areas because, it was said, foreigners were
taking what properly belonged to South Africans. In its response, AbM emphasised
that its membership, and indeed its leadership, includes ‘people born in other
countries’.41 At meetings called in response to the crisis, it opened up the issue to
debate but questioned those who attributed anti-social behaviour only to foreigners.
The message was that people should respond to the behaviour, not to the identity
of the person. ‘An action can be illegal. A person cannot be illegal. A person is a
person wherever they may find themselves. If you live in a settlement you are from
that settlement and you are a neighbour and a comrade in that settlement.’ At the
same time, AbM asked, ‘why it is that money and rich people can move freely
around the world while everywhere the poor must confront razor wire, corrupt
and violent police, queues and relocation or deportation?’42
In September 2009, some 40 men armed with an assortment of weapons
rampaged through Kennedy Road. Two men were killed in uncertain circumstances
on that night. In AbM’s account, the armed men were shouting, ‘The AmaMpondo
are taking over Kennedy. Kennedy is for the AmaZulu’.43 They demolished and
looted a number of houses, specifically targeting those of the Abahlali leadership
irrespective of their ethnic origins. Those targeted and other witnesses believe that
the attacks were instigated by local African National Congress (ANC) politicians

49
Elite crisis
and, in the following days, the ANC took control of the settlement – including the
community hall and AbM’s office. Thousands of people fled the settlement while
a local ANC councillor claimed that ‘harmony’ had been restored. Abahlali president
S’bu Zikode, whose own home was destroyed, responded: ‘For the ANC harmony
means their power and our silence. For us our silence means evictions, shack fires,
children dying of diarrhoea and the organised contempt that we face day after day
. . . Our crime is a simple one. We are guilty of giving the poor the courage to
organise the poor’.44 This, it seems, challenged the ANC’s possession of the poor
as a political asset, not just for the votes but for the claim to represent the interests
of the poor.
That claim is reflected at all levels in the global discourse of development. The
poor are at once excluded from the rights of citizenship and targeted as the objects
of development aid. The ultimate image of this is ‘the American warplane flying
above Afghanistan – one is never sure what it will drop, bombs or food parcels’
(Zizek 2002: 94). The war on terror already provides a proxy for great power global
rivalry over oil and other resources, shaping the diplomatic as much as the military
terrain. It justifies violence at any scale including outright invasion (as in Iraq),
counter-insurgency (as in the Niger Delta) or local actions aimed at containing
dissent and protest by workers and citizens. Yet it is also the symptom of the
failing power of imperial capitalism. That power is rapidly being overwhelmed by
the crises of its own making but is unlikely to be any less brutal in chaotic decline
than it was in its compulsive expansion.

50
Toxic Futures
2
The Vaal in South Africa
FROM A DISTANCE IT seems that a number of hills rise prominently over the
landscape of the Vaal Triangle. Coming closer, the hills turn to black and
barren slag or to grey ash with a thin covering of vegetation. They are toxic solid-
waste dumps and at the foot of each hill of waste is the industrial plant that made
it – Eskom’s Lethabo Power Station just south of Vereeniging, ArcelorMittal’s
Vanderbijlpark steelworks (formerly Iscor), Sasol’s coal-based chemicals industries.1
These plants themselves are impressive for their sheer size and their smokestacks
and flares dominate the urban skyline. Enormous volumes of gas flow up these
stacks and carry millions more tons of waste into the air. Hidden within the landscape
are the lakes and pools of liquid waste and, beneath the ground, poisoned aquifers.
What is turned to waste comes from the ground. The towns of the Vaal Triangle
are built on coal and black valleys are cut in the opencast mines while vast caves are
dug out underground. Coal is moved by heavy trucks or conveyor belts, some
stretching over twenty kilometres across the countryside, to feed a voracious
industrial appetite for energy. Remote from the Vaal, but linked to it by the heavy-
industry infrastructure of railways, pipelines, power lines and roads, are the iron
mines of Sishen and Thabazimbi, the manganese mines of Hotazel in the Northern
Cape, the coking coalmines of Witbank, the gasfields of Temane off the
Mozambique coast, and the oilfields of the Middle East and West Africa linked
through Durban. The infrastructure also carries the product to market. The
dominant domestic market of the Johannesburg conurbation is just 50 kilometres
to the north and the northern Free State goldfields lie just to the west. Much of the
product is exported through Durban, Richards Bay and Saldanha to the wealthy
North or the booming economies of China and India.
This industrial space is also linked to the far corners of southern Africa, to
Asia and to Europe in the lives and histories of the people. Its construction was a

51
The Vaal in South Africa
profoundly masculine as well as a racist enterprise and the men who designed,
managed and built it came for opportunity or were driven to work there by coercion.
Many of those who are settled in the area have families in rural South Africa, in
Lesotho and Mozambique and a part of the labour force still migrates for work.
THE CONCENTRATION OF POWER
The Vaal Triangle is a major centre of the minerals-energy complex but, for most
of its history, has had a subordinate place within that complex; the poor relation
expected to deliver cheap inputs for the greater profits of gold production. It has
also been central to state strategies, first for ‘inward industrialisation’ which, in the
1970s and 1980s, was reinforced by apartheid’s security needs, and more recently
for export-oriented production. Its economy is still reliant on the primary industries
of energy and steel and on cheap labour.
The concentration of power is magnified in the Vaal where the giant state-
owned corporations have largely dictated the production of space and built instant
towns on the open veld to serve their needs. The relationship between these state
corporations and private mining and industrial corporations as well as state and
private finance corporations has been close. It was founded on often tense
negotiation and deal-making relating to such issues as the price of energy and steel
to the mines as well as the cosier co-operation on a variety of joint projects –
‘public-private partnerships’ as they would now be called. The ‘mega-projects’ gave
physical form to the concentration of power, first in the Vaal Triangle and later at
Secunda (energy and chemicals), Richards Bay (aluminium smelting and coal
exports), Saldanha (steel and iron ore exports) and Maputo in Mozambique
(aluminium smelting). The Coega Industrial Development Zone near Port Elizabeth
is the latest initiative in this line but, having devoured much money with little
return, looks like a white elephant.
The major towns of the Vaal Triangle are named for the industries that founded
them and dominate their economies.
Vereeniging pre-dates the age of the mega-project. It was founded in 1892 on
the vast Vereeniging Estate belonging to the partnership of Lewis and Marks.2 The
town only really developed into more than a coalmining village after 1910 with the
building of the first Vaal power station and the Union Steel Corporation works.
Lewis and Marks sold the steelworks to Iscor in the 1930s while their interest in
the Free State goldfields, their collieries and the Vereeniging Estate itself were
taken over by Anglo American in 1945. AngloCoal remains South Africa’s largest
collier and one of the top global producers. It owns the New Vaal Colliery, a vast

52
Toxic Futures
Figure 2.1 Map of South Africa and the Vaal Triangle.

53
The Vaal in South Africa
opencast mine covering 2 275 hectares on the bank of the Vaal River opposite
Vereeniging. The colliery supplies Eskom’s very large Lethabo Power Station, the
latest of a succession of power plants in the area. The transnational Mittal
corporation took over Iscor in 2004 and now as ArcelorMittal its Vereeniging plant
produces ‘long steel’ products. There are several downstream metal and engineering
works in the town as well as refractory, ceramics and brick and tile industries.
‘Top Location’ in Vereeniging was once the social melting pot of the Vaal area
but now stands empty apart from the local museum. People were moved to the
‘Sharpe Native Township’, later Sharpeville, between Vereeniging and Vanderbijlpark.
The specific intention was to move black African workers away from the town.
Shortly afterwards, Indian and ‘coloured’ workers were moved from Top Location
to Roshnee and Rust ter Vaal well north of the town. The elite of Vereeniging,
meanwhile, have settled on the banks of the Vaal River upstream from the town.
The smaller town of Meyerton, north of Vereeniging, originates in late
nineteenth-century land speculation. Samancor Manganese, jointly owned by global
mining giants BHP Billiton and Anglo American, is the most significant industry
with two plants: Metalloys produces manganese used as an alloy in steel production
and DMS Powders makes ferrosilicon powders also for steel producers. Other
industries in Meyerton produce bricks, tiles and domestic ceramics.
Vanderbijlpark is a company town planned by Hendrik van der Bijl to house
workers for the giant Iscor works constructed in the 1940s. This is South Africa’s
original mega-project. Van der Bijl set up the state-owned Iron and Steel Corporation
in the late 1920s and the Vanderbijlpark plant represented the massive expansion
of capacity necessary to establish the corporation as an ‘integrated’ steel producer
controlling production from the iron ore mines, through iron smelting and raw
steel production to the manufacture of finished steel for sale to industry and the
mines. Iscor was privatised in 1989. Now owned by ArcelorMittal, which controls
10% of global steel production, the plant produces ‘flat steel’ products. It occupies
a massive site astride a ridge above the town. Several lesser, but nevertheless
substantial, downstream metal and engineering plants are clustered around it.
The formerly white town stretches south to the river some eight or nine
kilometres from the plant. It starts with white working-class housing, separated
from the steel plant by a light-industry buffer zone, and gets richer with the distance
from the plant. Nearest to the river and furthest from the blast of air pollution,
wealth is visibly displayed in opulent houses. The brassy Emerald Casino, occupying
a good stretch of river front, fits the neighbourhood. The real wealth of

54
Toxic Futures
Vanderbijlpark, however, is overseas in London where corporate boss Lakshmi
Mittal splashed R840 million on a house of unrivalled extravagance.
Bophelong and Boipatong, located west and east of the steel plant, are
Vanderbijlpark’s original townships. They were designed to house black workers
close to work in a way that would not take them through the white town south of
the plant. Boipatong is next to Sharpeville and both are downwind of the plant in
the path of pollution. Sebokeng lies to the north of ArcelorMittal. It started with
worker hostels built in the 1960s and 1970s and recently converted to residential
units. To the north again, Sebokeng merges with the older settlement of Evaton
where a history of black freehold has created a mix of owners and tenants and of
middle and working-class residents. Beyond this is Orange Farm, a settlement of
iron ‘shacks’ that was originally a last refuge for people who had nowhere else to go
and which remains at the economic periphery of the Vaal to the south and greater
Johannesburg to the north.
Sasolburg was established four years after Vanderbijlpark on the other side of
the Vaal River. It is also a company town, taking its name from Sasol, the South
African Oil and Gas Corporation initiated as a state-owned corporation. The town
is now a major hub for the petrochemical and chemical industries. The major
plants include the Natref oil refinery, Sasol Gas, Sasol Chemical Industries (SCI) –
producing olefins and surfactants, fertilizers and explosives, waxes and a variety of
other chemicals – Sasol Polymers, Karbochem and Safripol (formerly Dow
Chemicals). Sasol’s Sigma Colliery supplies SCI as well as Sasol’s own power plants
which supply electricity and steam to the chemical works. Sasol was privatised in
1979 and, since 1994, has developed into a substantial transnational corporation. It
is now tied into petrochemical global production networks through a web of
partnerships that include the oil supermajors ChevronTexaco and Total, state-owned
Qatar Petroleum, and chemical giant Mitsubishi.
As at Vanderbijlpark, Sasolburg’s white suburbs were designed as a ‘garden
city’ with tree-lined avenues. The white working-class areas are closest to the chemical
plants and waste dumps while wealthier Vaalpark is to the north, closest to the
river. In the planning of Sasolburg, a careful study was made of wind directions to
minimise the impact of pollution on the white town. Zamdela, the black township,
is separated from Sasolburg by the dumps. It lies in a triangle of land formed by
the chemical works to its north and mines and dumps to the west. To satisfy the
criteria of proximity to the plant and separation from the town, it was knowingly
placed in the path of the prevailing plume of pollution.
55
The Vaal in South Africa
The big industries of the Vaal Triangle are both major producers and consumers
of energy. Eskom’s 3 700 megawatt (MW) ‘six pack’ Lethabo Power Station is one
of the largest in the country. The Sasol 1 plant in Sasolburg started off making
synfuels from coal but now uses the same basic process to make heavy chemicals.
Sasol and Total own the Natref crude-oil refinery in Sasolburg, the oil being piped
up from Durban. ArcelorMittal’s Vanderbijlpark plant’s total energy consumption
is nearly equivalent to Lethabo’s annual output, while the Vereeniging plant, at one-
tenth the size, is a significant consumer.
FRONTS OF ENVIRONMENTAL INJUSTICE
The process of producing the space of the Vaal Triangle, of turning what was the
open veld landscape of the pre-colonial Tlhaping people into an industrial and
urban space, was dominated by the powers of the state and of capital and driven
by conflict. It has not been a tidy process as different elements within the state and
within capital have come into conflict with each other or made alliances according
to the contingencies of the day. More broadly, these powers have sought to control
labour and people and have, at every turn, met with resistances that have profoundly
influenced the process. This history of development has created many fronts of
environmental injustice. The costs have been mostly displaced on to the poor but
the economy as a whole will soon start feeling the pinch as development pushes up
against ecological limits while making those limits ever tighter.
The Vaal Environmental Justice Alliance (VEJA) was formed in 2005 at a
meeting of community-based organisations. The meeting drew groups from across
the political spectrum because, as the people say, ‘everybody in the Vaal is polluted’.
Taking inspiration from the well-established South Durban Community
Environmental Alliance (SDCEA), VEJA is inclusive. It is composed of twelve
organisations of varying shapes and sizes that have been active on different fronts
of environmental justice and so brings both the people and the issues together in
a common group for the first time. VEJA’s expressed demands are that the pollution
must stop, the damage to the environment must be repaired and people must be
compensated for the damage to their health and livelihoods. People are well aware
that these demands have far-reaching implications and the idea of ‘another Vaal’,
echoing the World Social Forum demand for ‘another world’, is very much part of
their debates.
In 2006, when VEJA participants showed us around the Vaal, the commodity
boom was in full swing. It started off at a low point in 1999 and, with some
precipitous drops on the way, gathered pace through to 2008 and drove growth in

56
Toxic Futures
the South African economy to about 5.5%. This chapter describes conditions in
the Vaal at a time when the captains of industry were confidently proclaiming a
commodity super-cycle and finance minister Trevor Manuel said the economy was
hitting the ‘sweet spot’. Within the logic of capital, this is about as good as it gets
for the majority of the Vaal’s people. This chapter is largely based on our
conversations with people – not all of them VEJA activists – who shared their
formidable analytic understanding as well as their experience of living at the cruel
heart of the minerals-energy complex.
Toxic externalities
Bad air on the fencelines
In their annual reports, the Vaal Triangle’s big corporations all state their commitment
to reducing carbon emissions. None has done so. In the boom years to 2008, their
carbon emissions rose with production except where production was interrupted
by plant failures. Sasol and ArcelorMittal focus on reducing carbon intensity –
emissions per unit of production – but whatever is gained is more than lost to
increased production. Real reductions were forced on them when the power tripped
out in early 2008 and, more significantly, the economy tripped out later that year.
Along with carbon comes a cocktail of other air pollutants with immediate
consequences for people’s health and well-being and for the productivity of natural
resources. The Vaal Triangle was the first air pollution hot spot to be declared a
‘priority area’ by the national Department of Environmental Affairs and Tourism
(DEAT). Yvonne Scorgie produced a comprehensive report on air quality in the
area in 2004 based on available information. She warns that this information is far
from complete, mostly not validated and often dated. It should be added that all
information on industrial source emissions and most information on ambient air
quality comes from industry and that, throughout the world, industry commonly
under-reports or conceals emissions. Scorgie lists a total of 58 polluting industrial
and mining activities and the top polluters for particulates, sulphur dioxide and
carbon dioxide are ranked in Table 2.1 based on information that dates from 2000.
All emissions have increased significantly since then. The Vaal Triangle totals at the
bottom of the table include emissions from all the industries listed by Scorgie.
Other big-ticket pollutants are nitrogen oxides from all the big plants and
hydrogen sulphide from Sasol’s coal-based processes. Sasol is South Africa’s biggest
source of volatile organic compounds (VOCs)3 while ArcelorMittal also emits
significant amounts but does not report them. VOCs include a heady range of
chemicals that evaporate easily into the air and most of them are highly toxic.

57
The Vaal in South Africa
Sasolburg Air Quality Monitoring Committee (SAQMC) activists, using low-tech
‘bucket’ sampling, revealed some sixteen different VOCs in Zamdela’s air in 2000.
Several of these compounds had not previously been reported in South Africa.
Samples showed dangerously high levels of benzene and high levels of toluene
and xylenes at some sites.
Sasol switched from coal to gas piped from Mozambique to provide the
feedstock for chemical production in 2005 and said this reduced its sulphur dioxide
and nitrogen oxide emissions in South Africa and ‘eliminated’ hydrogen sulphide
odours at Sasolburg.4 It also promised to reduce emissions of eight VOCs – benzene,
butadiene, ethylene oxide, propylene oxide, vinyl chloride monomer, acetaldehyde
and formaldehyde – by 50% over the next ten years. Five years later, it had reduced
VOC emissions by just 12%. In 2005, ArcelorMittal reported only its greenhouse
gas emissions. Following the tighter regulation promised with the declaration of
the Vaal as a priority area, its 2008 report identified sulphur dioxide and particulates
as its most significant emissions. It outlined three projects to reduce them but two
were under review because of cost escalations and the crash in sales revenues. Its
recorded emissions intensity was actually higher because it introduced ‘more accurate
emission inventories’.5 In other words, it had previously under-reported. Eskom
said it reduced particulate emissions per megawatt-hour in 2005 by installing filter
bags at Hendrina and Arnot stations and by ‘optimisation of the sulphur trioxide
flue gas conditioning plant at Lethabo Power Station’.6 The improvement has,
Table 2.1 Ranking of top industrial polluters in the Vaal Triangle in 2000. Emissionsgiven in tonnes per annum (tpa).
Particulates (PM10) / tpa Sulphur dioxide / tpa Carbon dioxide / tpa
IscorVanderbijlpark 8 990 Eskom Lethabo 219 868 Eskom Lethabo 21 920 000
Eskom Lethabo 8 150 SCI 33 061 SCI 7 100 000
Iscor Iscor IscorVereeniging 8 046 Vanderbijlpark 23 203 Vanderbijlpark 6 244 000
Sasol/ Total Sasol/ TotalSCI 6 618 Natref 19 144 Natref 3 076 950
Vaal TriangleTotals 43 040 298 624 38 565 422
Compiled from Scorgie 2004.

58
Toxic Futures
however, been largely offset by increased production. Its sulphur dioxide and
nitrogen oxide emissions have increased in line with production.
Scorgie shows that industry emits 90% of total air pollution in the Vaal Triangle.
Much of it is emitted from high stacks claimed to reduce the local impact. During
winter, however, temperature inversions trap pollutants in the lower atmosphere,
creating a visible brown haze, and down-drafting brings the pollution down to
earth. Most high-stack emissions in fact come to earth within a ten-kilometre radius.
Further, particulates from ArcelorMittal and VOCs from Sasol are emitted close
to the ground while dust from coal, slag and ash heaps blows across neighbouring
settlements. Spontaneous combustion at New Vaal Colliery results in repeated
fires at ground level. Scorgie notes that such fires are estimated to burn as much
coal as Eskom and are associated with ‘elevated sulphur dioxide concentrations . . . in
the Witbank and Vaal Triangle areas’ (2004: Section 3: 64). They burn without any
pollution abatement whatsoever and under conditions that produce a high
percentage of incompletely combusted VOCs, such as the carcinogenic benzene.
Throughout the Vaal Triangle, people complain of itching eyes and burning
mucous membranes whenever the wind is in their direction. Zamdela, across the
road from the Sasol 1 chemical plant and downwind of it, is particularly hard hit.
Even following Sasol’s conversion to gas, the air has a sharp chemical smell and
people complain of constant headaches.7 Health impacts, and struggles for relevant
information, are reported in more detail in Chapter 3.
Metal pollutants are a growing area of concern. Samancor releases manganese
to the air. ArcelorMittal releases manganese, chrome, iron and other heavy metals.
Coal also contains trace metals, including mercury, which is highly toxic even at
very low levels of exposure. Mercury is present in minute proportions but the
massive scale of coal-burning by Eskom, Sasol and ArcelorMittal makes it significant.
Incidents – fires, explosions, leaks and flaring – occur with alarming regularity
at many South African plants. As well as adding to the overall burden, incidents
produce pollution spikes that result in intensive exposure. Even where the duration
of such exposures is limited to a few minutes, the impacts on people’s health are
often severe and can be long lasting. Moreover, successive exposures have a
cumulative effect that comes on top of the background exposure from normal
operating emissions.
Incidents are not accidents. They are in principle avoidable and a sign of
negligent environmental management. In 2005, the Sasolburg industries reported
86 significant incidents but there is no independent verification or guarantee that
there were not in fact more. None of these incidents attracted sanction or any
59
The Vaal in South Africa
other visible enforcement from the DEAT. One example serves to illustrate the
easy collusion between industry and government that has characterised the history
of environmental regulation.
In July 2005, Sasol recorded ‘a few exceedances of the proposed annual standard
of 1.6 ppb [parts per billion]’ for benzene.8 This followed the release of ‘cracker
petrol’ from the Sasol 1 plant. SAQMC reported petrol odours to Sasol on 26 July
and took a bucket sample that showed benzene concentrations of 900 ppb. Exposure
for one hour to this level of concentration results in serious symptoms. Sasol took
its own sample 37 hours after SAQMC raised the alarm and after corrective actions
had been initiated. It found 13 ppb and concluded that this did not warrant
classification as a reportable incident. groundWork and SAQMC concluded that
its sampling methodology was ‘clearly flawed if not deliberate’. They sent all relevant
information to the DEAT, which has regulatory authority for the large industries
in the area, and called for Sasol to be prosecuted. The DEAT took no action to
sanction Sasol.9
Poisoned waters
Intensive energy use is associated with intensive water use and pollution, which is
ill-advised in a dry country. The water supply to Gauteng, the northern Free State
and Mpumalanga is increasingly met by cross-watershed transfers from Lesotho
and KwaZulu-Natal to the Vaal River and further transfer schemes are planned. At
the upstream end, rural communities have been removed to make way for the large
dams that supply the water and have lost their best land. At the downstream end of
this massive ‘re-plumbing’ of waterways, users across half the country – as far
south as Port Elizabeth – will find themselves in competition with inland industry
in years of widespread drought. Climate change greatly increases the likelihood of
such droughts.
Eskom’s national water use in 2005 amounted to 347 135 million litres, Sasol’s
global use was 163 203 million litres – most of it in South Africa – while Mittal
South Africa used about 19 833 million litres in 2004. The Vaal River Eastern Sub-
System Augmentation Project (VRESAP), opened in 2009, pipes additional water
from the Vaal Dam to the eastern highveld and is particularly intended to secure
the water supply to Eskom’s Mpumalanga power stations and Sasol’s plants in
Secunda. In the Vaal Triangle, Lethabo draws 76 650 million litres annually, Sasol’s
Sasolburg plants draw 19 436 million litres10 while ArcelorMittal’s Vanderbijlpark
and Vereeniging plants respectively draw 8 928 and 939 million litres.11
Much of the water used by industry is recycled or returned to groundwater or
rivers but not necessarily cleanly. In 2005, Sasol produced 44 082 million litres of
60
Toxic Futures
liquid effluent globally. Its Sasolburg operations produced 17 111 million litres
that were treated and returned to the Vaal Barrage downstream. The returned
water carries a heavy load of mineral salts into the river. Before the conversion
from coal to gas feedstock in 2005, the salt loading was 30% higher but the water
in the barrage must still be diluted with releases from the Vaal Dam to make it
useable.
This logic extends upstream as the transfers from Lesotho are intended to
compensate for the declining quality of the Vaal River water as much as to increase
the supply. VRESAP adds a new twist as it delivers water back upstream. According
to the minister of Water Affairs, it was built both to meet expanded demand and to
compensate for ‘an expected deterioration in water quality’ on the highveld.12 This
expectation is well founded. The Olifants catchment, which drains northward across
the Witbank coalfields, is degraded to the point that ‘water in the Middelburg Dam
is now no longer fit for human consumption for 40% of the time’ (McCarthy and
Pretorius undated: 15). The Vaal catchment drains south from the highveld
watershed and includes Secunda, two power stations and new coalmines being
opened up at the headwaters in the Mpumalanga lake district. Thus, clean water
will be taken from the Vaal Dam but dirty water will be returned to it.
Nationally, according to the draft National Strategy for Sustainable Develop-
ment, 82% of river systems are now threatened while half the country’s wetlands
are already destroyed. A number of small rivers and streams feed into the Vaal
River through a complex of wetlands in the Triangle. The wetlands served both to
regulate the flow of water and to filter it clean. These environmental services are
now destroyed and the Rietspruit and Klip rivers carry a heavy load of pollution
from the Reef mines and industries into the already polluted Vaal.
The industries of the Vaal Triangle itself have unerringly located their dumps
and slimes on watercourses. Eskom’s Highveld and Taaibos Power Stations are
now demolished but five hills of ash still leach contaminants into the Taaibosspruit.
Lethabo is on the bank of the Vaal while the New Vaal Colliery that supplies it is
bounded by a bend of the river. A few kilometres downstream, Sasol’s Wonderwater
opencast coalmine, recently mined out and closed, occupies another bend of the
river. Sasol’s ash dump and effluent ponds, as well as Sasolburg’s town dump, are all
located above the Leeuspruit.
ArcelorMittal’s massive site is located astride a ridge above Vanderbijlpark and
contains the mountainous slag-heap and very large effluent dams. The dams have
been in use since 1952 when Iscor started production but have never been lined to
prevent effluent drainage into the groundwater. The ridge is a local watershed. In

61
The Vaal in South Africa
a detailed study, Cock and Munnik note that the site was purposely chosen ‘to
allow for waste water to drain away effortlessly’ (2006: 12).
To the west, it drains through what was once the smallholder farming area of
Steel Valley. More than five decades of unmitigated pollution has poisoned the
groundwater with a toxic mix of heavy metals, dissolved salts and hydrocarbons
derived from coal. It has also raised the water table. By 1996, the poison plume
from the effluent dams was thought to cover up to seven square kilometres. It is
supplemented by leachate from the slag-heap that rises darkly over Steel Valley and
has not been capped. Farming is no longer possible: ‘People and animals have been
poisoned, crops have failed and lives have been devastated’ (18). The area is now
deserted. In 2006, two of 500 smallholders were still holding out. They lived behind
high electric fences, recently erected by ArcelorMittal, which mark what is effectively
an environmental sacrifice zone. One of them, Strike Matsepo, said it felt like his
home had been turned into a prison. This western drainage flows on to the Rietspruit
River and thence to the Vaal downstream at Lochvaal.
To the east of the ridge, water drains through the populous black townships of
Boipatong and Sharpeville before emptying into the Vaal. This was previously a
complex of wetlands and streams and local people say they once found freshwater
crabs. Now it is stagnant and lifeless. An unlined canal drains water from the Arcelor-
Mittal site and runs below the town dump but groundwater still rises to the surface
in many places. Local people believe that a ‘pollution plume is moving east, it is
already in Boipatong and will soon be in Sharpeville’ (quoted in Cock and Munnik
2006: 33). They have received no clarity on the status of the water and have seen
no action from the national Department of Water Affairs and Forestry (DWAF).
Steel Valley residents challenged Mittal in a number of court cases and through
direct action. The local and national media have also spotlighted their pollution. In
ArcelorMittal’s own words, ‘because of legislation, legacy issues, legal action against
the works and increased pressure from state departments during the late nineties,
the need was identified to develop an environmental masterplan’.13 Said to be 6 000
pages, the plan is secret so communities have to guess how much they have been
polluted and trust ArcelorMittal to remedy it. ArcelorMittal says it has committed
close to R1 billion for environmental mitigation. This includes what it claims is a
‘zero effluent’ water-treatment plant opened in 2005. There has been no indication
that the plan includes cleaning up the Steel Valley aquifer. At the same time,
ArcelorMittal plans to spend R8 billion on expansion. The end result may be more,
not less, pollution.
As with air, business as usual pollution is supplemented by incidents. Arcelor-
Mittal reported a ‘serious incident’ in July 2004 when it spilt a ‘significant amount

62
Toxic Futures
of “Spent Pickle Liquor” ’ – a hazardous waste composed of acid contaminated
with heavy metals and sludge.14 That this was reported represents some improvement
on 1994 when Iscor failed to report a major spill of highly toxic chromium salts.
ArcelorMittal said it had taken action to ‘prevent future similar incidents’ but made
no mention of remedial action. Nor was there any reference to action or penalties
by the regulator. Sasol reported three spills at the Sasol 1 site, including a serious
spill of vanadium, in just the two months of February and March 2006.
South Africa is prone to floods as well as droughts, and the severity of floods
will increase with climate change and so increase the likelihood of effluent overflows.
Following rain, a white powdery substance – associated with sulphuric acid
contamination – ‘covered the veld’ in Steel Valley and flooding in 1996 increased
the general levels of contamination, according to erstwhile residents (Cock and
Munnik 2006: 14). In January 2005, oil-contaminated water overflowed from Sasol’s
Secunda effluent dams into the Klipspruit River following heavy rain. Sasol reported
the incident and took remedial action. What Sasol reports as ‘very low volumes’
overflowed from a Sasolburg ash dam into the Leeuspruit following rain in February
2006.
Floods also flush accumulated silts from river-beds and wetlands. In the Vaal
area, these silts are heavily contaminated. During flooding in January 2006, sewage
works overflowed and contaminated silt was flushed into the Vaal River, resulting
in major fish kills and the virtual destruction of the river’s ecosystem, according to
Beeld.15 Sewage was identified as the primary destroyer but it is most probable that
there was also a heavy load of industrial pollution. This has not been investigated.
Poisonous work
Many of South Africa’s industrial workplaces are highly polluted environments
and workers are often not provided with proper protective clothing and masks.
Workers who live near polluting industry thus get a double dose – at work and at
home.
In 1999, medical tests were carried out on 509 workers at Samancor. The results
showed that most workers, from all sections of the plant, suffered from manganese
poisoning. This affects the mind – creating dizziness and confusion – as well as
organs such as the kidneys. Ex-workers believe that a high proportion of their
comrades have died as a result both before and after 1999. The medical report to
Samancor recommended that workers should be informed of their individual results.
The corporation did not do this. Instead, it proposed voluntary retrenchments
and, when workers did not agree, implemented forced retrenchments. Samancor

63
The Vaal in South Africa
agreed to the redundancy deal with the National Union of Metalworkers of South
Africa (NUMSA) but the union did not consult its members – it merely informed
them and, indeed, put pressure on them to accept the deal. The retrenchments
gave redundancy but not illness benefits.
In the meantime, the report was leaked to workers. Having lost their union
membership along with their jobs and finding no support from NUMSA, they
formed the Samancor Retrenched Workers Crisis Committee (SRWCC). This
committee mounted a campaign demanding full reasons for their retrenchments
and proper compensation for occupational illness from the corporation. In 2006,
Samancor finally agreed to compensate workers found to be suffering from
manganism by independent doctors. In 2008, ex-Samancor workers joined workers
from Assmang’s manganese smelter in Cato Ridge near Durban at hearings into
the deaths and disabilities of Assmang workers from manganese poisoning. They
marched into the hearings bearing a coffin to commemorate ‘all our brothers killed
by Assmang and Samancor’.16 Just days before the hearing, five Assmang workers
were killed when a furnace exploded. This followed an earlier blast that killed one
worker in December 2007. NUMSA said that the furnace had been kept going
against the advice of engineers.
Workers retrenched by Iscor before Mittal’s takeover also observe that they
received no compensation for occupational illness. The manganese from Samancor
is just one of a number of toxic substances used or emitted at the plant at
Vanderbijlpark and workers at the coke ovens, smelting furnaces and tapping floors
are also subject to extreme heat. Coke-oven workers are typically exposed to a
variety of VOCs, including benzene, and to hydrogen sulphide, carbon monoxide,
ammonia and particulates. Furnace and tapping-floor workers are exposed to heavy
metal fumes, carbon monoxide and particulates. Further down the line, they are
exposed to vapours from solvents and acids (pickle liquor) used to clean metal
surfaces and to various chemicals used to coat it. Workers say typical symptoms
include ‘high blood pressure, kidney problems, headaches, swelling feet, eye
problems, ulcers [and] body swellings’ (Cock and Munnik 2006: 41). Respiratory
illnesses are also widely reported while cancers should be expected.
Several workers observe that they were retrenched when they showed signs of
occupational disease. They are unable to corroborate this because the corporation
says that their health records were lost in a fire. The story of the fire is both
convenient and vague and workers suspect that it is more smokescreen than fire.
More generally, they believe that Iscor used mass retrenchments to dispose of
occupational health liabilities. The corporation agreed with NUMSA to retrench

64
Toxic Futures
workers over 45, reversing the common practice of ‘last in, first out’ and enabling
Iscor to rid itself of workers who were already sick or whose long-term exposure
put them at risk. As at Samancor, workers say the union did not consult them on
this policy change.
Throughout the Vaal Triangle, at Sasol as well as at ArcelorMittal and Samancor,
workers and activists say that company doctors cover up occupational and
environmental illness. Thus, it was said that company doctors always prescribe the
same remedy irrespective of symptoms, that independent doctors give different
diagnoses and frequently identify occupational and environmental causes, that most
workers cannot afford such independent advice but those who do risk losing their
jobs if they talk about it.
Back at Samancor, many of the jobs were outsourced to contractors. Ex-workers
see this as the continuation of a strategy, already evident in the corporation’s
approach to retrenchments, designed to reduce the corporation’s liability for worker
health and safety and, conversely, limit workers’ rights. They say that those still
working at the plant know that the job may cost their lives but cannot afford to lose
their livelihoods. At both Samancor and ArcelorMittal, it appeared that NUMSA
had abandoned responsibility for health and safety, accepting it as a management
prerogative.
Throughout the Vaal Triangle, people observe that outsourcing is now common
practice. It takes two main forms with some variations in between. First, work is
contracted out to small firms whose survival depends on the corporation and who
must cut costs to meet the price terms dictated by the corporation. According to
Mabuti Mlangeni, Sasolburg organiser for the Chemical, Energy, Paper, Pulp,
Wood and Allied Workers Union, Sasol has now added to the price pressures by
co-ordinating bidding for outsourced work and so intensifying competition between
small firms. Cutting wages and health and safety standards are then made the basis
for that competition. Alternatively, jobs are made temporary as individual workers
are employed on fixed-term contracts and redefined as contractors. Such contractors
are often supplied through labour brokers, who are supposedly responsible for
benefits such as pensions and medical aid, and contracts are managed to prevent
claims for permanent employee status.
The effects of these practices are devastating. Following a series of incidents
in 2004 (see Chapter 6), Sasol undertook a major safety review and promised a
makeover of its safety training programme and safety ‘culture’, including ‘contractor
management standards’ (Sasol 2005: 45). But it ducked the central issue of using
contracting to cut costs and limit liabilities. This results in the long-term erosion of

65
The Vaal in South Africa
institutional memory and intimate knowledge of complex plants. More immediately,
it increases the likelihood of poor co-ordination and communication between
different work teams. In June 2006, despite the safety makeover, nineteen people
were injured in an explosion in Sasolburg. According to Sasol, an ‘independent’
contractor was clearing chemicals left by another contractor ‘after vacating the
premises’. Sasol’s reporting is calculated to distance the corporation from
responsibility although it clearly controls the site as well as the terms on which
both contractors operated.17 Globally, Sasol did reduce its reported number of
‘fires, explosions and releases’ from 32 in 2004 to 15 in 2006. But the number has
risen every year since with 36 reported in 2009.
Enclosed economies
Jobs, income and poverty
Mining and heavy industry in the Vaal Triangle created a mass workforce largely
made up of men. Workers faced the brutality of racist baasskap – which gave any
white worker authority over all black workers irrespective of experience or position
– and wages were below the costs of household maintenance.18 This regime was
increasingly challenged by union organisation but much of the cost of production
was transferred on to increasingly stressed families both in the townships and in
the rural homes of migrant workers. Faced with intense resistance, the apartheid
government declared a State of Emergency in 1985. Brutal repression failed to
subdue the anti-apartheid resistance but did enable corporate capital to crush a
series of worker strikes that posed the most serious challenge to its power since
the 1922 Rand Rebellion.
The workers’ defeat enabled the corporations to impose a new round of
industrial restructuring. Since the late 1980s, the masculine workforce has been
torn apart and reconfigured. Across the Vaal area, people see the same pattern:
massive redundancies have left a core of workers at the big plants while what the
corporations redefine as ‘non-core’ business is contracted out. Between 1993 and
1998, 46 000 jobs, including 20 343 manufacturing jobs, were cut on the Gauteng
side of the Vaal Triangle according to development researcher Wim Pelupessy
(2000: 8). This followed the broader national trend. In the first decade of democracy,
about two million full-time formal-sector jobs were cut in the name of competitive-
ness and productivity. Iscor alone cut 30 000 jobs nationally and Eskom cut over
10 000. Nor has the massacre of people’s livelihoods been reserved for the urban
areas. Many thousands of farmworkers in the Free State have lost both their jobs
and their homes and moved into the towns of the Vaal Triangle to find somewhere
to stay.

66
Toxic Futures
What people see happening in the Vaal is what is evident at national and indeed
global levels. Labour scholars Edward Webster and Karl von Holdt (2005) observe
that the world of work is increasingly unequal and divided into three major ‘zones’:
the core, non-core and peripheral zones.
At the centre is the core zone of permanent full-time workers, numbering
6.6 million nationally. Changes in the workplace regime have been highly uneven
depending on the strategies and coherence of management and of unions at
particular corporations and plants. Authoritarianism and racism remain entrenched
in many plants and migrant workers are still employed, particularly in the mines
including Sasol’s Sigma Colliery.
In general, core workers’ skills and wages have been upgraded and they have a
degree of security both in their jobs and in benefits such as medical aid and pensions.
They have access to legal rights under the post-apartheid labour laws and most are
organised in trade unions. At the same time, they work under intense pressure to
increase productivity and often in a dangerous environment. ArcelorMittal has two
strategies for increasing productivity: multi-skilling to create a more flexible
Box 2.1 Retrenched and destitute
Workers retrenched from the Vanderbijlpark plant believe they were cheated out
of their full entitlement. Many have given up and returned to their rural homes
but a group of men living at the KwaMasiza hostel have remained to fight for
their rights and are engaged in a protracted court challenge to the legality of
their retrenchments. It is a hard road. ‘I am here in prison waiting for the money
due to me,’ said Ernest Sigaqana. He was offered a retrenchment package of
R32 000 but refused to sign for it or to take it, believing that this was not the
amount due after 22 years working at Iscor. The money nevertheless appeared
in his bank account the next day.
All the men were migrant workers and their families still live at their rural
homes. Sigaqana came to work at Iscor from Qumbu in then Transkei in 1979.
The men observe that the policy of retrenching older workers left them without
hope of getting another job. Most of them are in their late fifties and early sixties.
The retrenchment money has long since run out but they are not yet eligible for
pensions. Their families no longer visit them and nor do they go home. ‘There is
no money here and no money there.’

67
The Vaal in South Africa
workforce, and retrenchments. In 2004, it agreed to a two-year moratorium on
forced retrenchments with unions but reduced its permanent workforce by 9%
and 8.5% in each of those years through voluntary retrenchments and by not filling
posts.19 Nevertheless, people in the Vaal Triangle observe that the big corporations
find ways to get rid of workers who challenge them. Core workers are always at
risk of being ejected from the inner zone.
Outside the inner core are the outsourced workers employed by contractors or
employed as fixed-term contract labour, numbering about 3.1 million. They may
be part-time or temporary workers, many are ‘permanently temporary’ and most
are poorly paid. They, and the small contracting firms, are at the beck and call of
the corporations – available when work picks up, dispensable when it falls off and
vulnerable to arbitrary reductions in pay. Mostly, they are not organised, partly
because unions have not come to terms with organising them and partly because
they are threatened with losing their jobs, or their opportunities for work, if they
join a union. Their insecurity is heightened by the knowledge there is a ‘reserve
army’ of unemployed workers desperate to take their place. In Sasolburg, Sasol
employed about 9 000 outsourced and contract workers as against 6 000 permanent
workers in 2005.
The peripheral zone is made up of about 2.2 million informal workers and
8.4 million unemployed people. In Emfuleni Municipality north of the Vaal River,20
Tielman Slabbert (2004) of the Vaal Research Group shows that about 9% of
workers are active in the informal economy. They are regarded as employed however
meagre or irregular their income. The garbage trucks arriving at Vanderbijlpark
dump are met by more than 50 waste-pickers. They compete for recyclables such
as plastic sheets and metal, packing them into large bags. The market in recyclables
yields slim pickings but the pickers count as having jobs. Street traders set up their
stalls mainly at taxi ranks but, because the people are poor, their income from
trading is small. Unemployment in Emfuleni, using the broad definition,21 was
51% in 2001 and rose to 54% in 2003 according to Slabbert. More than half the
households in Emfuleni could not afford the costs of bare subsistence and 64%
could not afford additional necessities such as school fees and medicines as well as
subsistence.
South of the river in the Free State, Metsimaholo Municipality used the narrow
definition of unemployment in its 2003 Integrated Development Plan (IDP). It
put unemployment at just over 26% for the Sasolburg area. If the broad definition
was used, the figure would be significantly higher. Further, this figure did not
‘accommodate the outflow of farmworkers from farms to towns as well as growth
68
Toxic Futures
in townships due to other reasons of urbanization’ (Metsimaholo Municipality
2003: Section 5: 3). The way the figures were done, Metsimaholo’s economically
active population makes up only 42% of adults aged from 20 to 65. Local people
believe something like 80% of all adults have no jobs and, according to the IDP,
63% ‘of the potential labour force earn no income’ (Section 5: 3). Many of these
people were supported by others but more people depended on fewer incomes.
Fully 9% of households had no income whatever.
Throughout the Vaal, more men than women have jobs and women are more
likely to have low-paying work. Women are thus more likely to be poor. Poor
households also tend to be larger than better-off households, so what money comes
in has to support more people. Most of those supported are children. They are the
majority of the very poor. Pensions and child support grants mitigate this poverty
to some degree but do not reverse it.
In 2004, government claimed that over two million jobs were created in the
first decade of democracy. Webster and Von Holdt note that most of these new
jobs are either ‘non-core’ or informal. They conclude that ‘the erosion of core
jobs, the growth of insecure and low-wage non-core jobs, and the expansion of
the peripheral zone have generated a widespread increase in poverty’ (2005: 23). As
with the apartheid work regime, the costs are transferred to households. Insecurity
is taken home with alcohol abuse and conflicts over who spends what, and home
becomes a fragile refuge, a place ‘to hide one’s poverty’ (24).
By mid-2008, government was reporting substantially reduced unemployment
– down to 23% on the narrow definition from 31% in 2003. Then commodities
crashed and, by mid-2009, the economy had shed over a million jobs. Following a
reprieve at the end of 2009, another 170 000 jobs were lost in early 2010. Statistics
South Africa (StatsSA) put the official unemployment rate at just over 25% but the
statistic was helped because hundreds of thousands gave up looking for work.
Enclave development
Clearly jobs are at a premium in the Vaal and local people say they want the big
corporations to clean up, not to shut down. The corporations themselves see jobs
as central to their ‘social licence to operate’. Yet people are increasingly questioning
the logic. They remark that those born in the Vaal Triangle are less likely to get jobs
than newcomers to the region. One reason is that, having grown up in the bad air
of the Vaal Triangle, locals tend to fail the pre-employment medical test.22 The
corporations, it seems, rely on the fresh blood of people they have not yet con-
taminated.
69
The Vaal in South Africa
They also observe that these industries are capital-intensive and are making
very substantial profits but few jobs. After so many rounds of retrenchments,
ArcelorMittal is no longer seen as a source of work. The local economy may be
heavily dependent on the corporations but more and more local people see less
and less benefit. They are ‘de-linked’ from this formal economy and the money
simply bypasses them. This is the logic of ‘enclave’ development.
The most extreme examples of enclave development are associated with
extractive industries – mining and particularly oil – in poor countries with ‘failed
states’. ChevronTexaco’s luxury Malongo compound in Cabinda, Angola, is separated
from the surrounding poverty by several rings of security. Corporate personnel, all
foreign, never step into the local community. The flow of oil money is equally
divorced from the local economy but tightly integrated with the global money
centres. It is repatriated to the US in corporate profits, it returns to global finance
capital through Angola’s endless repayments on national debt, and it lines the pockets
– or international bank accounts – of the corrupt ruling elite. In 2006, Angola’s
GDP growth was turbocharged to 19% with windfall oil profits and massive foreign
direct investment but no expansion of local jobs or income. As James Ferguson
puts it: ‘The movements of [global] capital cross national borders, but they jump
point to point, and huge areas are simply by-passed’ (2005: 379).
South Africa is not Angola and the Vaal Triangle is not Malongo. Yet the enclave
logic is powerfully at work as the economy is increasingly integrated into the circuits
of global production networks. If apartheid attempted to confine poverty to the
homelands, townships and hostels, wealth is now securing itself within gated
residential estates. The most extravagant is Sandhurst in Sandton where 640 houses,
with an average value of R30 million each, are protected by kilometres of high-
security fencing. The logic is actively extended through government economic and
spatial planning and the ambition of the big metropolitan municipalities to create
competitive ‘world-class cities’, on display to foreign investors in the glittering shop
windows while the poor are packed off to the back of the shop.
Back-door delivery
At the edge of Gauteng, much of the Vaal looks more like the back of the shop
than the shop window. As the jobs are swept out of the factories and neighbouring
farms, ‘delivery’ – a catch-all term for the provision of jobs, housing, amenities
and services – is the primary means for managing poverty. It is the supplement to
enclave development, held out as the lifeline to many people and so also the measure
of government legitimacy.

70
Toxic Futures
Since municipal restructuring in 2000, delivery has been increasingly devolved
to local government. However, if South Africa is far from being a ‘failed state’ at
the national level, there are many failed municipalities at local level. Emfuleni fits
the bill. According to its 2005 IDP, its bureaucracy is over-staffed but under-skilled
and consequently lacking accountability. Stories of corruption are common in every
corner of the Vaal. Officials and politicians are seen to be making good with property
development companies and shares in shopping centres and businesses. Local people
see a repetition of the patterns of enrichment through office that defined the
collaborationist black councils of the 1980s and provoked the Vaal Uprising.
The logic of enclave development supplemented by delivery is overlaid on
earlier rounds of the Vaal’s developmental history. What it gives rise to is not the
single citadel of wealth surrounded by poverty but a variable pattern of inclusion
and exclusion, of wealth and poverty, as the new logic is patched on to and into the
old.
Housing is both the most visible evidence of this and at the core of delivery.
For many people, a home is their first need and their last refuge. The history of
apartheid removals has left many with a deep sense of insecurity and housing has
been central to the conflicts that have escalated around the country in recent years.
In the Vaal Triangle, the sense of vulnerability is palpable in some communities.
And just as people are inhibited from criticising the corporations for fear that
more jobs will be lost, so complaints about pollution have been muted in some
areas for fear that they will result in removals rather than in the clean-up of pollution.
Housing delivery in the Vaal started with the conversion of hostels to family
housing, and site and service schemes and the roll-out of Reconstruction and
Development Programme (RDP) housing followed. In the first decade of
democracy, government approved two million housing grants nationally but said
housing demand was outstripping supply as people opted to live in smaller
households. This resulted in ‘an increase of two million additional households
over and above that generated by population growth’ and led to the proliferation
of shack settlements (Presidency 2003: 26). However, this trend was already evident
in 1994. In the old township of Bophelong, apartheid policies confined three or
four generations in the same home. Despite the relative generosity of the original
houses and the addition of backyard shacks, families had long since outgrown the
space. In Evaton, many people rented backyard shacks densely packed into the
same household. People moved out from these cramped conditions when they
could and this movement itself was part of what cracked open the apartheid
confinement. At the same time, just as farmworkers have lost their homes with

71
The Vaal in South Africa
their jobs, so too have many industrial workers who lived in ‘tied housing’ belonging
to Sasol or Iscor. Many of these people have found no alternative but to house
themselves in shack settlements.
The trend to smaller households has also been encouraged by government’s
own housing and service delivery programmes. Most RDP houses consist of two
small rooms, including kitchen and washing areas, with limited space for extension
while the free basic electricity and water supply penalises larger households because
they get the same amount as small households. Houses are also poorly built and the
basics of environmental design have been neglected. They are not energy-efficient
and poor people must either pay for warming or cooling their homes or they must
live with extreme cold or heat. People in Bophelong remark that the original houses
built in the 1940s are more comfortable than new RDP houses simply because
they have double-skinned outer walls. The saving on quality goes to government
and contractors but is passed on as a cost to the ‘beneficiaries’.
Harry Gwala is a new RDP housing estate built in Sasolburg beyond Zamdela.
People forced to fit into the standard two-roomed houses have added shack
extensions to accommodate their families. The local council is evidently not happy
with this and wants the shacks taken down. Nearby is Iraq, set up by people who
refused housing in Harry Gwala because their households did not fit into the RDP
houses. It is termed a shack settlement because the houses are built of iron sheeting.
Yet they are large by comparison with the RDP houses, well built and freshly
painted with door and window frames picked out decoratively in the Sotho style.
Plots are neatly fenced off and many have food and flower gardens.
In Sebokeng Zone 15, the five old Iscor single-storey hostels have been
converted into ‘family housing’. The residents pooled their housing grants to fund
it but were told that the money had run out after just two of the hostels had been
converted on the cheap. The result is that three or four beneficiaries have to share
each of the apartments supposed to be family units. Most of them are unemployed
following the Iscor retrenchments, their once-in-a-lifetime housing subsidies are
used up and they are effectively trapped there. Local authority officials who
administered the scheme could not account for spending. Residents believe that
the job was not completed because officials pocketed the money. Whichever way –
through negligently poor planning or corruption – they were dispossessed of
housing rights at the very moment that these rights were created. Acting through
the Vaal Working Class Crisis Committee, they have demanded that these rights
should be restored.
72
Toxic Futures
For the most part, the enclave logic has drained money out of the Vaal townships
along with the jobs. But those who have found a place within the ‘core’ labour zone
are now highly visible. They are not part of the new elite settled on the river
frontage, but full-time operatives – the new word for multi-skilled, flexibly-tasked,
full-time workers – and professionals, mostly employed by the state, such as teachers.
In Bophelong, isolated face-brick houses tower over their neighbours in the new
RDP housing estates. Their owners claimed the housing grant to access land but
immediately demolished the RDP house and rebuilt. In Zamdela, private developers
built face-brick houses in the area now known as Success. They were bought by
full-time Sasol operatives and middle-ranking professionals. Cars are parked or
garaged in most yards behind the usual security gates but, after work, people are
out strolling on the streets.
Corporate patronage is also visible. As company towns, Sasolburg and
Vanderbijlpark received corporate largesse from the start. In the 1990s, the focus
of patronage shifted from the white town centres to the townships and took the
new name of Corporate Social Responsibility. In Zamdela, Sasol funded the well-
appointed community centre that occupies a prominent and spacious block. It has
also entered a public-private partnership with the Free State government to give
the township’s library a makeover. On the periphery of the Vaal Triangle, by contrast,
Orange Farm remains remote from any benefits of the enclave.
Back-door services
Around the corner from Success and close to Zamdela’s business centre in Joe
Slovo, a shack settlement is squeezed into a lane between formal houses. On a
winter’s evening, men and women are in the street preparing for the night. The
men are cutting up wood scrounged from old pallets while the women make balls
of coal from a mixture of coal-dust, ash and water. The coal-dust is trucked in by
entrepreneurs who get it free from Sasol. Like paraffin, it is sold in small quantities
because people cannot afford to stock up – even if it costs more in the long term,
the poor must budget daily. The braziers are lit in the street so that the worst of the
smoke disperses into the outside air. They are then taken indoors to provide both
for cooking and heating. The only ventilation is the gaps left by ill-fitting doors and
the holes in the iron roofing and walls.
The variable pattern of enclave development supplemented by delivery applies
to services as much as to housing. In old Bophelong, the houses were originally
fitted with iron coal stoves ventilated through chimneys. Bophelong is upwind of
white Vanderbijlpark and, in the 1970s, there was growing concern about pollution.

73
The Vaal in South Africa
The old stoves were then replaced by newer models that could take smokeless
coal. Both ordinary and smokeless coal is now available from Bophelong coal-
merchants. These houses also had full services from the start in 1948 – electricity,
water, sanitation and rubbish removal.
Total emissions from domestic coal-burning are comparatively minor. According
to Scorgie, some 20% of homes in the Vaal Triangle rely on coal and they emit
2.8% of particulates compared to industry’s emission of over 95%.23 Just the low-
level emissions from industrial combustion are 2.5 times greater than household
emissions.24 Nevertheless, household emissions have a significant impact on health
because they are emitted where people live and are close to the ground. The effects
of indoor emissions, where coal smoke or paraffin fumes are not ventilated, are
many times greater for the household concerned. Indoor braziers and paraffin
stoves also create fire hazards, particularly in crowded households where accidents
are more likely, and in densely packed shack settlements where fires spread rapidly.
Noting that energy is necessary for life but that, for poor people, it has become
hazardous to life, social movements have demanded delivery of clean, safe and
affordable domestic energy. In practice, this has translated into a demand for
electricity and it is twinned with the demand for clean water. In 2000, government
responded with the ‘free lifeline’ supplies. The lifeline proved miserly: six thousand
litres of water and 50 kilowatt-hours (kWh) electricity per month per household.
Few can make it on this, least of all the poorest and largest households. In most
distribution areas, the price rises sharply once the free allocation has been used and
people end up paying as much as seven times more than industry per unit consumed.25
Prepaid meters and other technologies such as trickle-feeds, for both electricity
and water, have come to symbolise government’s insistence that delivery must be
based on ‘cost recovery’ and are associated with privatised or commercialised service
delivery.
Johannesburg contracted transnational corporation Suez to provide water
management services in 2001. Anti-Privatisation Forum researchers remark that
Suez was heavily indebted and saw Johannesburg as a good cash cow (Fiil-Flynn
and Naidoo 2004).
Most households with electricity connections in the Vaal area are on prepaid
meters and must cut themselves off before the end of the month. Indeed, many
are cut off the moment their prepaid allocation is used up. In Emfuleni, the situation
for water is anomalous because of the chaotic state of the council administration.
In 2006, the history of water reticulation was evident in a patchwork of different
systems. In the old Iscor hostels, for example, the council charged people collectively

74
Toxic Futures
for bulk deliveries – including the leaks from poorly maintained water pipes. Since
then, under the banner of the Campaign Against Water Privatisation, people have
resisted plans to introduce prepaid meters.
Prepaid water meters were pioneered where people are most vulnerable – in
Stretford, which is on the periphery of the Vaal Triangle in a part of Orange Farm
administered by the Johannesburg Council. A high proportion of households are
headed by women, all are poor and 30% have no income (Fiil-Flynn and Naidoo
2004: 16). The prepaid system replaced communal tap stands where water was
free. It was justified as saving water and enabling the delivery of the free basic
water supply. A year after it was installed, half the households ran out of water at
some time because they had no money to pay for more units. Others ran dry
because either the meters or the computers at the sales point broke down. Most
had to restrict water use and local people remarked that children from Stretford
were easily recognised because they ‘go to school in dirty clothes’ (20). Caring for
sick people became more difficult and costly. For the most part, women carried
the responsibility of managing water use, of begging from neighbours or of walking
to find free sources. The system also provoked conflict in the neighbourhood over
allegations of water theft and in households where people experienced increased
domestic violence.
The system works well for the managers. The cost of providing the free basic
supply is offset by the reduction in administrative costs, the need for billing systems
and staff to read meters is eliminated as is the cost of cut-offs and the potential for
conflict between people and utility staff – whether municipal or privatised. Beyond
this, Greg Ruiters argues that the technologies of ‘delivery’ are also technologies
of political and social control. They are part of a discourse that represents the
‘empowered citizen as the customer . . . who pays for services, only uses as much
as she can afford and makes wise, sovereign and informed choices with her limited
means’ (2005: 7). Discipline at the back of the shop is thus individualised as self-
discipline divorced from social action: the poor must know their place in the order
of the market; they must learn to be frugal consumers.
The system both reveals and hides poverty. Poor people must show their poverty
to the authorities by registering to qualify for the free basic supply but prepaid
meters erase politically embarrassing statistics on how many people are cut off
because they cannot feed the meter. The effects of poverty are removed from the
social realm and confined to the household. Yet the system computers still return
a constant stream of information, creating banks of data that make ‘customers’
visible to managers while managers are largely invisible to the people.

75
The Vaal in South Africa
Delivery of sanitation has lagged behind water but, in 2004, government
promised to ‘eradicate the backlog’. At Orange Farm, the promise of flush toilets
was used to win acceptance of prepaid meters. People were given to understand
that prepaid meters provided the means to obtaining flush toilets. They later
discovered that the water to flush the toilets was more than they could afford.
Water-borne sewage without water doesn’t work so the pipes are constantly blocked.
Johannesburg Water, however, has refused to accept that this is their problem.
Instead it ‘relies on the sheer necessity for hygiene and sanitation . . . to make
residents provide this service for themselves’ (Fiil-Flynn and Naidoo 2004: 17).
Without proper tools, that means digging faeces out by hand.
Waste management has the lowest profile of domestic services. According to
the Emfuleni IDP review 2008/9, 133 030 households have their waste collected
once a week while 22 200 households in formal settlements and all households in
informal settlements do not have their waste removed. Business waste is collected
daily from 1 453 stands in Vanderbijlpark and Vereeniging. There are also street-
sweeping services in business centres in Vereeniging, Vanderbijlpark, other outlying
business centres, the Sebokeng taxi rank ‘and all main roads’. But the service is
visibly inadequate. Litter is commonly encountered, particularly around taxi ranks,
and open ground is frequently used for informal dumps.
At the end of the waste pipe, sewage works and waste dumps are poorly managed
throughout South Africa and have a major impact on rivers. The history of careless
and profligate waste production combined with the gross neglect of waste
management is clearly visible in the Vaal. None of the dumps has a permit. On
paper they are illegal but in practice they are operated by the local authority and
overseen by regulatory authorities. This semi-legal status is just one face of the
greyness of waste and the shiftiness of definitions within the broader regime of
negotiated non-compliance. The legacy costs incurred through decades of neglect
are huge. The present waste-management system is not only unable to deal with
them but is adding to them.
Emfuleni’s planning ignores reduction at source and the waste managers must
deal with what comes at them. As elsewhere, waste is a low priority and underfunded
and managers are left to ‘make a plan’. The Palm Springs dump across the Golden
Highway from Evaton is a good example. Here the waste-pickers far outnumber
the municipal team and Emfuleni’s landfill manager responded by incorporating
them into a benign management regime and supporting their capacity to earn a
livelihood off recycling.

76
Toxic Futures
In Sasolburg, by contrast, the municipality more or less abandoned the dump
and the waste reclaimers are practically in charge of it. They also established their
own market, selling directly to buyers of recyclable materials. In 2006, with Sasol’s
support, the municipality awarded an exclusive right to recycle materials from the
dump to Phutang, a local black-empowerment group. Having neither capital nor
experience in waste recycling, Phutang soon merged with Remade, an established
white-owned firm. Phutang-Remade simply inserted itself in the selling chain
between the reclaimers and the original buyers. Its income depended solely on
paying less to the reclaimers. The reclaimers resisted this but, having legally enclosed
the reclaimers’ livelihoods, the council literally enclosed the dump with a fence –
60% paid for by Sasol – to control access and prevent the reclaimers taking
recyclables out to sell independently. Finally, in 2008, the council sent the police in
to force the reclaimers to sign contracts with the company. In a report for
groundWork, Melanie Samson observes:
The combination of the police and the fence broke the reclaimers’ ability
to continue with their resistance. One reclaimer eloquently summarised
the outcome of what she perceives as a hard-fought battle stating, ‘[w]e
were chased away by the police on a Friday. We came back on Monday to
surrender and sign the contract’ (2008: 25).
ANOTHER VAAL
In 1996, democratic South Africa adopted a new Constitution. It is widely seen as
a very progressive document but it provides two contradictory mandates for
development. The Environment Right explicitly mandates sustainable development
based, in the reading of The groundWork Report 2004, on environmental, social and
economic justice. The Property Right implicitly mandates capitalist development.
Since then, at least until the power went down (see Chapter 8), economic policy
has scarcely deigned to mention the environment and development policy has
been determinedly focused on securing the basis for the accumulation of capital as
we shall see in the next chapter. The central idea of accumulation – that profits
must be accumulated and reinvested to make more profits – is the basis of economic
growth which is assumed to be a self-evident good.
This good is rather less self-evident to the people of the Vaal. Even as
commodities boomed and growth topped 5%, most saw declining benefits and
escalating costs. In contrast, the captains of industry did rather well. In 2005, Eskom’s
chief executive took home R10.4 million, Sasol’s took R15.6 million including profits
77
The Vaal in South Africa
from share options, while Mittal South Africa’s took R4.4 million. The bosses of
the big mining houses with interests in the Vaal did even better. The CEOs of
Anglo American and BHP Billiton respectively took R55 million and R30 million.26
Starting in the 1980s, shareholder expectations for profit inflated alongside the
expectations of executives and cost-cutting, starting with the wage bill, was made
a core criterion for judging executive performance.
VEJA’s first concerns are that corporations should clean up and compensate
for the environmental harm done to people but, together with other fenceline
organisations like the SDCEA, it is more broadly confronted with the nature of
corporate production and the crisis in the lives of the poor. While the organisations
that make up VEJA do not necessarily share a single analysis of their situation, a
strong common language, critical of neo-liberal capitalism or of capitalism as such,
is evident. At an air quality workshop in Sasolburg participants observed that the
power of corporations is founded on their relationship with the state, both because
the state creates the basis of corporate legitimacy and because corporations create
the revenue basis for the state.27
Discussions of the purpose of struggle are located within this critical perspective.
The immediate demands – clean up and compensate – are themselves ambitious
in the current context. Beyond this, the desire for ‘another Vaal’ is very much part
of the discussion with people raising the need to change the capitalist system for a
new model of development, to socialise the economy and to create a new paradigm
where communities and workers are central to the power system.
At a strategy meeting, people from the Vaal and other pollution hot spots
observed that ‘the corporations are like a brick wall while government is a wet
blanket on people’s action’. They see it as important to assert the freedoms and
rights won through the anti-apartheid struggle and written into the Constitution.
‘If we can’t protect the achievements of the past, we cannot protect the future.’
The tactics of struggle proposed by participants therefore include formal
representations to parliament and other official bodies and engagement with formal
processes of participation. And they are acutely aware of the potential for exclusion.
‘Participation is not a favour from government but a right for us. When government
did the EIA revisions, it consulted industry, not us.’28
Finally, there is a strong sense that popular mobilisation is the heart of struggle
and that it must accompany whatever actions are taken through formal engagement.
Action must always have its roots outside the bureaucratic wet blanket of state-
sanctioned process. This mobilisation needs to link apparently disparate struggles
that the organisations participating in VEJA are engaged in. This linking is at once

78
Toxic Futures
an expression of solidarity and a recognition that these fronts of struggle are formed
in resistance to the same processes of capitalist development.
There is a deep recognition in the Vaal that there is no blueprint for the future.
What will be will emerge out of the process of engagement and struggle between
people, corporate capital and government. This engagement takes place on many
fronts and in many dimensions – on the streets, in the formal forums of par-
ticipation, in battles for information, in the contestation of corporate control of
knowledge and science, in the media and in struggles around the identity and purpose
of the state.
These contending forces do not begin and end in the Vaal. The Vaal as an
industrial and urban space has been produced within the old imperial economy of
London and the new world economy of Washington as well as within the brutal
politics and corporate rivalries specific to South Africa. It is the product of the
racist divisions of labour that took particular forms in South Africa but were also
part of the structuring of a global division of labour. The story opened with the
dispossession of people to force them into mining and industrial work. It has
arrived now at the dispossession even of that labour. It opened with an industrial
regime indifferent to its environmental destruction. It has arrived at the prospect
of the wholesale junking of the basis of life. The story does not close here.
The crises into which the world is now led will send successive shocks through
South Africa and the Vaal. Those who direct the processes of accumulation that
produce the crisis will seek to save themselves by managing the displacement of its
violent effects on to those made poor. Yet crisis is also opportunity. Resistance to
the orders of accumulation is gathering in all corners of the world and resistance
itself becomes part of the crisis of the ruling powers. And just as these struggles
shake the Vaal, so too will the struggles of the Vaal people reverberate around the
world – as they have done in the past.

79
New South Africa
3
New South Africa
INDUSTRIAL DEVELOPMENT CASTS a deep shadow of environmental
injustice but is still widely assumed to be at the heart of economic development
and to hold the prospect of adding to the sum of social wealth. This reflects a
more global and deeply-rooted assumption of modernity: in official and academic
language, development and industrialisation are virtually synonymous – ‘developed
countries’ and ‘industrialised countries’ have become more or less interchangeable
terms. Development is about how societies are ordered. It is deeply political. That
developing countries should aspire to become developed, that they should see the
image of their future in the rich world and the means of realising it in the process
of industrialisation is thus naturalised in the language of international and national
institutions. It is taken not so much as the matter of politics but as its foundation,
as the unexamined assumption on which politics rests. What development is about
is fiercely contested but development as such works as an imperative.
Chapter 2 shows how the developmental process has shaped people’s lives and
reproduced environmental injustice on the ground in the Vaal Triangle. The enclave
development described there has been actively produced through the so-called
‘post-Fordist’ strategies of corporations enabled by the neo-liberal policies initiated
by the apartheid government and entrenched by the government elected in the
first democratic elections of 1994. The logic of the enclave has been patched into
the spatial orders produced in previous rounds of development – the colonial free
market ruled over by the British Empire and the racial Fordism of the apartheid
era tied into the Cold War US hegemony. This chapter looks first at the policies
that have broadly shaped development since 1994. This sets the context in which
environmental policy developed. The second section shows how it has been driven
by fierce contestation on industry’s polluted fencelines. In the last section, we open
the lens on the wider world to interrogate the promise of green capitalism.
80
Toxic Futures
NEGOTIATING THE FUTURE
South Africa’s democratic constitutional order was won at considerable cost through
a struggle that mobilised people across the full spectrum of social relations: through
labour and civic organisations, religious bodies, women’s organisations, human rights
groups and in struggles for land. It terminated the brutal repression and authoritarian
racism of apartheid and so represents a victory for the majority of people. As is so
often the case in struggles against oppression, what has been won is very far from
what many South Africans imagined they were fighting for. For the majority,
apartheid was not just about political exclusion from decision making: exclusion
was the means by which they were dispossessed and impoverished to secure cheap
labour for capital. Similarly, democracy was not an end in itself but the means by
which the majority would gain freedom from want through their control of
production. Thus, the Freedom Charter called for the return of the land to those
who worked it and the people’s control of the ‘commanding heights’ of the economy.
These demands picked up strands of egalitarian and socialist thinking within the
liberation movement but were increasingly marginalised in the course of the
transitional negotiations.
The crisis of apartheid created the conditions for the transition to democracy
but bequeathed a tattered economy. Commonly identified problems included that
the local market was too small for large-scale production that could compete with
imports; investors were therefore not interested; capital goods (manufacturing plant)
had to be imported at huge expense; and the local skills base was constricted by the
perversity of apartheid education. Many analysts saw these problems as symptoms
of the exhaustion of industrial strategies, originating in the 1920s, and founded on
import substitution.1 The Macro-Economic Research Group (MERG), by contrast,
found little in the way of coherent industrial strategy in South Africa’s history. It
identified the centrality of the minerals-energy complex in defining South Africa’s
development or, in Ben Fine’s words, ‘the concrete form of accumulation of capital
taken in South Africa’ (2008a). This implied that industrialisation in South Africa
was founded on the power of the minerals-energy complex which was, from the
beginning, geared for export of resource commodities demanded by imperial capital
and indifferent to local needs. The constriction of the local market and the failure
of investment flowed from this. Ad hoc responses to demands for protection
meanwhile allowed the development of consumer goods industries to supply the
top end of a stunted (white) market. The overall result was an industrial structure
developed at two extremes with nothing in between to link the dominant core
created by the minerals-energy complex and the rest of the economy.

81
New South Africa
South Africa’s negotiated transition was not just a compromise with apartheid’s
ruling elite or even with the representatives of racial capitalism. Negotiations took
place in the context of change in the global order of power. The collapse of the
Soviet Union marked the end of the Cold War and left the US as the only
superpower. The victors proclaimed the triumph of capitalism and aggressively
redefined ‘development’ in line with neo-liberal ideology. Behind the scenes at the
South African negotiations, the institutions of global capital profoundly influenced
the terms of the economic debate.
During the early 1990s a range of experts, including the World Bank, business
leaders and economists of various political leanings, said that South Africa’s economy
would need to grow by at least 6% a year to create enough jobs to reverse poverty.
There were intense arguments about how this was to be achieved and what the role
of the state should be. The trade unions called for ‘growth with redistribution’ and
an interventionist state. Their thinking was strongly represented in the
Reconstruction and Development Programme (RDP) published as the ANC’s
manifesto for the first democratic elections in 1994.
Capital, on the other hand, argued that the economic failure of apartheid was
precisely the consequence of state intervention and that the ‘market’ should regulate
itself. This view was endorsed by the international players. They emphasised that
‘there is no alternative’ to an export-oriented economy integrated into global relations
of production and marketing, and this message was strongly supported by those
sectors of South African industry that saw profits in the world market.
In 1993, MERG was specifically tasked by the ANC to prepare an alternative
to these prescriptions. On Fine’s account, however, ‘both the substance of economic
policy and the way it was produced (from on high . . . as opposed to organised root
and branch discussion in the earlier period leading to the RDP) had changed
dramatically’ and the ANC leadership disowned MERG’s report even before it was
published (2008a). It thus accepted South Africa’s place in the global orders of
production as prescribed by the Washington Consensus.
Consuming the liberation
Shortly thereafter, the Melamet Commission recommended that those holding
public office should be paid ‘market rates’, effectively taking the acquisitive corporate
executive class as the market benchmark. As veteran anti-apartheid activist Neville
Alexander remarks, this was accepted without question. During the struggle years
‘everyone, including your “Comtsotsi”, was seen to be and treated as an equal,
whereas after 1994, there was this sudden and very visible divide between those

82
Toxic Futures
who were deemed to have been “successful” . . . and the veritable underclass, victims
of apartheid before 1996 and of neo-liberalism thereafter’ (2009). Conspicuous
consumption as the reward of office has since become the norm as the parade of
million-rand ministerial cars testifies.
South Africa thus joined the world market defined by Ponzi capital’s globalisation
strategy. This strategy produced growing inequality both globally and within
individual countries while trumpeting the promise of individual fulfilment through
consumerism. For those on the wrong side of the wealth gap, this is a promise
broken as it is made. Anticipating Alexander’s critique, media analyst Eve Bertelsen
observed: ‘The heroic figures (role models) of the anti-apartheid narrative were
. . . principled political and union leaders who lived frugally and stoically battled
for the cause. In the organising narrative here collaborative endeavour ensures the
betterment of the whole community’ (1998: 232). Since the 1994 elections, however,
the political leadership ‘enthusiastically embraced the philosophy of the late capitalist
“free market” ’ (221). Commercial advertisements, meanwhile, played on the
symbolism of struggle by emptying its political meaning and ‘recoupling its potent
signifiers (of black pride and accomplishment, democratic choice, civil rights, the
right to a better life) with the discourse of consumerism . . . In the process, the
desire for a shared social good is replaced by the desire for consumer goods or
commodities’ (231).
The values that stitch together status, power and consumption have trickled
down through the layers of government and bureaucracy. It may not be that the
values of liberation have been entirely consumed on the gravy train. Yet the many
people who continue to serve their communities with dedication – whether as
professionals or volunteers working in such fields as health, education and
development – are confined to the back of the shop where the narrative of poverty
alleviation offers small rewards when compared with the promise of liberation.
Consumer gratification no doubt compensates for the disappointment of that
promise. Thus, Thokozani Xaba recounts the tragic transition of struggle hero to
community pariah in the Durban townships and notes that ‘comrades’ and ‘exiles’
without employment ‘could not legitimately get money to buy what they considered
to be “the best things in life” – expensive cars, clothes and jewellery (for their
girlfriends)’ (2001: 112). He concludes that such luxuries are won by those who are
‘more daring and brutal’ and that the risk of being killed is preferable to the benefits
promised by government’s development programmes (119).
Jacklyn Cock observes that a certain masculinity is linked with particular icons
of consumerism. She quotes a research respondent from Lenasia: ‘If you have a

83
New South Africa
BMW, a cell phone and a glamorous woman you’ve got a lot; if you’ve got a gun
you’ve got everything’ (2001: 14). This masculine consumerism is not restricted to
the criminal fringes. Indeed, criminal activity seems very much in tune with ‘core’
development. Hein Marais argues that syndicates not only demonstrate the
entrepreneurial virtues promoted by government but also provide start-up capital
for many legitimate businesses. Property crime reinforces ‘the values of con-
sumerism and . . . helps sustain consumer capitalism in a society that deprives the
bulk of society from sharing in its ostentatiously advertised fruits. In many depressed
communities, circuits of illegal accumulation have become integral to social and
economic reproduction’ (2001: 196). Corruption, whether of politicians or officials,
similarly reflects the values of consumerism and provides a link between criminal
activities and state institutions.
The gravy train did not start out in 1994. These values were already anticipated
in the colonial and apartheid values of racial capitalism and they are now refigured
in the conspicuous displays of global consumer capitalism. The corporate leaders
who are, to paraphrase Bertelsen, ‘the heroic figures (role models) of the narrative’
of capitalism-as-development are themselves none too precious about the getting
of wealth as the fraudulent dealing at the centre of global capitalism demonstrates.
Geared
Two years into the life of the ANC-led Government of National Unity,2 international
finance capital demonstrated the material force behind the World Bank’s arguments.
Trevor Manuel, just appointed as the first ANC (and black) minister of Finance,
made a mildly sardonic comment about ‘the market’ and foreign capital was instantly
withdrawn from the economy, putting the value of the rand on the skids. According
to economic policy insider Alan Hirsch (2005), ‘restoring credibility’ with
international capital was then made government’s top priority. Macro-economic
policy, given the title Growth, Employment and Redistribution (GEAR), was put
together in a matter of months and adopted in 1996. It was the culmination of the
process that began with the business delegation visits to the ANC in exile. In that
process, ‘the working class [was] forsaken as the agent of the National Democratic
Revolution in favour of the state and a black bourgeoisie’ (Chipkin 2003: 35).
Government’s agenda for transformation thus came to centre on Black Economic
Empowerment (BEE) aimed at creating a black capitalist class and, in Moeletsi
Mbeki’s view, represented the deal done between the new black political elite and
the old white business elite.3
With some variations on the theme, GEAR replicated the development model
prescribed by the neo-liberal Washington Consensus. Indeed, several World Bank

84
Toxic Futures
staff members were on the team that developed the policy. While the bank,
effectively representing the ‘virtual senate’ of global investors, was given an inside
track, the policy was developed in secret and presented as a fait accompli to the
South African people and even to the unions who were formally in alliance with
the ANC.
What remained consistent through the policy shifts that led to GEAR was the
vision of a modern industrial economy aiming for the magic number of 6% growth.
The neo-liberal strategy accepted global, rather than national, capital as the agent
of modernising development. The state’s own strategies were then geared to
attracting private capital, and particularly transnational corporations, through
privatisation or through state infrastructure investments in Spatial Development
Initiatives (SDIs) and Industrial Development Zones. It was claimed that benefits
to workers, to women and to the poor would then flow from economic growth.
The effects, however, were to expose these supposed beneficiaries to the full blast
of globalisation and GEAR met with resistance from the start.
Government defended GEAR on two grounds. First, South Africa had to deal
in the real world. The political transition had coincided with globalisation, the
world economy was expanding rapidly and, in contrast to the economically isolated
apartheid regime, democratic South Africa would ride it. Higher rates of investment
into South Africa and access to global markets would provide for growth and
growth would provide jobs. The domestic market would then grow to create a
virtuous cycle. Foreign investments would usher in new skills and clean and green
technologies to replace South Africa’s dirty old industrial plant. Second, government
argued that the RDP remains the development programme but GEAR provides
the economic means through which the necessary resources can be mobilised.
Fiscal conservatism and the proceeds from privatisation would reduce South Africa’s
debt, the country would avoid the debt trap and the consequent dictation of policy
by the International Monetary Fund (IMF) and World Bank, and the money saved
on interest repayment would be freed up for redistributive development.
Contrary to the words of its title, and as its critics predicted, GEAR produced
little growth; formal sector employment shrank with the loss of two million full-
time jobs in the first decade of democracy, and inequality grew as wealth was
indeed redistributed but from the poor to the rich. Resistance also grew as the
effects of GEAR were trickled down through cost recovery on services, inadequate
housing provision, the collapse of already pitiful environmental regulation and the
lacklustre performance of land reform. The value of pensions, on which many
poor households depended for survival, was eroded and the very principle of welfare
grants came under sustained assault.

85
New South Africa
At the same time, the private corporations at the heart of the minerals-energy
complex were allowed to list offshore in the global financial capitals. This came on
top of large and illegal capital outflows and represented a huge disinvestment –
appropriating resources produced in South Africa to finance the corporations’ global
ambitions. Fine (2008b) observes that the process was facilitated by government.
Treasury effectively lined the corporations into a queue for permission to list in
London and New York. The intention was to prevent too much money leaving the
country at once as this would have devalued the rand and hence also the value
given to the corporations’ global listings by the market. State-owned corporations
were meanwhile instructed to restructure in preparation for privatisation.
Resistance was deeply resented, particularly when it threatened the ANC
government’s claim to the mantle of emancipation. Critics, including the ANC’s
alliance union partner, were castigated as ‘ultra-left’ or ‘infantile’. More insidiously,
resistance was associated with a supposed right-wing reaction against black rule or
said to be manipulated by a ‘third force’. As it cracked down on dissent, government
upped the rhetorical emphasis on ‘poverty alleviation’ and turned up the volume to
legitimate a priority for ‘development’ over ‘environment’ at the 2002 World Summit
on Sustainable Development (WSSD) in Johannesburg. Instead of submitting to
the ANC’s leadership, however, people took to the streets outside the approved
orders of participation. There they were confronted by armed force. At the WSSD,
police violently disrupted disapproved protests. Activists from the Landless People’s
Movement and the Anti-Privatisation Forum were arrested following one
demonstration. The following week, police used percussion grenades to break up a
march of activists demanding their release. Several people were injured including
international visitors. At the same time, government moved to ban a mass march
under the banner of ‘Social Movements United’ but simultaneously promoted a
march organised by the ANC. In the event, it backed down on the ban as the
political costs became clear. The social movements’ march, involving thousands of
international activists along with the local movements, substantially outnumbered
the ANC’s march.
While losing the battle on the streets, government was winning in the official
negotiating halls. The top environmental official told parliament that the United
Nations Conference on Environment and Development had sub-ordinated
development to environment and the WSSD would put this right. In the name of
‘poverty alleviation’, the Johannesburg summit firmly prioritised development and
held up government ‘partnerships’ with corporations as central to the means of
delivery. Far from addressing poverty, however, development was producing it

86
Toxic Futures
along with environmental degradation. Government’s policy was really about creating
the conditions for capital accumulation. And even that was not working. Rather
than make direct investments in local enterprises, the global managers of capital
preferred to speculate on the South African economy and, in 2002, they were
taking their ‘hot’ money out. The value of the rand sank dramatically, exposing the
country to the vulnerability caused by the GEAR policy of opening capital markets.
Food prices ballooned, most spectacularly for maize meal and bread, the staples of
the poor.
The developmental state
If government resented being challenged, GEAR was also failing in areas that
were of concern to it as the manager of a capitalist economy. On its own terms,
GEAR was successful in imposing spending constraints and reducing inflation and
the national debt, but it completely missed its stated goals on economic growth
and job creation. In government’s view, the key problem was that GEAR failed to
attract private sector investment – and particularly foreign direct investment. Finance
minister Trevor Manuel expressed his frustration at an international Financing for
Development Summit in March 2002: ‘You can subject South Africa’s policies to
the tests of salt water and fresh water economists, and we will pass those tests. But
that has not translated into a great flow of investment’. In other words, the economic
fundamentals required by the neo-liberal Washington Consensus were in place but
the development story did not go according to the script.
The script itself was beginning to change, however. The World Bank backed
off some of its more extreme free-market positions and allowed an economic role
for the state beyond macro-economic rectitude. In 2000, World Bank president
James Wolfensohn made ‘a strong plea’ to President Thabo Mbeki for South Africa
to get its ‘micro-fundamentals’ right (SALB 2002: 8). This was a green light for
more active state intervention in the economy but for the purpose of extending
the logic of the market into the day-to-day working of the state and into the fabric
of social life.
The Micro-Economic Reform Strategy and the Integrated Manufacturing
Strategy followed in 2002. They were welcomed by labour as signals of a more
interventionist approach to economic growth but were cast in the mould of GEAR:
they were premised on an open, export-oriented economy tied into the world
economy through global production chains; and they were formed from an
imagination of development as produced through market competition based in
high-tech, high-capital and high-energy enterprises. This excluded the majority of

87
New South Africa
South Africans from the core of the economy while subordinating this economic
core itself to the needs and profits of global capital.
Government subsequently admitted that its development policies excluded the
poor. In 2003, Thabo Mbeki introduced the metaphor of the two economies: the
First World market economy and the second economy, a Third World survivalist
economy. Wealth, he said, would not ‘trickle down’ from the first to the second
economy so we should ‘not assume that the interventions we make with regard to
the “first world economy” are necessarily relevant to the [“third world economy”]’.
A distinct development strategy was needed ‘to transform this economy . . . so
that the “third world economy” becomes part of the “first world economy”’ (quoted
in Hirsch 2005: 233).
The metaphor produced a dissonant echo of the apartheid description of South
Africa as two worlds – First and Third – in one country. The problem of the second
economy was held to be that it lacks development rather than that it is the product
of development. The process that produces wealth was thus made to appear separate
from the process that reproduces poverty. This justified a dual development strategy:
core development promoted capital accumulation while development-as-delivery
contained the fallout from the enclosure of common and public resources and the
costs of externalisation at the ‘back of the shop’.
This dual strategy came to be named the Accelerated and Shared Growth
Initiative for South Africa (ASGISA). The ‘first economy’ strategy focused on the
magical 6% growth target. Government put the privatisation of key state industries,
notably Eskom, Transnet and the arms group Denel, ‘on hold’ and channelled very
substantial investments into infrastructure, primarily designed to service the needs
of capital, through these parastatals. Asserting that the poor lacked development,
government focused the ‘second economy’ strategy on turning them into budding
entrepreneurs who could be linked into the ‘first economy’ while also providing
‘work opportunities’ – that is, badly paid temporary jobs – through the Expanded
Public Works Programme (EPWP). Outside of the ASGISA framework,
government expanded social spending – on grants and housing, etcetera – and
belatedly acknowledged that this was the only policy that had any effect in alleviating
poverty. Calls for a Basic Income Grant payable to all adults were nevertheless
brushed aside on the rationale that it would create a ‘culture of dependency’.
These second economy initiatives followed the World Bank prognosis that,
throughout the developing world, the informal sector will now provide the jobs
that the formal sector no longer offers. It also provides the most flexible of labour
markets. Nevertheless, it is commonly recognised that the informal sector relies on

88
Toxic Futures
formal-sector wages for its market. As the number of jobs shrinks, so too will the
opportunities for making a living. Further, informal trading is increasingly saturated.
There are only so many shebeens that can survive competing for the same shrinking
market. In 2003, UN Habitat concluded that the rise of the informal sector, together
with the slums that now house close to one-sixth of the world’s population,4 was
itself ‘a direct result of liberalisation’ dating from the 1980s and enforced by the
IMF and World Bank (quoted in Davis 2004: 23).
Government now argued that GEAR was always intended to create the basis
for a more expansionary programme of intervention.5 Yet the programme outlined
in ASGISA clearly marked a radical shift from GEAR in respect of the role of the
state in development. GEAR explicitly relied on the market to drive growth and
create jobs once the economic fundamentals were put in place and it assumed that
state investments would crowd out private-sector investments. If the story had
gone according to script, ASGISA would be superfluous. Instead, ASGISA made
the opposite assumption, that public investment would crowd in private investment
and the state would lead the drive for growth. In short, it is an expansionary
programme where GEAR was not. The shift is most obvious in energy policy
described in Chapter 8.
Nevertheless, government had considerable justification in claiming that GEAR
still lived. If the role of the state changed, government’s imagination of development
did not: modernising development – catching up with the industrialised nations –
would be achieved through an export-oriented economy driven by international
competitiveness and by infrastructure investments intended to create a competitive
advantage for South African industry. These investments, now in progress, are
capital-intensive and create significant numbers of jobs only during construction.
The creation of a black capitalist class through BEE remained at the centre of
government’s project for transformation and was promoted with increasing vigour
through BEE charters for most economic and industrial sectors. The charters are
intended to ensure that business does not renege on the transitional deal, but also
have the effect of intensifying the networking between the new political elite and
the old economic elite.
Indeed, these interventions were to give greater depth to that imagination,
taking it into the details of economic life and attempting to recreate people’s
subjectivities – their sense of themselves in the world – in its own image. The
first-economy interventions were to address the constraints to international
competitiveness and accepted that it is defined by global capital and the major
powers. Box 3.1 looks at the implications. Industrial policy remained fixated on

89
New South Africa
‘knowledge intensity’ and finding a place in the global production networks presided
over by the leading transnational corporations who determine the terms of
production and access to markets. By this means, government aimed to move South
Africa up the value chain, to higher, value-added production and therefore higher
GDP growth, but it also signalled that South Africa ‘knows its place’ in the global
order, just as it expects the denizens of the second economy to know their place.
Box 3.1 Competitive regulation
The constraints on international competitiveness are not just about technologies
of production. ASGISA mandated ‘a system of regulatory impact analysis [which]
will add well-designed procedures (first developed in the United Kingdom) to
reduce or eliminate the negative unintended consequences of laws and
regulations, especially on job creation’ (SAG 2006: 12).
It expresses particular concern about local and provincial planning and zoning
and the Environmental Impact Assessment (EIA) system. Revised regulations
‘streamlining’ EIAs were introduced in 2005 but government ministers kept up a
verbal barrage to the effect that they were holding up development. Delays were
attributed to the constraints of bureaucratic capacity and to ‘special interest’
groups – read local activist groups concerned about the impact of proposed
development on their communities. What was not, and is not, acknowledged is
that business itself contributes significantly to delays. Brent Johnson observed
that environmental and social impacts are peripheral to the concerns of most
project developers who ‘often fail to plan or provide adequate resources’ to
address them.6 Even as ministers reiterated their commitment to environmental
integrity, the discourse of development – the framing that defines the issues –
made the environment, not to mention environmental justice, a point of resistance
in the heroic narrative of accelerated growth.
ASGISA also called for ‘a review of labour laws, including their impact on
small businesses’ (10). The phrasing suggested that the legal endorsement of a
dual labour market, consistent with a dual development strategy, was under
consideration. It also suggested that ‘labour market rigidities’ in the first economy
would be subject to hostile scrutiny. These were not novel proposals but confirmed
that the ‘developmental state’ was indeed the child of GEAR. The unions once
more rallied in opposition.
90
Toxic Futures
President Mbeki was ousted by his own party just as the effects of the global
financial meltdown hit South Africa. While government denied that the economy
was in recession,7 corporate capital cut 20 000 formal jobs in mining and
manufacturing in the fourth quarter of 2008. Over a million more jobs followed in
2009. In February, Manuel finally admitted that the South African economy would
not escape the storm but claimed that the wisdom of past policy had created the
resilience to weather it. Government’s infrastructure programme, along with the
2010 football World Cup spend, was then repackaged as a ‘countercyclical’ stimulus
to the economy. Hot money meanwhile flooded out and then back into the economy
– more or less tracking the volatile fortunes of commodities – as global capital
looked either for safe havens or piratical profits.
President Jacob Zuma’s administration took office in May 2009. The wholesale
restructuring and enlargement of cabinet portfolios appeared as much about
rewarding those whose loyalty sustained Zuma through numerous court appearances
on corruption charges as about executive effectiveness. Policy hung in suspension
between the conflicting interests of his supporters: the ‘left’ alliance partners; a raft
of business opportunists; and the moderates representing the interests of global
This regulatory agenda confirmed the subordination of the ‘developmental
state’ to global capital. French legal scholar Alain Supiot remarks on the influence
of the World Bank’s annual Doing Business reports which ‘provide a systematic
evaluation of every feature of national legal systems that have a bearing on
economic efficiency’ (2006: 115). They provide a supposedly objective
benchmark against which international investors and governments can measure
competitiveness – or profitability. In respect of labour regulations, ‘a “rigidity of
employment” index penalizes countries that recognise too many workers’ rights:
social insurance for part-time employees; excessive minimum wages ($20 a month
is deemed too high for an African worker); a working week limited to under 66
hours; the requirement to give third parties (for example, a union) notice of
dismissal; programmes to fight racial or sexual discrimination’ (116). Doing
Business is both a symptom and an instrument of a global economic system in
which ‘it is no longer products that are in competition but the normative [regulatory]
systems’. The obvious ‘consequence is a race to the bottom in fiscal, social and
environmental deregulation’ (119).
91
New South Africa
capital.8 ASGISA is rarely invoked but policy is more or less defined through the
revision of its elements. Putting snigger marks on ‘the second economy’, the
ASGISA Annual Report 20089 rejects the dual economy paradigm, ditches the
fantasy of poor entrepreneurs innovating their way out of poverty, recognises social
spending as an instrument of economic policy in response to inequality, and calls
for an expansion of public employment. In practical terms, following Zuma’s
promise of 500 000 ‘work opportunities’, the EPWP is once more expanded but is
still a stopgap that does not address long-term structural unemployment. The
countercyclical initiative as a whole remains framed by the market and ‘decent
work’ – adopted as a central plank of the alliance platform but dependent on
an unlikely expansion of a formal labour market with little history of decency.
The infrastructure spend meanwhile ran into funding limits while the big 2010
construction jobs were being done. The future of the new stadiums is now in
question as the municipalities are confronted with unpayable maintenance bills. It
may be that the demolition jobs will provide some relief to construction workers.
ENVIRONMENTAL POLICY
Whether left or right, the participants in the transitional debates on economic
development ignored the environment. GEAR did not mention it and the 2002
Integrated Manufacturing Strategy mentions it once and then only in reference to
the King Commission10 on corporate governance and its recommendation for ‘triple
bottom line’ reporting (DTI 2002: 19). This purportedly gives the social and
environmental practices equal weight with profits in corporate accounting. This
implied that environmental management be left to the self-regulation of the market
and/or that the Department of Trade and Industry (DTI) would leave the
environmental consequences of industrial development to the poorly resourced
Department of Environmental Affairs and Tourism (DEAT).
South Africa’s Constitution, as noted in Chapter 2, provides contradictory
mandates for development in the Environment Right and the Property Right. While
economic and industrial policy took its cue from the latter and barely mentioned
the environment, environmental policy initially took its cue from the former. At
the same time that GEAR was peremptorily announced, government initiated the
Consultative National Environmental Policy Process (CONNEPP) widely seen as
a highpoint of open and participatory governance.
CONNEPP was fiercely contested. Under apartheid industry dominated the
DEAT and enjoyed a virtual monopoly on policy inputs. As business repositioned
itself in the early 1990s, two powerful lobbies were formed to represent industry’s

92
Toxic Futures
environmental interests: the Industrial Environment Forum and the Chemical and
Allied Industries Association. They called for self-regulation in the place of
apartheid’s ‘command and control’ approach. Neither command nor control were
much in evidence but the phrase was intended to associate apartheid with
authoritarian socialism and contrast both with free-market capitalism. They thus
echoed capitalism’s triumphant bray following the collapse of the Soviet Union.
This agenda reflected that of international business which was repositioning
itself as ‘part of the solution’ to the growing environmental crisis. The self-regulatory
manifesto was taken into the 1992 United Nations Conference on Environment
and Development at Rio de Janeiro by the World Business Council for Sustainable
Development (WBCSD) that was formed for the purpose. It subsequently spawned
offshoots such as Business Action for Sustainable Development created largely to
co-ordinate business interests at the WSSD in Johannesburg ten years later.
Industry’s environmental agenda was confronted by an alliance of trade unions
and local community and environmental groups who found common cause in
the idea of environmental justice. Initially under the banner of ‘green politics’,
the environmental justice movement emerged in the early 1990s. It saw the
environmental destruction of apartheid in explicitly political terms and challenged
the dominant view that reduced the environment to wildlife conservation.
It also responded to the peripheral place of the environment within the
imagination of liberation. For many black people, the environment was associated
with conservation and conservation with forced removals. It was a middle-class
white concern that put animals before (black) people and ‘not relevant to the urgent
needs of the country for development and social justice’ (Whyte 1995: xviii).
Nevertheless, many of the demands articulated during the 1980s responded to
environmental injustice: unions demanded health and safety at work; civics
demanded water, energy and waste services; and everyone demanded the total
transformation of South Africa’s spatial regime – an end to pass laws and urban
influx controls and comprehensive redistribution of land. So in many ways, the
struggle against apartheid was implicitly also an environmental struggle as was first
recognised by the National Environmental Awareness Campaign, founded in Soweto
in the aftermath of the June 1976 uprising.
The environmental justice agenda was given visceral meaning through a series
of struggles around waste and air pollution.11 Key campaigns related to the illegal
dumping of toxic waste on open ground, invariably in poor black neighbourhoods,
the appalling state of formal dumps, waste incineration and trading in toxic waste.

93
New South Africa
The Thor campaign, co-ordinated by environmental group Earthlife Africa, was
emblematic. Thor Chemicals, a British transnational corporation, traded in toxic
mercury waste from the US and used an incinerator to separate out the mercury
for ‘recycling’ at its plant at Cato Ridge outside Durban. It had a similar plant in
Britain that was under investigation by British regulators. They found mercury in
the air up to twenty times the legal limit and, in 1987, told Thor to clean up or face
court action. Rather than do either, it closed the British plant but expanded at Cato
Ridge where it could draw on a pool of cheap labour from the impoverished
Inchanga area. The consequences were stark: four workers are known to have died
from mercury poisoning; many more suffered chronic poisoning; the site itself
was saturated with mercury; a stream used by local people was heavily contaminated;
and mercury emissions into the air were unknown because they were not measured.
While apartheid South Africa liked to represent itself as a First World state, the
case highlighted its habitual collusion with industry and the Third World state of
environmental regulation: Thor ignored air-pollution regulations and was not
penalised by the DEAT; the Department of Water Affairs and Forestry (DWAF)
did not act on evidence of water pollution until it became a public scandal; the
Department of Manpower inspectorate failed to identify health and safety issues
until forced to do so. Next, prosecutors were reluctantly forced to bring Thor to
court but botched the case and created the impression that legal action against
corporate interests would fail in South African courts. Under the new government,
the Davis Commission was set up to enquire into the case and found that
government shared responsibility with Thor for the disaster because of the failure
of regulation.12
The Thor campaign also set the pattern for coalition campaigning. Earthlife
made a point of engaging with organisations representing people directly affected
by pollution as well as networking internationally for information and support.
This principle was given organisational form at a conference organised by Earthlife
in 1992. The conference emphasised the connection between relations of power
and environmental degradation and aimed to connect South African civil society
with international debates (Hallowes 1993). The concept of environmental justice,
introduced by US activist Dana Alston, resonated with the experience of South
African delegates. News received during the conference that an Italian corporation
was dumping toxic waste in war-torn Somalia demonstrated its pertinence and
urgency. Delegates adopted environmental justice as the core idea capable of linking
disparate struggles – struggles for land, housing and services, and struggles against
pollution, dispossession and exclusion – to a common movement. They also

94
Toxic Futures
mandated the formation of the Environmental Justice Networking Forum (EJNF)
to give shape to the movement. EJNF grew rapidly to provide a shared forum for
over 600 organisations representing workers, local community groups, religious
bodies and women’s groups as well as non-governmental organisations (NGOs)
active in a range of sectors. It took up the Thor campaign amongst others and led
civil society participation in the debates that then seemed to promise a wholesale
transformation of policy.
Spurred by controversy and bad publicity, the state began to fashion a response
from the early 1990s. The Integrated Pollution Control (IPC) process, initiated in
1993 and jointly managed by DWAF and DEAT, reflected the interests of the state
and corporate capital in minimising the costs of environmental management. It
was criticised for its exclusion of labour and civil society, and even industry agreed
that it was ill-conceived and ineffective. Rising environmental activism, linked to
the prospects of a democratic government, appeared to be driving change. Earthlife
adopted the waste hierarchy to reduce, re-use and recycle waste but pointedly omitted
disposal. The ANC and its alliance partners meanwhile commissioned the Inter-
national Mission on Environmental Policy, which adopted the framing of
environmental justice (Whyte 1995).
In the context created by local struggles to close existing dumps and oppose
new ones, the IPC process lost all credibility and was terminated. Government
launched CONNEPP, which was to produce an environmental policy framework
within which a coherent policy on pollution and waste could be developed from
scratch and with the involvement of all sectors. Most of the principles that civil
society had been calling for – including sustainable development, environmental
justice, the waste hierarchy, the polluter pays principle and the precautionary principle
– were adopted as policy and subsequently incorporated into the National
Environmental Management Act (NEMA) of 1998.
These fine principles notwithstanding, NEMA was compromised. During
CONNEPP, industry argued for ‘environmental management co-operation
agreements’ (EMCAs), that is, for self-regulation dressed up as ‘partnerships’ with
the state and made into law. EJNF and the unions countered that this was intended
to avoid effective regulation and called for legally binding pollution standards with
stiff penalties for non-compliance. They eventually agreed to EMCAs only on the
condition that they would be additional to rigorous regulation based on enforceable
environmental standards and would be designed to take industries beyond
compliance. In return for this concession, NEMA would enable communities to
take industries to court if they broke the law.

95
New South Africa
At the national conference closing CONNEPP in January 1997, the minister
agreed that state regulation should precede EMCAs because industry could not be
trusted to regulate itself. With the formal consultation process closed, however,
industry went to work in the back-door lobbies. The first draft of the NEMA
placed clear conditions on the development of EMCAs, including that all
stakeholders should participate in their design, that they should include quantifiable
targets with independent monitoring and that there should be penalties for non-
compliance. These conditions were diluted or deleted in the final version. The
agreed purpose of improving on standards was made optional. EMCAs would
merely ‘promote’ compliance with the principles of the Act.
Moreover, NEMA had no teeth. Environmental organisations found that the
provision that enabled them to take corporations to court had little meaning both
because environmental cases are generally difficult to prove, and particularly so
where there is no credible information, and because specific laws and legally binding
standards for air emissions and other wastes were not developed.
Follow-up processes meant to establish the basis for implementing NEMA
were first rushed and then stalled. Thus, policy on Integrated Pollution and Waste
Management was to be implemented through a National Waste Management
Strategy (NWMS) within the legal framework provided by NEMA. The NWMS
was finally published two years late but without consultation. In theory, it marked
a paradigm shift in the approach to waste management. Founded on the waste
hierarchy, reducing waste generation is central to the stated objective. The objective,
however, faded from the practical strategies: Waste prevention was altogether lost;
minimisation through ‘cleaner production’ was flagged but with no real means of
implementation; incineration, particularly for hazardous waste, was retained as a
disposal option despite the fact that it contradicts reduction; recycling was reduced
to a symbolic cipher without adequate funding or any requirement for producers
to use recycled materials and so create a viable market. Further, while NWMS
prioritised development of a waste information system, it did not require industries
to report on waste. It thus created no credible basis for waste information but
rather sustained the wilful ignorance that allows producers to disregard their own
waste and the externalised costs.
In short, the NWMS had no purchase on the production system presided over
by the ‘senior’ departments. For government as a whole, the environment was
scarcely a priority. The intergovernmental Committee for Environmental Co-
ordination, established in law by NEMA and chaired by the very junior DEAT,
was all but ignored by senior departments. Meanwhile, environmental budgets were
96
Toxic Futures
squeezed, waste management was abandoned without adequate resources in the
flood of waste, and environmental regulation for air and water, such as it was,
collapsed. There were just four air pollution control officers left by 2002, down
from five in 1994 and seven in the 1980s. In KwaZulu-Natal, the regional DEAT
office was abandoned without so much as a forwarding address. Industries required
to submit reports in terms of their scheduled process permits had them returned
unopened. The environment was left to the mercy of the market constrained only
by the resistance of local environmental groups.
Bad air
Local-level environmental struggles were most intense in south Durban. Under
the 1965 Air Pollution Prevention Act, and protected from public scrutiny by the
Key Points Act, apartheid industry was effectively self-regulating. All industrial
centres were, and still are, pollution hot spots. Situated next to Africa’s busiest
port, south Durban houses some 600 industries including the two largest oil refineries
and Mondi’s large paper mill. Until 1998, the Engen refinery’s permit allowed it to
emit 72 tonnes of sulphur dioxide a day while Sapref, jointly owned by Shell and
BP, could emit 50 tonnes a day. Both said that they operated well below these limits
and the combined emissions from south Durban’s top eight polluters was put at
over 95 tonnes a day.13 However, Sapref had under-reported emissions for five
years and was well over its limit so the combined emissions were actually around
107 tonnes a day – assuming no one else was under-reporting.
It was the bad air that brought the communities of south Durban together.
They have a long history of environmental concern and the transition to democracy
enabled its more robust articulation. In 1993, a group of community organisations
and NGOs formed the South Durban Environmental Forum to co-ordinate civil
society action on air pollution. This forum was the forerunner to the South Durban
Community Environmental Alliance (SDCEA) that was constituted in 1997.
Engen, meanwhile, anticipated that the democratic transition would create the
need for a ‘policy of transparency’. With President Nelson Mandela due to visit
the plant in 1995, management told community representatives that they wished to
announce the formation of a Community Awareness and Emergency Response
(CAER) committee ahead of his visit. CAER is central to the ‘Responsible Care’
initiative administered by the International Council of Chemical Associations. It
was developed by the industry following the Bhopal catastrophe to ‘build trust’
with people neighbouring chemical plants. CAER gives industry a tool for managing
local participation and shifting responsibility to communities while not taking on
any obligations.
97
New South Africa
The local organisations rejected this approach and proposed instead a detailed
‘Good Neighbour Agreement’ modelled on community-initiated agreements with
companies in the USA. This would commit Engen to reporting impacts, and to
workplace and environmental planning including pollution reduction, improved
emergency planning and active affirmative action. The company declined the
agreement and members of the Wentworth community demonstrated at the plant
during Mandela’s visit. Mandela stopped to talk to them and subsequently called
community leaders to a meeting with cabinet ministers and Engen executives where
the latter pledged that they would address the problems of pollution.
Talks on a Good Neighbour Agreement resumed but deadlocked for two
reasons. First, Engen attempted to intervene in the selection of community
representatives and, second, it argued that its emissions were within the legal limits
set by its DEAT permit, and that health impacts were unproven. Wiley, Root and
Peek (2002) argue that the company would have found reason for holding out on
pollution reduction both in government’s patent lack of interest in pollution control
and in the pro-corporate context created by GEAR. But community activism, now
co-ordinated by SDCEA, intensified and resulted in bad publicity while civil society
demands for national air quality standards were gathering momentum at CONNEPP.
In 1997, Engen re-opened negotiations on an agreement.
The Environmental Improvement Plan agreed by Engen and SDCEA depended
heavily on switching from heavy furnace oil – with a high sulphur content – to gas
to fuel the refinery. As it happened, this fitted well with government’s agenda.
Sasol was planning to pipe gas from its Secunda plant to Durban and this linked
with the development of Mozambican natural gas, a project to which government
was committed in the name of regional development. Further, the DTI was shortly
to promote the development of a ‘world-class chemicals cluster’ in south Durban.
Gas then appeared as the means of legitimizing a new round of industrial expansion
within the discourse of ecological modernisation. Whatever undeclared agenda
may have lurked behind Engen’s decision, SDCEA was effectively put in the role
of surrogate regulator as the DEAT abandoned its responsibility.
Contested knowledge
As the energy around CONNEPP dissipated, EJNF lost focus. For six years, the
forum had co-ordinated the emergence of a remarkably vibrant environmental
justice movement linking disparate struggles over a very wide range of issues
including land and labour, municipal services and waste, and air pollution and climate
change. In 1998, however, internal tensions opened into painful divisions and the
organisation suffered a collapse of capacity.

98
Toxic Futures
groundWork emerged from the fallout to focus on working with local activists
mobilising against industrial pollution and challenging the power of large
corporations. It introduced the ‘bucket brigade’ to the refinery fenceline
organisations with electrifying effect. Using a low-tech air sampling method
developed by Communities for a Better Environment on the fencelines of US
refineries, the bucket brigade showed a cocktail of chemicals in the air at all sites:
sixteen compounds on the official US list of hazardous air pollutants in Sasolburg;
fourteen on the fenceline of the Chevron refinery in Cape Town; and nine at
Engen in south Durban. Readings for benzene were extraordinarily high at all sites.
The documented health effects of these chemicals show harm to all the bio-physical
systems of the body as well as to individual organs. Many are carcinogenic. Many
cause death following high-level exposure and many eventuate in death following
prolonged exposure at lower levels.
Under the Air Pollution Prevention Act, air pollution control officers negotiated
permits in secret with industry and relied on what industry told them. They were
also concerned exclusively with sulphur dioxide emissions. They produced no
credible information on pollution but both industry and the regulators used this
lack of information to dismiss the concerns of neighbour communities as
uninformed. Industry, left to monitor its own emissions, represented itself as the
only reliable source of knowledge but ensured that its knowledge was untroubled
by some very basic questions. The bucket brigade upset this purposeful ignorance.
Sasol immediately contested both the findings and the bucket method. It
commissioned its own sampling programme, undertaken by the South African
Regional Science Initiative (SAFARI) in 2000 and Leeds University, but the results
confirmed the bucket findings and hence also the credibility of the method. The
campaign thus discredited industry claims to superior scientific information along
with its assurances that it could be trusted to monitor its own emissions. It also
discredited government’s reliance on industry figures and exposed the paucity of
official information.
Meanwhile, a string of incidents across the country and a series of articles in a
local newspaper on health impacts in south Durban provoked an intense public
reaction.14 In April 2000, groundWork and SDCEA organised a mass protest in the
city centre on Earthday. Calling for a clean energy future, the protestors asserted
that ‘clean energy is our constitutional right’ and called on the city authorities to act
on pollution in south Durban. The march was notable for the number of children
participating. Many had been gassed out by toxic blowouts from local plants. An
‘irregular discharge’ of sulphur dioxide from Sappi-Saiccor’s Umkomaas plant

99
New South Africa
engulfed the Naidoo Memorial School. On three successive occasions, chlorine
clouds blew across the Strelitzia School from Sasol’s polymer plant at AECI’s
Umbogintwini complex. At Settlers School, situated between the two refineries,
children had difficulty breathing even when the plants were operating ‘normally’.
Civil society’s perception that government had lost – or abandoned – regulatory
control of polluting industries was fast becoming the public perception. In
December 2000, the national and provincial ministers responsible for the
environment, for health and for industrial development, together with the Durban
city mayor, finally responded. At a stakeholder meeting they jointly announced a
‘multi-point plan’ for environmental management to be piloted in Durban. The
plan included: setting national sulphur dioxide standards; introducing new legislation
to replace the moribund Air Pollution Prevention Act; banning the use of dirty
fuel by industry in south Durban; improving air pollution monitoring; identifying
and minimising fugitive emissions; and assessing community health impacts. This
reflected, point by point, the demands of civil society. At the same time, regulatory
authority was to be devolved to the municipal level.
Local industry mobilised against the ban on dirty fuels, saying it would put
them at a competitive disadvantage and deter local investment, and government
ditched this promise almost immediately. Much of the rest of the multi-point plan
has since been implemented albeit unevenly, slowly and often grudgingly. Under
sustained pressure from SDCEA and in the face of considerable resistance from
the refineries, the Durban regulator opened up the once secret permit process to
public scrutiny and implemented a more credible monitoring regime for ambient
air quality. At the same time, the implications of devolution were stark. Outside
the metropolitan areas, local government capacity varies from minimal to zero.
Even in metropolitan areas, effective regulation depends on the relation of power
between local organisations, industry and local government.15 This lent urgency to
the demand for effective national legislation backed by stringent standards.
While government outsourced much of its environmental responsibility to
civil society, it simultaneously disarmed them. Participation was increasingly confined
to forums where the outcome was predetermined or could be ignored while the
‘partnership’ of government and corporations appeared focused on outlawing
dissent. In 2003, clauses in NEMA guaranteeing rights of access to environmental
information were removed and access made subject to the more restrictive
Promotion of Access to Information Act. Noting that information was critical to
environmental struggles against polluting industry, groundWork observed that
‘industry and government [are] working hand in hand to ensure that environmental

100
Toxic Futures
information is kept away from the very people that are living on the fenceline of
polluting industrial development’.16 The Key Points Act was revived by the Ministry
of Defence, which told south Durban industries that environmental information
should be treated as ‘extremely sensitive’. The Mondi paper mill managers saw the
point. They sought to restrain SDCEA from publicising information on worker
injury and death at the plant and threatened to use Mondi’s influence with the
media to block stories highlighting its pollution. Steel giant Iscor similarly sought a
gagging order against community members who had taken legal action in an attempt
to hold it to account for the pollution that destroyed smallholder farming in Steel
Valley. And, while the DEAT was simply not producing credible information, both
government and industry worked to discredit those who claimed that their health
was affected by pollution.
Health impacts
The Air Quality Bill presented to parliament in February 2004 did not recognise
the protection of people’s health as an objective. For communities on the fenceline,
the relationship between health and pollution is central and civil society
representatives vigorously objected to the omission, pointing out that the
Environment Right in the Constitution emphasises health. The final version of the
Bill draws its objectives directly from the Environment Right.
The original omission, whether intentionally or not, appeared to play to a
corporate agenda that works to dissociate health and industrial pollution on the
grounds of ‘scientific uncertainty’. Scientific certainty is in fact the twin of wilful
ignorance. As industry uses it, certainty must be absolute: the link between pollution
and ill-health must be demonstrated in each case. Medical studies on the causes of
ill-health, however, work on the basis of statistical probabilities and are not
compatible with absolute certainty. Industry thus demands a standard of proof
that it knows is impossible. The strategy is to invalidate statements linking pollution
and ill-health and so exclude them from public debate and make the relationship
invisible. It puts the onus of proving harm on to those who suffer it and
simultaneously raises the costs of doing so.
The relationship is also made invisible because the Department of Health does
not collect relevant health statistics. Nevertheless, groundWork was able to access
clinic records for its 2003 report on air pollution. In Sasolburg, it found that
‘respiratory illnesses can account for up to 40% of all illnesses treated at the clinics’
(2003: 27). Subsequent to this, clinic records were withdrawn from local scrutiny as
the Ministry of Health decided ‘that one cannot access information on health

101
New South Africa
without pre-approval from the provincial offices’ (Fiil-Flynn and Naidoo 2004:
20).
Fenceline activists see the impact on people’s health every day and the Vaal
Environmental Justice Alliance (VEJA) participants note that independent doctors
regularly tell patients that they will not get better unless they leave the area. Their
struggle is against official silence and the wilful ignorance that serves to frustrate
their core demands that industry must clean up and compensate those it has harmed.
It is a struggle to have what they know substantiated by medical science so that it
can no longer be excluded from public debate and ignored. Their belief that the
health impacts are pervasive is in fact supported by a massive international literature,
which shows that exposure to specific pollutants results in specific health effects.
It is also widely acknowledged that the cumulative effect of exposure to many
pollutants is probably greater than the sum of impacts from individual pollutants
but this is not well studied due to the limitations of scientific procedure.
Faced with denial of health effects from industry and government, SDCEA
campaigned over several years for a health study to corroborate what they knew to
be a heavy toll of death and disease from pollution. In 2000, government finally
agreed. An initial study focused on respiratory effects at a local school situated
between the two Durban refineries. After numerous delays in getting started, a
larger study compared south Durban with other sites in eThekwini, including
Warwick next to the major city traffic intersection, and sites that are remote from
industry and traffic. The South Durban Health Study (Naidoo et al. 2006) corroborated
local people’s perceptions and its recommendations echoed their demands. It comes
in two sections: a health risk assessment based on monitoring people’s exposure to
air pollutants; and an epidemiological study that looked at the actual status of
people’s respiratory health by examining children at selected schools and their
parents.
The risk assessment concludes that the number of cancers caused by pollution
will be very high in south Durban compared both with the other sites and with
figures from studies in other places in the world. It estimates 25 cancer cases for
every 100 000 people, which is 250 times the accepted norm, but notes that this
figure is conservative for three reasons: air monitors were not necessarily located
at hot spots; estimates of people’s exposure were based on averages for pollutant
concentrations and actual exposure may have been much higher; the amount that
people actually breathe in was conservatively estimated. Real cancer rates in south
Durban are thus likely to be higher than the study estimates and may be much
higher. The study identifies benzene, naphthalene, and dioxins and furans as the

102
Toxic Futures
pollutants responsible for most of the cancers, but ethyl benzene, polychlorinated
biphenyls (PCBs) and styrene and the metal particulates of nickel and chromium
also contributed to cancers.
The epidemiological study finds that respiratory ailments in south Durban are
high by comparison with other sites. In particular, it notes that previous exposure
increased people’s vulnerability. Further, relatively modest increases in pollution
affected vulnerable children. The key pollutants linked to respiratory ailments were
sulphur dioxide, nitrogen dioxide, nitrogen oxide and particulates.
The study recommends tighter regulation with further improvements to the
air quality monitoring system and of emission controls. For the ‘conventional
pollutants’, it notes that sulphur dioxide emissions have been reduced from
historically very high levels but further reductions are needed, particularly if there
is going to be more development. As it is, daily and ten-minute limits are frequently
exceeded by pollution peaks although the annual limit is met.17 Particulates (PM10
)
and nitrogen dioxide exceed the annual limit and very frequently exceed short-
term limits. Limits for fine particulates (PM2.5
) – which penetrate deeper into the
lungs – have not been set but limited monitoring specifically for the study showed
that concentrations exceeded the World Health Organisation annual guideline and
regularly exceeded its daily guideline.18 It recommends that a ‘strategy and timeframe
for attaining compliance with standards, guidelines and targets should be developed
for each pollutant’ (Naidoo et al. 2006: 202). For other pollutants, it recommends
expanded monitoring for a wider range of volatile organic compounds (VOCs)19
and for metals, dioxins and furans, and total reduced sulphur compounds. The
sources of all these pollutants should be tracked down and rigorous emission
controls introduced. Finally, it calls for a programme of asthma education in Durban
communities and for better health information, including long-term monitoring
of respiratory diseases and setting up a cancer registry.
Framing the law
Although the environment still ranked at the bottom of government’s priorities,
the DEAT budget for environmental management, supplemented by donor funding,
expanded. In 2003, the DEAT started setting up the Environmental Management
Inspectorate – or Green Scorpions – and announced its presence by stinging the
operators of an illegal toxic dump. The inspectorate was formally established in
2005 and is working, according to the minister, ‘to change the common perception
in South Africa that government lacks the will to enforce our environmental
legislation’.20

103
New South Africa
The DEAT also started actively preparing long-promised laws. It finally brought
the Air Quality Bill to parliament in 2004 while the Waste Bill started going through
the parliamentary process in 2007 – seven years later than originally promised.
Civil society participation in these legislative processes was generally restricted to
formal parliamentary hearings required under the Constitution. Business, on the
other hand, appeared to have prior access during the drafting stage.21 Fenceline
groups put together joint submissions arguing that people’s right to an environment
not harmful to their health should be written in as the primary purpose of the Bill;
it should focus on reducing pollution at source and should therefore mandate
emissions standards rather than rely exclusively on ambient air regulation; and that
various measures should be made mandatory rather than left to the discretion of
the minister. The department accused them of delaying the urgently needed Bill
but they argued that, having waited ten years for it, they would wait a few months
more rather than accept a flawed Bill. The amended Bill included several significant
changes demanded by communities and was passed in August 2004.
National environmental laws take the form of framework legislation, outlining
broad objectives and either requiring or allowing the minister to promulgate more
specific regulations required for implementation. As with the laws themselves, these
processes are contested and vulnerable to delay, intentional or not. Thus, ambient
air quality standards required by the Air Quality Act were developed four years
after the Act was signed into law and nine years after they were promised. Industry
was particularly resistant to meaningful emission standards. Through the long process
from the 2000 multi-point plan announcement, fenceline groups kept them on the
table, insisting on their inclusion in the Air Quality Act and refusing to allow their
neglect in the standards-setting process. They were finally promulgated in 2010
but, for most industrial processes, regulate only for the conventional pollutants
and not the more exotic substances noted by the Durban health study.
The Waste Bill followed in 2008. Civil society contestation focused particularly
on incineration and the DEAT’s refusal to recognise waste-pickers. The DEAT
then rallied industry in defence of incineration. Ahead of the parliamentary hearings,
it flew officials to all the cement kilns lining up to burn toxic waste to consult with
management but not with neighbouring communities. This disregard was highlighted
during the hearings and it belatedly visited three communities. The Waste Act
codifies the current state of play in struggles around waste initiated in the late
1980s. Understood this way, it makes sobering reading: waste is generally to be
defined by the market; the waste hierarchy is invoked but effectively inverted to
prioritise disposal over avoidance and minimisation; incineration is permitted
although, in a nod to civil society objections, subject to parliamentary approval

104
Toxic Futures
rather than ministerial fiat; and toxic waste trading, so long resisted through
successive campaigns, is regulated in order to allow it. Over the objections of the
department, the Act does recognise waste-pickers and so creates a political opening
for them to engage with the official processes that define their work.
More broadly, the DTI’s view of the place of environmental management in
the developmental state was confirmed by DEAT officials at the parliamentary
hearings: ‘The bottom line [is] that South Africa [is] a country in need of economic
growth and development. DEAT [is] thus trying to manage the negative effects of
dealing with waste’.22
PAINT IT GREEN
Despite having a record of supporting dirty projects, the DTI’s endorsement of
‘triple bottom-line’ reporting, together with its promotion of knowledge intensity,
gestures towards an assumption that a new round of globally integrated development
is accompanied by cleaner production driven by the market. In the last decade
South Africa’s major corporations have shown increasing concern over the
representation of their environmental and social records. They have introduced
sustainability reports and signed up with international organisations such as the
Global Reporting Initiative and the WBCSD, which promote triple bottom-line
reporting and proclaim a new age of clean and socially responsive development
founded on networked production (WBCSD 2010).
Networked production has its origin in the East Asian economies and Japan in
particular. It introduced a range of innovations to cut production costs such as
‘just in time’ delivery of inputs and ‘total quality management’ aimed at ‘zero defect’
in goods produced. The concept of zero waste, according to industrial economist
Robin Murray, is an extension of zero defect and derives, on the one hand, from
the pressures exerted by the environmental movement and, on the other, from ‘the
world of industry and its rethinking of production’ (2002: 19). Zero waste, he
argues, is central to a new ‘wave of industrial development . . . centred on electronics’
and ‘marked not so much by a new material . . . as by the pressure to reduce materials
and their toxicity . . . We live in an age [that] speaks of “dematerialisation”, of
finding ways of avoiding production, of making more with less’ (69). And he goes
on to applaud the WBCSD’s leadership in promoting ‘eco-efficiency’.
Murray emphasises the role of social movements and government regulation
in ushering in a new paradigm of ‘post-industrial’ production with design for inbuilt
re-use, upgrading and recycling, etcetera. But finally it is corporate capital that
leads this wave of development and shapes the new world of clean production. ‘In

105
New South Africa
the words of Edgar Woolard Jr, former chairman of DuPont, “The goal is zero:
zero accidents, zero waste, zero emissions” ’ (71).
This representation of green capitalism, in a book written for Greenpeace,
could not be further from the experience of actual networked production and it
fundamentally mistakes the nature of capital. First, the new wave of development
has been accompanied by a new wave of waste precisely from the cutting-edge
sector of electronics, as shown in Box 3.2.
Box 3.2 The most (post)modern waste
A growing and toxic electronic waste stream flows from the so called ‘post-
industrial’ and ‘resource-light’ economies of the North. The major components
of e-waste are discarded personal and mainframe computers, printers, copiers,
faxes, cell phones, telephones, televisions and high-end telephonic equipment.
In Europe it is growing three to five times faster than municipal waste as a whole.
In the US, where around half of all households own a personal computer, the
Environmental Protection Agency estimated in 2001 that e-waste in US landfills
would grow four-fold.
This rapid growth results from the purposeful design of inbuilt obsolescence.
From the 1950s, as Annie Leonard observes, industrial design journals ‘actually
discuss how fast [designers] can make stuff break and still leave the consumer
with enough faith in the product to go buy another one’ (2008). Electronics take
obsolescence to new heights. Rapid technology change is part of the arsenal.
Computers are made to become incompatible with evolving information and
communication technology systems. They could be designed for upgrading but,
says Leonard, the ‘piece that changes’ is given a different shape so it won’t fit
and ‘you gotta chuck the whole thing and buy a new one’ (2008).
E-waste is toxic, yet most of it enters the municipal waste stream. In 2001, e-
waste was reported to be the source of 70% of the heavy metals in US landfills,
including mercury, cadmium and hexavalent chromium (the biologically
absorbable form of chromium). Computer monitor screen glass contains lead to
stop radioactive gamma rays from the display cathode from reaching user’s
eyes. This contributes 40% of the lead now in US landfills. Computers also contain
polyvinyl chloride (PVC), which generates dioxins and furans during production
and disposal by incineration, and other toxic compounds.
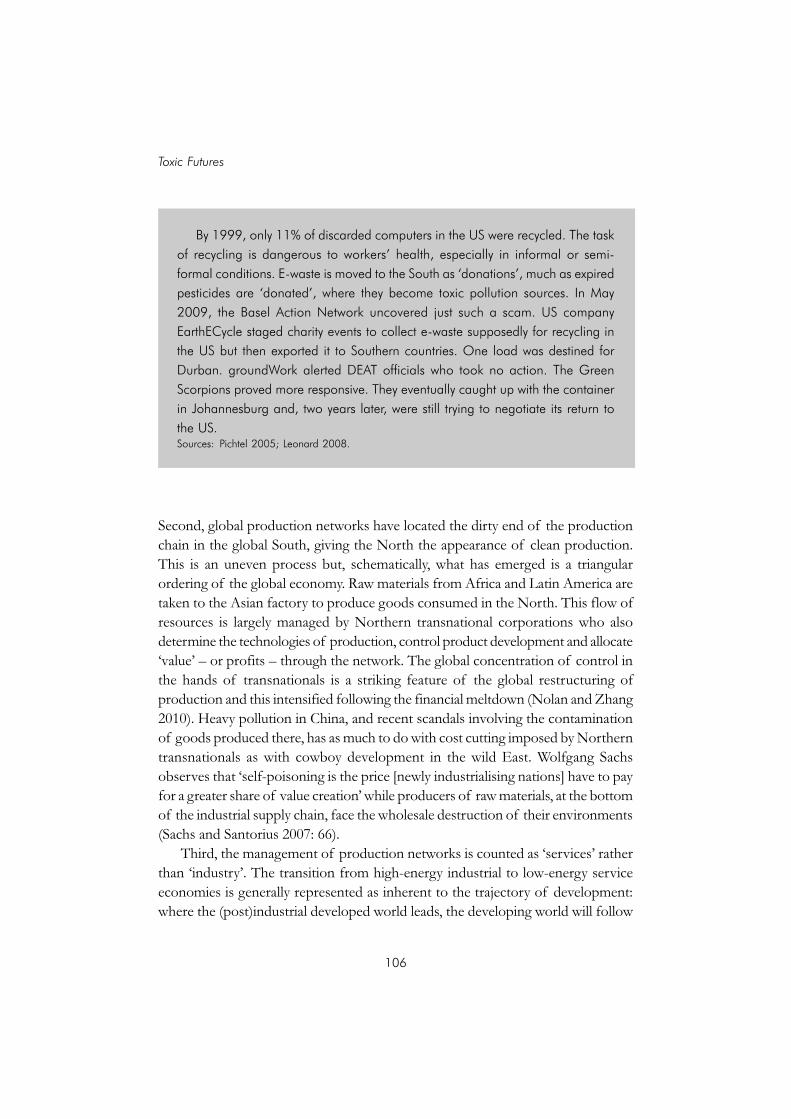
106
Toxic Futures
Second, global production networks have located the dirty end of the production
chain in the global South, giving the North the appearance of clean production.
This is an uneven process but, schematically, what has emerged is a triangular
ordering of the global economy. Raw materials from Africa and Latin America are
taken to the Asian factory to produce goods consumed in the North. This flow of
resources is largely managed by Northern transnational corporations who also
determine the technologies of production, control product development and allocate
‘value’ – or profits – through the network. The global concentration of control in
the hands of transnationals is a striking feature of the global restructuring of
production and this intensified following the financial meltdown (Nolan and Zhang
2010). Heavy pollution in China, and recent scandals involving the contamination
of goods produced there, has as much to do with cost cutting imposed by Northern
transnationals as with cowboy development in the wild East. Wolfgang Sachs
observes that ‘self-poisoning is the price [newly industrialising nations] have to pay
for a greater share of value creation’ while producers of raw materials, at the bottom
of the industrial supply chain, face the wholesale destruction of their environments
(Sachs and Santorius 2007: 66).
Third, the management of production networks is counted as ‘services’ rather
than ‘industry’. The transition from high-energy industrial to low-energy service
economies is generally represented as inherent to the trajectory of development:
where the (post)industrial developed world leads, the developing world will follow
By 1999, only 11% of discarded computers in the US were recycled. The task
of recycling is dangerous to workers’ health, especially in informal or semi-
formal conditions. E-waste is moved to the South as ‘donations’, much as expired
pesticides are ‘donated’, where they become toxic pollution sources. In May
2009, the Basel Action Network uncovered just such a scam. US company
EarthECycle staged charity events to collect e-waste supposedly for recycling in
the US but then exported it to Southern countries. One load was destined for
Durban. groundWork alerted DEAT officials who took no action. The Green
Scorpions proved more responsive. They eventually caught up with the container
in Johannesburg and, two years later, were still trying to negotiate its return to
the US.Sources: Pichtel 2005; Leonard 2008.

107
New South Africa
as they ‘catch up’. But first they must pass through the stage of industrialisation. To
the contrary, however, the service economies are possible only on the basis of the
global structuring of production described above and they rely on the unequal
global division of labour. This brings us to the fourth problem – the wasting of
people. As described in the chapter on the Vaal, the world of work is increasingly
unequal and divided into three major ‘zones’: the shrinking core of permanent
workers; the growing ‘non-core’ of insecure casualised workers; and, in the
‘peripheral zone’, the vast pool of informal workers and unemployed people made
surplus to the requirements of networked capital.
Fifth, the age of globally networked capital is integrally bound up with the
neo-liberal policies given global force through the Washington Consensus. A critical
aspect of this revolution from above was the financialisation of capital resulting
from the crisis of over-accumulation. The series of financial crises devolved to
Southern countries since the 1970s have yielded high returns to global capital that
could appropriate assets at fire-sale prices. This was just one aspect of ‘accumulation
by dispossession’ through which capital managed the spectacular transfer of wealth
from poor to rich globally and within most countries, South and North. Finance is,
of course, also a service sector and it is financialisation, rather than reduced materials
intensity, that has ‘dematerialised’ economies. In South Africa, the finance sector
now accounts for 20% of GDP but, as Fine (2008a) argues, this was not a contribu-
tion of ‘value added’ to the economy but rather the finance sector’s appropriation
of value from the economy.
The crisis was also passed on to workers and the environment as indicated in
the first and third points above. Beyond e-waste, however, the WBCSD is very
much part of the neo-liberal moment, promoting ‘flexible business solutions’ in
opposition to mandatory regulation and precisely to deflate pressure for such
regulation. Murray (2002) provides a seductive account of initiatives by this or that
corporate. Many of the same corporations, however, operate by other standards in
other parts of the world. And, as lead corporations in global production networks,
their demands on subordinate firms ensure practices that are directly contrary to
those advertised to consumers. This is the flexibility that corporations seek to
protect and it is enhanced by corporate advocacy in other forums such as the
World Trade Organisation. It is this advocacy that has subjected national regulatory
systems to international competition. And it is this advocacy that creates Byzantine
market responses such as carbon trading: after a great deal of mathematics, and
profit, the carbon credits traded still have no relationship to actual carbon emissions.

108
Toxic Futures
4
The toxic cradle of production
CAPITALISM IS NOT ONLY a ‘gigantic accumulation machine’ (Kovel 2002:
59); it is also a gigantic waste creation machine. Its logic is to turn more and
more raw materials and energy into sellable commodities, commodities into
accumulated profit and profit into investments which then expand the system as a
whole. Its restless need for never-ending accumulation and expansion means that
it must keep on consuming resources and creating ever-growing wastes. Behind
the product on the shop shelf lies the ‘value chain’ of production that is shadowed
by a vast chain of waste and destruction. This shadow leaves a deep toxic stain that
spreads through air, water and land across the face of the earth and across time
into a poisoned future. This chapter focuses on minerals, looking at mining, the
first link in the waste chain, and then at selected industries further along the chain:
iron and steel, aluminium and cement.
THE SACRIFICE TO MINING
The post-war period in South Africa saw a rapid expansion of industry centred on
the minerals-energy complex. The apartheid state’s massive investments in Iscor,
Sasol and Eskom enabled the vertical integration of production under the control
of the corporations. This meant controlling the entire chain of production from
raw material inputs to the marketing of products. More broadly, this process of
industrialisation created the giant corporations, private and state-owned, necessary
to manage vertical integration and concentrated economic power in their hands.
By the 1980s, Anglo American and the state each controlled 25% by value of
South Africa’s top 50 corporations. ‘The picture is essentially one of a relatively
small economy with three main pillars: the state, the three insurance-based groups,1
and Anglo’ (Pallister, Stewart and Lepper 1987: 38). If anything, this understates
the degree of concentration since the finance houses were themselves tied in with

109
The toxic cradle of production
the big mining houses (Fine and Rustomjee 1996) and Anglo’s influence extended
well beyond its control of over half the capital value of listed companies.
Anglo had gained control of the De Beers diamond monopoly and emerged as
the top gold-mining house during the 1930s. It also started diversifying into coal,
base metals and industry. Following the war, it too established vertical control of
production relating to mining – mining inputs and minerals and metal industries –
as well as in other industrial sectors such as the auto industry, forestry, timber and
paper, and agriculture, food and beverages. Anglo became Iscor’s main partner in
upstream and downstream businesses and also both the main supplier of coal to
Eskom’s power stations and the power utility’s largest customer. The interests of
the minerals-energy complex were thus consolidated through tight institutional
relationships across the state and private sectors. They were also given representation
within the state through the Department of Minerals and Energy (DME), which
was dominated by the Chamber of Mines on the one side and Eskom on the other.
With the political transition of the 1990s, Anglo moved considerable assets out
of the country so as to pre-empt the possibility of nationalisation. Thus, it transferred
substantial shareholdings to Minorco, an established subsidiary registered in
Luxembourg, which in turn invested heavily in international acquisitions, particularly
in North America. At the same time, it began a process of unbundling, selling off
non-strategic assets and using the process to initiate the first black-empowerment
deals and so consolidate relationships with the new political elite.
The offshore listing in London followed in 1999. Anglo was then level pegging
with Rio Tinto for the top spot as the world’s largest mining corporation. Starting
with the merger of BHP of Australia and Billiton – to which we return below –
the 2000s have seen a major concentration of ownership at the global level. By
2005, Anglo had been knocked down to fourth place behind BHP Billiton, Rio
Tinto and Brazilian corporation Vale.2 It remains South Africa’s largest mining
company and massively influential in the broader economy.
Spoils
Mining is literally an extractive industry, clawing materials from the ground and
generally impervious to the environment and people around the mines. Solid mining
waste is rarely managed beyond being piled into heaps or dams next to where it has
been excavated. For the most part, mining slurry has simply been dumped into
rivers, lakes or the sea although mining engineers say this is changing:
Historically the easiest and most economical solution was to discharge
tailings slurry by gravity to the nearest body of water and let nature take

110
Toxic Futures
care of the problem. However, as communities and farming activities have
encroached on mining areas, and fishing industries and interested individuals
have applied pressure to government regulatory bodies, the need for properly
engineered tailings disposal areas has become apparent (Robinson and
Toland 1979: 782).
In fact, it was mostly the mines that ‘encroached’ on farming, fishing and
communities, but the idea that the land was empty made its enclosure easy, especially
if it belonged to indigenous people, North or South, without capitalist property
rights. The term ‘sacrifice area’, reports mining activist and researcher Roger Moody,3
was first officially attached to the Four Corners region of the US Midwest by the
US Academy of Science in 1973, after it had been trashed by uranium, coal, oil and
gas mining. In July 1979, a tailings dam in the area burst to release 1 100 tons4 of
milling waste and nearly 100 million gallons5 of radioactive liquids into streams on
Native American (Navajo) territory. According to Native American activist Winona
La Duke ‘at least one member of every Navajo family has likely died from lung
cancer and other diseases resulting from uranium mining’ (quoted by Moody 2007:
127).
In Papua New Guinea, Rio Tinto insisted on the right to dump wastes from its
very lucrative Panguna mine in Bougainville into a nearby river and so provoked a
civil war:
By 1988 a few of the Panguna indigenous landowners, led by a former Rio
Tinto mineworker, Francis Ona, demanded US$10 billion compensation
for the ruination of their gardens, forest and waterways. The company
jeered at the claim and refused to negotiate. Ona set up a nucleonic
‘Bougainville Revolutionary Army’, declaring independence from Papua
New Guinea. Backed by Australian helicopter gunships, troops from the
mainland invaded the island. In the bloody civil war that ensued up to a
fifth of the island’s population (between 15 000 and 20 000 villagers, many
of them women and children) were to die before peace was reached in
early 1998 (Moody 2007: 2).
Active mines pollute water in two ways according to a textbook on coalmining.
First, water used for mining processes ‘is often seriously polluted and cannot be
returned directly to the hydrological cycle without prior treatment’. Second, ‘a
large volume of water . . . is casually affected’ by surface run-off, acid mine drainage,

111
The toxic cradle of production
pumped mine water and groundwater flows. ‘It is not possible to apportion the
damage among the “process” and “casual” categories, but the latter is probably the
more important’ (Down and Stocks 1977: 91).
Acid mine drainage results when sulphates in rock are exposed to oxygen, on
mine dumps or underground, to produce sulphuric acid. The acid then dissolves
and mobilises heavy metal toxins. Millions of litres are pumped from South Africa’s
mines daily and ‘partially treated’ with chemicals to neutralise the acid, but not the
metal toxins, before being released into the surface water. If it is not pumped, it
fills to the surface and decants untreated. The Johannesburg conurbation is now
sitting on a rising tide of toxic water as the old mines fill. The first large-scale
decant occurred on the West Rand in 2002. The water flowed out through mine
shafts and boreholes and through springs that had dried up when the mines originally
ruined the aquifers that fed them. That decant has been ‘managed’ but scarcely
contained. The year 2010 opened with a new round of unmanageable decanting on
the West Rand as several mining corporations stopped pumping. The Central and
East Rand basins are also filling fast and will reach critical levels in the next year or
so. The Witwatersrand is a major watershed, draining south and west to the Vaal
and north and east to the Limpopo. Large-scale decanting will flow both ways and
threatens the ruin of life over an immense stretch of the country. While the mining
houses ducked for cover from liability, government ignored the problem for over a
decade. In August 2010, it put together an inter-ministerial team chaired by Water
and Environmental Affairs minister Buyelwa Sonjica who said they were looking
for ‘a cheap, effective and sustainable’ solution.6 Whether these aims can be
reconciled remains to be seen.
Abandoned mines
Mining corporations arrive brazenly, but leave furtively when the profits dry up. In
North and South alike, ‘abandoned and ownerless mines’ litter the landscape. In
the US, there are half a million such mines (Moody 2007: 129ff.). In South Africa,
the list is not complete but is estimated at 6 000. The mine owners simply abscond,
or slip out of one corporate skin into another, taking their wealth with them but
leaving toxic liabilities for others to clean up.
The Transvaal and Delagoa Bay coalmine near Emalahleni (formerly Witbank)
tops the list of abandoned mines in South Africa. It operated from 1896 to 1953
but, more than half a century later, its waste is still producing an ongoing ecological
catastrophe. Underground fires still smoulder, releasing sulphur dioxide, methane

112
Toxic Futures
and carbon dioxide. Acid mine drainage seeps from various cracks and covers the
area with sulphate salts that kill all vegetation they touch.
Near Maguqa, one of Emalahleni’s townships, local children use a warm pool
to swim in. It is filled with acid mine drainage water heated by the underground
fires and likely to contain carcinogens, including benzene and toluene, which have
been detected in the gases from the fires by Pone et al. (2007). The pond is one of
a series constructed by the Department of Water Affairs and Forestry (DWAF)
when it took responsibility for the abandoned mine. The ponds collect acid mine
drainage water that is then supposed to be pumped to a DWAF treatment plant
built in 1997. Although only ten years old, the plant was taken out of commission
in late 2006 for want of staff and fairly minor repairs (Hobbs, Oelofse and Rascher
2008) and the acid mine drainage just ran into the Brugspruit which flows past
Maguqa. In 2008, the sulphate salts were so thick on the water that the stream
looked like it was snowed over. The toxic water then ran into the Olifants River,
past fruit farmers and into the Loskop Dam. Over the past few years, officials at
the Loskop Dam nature reserve have reported thousands of fish deaths as well as
the deaths of crocodiles and water turtles.
The acid mine drainage degradation seems to have encouraged other factories –
Highveld Steel, Vanchem, Samancor – to release their untreated waste water into
these streams. The Emalahleni municipality similarly releases raw sewage into local
streams and this too arrives in the Brugspruit. The stream is surrounded by townships
in a busy valley. Children play in it, people cross it on their way to work, herders
graze cattle and coal-pickers work over heaps of discarded coal.
Four mines in the Witbank area, belonging to AngloCoal and BHP Billiton,
have constructed an acid mine water treatment plant. They show that acid mine
drainage water can be treated but the price tag of R300 million deters hundreds of
other coalmines. The externalised cost from untreated acid mine drainage is far
greater. It is imposed on the environment and the people living there. Finally, the
costs from working and abandoned mines are imposed on the public purse – except,
of course, that DWAF also abandoned the responsibility. By the time the coal is
mined out, both ground and surface water will be severely contaminated and ‘the
region could become a total wasteland’, according to McCarthy and Pretorius
(undated: 16). There is no plan to prevent this.
Gold’s wasteland
In more than a century of mining, South African gold mines have covered an
estimated 180 square kilometres under more than 200 tailings dams. These areas
are now permanently contaminated. In 2001, Roesner et al. estimated that treating

113
The toxic cradle of production
just the polluted topsoil (top 30 cm) would cost $550 million. Mining waste is
classified into rock and sand heaps and slimes dams. Slimes dams contain the silt
and slurry together with the chemicals – arsenic, cyanide or mercury – used to
extract gold from ore. The gold ore itself typically contains uranium and significant
concentrations of chromium, copper, nickel, lead and zinc.
On the Far West Rand, gold miners physically destroyed a high-quality dolomitic
aquifer and also contaminated it beyond recovery by dumping radioactive mining
waste into it. The ore contains high concentrations of gold making the Far West
Rand the richest of all seven active goldfields of the Witwatersrand basin. It also
contains the highest concentrations of uranium and, when mining started in the
early 1950s, 9 of the 22 mines produced uranium as well as gold. Between 1952
and 1988, they processed the uranium into more than 11 000 tonnes of yellow
cake (U3O8).
But miners seeking a fortune here first had to conquer the aquifer that lay
above the gold reefs. The aquifer consists of caverns weathered in the alkaline
dolomite by the mild natural acidity of rainwater. A number of impermeable dykes
divide the aquifer into a series of ‘compartments’. These dykes also ensured that
pressure within the aquifer forced the water up and out through a number of
springs feeding into the Wonderfonteinspruit. The water was of high quality and
much prized by early black farmers and by the white farmers who displaced them.
When the miners arrived and created a local market for food, the Wonderfontein
Valley became a prime area for irrigation production according to mining geologist
Jan Wolmarans (1984).
Early attempts to sink shafts in the area were abandoned as the shafts flooded.
When real mining started in the 1950s, the corporations pumped out water into
existing irrigation channels, into overland pipes or down to the Wonderfonteinspruit.
They thus dewatered the aquifer. The Wonderfontein springs started drying up
from 1957 and the first sinkholes – resulting from the loss of pressure in the caverns
– appeared in 1960 to much public alarm. This provoked an official inquiry by
DWAF7 and, on its recommendation, government decided to sacrifice farming
and the aquifer to the interests of gold mining. Ever anxious to make someone else
pay for the inconvenience of the aquifer, the mining corporations bickered about
who was responsible for pumping and disposing the water, so prompting the state
to regulatory action. In 1963 it made dewatering compulsory for all mines in the
area, confirming the sacrifice of the aquifer in the interest of peace between the
mining houses. Even so, the miners do not always win against the water. In 1968,
the Wes-Driefontein mine was flooded.

114
Toxic Futures
The dewatering led to extensive damage to farms in the area. In 1964, the Far
West Rand Dolomitic Water Association was formed. Behind its bland name, it
was a cat’s paw for the mining companies and each had to contribute according to
the amount of water it was pumping out of its mines. The association’s task was to
receive public complaints, buy up the farms from the complainants and then rent
them out again. As a result, the association now owns large stretches of land affected
by sinkholes and, as the landlord, is in a powerful position to deal with complaints.
By 1984, the area had 589 sinkholes, most of them caused by dewatering and other
mining activities. They seriously damaged railway lines, roads, mining infrastructure
and buildings, and people’s homes. Some structures just disappeared into the
dolomite caverns below.
The gold miners deliberately built large numbers of slimes dams on top of
sinkholes. In mining terms, sinkholes add ‘stability’ to slimes dams by draining
away fluid and so preventing a build-up of pressure with the potential to burst the
walls (Robinson and Toland 1979). Slurry thus drains straight into the caverns of
the aquifer that are then made into sumps for toxic waste. In some cases, miners
attempted to plug sinkholes with mining waste. Predictably, in Wolmarans’s view, it
didn’t work. The waste simply dropped down into the water of the aquifer.
That the waste is heavily contaminated with uranium has been known to a
closed circle of miners, scientists and state officials for decades. With the political
transition from apartheid to majority rule, argues water researcher Anthony Turton,
the mining corporations’ controlling grip on this group slipped. Some began to
speak out and confirmed public suspicions that the Far West Rand aquifer was
contaminated with radioactive uranium. ‘It is this new generation of public domain
literature that has given rise to the dilemma now confronting Government, because
in essence, what it has shown is that there is a massive pollution plume downstream
of gold-mining activities, consisting of a cocktail of heavy metals, sulphates and
radionuclides’ (2008: 3).
On the Far West Rand two local farmers, the Coetzee brothers Sas and Douw,
decided to clean up their farm dam on the Wonderfonteinspruit during 2007. As
soon as they removed the wall and exposed the sediment, a satellite picked up the
radiation from uranium that had accumulated at the bottom of the dam and alerted
the National Nuclear Regulator. The National Nuclear Regulator then instructed
the Coetzees to repair the wall, never to drain the dam again, not to disturb the
sediment, not to allow their cattle to drink there, and not to sell any produce from
their farm as it might be contaminated. The Coetzees complied because ‘we were
brought up to believe that it is not right to knowingly harm someone’. But they are
not happy to bear the cost while those responsible for the contamination, the

115
The toxic cradle of production
owners of a nearby slimes dam from which the dun-coloured slurry water traces a
clear trail to their dam, face no consequences.8 The National Nuclear Regulator has
since declared that the food from the area is safe to eat. Nevertheless, its study of
the catchment (NNR 2007) confirms that significant amounts of uranium are
entering the Wonderfonteinspruit, that uranium is concentrated in the rivers and
sediments from where it can be mobilised, and that it poses a health risk to residents.
It has not explained the contradiction.9
The mining companies now propose to remove and consolidate all the slimes
dams into two mega slimes dams situated on granite rather than on dolomite. This
move is opposed by the considerable public mobilisation against the mining waste,
which has given birth to a new environmental alliance, the Federation for Sustainable
Environments.
Box 4.1 Radioactive waste
The status of radioactive waste has been a closely guarded secret, both because
of apartheid South Africa’s nuclear weapons programme and the miners’ direct
interest in it. However, in 2004, an unusually frank audit of radioactive waste
was put together by the DME.
The report estimated that there could be 5 000 million tonnes of gold-mine
tailings containing uranium, and around 1 000 million tonnes of waste rock.
About 25% of the uranium in mining waste had been extracted by 2000. Vast
amounts of soil were also contaminated, along with buildings and materials
used in uranium plants and mines. Up to 1993, when mines first became subject
to regulation by the National Nuclear Regulator, contaminated mild steel scrap –
an estimated 60 000 tonnes per year – was simply sold for recycling. More than
30 mines had been identified for decontamination, to be paid for by the gold-
mining industry but, by 2000, only 8 were reported to have been cleaned up.
The lax approach of the mining industry, and its regulators, can be seen in
the DME report’s argument for mixing contaminated materials into existing mine
dumps:
. . . there are recognised benefits of reintroducing radioactive residues
from uranium and acid plant maintenance/decommissioning into the
milling and gold-uranium extraction process. Apart from the financial

116
Toxic Futures
Platinum: More precious than people
Dispossessing people of their land while trashing their environments is by no
means a relic of the history of colonialism and apartheid. The lives and livelihoods
of thousands of rural people in Limpopo are being trashed right now by the mining
activities of the world’s largest platinum producer, AngloPlatinum,10 reports
ActionAid (2008). They have lost their land, which is now being physically removed
benefits of recovering gold and uranium, the gradual reintroduction of
this material into the process has the effect of returning the radionuclide
concentrations back to their original values, i.e. to the levels prevailing in
the original feed material to the plant. The reprocessing of these residues
therefore avoids having to dispose of them separately (a potentially risky
and expensive process if they are to remain at high activity concentrations).
Instead, they simply end up as being an indistinguishable part of the
tailings (DME 2004: 52).
Pelindaba, the nuclear research facility near the Hartbeespoort Dam, placed its
wastes in an excavated hillside called Thabana. For this waste, ‘complete records
are not available’, as the audit politely puts it. It was foreseen that all the Thabana
trenches would eventually have to be excavated. The audit anticipated that
decommissioning of buildings, stores and plants (including the Safari-1 reactor)
would result in 13 000 cubic metres of waste, from a total volume of 150 000
cubic metres in contaminated materials. It gave no figures but expected this to
be a costly process that would last between 20 and 30 years.
At the time of the report, Vaalputs in Namaqualand contained 7 371 cubic
metres of low and intermediate-level waste, which is mostly material coincidentally
contaminated by radioactivity or with uranium. Vaalputs is now being considered
for the burial of high-level waste. Thus far, Koeberg nuclear power station has
stored its high-level waste on site. This waste is composed of spent fuel assemblies
and stored in racks under water. The racks are periodically repacked to cram in
more waste. According to the report, by 1999 Eskom had provided R1 164
million for the management of the spent fuel and the eventual decommissioning
of Koeberg.
There is still no plan for final disposal of high-level radioactive waste.

117
The toxic cradle of production
by opencast mining or covered with mining waste. They have lost access to drinking
water, now polluted and unfit for human consumption. They have lost their
livelihoods and have not received adequate compensation. Their ancestral graves
have been removed, injuring their spiritual connection with the land. And they
have been excluded from decisions about their own future, as the mining giant
established front organisations – fifteen different Section 21 companies – that
signed agreements on their behalf accepting relocation. Their challenges to the
AngloPlatinum land grab have been met with police brutality and corporate legal
action.
The villagers are traditionally almost completely dependent on farming on
communal land. Jobs are scarce and social services are minimal. Their other major
source of income is from government grants – old-age pensions and children’s
allowances. Villagers in Ga-Pila, Potgietersrus, accuse the mine of cutting off their
water and electricity to force them to move. Two water reservoirs disappeared
under mining waste. The municipality did not reconnect or re-establish a water
supply. Even where the land is not covered by waste, villagers are not allowed to
plough because it is now ‘mining property’.
The villagers live – or used to live – on the richest platinum resource in the
world. The Bushveld Mineral Complex hosts 88% of the world’s platinum and
palladium. Platinum is used in catalytic converters for vehicles to reduce levels of
carbon monoxide, hydrocarbons and nitrous oxides emissions to legislated levels.
These catalysts, responsible for half the demand for the platinum minerals group,
are mainly produced in Britain, Germany and Italy. Platinum is also used in the
electrical, electronics and chemicals industries, for glass-making and as jewellery.
AngloPlatinum, which made record profits of $1.75 billion in 2007, spends less
than 1% of its profits on local community development but makes extravagant
claims about its positive influence. The claims are at odds with what ActionAid
found on the ground.
South African law does not protect these communities from exploitation, and
discriminates against communal landowners. According to ActionAid’s report:
The Mineral and Petroleum Resources Development Act of 2002, is very
permissive towards mining companies . . . The law requires mining
companies only to consult with the community and report back on the
outcome of those consultations to the government department responsible
for mining – the Department of Minerals and Energy (DME) – before a
mining right is issued by the minister. The permission of the community is
118
Toxic Futures
not required. The DME and the minister have no obligation to consult
with the community affected and usually do not do so; they depend on the
report given to them by the mining company, which the community has no
right to see. Once a mining right is awarded to a company, the law does not
require it to obtain permission from the occupiers or the owners of the
land. Rather, the law expressly authorises the company to commence laying
infrastructure and undertake mining on the land. Neither does the DME
require written lease agreements to be concluded between the mine and
the community. The negotiation and conclusion of a lease agreement is
standard practice in relation to privately owned land (land owned by white
people) but is the exception in relation to communal land (land generally
used by black people) (2008: 12–13).
While the guardianship of the country’s mineral resources is supposed to be vested
in the state, mining and prospecting rights are allocated to corporations for free.
Compensation is limited by the fact that the mining corporation’s offer is usually
the only one on the table, reflecting ‘at most the agricultural value of the land, not
a proportion of the value of precious metals or minerals in the ground’ (2008: 13).
Campaigners for community rights want the Mineral and Petroleum Resources
Royalty Bill and the draft Mineral and Petroleum Royalty Bill to be amended to
ensure:
• communities have greater rights to be fully consulted and give informed
consent before mining concessions are granted;
• the consultation process is supervised by the state or an independent, non-
interested party delegated by the state and strictly governed by regulations;
• environmental assessments and safeguards are retained and strengthened
and remain under the control of the Department of Environmental Affairs;
• mining companies’ BEE obligations include equity participation and/or
community royalties for historically disadvantaged communities in mining
areas (2008: 13).
The villagers have actively resisted the enclosure of their resources as is documented
in Chapter 10. They have enlisted the help of environmental justice lawyer, Richard
Spoor, and worked with the social movement Jubilee, groundWork and the Vaal
Environmental Justice Alliance (VEJA) as well as ActionAid. Ironically, their best
hope lies in the falling demand for and falling prices of platinum. As the commodity
boom was reined in by the prospect of global recession, several platinum projects

119
The toxic cradle of production
were cancelled or delayed. Many were revived as the price recovered in anticipation
of global economic recovery.
STEELING THE FUTURE
Iscor was privatised for R3 billion in 1989 as part of the late apartheid strategy of
liberalising the economy but government retained a large share through the Industrial
Development Corporation (IDC). South Africa provided a low-cost base for steel
production. Apart from scrap metal, all the inputs were and are cheap: energy was
as cheap as it gets; labour costs were less than half the world average; and high-
quality iron ore was available from Iscor’s own mines. Despite this, the privatised
Iscor was in trouble. It produced too many product types requiring high-cost short
production runs and its gross inefficiency resulted in a high proportion of defective
products. Government bailed it out with over R1.2 billion in subsidies between
1992 and 1996 on top of a 30% import tariff protection.11
From 1994, Iscor shut down 2.5 million tonnes of capacity, halved the number
of grades produced, slashed thousands of jobs and reorganised its marketing to
support exports at the cost of the domestic market. In 1996, government reduced
the tariff protection to 5% in order to cut costs to downstream manufacturers, and
car makers in particular, and so promote export-oriented manufacturing.
In 1995, Iscor and the IDC embarked on a joint project to build a new steel
mill at Saldanha Bay – the anchor project for government’s Spatial Development
Initiative (SDI) – designed to produce for export. It started producing in 1998 just
as the price of steel collapsed. Large steel surpluses came on to the market as the
result of the International Monetary Fund (IMF) induced ‘Asian crisis’ and new
production in China, South Korea and Brazil added to the surplus. The project
bled money. It accounted for 65% of the IDC’s portfolio and threatened its very
existence. In panic, the IDC came up with two strategies. First, it drove a process
of ‘unbundling’ Iscor by splitting off its iron-ore and coal-mining operations to
form Kumba Resources, which is now controlled by Anglo American. Iscor opposed
this move and then tried to saddle Kumba with its massive debts. It failed on both
counts. Kumba would, however, supply iron ore at cost plus 3% so the deal protected
Iscor’s low-cost supply. Next, IDC looked for an international investor to bail it
out. It found Lakshmi Mittal who was building his global empire by buying out
cheap, dirty and inefficient steelmakers hit by the price collapse. His atrocious
environmental record did not register as an issue with the IDC.
A fire sale doesn’t quite describe it. They paid Mittal to take it away. The
corporation built up its shareholding to take majority control in 2004. The unions

120
Toxic Futures
contested the takeover. Iscor had reduced its workforce from 44 000 in 1980 to
12 200 in 2004 and they anticipated that Mittal would cut more jobs. Investors, in
contrast, lauded the high profits managed by Mittal. Business journalist Ann Crotty
was unconvinced. Those on the ‘Iscor unemployment scrapheap’ would witness a
dividend pay-out that turned the previous Iscor managers into multimillionaires
and gave Mittal R3 billion – which would more than cover the cost of his buying
Iscor shares for R2 billion in 2001’.12 In the meantime, Mittal achieved his ambition
of building his family corporation into the biggest steel producer in the world
through a takeover of Arcelor, Europe’s largest steelmaker, in 2006.
ArcelorMittal leached money from the South African economy. Government
had facilitated the Iscor takeover on the understanding that the benefit of dirt-
cheap ore would be passed through to domestic steel users and so create a
competitive advantage to local manufacturing. It did not, however, bring in measures
to enforce this gentlemen’s agreement. Being the dominant producer, Mittal
instituted import-parity pricing, meaning that it loaded the price with the imaginary
costs of transport to South Africa, handling costs at the ports, the 5% import duty,
and transport inland. This added around 30% to the price of domestic steel and,
between 2002 and 2005, Mittal charged domestic customers over 60% more than
it charged for export steel (Roberts and Rustomjee 2009). Government has since
scrapped the import duty.
In effect, Mittal used the domestic market to subsidise its export market. At a
Competition Commission hearing instigated by Harmony Gold, it claimed that it
no longer used import parity but instead calculates the price on an international
basket of prices. This merely gives a new gloss to the local subsidy to exports. The
Department of Trade and Industry (DTI) calculates that ArcelorMittal’s 2009 prices
were in fact higher than import parity. It happens, however, that ArcelorMittal has
screwed up on the iron-ore deal in terms of which it gets the ore at about $30 a
tonne – a fifth of present spot-market prices. Kumba says that ArcelorMittal
neglected to update its rights and will now be charged the full market price.
ArcelorMittal says it will pass the price on if it loses the fight. Government says it
never passed the benefit on in the first place. Nevertheless, seeing the last chance
of cheap steel for the manufacturing industry disappearing, the DTI rushed to
broker a solution.13
Government’s interest in cheap steel is not matched by its concern over pollution.
Whether as Iscor or ArcelorMittal, the corporation has fought to avoid recognition
of and liability for its destruction of Steel Valley. It won. Repeating the strategy of
the Far West Rand mining houses, it bought out the nearly 600 smallholders in the
121
The toxic cradle of production
valley and fenced it in. The municipality is now considering locating a new landfill
in the valley, a sign that it is regarded as already sacrificed.
Iron and steelmaking takes place on a giant scale, consuming millions of tonnes
of raw materials and very large quantities of water and energy. It is widely regarded
as the most polluting industrial activity on earth. The raw materials – iron ore,
scrap metal and coal – contain substantial impurities that must be removed to
preserve the quality of the product and are discarded as gas through smokestacks,
in liquid form or as solid wastes. The Vanderbijlpark steel plant produces 2.2 million
tonnes of solid waste every year. One million tonnes of this is hazardous, containing
inorganic contaminants that leak into the groundwater: manganese, aluminium,
cadmium, calcium, chloride, fluorides, iron, sulphates, titanium and zinc. Various
organic substances,14 mainly derived from coal tars, pose an additional toxicity
threat. Most of these materials are found in the solid-waste dumps, the evaporation
dams and maturation ponds.
Impurities in iron ore include sulphur, manganese, and traces of heavy metal
including cadmium, lead, zinc and mercury. Scrap is predominantly contaminated
with tin, lead and copper and increasingly contaminated with plastics and paints.
Some scrap metal is radioactive as described in Box 4.1. Flux materials such as
limestone are used to act like ‘a kind of chemical sponge’ (Davis 2002: 10) to
capture and remove impurities and unwanted chemicals like sulphur from the
furnaces. Slag is used flux, and the scale on which it is produced is evident in the
mountainous slag-heap that looms over Steel Valley.
While impurities are removed, other metals are added to the iron-carbon mixture
to give the steel special properties. Nickel and tungsten add strength, chromium
increases the hardness, vanadium reduces the effects of metal fatigue, and lead
makes steel more pliable. Large amounts of chromium and nickel are added to
make stainless steel and zinc is used to coat or galvanize steel so it does not rust.
All these additives are toxic heavy metals that can and do escape from the
manufacturing process into the environment.
The coke ovens are particularly toxic. Coal is purposely starved of oxygen to
create coke, used in blast furnaces, and so produces carcinogenic polycyclic aromatic
hydrocarbons. Water used to quench the coke catches much of this but the rest
escapes as fumes and is particularly dangerous to workers. The gas created by
heating the coal is led off to the coke by-products plant where ammonia and a
range of volatile organic compounds (VOCs), notably benzene, xylene, toluene,
phenol and naphthalene, are recovered. During recovery, the gas is sprayed with
water to produce flushing liquor. ‘This represents a very difficult pollution control

122
Toxic Futures
problem,’ according to steel pollution expert Frank Kemmer, ‘since the liquor is
very high in ammonium chloride . . . and contains such other contaminants as
phenol, cyanide and thiocyanates’ (1971: 10–16). In addition, dioxins are formed in
coke-oven exhausts. Liquid and solid waste from the ovens includes highly toxic
tars containing phenols, cresols, naphthols, acridine and pyridine.
Iscor installed its first coke ovens and by-product plant at Vanderbijlpark in the
1950s. They have operated ever since but the difficulty of handling the waste has
largely been neglected. In 2004, an environmental impact assessment for Mittal
reported the annual waste from the plant’s coke ovens as 70 000 tonnes of crude
tar, 2 400 tonnes of tar sludge, 4 000 tonnes of ammonium sulphate and 180 000
tonnes of coke ‘breeze’ (fine dust).15
Traditionally, blast furnaces – which are huge steel stacks lined with refractory
brick – are used to smelt ore into liquid iron. A mixture of iron ore, coke and
limestone is dropped from the top of the stack and descends through blasts of hot
air to the bottom over a period of six to eight hours. Very high temperatures result.
At the end of the process, the liquid iron is tapped off through one hole while the
slag floats to the top and is tapped through another. While gas is caught and cleaned
by special pipes, some of it is vented to the air or burnt as waste. Emissions include
dioxins, sulphur dioxide, carbon dioxide, carbon monoxide and breathable iron-
dust particulates.
The Vanderbijlpark plant reportedly produced 28 700 tonnes of iron dust (or
particulates), 13 000 tonnes of gas-cleaning sludge, 600 000 tonnes of granulated
slag and 36 000 tonnes of blast-furnace slag from its two blast furnaces in 2004.
The iron dust and gas-cleaning sludge are recycled to the sinter plant and the slag
is used in the cement industry and for road construction. A sinter plant prepares
sinters – pellets of iron and coal dust – to feed into steelmaking furnaces.
Molten iron from the blast furnace, sinters and scrap metal are used as feed for
the steelmaking furnaces of which there are two kinds: Basic oxygen furnaces
(BOFs) and electric arc furnaces (EAFs). ArcelorMittal uses both at Vanderbijlpark.
In the BOFs, a lance is used to inject oxygen into the furnace at supersonic –
and ear-piercing – speeds. This drives impurities off the molten steel and raises
the temperature to melt the scrap metal added to the feed. Six-storey buildings are
needed so that the huge oxygen lances can be manoeuvred. Fluxing materials are
added to carry off impurities. Iron fumes, carbon dioxide and large amounts of
carbon monoxide are released when the furnaces are charged and tapped. Water is
used to scrub gases of dust and fumes.

123
The toxic cradle of production
In 2004, Vanderbijlpark’s BOFs produced solid waste consisting of 12 000
tonnes of iron dust, 45 000 tonnes of desulphurisation slag and 504 000 tonnes of
furnace slag, all of which was dumped. Other solid wastes – 36 000 tonnes of
mud, 8 000 tonnes of grit and 36 000 tonnes of furnace slag – were re-used internally.
In the EAF, an electric arc sprung between two giant electrodes provides most
of the energy to melt the scrap and iron feed. Oxygen lances are also used in this
process. EAFs produce low-carbon steels and ferroalloys used in the production
of ferromanganese, ferrovanadium and ferrochrome. As in the BOFs, fluxing
materials carry off impurities. EAFs ‘cause a rather high discharge of dust to the
atmosphere’ and wash water picks up very high levels of suspended solids (Kemmer
1971: 10).
In 2004, the EAFs produced 16 000 tonnes of dust that was dumped, and
100 000 tonnes of furnace slag that was reportedly re-used internally. The clouds
of red dust that are regularly seen rising through roofs at the plant are from this
unit.
The steel tapped from these furnaces is rolled or cast into intermediate and
final forms at the hot or cold-roll mills. In the rolling mills, water picks up oils and
lubricants. The steel forms are then ‘pickled’ – treated in acid baths with sulphuric
or hydrochloric acid – to remove rust from the surface. The waste – ‘spent pickle
liquor’ – is strongly acidic and contaminated with suspended scales. The steel forms
are then galvanized at high temperatures, releasing fumes and heavy metals.
Slag-heaps are the most visible solid waste from iron and steel plants. As slag
results from removing contaminants from the production process, these
contaminants are again leached or blown from the heap. The scale of slag production
allows other wastes to be covered up. In 2005, activists observed Mittal staff burying
what appeared to be bag-house waste in the slag-heap. The bags filter particulates
from the air exhaust. Altogether, a toxic brew of more than 100 chemicals is known
to be emitted by steel mills. Recent research in Canada has shown that this cocktail
not only affects all life forms around the mills, but goes down to the genetic level
with hereditary DNA damage reported around a plant in Hamilton Harbour.16 In
addition to local health impacts, sulphur and nitrogen emissions contribute
substantially to acid rain.
POWER TO ALUMINIUM
In 2001, the Australian corporation BHP merged with Billiton to create the world’s
largest diversified minerals corporation. Billiton was previously owned by Shell
who sold it to the South African group Gencor in 1994. The deal required a major

124
Toxic Futures
export of South African capital and Gencor sought and received an exemption
from the capital controls then in place from the minister of Finance. Billiton was
listed in London and it soon became evident that Gencor, the supposed parent,
was in fact of subordinate interest. In an internal deal, Billiton bought Gencor’s
base metals assets, including the Richards Bay aluminium smelters. The deal thus
preceded, and set a precedent for, the listings of other major South African
corporations on the world’s central stock exchanges in the late 1990s and early
2000s.
Gencor itself retained its own precious metals division but quickly unbundled,
morphing into a capital holding company and selling off its last assets, a 46%
holding in Impala Platinum, before closing its doors in 2003. The hollowing-out
and closure of Gencor seems to have been connected with a legal claim against it
by people suffering from asbestosis. The corporation bought Cape Plc’s asbestos
mines when the latter disinvested from South Africa in the early 1980s. Without
admitting liability, Gencor made a ‘full and final’ settlement of R380 million to the
Asbestos Relief Trust. It was then quickly liquidated, returning very substantial
‘shareholder value’ while terminating corporate responsibility for the ongoing ruin
of the environment and of thousands of people’s health. In the meantime, much
of Gencor’s top management had transferred to Billiton.
Billiton continued a major expansion of aluminium-smelting capacity in-
augurated by Gencor. The Hillside smelter at Richards Bay, complementing the
older Bayside smelter, was completed in 1996 and the Mozal smelter outside Maputo
in Mozambique followed shortly after with production starting in 2000. These
smelters linked with Billiton’s existing bauxite mines and refineries: the Worsley
mine and refinery in Australia and the mines in Suriname, in Latin America, which
supplies a refinery operated by Alcoa in which Billiton has a 45% interest. The
refineries produce alumina, a whitish powder, from the raw bauxite ore supplied
by the mines. The process uses chemicals and heat to separate alumina from the
toxic residue known as ‘red mud’. Worsley appears to produce about 12 million
tonnes a year of the stuff, although BHP Billiton (2006) is not exactly explicit on
this point.
The southern African smelters are the primary market for Worsley’s alumina –
although this ‘market’ is obviously internal to the corporation. All three smelters
were primary beneficiaries of state infrastructure investments. The original
construction of Bayside, in 1971, was integral to the apartheid state’s simultaneous
development of the deep-water port at Richards Bay. The project required close
collaboration of government departments, major state-owned corporations –
primarily the IDC, Eskom and Transnet – and private interests led by Anglo

125
The toxic cradle of production
American. These institutional relations were, if anything, strengthened in the post-
apartheid period and Billiton slipped into the seat already warmed by Gencor.
Hillside was seen as an anchor project for the SDI and Industrial Development
Zone intended to inaugurate another round of industrial modernisation at Richards
Bay, while Mozal anchored the Maputo Corridor SDI and was accompanied by the
development of a deep-water port at Maputo. Mozal also provided a vehicle for
practical collaboration between the corporations at the centre of the minerals-
energy complex (state and private) and the World Bank, so reinforcing local-global
institutional relationships as South Africa emerged from isolation.
In contrast to ArcelorMittal’s import-parity pricing, it appears that BHP Billiton
uses transfer pricing to boost its profits at the cost of the South African economy.
That is, it exports the aluminium to itself at below-market rates and gets an additional
tax benefit for doing so. Journalist Jan de Lange reports that it has therefore refused
to supply molten aluminium to downstream manufacturers in Richards Bay. Instead,
Box 4.2 Recycling red mud
The industry is busily looking for ways of getting rid of its mud – along with the
costs of storing it – by touting it as a resource. In Australia, during the 1990s,
Alcoa helped fund a Department of Agriculture experiment using red mud from
its refinery to stabilise phosphorus run-off. The department persuaded farmers to
participate in spreading it on their land, claiming that it would substantially
increase yields. Instead, the farmers say, their cattle started getting sick. Spread
at 20 tonnes a hectare, according to journalist Gerard Ryle, the red mud contained
‘up to 30 kilograms of radioactive thorium, six kilograms of chromium, more
than two kilograms of barium and up to one kilogram of uranium’ together with
‘24 kilograms of fluoride, more than half a kilogram each of the toxic heavy
metals arsenic, copper, zinc, and cobalt, as well as smaller amounts of lead,
cadmium and beryllium’. The department nevertheless insisted that this had
nothing to do with the cattle sickening and subsequently marketed the mud to
farmers in south-west Australia as a soil dressing. Alcoa agreed that the ‘product’
was safe but nevertheless demanded, and got, an indemnity for any environmental
damage.Source: Gerard Ryle, ‘The great red mud experiment that went radioactive’, Sydney MorningHerald, 7 May 2002.

126
Toxic Futures
they have to import solid bars and melt them. According to the manufacturers,
supplying molten aluminium would cut Billiton’s own electricity consumption by
924 MWh and save the manufacturers 2 640 MWh.17
Electric energy is the most significant input into aluminium smelting and, for
Billiton, cheap electricity from Eskom was the primary reason for locating both
Hillside and Mozal. Table 4.1 shows energy consumption for the three Billiton
plants equating to 10% of South Africa’s electricity supply and 3.6% of total final
energy demand. The balance of the smelters’ energy is derived from coking coal,
gas and liquid fuels. Mozal, of course, is not formally included in South African
energy demand or carbon emissions, but it is directly supplied by Eskom on similar
terms to Hillside and Bayside. In short, it would not be there if it was not bound to
South Africa’s energy economy. It consumes more electricity and emits more carbon
than the rest of Mozambique put together.18
The precise terms of the Special Pricing Agreement are secret but Billiton
undoubtedly gets the cheapest electricity in the world. The normal industrial rate,
at around 16 cents per kWh in 2007, was already the world’s cheapest and the
smelters are supplied below this price. It is known that the price of power is tied to
the world price of aluminium, so this is protecting Billiton from both currency and
commodity price fluctuations. In fact, much of the risk is transferred to Eskom,
which lost R9.5 billion on ‘embedded derivatives’ when both the rand and the
price of aluminium tanked in 2008/2009. Reports leaked in 2010 suggested that
Billiton paid 12 cents per kWh19 for power – about half Eskom’s cost of production.
During South Africa’s electricity crisis in 2008, Eskom demanded a 10% reduction
from the combined consumption of the three smelters and Billiton cut production
at Bayside.
The smelters’ high-energy consumption is largely responsible for the intensity
of greenhouse gas emissions (CO2e), contributing the equivalent of 5.7% to South
Africa’s emissions. This is supplemented by perfluorocarbons (PFCs), which are
extremely powerful and long-lasting greenhouse gases, emitted primarily during
upset conditions at the plants, according to BHP Billiton. Power outages or poor
management of the smelting process therefore increase emissions and it may be
estimated that 2008 was a very bad year for PFC emissions (BHP Billiton 2006).20
The table also shows an extraordinary intensity of sulphur dioxide emissions,
with Bayside’s emissions similar to that of Durban’s oil refineries, and Hillside and
Mozal emitting nearly three times as much. In the smelting process, alumina is
saturated with fluoride to give rise to the fluoride emissions. Fluoride is toxic to a
variety of plants even at very low concentrations and also accumulates in plants.

127
The toxic cradle of production
Exposure even to low emissions thus results in fluoride concentrations accumulating
over time and so entering the food chain from vegetables or grass grazed by cattle.
Aluminium is smelted in pots at very high heat. The pot-linings accumulate
carbon and must periodically be renewed. Spent pot-linings form the bulk of the
solid waste from smelting and the carbon is impregnated with alumina and fluoride
and laced with cyanide and arsenic. It is classified as a hazardous waste. Faced with
rising disposal costs, BHP Billiton entered a partnership with EnviroServ to reduce
costs and ‘increase the value of its waste streams into specific offset markets’ (BHP
Billiton 2006: 50). In other words, it was looking to sell waste with the aim, according
to EnviroServ, of ‘zero waste to landfill’ (2007: 24). EnviroServ now ‘recycles’ the
waste as an alternative fuel for steel and cement production and so saves ‘enormous
volumes of valuable landfill airspace’ (25). What does not go down into the landfill,
however, generally goes up into the air.
TOXICS TO CEMENT
The major cement corporations are AfriSam, Lafarge, Natal Portland Cement and
Pretoria Portland Cement (PPC). AfriSam is the newest kid on the block, taking
the place of transnational corporation Holcim. The latter dressed up disinvestment
from South Africa as an empowerment deal that was carried through with
R6 billion support from the state-owned Public Investment Corporation. These
four companies are the members of the Cement and Concrete Institute whose
Table 4.1 Aluminium smelters: production, energy, waste (2006).
Production Total final Electric CO2e SO
2Fluoride Waste
tonnes energy energy million tonnes tonnes tonnes(PJ) (PJ) tonnes
Mozal 550 000 37 27 9.4 11 945 249 22 230Hillside 700 000 47 45 11.6 11 161 354 48 272Bayside 180 000 14 10 4.1 4 021 357 43 000
Total 1 430 000 98 82 25 27 127 960 113 502
South 2 718 816 440
Africa1
Sources: BHP Billiton 2006; DME 2006.
1. The national figures are for 2004 due to the laggard production of energy statistics. In 2010, it wasconfirmed that Billiton consumed about 9.3% of electricity. Billiton’s consumption would have beenfairly constant since its last expansion, so earlier figures would give it a higher share of nationalconsumption.

128
Toxic Futures
objective is ‘to increase the market share’ of concrete in construction. At present,
residential and commercial construction has contracted sharply and the market is
being sustained by the state’s infrastructure programme, starting with the 2010
stadiums and with massive demand from Eskom and Transnet’s expansion
programmes to follow.
The raw materials of cement production are limestone and silica and alumina
from clay. They are ground to a fine powder and then fed through the kiln, where
temperatures reach 1 400 to 1 500 ºC, to produce ‘clinker’. Kilns are traditionally
fired by coal and the bottom ash is incorporated in the clinker. The clinker is then
cooled and ground with various additives to the fine powder that is cement. The
process is very energy-intensive and the use of coal puts cement in the same bracket
as the energy sector in terms of its contribution to climate change.
Internationally, the Cement Sustainability Initiative is putting a green spin on
production but, as Jane Harley comments in a report for groundWork, it ‘has put
out a great many documents, all of which avoid the central truth – that cement can
never be sustainably produced’. Rather, the industry has focused on ‘the use of . . .
“alternative fuels”, which translates to the use of waste as a fuel’ (2006: 2). While
the environmental benefits of these fuels are dubious, the economic benefits to
the cement industry are evident. From 2003 to 2008, coal prices went up from
around $20 to over $160 a tonne. PPC said that international demand was limiting
‘the availability of the appropriate coal quality for cement manufacture’ while
‘spiralling’ international prices were pushing up costs (PPC 2007: 24).
The industry describes burning waste as ‘co-processing’ or ‘energy recycling’.
PPC goes so far as to suggest that co-processing replaces ‘fossil fuel with renewable
sources’ (50). Apart from twisting the notion of ‘renewable’ beyond recognition,
the statement implies that waste will indeed be eternally renewed. The industry
favours waste with a high-calorific content, much of which consists of hazardous
petro-chemical wastes derived from fossil fuels. Wastes used internationally include
solvents, old tyres and oil, paint and dried sewage sludge. The use of spent pot-
linings from aluminium smelters has an added advantage as the alumina substitutes
for alumina in the raw material fed into the kiln.
Pot-linings and dried sewage sludge are already used in some plants in South
Africa with the approval of the Department of Environmental Affairs and Tourism
(DEAT). It is possible that other wastes have been used without approval. Used
tyres, however, would require modification of the kilns and the industry is, somewhat
impatiently, ‘waiting for the relevant legislation to be enacted’, as PPC puts it

129
The toxic cradle of production
(2007: 50). Harley notes estimates that South Africa’s used tyres could replace
about 25% of the 1.2 million tonnes of coal used in kilns. The industry anticipates
something better than cheap fuel. It anticipates receiving a tipping fee for disposing
of tyres and has also lobbied government for an ‘establishment subsidy’ against
the costs of modifying the kilns. A draft memorandum of agreement between
DEAT and waste-tyre handlers, negotiated in 2006, looked like a very good deal
for both the waste and cement industries with costs paid by the public in taxes and
in the price of tyres.21 The DEAT subsequently withdrew from the agreement
without public explanation.
Meanwhile, the DEAT’s proposed waste-tyre regulations, published for
comment in April 2008, give priority to re-use or recycling over energy recovery,
and of energy recovery over disposal. Incineration with energy recovery is thus
lifted above disposal in the waste hierarchy. The regulations do not seriously address
minimisation but they do impose ‘extended producer responsibility’ on tyre
producers who must prepare integrated waste-management plans. The regulations,
brought out one month after the final hearings on the Waste Bill, were published in
terms of the Environmental Conservation Act but clearly anticipated the Waste
Bill’s enactment. It is less clear how ‘recovery of energy’ relates to a clause in the
Waste Act requiring that any regulation pertaining to incineration be submitted to
parliament or whether, in fact, early publication was designed to pre-empt that
requirement. Assuming, however, that the parliamentary hurdle is either crossed
or bypassed and the cement industry invests in the modification of kilns, it can be
anticipated that they will provide the easiest disposal option.
Kilns fired by coal are dirty operations. Kilns fired by used tyres are even
dirtier. A study cited by Harley compares the two.22 It shows that tyre-burning
emissions of hydrocarbons are lower but particulates and most gas emissions are
higher while emissions of most metals are two or more times higher. Tyres, however,
will not replace coal but will be burnt with coal and whatever other wastes are
allowed to be added to the mix. Emissions from the combination of fuels are likely
to be dirtier than the sum of emissions from each because more chemicals will be
available to create more toxic compounds. Spent pot-linings, for example, would
add a heavy charge of fluoride.
Waste burnt in kilns produces similar emissions to waste burnt in incinerators
– sulphur dioxide, hydrogen chloride, nitric oxide, particulates and dioxins formed
in the exhaust. Thompson and Anthony note that cement kiln technology has not
changed much since the early 1900s and is not well adapted to ‘toxic waste
destruction’. Moreover, even in the European context, they are less rigorously

130
Toxic Futures
regulated than incinerators: they are allowed to emit more and ‘have poorer
abatement equipment’ (2005: 35). In South Africa, cement kilns have operated
without any scrutiny from the authorities, even after permission was given to burn
spent pot-linings at some kilns. This changed shortly after the confrontation over
incineration at the parliamentary hearings on the Waste Bill. In May 2008, the
DEAT announced that the Green Scorpions would do a ‘blitz’ on cement kilns,
heralding the start of a ‘clean cement’ campaign. It said the cement industry was
growing rapidly and might ‘contribute significantly to pollution if not mitigated
and managed properly’.23 This is laudable. The suspicion remains, however, that
the real intention is to head off opposition to waste incineration in cement kilns
when the relevant regulations are put to parliament. In the meantime, inspection
reports have yet to be made public and it is unlikely that they will reflect normal
operating. The industry was given notice of the blitz and will have been on its best
behaviour. High standards – for example, ensuring complete combustion – costs
money. It is doubted that they are maintained outside of inspection in Europe and
it seems unlikely that the local industry will be more assiduous.
Toxics generated in the kiln, including dioxins and heavy metals, have three
places to go: into the air, to the dump or into the product. The kilns do not produce
substantial solid-waste volumes. This is because the ash from the furnace binds
with the limestone and other material inputs to form the clinker. Thus, the toxic
residue in the ash is incorporated into the product. Where filters are used to reduce
emissions of particulates (known as cement kiln dust), the captured waste is either
sent to landfills or recycled through the kiln. The latter practice leads to a
concentration of heavy metals that is ultimately incorporated into the clinker.
Further, ‘extenders’ are added when the clinker is milled. During 2006, PPC increased
its use of fly ash and limestone as extenders ‘to conserve non-renewable resources’
and reduce the proportion of clinker in its cement products (PPC 2006: 32). This
would also reduce costs and bulk up the product to meet expanded demand. PPC
does not say whether the fly ash comes from its own plant or other industries nor
does it mention whether it is tested for toxic contaminants. From whatever source,
however, fly ash is particulate emission and almost certainly toxic. Toxics in the
clinker are thus supplemented by those in the extenders and incorporated into the
product. Cement and construction workers would be most immediately exposed
to any such contamination but it remains in the built environment and will be
released during renovation or demolition.

131
The toxic cradle of production
LEAVING RUIN
Industrialisation massively increased the volume of resource consumption and
waste. While peasants consume up to 5 tonnes of raw material per person per year,
urban Europeans now use between 40 and 70 tonnes, according to Wolfgang Sachs.
Most of this is for ‘installations run by organizations at various levels of the system:
high-rise buildings, steel plants, supermarkets, swimming baths, airports, armoured
vehicles and so on’ (Sachs and Santorius 2007: 36). ‘Per person’ is thus a little mis-
leading. The institutions of capital and state consume more than ‘consumers’. It is
not just the goods on the shelf, but the shelf itself, the shopping mall, the city that
sustains the mall, the machinery of manufacture and the infrastructure of energy
and transport and, finally, the extravagance of arms.
It is not incidental that the financial crisis was connected to the contemporary
process of urbanisation through the so called ‘sub-prime’ mortgage defaults, argues
David Harvey (2008). Historically, grandiose urban development has repeatedly
been used to absorb surplus capital when over-accumulation threatens profits. Over
the last decade or so, this process has gone global reflecting the globalisation of
finance capital. The urbanisation of China dwarfed everything else, but property
markets boomed across the world accompanied by frenzied demolition and
construction. From the towers of Dubai to the golf estates of the Western Cape,
it has been marked by competitive conspicuous consumption. And, as noted in
Chapter 2, this investment has been focused in enclaves to the exclusion of the
poor who are driven to the urban peripheries to make way for the high value
investments of ‘world-class’ cities.
The competition in conspicuous consumption finds direct expression in the
ritualised auctioning-out of spectacularly commercialised sports festivals. Each
Olympics or football World Cup competes with the last for extravagance as corporate
sponsors demand yet bigger bangs for their advertising bucks.24 When South Africa
won the bid for 2010, the major cities started competing with each other for national
funding of ‘iconic’ stadiums and transport infrastructure projects, running up debts
that will settle on citizens into the future. As organisations of the poor noted, the
resources mobilised for the event contrasted starkly with the repeated assertions
that the state lacks capacity for ‘delivery’ to the poor.25
The industrial policy objective of expanding manufacturing production to create
jobs scarcely floated even on the high tide of the boom. As Northern demand
shrank following the financial meltdown, China maintained high economic growth
through a massive infusion of cash into its economy and replaced the US as the
largest consumer of South African exports. Primary minerals commodities –

132
Toxic Futures
platinum, iron ore and coal, along with ferroalloys, aluminium metal and rolled
steel – accounted for three-quarters of all exports in the first half of 2010.26 South
Africa’s place at the bottom of the industrial value chain, and the continued
dominance of the minerals-energy complex, was thus confirmed. The economic
benefits are largely taken by the corporations whose global expansion has both
reduced their dependence on and increased their power over the local economy.
The environmental ruin is left to the people.

133
Peak poison
5
Peak poison
THE WORLD WE LIVE IN is profoundly shaped by the abundance of oil. This
was not an entirely spontaneous process. Outside of war, the problem for big
oil during most of the twentieth century was that there was too much of it and oil
prices and profits were constantly threatened with collapse. Big oil developed two
main strategies for managing the glut: restricting supply and expanding demand.
First, the big corporations established control over supplies through monopolies
or cartels. Thus, the ‘seven sisters’1 used Middle Eastern countries as swing producers
– opening or closing the taps to balance supply and demand – and so subordinated
national to corporate interests. Their imperial manners provoked the rise of ‘resource
nationalism’ and the formation of OPEC. In the last resort, they provoked war.
‘When profits fell to what the industry called a “danger zone” ’, according to Retort,
‘oil men turned hawkish. Each descent into the “danger zone” preceded an energy
conflict, and was in turn followed by a dramatic reversal of economic fortune’
(2005: 70).
War has also been significant in expanding demand. During both world wars,
production was ramped up to meet military demand. Following the wars, car makers
and big oil combined to expand the civilian market. In the US, they bought out and
dismantled tram companies and lobbied for a massive expansion of paved roads
and promoted the industrialisation of agriculture everywhere. In the 1990s, they
secured the exemption of sport utility vehicles (SUVs) from fuel-economy standards
applied to other family cars and, in Johannesburg as in New York, aggressive
marketing and the marketing of aggression made these gas guzzlers the elite
suburban vehicle of choice. More broadly, transport as a whole received massive
support from the neo-liberal enforcement of open markets and export-led
development. While the World Bank secured cut-rate commodities for the global
market from the global South, the global restructuring of production fuelled a

134
Toxic Futures
massive increase in trade, most of it internal to transnational corporations,
accompanied by a boom in tourism. Sea and air transport grew exponentially while
‘just-in-time’ delivery systems created ‘warehouses on wheels’ to reduce storage
costs. Significantly, air and sea transport are excluded from national carbon accounts.
Europe could thus commit to a 20% carbon reduction by 2020 while signing an
‘open skies’ agreement with the US designed to increase transatlantic flights by
50% in the next five years.2
The age of plenty is now over. The basic assumptions of energy policy over
the last century are no longer valid and, while unable to let go of these assumptions,
the energy elites are nervous. The International Energy Agency’s (IEA) World Energy
Outlook (WEO) 2006 responded to a mandate from the imperial club of G8 countries
to ‘map a new energy future’. The stated concerns were energy security and climate
change. The WEO argued that the responses to these concerns are mutually
reinforcing: energy efficiency and diversification of energy sources. Its
representation, however, showed them to be deeply contradictory, at least in the
context of never-ending accumulation required by capitalism. Its central message
was that the world must invest $20 trillion between 2006 and 2030: $11 trillion in
electricity generation, transmission and distribution; $4.3 trillion in oil, mostly
upstream; $3.9 trillion in gas; and $560 billion in coal. According to Claude Mandil,
‘The energy future . . . is doomed to failure [because of] underinvestment in basic
energy infrastructure . . . In short, we are on course for an energy system that will
evolve from crisis to crisis’ (quoted in Hirsch 2007). This chapter shows the growing
disconnect between reality and policies founded on energy expansion and the
growing intensity of pollution consequent on those policies. It starts with an
overview of the energy future projected by the IEA and its response to the challenge
of climate change. Box 5.1 shows why this response does not meet the challenge.
It then looks at each of the sources of energy and shows why peak oil is accompanied
by peak pollution.
FAILING FUTURE
The WEO of 2006 develops two energy future scenarios for the period to 2030.
The ‘reference scenario’ is based on national policies that have been adopted in
both developed and developing countries and it assumes that they will be fully
implemented. The ‘alternative policy scenario’ takes account of additional policies
aimed at enhancing energy security and/or addressing climate change. These are
policies that were being considered in each country and which, in the IEA’s view,
they ‘might reasonably be expected’ to adopt (IEA 2006: 54).

135
Peak poison
The WEO of 2008 takes a slightly different line. The reference scenario is
developed in the same way but, instead of the alternatives scenario, it looks at the
implications for the energy system of stabilising the concentration of greenhouse
gases in the atmosphere at 550 parts per million (ppm) and at 450 ppm of CO2e.
These are the targets most commonly discussed in the international climate
negotiations. Following the Intergovernmental Panel on Climate Change (IPCC),
the WEO of 2008 assumes that stabilisation at 550 will result in global temperatures
rising by 3 ºC. Stabilisation at 450 ppm is held to give a 50% chance of restricting
global warming to 2 ºC. These two scenarios are based on a ‘hybrid’ set of policies
that the IEA believed negotiators might possibly adopt for the post-2012 climate
regime: cap and trade for Northern countries with compulsory reduction targets;
national policies and measures for Southern countries without compulsory reduction
targets; and international sectoral agreements covering major industries such as
iron and steel and cement making.
Table 5.1 shows global energy consumption and carbon dioxide emissions for
each scenario from WEO 2006 and 2008. This excludes emissions from industrial
processes and land-use change as well as other greenhouse gases. Total CO2
emissions in 2005 were 36 billion tonnes (Gt) and total greenhouse gas emissions
were equivalent to 44 Gt of CO2 (CO
2e).
Both 2006 scenarios project massive increases in energy consumption and
carbon emissions although demand rises less steeply in the alternative case as a
Table 5.1 Annual global energy consumption and CO2 emissions (billion tonnes).
2004 2006 2015 2020 2030(actual) (actual)
toe CO2
toe CO2
toe CO2
toe CO2
toe CO2
WEO 2006
Reference 11.2 26 14.1 33 – – 17.1 40Alternative 13.5 32 – – 15.4 34
WEO 2008
Reference 11.7 28 14.1 33 – – 17.0 41550 scenario 14.4 32 15.5 33450 scenario 14.3 32 14.4 26
Adapted from IEA 2006 and 2008.
Energy consumption in tonnes of oil equivalent (toe). The 11.7 billion tonnes consumed in 2006 is theequivalent of around 234 million barrels of oil a day.

136
Toxic Futures
result of increased energy efficiency. Assuming immediate implementation of the
alternative policies, total emissions from 2005 to 2030 would be 8% less (820 Gt)
compared with the reference case (890 Gt).3 If alternative policies are implemented
only in 2015, cumulative emissions for the whole period are only 2% less than in
the reference case. Implementation would also be considerably more costly.
The table shows that actual energy consumption rose by 500 million tonnes of
oil equivalent (toe) from 2004 to 2006. That is equivalent to over ten million barrels
of oil a day. For the period to 2030, the 2006 and 2008 reference scenarios are
almost identical. The implication is that the alternative policies being considered in
2006 have not in fact been adopted. The 2006 alternatives scenario and the 2008
550 scenario appear very similar. In the latter, however, emissions level off only in
2025.
Fossil fuels remain dominant in all scenarios. At present they account for 80%
of total energy consumption and, in the reference scenarios, they retain this share
of consumption through to 2030. The 2008 figures, however, assume higher oil
prices and reduced oil demand compared with the 2006 figures. Higher coal
consumption compensates for the difference. In the 550 and 450 scenarios, the
fossil-fuel share decreases to 74% and 66% respectively. Consumption of fossil
fuels still grows overall but coal’s share is reduced and, in the 450 scenario, less coal
is consumed in 2030 than in 2006. In the WEO’s analysis, this is largely the result
of high carbon prices at $90 a tonne in the 550 and $180 in the 450 scenario.
Supposedly ‘non-carbon’ energies grow at a faster rate and carbon capture and
storage is developed on a massive scale. Table 5.2 shows global energy sources for
the WEO 2008 scenarios.
In the 450 scenario, energy emissions peak around 2020 and are then reduced
to the 2004 level of 26 Gt by 2030.4 This results in ‘greenhouse gas concentration[s]
initially rising above 450 CO2e, but then declining’. The WEO argues that ‘overshoot’
is necessary because avoiding it would require substantially lower emissions before
2020 and ‘this could be done only by scrapping very substantial amounts of existing
capital across all energy-related industries’. Further, ‘it is unlikely that the necessary
new equipment and infrastructure could be built and deployed quickly enough to
meet demand’ (IEA 2008: 414). In fact, the 450 target is already overshot and, as
the WEO 2006 recognised, peaking later and higher adds massively to cumulative
emissions over time as well as to the costs of subsequent reductions.
While writing off investments in wells, pipelines and generators poses a barrier
to early reductions, ‘meeting demand’ acts as an absolute imperative. All energy
planning starts from the assumption of future demand growth and then organises
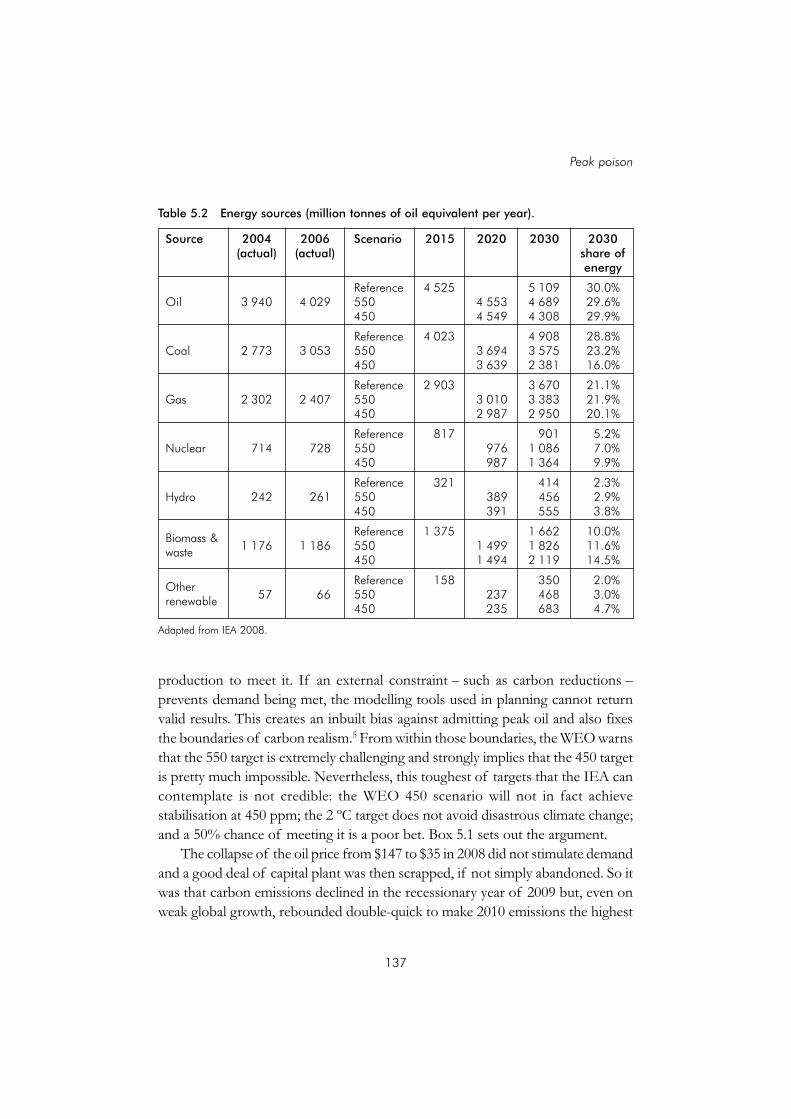
137
Peak poison
production to meet it. If an external constraint – such as carbon reductions –
prevents demand being met, the modelling tools used in planning cannot return
valid results. This creates an inbuilt bias against admitting peak oil and also fixes
the boundaries of carbon realism.5 From within those boundaries, the WEO warns
that the 550 target is extremely challenging and strongly implies that the 450 target
is pretty much impossible. Nevertheless, this toughest of targets that the IEA can
contemplate is not credible: the WEO 450 scenario will not in fact achieve
stabilisation at 450 ppm; the 2 ºC target does not avoid disastrous climate change;
and a 50% chance of meeting it is a poor bet. Box 5.1 sets out the argument.
The collapse of the oil price from $147 to $35 in 2008 did not stimulate demand
and a good deal of capital plant was then scrapped, if not simply abandoned. So it
was that carbon emissions declined in the recessionary year of 2009 but, even on
weak global growth, rebounded double-quick to make 2010 emissions the highest
Table 5.2 Energy sources (million tonnes of oil equivalent per year).
Source 2004 2006 Scenario 2015 2020 2030 2030(actual) (actual) share of
energy
Reference 4 525 5 109 30.0%Oil 3 940 4 029 550 4 553 4 689 29.6%
450 4 549 4 308 29.9%
Reference 4 023 4 908 28.8%Coal 2 773 3 053 550 3 694 3 575 23.2%
450 3 639 2 381 16.0%
Reference 2 903 3 670 21.1%Gas 2 302 2 407 550 3 010 3 383 21.9%
450 2 987 2 950 20.1%
Reference 817 901 5.2%Nuclear 714 728 550 976 1 086 7.0%
450 987 1 364 9.9%
Reference 321 414 2.3%Hydro 242 261 550 389 456 2.9%
450 391 555 3.8%
Biomass &Reference 1 375 1 662 10.0%
waste1 176 1 186 550 1 499 1 826 11.6%
450 1 494 2 119 14.5%
OtherReference 158 350 2.0%
renewable57 66 550 237 468 3.0%
450 235 683 4.7%
Adapted from IEA 2008.

138
Toxic Futures
yet.6 Meanwhile, the trillion-dollar bailouts have not lifted the economy off the
rocks and, each time the markets see ‘green shoots’ in their economic desert, the
price of oil jumps.
Box 5.1 Required CO2e emissions reduction
The international consensus now defines 2 ºC above pre-industrial temperatures
as ‘dangerous’. The 450 target follows from the conclusion of the IPCC’s Fourth
Assessment Report (AR4) that stabilisation in the range of 450–490 ppm CO2e
yields an average temperature increase in the range of 2–2.4 ºC. However, this
finding excludes consideration of natural feedback loops induced by global
warming described in Chapter 1. These feedbacks are now being observed well
ahead of the predicted dates making temperature rises of ‘5 or 6 ºC or higher
. . . plausible’ (Stern 2006: 59).
Taking account of all greenhouse gases, the 2006 Stern Report said the
concentrations in the atmosphere were then equivalent to 430 ppm of carbon
dioxide (CO2 equivalent or CO
2e) and rising at the rate of 2.3 ppm a year
(2006: 3). This figure was in fact already dated. The IPCC’s AR4, published in
2007, put the 2005 concentration at 455 ppm.7 If, said Stern, the concentration
was stabilised at 430 – in other words, carbon emissions were almost shut off –
‘there is up to a one-in-five chance that the world would experience a warming
in excess of 3 ºC above pre-industrial [levels]’ (9).
Stern underestimated the growth in emissions since 2000 on the assumption
that energy and carbon intensity relative to GDP was declining as it had done
throughout the twentieth century. This trend was reversed around 2000 and the
pace of carbon dioxide emissions accelerated dramatically, growing faster than
predicted in ‘the most fossil-fuel intensive of the Intergovernmental Panel on
Climate Change emissions scenarios developed in the late 1990s’ (Raupach et
al. 2007: 1). On the basis of actual emissions from 2000 to 2008 and taking
account of climate induced feedbacks, Anderson and Bows (2008) show that
stabilisation at 450 CO2e will be physically impossible unless emissions peak by
2015 and global energy and industrial process CO2 emissions are then reduced
by 6 to 8% a year.8 A 2020 peak could not result in stabilisation at less than 550
ppm and then only if followed by annual reductions of 9%. In contrast, the
reductions proposed by the WEO 2008 450 scenario come in at just over 2%.9
139
Peak poison
The reasoning behind this is that cumulative emissions are more critical than
final emission targets. Because CO2 stays in the atmosphere for centuries, the
total quantity pumped into the atmosphere over time determines the concentration
in the atmosphere. Thus, a total emission ‘budget’ can be calculated relative to
target concentrations. Peaking later and higher consumes much more of the
budget – as WEO 2006 recognised – and so requires impossibly steep reductions
following peak. Subsequent research suggests that, assuming a 2 ºC target, one
third of the budget for the period 2000 to 2050 was already used up by 2009.10
Anderson and Bows note that the economic collapse of the Soviet Union
resulted in a reduction of emissions of around 5% a year. They conclude that ‘it
is difficult to envisage anything other than a planned economic recession being
compatible with stabilisation at below 650 ppm CO2e’ (2008: 18). This implies
‘an unprecedented step change in the global economic model’ (15). In other
words, it implies ditching capitalism.
As the AR4 was being published, new research indicated that warming of
1 ºC already constitutes a ‘ “dangerous” level of warming’ (Levin and Pershing
2007: 3). Indeed, millions of people around the world, and particularly in Africa,
are already faced with dangerous consequences of climate change. In testimony
to the US Congress in June 2008, climate scientist James Hansen warned that
“the oft-stated goal to keep global warming less than 2 ºC is a recipe for global
disaster, not salvation”.
This conclusion was based on a paper by Hansen et al. (2008) which argues
that a safe target for stabilising CO2 (not e) concentration is ‘no more than 350
ppm’11 and may be less than that. The world had long since overshot the mark
but disaster might be averted if the CO2 concentration peaks at around 400
ppm and is then rapidly reduced. Taking account of peak oil, they argue that this
is possible ‘if difficult to extract oil and gas is left in the ground’, coal is not used
to substitute for declining oil and all coal use is phased out by 2030 unless the
carbon emissions can be safely sequestered, and forest and soil sinks are restored
through reforestation and changed agricultural practices. This should return ‘CO2
below 350 ppm late this century, after about 100 years above that level’ (13,
14).
Even this is optimistic for two reasons. First, new research shows that the long-
term carbon budget for the next 500 years only accommodates the use of two thirds
of existing fossil-fuel reserves. In other words, all exploration should stop now –

140
Toxic Futures
there is already more than enough in the project pipeline to burn the world.12
Second, Solomon et al. (2009) show that temperatures will not retreat along with
CO2 concentrations because of the build-up of heat in the oceans. If the
temperature stops rising at the disastrous 2 ºC, then that is pretty much the
temperature the world is stuck with for the next thousand years. In short, scenarios
in which temperature targets are ‘overshot’ and followed by cooling are no
longer credible. This does not mean that reducing carbon concentrations is
made irrelevant. To the contrary, the temperature stabilises because reduced
heating from lower CO2 concentrations is balanced by ‘reduced cooling through
heat loss to the oceans’ (1705).
The implications of this research are shown in Figure 5.1. A 2011 peak
followed by a relatively modest decline in emissions yields an 85% reduction by
2050 to keep within the carbon budget. Later peaking results in a negative
carbon budget. This assumes the disastrous 2 ºC target. A target of 1.5 ºC,
demanded by small-island states that face drowning, would require earlier peaks
and steeper declines. This is not a safe target. Given the lag between emissions
and temperature rise, it is probably the best that can be hoped for.
Figure 5.1 Global emissions pathways, 2010–50.
Source: German Advisory Council on Global Change (2009).

141
Peak poison
Meeting oil demand – or not
From 2000, annual demand grew by about two million barrels a day (mb/d) until
high prices constricted the increase to around one million in 2005 and 2006. In
these two years, demand for fuel for transport kept growing but many applications
using oil, such as electricity generation and heating, switched to coal or gas. By
2007, most of the options for switching were used up while transport demand was
increasing. Despite higher prices, overall consumption rose by 1.3 mb/d to 86.5 –
over 31.5 billion barrels a year – according to the IEA. Production scarcely rose,
however, coming in at 85.7 mb/d. The difference appears to have been made up
with biofuels. The 2008 demand averaged at 86.2 but shrank fast from a high of
87.5 at the beginning of that year to 84 mb/d in mid-2009. The IEA forecasts
demand at 86.9 for 2010 and over 88 mb/d for 2011.13
Production must not only meet demand but also compensate for declining
production from existing oilfields. The WEO 2008 study showed far steeper decline
rates than previously assumed and concluded that 19 mb/d of existing production
would have to be replaced by 2015 and 43 mb/d would have to be replaced by
2030 just to maintain production at 2008 levels. New IEA boss Nobuo Tanaka
pointed out the implications: adding in growth in demand, ‘between now and 2030,
we will need 64 mb/d of new oil production capacity, six times the size of Saudi
Arabia’s capacity today’ (IEA 2008: 3).
Nevertheless, WEO 2008 asserted that new production could meet the reference
scenario demand of 106 mb/d (38 billion barrels a year [bb/y]) in 2030. In contrast,
Campbell put production in 2030 at 56 mb/d, down from his 2007 projection of
65 mb/d,14 while the Energy Watch Group (Zittel and Schindler 2007) saw 2030
production falling even lower to just 39 mb/d. In claiming that the demand can be
met, the WEO makes three assumptions: technology investments will extract
more oil from existing wells; sufficient new oil will be discovered; production of
‘unconventional oil’ will increase substantially.
Technology investments
Most oilfields yield only about 35% of the oil that is actually in the ground. A raft
of new technologies for ‘enhanced oil recovery’ was developed in the US once its
mainland production passed peak. These technologies get more oil out of old
fields. In newer fields, the technology is built in or planned from the start. The
potential of enhanced recovery is already accounted for and so does not add to
reserves unless yet newer technologies are developed and applied. The WEO 2008
suggests that yet-to-be-developed technologies could increase yields from 35 to
50% and so ‘boost world reserves by 1.2 trillion barrels – equal to the whole of

142
Toxic Futures
today’s proven reserves’ (IEA 2008: 212). This is somewhat fanciful and at odds
with the findings from the study of oilfields, which shows that technology
investments to date have slowed the decline rate by less than a third.
Enhanced recovery is also designed to increase production rates. The result is
that the newer fields have a shorter life while the final decline in all fields is much
more rapid. Indeed, the attempt to maintain or increase production from old
declining fields risks collapsing production altogether, leaving ‘trapped oil’ in the
ground. In April 2006, the Saudis admitted having difficulty keeping up with demand
and made an unprecedented call for energy conservation, particularly in the US.
One official observed: ‘When you have this kind of demand, you’re forced to
supply beyond the optimal rate’.15
Leggett concludes: ‘Enhanced recovery made precious little difference to the
inexorable decline of US oil production, and it will be no different globally’ (2005:
68). Rather, it will sharpen the crisis of depletion when it hits because the rapidity
of decline will leave little time to develop alternatives.
New oil discoveries
The WEOs assume that there are still very large fields to be discovered, particularly
in the Middle East and North Africa. However, the main evidence it gives for this
is that Western oil corporations have not been free to explore these areas since the
1970s. This echoes the argument, led by ExxonMobil and the US, that there is
plenty of oil to be discovered but it is locked in by ‘resource nationalism’ and the
inefficiency of state corporations. As with OPEC reserves, it is a story designed
for political ends – to create pressure in support of big oil’s bid to regain effective
control of the world’s largest reserves, irrespective of whether there is more oil to
be found, while leaving OPEC with the blame for any shortfall. War and sanctions
have left Iraq with the largest untapped reserves of ‘easy oil’ and, following deals
signed in January 2010, the supermajors have taken control of them.16
The scale of discovery has long since diminished. The biggest discoveries were
made in the 1950s and 1960s. Since then, many more wells have been found but,
despite increasingly sophisticated exploration technologies, there has been a
consistent downward trend in the amount of new oil discovered. The last time
discovery matched production was in the early 1980s and the gap has been widening
since. Moreover, new discoveries are smaller in size, contain lower-quality oil and
are more often located in extreme environments than the earlier fields. Thus, Chad’s
oil, brought on stream in 2004, still makes it into the category of ‘easy oil’ but is of
such low quality that only two or three refineries in the world can process it.17 The
implication is higher costs and dirtier production at both wells and refineries while

143
Peak poison
the energy return on energy invested (EROEI) is lowered all along the production
line. According to Heinberg, imported oil in the US had an EROEI of 8.4 in 1996
compared with 30 in the 1970s and 100 for US-produced oil before 1950 (2005:
138).
Several offshore finds in very deep water have been announced to much fanfare
in recent years. In April 2010, BP’s Deepwater Horizon drill rig was blown out of
the water by the force of oil and gas released under enormous pressure from the
great depth of the well. The rig sank with the loss of eleven lives and, over the next
five months, some 4.9 million barrels of oil gushed into the Gulf of Mexico from
the well-head 1.5 kilometres below the surface. Efforts to cap the well failed because
of the difficulty of working at such depth and it was finally ‘killed’ only after a
relief well was drilled. The blowout occurred just weeks after the US administration
said it would lift a moratorium on offshore exploration. The announcement ‘reflected
the widely-held belief that offshore oil operations, once perceived as dirty and
dangerous, were now so safe and technologically advanced that the risks of a major
disaster were infinitesimal’.18 That view was propounded by the oil industry to
secure lax regulation from the US state, enabling BP and its contracted service
companies – Halliburton and Transocean – to cut costs on the blowout prevention
system. But the issue is not just about regulation. Big oil is pushing for rights to
explore ever deeper and in ever more remote and extreme environments including
the Arctic.
Unconventional oil
The WEO 2008 sees production from unconventional oil growing from 2 to 8%
of global production in 2030. This in itself is an indication of the peaking of
regular oil and of the poor state of reserves under control of Western oil
corporations. In contrast, the 1970s oil shock resulted in interest in unconventional
resources, but very little production.
The oil deposits in Canada’s tar-sands and Venezuela’s extra-heavy oils are truly
enormous. The problem is getting it out. Canada’s tar-sands have seen huge
investments since 2002 to produce 1.2 mb/d in 2007. Only 60% of this is a low-
quality ‘syncrude’, the rest being bitumen. The WEO 2008 sees this rising to
5.9 mb/d in 2030, a million barrels more than the 2006 forecast. In David Strahan’s
view, this was always unlikely but necessary to balance the IEA’s projected demand.19
New tar-sands projects need $85 a barrel to get a return and, with the price in free-
fall, expansions totalling 1.7 mb/d were deferred or cancelled in 2009.
To date, most of the extraction has been done by opencast mining of tar-
sands, creating pits some 80 metres deep and 7 kilometres wide, which is then

144
Toxic Futures
‘washed’ to separate the oil. Getting to the deeper reserves requires the injection
of super-heated steam to make the tar more liquid, separate it from the sand and
then pump it up. Both processes are very energy-intensive, yielding an EROEI as
low as 1.5 in Heinberg’s calculation (2005: 128).
The energy used for the process comes from Canada’s rapidly declining gas
reserves which are thus diverted from the future supply to heat houses and fuel
electric generators. The Canadian Centre for Policy Alternatives (CCPA) notes that
households in Alberta, where the tar-sands are located, are already turning to dirtier
coal for heating. In principle, the natural gas can be replaced by gasification of the
tar-sands themselves, but this further reduces the EROEI, is more expensive and
more polluting. Substituting coal or nuclear power for gas is also being considered,
according to Hirsch, Bezdek and Wendling (2005), but will similarly increase the
energy costs.
As it is, the pollution is intense. Carbon emissions of around 125 million tonnes
have broken Canada’s Kyoto commitments and are accompanied by severe sulphur
emissions. Energy intensity is matched by the intensity of water use and waste.
The water is drawn from an environment that is already drying out under the
influence of climate change. The effluent and tailings ponds,20 up to 15 square
kilometres and 50 metres deep, litter the landscape and ‘no one knows where [the
toxics] go after that’ (CCPA 2006: 31). Scaling up production by five times does not
present a pretty prospect.
The documentary film H2Oil (Walsh 2009) shows that at least some of the
toxins leach into the Athabasca River. They have been found downstream at Fort
Chipewyan, home to a largely Native American community who traditionally fish
the river to provide a substantial part of their diet. A local study showed high levels
of ‘arsenic, cadmium, polycyclic aromatic hydrocarbons and resin acids in the [river]
sediment, as well as high levels of mercury in tested fish’. Not surprisingly, the
local doctor has recorded increasingly high levels of cancer along with other ailments
associated with toxic pollution.
The tar-sand industry’s response is familiar to fenceline communities around
the world: they didn’t do it – the river was naturally polluted by the tar-sands prior
to development. The Canadian establishment has rallied in industry’s defence.
Politicians routinely puff the industry as a wonder of the world, the official
environmental and water agencies avoid relevant investigations, and the Fort
Chipewyan doctor ‘was summarily silenced by Health Canada and reprimanded by
the College of Physicians and Surgeons in Alberta for causing “undue alarm” ’.21
Although cleared of the charge, he is effectively on notice that he’ll be taken down
at the first opportunity.

145
Peak poison
Venezuela’s sulphurous extra-heavy oils are only marginally easier to extract. Existing
projects, hitherto managed by big-oil corporations, have recovered only 5 to 10%
of the resource and production rates are slow. Technology developments could
improve this but gains would be offset as the more accessible reserves are extracted.
The WEO 2006 saw little development by 2030, with production rising from 100
to 400 thousand barrels a day (IEA 2006: 93). This view was clearly informed by
Venezuela’s inversion of the usual relationship between oil and social investment:
in place of society subsidising oil production, oil is made to subsidise social
investment. The IEA’s view was no doubt reinforced in February 2007 when
President Hugo Chávez decreed that Petróleos de Venezuela SA, or PDVSA, the
state petroleum corporation, would take a majority stake in the heavy-oil projects.
In May of that same year, PDVSA took operational control as well. The WEO
2008 is more optimistic, forecasting 1 mb/d from the Carabobo field alone.
However, state auctions of oil blocks have been delayed several times as prices
dropped and oil corporations held off.
Slow development retards both social and environmental impacts but is not
intentional. In 2008, Venezuela secured OPEC recognition of heavy-oil reserves.
This boosted its reserve figures from about 99 to over 170 billion tonnes and lifted
it from fifth place in the OPEC reserve rankings, based on its ‘regular’ oil reserves,
to second behind Saudi Arabia. Heavy oils thus secured a larger OPEC quota
although they will contribute little to filling it.
Box 5.2 Third-Worlding Alberta
CCPA sees Canada being turned into a peripheral energy province of the US.
Both oil and gas are pumped south in ever greater quantities while North American
Free Trade Agreement rules subordinate domestic energy security and conservation
to the demands of the larger US market. More specifically, the US sees Canada
as a secure source of fuel for its imperial war machine. At the same time, the
aggressive neo-liberalism of Alberta’s provincial government seems calculated
to make a Third World enclave in the tar-sands area: the oil corporations have
been given major subsidies in tax and royalty breaks while labour unions are
purposely subverted, environmental regulation trashed and local government is
starved for funds for social services or even to maintain the infrastructure in the
oil boomtown of Fort McMurray.

146
Toxic Futures
Gas
Gas is closely linked to oil. As noted above, it has replaced oil in applications such
as heating and electricity generation and thus moderated oil demand in 2005 and
2006. It is also found in the same places and ‘associated’ gas is a by-product of oil
production. Further, natural gas liquids, otherwise known as condensates, are
produced from what McKillop (2006) calls hot greasy gas. In the US, such gas
represents the tail end of production from otherwise depleted oil wells. The natural
gas liquids share of crude-oil production is rising rapidly. It now contributes 13%
to oil production and, on current trends, WEO 2008 sees natural gas liquids
production doubling to account for 20% in 2030. This is 20 mb/d and a massive
increase on the 2006 projection of 15 mb/d by 2030.
Box 5.3 Challenging empire
In stark contrast to Canada, Venezuela has articulated an explicitly anti-imperialist
agenda and is loosening the ties of dependency. The US is still its largest market
but it is cutting back exports to the US while expanding exports to China. In
Chávez’s view: ‘The United States as a power is on the way down, but China is
on the way up. China is the market of the future’.22 Venezuela is also pursuing
Latin American integration under the banner of the Bolivian Alternatives for the
Americas as a direct challenge to the failing US agenda for an all-American free
trade zone.23
At the same time, Venezuela is loosening big oil’s grip on its petroleum
industry. ExxonMobil, BP, Total, Chevron and ConocoPhillips are now minority
partners in existing Orinoco projects while PDVSA is entering new partnerships
with state-owned oil corporations, mostly from other Southern countries.
Partnership deals with the China National Petroleum Corporation, Brazil’s
Petrobras, Cuba’s Cupet, Iran’s Petropars and Russia’s Lukoil variously cover the
certification of Orinoco reserves as well as exploration and extraction.
These South-South partnerships may yet upset the IEA’s estimate of what is
technologically possible in the absence of the traditional big-oil corporations.
Indeed, they reflect a deeper shift in the meaning of what constitutes big oil. Ten
of the biggest fifteen oil and gas corporations by production are now state-
owned according to WEO 2008. Saudi Aramco tops the list and ExxonMobil,
the leading supermajor, comes in fourth. If ranked by revenues or profits, however,
the supermajors take the top six places.

147
Peak poison
Several big oil corporations are also constructing gas-to-liquid (GTL) plants
using ordinary natural gas and WEO 2008 sees production rising from just
50 thousand barrels a day to 650 in 2030. However, ‘much of the gas used by GTL
plants is for the conversion process, which is extremely energy intensive’ (IEA
2006: 113). The EROEI, in other words, is dismal. In February 2007, escalating
development costs prompted ExxonMobil and Qatar Petroleum to abandon a
joint GTL project. The partnership will instead supply gas to the domestic Qatar
market.
Overall, WEO 2008 forecasts gas demand (excluding natural gas liquids) rising
from about 49 mb/d of oil equivalent to over 75 mb/d24 in 2030, with electricity
generation accounting for the largest part of the growth. North America and Europe
remain the largest consumers, with the US by far the largest single consumer.
Reserves are increasingly concentrated in Russia and other Central Asian countries
and in the Middle East. Sour gas – with a high content of hydrogen sulphide and/
or carbon dioxide – constitutes over 40% of reserves. Most of it will be transported
by lengthening pipelines as supplies close to the main markets are depleted. As the
network expands across Europe and Asia, China will increasingly compete with
Europe for Russian gas.
Piped gas is increasingly supplemented by liquefied natural gas that can be
shipped – although at a major cost in energy as liquefied natural gas must be
refrigerated to minus 176 °C. Although WEO 2008 sees North American production
holding up through to 2030, this is not enough to meet future demand. Being
isolated from the expanding pipe network in Eurasia, WEO 2006 assumed that US
imports of liquefied natural gas would ‘make good . . . the shortfall’ (IEA 2006:
120). However, ‘some productive activities have stopped or been shifted overseas,
where gas prices and overall production costs are lower. The US chemicals industry,
which relies heavily on natural gas feedstock, has contracted sharply in recent years’
(293). This seems something short of ‘making good the shortfall’. It also indicates
an accelerated movement of energy-intensive dirty industries to locations where
the energy is available, mostly in the global South.
Since 2006, the US has massively expanded production of non-conventional
‘tight’ gas from sands, coal-beds and, most spectacularly, from shale. This has more
than compensated for rapidly declining conventional production. Developing tight
gas is typically costly and energy-intensive and the wells are quickly depleted. In
2008, constant drilling – with 33 000 new wells each year – barely kept pace with
demand according to investment touts Energy and Capital. When demand and prices
dropped in late 2008, drilling was abruptly halted on most shale fields.25

148
Toxic Futures
According to the IEA, the growing global demand for gas can be met by existing
reserves, not including new discoveries, for 40 years. It also remarks that gas is
preferred on environmental grounds because it has a lower carbon intensity than
oil.
Both these conclusions are contested by McKillop (2006). First, gas reserves
are overstated in the same way that oil reserves are. Russia, supposed to have the
largest reserves, is having difficulty maintaining production. Second, peak oil is
provoking a sharp increase in gas-based oil production. Third, ‘the loss rate is
increasing much faster than production’. As long as oil is more valuable than gas,
‘associated’ gas is treated as waste and vented, flared or re-injected into the well
unless there is an infrastructure to gather it. Gas is also a by-product of natural gas
liquids production and is similarly vented or flared. In both cases, the proportion
of gas to oil increases as the oil reserve is depleted. On the World Bank’s estimate,
gas equivalent to 943 million barrels of oil is flared every year. Finally, natural gas
is prone to leaking and the scale of losses will grow faster than the infrastructure.
Larger storage at the market end will leak more as will the lengthening pipelines
tapping ever smaller reserves in increasingly harsh environments. Meanwhile, the
costs of maintaining production and infrastructure will spiral.
McKillop concludes that gas depletion is happening much faster than assumed
and those who hope that gas will provide a ‘bridge’ to a clean energy future will
find the bridge collapsing. And while gas burns cleaner than oil, the scale of losses
undermines the environmental claims. Flaring releases millions of tonnes of carbon
dioxide while venting and leaks release methane. Getting at the shale gas, meanwhile,
is both energy- and carbon-intensive. It requires horizontal drilling combined with
‘hydraulic fracturing’, which involves injecting a combination of water, sand and
toxic chemicals into the well at high pressure to force the gas from the shale.
Evidence has already emerged of large-scale poisoning of groundwater.
Coal
Coal consumption has increased faster than either oil or gas since 2000. The WEO
2008 puts global coal demand in 2006 at 4.4 billion tonnes, equivalent to about
63 mb/d of oil, and rising to over 7 billion tonnes, equivalent to 100 mb/d, in
2030.
As with gas, coal prices are dragged up by the high oil price. ‘Steam’ coal
competes with both oil and gas for electric power generation and for industrial
process heat. In addition, coal-to-liquid (CTL) and coal gasification for chemical
production or for use as gas becomes more competitive at higher oil and gas prices.

149
Peak poison
As with unconventional oils, the 1970s oil shocks provoked interest in CTL but
projects collapsed as crude-oil prices crashed in the 1980s. The exception was
Sasol’s construction of the Secunda CTL plants, which was driven by apartheid
South Africa’s increasing international isolation.
The WEO 2006 saw minor growth in CTL and this is little changed in WEO
2008. Rising coal prices offset rising oil prices and the plant cannot be viable unless
it sits on top of a very large cheap coal reserve. Capital costs are exorbitant, estimated
at over $5 billion in 2006, compared with $2 billion for GTL, for a plant producing
80 000 barrels a day. The process is even more energy-intensive than GTL and
carbon emissions are astronomical. The WEOs do not comment on the intensity
of pollution from other emissions such as sulphur dioxide or the intensity of water
use and pollution.
Farrell and Brandt (2006) believe the IEA underestimates the likely use of all
synfuels including CTL, GTL and syncrude from oil sands and extra-heavy oils.
Hirsch, Bezdek and Wendling (2005) positively advocate a major CTL building
programme in the US in anticipation of peak oil. In 2007, Sunita Dubey of
groundWork reported that at least nine CTL plants were being planned in the US
and the industry, including Sasol, was lobbying hard for subsidies to build capacity
of around 2.6 mb/d by 2025.26 Sasol’s plans are furthest advanced in China. In
2007, two 80 000 barrels a day (b/d) plants were on the cards but, with the collapse
of markets, this has been reduced to one. It is also investigating CTL production in
India and Indonesia (see Chapter 6).
Electricity generation is the biggest consumer of coal. Compared with earlier
projections, WEO 2008 sees ‘slower economic growth’ (IEA 2008: 141) and
therefore reduced additional demand for electricity: instead of doubling,
consumption increases by 80% and coal increases its share of production from 41
to 44%. In the 550 scenario, electricity consumption rises less steeply as energy
efficiency is promoted although more electricity is used for transport. Switching to
other energy sources also reduces coal’s share but there is still an absolute increase
in the amount of coal burnt for electricity.
Despite massive global reserves, WEO 2008 remarks that ‘the rapid increase in
demand in recent years has seen the reserves-to-production ratio fall sharply, from
188 years in 2002 to 144 years in 2005’ (128). It attributes the decline to a ‘lack of
incentives’ rather than of available resources. Nevertheless, supply lines have been
stretched and new coal is harder to mine. The US holds the largest reserves but
started importing because of increasingly high mining and transport costs. In 2007,
China overtook the US as the biggest producer and consumer. It was also a major
exporter but is now importing more than its exports. India, the third-largest

150
Toxic Futures
consumer, similarly holds major reserves but is already importing large amounts
of coal. The WEO 2008 projects world trade rising from 613 to 979 million tonnes
in 2030, implying very large infrastructure construction. Major exporters, including
South Africa, have been expanding railways and ports to handle bulk exports.
Coal is the dirtiest of the fossil fuels and has the highest carbon density. ‘Clean
coal technologies’ are now being promoted to justify the continuation of the industry
in the context of climate change. Carbon capture and storage (CCS) is the main
hope. This involves separating carbon dioxide from the emissions stream – leaving
other pollutants to go their way unless separately scrubbed – and injecting it in
liquid form into deep geological strata or the ocean. The scale required for
meaningful CCS makes it improbable. Technology and environment academic Vaclav
Smil comments: ‘. . . [T]o sequester just 25% of CO2 emitted in 2005 by large
stationary sources . . . we would have to create a system whose annual throughput
(by volume) would be slightly more than twice that of the world’s crude-oil
industry . . .’27
The ocean has already absorbed an overload of carbon dioxide and is
consequently becoming more acidic. This is already affecting the reproduction of
krill, the foundation of the ocean food chain, and so threatens to collapse fisheries.
Risking accelerated acidification through ocean sequestration thus seems like a
really bad idea. As a liquid, it may also spread across the ocean floor creating dead
zones.
That carbon dioxide, injected on the scale required, will stay where it’s put in
geological strata is also uncertain and is possible only in particular geological
formations. Such formations do not necessarily coincide with the location of power
plants and other big industrial emitters. South Africa, for example, has recently
mapped its CCS potential and the best prospects are offshore and remote from the
carbon-intensive power and CTL plants. Many other industrial regions would need
to construct 300-kilometre pipelines to take the carbon dioxide to suitable locations.
A peculiarity of the CTL process is that it already separates out a portion of carbon
dioxide and so makes capture relatively easy. Adopting CCS, whether or not it
actually works, therefore requires the additional costs of compressing and injecting
it. Power stations would, in addition, have to separate the carbon dioxide, which is
very costly and consumes around 30% of the energy produced by the power station
– so producing even more carbon to be sequestered.
CCS was not recognised under Kyoto so carbon credits cannot be claimed but
the pressure is on to change this. CCS has long been pushed by the US, the World
Bank and corporations to avoid cutting fossil-fuel use. Europe has joined the clamour
in order to meet its own unilateral target to cut carbon emissions by 20% by 2020.

151
Peak poison
A European Union directive, issued in April 2009, indicates that new power plants
should be ‘CCS-ready’ and power corporations anticipate that they will be required
to implement CCS. This puts the coal industry in a quandary. One the one hand, it
has promoted CCS as a response to climate change. On the other, it is concerned
that the cost will wipe out coal’s price advantage and generators will turn to nuclear
instead.28
Nukes
The WEO 2008 sees a modest expansion of nuclear-power generation in the
reference scenario and much greater expansions in the 550 and 450 scenarios. It
argues that this will enhance energy security and reduce carbon emissions. The
claim of carbon savings is widely disputed, however. Nuclear energy does not emit
carbon from the generating plant but the full cycle of production is both energy-
and carbon-intensive. Heinberg (2005) argues that, in energy terms, nuclear has
been subsidised by cheap oil just as it has been subsidised economically by
governments for (usually unacknowledged) military reasons.
The IEA says uranium deposits are plentiful and widely distributed. At current
usage, this may be the case. A worldwide turn to nuclear would, however, soon test
the limits of supply and production. Again, this is not just about whether or not
there is uranium in the ground, but how fast it can be extracted and processed to
supply a greatly expanded industry as the high-grade ‘easy’ uranium is mined out.
At present, the world’s 443 nuclear power stations consume 68 000 tonnes. Only
40 000 tonnes comes from mining. The rest is supplied from decommissioned
Russian warheads that will be used up by 2013. Like oil, uranium prices are volatile
now and a recent sharp fall in prices is putting investments, and hence future supplies,
in jeopardy.
The mining industry has been prone to disaster. In October 2006, the Cigar
Lake mine in Canada flooded with groundwater. This is a new mine still under
construction by Cameco, the world’s leading uranium producer. It was advertised
as the world’s largest undeveloped uranium deposit and expected to supply 10% of
world demand from 2008. Following the flood, Cameco said it would bring the
mine into production in 2010. A second flood interrupted remediation work in
2008 and the corporation now says it will bring the mine on line in 2013. The scale
of groundwater contamination is unknown but remediation plans involve pumping
it out to the surface.29 Short of disaster, miners are routinely exposed to radiation
while mine tailings leave a radioactive legacy for tens of thousands of years. Niger
supplies most of the uranium for France’s nuclear power stations from mines
operated by French nuclear corporation Areva. Radiation levels on the streets of

152
Toxic Futures
local towns are up to 500 times higher than normal and drinking water in some
areas is also contaminated, according to a report by Greenpeace. The mines are
also depleting water sources and threatening to wipe out the local pastoral economy.30
In addition to fuel production, nuclear construction is enormously costly
in energy, carbon and money – with a history of over-running large budgets
by three times or more31 – and again in the disposal of waste and in the final
decommissioning. Taking account of the full nuclear cycle therefore substantially
lowers the EROEI of nuclear and destroys its carbon claims. The Eco-Institute in
Darmstadt, Germany, calculates that a 1 250 MW nuclear power station in Germany
emits 33 grams of CO2e per kWh, amounting to 250 000 tonnes per year. Carbon
emissions are higher for lower grades of uranium ore: for grades between 0.1 and
1%, CO2e emissions are 120 grams/kWh.32
The last step, decommissioning and disposing of high-level nuclear wastes, has
a particular significance. First, no satisfactory solution has been found for either.
Second, in a post-peak oil context, decommissioning will compete with other
resource demands and may simply be beyond the capacity of a declining energy
system. Nuclear power will then leave an irredeemable toxic legacy to future
generations. Economist David Fleming calculates that, by 2020, it will take more
energy to clean up nuclear sites and deal with their wastes than the whole nuclear
industry will be able to generate from the remaining uranium ore (cited in Heinberg
2007: 7).
Nuclear power claims an above average safety record because it is tightly
regulated. This is partly achieved simply by secrecy. Many incidents at nuclear plants
have come to light years after the fact. Even if it were true, the claim does not
address the real issue that a single incident can be catastrophic. The 1986 meltdown
of the reactor at Chernobyl in Ukraine spread radioactive fallout across Europe.
Recently published research puts the death toll at close to a million people.33 The
area surrounding the plant is effectively sacrificed forever. The multiplication of
plants around the world clearly increases the risks of catastrophic failures.
Finally, the proliferation of nuclear power cannot be dissociated from the
proliferation of weapons. The Non-Proliferation Treaty has been discredited and
now appears as a tool for maintaining the military advantage of the great powers
and their allies. The US has abrogated its own obligations under the treaty, supported
Israel’s nuclear capacity in defiance of the treaty, and used the treaty as a diplomatic
weapon against Iran.34 In this context, it proposed a Global Nuclear Energy
Partnership that is little more than a move to take control of the world’s nuclear
supply chain.

153
Peak poison
Big hydro
Large dams currently supply about 16% of the world’s electricity, according to
WEO 2008. Despite a doubling of capacity, this share of supply drops to about
14% by 2030 in the reference scenario. The share increases in the 550 and more so
in the 450 scenario as more dams are built. The IEA claims that less than one third
of potential hydro power has been exploited with most of the potential in developing
countries. It shows the largest potential expansion in Africa. It also repeats the
common assumption that big hydro has low-carbon emissions: ‘In Brazil . . . where
more than 80% of electricity is hydropower, the power sector accounts for just
10% of the country’s CO2 emissions, four times less than the world average’ (IEA
2006: 142).
This claim omits the very large carbon emissions associated with dam
construction and even larger emissions of methane from rotting submerged
vegetation. This is just the beginning of the social and environmental impacts. As
noted in the introduction, the 45 000 big dams already built have had a major
impact on earth’s freshwater hydrology. They have also forced the removal of over
100 million people worldwide and submerged their most productive river valley
fields. Not surprisingly, they have provoked massive resistance and are routinely
accompanied by heavy state repression.
Big dams are the ‘economic hit man’s’ project of choice. The economic benefits
are invariably overstated while the costs understated – even when the cost to those
dispossessed is ignored. Thus, the crisis of surplus petrodollars in the 1970s led to
a massive round of dam building to the benefit of corrupt Northern banks,
construction corporations and Southern elites while the debt burden was mostly
imposed on ordinary citizens through such instruments as structural adjustment
programmes.
The World Bank says the Congo River has the potential for 100 000 MW of
hydropower. This is no doubt a salesman’s figure to provoke investor interest in the
Grand Inga project, which the Bank is touting in partnership with the World Energy
Council. The potential capacity of the project is advertised at 40 000 MW – equal
to South Africa’s total power production and twice the size of the Three Gorges
Dam in China. Visiting the site, Bank president Robert Zoellick said that what
‘brings the biggest change to people’s lives [is] bringing electricity to rural
communities. It transforms the lives of women most of all because they get labour
saving devices, they get lights so they can study at night, and it helps the kids with
school’. But he also ‘urged African governments to design more “bankable”
infrastructure projects . . .’.35 That means getting the product to market to pay the
debts. In the case of Grand Inga, the intended markets are Europe and energy-

154
Toxic Futures
hungry industries in South Africa – not poor rural African women. The cost is
estimated at $80 billion and this will certainly rise dramatically if the project goes
ahead. The debt will accrue to the already indebted Democratic Republic of Congo
(DRC) and provide a pretty income for finance capital with the World Bank as
enforcer.
There are already two dams, built in the 1970s and 1980s, at the Inga Rapids.
They have produced little power and drained ‘the country’s finances for decades’36
but are now being refurbished with World Bank support. A third project, the
5 000 MW Inga 3, has been the subject of lengthy negotiation between southern
African state-owned utilities. It was originally driven by South African interests
and primarily intended to transmit power to South Africa. The DRC government
has apparently pulled the plug on this and is in talks with BHP Billiton to both
fund the project and to build an aluminium smelter or two as its primary market.
The people displaced by the existing Inga 1 and 2 dams have not been compensated
and live in wretched conditions. Most do not get electricity. And all are excluded
from negotiations on the planned projects and from information on the terms of
the deals already done.37
Many of the east and southern African countries now produce most of their
electricity from hydro. The supply, however, has proved erratic as the regular
droughts in the region cut the flow of water. Climate change will exacerbate this
vulnerability. Tanzania relies on hydro for nearly 90% of its electricity. In 2005,
drought cut capacity from this source from 559 MW to 120 MW38 and resulted in
widespread outages. In Uganda, the priority given to power production at the
Nalubaale Dam39 resulted in over-use of water from Lake Victoria and lowered the
lake’s level. The World Bank nevertheless approved a $360-million loan package
for the construction of the Bujagali Dam downstream of Nalubaale. Hydrologist
Daniel Kull comments that the Bank’s studies ignored the ‘true damage done to
Lake Victoria by the existing dams and follows with a selective and optimistic view
of current lake levels and possible climate change impacts’ (2006).40
Hydropower projects and competition for water intersect in many parts of the
world. All the countries east and south of the Himalayas, home to half the world’s
people, have big dam-building and water-transfer ambitions both to compensate
for depleted aquifers and to generate power. China controls the Himalayan
headwaters of most major rivers and it has the money, skills and resources to carry
out grandiose projects. The biggest is a 40 000 MW hydropower scheme at the
‘great bend’ of the Yalong Zangbo River in Tibet. The Yalong Zangbo is a major
tributary of the Brahmaputra which, together with the Ganges, feeds the great
delta that defines Bangladesh and West Bengal in India. Both countries suspect

155
Peak poison
that the great bend scheme is also intended to divert water to the Yellow River to
supply China’s dry north. India itself, however, has plans to divert water from both
the upper Brahmaputra and the Ganges (Pomeranz 2009).
Biofuels
There are two basic forms of biofuel: ethanol is an alcohol produced from just
about any plant matter to blend with, or substitute for, petrol; biodiesel is produced
from vegetable oils. Biofuels are heavily advertised as a renewable fuel source and
carbon-neutral because the carbon emitted when they are burnt is supposed to
equal the carbon absorbed during the plant’s growth. This may be so where they
are produced from recycled cooking oils or, on a small scale, from organic agriculture.
It is certainly not so where the agriculture is itself energy- and carbon-intensive,
besides being a major polluter, and the scale of production threatens food security.
Production more than doubled between 2003 and 2007, largely driven by high
oil prices and concerns over energy security but justified also by the supposed
climate benefits. Nevertheless, biofuels accounted for less than 1.5% of liquid
fuels for transport (equivalent to 600 000 b/d of oil) in 2006. By 2030, this rises to
5% (3.2 mb/d) in the WEO 2008 reference scenario. The volume of biofuel
production is substantially increased in the 550 scenario and doubled in the 450
scenario.
Together, the US and Brazil produce 80% of biofuels, prompting the US to
propose, in February 2007, a biofuel partnership to promote the industry. Brazil
has been the industry leader, developing ethanol production from sugar following
the 1970s oil shocks. The subsequent fall in oil prices squeezed the industry but it
was maintained through compulsory blending of fuels. Production reached new
highs in 2007 with ethanol supplying around 14% of domestic fuel. Brazil is the
world’s leading exporter but this market slumped along with the oil price in the
second half of 2008. Massive expansion of ethanol production from maize in the
US, motivated primarily by national energy security, accounts for most of the growth
in world production. In 2005, the US overtook Brazil as the largest consumer and
producer of biofuels, consuming around 15% of the maize crop but producing
only 1% of US liquid fuel demand. Production was set to double by 2008 but, even
if the whole maize crop were used, biofuels could provide only 7% of US demand,
according to Pimentel, Patzek and Cecil (2007). The industry is made viable only
by heavy subsidies to ethanol production, on top of the extravagant subsidy of US
industrial agriculture, supplemented by tariff protection. Despite this support, many
of the corporations that rode the boom went bust in 2009, according to the Wall
Street Journal.41

156
Toxic Futures
Biodiesel accounts for only about 15% of biofuels. Europe is the main centre
of production and consumption. It has more than tripled output since 2000 and
also become the largest importer as it chases a European Union (EU) target of
20% biofuels in the liquid-fuel mix by 2020. The expansion is ostensibly motivated
by climate concerns but the timing, as well as the dubious nature of environmental
claims, indicates that energy security and agricultural policy are the real drivers. For
Britain to meet the EU’s target, however, ‘would consume almost all our cropland’
(Monbiot 2006: 158). The whole of Europe will not do much better so the policy
implies a heavy reliance on imports from Southern countries where land and labour
are cheap.
The claim that biofuels reduce carbon emissions assumes a positive EROEI:
fossil-fuel inputs in agriculture and in the production process must be less than the
energy content of the biofuel. A study cited by WEO 2006 supports this claim, but
Pimentel, Patzek and Cecil (2007) show that this study42 does not take account of
the full range of energy inputs. Taking all farming, ethanol production and marketing
energy inputs into account, they find that US production of maize ethanol requires
‘43% more fossil energy than the energy produced as ethanol’. If wastes can be
turned into by-products, this would be reduced to 28%. Tropical sugar has the best
EROEI but it is still negative in their view. Biodiesels, according to Pimentel and
Patzek (2005), also show negative energy returns.
The carbon equation does not end with the energy equation. Soil is a major
carbon ‘sink’ – that is, it absorbs carbon from the atmosphere. Industrial agriculture
destroys this function as heavy machines compact soils while agricultural chemicals
kill the microbes that give structure and life to soil. The effect will be to reinforce
one of the feedback loops created by global warming. Higher temperatures are
expected to convert soil from a major sink to a major source of carbon dioxide.
Journalist George Monbiot notes that this reversal ‘was not supposed to happen
for several decades but in 2005 British scientists reported that soils in England and
Wales had already become carbon sources’ (2006: 10). Meanwhile, the conversion
of land to industrial agriculture results in a massive loss of carbon to the atmosphere.
European demand for biodiesel has driven a rush into palm oil production in
Malaysia and Indonesia. Natural forests are being cleared and peat bogs drained on
a very large scale to make way for industrial palm plantations that scarcely begin to
compensate for the carbon losses caused by the clearance.43
This conversion of land use is associated with dispossession. The Brazilian
land movement, Movimento Sem Terra, notes that it gives new intensity to
established patterns of rural dispossession, gross exploitation of labour and

157
Peak poison
environmental destruction associated with sugar throughout its history. In a joint
statement with social movements from other Latin American countries, titled ‘Full
tanks at the cost of empty stomachs’, they denounced the US-Brazil ‘biofuels
partnership’ as part of a US geopolitical strategy to counter Venezuela’s influence
in the region. The partnership was also intended to support the interests of Northern
transnational gene and agribusiness corporations. Biofuels thus created the basis
for novel partnerships between agribusiness, big oil and motor corporations and
now represented ‘an important source for the accumulation of capital’.44 Brazil’s
role ‘would be to provide cheap energy to rich countries which would represent a
new phase of colonisation’.45
In May 2007, a group of African NGOs responded to Britain’s proposed
Renewable Transport Fuel Obligation that sets out biofuel targets.46 They noted
that their response was uninvited because the consultation process was restricted
to Britain but that meeting the targets implies large-scale land conversion in Africa.
Already, the Ugandan government planned to give over 7 000 hectares of the 30 000
hectare Mabira Forest, a reserve area, to sugar corporations interested in ethanol.
The forest is part of a people’s commons, contributing to the livelihoods of over a
million people who draw on it for water, firewood, honey, mushrooms and materials
for making baskets. Ironically, it also conserves the Lake Victoria catchment adjacent
to the Nalubaale and the proposed Bujagali dams, and its preservation was agreed
as necessary to optimising the new dam’s performance. Opposition to the giveaway
was intense and demonstrations in Uganda during April 2007 were accompanied
by a police crackdown and rioting. In October, government backed down, scrapped
the sugar deal and said it was committed to conserving Mabira.47 Elsewhere in
Uganda, palm-oil plantations are displacing forests while Benin is planning a major
expansion of palm oil in peat bogs.
More broadly in Africa, the potential use of cassava for ethanol poses ‘an
especially grave threat to the food security of the world’s poor,’ according to
agricultural economists C. Ford Runge and Benjamin Senauer (2007). It is the
staple ‘for over 200 million of Africa’s poorest people . . . the food people turn to
when they cannot afford anything else’ and a reserve against the failure of other
crops. Higher cassava prices will certainly be advertised as benefiting peasant
producers but, the authors note, ‘the history of industrial demand for agricultural
crops . . . suggests that large producers will be the main beneficiaries’. An African
NGO group is similarly concerned that dispossession and the privatisation of
common lands, along with environmental degradation, will follow from large-scale
biofuel mono-cropping. They argue that biofuels will be sustainable only within

158
Toxic Futures
diverse farming systems controlled by local people and ‘produced for household,
local or domestic use, in order to meet the energy needs of the poor’ rather than
the demands of export markets constructed ‘as a quick-fix replacement to fossil
fuels’.
Environmentalist Lester Brown calculates that ‘[t]he grain required to fill a 25-
gallon SUV gas tank with ethanol will feed one person for a year’. The expansion
of US biofuels in 2006 doubled the price of maize, which in turn dragged up
wheat and rice prices and pushed up feed costs to raise meat, dairy and egg prices.
Because the US dominates world grain trade by virtue of farm subsidies – which
have precisely that intention – US prices set world prices. In Mexico, the price of
tortillas went up 60% and millions faced the prospect of empty stomachs. In
February 2007, 75 000 workers and peasants took to the streets of Mexico City in
protest and extracted a promise of price controls on maize products from the
government.48
Journalist John Ross notes the deeper roots of Mexico’s food crisis. The North
American Free Trade Agreement signed in 1994, subjected Mexican peasant farmers
to direct competition with US corporate agriculture that receives ‘up to $21 000 an
acre in subsidies from the US government, enabling them to dump their corn over
the border at 80 percent of cost’. In consequence, six million peasant families have
been forced from their land and joined the stream of migrant labour. The North
American Free Trade Agreement also enabled US corporates, in partnership with
Mexico’s dominant firm, to take control of distribution and retailing. They are
now aiming for control of the seed market and used the food crisis to attack a ban
on genetically modified seed, claiming that ‘bio-tech is the only solution to growing
more corn and keeping the tortilla affordable’. The corporations are in fact focusing
on genetic modifications to enhance biofuel production.49
High food prices were not only driven by biofuels. Australia is the second
biggest wheat exporter after the US. The longest and worst drought on record
collapsed production in the Murray River basin. Independent of climate change,
industrial agriculture is undermining its own resource base, resulting in the global
loss of 5 to 7 million hectares every year from land degradation and another
1.5 million hectares from water-logging and salination, according to the Food and
Agriculture Organisation (FAO).50
As with oil and other commodities, speculative capital in flight from the crashing
equity markets also crowded into food taking short-term profits, effectively traded
for people’s lives, until the commodities bubble burst in 2008. Prices then eased
somewhat but were again rising sharply in 2010. Meanwhile, the crisis provoked a

159
Peak poison
Third World land-grab. It is driven by two distinct sets of interest. First, several
cash-rich countries faced the prospect of food shortages and responded by looking
for cheap land in other countries. Second, farm land is now seen as a long-term
safe haven investment by finance capital as well as agribusiness transnational
corporations.51
Renewables
‘Other’ renewables – wind, solar, ocean, geothermal – are the fastest-growing energy
sector, according to the IEA, but off a very low base. In 2006, they produced
around 0.6% of global energy supplies and by 2030 will produce only 2% in the
reference scenario. In the 550 and 450 scenarios, they produce 3 and 4.7%
respectively. Renewables have a greater share of electricity generation: 2% in 2006
and 8.5% (reference), 13% (550) or 19.6% (450) in 2030. These figures are buffed
up by the inclusion of ‘modern’ biomass. Growth is fastest in the global North but,
in the 450 scenario, there is very substantial growth of renewables in the South as
well. The IEA gives more credence to renewables in WEO 2008 than in previous
years. They nevertheless remain something of a niche market except in the 450
scenario.
This perhaps indicates a turning point in the energy establishment’s traditional
hostility to renewables. While fossil fuels benefit from immense subsidies from the
World Bank and national states, renewables have generally been discriminated against.
Thus, former World Bank president James Wolfensohn thought them an interesting
option but ‘we also have to remain realistic: renewable energy is expensive’ (quoted
in Simms, Oram and Kjell 2004: 20). The New Economics Foundation responded
that this view ‘reflects the interests of the Bank’s major donors’ fossil-fuel industries’.
Further, oil, coal and gas are used to catch poor countries ‘in a nexus of dependency
relationships with other nations, multilateral donors, and foreign companies’ (2004:
23). Renewables are dangerous to this establishment because they offer poor
countries and, more particularly, poor people a potentially autonomous energy
supply and the possibility of throwing off the shackles of dependency.
It does not follow from the New Economics Foundation’s argument that
renewables can replace fossil fuels to maintain profligate consumption by industry
and the world’s rich. The opinion of environmentalists is sharply divided on this
issue. Leggett argues that renewables can produce enough energy to meet the global
‘demands of 10 billion people wasting energy at the level your average wasteful
European does today’ including energy for transport (2005: 201). The more
160
Toxic Futures
immediate problem is the transition from fossils to renewables. Building a renewable
systems and infrastructure will take time and consume vast amounts of energy that
is not presently available from renewable sources. In other words, a renewable
future needs an energy subsidy from fossil fuels to get started and, past peak, that
subsidy will not be easily available. Leggett therefore sees a period of chaos followed
by the explosive growth of renewables. A massive programme of energy
conservation and efficiency will ease the transition. In the meantime, people should
mobilise to persuade governments and corporations to start the switch now. Every
new investment in fossil energy is not only a commitment to future carbon emissions
but also a misdirection of resources.
Many environmentalists, mostly but not exclusively Northern, share a basic
assumption with Leggett: preventing runaway climate change must be achieved
within the present order of power – that is, within the context of capitalism and
economic growth. Time is now so short that the powers must be persuaded to a
heroic international effort, equivalent to war-time mobilisation and combining the
resources of nation states and corporations. They must be persuaded that renewables
can keep the world economy powered-up for growth. Against this, many
environmentalists and most peak oil analysts do not believe renewables can come
close to replacing the flow of energy from fossil fuels. While renewables can be
and must be expanded, along with a massive drive for energy conservation, the
overall energy supply will contract and it will not be possible to sustain economies
based on growth.
Renewables include a very wide range of technologies and energy sources and
the definition of what is or isn’t renewable is contested. From Britain to South
Africa, countries that have adopted renewable energy targets include biofuels, landfill
gas and big hydro in their definitions of renewable. Paul Mobbs (2005) distinguishes
between low-carbon energy, including biofuels, biomass and biogas, and renewables
that use natural flows of energy ultimately derived from the sun or from gravity,
including solar, wind, hydro, wave, ocean current and tidal energy.
For practical purposes, low-carbon technologies are renewable if they are
founded on sustainable production systems. In industrial contexts, most are not.
As noted above, industrial production of biofuels scarcely qualifies even as low
carbon. Similarly, biogas from waste dumps is heavily promoted by governments
and the World Bank. Landfill gas is produced from rotting organic matter but,
being contaminated by other matter in the dumps, is toxic. In contrast, biodigesters
capture the gas from sewage and organic matter before it becomes a pollution
problem and also produce compost (energy in a different form). However, they

161
Peak poison
would require a thorough transformation of waste management and scarcely register
in the official energy future.52 Firewood is the primary fuel for the rural poor in the
global South and the carbon account is balanced if new trees are grown to replace
what is burnt.
Renewable energy resources are abundant and free but, in contrast to fossil
energy which is very dense, renewables are diffuse or ‘thin’. This means that only a
small fraction of the potential can be used in practice. Some, but not all, renewables
are also limited because they are intermittent sources of energy and they therefore
need backup from more constant supplies or from storage. Renewables may produce
heat energy – as with solar water heaters – or be converted into another usable
energy, usually electricity. Given the monetary subsidy to fossil fuels, renewables
have competed on unequal terms but, with rising fuel prices, they become more
competitive. The costs of a number of technologies are also falling as production
is scaled up. Wind energy is now more or less competitive with conventional power
in many countries and new innovations are reducing the very high costs of solar
photovoltaic (PV) power. In contrast to fossil fuels and nuclear energy, both of
which will face rising fuel costs in the future, the costs of production from many
renewable systems falls over time because the energy source is free. Nevertheless,
if renewables must provide the energy ‘to make and operate’ the renewable system
itself – including mining and manufacturing – the EROEI declines and ‘in some
[not all] cases is negative’, according to renewable energy researcher Ross McCluney
(2005: 161).
There are also environmental limits to renewables. They do incur environmental
costs, not only in mining, manufacture and construction but also in their operation.
Solar PV panels contain metal toxins that will require sophisticated waste
management starting with the design of panels to enable safe recovery and re-use.
For most other renewables, the issue is one of scale. Small-scale and dispersed
systems have a negligible impact but, if they are scaled up to replace a major portion
of fossil energy, the impacts will be substantial because they draw energy from the
natural system. Thus, a large tidal dam has had a severe impact on an estuary in
northern France, large wave systems will cause coastal erosion and may affect
marine life sensitive to noise, large ocean-current systems will slow and may divert
the current, very large wind farms have been shown to affect local climates although
this impact does not begin to compare with fossil-fuel impacts.53
In short, concentrated large-scale production from most systems will likely
become as controversial as big hydro. Yet it is precisely such systems that tend to
be favoured by national states and big corporations. The Tyndall Centre, a British

162
Toxic Futures
climate-change think tank, observes that the ‘existing regulatory system for electricity
distribution operates within the paradigm of centralised generation and one-way
flow of electricity from large power plants to users. The “passive” user has co-
evolved with such a supply system’ (2005: 73).
The implication is not only that national grids are designed on the assumption
of a few big power sources but, more importantly, the system embodies the
concentration of political and economic power. The proposed Desertec project,
initiated by a consortium of twelve major European energy, engineering and banking
corporations, fits the bill. It involves massive solar installations in the Sahara Desert
to produce 15% of Europe’s electricity by 2050. The New Economics Foundation’s
understanding of renewables linked to people’s autonomy is expunged here. Instead,
renewables are fixed within the ‘nexus of dependency’.
Centralised power is also extremely wasteful. Heat losses from big plants
combined with losses from long-distance transmission through the grid means
that less than 40% of the primary energy used to fuel the generator ends up as
useful energy. A growing body of environmentalists therefore advocate decentralised
energy systems based on numerous micro-generators producing electricity for
localised mini-grids and heat where it will be used. In this way, districts and even
households would produce a surplus and the surplus from the mini-grid would
feed into the national grid. In the Tyndall Centre’s view, it could also ‘stimulate new
user/consumer identities as awareness of energy per se, and of sustainable energy
in particular, rises’ (74).
Energy decentralisation relates to a wider set of demands. In the North, a
variety of social movements call for ‘localisation’ and an end to dependency on the
plunder from the South. In the South, movements of resistance to corporate plunder
call for local food and energy sovereignty. In the peak oil perspective, localisation is
likely to be forced by declining oil production. Renewable energy is then a matter
of survival and there can be no assumption of economic growth. Mobbs observes
that ‘when you cut your energy consumption by 75% renewable energy options
become far simpler . . .’ Moreover, the term ‘energy-poor’ will lose its meaning in
a future where none are energy rich because ‘the amounts of energy will not be as
relevant as the extent to which people can control and operate their own energy
systems’ (2005: 172, 173).
The use of small-scale and dispersed renewables is thus linked to local and
democratic control of production because, unlike fossil and nuclear fuels, they do
not require centralised corporate empires to manage them. We will return to this in
Chapter 10. In the present, however, the democratic potential associated with

163
Peak poison
decentralised renewables does not mean that they cannot or will not be managed
by corporate empires. Indeed, several of the oil supermajors, including BP and
Shell, are already established as leaders in the renewable energy field. They are
widely criticised for co-opting renewables for corporate greenwash because their
investments in renewables are dwarfed by their fossil-fuel investments. Nevertheless,
their deep pockets give them a leading role in defining renewable technology options
and business models to centralise profits even from decentralised plant. Nor does
local necessarily mean more democratic. Corporate control of local generation
may well be accompanied by local despotism in order to enforce the returns on
investment.
Efficiency and the ends of energy
Whatever the energy source, efficiency is held to be the easiest and cheapest means
both to energy security and carbon reductions. In a market system, however, energy
efficiency leads to an overall increase in energy use. This is known as the ‘Jevons
paradox’. For capitalism, increased energy efficiency is another form of increased
productivity. It increases the work done by energy but the benefit is taken in profit
and economic growth rather than a reduction of overall energy use. Put differently,
the priority is the efficiency of capital, not energy, and the additional returns to
capital must then be reinvested in further economic activity that requires more
energy.
Moreover, efficiency generally assumes ‘grandfathering’. That is, existing
technology systems are assumed and efficiency is advocated within that system.
Thus individual units such as cars are made more efficient but the transport system
and the interests that promoted the car are not. For most of its history, the oil
industry has been concerned to manage a glut of supply and has promoted expanded
consumption. Thus, big oil purposely sabotaged public transport in the US to
promote the use of cars and so created a system-wide reduction of efficiency.
Beyond this, Tadit Anderson notes that supposed efficiencies associated with
economies of scale in manufacturing relied on a profligate supply of fossil energy
to drive out local industries and concentrate power in markets constructed over
ever larger regions.54 The technologies thus embed relations of power and it is
really these power relations that are grandfathered in the discourse of energy
efficiency as well as in the Kyoto Protocol’s carbon reduction commitments (see
Chapter 8).
A limit on that expansion is not compatible with economic growth. If the
quantity of energy is fixed then growing use for some can only be had at a loss to

164
Toxic Futures
others and this equation grows more acute in the context of peak oil. Ultimately,
Mobbs observes that ‘energy efficiency is meaningless in the face of actual
shortages’ – efficient or not, the car will not go without fuel (2005: 143). In a
context of declining energy supplies, the choice is what – or whose – energy use
to cut.

165
The chains of petro production
6
The chains of petro production
THE OIL INDUSTRY IS generally talked of in terms of upstream and
downstream production. Upstream production is about exploration and
extraction – finding the oil and getting it out – while downstream is about refining
and marketing. The previous chapter showed that peak oil brings on peak poison
as the ‘easy’ oil goes first leaving heavier and dirtier oil increasingly supplemented
by unconventional sources including coal-to-liquid (CTL). But the ‘easy’ oil was
never clean. This chapter opens with an all too brief account of the subordination
of upstream producers in Africa to the interests of big oil and of the blood on the
pipelines. A fuller account is given in The groundWork Report 2005. The main focus
here is the petrochemical value chain in South Africa, starting with the refineries
and CTL plants and looking further downstream at plastics, one of the sectors
identified for expansion in industrial policy. The petro corporations extract value
from every point in the production chain and have a strategic view of it that is not
confined by locality or nation. They also provoke resistance all along the line but
this invariably starts locally – in each place where people’s lives are disrupted by
the incursion of the industry. Connecting people in different localities thus becomes
an important strategy of resistance and, in 2005, people living on the refinery
fencelines in South Africa visited the Niger Delta to build solidarity in resistance
upstream and downstream. There they witnessed the intensity of the upstream
war against the people. The village of Odioma had recently been razed to the
ground by the Nigerian army while everywhere the gas flares roared and spilt oil
saturated the ground and slicked over the waters of the delta.
AFRICA’S OIL RUSH
The US invasion of Iraq added impetus to Africa’s oil rush. The Gulf of Guinea
off west and central Africa was already ‘viewed by the oil industry as the world’s

166
Toxic Futures
premier “hotspot” ’ and the biggest discoveries worldwide in 2001 were made there
(Gary and Karl 2003: 9). Security and the cost of crude supplies were top of the
agenda for consuming countries. The US in particular stepped up diplomatic and
military activity in the region, edging in on the regional hegemonies of the former
colonial powers of Britain and France. Also reflecting the changing pattern of
power relations in the globalised world order, several Third World countries
developed active interests in African crude supplies, including China, Malaysia,
India and South Africa. While corporate and state interests are not necessarily
identical, they are closely aligned and move pretty much in lock-step into the oil
regions. The dominance of particular corporations in each country thus tends to
reflect international relations of power at the time that oil was discovered.
The international financial institutions – the International Monetary Fund (IMF)
and the World Bank – are key actors in support of the Northern agenda. Vallette
and Kretzmann (2004) show that the World Bank first invested in the oil sector at
the behest of the US in the late 1970s with the aim of opening production in new
countries and so reducing OPEC control of prices. It was also in this period that
the neo-liberal Washington Consensus began to emerge as the US started to make
more direct use of the IMF and World Bank to extend its control over the economic
policies of Third World countries. Almost all Bank loans for oil projects have been
to the benefit of ‘Northern fossil fuel corporations, especially those based in the
United States’ (Vallette and Kretzmann 2004: 7). Further, 82% of Bank oil projects
were designed to export the oil to the major Northern markets and a good many
of them are located in countries ruled by despots and warlords. The Bank itself
makes substantial profits from resource extraction but its broader role is to provide
a political guarantee to oil and finance corporations that they will get their profits
out from projects in unstable countries. Contrary to its stated mission of alleviating
poverty, it thus appears that the Bank’s real mission is to secure the flow of resources
to ‘the market’.
Box 6.1 The Extractive Industries Review
The World Bank commissioned the Extractive Industries Review (EIR) in 2000 in
response to mounting criticism from civil society organisations that lending to
oil, gas and mining projects contradicted its stated mission of alleviating poverty.
The review, published in December 2003, found that the Bank’s ‘project funding

167
The chains of petro production
Producing countries, and would-be producers, are no less enthusiastic. Their
economic interest is primarily in oil revenues as well as balance of payments.
Politically, they benefit from the international recognition that comes with sitting
on top of a strategic resource and oil discoveries may reinforce their grip on power
– provided they play the game. Thus, Equatorial Guinea moved from being a virtual
outcast nation to being courted by the great powers with the US re-opening its
embassy, closed in 1988. Their relationship with corporations tends to be as close
as that between corporations and their ‘home’ countries but, given the superior
economic clout of big oil corporations, it is an unequal relationship and marked by
duplicity and corruption.
As oil prices rose from a low of $10 a barrel in 1999, everyone in the extraction
business did well except ordinary people in oil-producing countries. While the
fabulous wealth of oil was paraded before them, they were driven ever deeper into
poverty. The very common association of oil wealth with the impoverishment of
people and the failure of national economies has given rise to the notion of the
‘resource curse’. Conventional accounts of the resource curse emphasise the effects
on currency values, the devaluation of other sectors of the economy and the
consequent dependency on oil both for state revenues and the economy as a whole
in the extractive industries has not had poverty reduction as its main goal or
outcome’ (Vol. I: 18). Indeed, ‘[o]ver the course of two years of examination, the
World Bank . . . was unable to provide an example of a single instance where an
oil project alleviated poverty. Many examples were provided of oil projects that
exacerbated poverty’ (Kretzmann and Nooruddin, 2005: 13).
The central recommendation of the EIR was that the World Bank ‘should
phase out investments in oil production by 2008’ and focus on sustainable energy
(Vol. I: 64, 65). It also said there should be no support for oil projects in a context
of human rights abuse or corruption. The Bank rejected the phase-out – repeating
its discredited claim that such projects were necessary for poverty reduction and
the delivery of energy to the poor – but said it was adopting most of the other EIR
recommendations. Dr Emil Salim, who headed the EIR, commented that in fact
the Bank’s response intended to justify business as usual and made ‘few
commitments to addressing these recommendations fully or to implementing
them’ (quoted in Stockman and Muttitt 2005: 16).

168
Toxic Futures
but generally leave out the devastation of environments. At the same time, these
accounts narrow the frame of reference to conceal the actual politics of resource
extraction. They treat each oil-producing country as a separate economy and leave
out the broader context of global corruption and the purposeful subordination of
Southern countries documented in The groundWork Report 2005.
Africans doing it to themselves
The New Partnership for Africa’s Development (NEPAD) embodies the vision of
Africa’s governmental leaders ‘to enable the continent to catch up with developed
parts of the world’ (NEPAD 2001: para. 65).1 The ‘partnership’ of the title is
between Africa and the major powers who are asked to help finance NEPAD as a
‘Marshall Plan’ for Africa. From its inception, NEPAD has been presented to
successive meetings of the G8 rich country club. Consultation with African civil
society – primarily labour and faith-based organisations – appeared as something
of an afterthought following intense criticism.
NEPAD opens by criticising the role of colonialism in impoverishing Africa
and acknowledging ‘poor leadership, corruption and poor governance in many
countries’ (para. 21) in the post-colonial period. It commits African leaders to
democracy, respect for human rights and good governance and to the pursuit of
the United Nations Millennium Development Goals which set targets for addressing
poverty. This sounds good but is already given away in the core vision of emulating
Northern development.
NEPAD commits Africa to capitalist development. Its key goals are to attract
capital investments – from donors as well as private-sector investment – and to
gain ‘market access’ through increased productivity and expanding exports. By this
means, it reckons to achieve 7% economic growth per year for fifteen years. This is
not credible. The central problem is that Northern development was substantially
financed by plundering the Third World and there is no other Third World left to
plunder unless African leaders plunder, once again, their own people. This is more
or less what they do anyway. As Manuel Castells argues, the Northern powers and
African elites have a common interest in Africa’s fragmented integration into global
capitalism. Europe and the US benefit from the extraction of valuable assets and
‘what is a human tragedy for most Africans continues to represent a source of
wealth and privilege for the elites’ (2000b: 127). In this light, the ‘partnership’ in
NEPAD is hardly encouraging. Money will be made as the poor are made poorer.
Developing regional infrastructure corridors for transport and energy is a key
focus for NEPAD. The West African Gas Pipeline – to take Nigerian gas to Benin,

169
The chains of petro production
Togo and Ghana – fits the bill. Originally proposed by Chevron in the early 1990s,
it is now NEPAD-approved. NEPAD argues that this breaks with the colonial
infrastructure that connected African countries only to the colonial power. So it
appears. Yet the money flows are as colonial as ever. The project is subsidised by
‘generous exemptions from taxes, rates and customs duties’ while the $400 million
invested will return to the Northern countries which provide the engineering
resources (ERA and Oilwatch 2000: 13). The profits will follow in the same direction.
A similar project supplies gas from Côte d’Ivoire direct to AngloGold Ashanti’s
Ghanaian gold mines. It is an infrastructure developed for the benefit of capital,
not people who are unlikely to be able to afford the energy at the end of the
pipeline.
The West African Gas Pipeline also reflects NEPAD’s bias towards capital-
intensive mega-projects. Such projects are favoured by financial institutions,
particularly the World Bank, partly because they are easier to administer than
numerous small initiatives but, more substantially, because they reflect the interests
of global capital. Mega-projects produce ‘enclave economies’ divorced from local
needs and dependent on transnational corporations and expatriate resources. They
give concrete form to Africa’s fragmented integration into global capitalism.
A regional power
The South African government’s contribution to NEPAD was critical and, allowing
for differences in context, the document reflects its development thinking. This
role reflects the pan-African sentiments of its leaders but also its growing economic
interest as the leading economy in the region – producing 44% of sub-Saharan
Africa’s GDP. As Deputy Minister of Foreign Affairs Aziz Pahad put it in 2005,
‘economic diplomacy is a central pivot around which to anchor all our efforts to
address underdevelopment and poverty. In this regard, there are many new economic
opportunities in Africa, the Middle East and Asia which should be investigated and
exploited by the South African private sector’.2
South Africa’s corporations, public and private, have certainly followed the
diplomats into Africa, investing in a wide range of sectors from cell phones and
supermarkets to resource extraction and accounting for nearly half of all foreign
direct investment in the Southern African Development Community. Mining and
metal processing have been prominent, as indicated by the acquisition of Ashanti
by AngloGold. The country’s interest in crude extraction is relatively new although
it has the best developed refining sector in the region. PetroSA, the state oil
corporation, has two relatively small fields off South Africa itself. It has been moving

170
Toxic Futures
into Africa since 2003, acquiring exploration and production licenses in Gabon,
Nigeria and Equatorial Guinea. In 2005, following on the heels of South Africa’s
peace-keeping troops in Darfur, PetroSA signed an exploration agreement with
Sudan’s state-owned corporation. It has also acquired exploration rights in Egypt’s
Gulf of Suez.
Sasol has expanded rapidly into upstream oil and gas exploration and production
with operations concentrated in Africa. Gas fields in Mozambique were brought
into production in 2004 to supply its South African production plants through a
dedicated pipeline. In Gabon, it has shares in several oilfields and is the operating
partner in an exploration project. It is entering into deep-sea exploration in Nigeria
and is reviewing operations in Equatorial Guinea and South Africa. Sasol is also
developing a gas-to-liquid (GTL) project with ChevronTexaco at Escravos in the
Niger Delta. Clearly, it is not deterred by the idea of dealing with regimes that
abuse human rights although it says it is determined ‘to bring world-class
environmental standards to all new and planned future projects, irrespective of
location and project type’ (2004: 39).
Corporate South Africa’s march into Africa is backed by state-directed funding
through the Industrial Development Corporation (IDC). The IDC has typically
backed large-scale capital-intensive projects, reflecting an historical bias towards
mega-projects that is reinforced by the development of institutional relations with
the World Bank. It has a specific interest in the petroleum sector and provided
substantial backing to Sasol’s Mozambique gas development. Not surprisingly, the
IDC, Sasol and PetroSA are all keen to identify their African projects with NEPAD.
Frontline Nigeria
On 10 November 1995, Ken Saro-Wiwa and eight other Ogoni activists were
executed on the order of a rigged military court. In his closing statement to the
court, Saro-Wiwa wrote:
I and my colleagues are not the only ones on trial. Shell is here on trial . . .
the ecological war that the Company has waged in the Delta will be called
to question sooner than later and the crimes of that war will be duly punished
(quoted in Doyle 2002: 174).
The ecological war in the delta starts with enclosure. Nigerian law gives control of
land and oil to the state but the practical effect is that oil corporations can and do
take what they want from the people within their areas of operation. The

171
The chains of petro production
corporations themselves call this the ‘land take’. The pollution has poisoned a much
wider area, filling the air, spreading over the waters and saturating the land.3 For
people who depend on fishing and farming, said Saro-Wiwa, ‘that’s . . . saying we
don’t have any right to live’ (quoted in Doyle 2002: 161). Christiana Mene from the
Escravos Women’s Coalition, involved in shutting down ChevronTexaco’s export
terminal in 2002, echoed the point: ‘Our farms are all gone . . . we cannot catch
fishes and crayfish’ (quoted in Turner and Brownhill 2004: 67).
Niger Delta communities have a long history of resisting the enclosure of
their land. The Movement for the Survival of the Ogoni People (MOSOP) became
the best-known organisation of resistance and an inspiration for communities across
the delta. In 1993, it organised mass protests throughout Ogoniland and forced
Shell to close down its Ogoni production wells although active pipelines still cross
the territory. Resistance was met with brutal repression. It started with security
force attacks thinly disguised as inter-ethnic violence. Then, in 1994, four ‘moderate’
Ogoni chiefs were murdered at Giokoo. The circumstances indicate that they were
killed by security operatives acting under cover. Saro-Wiwa and his fellow MOSOP
leaders were immediately accused of the murders and arrested without even the
pretence of an investigation. According to Owens Wiwa, Shell’s managing director
told him that he could secure his brother’s release ‘but would only do so if MOSOP
called off its international campaign against his company’ (Okonta and Douglas
2003: 58). Saro-Wiwa refused. Shell denies making this offer.
The Giokoo murders provided the pretext for the military occupation of Ogoni.
A special task force closed off media access and launched a terror campaign marked
by arbitrary detention, torture, rape, murder and military assaults on towns. Colonel
Paul Okuntima, who led the operation, later claimed that Shell helped finance it.
Shell denied it and Okuntima subsequently retracted. Human Rights Watch
established, however, ‘that all through the Ogoni crisis Shell Nigeria representatives
met regularly with the commander . . .’ (Okonta and Douglas 2003: 135).
The use of brutal security force violence did not begin or end in Ogoni. From
the early 1990s protests across the delta became more organised and numerous
ethnic groups adopted charters loosely modelled on the Ogoni Bill of Rights.
They also looked for a broader unity that would give expression to Saro-Wiwa’s
vision of a pan-delta solidarity based on people’s common experiences. The savagery
of the security force response also intensified throughout the decade. Ijaw youth
greeted the new year of 1999 by mobilising in support of the Ijaw Youth Council’s
Kaiama Declaration. In response, security forces killed over 100 people and burned
down ten or twenty homes. In many similar incidents around the delta, corporate

172
Toxic Futures
helicopters and boats were seen carrying security forces. At Odi, the army razed
the entire town to the ground and killed several hundred people according to Human
Rights Watch (2002: 21ff.). On the other side, people occupied oil facilities and
forced repeated shutdowns across the delta.
In this period, gun trafficking in the delta escalated and armed youth groups,
sometimes known as ‘cults’, emerged. Mostly, it appears that they were armed by
politicians to intimidate opposition party supporters, by local elites to secure their
control over oil sub-contracts and pay-offs against rival factions, or through ‘illegal
bunkering’ networks responsible for the wholesale theft of oil. Cult leaders have
also been used to infiltrate and subvert resistance movements but, in the ambiguity
of the delta, that works the other way too as cults turn to resistance against their
erstwhile sponsors. From this, a more direct insurgency was spectacularly announced
by a direct attack on Port Harcourt, Nigeria’s oil capital, by Dokubo Asari’s Niger
Delta People’s Volunteer Force. Human Rights Watch (2005) sees this as part of a
battle with rival gangs for control of illegal bunkering. Nigerian scholar Ike Okonta
observes to the contrary that Asari was an insurgent leader whose actions were
‘symptomatic of a larger and quickly spreading national crisis’ (2005).
This was emphatically confirmed with the emergence of the Movement for
the Emancipation of the Niger Delta (MEND). In February 2006, government
sent helicopters and gunships to attack the small village of Okerenkoko on the
Escravos River, claiming it to be a centre of oil bunkering. ‘It was this bloody
incident that triggered the birth of MEND,’ says Okonta (2006). MEND captured
expatriate oil workers, destroyed flow stations and pipelines across the delta and
even attacked offshore platforms ‘to remove any notion’ that deepwater production
is beyond its reach.4 It has shut in something like half of Nigeria’s production and
reduced the flow of oil from the delta itself to a trickle. Yet MEND is more an
idea than an organisation, according to Okonta, and composed of shifting alliances
of resistance groups and ‘cults’.
The oil corporations portray MEND and the cults as merely criminal. They
represent themselves as the victims of illegal bunkering, sabotage and the loss of
state authority. They are, however, directly complicit in creating Nigeria’s outlaw
economy. Ridding the delta of the transnationals is a key MEND objective. It
routinely warns them to leave and several service companies have done so. Shell
and the other majors hang on but have ‘lost their [social] license to operate’ observes
Watts (2009). That licence was always a fiction, a cover for coercive force. Nigeria
demonstrates the scale of rebellion needed to withdraw it. Further, ‘[w]hat is on
offer in the name of petro-development is the terrifying and catastrophic failure

173
The chains of petro production
of secular nationalist development . . . From the vantage point of the Niger Delta
. . . development and oil wealth is a cruel joke . . . The government’s presence,
Okonta notes, “is only felt in the form of the machine gun and jackboots” ’ (Watts
2008).
The oil regime is bereft of all legitimacy. Getting the oil out, whether it is done
by the corporations or the bunkerers, is dependent on gangs of armed men whether
or not they are uniformed. This situation in the Delta is replicated in numerous
producing countries. And at the global scale, the invasion of Iraq, the plunder of
its treasury and the attempt to rewrite its legal framework in the interests of US
corporations, show that all is now the product of protection rackets.
REFINING ENVIRONMENTAL INJUSTICE
South Africa and Nigeria are the main centres of refining in sub-Saharan Africa.
Nigeria’s three refineries, operated by the state-owned Nigerian National Petroleum
Company, are badly managed and run at less than 50% efficiency. They do not
meet the demand for petrol even in Nigeria, let alone the rest of West Africa, so
much of the region’s demand is supplied from US refineries. In contrast, South
Africa’s refineries massively expanded production in the 1990s to supply growing
domestic demand and to export refined products to southern and eastern Africa.
South Africa’s own demand has since overtaken this expanded supply and several
new refineries are now proposed both in South Africa and in the region.
Petrochemicals in South Africa
The chemicals sector makes up a major slice of South African industry, producing
24% of the value of all manufacturing. This includes liquid fuels production that
dominates chemicals, producing close to 33% of value within the sector and creating
the feedstock for chemicals production. Liquid fuels are produced from imported
crude oil, coal and gas. Table 6.1 shows the location, ownership, fuel source and
capacity of the refineries. Sasol Chemical Industries, located primarily in Sasolburg,
uses the same technology as its Secunda CTL ‘synfuel’ plant to produce basic
chemicals. The process is particularly polluting and consumes about 41 million
tonnes of coal each year.
South Africa’s four crude-oil refineries are all complex, using ‘catalytic cracking’
to produce a higher proportion of high-value products such as petrol but at a
major cost to the environment. They are Sapref and Engen in Durban, Caltex in
Cape Town and Natref at Sasolburg. Natref is the only inland crude refinery and is
supplied by pipeline from Durban.

174
Toxic Futures
In 1995, over two thirds of the crude was sourced from Iran. Saudi Arabia is now
the largest supplier followed by Iran. These crudes have a high-sulphur content
with major implications for pollution. Since 2000, Nigeria has become an increasingly
significant supplier while South Africa itself has developed three small oilfields
and is the fourth largest source at less than 3%. Oil is South Africa’s biggest import
item, with around 21 million tonnes imported annually, most of it through the port
of Durban.
Structured for profit
Although privatised in 1979, Sasol remained intimately linked with the state both
before and after the political transition. With sanctions lifted, Sasol repositioned
itself as a transnational corporation in its own right. It has listed on the New York
Stock Exchange and has major investments in Europe, the US, China, the Middle
East and Africa. This expansion has been made possible by a massive accumulation
of subsidies at public expense, not to mention the additional subsidy of being
allowed to pollute.
Petroleum is dominated by transnational corporations – Shell, BP, Caltex and
Total – which were also complicit with apartheid and sanctions-busting. In return
for this co-operation, the state guaranteed corporate profits by regulating the price
of fuel in relation to the supposed costs of importing oil.5 As part of the deal, the
transnationals were required to buy Sasol’s synfuel to blend with their refined crude-
oil products while Sasol was restricted to a few symbolic pumps and could not
develop a significant retail market. Industry regulation has thus centred on pricing
and the use of Sasol’s synfuels. The pricing mechanism is still in place.
When the price of crude oil is low, as it was for most of the 1980s and 1990s,
Sasol’s synfuel is hopelessly uncompetitive. From 1989 to 2000, it enjoyed nearly
Table 6.1 Refineries and ownership in South Africa.
Refinery Location Owned by Fuel source
Calref Cape Town ChevronTexaco (Caltex) Crude oil
Engen Durban Petronas 80% & Worldwide AfricaInvestment Holdings 20% Crude oil
Sapref Durban Shell 50% & BP 50% Crude oil
Natref Sasolburg Sasol 64% & Total 36% Crude oil
Secunda Secunda Sasol Coal
Mossgas Mossel Bay PetroSA Gas

175
The chains of petro production
R8 billion in subsidies paid out of the ‘fuel equalisation fund’. Sasol was paid from
the fund when the oil price fell below a benchmark figure ($23 a barrel in 1995),
and was supposed to pay back into the fund if it rose above a second benchmark
($28 in 1995). In 1996, government announced that this subsidy mechanism would
be phased out. The last subsidy payment was made in 1999 when the price hit
bottom at $10. The escalation of prices since then reversed the competitive
relationship between synfuels and oil products because Sasol controls its own
supply of cheap coal and is insulated from rising global energy prices.6 It thus
enjoyed windfall profits guaranteed by the oil-based pricing mechanism. Sasol then
argued that the equalisation mechanism had lapsed so it did not have to repay the
subsidy.
Government did not quite share this view. It initiated a review of the equalisation
mechanism in 2000. It was not made public but apparently recommended that the
mechanism be retained – in other words, Sasol should pay back the subsidy. This
was revealed in the report of a second investigation, announced by finance minister
Trevor Manuel in March 2006, into whether Sasol should be slapped with an
additional tax on windfall profits. According to this report, the equalisation
mechanism was in fact based on a gentleman’s agreement. ‘When in 2003 Sasol
believed that it no longer required tariff protection it refused to reintroduce such
a “gentleman’s agreement” ’.7
The report also made clear that Sasol Synfuels, Natref and the oil refineries
more generally, secured numerous other hidden subsidies besides the equalisation
and pricing mechanisms: Natref did not pay for piping crude oil from Durban for
seventeen years; Natref also received oil from the strategic reserve at Ogies at cut
rates; Mossgas received about R1.5 billion from the equalisation fund; the benefits
to the oil majors from a deal cutting them into coal exports are not known; the
state over-invested in pipelines in the 1960s and 1970s and the costs have not been
recovered.
Sasol’s response suggested that more subsidies might be appropriate. It argued
that the international trend was to provide incentives for ‘alternative fuels’ and that
its subsidy paled beside those given to defence industries – R200 billion, mostly
paid before 1994 – and the motor industry – R90 billion paid out through the Motor
Industry Development Programme. In all, it said, the state had paid out some
R334 billion to industry between 1989 and 2000.
Deregulation8 of liquid fuels under the 1998 policy banner of competition and
industrial restructuring envisaged a three-phase ‘managed transition’ to ‘allowing
market forces to set prices’ in Phase 2, with government monitoring and measures
to correct market failures in Phase 3.

176
Toxic Futures
Phase 1 centred on terminating the requirement that the oil majors purchase
Sasol’s product and allowing Sasol independent access to the market. The most
immediate effect was a merger deal between Sasol and Petronas, owner of Engen,
together with their respective BEE partners, to form a new company called Uhambo.
The other oil majors – BP, Shell and Caltex – opposed the deal at the Competition
Tribunal and, in February 2006, the Tribunal refused to allow it. It found that
Uhambo would dominate the market, control most inland refining capacity and
also the existing pipelines from Durban, and entrench import-parity pricing that
enables Sasol to reap the windfall profits from the difference between its costs and
high-priced oil imports.
When, and whether, Phases 2 and 3 of the restructuring will take place is not
known. The policy is formally unchanged but the official view is that South Africa
is not ‘ready’ for deregulation.9 At the Uhambo hearings, Department of Minerals
and Energy (DME) officials indicated that the pricing mechanism would be
maintained well beyond 2010 to guarantee petroleum profits so that BEE partners
would be able to pay for their shares. Business Report’s Ann Crotty calculates that
this implies that ‘consumers are paying about R594 million a year towards the cost
of empowerment . . . a cost that is generally carried by the shareholders of
companies’.10 It does not follow that deregulation would benefit consumers. More
likely, regulated prices would be replaced by cartel prices.
Government, meanwhile, is building up another state-owned petroleum
enterprise within the Central Energy Fund (CEF) group of companies. PetroSA
was established in 2002 from a merger of the state’s exploration and refining
businesses. It owns the Mossel Bay GTL refinery and has relatively small gas and
oilfields off South Africa itself. Other CEF subsidiaries are the Strategic Fuel Fund,
responsible for securing supplies and ensuring reserves of oil, the Petroleum Agency
SA and IGas which respectively promote oil and gas exploration, and the Energy
Development Corporation, tasked with facilitating the development of ‘com-
mercially viable’ renewable energy projects.
For the industry, BEE has been critical to securing a ‘social licence’ to operate.
It creates a black interest group ready to defend industry interests and to take the
political offensive to legitimize profits. This is particularly necessary for the refineries
because local organisations have questioned the legitimacy of profits bought at the
cost of people’s health. The petroleum industry pioneered the concept of sector
empowerment charters with the Liquid Fuels Charter. It includes the target of
25% black ownership of the industry and all the corporations operating in South
Africa have moved rapidly to meet it.

177
The chains of petro production
The industry also makes much of its contribution to the South African economy.
Thus, the annual reports of individual corporations and of the South African
Petroleum Industry Association (SAPIA) give prominence to ‘value-added
statements’. SAPIA claims R44.6 billion as the combined value added for the industry
in 2006, up from R24.8 billion in 2001. They made R6.7 billion after tax, down on
2005 but close to double the profits of the early 2000s. State taxes, duties and levies
amounted to about R31 billion. Reflecting the capital-intensive nature of the industry,
salaries and wages – including the exorbitant remuneration of top directors –
account for less than 10% of this in most years.11
Box 6.2 Oil stain
South African corruption does yet not match Nigeria’s but it has grown very
rapidly. At local level, corruption has been named as a core grievance in many
of the so-called ‘service-delivery’ protests. Arms and oil have been at the centre
of higher-level corruption. A series of reports by the Mail and Guardian newspaper
showed that the ruling ANC received election funds through a front company
which diverted money meant to pay for oil consignments.
The story starts in 2001 when the company, Imvume Management, received
support in negotiating with Iraq for oil allocations from senior ANC office-bearers,
officials of the DME and a director of the Strategic Fuel Fund, the state agency
responsible for crude-oil reserves. The deal implied the exchange of diplomatic
support to Iraq for oil-supply deals, with the profits contributing to ANC funding.
This was followed by Imvume being awarded a contract for the delivery of Iraqi
oil by the Strategic Fuel Fund. The newspaper details a series of irregularities in
the tender process and concludes that the award was rigged. However, the
US invasion of Iraq put paid to these deals and the expected profits were not
realised.
Following its establishment in 2002, PetroSA immediately awarded Imvume
a contract to supply oil condensate to the corporation’s Mossel Bay GTL refinery.
Imvume acted as a go-between in these deals, buying the oil from resource
trader Glencore. Several cargoes were delivered in terms of this arrangement. In
December 2003, Imvume requested, and was granted, an advance payment of
R15 million from PetroSA for the next cargo. Five days later, it donated R11 million
to the ANC, which was then short of funds for its 2004 election campaign. But

178
Toxic Futures
Expansions
The formidable process of refinery expansion is shown in Table 6.2. Despite this,
SAPIA warned in 2005 that the local refineries will not be able to meet rising
demand for petrol and diesel in the countries of the Southern African Customs
Union – South Africa, Namibia, Botswana, Lesotho and Swaziland – by 2010. The
deadline arrived early starting with diesel imports in 2005. By 2008, South Africa
was importing about 1.4 billion litres of petrol, diesel and kerosene. Demand for
diesel was stoked up first by the Western Cape electricity crisis and then by the
national crisis as Eskom used its Open Cycle Gas Turbine (OCGT) generators,
normally reserved for peak demand, as a substitute for base-load while private
corporations brought in diesel backup generators.12
In late 2005, and coinciding with the start of the Cape Town power blackouts,
fuel shortages hit several areas of the country. The causes were largely technical,
relating to a switch-over to tighter fuel standards – ‘Cleaner Fuels Phase 1’ – and
failures of refinery planning. Government was duly alarmed at the prospect of
future shortages. A DME study estimated that a complete collapse of supply would
cost the country close to a billion rand a day and the department then developed
its Energy Security Master Plan: Liquid Fuels (DME 2007).
In the plan, the priority for growth is absolute. The document uses ‘affordability’
to link poverty alleviation to growth, emphasising that energy is a ‘strategic input
to a resource-intensive South African economy’ (14). In contrast to most economic
planning documents, the master plan repeatedly refers to environmental
management and climate change. However:
Imvume failed to pay Glencore for the cargo. Under threat of having the next
cargo withheld, PetroSA then paid Glencore directly. The Mail and Guardian
reporters conclude: ‘The effect of the entire transaction was that PetroSA, and
ultimately the taxpayer, subsidised the ruling party’s election campaign: a blatant
abuse of public resources.’
The ANC, Imvume, SSF, DME and PetroSA all denied wrongdoing and the
ANC and Imvume each served notice of court actions against the newspaper.
This seems to have been a bully tactic as they have not followed through with the
actions.
Source: Reports by Stefaans Brummer, Sam Sole and Wisani wa ka Ngobeni in Mail and
Guardian, 20–26 May 2005; 15–21 July 2005; 22–28 July 2005.

179
The chains of petro production
In the short-term, South Africa cannot sacrifice its development at the
altar of the environment but in the long-term, unless South Africa,
along with the rest of the world, does something about global warming,
its own economy is threatened by climate change (31).
It also sounds a warning on oil depletion: ‘a transport strategy that is over 90%
dependent on oil is guaranteed to land South Africa in serious trouble in a few
years’ time. No form of planning will find South Africa oil, when it has all been
mined or acquired by those with more might or insight’ (8). As with global warming,
however, peak oil is effectively treated as a long-term issue and deferred to the
future.
The plan proposes a range of interventions, most of which were already being
pursued. Fuel transport and storage infrastructure is to be massively expanded. A
proposal for a privately operated pipeline to import refined product through Maputo
to Gauteng was approved in 2007 while a high-capacity ‘multi-product pipeline’
from Durban to Gauteng is a major component of Transnet’s infrastructure
programme. Rail-transport capacity and port-handling capacity is also under
construction. Finally, the plan calls for an expansion of refining capacity.
Sasol is obliging with a 20% increase – to 180 thousand barrels per day – in
synfuel production at Secunda. This is part of a broader expansion, including
chemical production, dubbed Project Turbo. The pace of expansion was retarded
first by the ‘instability’ of new plant and then by cuts in capital spending as Sasol
reacted to the collapse in oil prices in 2008. This delays the scale-up in production
Table 6.2 Refinery expansions 1990 to 2004.
Capacity in thousand barrels per day (or equivalent)
1990 1992 1993 1994 1995 1998 2001 2002 2003
Calref 50 90 100Engen 67 85 105 125 150*Sapref 120 165 180Natref 78 86 108*Secunda 150Mossgas 45
Total 510 528 536 556 641 656 676 708 733
Compiled from industry sources
* Engen currently runs below capacity at a nominal 135 thousand barrels per day while Natref’sproduction was cut to 92 thousand barrels per day consequent on the 2009 power shortages.
180
Toxic Futures
but does not reduce it. In 2007 Sasol was also talking up the need for a new
inland refinery and initiated feasibility studies for Project Mafutha, an all new
80 000 barrel-a-day CTL plant that would require a whole new Sasolburg. The
Waterberg area in Limpopo province, where Eskom is already polluting the air, is
the favoured site. Being a dry area, CTL’s exorbitant water demands can only be
met through massive cross-watershed transfers as will be discussed in Chapter 8.
Irrespective of the oil price, PetroSA has pushed its Mthombo crude-oil refinery
as hard as it can. In 2007, it announced its ambition to build a new 200 000 barrel-
a-day refinery at an estimated cost of R39 billion. A month or so later, it said that
the Coega Industrial Development Zone (IDZ) had ‘won’ selection as the preferred
location in competition with four other sites, an outcome that appeared pre-
determined. The scale of the project has since expanded to a 400 000 barrel-a-day
behemoth initially estimated to cost $11 billion. This estimate was then reduced to
$10 billion as steel and other input prices declined. Given the volatility of both the
exchange rate and input prices, these figures imply a cost of somewhere between
R70 and R120 billion.13 That is assuming PetroSA got its figures right in the first
place and there are no cost escalations along the way. In 2009, PetroSA lined
up with every other state-owned corporation to ask the Treasury for funding
support. It is also looking for partners to invest up to 63% in the refinery but
suggests that government may, for strategic reasons, prefer PetroSA to retain a
controlling interest of over 50%. It also wants control of crude inputs and has
signed a joint venture with Venezuela’s PDVSA and held talks with Angola’s
Sonangol amongst others. BP and Shell oppose the project, arguing that there is
now a global surplus of refining capacity and it would be cheaper to import than
build a new refinery.
PetroSA says Mthombo will be designed to refine low-quality crude to high-
quality liquid fuel specifications while yielding a high proportion – up to 90% by
volume of crude – of light high-value product. The large quantity of sulphur and
other pollutants in heavy sour crude must find a destination other than the fuel
product – the atmosphere, solid waste, the already saturated sulphur market or
bunker fuel for ships. The Environmental Impact Assessment (EIA) for the project
was expected to start in 2009 but appears to be delayed. Halliburton subsidiary
KBR,14 fingered for corruption in Nigeria, has been appointed as the lead engineering
consultant for the project.

181
The chains of petro production
High-tech pin-up
Sasol is the poster boy of South Africa’s industrial strategy. Set up by the apartheid
government in the 1950s, it developed the only commercial CTL plant in the world
together with a string of heavy chemicals plants. It is now positioned as a global
technology leader, active in 35 countries and linked into global production networks
through partnerships with a range of leading transnational corporations, including
ChevronTexaco, and state-owned corporations such as Qatar Petroleum. Its exports
are founded on high-value chemical-design services as much as on the export of
commodities – primarily coal and heavy chemicals.
The corporation made hay in the global sunshine of high oil prices. In
partnership with the Shenhua Ningxia Coal Group, it is planning to build an 80 000
barrel-a-day CTL plant in China. The project is now in the feasibility stage. It has
entered a similar partnership in India with the Tata group. In March 2009, the
partnership secured a massive coal block in Orissa state, so opening the way for a
pre-feasibility study for another 80 000 barrel-a-day CTL plant. In Indonesia it has
initiated preliminary studies for a CTL plant while in the US it has joined with local
corporations to lobby for government handouts for new synfuel plants. In South
Africa, government waived the windfall tax and agreed that it would facilitate
expansion while Sasol would undertake the feasibility studies for the Mafutha CTL
plant. Mafutha is advertised as a partnership with the IDC. Sasol is also in a leading
position on the development of gas-to-liquid (GTL) plants. Its new Oryx plant in
Qatar, a joint venture with state-owned Qatar Petroleum, is the largest in the world
though soon to be overtaken by Shell’s neighbouring Pearl plant. It is also building
a GTL plant in the Niger Delta in partnership with Chevron and has recently
signed a joint venture with Uzbekneftegaz and Petronas to look at building one in
Uzbekistan. It plans another GTL plant in Canada where it has joined the rush for
shale gas through a partnership with Talisman Energy. It then hopes to bring
‘fracking’ home to South Africa to produce the feedstock for yet another plant.
Rebranding itself as an environmental leader is perhaps Sasol’s greatest
innovation. Within the discourse of ecological modernisation – the World Bank’s
version of sustainable development – it has indeed made significant improvements,
but off an appalling base. The essential problem for Sasol is that its processes are
inherently energy-, carbon- and pollution-intensive.
For GTL, production is more energy-intensive than oil refining but Sasol claims
that the superior performance of GTL fuels offsets higher carbon emissions at the
plant. Over the life cycle of production and consumption, ‘total [greenhouse gas]
emissions of the GTL system may vary between 12% less and 11% more than the
refinery system, depending on assumptions about the nature of the operating

182
Toxic Futures
conditions’ (Sasol SDR 2006: 21). Sasol claims more significant reductions in sulphur
dioxide, nitrogen oxide and volatile organic compound emissions from GTL.
‘The case for promoting coal,’ according to Sasol, ‘is strengthened by the
development of clean-coal technologies and the need for energy security’ (Sasol
SDR 2006: 20). For CTL, ‘clean coal’ comes down to carbon capture and storage
(CCS) and a choice of integrated gasification combined cycle (IGCC) or gas to
power the plant itself. Regrettably, neither CCS nor coal-fired IGCC are proven
technologies. Be that as it may, Sasol compares three variations of CTL plants –
coal-fired plants, IGCC-fired plants and gas-fired plants – with a standard refinery.
It then runs the comparison again using CCS with each type of CTL plant. In
Table 6.3, the numbers are relative to a refinery set at 1.0.15
The results of its studies show that a conventional CTL emits 2.5 times as much
CO2e as a conventional refinery. The credibility of this claim seems doubtful. In
2004,16 Sasol’s Secunda plant emitted 52 million tonnes of CO2 while the larger
Sapref refinery emitted one million tonnes. With CCS, it claims that CO2e emissions
drop to 1.5 times those from a refinery. The combination of IGCC and CCS yields
the lowest greenhouse gas emissions, a little below the level of a conventional
refinery.
In short, on Sasol’s own information, replacing conventional oil with GTL or
CTL, however modified, presents no climate change advantage over the conventional
oil system that got us into the climate crisis in the first place. These results should
also give pause to those who have advocated, however reluctantly, CCS as a last-
ditch solution. Even assuming the carbon stays where it is put, CCS does not
necessarily reduce greenhouse gas emissions to anywhere near zero.
Pollution
The petrochemical plants produce massive wastes to air, water and land. All boast
continuing environmental improvements. These improvements are off a very poor
base. Under apartheid, they had a virtually unlimited licence to pollute. The walls
Table 6.3 CTL CO2e emissions compared with a conventional
refinery = 1.0.
CTL Coal-fired IGCC-fired Gas-fired
Without CCS 2.5 1.5 2.0With CCS 1.5 0.8 1.0
183
The chains of petro production
of secrecy started to crumble in the 1990s and national and local environmental
justice organisations began putting real pressure on the corporations and on
government. Much more is now known about the extent of pollution but this is
very uneven. Information still relies heavily on what industry chooses to reveal or
is forced to reveal. This means that most is known about those areas where resistance
is most active.
Sasol’s Sustainable Development Reports (SDRs) give aggregate figures on
worker safety and environmental wastes for its global operations but do not break
the figures down for specific sites, plants or component businesses. Since it claims
real reductions of some pollutants at some plants, it is curious that it will not
release site-specific figures.17 Its reporting is thus of limited use to local communities
but responds to the corporate social responsibility framing of global institutions
and business organisations.18 The corporation’s Sasolburg Health, Safety and
Environment brief quantifies solid wastes produced by Sasol Chemical Industries
and Natref but not air emissions. It has not been updated since 2006. Sasol has not
produced a similar brief for Secunda although this plant produces 90% or more of
its global wastes and is the largest single source emitter of carbon dioxide in the
world.
Sapref and Engen now publish information on source emissions and other
wastes from the Durban refineries. Their reporting is clearly designed to respond
to – and often to rebut – local criticisms. The refinery wastes appear small by
comparison with Sasol. The latter’s coal-based process is undoubtedly the filthiest
way of producing either fuel or chemicals. Nevertheless, Sasol’s figures largely
represent the integration of extraction and production whereas the refinery figures
exclude the appalling costs of oil extraction in other countries. Engen claims that
it produced no high hazard waste (H:H) in 2006 but does not report ‘low hazard’
(H:h) waste. Sapref avoids specifying what proportion of its waste is hazardous.
Chevron gives no account of its environmental wastes and has consistently
reneged on promises made to local environmental activists to reduce emissions.
PetroSA is a state-owned corporation but its annual reports show no sense of
public accountability in respect of the environment and say nothing about its wastes.
Information is also contested. Industry has on occasion been forced to admit
under-reporting – as when Sapref admitted in 2000 that it had under-reported
sulphur dioxide emissions by 12 tonnes a day for the previous five years.
Government, however, has not developed its own capacity to verify or dispute
industry claims on pollution from source. Unless it does so, the credibility of basic
data will remain suspect.

184
Toxic Futures
Table 6.4 is constructed from industry reports or direct communication with
the refineries. It shows some improvements in source emissions over previous
years. The Durban refineries made environmental improvements conditional on
expansions. They have reduced sulphur dioxide emissions in absolute terms but
improvements in the rate of emission of some substances, such as nitrogen oxides,
have been offset by expanded production. Sasol is converting from coal to gas,
extracted from Mozambique, to fire its synfuel plants and as the feedstock for
chemicals production in Sasolburg. This mitigates the astronomical pollution from
coal-based processes but emissions remain high even by the standards of the oil
industry.
Sasol’s recent SDRs leave out the mountains of ash produced each year,
previously reported at over 10 million tonnes (mt) in Secunda and 1.8 mt in
Table 6.4 Wastes from selected petrochemicals in 2006 (tonnes).
Pollutant Sasol Sasol Sasol Sasol Chevron Sapref EngenGlobal Synfuel Chemical Total Calref
(Secunda) Industries Natref
Air 2006 2004 2004 2004 2004 2006 2006
Carbon60 009 000 52 164 000 8 872 000 829 000 746 479 978 000 930 385
dioxide
Sulphur223 000 189 923 30 989 1 333 4 940 4 015 4 668
dioxide
Nitrogen162 000 148 300 25 824 686 953 1 301 1 935
oxide
Hydrogen78 000 85 682 16 496
sulphide
Particulates7 560 6 128 1 218
583 85 255(flyash) (flyash)
VOCs 461 000 409 783 17 663 2 189 3 529 971
Solid2006 2006 2006 2006 2006
Waste
Hazardous 270 000 5 755 880General 1 126 000 11 557 2 391
Unspecified 6 335
Notes:Figures are for direct emissions and do not include emissions associated with electricity consumption.Engen and Sapref report average daily emissions from which the annual figure is calculated.Sasol now reports methane under greenhouse gases rather than volatile organic compounds (VOCs) butthey are here returned to the VOC line and make close to half the total.

185
The chains of petro production
Sasolburg. This is because Sasol is now ‘recycling’ its ash by selling it off to
brickmakers. The ash contains various toxic residues, including heavy metals such
as mercury, that leach from the dumps and into water, so recycling this ash should
result in local environmental benefits. Nevertheless, the toxic residues will remain
in the bricks and, as with PPC’s cement, are dispersed into the built environment
and will be released over time. Sasol is now also selling spent catalyst and waste
waxes to clay brickmakers. This contributed to a substantial reduction in hazardous
waste from its Sasol 1 site from 14 851 tonnes in 2005 to 4 257 tonnes in 2006. The
corporation makes no comment on the final fate of the toxic material. As with ash
bricks, however, this is effectively a strategy of dispersing toxic waste in space and
time.
Catalysts are used to create chemical reactions in both the refining and chemicals
industries. In Sasol’s process, catalysts react with ‘syngas’ to produce synfuels and a
variety of chemicals. The catalyst is designed for specific processes but is generally
composed of grains of metal oxide coated with other metals. Commonly used
minerals include iron, aluminium, nickel, cobalt, vanadium and potassium. In
production, the catalyst is contaminated and is constantly regenerated until it is
degraded beyond use. Waste catalyst is choked with heavy metals and is highly
toxic.
Sasol’s Natref refinery is now disposing its waste catalyst to recently established
waste-recycling companies for export ‘to companies abroad for metal recovery
and final treatment’ (SH&E 2005: 7). ‘Abroad’ is in fact China. This has reduced
the refinery’s toxic waste from 4 000 to 880 tonnes a year. In so far as the metals
are recovered, this is likely to result from the commodity boom creating high metal
prices. A sharp drop in metal markets, as in 2009, might collapse such enterprises
and so return the problem to Sasol – or leave it at sea.19 It should also be recalled
that toxic-metal recovery has a poor record as was demonstrated at Thor Chemicals.
The problem of toxic waste may therefore be transferred to the workers in the
metal-recovery factories. Given the documented experience of IT recycling in
China, it is possible that a proportion of the waste is simply dumped on arrival
depending of the recoverable value.
Engen has increased its consumption of catalyst but claims zero H:H waste.
This is achieved by ‘de-listing’ H:H to H:h waste which is then dumped at Bulbul
Drive landfill. It is not clear how the metals in catalyst waste can be treated to
warrant the de-listing. Replying to queries from groundWork, Engen said that catalyst
waste batches are variable and it may not always be possible to de-list. In this case,
it would be disposed to an H:H site. Engen is also exploring the possibility of

186
Toxic Futures
recycling catalyst wastes that have ‘a lot of monetary value due to their constituents’.
It justifies this also in terms of the requirement for waste reduction.20
Water pollution from these processes is intense. All plants produce effluent
and say the quality of their effluent is within their permit conditions. These permits
are in many cases ‘exemptions from the general standard’ – meaning that they are
permitted to meet lower requirements than in the national regulations.
The figures in Table 6.4 show normal emissions from normal operations.
Abnormal incidents are pretty normal too. Fires, explosions, gas leaks spills and
excessive flaring occur with appalling regularity at the petrochemical plants. Sasol’s
Polymer plant in south Durban leaked clouds of chlorine gas over the
neighbourhood on five successive occasions in 1999 and 2000. In south Durban
2001 was another bad year with four major fires, five major flaring incidents, five
oil spills and nine chemical spills. In the worst spills, Sapref lost 26 tonnes of tetra
ethyl lead – which is as toxic as it sounds – from a badly maintained tank. Later
that year, it spilled between one and two million litres of fuel from a pipeline
buried under a residential street. The spill forced the evacuation of local people
and marked the beginning of a lengthy struggle to make Sapref replace its 40-year-
old pipes rather than just patch them. These were two of twenty-six spills from the
Engen and Sapref refineries recorded by the South Durban Community
Environmental Alliance (SDCEA) from 2001 to the end of 2004, not including
spills from road tankers.
Toxic air releases, usually through the flares, are as common as spills. Such
incidents are interspersed by earth-shaking explosions followed by fires. In south
Durban 2007 was a year of fire. At the Island View chemical storage on Durban
docks a series of explosions ripped through eight tanks that burnt through the
night of 18 September. The air was thick with chemical smoke and fish turned up
dead in the water a few days later. Three major fires at Engen spread fumes and
soot across the neighbourhood. In July, a fire in the alkylation unit was caused
when a corroded metal flange failed. In November, a storage tank was, according
to management, struck by lightning and burned for three days. Just a week later, a
leak at the lubricants plant caused an explosion and a fierce, if brief, fire. At Sapref,
in November, a fire broke out in the catalytic cracker unit. The fires have not
stopped. In November 2008 another major fire at Engen’s crude-oil feed shut
down the entire refinery for weeks.
The Chevron Refinery’s neighbours in Cape Town fare no better. Apart from
the gas clouds, they have had crude oil raining down on them. It got so bad that the
Green Scorpions broke the official silence on incidents in 2006. They invited
groundWork and the Table View Residents Association to a meeting to discuss

187
The chains of petro production
measures for dealing with the refinery and revealed a stack of incident reports
from the past three years.
Sasol’s inland plants are, if anything, even more dangerous. A massive fire closed
the Natref refinery in Sasolburg for several months in 2001. Sasol’s record in 2004
was particularly dismal. At least fourteen people were killed in a series of incidents,
four of which were particularly serious: In June, a gas liquor-storage tank exploded
at the Phenosolvan facility in Secunda. In July, Sasol Collieries was rocked by an
explosion. In August, a Sasol gas pipeline ruptured at the Gateway Industrial Park
and the flames shot more than 30 metres into the air. The most serious incident
was in September. Ten people died and more than one hundred were injured in an
explosion at the Sasol Polymers’ ethylene plant in Secunda. Sasol then initiated a
major safety programme. Nevertheless, from a low of fifteen in 2006 the number
of reported ‘fires, explosions and releases’ has increased steadily to thirty-six in
2009. Following the ethylene plant explosion, Labour Minister Membathisi
Mdladlana said that if Sasol killed any more people he would shut them down.
They have. He hasn’t.
The SDCEA put the spotlight on excessive flaring from 2003. Flares are
necessary safety valves in case of a build-up of explosive gases but, in the US, the
Environmental Protection Agency found that they are frequently used to evade
limits on emissions, for example, by burning off unwanted sulphur at night. The
South African regulators would not have the capacity to detect such practices if
they occur in South Africa.
Following tighter regulation, the Engen refinery reported 109 flaring incidents
in 2003. Sapref reported just one because it regards all flaring as ‘normal’ unless
caused by an external event. People in Durban remember 21 April 2004 as ‘black
Wednesday’. A power failure resulted in Sapref shutting down and a dense plume
of smoke from the flare spread over the city. Sapref said there were no ill-effects
beyond irritation from smoke and odour. No one believed them.
Box 6.3 Disputed production
The Comparison of Refineries in Denmark and South Durban in an Environmental
and Societal Context: A 2002 Snapshot was produced by Danmarks
Naturfredningsforening (DN) and SDCEA. It includes a technical comparison of
the refineries based on information supplied by the refineries. At the launch, the
Durban refineries attempted to block publication and have subsequently sought
to discredit the report claiming technical inaccuracies.

188
Toxic Futures
The central point of contention related to the refinery technologies. In a paper
to the World Congress on Environmental Health in February 2004, Engen’s
Sustainable Business manager Alan Munn, complained that:
The study compares the performance of two simple hydro-skimming
refineries in Denmark, that process low sulphur North Sea crude oil, with
two large complex refineries in South Durban processing higher sulphur
crude oil from elsewhere. This is like comparing a single engine aircraft
with a jumbo jet and trying to draw meaningful conclusions. For example,
for the authors to suggest that catalytic crackers, which are the heart of
any modern refinery, are obsolete is ridiculous (2004).
The study is, in fact, at pains to point out the difference (DN and SDCEA 2003:
21) and does not suggest that the catalytic crackers are obsolete. It says:
The quality of crude oil has wider implications because it determines the
limits on technology options . . . The additional production units necessary
to fully exploit the lower quality crude – particularly the cat cracker – are
major sources of particulate and sulphur dioxide pollution (45).
It goes on to encourage the use of high-quality crude inputs and suggests that
the cat crackers could then be sacrificed in the interests of reduced pollution. It
clearly indicates that this would also involve a sacrifice in the proportion of high-
value products – particularly petrol – produced from each barrel of crude and
hence also of refinery profits.
There would certainly be broader implications to such a decision. First, South
Africa’s vehicle fleet would need to shift from a bias to petrol to more efficient
diesel. Second, applied globally, it would imply a radical reduction in usable oil
reserves and so push the transformation of energy and transport systems. This
transformation is essential if catastrophic climate change is to be avoided.
At another level, the dispute brings into focus the question of who makes
society’s technology choices. At present these choices are largely made by
corporations. For the refinery managers this is only natural and their response to
the report perhaps indicates some shock that anyone should have the temerity to
challenge this prerogative. For civil society, the deeper question must be how to
democratise production and what technologies are compatible with such
democratisation.

189
The chains of petro production
Burn-up
The petrochemical corporations sell around 30 billion litres of refined product
annually. At the end of the fuel chain, most of it goes into vehicles. They burn the
largest part of hydrocarbons and contribute proportionately to air pollution. In
2006, government introduced cleaner fuel regulations to eliminate lead in petrol,
and thus also enable the use of catalytic converters that reduce a range of other
pollutants from vehicle exhausts, and to reduce the permitted sulphur content in
diesel from 3 000 to 500 parts per million (ppm). In a second phase, this will be
further reduced to 50 ppm. These improvements are driven as much by new engine
technologies as by environmental concerns and are linked to South Africa’s strategies
in manufacturing cars and catalytic converters. The regulations should mitigate
pollution particularly in congested urban areas although this will be partly offset by
expanding demand. As with the refinery improvements, however, they are off a
low base. European regulations now have an upper limit of 50 ppm sulphur content
and require the introduction of 10 ppm in both diesel and petrol.
The reduced sulphur content implies the removal of more sulphur at the
refineries. Refineries can no longer legally vent the difference in the form of
increased sulphur dioxide emissions. Globally, intensified regulation has created a
glut on the sulphur market since the production of sulphur is now driven by the
demand for petroleum rather than for sulphur.21 If this additional sulphur cannot
be sold, it becomes a waste product. The main market for sulphur is agricultural
chemicals and the sulphur industry is pushing it aggressively. Stripping the sulphur
out of fuel thus relates to the continued practice of toxic farming. No doubt
following the lead of Northern refiners of low-quality crudes, South Africa’s coastal
refineries have found a way out by concentrating surplus sulphur into bunker fuel.
It will thus convert into intensified sulphur dioxide emissions from ships and be
dispersed over the sea – out of sight, out of mind, beyond regulatory authority.
Natref described this as an unfair competitive advantage in order to argue that it
should be subject to less stringent fuel standards. It is rather better described as
environmental hooliganism.
CHEMICALS AND PLASTIC
Apart from liquid fuels and tars, petrochemicals are the source of all carbon-based
or ‘organic’ chemicals. They are used in the manufacture of an extraordinary array
of products including agricultural fertilizers, herbicides and pesticides, all plastics
and most rubbers, synthetic textiles, explosives, medical products, cosmetics,
detergents, paints, varnishes, waxes, glues and solvents. There are two other primary

190
Toxic Futures
sources for chemicals: those derived from plants are largely used in the
pharmaceuticals and cosmetics industries and ‘inorganic’ chemicals derived from
minerals are used to produce chlorine, caustic soda, acids and fertilizers.22
Chemicals from different sources are mixed in production. The endless
manipulation of molecules, the basic building blocks of chemistry, results in some
2 000 new products coming on to the global market each year, many of which are
toxic. Chemicals are also pervasively used in production processes, including the
production of other chemicals. In the process, they are contaminated and so become
unusable and often end up as toxic wastes from production.
Sasol dominates production of primary chemicals. It has six distinct chemicals
businesses with production plants in the US, Europe and East Asia in addition to
the Sasolburg and Secunda plants. The products are marketed globally, mostly
supplying chemicals for industrial use. Here we focus on the plastics production
chain.
Box 6.4 Making plastic
Plastics are produced from polymers which, in turn, are produced from monomers.
Monomers are composed of simple chemical molecules. Catalysts and energy
are used to produce long-chain molecules that make up polymers. Thus, ethylene
is a common monomer and the basic molecules can be joined up to create the
polymer polyethylene. However, not all polyethylenes are the same: the longer
the chain composing the molecule, the higher the density of the polyethylene.
High-density polyethylene is used to make thicker and more rigid plastics while
low-density polyethylene is generally used to make flexible light products such
as film-wrap.
The most common monomers are ethylene, vinyl, styrene and propylene.
Where a polymer is made from two or more monomers it is called a copolymer.
Polymers are also combined with other chemicals such as chloride used in polyvinyl
chloride (PVC). Finally, various other chemicals can be added in the process of
producing polymers or plastics: plasticisers such as phthalates are used to add
flexibility, pigments are added for colour and flame retardants are added to
products subject to heat. The mix is called a resin and is sold in the form of
liquids, solid rods or pellets, as the raw material for plastic fabricators or
‘converters’.

191
The chains of petro production
According to the Plastics Federation of South Africa (PFSA),23 the South African
plastic industry consumes over 1.1 million tonnes of polymers a year of which
800 000 tonnes are produced from Sasol’s monomers. Sasol is the only producer
of monomers and the largest producer of polymers. As part of Project Turbo,
Sasol Polymers has nearly doubled its capacity. Like monomer production, polymer
production is capital- and energy-intensive and there are just three other producers:
Safripol (formerly Dow Plastics) located in Sasolburg, SANS Fibres in Cape Town
and Hosaf Fibres in south Durban. Converters are considerably less capital-intensive
and there are some 850 firms ranging in size from small local firms to transnationals.
Power within the industry lies upstream, primarily with Sasol but also with
Safripol. While state regulation of the petrol price awards import-parity pricing to
Sasol’s fuel business, both Sasol and Safripol impose import-parity pricing on
polymers that are not regulated. Sasol is the monopoly producer of low-density
polyethylene and PVC while Sasol and Safripol share the market for high-density
polyethylene and polypropylene. Industry analyst Ralitza Dobreva, writing shortly
before Dow’s sale to Safripol, observes that the behaviour of Sasol and Dow is
‘implicitly coordinated’ as ‘their prices are consistently in line . . .’ (2006: 9). In
short, they operate as if they were a monopoly and, like ArcelorMittal, use import-
parity pricing to appropriate added profit equivalent to the transport, handling and
tariff costs of polymer imports. SANS and Hosaf both produce polyethylene
terephthalate, used to make soft drink and water bottles, and must either import
the ethylene monomer or buy it from Sasol.
While profits are concentrated upstream in the industry, labour is concentrated
downstream. According to Dobreva, the plastics industry employs 35 000 people
with 30 000 employed downstream. At both Sasol and Dow, new investment has
been associated with labour shedding or with dramatically increased output per
worker. Sasol Polymers reports a 26% increase in production per employee from
2006 to 2007 following the investment in Project Turbo. Dobreva concludes that
policy should aim for the expansion of the downstream industry in the interests of
job creation and this recommendation is reflected in the Department of Trade and
Industry’s (DTI) Industrial Policy Action Plan (2007). The longer-term benefits are
doubtful, however. Expansion would certainly be accompanied by mergers and
acquisitions predicated on expanding economies of scale and increased labour
productivity. It thus appears as a short-term response that will reproduce job-
shedding growth over the longer term.

192
Toxic Futures
Plastic and packaging
Packaging consumes 52% of plastics by value. For their part, plastics make up 70%
of the R29 billion packaging market and are rapidly expanding production and
market share. In its submission to the parliamentary portfolio committee hearings
on the Waste Bill, the packaging industry claimed it had ‘achieved impressive results’
in reducing, re-using and recycling packaging in accordance with the waste
hierarchy.24
Reduction is claimed because the weight of such items as beverage cans and
glass and polyethylene teraphthalate bottles has been reduced over time. Reduced
weight reduces the embodied energy, and hence production wastes, in such items
as well as the energy required for transport. The growth of the industry, however,
means that the number of items and the total volume of packaging material are
rising rapidly. As a whole, the industry now consumes two billion tonnes of raw
material a year. Plastic is held to be particularly virtuous for its lightness and the
substitution of plastics for other materials is claimed as environmental progress.
What is not said is that reduced weight is not associated with reduced embodied
energy in the substitution. Corporate Accountability International comments
caustically that a water bottle embodies energy equivalent to filling a quarter of the
bottle with oil25 while the Berkeley Plastics Task Force notes that producing one
polyethylene teraphthalate bottle results in ‘more than 100 times the toxic emissions
to air and water than making the same size bottle out of glass’ (Stover, Evans and
Pickett 1996: 11).
The plastics industry claims to recycle 33% of plastic packaging, implying that
66% is destined for dumping. The bulk of what is recycled would appear to be
factory waste – off-cuts and trimmings from the plastics production floor – and
industrial packaging. Consumer waste is rather less easy to recycle but is nevertheless
the focus of industry PR aimed to justify plastic in environmental terms. The
underlying strategy, however, continues the core business of expanding the market.
Understanding this requires a step back in time to see how, as Heather Rogers
puts it, ‘today’s polymer-laden reality is not simply the inevitable outcome of some
natural process; it is the direct result of an industry that was nurtured by massive
public spending, unrelenting lobbying, and sophisticated public relations’ (2005b).
In the two decades after the Second World War, the industry discovered the virtues
of packaging designed for dumping. Returnable glass bottles, for example, were re-
used up to 40 times. Single-use plastic, glass and can throwaways thus made for a
massive expansion in the market and in profits. Emphasising that the industry
should aim for ‘low cost, big volume, practicability, and expendability’, one far-

193
The chains of petro production
sighted participant told his colleagues at a plastics conference in 1956: ‘Your future
lies in the garbage wagon!’ (quoted in Rogers 2005a: 121). To make this future, they
had to persuade people who were used to mending and re-using things that throwing
them away was the natural thing to do. They had to make people think of themselves
as consumers.
Throwaways, together with the massive expansion of long-distance transport
infrastructure, also enabled market concentration and centralisation. Returnable
bottles were generally tied to local markets within easy transport range of bottling
plants where they were refilled. Throwaways thus became a weapon in the hands
of large corporations as they centralised production and used their financial clout
to undercut and bypass local bottlers. In the two decades following the war, Coke
and Pepsi established dominance in the soft-drinks market while the number of
brewers in the US dropped from 400 to 100. A study for the US Environmental
Protection Agency confirmed that this trend to monopolisation was ‘encouraged
and permitted by the introduction of nonreturnable bottles’ (Rogers 2005a: 137).
The US packaging industry responded very quickly to environmental campaigns
against the ever-growing torrent of waste. It launched Keep America Beautiful in
the early 1970s, ran advertising and ‘education’ campaigns on the virtues of plastic
and funded lobbyists to prevent legislative restrictions. Finally, it initiated industry-
driven recycling and re-advertised itself as a green champion. The strategies honed
in the US have been repeated around the world and the Plastics Federation of
South Africa (PFSA) has taken up the US slogan: ‘Plastics don’t litter, people do!’
The problem is thus individualised and confined to the domain of consumption in
order to deflect questions about production and the structuring of markets.
The PFSA was established in 1997, in time to participate in the final round of
lobbying on the National Environmental Management Bill as well as in the drawn-
out waste-policy process. Mimicking the message of the US industry, it advertises
its recycling initiatives as reducing waste in support of the waste hierarchy. Yet the
intention of expanding waste is evident in its explicit promotion of incineration.
According to its website: ‘We need to recover as much as we can for recycling or
energy recover’ [sic]. The Department of Environmental Affairs and Tourism
(DEAT) added ‘energy recovery’ to the waste hierarchy in the Waste Bill brought
to parliament in 2007 and so elevated waste-to-energy incinerators above disposal.
Incinerators, however, demand the waste that feeds them, particularly if they produce
energy, and so subvert the waste hierarchy’s first priority to avoid creating waste.
In the energy sector, plastic and paper are known as ‘non-energy’ because they
are produced from energy resources. Plastic has a much higher energy content

194
Toxic Futures
than paper. In 2004, eThekwini waste managers argued that the South African
waste stream does not have a high enough proportion of plastic to make energy
production from waste incineration viable. The reason given is that most South
Africans are poor.26 If poor people do not throw enough plastic into the bin, rich
people certainly do and it ends up in dumps located in the neighbourhoods of the
poor. Incinerators will be similarly located. In promoting incineration, both
government and industry are promoting a particular meaning of ‘development’:
that it produces more waste and more energy-intensive plastic waste in particular.
Development, as the idea of ‘a better life for all’, is thus made to serve the active
construction of the market in throwaway packaging. Such development, however,
is not only unsustainable on environmental grounds. It also produces, rather than
alleviates, poverty and inequality.
Behind this better life lies never ending brutality. In September 2005, activists
from across Africa met in opposition to the Eighteenth World Petroleum Congress
in Sandton, Johannesburg, whose theme of ‘shaping the energy future’ sounded
more ominous than reassuring. They responded:
As the bosses of big oil gather in South Africa for the 18th World Petroleum
Conference, concerned citizens and activists around the world unite to
condemn the oil industry. At every point in the fossil fuel production chain,
where the bosses ‘add value’ and make profit, ordinary people, workers
and their environments are assaulted and impoverished. Where oil is drilled,
pumped, processed and used, in Africa as elsewhere, ecological systems
have been trashed, peoples’ livelihoods have been destroyed and their
democratic aspirations and their rights and cultures trampled.
195
Power trip
7
Power trip
CAPE TOWN’S POWER is supplied through the long transmission lines from
Mpumalanga and from the Koeberg nuclear power station near the city. In
November 2005, transmission line failures caused a series of electricity blackouts.
Then, on Christmas Day, a loose bolt ripped the huge turbine rotor at one of the
two Koeberg nuclear generators. The reactor closed down, removing nearly a fifth
of the supply and plunging Cape Town and the Western Cape into a prolonged
electricity supply crisis marked by repeated blackouts and load-shedding over the
next eight months. The crisis was declared over when Koeberg was restored to full
power in August 2006.
The blackouts caused chaos. Trains stopped and workers were stuck on – or
between – platforms and arrived late for work, if at all. Businesses closed whether
or not their workers arrived. Food rotted in fridges in supermarkets, restaurants
and people’s homes. Computers crashed and the city was abruptly taken offline.
Cape Town’s garment industry, already under pressure from cheap Chinese imports,
stopped in mid-stitch. Fruit and grape harvests halted. Water pumps stopped and
sewage works overflowed into Cape Town’s already polluted streams. And, as the
streets went dark at night, they were felt to be unsafe.
While the Western Cape suffered the most severe power crisis, blackouts were
increasingly experienced across the country. These local blackouts were generally
attributed to failing municipal distribution systems but the national grid was also
strained. Eskom warned that the margin of supply over peak demand was
dangerously narrow and would remain so until it brought the first unit of its new
and very big coal-fired power stations into operation in 2012. In January 2008, the
lights went down across the country. At the height of the crisis, Eskom abruptly
shed over 4 000 MW from an already reduced supply and ‘begged people to “turn
it off ”, as the country hit the brink of disaster’.1 The chaos of the Western Cape

196
Toxic Futures
was repeated on a national scale. National government led the country to panic
stations with little evident effect. Municipal distributors desperately rotated blackouts
from area to area. The mines shut down on 25 January for two days. Eskom first
begged and then demanded a 10% reduction in industrial consumption. In May it
declared the immediate crisis over and ‘suspended’ load-shedding but reiterated its
warning of tight supply margins through to 2012.
This chapter starts by locating the crisis in the context of Eskom’s history. It
then focuses in on the crisis in the Western Cape to explore how things played out
in a specific local context. Finally, it draws some conclusions about the broader
implications of an overall decline in the energy system following peak oil.
Box 7.1 The power supply system
Base load is the backbone of the electricity supply system. South Africa’s system
is primarily designed to supply cheap power to energy-intensive mining and
industry. It has therefore developed a high base-load capacity founded on the
largest coal-fired plant available at the time of building. Prior to the ‘new build’,
it had ten coal plants located atop major coalfields with eight clustered on the
Mpumalanga highveld. Their combined capacity is 33 878 MW. The Koeberg
nuclear plant in Cape Town provides an additional 1 900 MW base-load capacity.
Base load is supplemented by peaking power plants that kick in with additional
power during peak-demand periods. In the daily cycle, demand peaks on weekday
mornings and is higher in the evenings when middle-class people return from
work. Working-class people contribute comparatively little to this peak because
most of the cooking is done by unemployed women during the day.2 In the
annual cycle, winter demand is highest for both base and peak load. The electricity
supply has to be managed to match demand as either an under-supply or an
over-supply can blow out distribution systems or sections of the national grid.
The ‘disaster’ feared by Eskom in 2008 was a total collapse of the grid. In that
case, getting the system going again would take several days as the big power
plants would have shut down. Starting them requires a major charge of electric
power so the whole process would need careful sequencing.
Two kinds of peaking plant are used in South Africa. Open Cycle Gas Turbines
(OCGTs) are something like jet engines and fuelled by diesel. They are designed
for short runs and are thirsty and expensive to operate, but get to full power very

197
Power trip
quickly and so can respond to demand spikes. Continuous operation can damage
them. Pumped storage systems consist of two dams, one uphill of the next. Water
is pumped uphill in off-peak periods when there is a surplus of power, and
released to generate electricity in response to peak demand. Pumped storage
systems help balance the grid but, overall, they use more energy than they
generate. They can only respond to an emergency if the water is already in the
top dam.
CENTRALISING POWER
The crisis has long roots in Eskom’s history, starting with the original mandate
to deliver cheap and abundant power for industry. The development of the grid
in the 1970s enabled Eskom to rationalise power generation and centralise
administration, planning and information systems. It also determined policy,
effectively becoming the apartheid government’s energy arm and more or less
running the power section in the Department of Minerals and Energy (DME). Its
own inclination for secrecy was reinforced and protected by security legislation
and its monopoly on strategic information prevented any serious challenge to its
decisions.
This institutional and technological regime enabled changes to the labour regime.
Both black and white workers had periodically demonstrated their power to disrupt
production in the first half of the twentieth century and had been brutally suppressed
by force of arms. Eskom had long aimed to minimise and isolate its labour force.
Its new power stations were always capital-intensive and, with the grid in place,
they could be built in remote areas while still subject to centralised management.
White workers, bought off with the apartheid privileges that they had demanded,
collaborated in the despotic management of the workplace while black migrant
workers on contract were made to feel their vulnerability to dismissal and were
housed in tightly controlled compounds distant from the urban centres of working-
class agitation.
In the 1970s, electricity demand soared on the back of the commodity boom
associated with the oil shocks. As international capital punted cheap loans to lay
off surplus petrodollars, Eskom borrowed heavily to build seven new giant stations
between 1979 and 1992. It was then caught in the debt trap induced by the Reagan-
Thatcher counter-revolution. The price of gold and commodities collapsed from

198
Toxic Futures
record highs, and the costs of the loans multiplied as interest rates rocketed and
the value of the rand dived. The economy went into recession and Eskom’s
projection of future demand proved wrong. By the end of the decade, generating
capacity exceeded peak demand by 62% (Eberhard and Van Horen 1995: 49) and
Eskom had to mothball power plants while desperately trying to boost demand.
Government was stuck with the debt. It declared a moratorium on repayments
in 1985 but also initiated the neo-liberal policies that would mature over the period
of the political transition. The privatisation of Eskom was mooted, although not
implemented, and the founding requirement that it operate without profit was
revoked, marking a significant turn towards commodifying public services (Gentle
2009). Eskom raised tariffs, provoking industry and the mines to call for tighter
government control to force it to operate on ‘business principles’. If this sounded
contradictory, Eskom then raised the alarm about ‘politicians in the engine room’
even as it maintained its occupation of the DME. Its corporate sense that it was a
law unto itself was even more sharply revealed as the political transition got
underway. According to its then boss, Ian McRae, staff feared that the new ANC
government would ‘nationalise’ the corporation (McRae 2006: 78).
In fact, the ANC government’s 1998 White Paper on Energy proposed
privatisation on the assumption that ‘the market’ would lead the action to create
economic growth and jobs. It predicted that new power plants would be needed by
2007 and said that building them should be left to the private investors. Eskom
then found itself defending against proposals to break up its generating monopoly
into supposedly competitive bundles to be sold off to the private sector and to
hand the grid over to a separate state entity. It was supported by the real heart of
the energy policy – the long-term commitment to cheap energy for industry as the
foundation of international competitiveness. While government barred Eskom
from planning new plants, private investors were not interested so long as there
was no price escalation in prospect.
The privatisation policy was suspended in 2004 as government adopted the
rhetoric of the developmental state. Amid alarms that economic growth was now
overtaking the capacity to deliver power, Alec Erwin, then minister of Public
Enterprises, announced that ‘R107 billion will be needed between 2005 and 2009
to meet the country’s growing energy needs. Eskom will invest R84 billion over the
next five years. The balance of R23 billion is reserved for independent power
producer (IPP) entrants’.3 New generator plants were supposed to be up and running
in 2008. By 2010, the IPPs had built nothing because the electricity price was too
low to yield a profit while Medupi, Eskom’s first new base-load plant, was expected

199
Power trip
to start generating only in 2012. The five-year capital spend had meanwhile increased
six-fold.
Figure 7.1 Eskom’s power stations in 2008.
Adapted from www.Eskom.co.za.

200
Toxic Futures
Distributing power
Historic tensions between Eskom and the municipalities have revolved around
distribution. White municipalities bought bulk electricity from Eskom but controlled
local networks distributing power to end users and used the profits of distribution
to supplement income from rates. With the political transition, municipal boundaries
have been expanded and they have been given responsibility for the delivery of
services to all citizens rather than only to the white and wealthier minority. Demands
on revenues have thus expanded faster than income and the profits from electricity
are more vital than ever. Eskom itself distributes to the rest of the country including:
• many black townships and commercial farms now located within the
expanded borders of previously white municipalities;
• most municipalities located in the old homelands – which do not therefore
get the benefit of a supplement to the rates;
• most, but not all, energy-intensive users – big industry and the mines.
Industries located in city distribution networks generally complain that they are
subsidising the rates and there is some rivalry between Eskom and municipalities
for rights of distribution to these users. Overall, Eskom accounts for 40% of
customers but 60% of the value of sales.
This history has created a patchwork distribution map. Following the 1998
policy White Paper, proposals to rationalise distribution have centred on the creation
of six Regional Electricity Distributors (REDs) to serve the whole country.
Municipalities were to pool their distribution assets and obtain shares in each RED
proportionate to those assets, while Eskom was to hand over its distribution assets.
The corporation resisted this and it is now proposed that it too will take shares in
all REDs proportionate to its existing distribution. The DME’s Electricity Distribution
Industry Blueprint Report of 2001 recommended that national government should be
able to ‘restrict changes in ownership’ for five years following the establishment of
REDs (DME 2001: 8). The implication is that municipalities will eventually be able
to sell their shares. REDs would then pave the way to the piecemeal privatisation
of distribution with the potential for a substantial transfer of wealth to politically
connected business people.
The formation of the first RED, centred on Cape Town and covering the
Western Cape and parts of the Northern Cape, was announced in 2005. It was
stillborn. Smaller municipalities feared that they would be swallowed by Cape Town
and refused to buy in. Cape Town feared that the RED would develop distinct
institutional interests to the detriment of its notional shareholders and return

201
Power trip
diminished profits to municipalities. By 2010, government was pushing through
legislation, including a constitutional amendment, to force municipalities into the
still-to-be-formed REDs. Their argument for doing so was reinforced by the
deteriorating state of municipal infrastructure. ‘We dare not allow a situation where
collapse of distribution networks would plunge us back into darkness,’ according
to Energy Minister Buyelwa Sonjica.4 Exactly how REDs would save the light was
not clear.
For the anti-apartheid movement, the discriminatory distribution of services
was a key issue and providing access to energy, and specifically to electricity, became
a political imperative during the transition period. The well-lit, high-consumption
suburbs of white South Africa contrasted starkly with the dark and grimy black
townships. In 1992, in the majority of formal townships ‘more than 80% of
households did not have access to electricity’, while hardly anyone living in informal
settlements, African rural areas or farmworker households had access (Greenberg
2006: 28).
Eskom started an electrification programme in 1991, both to reposition itself
politically and to use up some of its excess generating capacity. In 1993, a National
Electrification Forum – including the power industry, the political actors in the
transition, trade unions and civics – was established and agreed to an accelerated
programme. The ANC’s Reconstruction and Development Programme (RDP) set
a target for connecting 2.5 million homes between 1994 and 1999 and this was one
of the few RDP targets that was met and exceeded. By 2004, access to electricity
had doubled to 70%, prompting energy analyst Anton Eberhard to comment that
‘doubling access to electricity . . . in a matter of years is probably without precedent’
(2005: 6). Five years later, according to the president’s fifteen-year review, 80% had
access but for lights only, 67% had sufficient access to cook with and 59% had
enough for heating as well (Presidency 2008: 21).
For poor people, access to the electricity supply is compromised by the costs
of making use of it. The suspension of privatisation was not accompanied by a
suspension of cost recovery on services to the poor and electrification has not
fulfilled the promise of affordable energy services to poor households. For Eskom,
electrification certainly brought political dividends. The anticipated economic returns
did not materialise, however, as newly electrified households consumed less than
expected and so did not generate the scale of returns to cover infrastructure costs.
Eskom funded the electrification programme until 2000. When government
subjected it to taxation it announced that it would no longer ‘subsidise’ the
programme. This implied that the programme was exchanged for its tax-exempt
202
Toxic Futures
status and allowed Eskom to escape what was arguably a miscalculated investment
rather than a public-interest initiative. Subsequently, the DME has funded the
programme through subsidies to Eskom and municipalities.
Since 2001, when Eskom was ‘corporatised’ and restructured as a tax-paying
company, its profits rose steadily through to 2008: ‘a comparison with the Fortune
500 top global companies shows that Eskom’s after-tax-profits-to-revenue ratio is
nearly twice the median produced by 23 electricity utilities listed’ (Greenberg 2006:
39). The strategy to minimise employment has also met with success as the
corporation shed over half its workforce, reducing the number of workers from
over 65 000 in 1985 to 30 000 in 2004.
Thus far, Eskom has retained its strategic grip on the industry. It will remain
the dominant generator and, assuming that its distribution assets are in fact turned
over to the REDs, it will be a major shareholder in each of them.5 Throughout the
transition period it has defended its monopoly on strategic information and planning
capacity in the power sector, dominated the DME and held fast to its centralised
and secretive corporate culture. This was weakened, but not broken, with the
establishment of the National Energy Regulator of South Africa (NERSA), which
has developed some independent capacity. The national power crisis, and public
outrage at its exorbitant tariff demands, has shaken Eskom’s hold more profoundly.
Most immediately, Minister of Energy Dipuo Peters says that its systems operator
division – in control of the grid and responsible for balancing supply and demand –
will be hived off into a separate state-owned entity in order to facilitate access to
the grid for IPPs. This was a key element of the privatisation model put forward
following the 1998 White Paper and, if carried through, will mark the end of
Eskom’s corporate model of vertical integration. Nevertheless, Eskom still exercises
disproportionate power in policy.
DARKEST CAPE
Cape Town was energy-poor from the start. The more spectacular fynbos species
contributed to early Dutch botanic collections, but the settlers complained of the
lack of firewood and started growing European species such as oak. The British,
who ousted the Dutch in 1806, later planted Australian acacias – notably the invasive
Port Jackson Willow – for firewood and to stabilise the sandy soils. As the energy
infrastructure was expanded, the Port Jackson was left to the poor, who used it
both for firewood and building materials. By the late twentieth century, Port Jacksons
were identified as a threat to the fynbos and to the Western Cape’s tourism economy
and were infected with a gall that is now killing off whole stands of the trees.

203
Power trip
Following the discovery of gold, the mother city was thrust aside from the
centre of the southern African economy, being geographically remote from the
minerals-energy complex that emerged at the heart of South Africa’s economy.
The Western Cape has no coal deposits, no mining economy and, apart from the
Chevron oil refinery, no energy-intensive industries. Cape Town’s pattern of energy
consumption is therefore not typical of South Africa: First, liquid fuel supplies
about 60% of final energy – most of it for transport – as compared with 32%
nationally, making the region particularly vulnerable to rising oil prices. Second,
industry consumes a lesser proportion of energy than is the norm in South Africa.
Commerce and industry consume 29% of total energy and 59% of electricity – as
compared with 49% of total energy and 73% of electricity nationally. Cape
households consume 15% of total energy and 38% of electricity.6
The city was connected to the coalfields of the Eastern Highveld, 1 600
kilometres inland, when Eskom completed the national grid in the 1970s. It was
more intimately linked with the minerals-energy complex when the Koeberg nuclear
power station opened in 1982. Koeberg was supplied by uranium mined in the
former Transvaal and enriched at Pelindaba, and was a central link in setting up the
nuclear supply chain needed to service apartheid South Africa’s military nuclear
ambitions (Fig 2005). In the 1990s, the supply chain was dismantled as the last
apartheid president, F.W. de Klerk, renounced such ambitions before relinquishing
power. Koeberg’s fuel has subsequently been supplied by France.
Cape Town’s economy has grown strongly in the ‘new’ South Africa.
Manufacturing, particularly the textile industry, has declined precipitately but the
services sector has grown significantly. Tourism, financial services and real estate
have boomed along with a film industry able to make capital out of the dramatic
landscape and relatively cheap labour costs. The Western Cape’s wine and fruit
farms constitute the most ‘dynamic’ sector of South African agriculture, having
been integrated into global production chains supplying European supermarkets.
Investment in these sectors has not created jobs. Unemployment is rising while the
‘distribution of economic activity in the city has been highly skewed towards those
with greatest skills and access to resources, with a large majority of the city’s
population precluded from meaningful participation in the economy’.7
Rich city, poor city
Apartheid Cape Town was designed to preserve both the economic advantage of
white people and their sense of superior Western identity within what McDonald
and Smith describe as a ‘mixed economy [with] racial welfarism’ (2004: 1461).
204
Toxic Futures
Black people were needed for their labour but were physically removed from the
urban centre to the remote and bleak edges of the Cape Flats and excluded from
the high-level services afforded to whites. This was a racist variation on what urban
specialist Mark Swilling calls the ‘consumption city’, planned and built around the
needs of the rich and catering to
. . . the need within capitalist economies to create a mass of consumers
that provide the markets for the suppliers of the basket of urban goods
that are now defined as the basic elements of urban living . . . The basic
building block of the ‘consumption city’ is the ‘consuming neighbourhood’
that, in particular, needs to buy in the necessities for daily living from the
outside (often from very distant locales) – energy, water, waste removal
services, building materials, food, vehicles, etc. The city’s urban infra-
structures had to be planned and managed to make sure these goods and
services can be supplied, transported, removed, financed, and extended
(Swilling 2006: 5).
Consumption is highly unequal. While the richest 16% of households used nearly
60% of all domestic water, 20% of all Capetonians had no piped water supply in
2000. Profligate consumption by the rich – for gardens, swimming pools, deep
baths, etcetera – is expected to exhaust Cape Town’s limited water supplies in 2025.
These richest households also produce over half of Cape Town’s 895 000 tonnes
of residential waste every year. Half of this is organic (food and garden) waste, and
so produces methane gas as it rots, but only 6.5% of all waste is recycled. This is
one of the highest rates of domestic waste production and one of the lowest rates
of recycling in the world. The waste is taken to dumps located in poor
neighbourhoods on the Cape Flats where it pollutes both the air and the shallow
water aquifers.
Electricity use is similarly unequal. According to The State of Energy Report
for Cape Town, 95% of households are now electrified but the poor remain ‘very
dependent’ on paraffin. The poor spend up to 25% of their income on energy
while medium and high-income households spend only up to 5% and ‘use electricity
almost exclusively’. These richer households – about 39% of the population –
consume four or five times as much energy as the poor and ‘emit an immense
737 kg’ of carbon each every month (SEA 2003: Section 4:3). These figures exclude
transport where consumption is dominated by private vehicles.
The disparities in consumption are in fact higher than suggested here, first
because there are more people in poor households than in rich ones, and second

205
Power trip
because electricity and water to a large proportion of poor households is routinely
cut off because they cannot pay for it. Even after the introduction of the free
‘lifeline’ provision of water and electricity, ‘service disconnections and household
evictions continue in the city on a daily basis, supplemented by aggressive efforts
to introduce prepaid water and electricity meters in an attempt to deal with non-
payment of services’ (McDonald and Smith 2004: 1475).
While apartheid discriminated on racist grounds, the neo-liberal city aggressively
asserts the order of the market. McDonald and Smith show that, as an ideology,
neo-liberalism is embraced by all political parties and most city managers and
planners and is, indeed, represented as the means of addressing apartheid inequalities.
In part, they are responding to fiscal constraints imposed by central government
which slashed financial transfers to local government by 85% between 1991 and
1997, and by a further 55% between 1997 and 2000. This financial squeeze was
accompanied by the expansion of municipal mandates to deliver services to all
citizens rather than just the white minority. Private-public partnerships, punted by
the World Bank and national government, then appeared as an efficient and cost-
effective means of serving ‘unfunded mandates’ while the notion of extending
public service delivery was systematically downgraded. Local departments, including
Cape Town’s Electricity Department, still responsible for delivering services are
meanwhile corporatised – meaning that they are fenced off from the rest of local
government so that they can be run like businesses.
Since 2004, the cuts in transfers to local government have been reversed.
National government is also investing substantial sums through the Municipal
Infrastructure Grant programme supplemented by additional funding for the 2010
football World Cup. This adds up to big money, although dwarfed by Eskom’s
billions, but it does not reverse the neo-liberal assumptions that now frame local
institutional relations and planning. The City authorities have stated their dual priority
for economic growth driven by global competitiveness on the one hand and pro-
poor development on the other – a dual development strategy that mirrors ASGISA.
For its first priority, Cape Town adopted the ‘world-class city’ slogan, which sounds
like a good thing but in fact expresses a commitment to keeping the city within the
circuits of global capital. That means creating and servicing the high-value locations
and infrastructure to attract corporate investors and enable top managers to link
with high-value locations in other global cities. Both public and private investment
is consequently concentrated in wealthy areas. The pro-poor strategy is meanwhile
failing. Urbanist Charlotte Lemanski comments that ‘the two goals appear mutually
incompatible’.8

206
Toxic Futures
Swilling argues that planning assumptions favouring the consumption
neighbourhood are deeply rooted in the discipline of urban planning and linked to
the priority given to growth. As Cape Town reaches the limits of its water, energy
and other environmental resources, it becomes ever-more evident that satisfying
the demands of capital is possible only at the cost of the poor:
. . . it is difficult to see how poverty eradication in Cape Town is a realistic
goal if scarce financial resources and free services from nature . . . are wasted
on maintaining an ecologically unsustainable system that works in financial
terms for the middle and high income communities . . . but tends to be
too costly for those poor households that are lucky enough to be serviced
(Swilling 2007: 38).
Energy analyst Tristen Taylor takes a more caustic view, concluding that ‘electricity
is granted to non-elites in accordance with their ability to serve the elite class’
(2007: 6). The same might be said of other amenities and the war on poverty more
often seems like a war on the poor as the city ‘cleans up’ to present itself to investors.
This has provoked a growing movement of resistance as people struggling to keep
their homes have acted in solidarity with each other. In the late 1990s, the Western
Cape Anti-Eviction Campaign linked local Cape Town groups, and these groups
are now linking more widely with people in other South African cities and specifically
with Abahlali baseMjondolo.
Cape Town’s flagship N2 Gateway Housing Project shows what world class
means. It was intended to clean up the shack settlements that are highly visible to
foreign visitors on the N2 ‘gateway’ from the international airport to the city centre
and the shack-dwellers were supposed to be the first ‘beneficiaries’. Cost overruns
resulted in unaffordable rentals and the first houses completed remained empty
for some time. Those who moved in found shoddy building work and believed
they were being made to pay the costs of corrupt profiteering by construction
companies linked with the ruling party. Protesting outside parliament in July 2007,
tenants demanded that rent be suspended until construction defects were made
good. They were rebuffed by Minister of Housing Lindiwe Sisulu who ‘reportedly
advised them to “give a month’s notice, pack their bags and make way for people
who are willing to pay” ’.9
The people of the Joe Slovo shack settlement know that they will not be able
to pay. They were promised housing in the Gateway project in 2005 but faced
removal to Delft on the city periphery to clear the way for construction of Phase

207
Power trip
2 of the scheme. They were particularly aggrieved that government excluded them
from decisions about their own future and appealed to the Constitutional Court.
The court allowed their eviction but required ‘meaningful engagement’ by the
authorities with the residents, that alternative accommodation should meet a
minimum standard and that 70% of the new houses should be allocated to Joe
Slovo residents. This, according to Kate Tissington (2009) of the Centre for Applied
Legal Studies, is merely a palliative. At best, only 1 050 of the 3 000 Joe Slovo
households will eventually get the new housing. Meanwhile, the Delft sites are
already full, the housing mostly consists of ‘government shacks’, and the supposedly
temporary settlements are turning into permanent camps that are less about housing
than holding the poor.
Blackouts
When the bolt hit the rotor at Koeberg Unit 1 on 25 December 2005 it removed
900 MW capacity from an already stressed system. Two major blackouts followed
in February 2006 when the failure of the national grid supply had the further effect
of shutting down Koeberg Unit 2. Each event resulted in extended unplanned
blackouts of several days duration for large parts of the Western Cape. Unit 1 was
brought back on line in May when a replacement rotor obtained from France’s
nuclear utility was installed. Unit 2 then had to be closed for delayed maintenance
and refuelling. Full power was finally restored in August. During the entire period
from December 2005 through to August 2006, scheduled ‘load-shedding’ – a
euphemism for planned rolling blackouts – was used to prevent overload on the
available electricity supply and hence more general blackouts.
Explaining the unplanned blackouts, Eskom emphasised external technical
causes, including fires under the lines, high pollution levels and misty conditions,
causing ‘flash-overs’ that tripped the transmission lines. NERSA, however,
subsequently found that Eskom’s maintenance and commissioning procedures were
inadequate and concluded that Eskom had ‘transgressed its licensing conditions
and was negligent’.10
The Minister of Public Enterprises, Alec Erwin, looked for a more political,
outside cause when he tried to blame the bolt in the rotor on sabotage. Somewhat
lamely, he later denied saying what he said. Anti-nuclear activists saw this in the
context of earlier government pronouncements threatening to silence them in the
name of public order. The allegation carried the threat of redefining dissent as
terrorism. Opposition political parties saw it as a ploy to divert attention from
government mismanagement ahead of local government elections, indicating their

208
Toxic Futures
sense that political legitimacy is now reduced to technical competence. Eskom has
subsequently noted that it was prevented from making critical investments following
1998 when the Energy White Paper pronounced in favour of privatisation, a policy
strongly supported by the political opposition.
This was a crisis foretold, says Leila Mahomed of Sustainable Energy Africa.
In early 2005, Sustainable Energy Africa wrote to Eskom warning that demand
was rising and the transmission lines appeared vulnerable. It concluded that ‘all
eggs are in the one Koeberg basket’. Eskom responded that Koeberg was a very
safe basket. This response was not merely complacent: it entirely missed the point
that highly centralised energy systems reliant on large-scale generators are inherently
vulnerable to a major loss of power. It is a point that Eskom keeps on missing
because localised small-scale production is not compatible with its corporate culture
or its interests.
Box 7.2 The French connection
A replacement for the 200-tonne rotor, supplied by Electricité de France, arrived
on a South African warship in Cape Town on 5 April. At a press conference on
board the ship, the French ambassador revealed that the replacement had been
the subject of high-level negotiation, including discussion between Presidents
Mbeki and Chirac. The pomp and ceremony is a theatre of obligation and
dependency. It has been continued with Presidents Sarkozy and Zuma who met
in South Africa prior to the Copenhagen climate conference and again on the
way to the conference. Behind the glitz, the South African and French nuclear
establishments are closely connected.
Like Eskom, Electricité de France is a state-owned electricity monopoly. It
produces 70% of its electricity from nuclear power and is a central player in the
global nuclear industry’s current push for expansion. It is closely tied to Areva,
France’s state-owned nuclear construction and supply corporation. Areva executive
Anne Lauvergeon represented the energy sector on President Mbeki’s International
Investment Committee and ‘gives her utmost attention to South African projects
in the nuclear energy field’. Areva was formed from a merger between Framatome
and Cogema. Framatome built Koeberg, completed in defiance of the anti-
apartheid campaign in 1982. From 1976, Cogema bought uranium from South
Africa’s Nuclear Fuel Corporation and financed the uranium concentration factory
at Randfontein.

209
Power trip
The French connection is now tighter than ever. The Areva University trains
the staff of the South African National Nuclear Regulator and advises the Nuclear
Energy Corporation of South Africa on options for deep geological storage of
radioactive waste. Areva plays a role in all stages of the nuclear fuel cycle in
South Africa, generating revenues of 30–50 million euros in South Africa each
year. It holds contracts with Eskom for maintenance, services, technical assistance
and fuel supply and it seconds 50 to 60 technicians to Koeberg during
maintenance shutdowns.11 Not surprisingly, Areva is positioning itself as a
frontrunner in the bids to build South Africa’s next conventional nuclear power
station.
The pomp and ceremony that attends the French connection does not hide
the fragility of the nuclear chain as plants age and breakdowns increase and as
qualified nuclear engineers also age and are not replaced. When it comes to
decommissioning, there may not be enough skills left.
Managing participation
The public reaction to the crisis was intense and highly critical of Eskom and
government, creating a forceful dynamic for some form of participation in decision
making. Given the centralised power of Eskom, there was no readily available
institutionalised forum for participation and the demand found its own outlet. In
February and March 2006, a series of meetings of the bureaucratically named
Energy Risk Management Committee (ERMC) were convened. The ERMC
effectively emerged with the crisis and quickly evolved from a discrete stakeholders’
forum to a more or less open forum with increasing numbers of people at each
successive meeting. The original stakeholders were Eskom, the provincial
government, the City of Cape Town, business and labour, with labour calling in
environmental and other civil society interest groups.
Eskom apparently thought it enough to assert that it was in control. The February
blackouts shredded its credibility – clearly it had no plan beyond load-shedding
while fixing Koeberg. Government’s credibility was also on the line but provincial
and city governments also had no plan – beyond relying on Eskom. Not being ‘in
the engine room’ suddenly seemed hazardous as business loudly announced the
threat to economic growth. The politics of energy was suddenly centre stage and
open to question. The questioning, however, was effectively contained within two

210
Toxic Futures
parameters: holding Eskom accountable but not otherwise challenging its
institutional power; and managing the crisis until Koeberg was back on line. Thus,
the provincial Member of the Executive Committee (MEC) responsible for energy,
Tasneem Essop, demanded a 90-day plan from Eskom but prevented civil society
representatives from presenting a set of proposals to the ERMC.
She also proposed that the ERMC appoint a more orderly and restricted
stakeholder body, which came to call itself the Provincial Monitoring Team (PMT).
Chaired by a representative of business and including representation from civil
society, it defined its primary role as ‘to monitor the Western Cape Integrated
Recovery Plan on behalf of the EMRC’ and it did indeed act to hold the central
actors to account and enable a freer flow of information. However, its closing
report, written as the dust of crisis settled in August, was addressed to the provincial
MEC and not to the ERMC. This chaotic but more open forum had simply
evaporated.
Outside of this quasi-official process, the Congress of South African Trade
Union’s (COSATU’s) Western Cape region attempted to broaden public participation
through a public meeting early in March. This meeting was predominantly working
class and left, with a strong showing from the unions, social movements and
environmental activists, but also included some business representatives. Eskom
and the Western Cape premier were invited but did not attend. The meeting issued
a declaration with a stinging critique of both Eskom and government. It identified
the cause of the crisis in government’s earlier commitment to privatisation and the
consequent ‘under-funding of the generation and transmission capacity’, in the
‘age and servicing levels’ of Koeberg, and in the labour regime of outsourced and
casualised work. It denounced ‘the entire electricity restructuring process’ as
inadequate or ‘downright dangerous’. Inequity was built into the system as domestic
consumers subsidised energy-intensive industries. Inequity was also evident in the
response to the crisis as ‘load shedding has been applied unevenly with some areas
being preferred above others in the absence of any clear [and] agreed to objective
criteria’.12
Noting the hazards of nuclear power, the declaration proposed that
government’s power-sector strategy should focus on renewable energy, starting
with solar water heaters and wind turbines, and that the relevant manufacturing
capacity should be supported through the industrial strategy. In the short term, it
called for the subsidised use of gas for cooking and supported official proposals
for energy-efficient lights and the insulation of geysers.
This meeting thus began the work of creating a new politics of energy, providing
a trenchant criticism of the current order and proposing practical responses that

211
Power trip
went beyond the immediacy of crisis. The forcefulness of the declaration showed
the strength of networked relations in Cape Town’s civil society. The follow-up
showed civil society’s weakness: the meeting proposed action – but nothing
happened. Labour and civil society representatives duly took their seats on the
PMT. Some believe that they were able to play an important defensive role there
but the opening created by the crisis for a more radical engagement was quickly
closed down and the voice of the working class was muted after this single
expression. PMT proceedings were dominated by Eskom staff through sheer weight
of numbers while Eskom’s fiercest critics were silenced. According to Maya
Aberman, who represented environmental group Earthlife Africa on the PMT,
‘There was an explicit understanding that while we were part of the team we would
not criticise it from the inside. I now think that we should have been on the outside,
criticising and mobilising people so that the flaws of the current energy system
would become more apparent’.13
‘Sharing the load’
On 31 March Eskom produced the ‘recovery plan for the winter of 2006’ demanded
by Essop and the ERMC. It anticipated peak demand exceeding the available supply
and envisaged a multi-stakeholder process accompanied by an intense communica-
tions strategy aimed at:
• restoring public confidence in ‘the industry’, that is, in Eskom;
• managing load-shedding combined with disseminating information to enable
consumers to anticipate cut-offs;
• minimising load-shedding by ‘demand management’ aimed to reduce peak
loads by 500 MW, equivalent to 10% of Western Cape consumption.
The restriction on criticism from within the PMT was in support of speaking with
‘one voice’. At a mundane level, this was about avoiding contradictory information
on the available supply and load-shedding schedules. This level of communication
was then folded into public relations as Eskom centralised control of information
more broadly to ‘restore confidence’. Eskom’s plan envisaged stakeholder support
‘to elevate what seems to be an “electricity industry” [problem] to a “National
Challenge” ’.14 In short, the sense of crisis would justify Eskom’s national plans for
new coal-fired and nuclear generation and be used to override criticism.
Load-shedding was to be governed by a set of ‘common principles’, including
that the cuts should fall equally across all areas while priority should be given to
supplying ‘strategic’ or ‘sensitive’ consumers such as the fuel refinery, hospitals and
212
Toxic Futures
sewage works. Additionally, ‘[e]conomic hubs, such as the CBD, will not be shed if
they meet their allotted savings targets, where practical’. Cape Town’s central business
district did not meet its targets but nor was it shed.
Demand-side management (DSM) savings on peak demand exceeded
expectations. Ironically, the biggest saving was made by those who consume least
while efficiency savings from commerce and industry were negligible.
The blackouts revealed the social nature of electricity consumption. People
went from individualised consumers who simply assumed the availability of cheap
and abundant electricity at the flick of a switch to understanding their consumption
in the context of the city’s functioning. It thus created a sense of common crisis
and vulnerability. It even seemed that this crossed Cape Town’s rigid class-divide as
business and labour shared a number of platforms, but this larger solidarity was
illusory. The middle classes could enjoy the camaraderie of crisis as they checked
the load-shedding schedules and went to eat in restaurants where the supply was
on. Lacking such easy mobility and free spending power, the working classes
justifiably felt a strong sense of their class-specific vulnerability.
Prior to the blackouts, Eskom’s DSM programme was remarkable only for its
invisibility. The energy efficiency campaign was now made highly visible through
TV and radio power alerts as well as extensive press coverage and appealed directly
to the emergent sense of social solidarity with the slogan ‘sharing the load’.
Substantial savings of around 100 MW were made simply by turning things off.
This was backed up by efficiency subsidies available for geyser blankets and low-
flow shower heads. Households adopting electronic ‘ripple’ control – which enables
electricity managers to switch off their geysers from a central control – could also
claim subsidies.
In contrast, support for solar water heaters was excluded despite strong
arguments from civil society that water heating in richer households is the largest
component of residential consumption. Eskom claimed that, given the limited
solar-industry capacity in Cape Town, they could not be installed fast enough to
realise savings within the three-month crisis period. Environmental organisations
responded with a call for immediate action to launch a huge drive for solar water
heating and energy efficiency. They noted that research demonstrating the benefits
had gathered dust at the DME for over ten years and suggested that efficiency
should not be left to those with a vested interest in expanding electricity sales.15
An efficient lighting campaign made the biggest savings at 230 MW. It worked
through free swaps of incandescent bulbs for compact fluorescent lights (CFLs).
The bulk of these savings were made by poor households as over three million

213
Power trip
CFLs were distributed door to door in the townships. In middle-class areas, the
swaps were organised through retailers who distributed two million. Savings in
poor areas have not been sustained, however, as blown CFLs are replaced with
cheaper bulbs.
The poor were similarly targeted to swap electric for gas hotplates, including a
gas bottle and two refills, while richer households could get a discount on gas
appliances. Peak time savings were a modest 22 MW partly because poor households
cook ahead of peak demand. Those of the poor who made the swap soon ran into
trouble. First, rising crude-oil prices and the new demand for gas started driving
Box 7.3 Mercury
Each CFL contains a minute quantity of mercury – as Sustainable Energy Africa
pointed out in 2000.16 Dumping millions of CFLs when they burn out thus creates
a potential for groundwater pollution. Environmentalists again raised this issue
as the five million CFL roll-out got into gear. The PMT responded by recommending
a comprehensive disposal plan including a R5-million mercury-recycling plant.
This plan relies on voluntary recycling from households in a context where
municipal waste managers do not provide the infrastructure for recycling. Bringing
these lamps to a mercury-capturing plant is thus highly unlikely but, if it does
happen, it may just shift the problem. Mercury recycling plants, such as Thor
Chemicals, have a wretched history of poisoning workers and local environments.
Production appears equally problematic. In China, hundreds of workers in factories
making CFLs for the European market have been poisoned.17 Eskom has since
recognised that mercury is an issue – which is an advance on 2006 – but its
response appears limited to providing tips for householders. Some organisations
are looking at more costly but even more efficient light-emitting diodes to avoid
the mercury problem.
Coal-fired power generation also results in mercury pollution. Trace elements
of mercury in coal are minute but, because massive quantities of coal are burnt,
mercury emissions are significant. If CFLs have the effect of reducing the amount
of coal burnt, it might be argued that there is an overall reduction in mercury
pollution. Regrettably, this does not follow. Eskom is building new power plants
as fast as it can and DSM is really aimed to prevent demand growing faster than
Eskom can increase the supply.

214
Toxic Futures
up the price in mid-2006. The PMT proposed, without success, that the price be
regulated or subsidised. Second, gas supplies ran short largely because it is produced
as a refinery by-product. Refineries actively shape the market to fit demand to the
ratio of their product streams so the market was already calibrated to the supply.
With additional demand driven by the managers of the electricity crisis, the gas
supply could not simply be increased – and was not. Despite supply problems,
local research indicates that those who were introduced to gas now prefer it to
both electricity and paraffin because they found it clean, safe and efficient. Most
have retained their gas appliances even if they cannot afford to use them all the
time (Mohlakoana and Annecke 2008).
Exempted from load-shedding, the business community in Cape Town’s CBD
exempted itself from ‘sharing the load’. Eighty-eight businesses in the CBD were
approached to undertake voluntary electricity conservation. Twenty-five were not
interested, fifty-one expressed interest, only twelve pledged to efficiency measures
and achieved just 4 MW saving. In the Western Cape beyond the CBD, twenty
industrial and commercial customers took advantage of the 100% subsidy for
energy-efficiency projects. Projects with a combined impact of 17 MW were
approved but only 6 MW savings were achieved by the end July 2006.
Implementation of the rest of the projects would extend over several months.
Eskom’s rule that only interventions yielding short-term gains should be considered
was thus not applied to business.
More broadly, it is evident that voluntary measures did not work. It seems
equally evident that learning from this will be avoided. The CBD did not come
close to meeting the agreed targets. It was vigorously defended from the
consequences of sharing the load-shedding by the Cape Town Partnership – a non-
profit company set up by local government and business to promote the CBD.18
The partnership argued that its energy-saving campaign was making good progress
and would be undermined if load-shedding was implemented. The unspoken
assumption here is that business would co-operate only if it was afforded privileged
treatment.
Middle and working class Capetonians were incensed to see whole office blocks
lit up at night. Many of these buildings are hard wired for profligate consumption
because they operate on a single switch, meaning that the whole building is either
on or off. Rental buildings are particularly problematic because tenants pick up the
electricity bills but landlords decide on any retrofit. The effect is that the costs of
high-energy buildings are transferred from landlords to tenants but, in the context
of cheap electricity, business tenants did not notice. The Cape Town Partnership is

215
Power trip
Box 7.4 The poor pay the price
Energy researcher Wendy Annecke argues:
It wouldn’t be an exaggeration to say that the Electricity Supply Industry
has failed women in Africa . . . Women are often among the poorest of
the poor, and we know that it is women who are largely responsible for
acquiring energy on a daily basis to keep members of the household fed,
clean and comfortable. To do this women juggle with multiple polluting
and inefficient fuels: mostly wood, biomass and dung, but also kerosene
(2006: 38).
Kerosene, or paraffin, is dangerous, smells bad and gives food a bad taste – yet
it remains the fuel of necessity for around two million South African households
who cannot afford anything more expensive. They pay the price of massive
externalities resulting from an energy policy and practice that does not address
the needs of the poor.
A Paraffin Users’ Household Energy Summit, in June 2007, estimated ‘costs
to households and to the economy due to paraffin related incidents . . . in the
region of R100 billion per year’. A 2001 report to the Paraffin Safety Association
of South Africa concluded that in 2000 at least 143 000 children drank paraffin,
at least 55 000 children contracted pneumonia after drinking paraffin, and at
least 4 000 children died from paraffin-induced chemical pneumonia. There
were at least 46 000 paraffin-related fires and 50 000 paraffin-related burns,
and 31 000 of these burns were the result of paraffin stoves exploding.
In densely packed shack settlements, fire spreads within minutes. Lives are
lost, people are injured and meagre possessions are destroyed. These include
documentation like identity books, leading to problems in accessing pensions,
health and other services. Recently, a safer paraffin stove was developed but it
sells for around R200 in Cape Town – four to five times the price of an unsafe
stove. The DME has failed to control the paraffin trade and the price more than
doubles from leaving the factory gate to being retailed to poor households in
unsuitable containers. Electrification does not solve the problem, as cooking
and heating requires more energy than the basic free energy allowance provides.
Sources: Paraffin Users’ Household Energy Summit in June 2007, ‘Final Declaration’; ‘2001Report to Paraffin Safety Association of South Africa’ in Energy Management News, Vol. 8 No. 2.at www.eri.uct.ac.za.

216
Toxic Futures
now working to develop a model to ‘incentivise’ energy efficiency projects in multi-
tenant buildings.19 The real effect of this will be to protect the principle of voluntary
measures, which will come at a considerable price in public subsidies.
Business did much better when they could see the money. Eskom paid premium
rates – thought to be some ten times higher than normal industry electricity tariffs
– to 33 customers who used their own backup generators during peak hours and
so substituted about 58 MW. Many companies have since bought generators to
protect against future outages. Most run on diesel and are indeed expensive to
operate. They may substitute for grid electricity but at the cost of an overall increase
in energy consumption and carbon emissions.
Keeping the CBD switched on may have defended Cape Town’s world-class
city ambitions, but the profligacy of the CBD contrasts starkly with conservation
in the townships. It is part of the broader structure of discourse that defends
cheap energy for industry and business in the name of national economic
competitiveness and uses the need for conservation to justify prepaid meters and
trickle-feed technologies for the poor. While these technologies restrict consumption,
the need for energy is exacerbated by shoddy building and the neglect of
environmental design in public housing projects.
Agriculture unplugged
The blackouts provided a detailed demonstration of the economy’s dependence
on external sources of energy and provided a test run, albeit in just the one
dimension of electric power, of the implications of an energy future that, in Mandil’s
words, ‘evolves from crisis to crisis’. The Western Cape Regional Chamber of
Business claimed that, by the end of March 2006, the power failures may have cost
the provincial economy as much as R8.9 billion, with businesses losing R5.6 billion
and spending an additional R3.3 billion on generators and other equipment to help
them manage the blackouts.20 Large and small businesses reported lost production
and damage to equipment. The Chevron oil refinery in Cape Town lost twelve days
of production and a host of small businesses, from hairdressers to Internet cafes,
closed during blackouts.21 The modern rural economy is no less dependent on
fossil energy and here we take a closer look at the impact of the blackouts on the
farm.
Reliable electricity is a central input in the increasingly high-value export-
orientated Western Cape agricultural sector. Cape farms were first electrified in the
1930s, when industrial agriculture integrated electricity into farming. In the 1980s
and 1990s, Eskom renewed the drive to electrify agriculture as it tried to expand

217
Power trip
markets to soak up its excess generating capacity. Its agricultural arm, Agrelek,
gave technical advice on how to electrify ever-more farming processes.
With the political transition, the electrification of agriculture put the leading
Cape wine and fruit farms in a good position to respond, in exemplary fashion, to
the policy of export-oriented production.22 From 1998 to 2002 they experienced
booming exports to Europe and rising profits as they linked into global production
networks supervised by the Northern supermarket corporations. Thereafter, their
profit margins were squeezed as the rand strengthened, global competition for
access to the Northern markets intensified, competition from imports arrived on
their home turf as the state stripped out protective tariffs, global over-production
of wine created a glut on the markets, and input costs rose.23 In short, their
vulnerability at the subordinate end of the production network became evident
and the squeeze on labour intensified.
Energy is critical to creating the ‘cold chain’ that carries fresh produce from
across the world to the refrigerated display shelves of Northern supermarkets.
The entire process is on a tight schedule defined by just-in-time delivery systems
and, for fruit, the time from tree to ship is no more than 48 hours. Fruit is picked
by casual workers in the heat of summer and taken to packing sheds where it is
washed and rapidly cooled, packed and loaded on to refrigerated trucks. The trucks
must meet refrigerated ships that are on tight turnaround times. Any delay incurs
additional docking fees that are billed to the producer, not the buyer. The ships
must also meet the trucks at the other end, with time penalties again imposed on
producers. A thermometer inserted in each fruit box records its temperature
throughout the journey and the box is rejected if it has exceeded the temperature
limits at any stage. Finally, the supermarket may summarily cancel the whole contract
if time or quality criteria are missed.
Timing is also critical to the wine farm harvest. White wines in particular are
now drunk in the year they are produced, speed to market being crucial for
profitability within the global markets structured by the Northern buyers. For quality,
precision in production compensates for the time previously allowed for the wine
to mature. Grapes must be picked when the acid balance is right, rapidly cooled in
the cellar and the temperature precisely controlled by computerised systems
throughout the production process.
Wine and fruit production are large-scale industrial operations of which the
farms are but one component. Scale and the necessity for speed now dictate that a
large pool of unemployed people should be available for seasonal work.24 On a
single Cape farm, something like 700 pickers may be employed while anything
between 200 and 1 000 casual workers are employed in the packing sheds.

218
Toxic Futures
Blackouts brought the whole system to a halt. Without the cooling plant in
cellars and packing sheds, harvesting had to be stopped. In the account of farmer
organisation Agri-Weskaap, farmers had to pay workers for the day without getting
the harvest. This may have been the case on some farms. However, ‘most seasonal
workers work on a piecework basis and are paid by the “basket” ’, according to
agricultural researchers Ewart and Du Toit (2005: 120). It seems unlikely that they
would have been paid for more than they picked. Farmers also lost sensitive
equipment. Winemakers, for example, reported that electricity interruptions fried
their costly computer process-control systems. The larger threat, however, was
that of losing market access.
In the event, the impact of the electricity crisis on farms was largely contained.
Agri-Weskaap, according to CEO Carl Opperman,25 anticipated further supply
problems following the November 2005 blackouts and responded early and
proactively. It administered a survey of the Western Cape’s 6 000 farms to establish
at what times – daily and seasonal – the power supply was most critical to the
farming operation and when it was least critical. The responses were given to Eskom
staff who analysed them and planned load-shedding on that basis. The unplanned
blackouts, when the whole system crashed in February, were thus the most
threatening interruptions.
In Opperman’s view, farmers understand that they are tied to Eskom for the
foreseeable future. Like other businesses in the Western Cape, they abandoned
plans to sue Eskom but many were exploring ways to reduce their dependency.
Some opted for conventional backup generators. In response to climate change as
well as energy security, a small minority of the leading estates looked at their overall
energy and carbon flows, seriously addressing energy efficiency and developing
on-farm energy systems using low-carbon or renewable technologies.
These responses were motivated both by sensitivities in their export markets
and by a real concern about climate change, not least because Western Cape
agriculture will be severely affected by it (see Box 7.5). Thus, the Backsberg wine
estate was declared ‘carbon-neutral approved’ according to ‘The Carbon Standard’,
having reduced its energy consumption and offset its outstanding emissions by
planting trees in a nearby township in partnership with the NGO Food and Trees
for Africa (FTFA).
The Carbon Standard sounds both official and universal but was actually
established by FTFA and implemented in a partnership between the NGO and
transnational corporate auditors PricewaterhouseCooper. PricewaterhouseCooper’s
South African office was ‘the first African company accredited to do carbon auditing’

219
Power trip
according to FTFA.26 Its accreditation was based on the International Standard
Organisation’s newly developed standard for greenhouse gas reporting. This standard
is one of several such initiatives, most notably the ‘Voluntary Carbon Standard’
established by the International Emissions Trading Association, The Climate Group,
the World Business Council for Sustainable Development, and the World Economic
Forum with the primary purpose of facilitating carbon trading. FTFA’s Carbon
Standard may be similarly used and PricewaterhouseCooper is actively engaged in
facilitating the carbon market brought into being by the Kyoto Protocol of the
United Nations Framework Convention on Climate Change (UNFCCC).
For Southern countries, trading is possible under Kyoto’s Clean Development
Mechanism (CDM). The rules require that a Northern organisation or business
must invest in a Southern CDM project, which results in lower carbon emissions
than a business-as-usual project. The Northern organisation is then credited with
the carbon emissions that are held to have been saved. It can either sell the carbon
credits or, if it is in danger of exceeding its own emission allowance, it can subtract
the presumed saving in the South from its actual emissions in the North.
Backsberg rejected trading on these terms because it means that South African
carbon rights are alienated to the North, but did expect to improve its brand position
particularly in Northern markets. It thus pioneered the addition of climate change
concerns to ethical trading, etcetera, at the producer end of global production
networks. In the North, the supermarkets were already on to the management of
these concerns. Not frying the planet is offered as one more consumer choice,
mainly aimed upmarket, in a basket of ethical, quality and brand choices. Overall
food-energy costs are rising, however. In Britain, the production, processing,
distribution and preparation of food now consumes one fifth of total energy. Lucas,
Shiva and Hines (2006) show that half the energy for transport is used within
exporting countries and between exporters and Britain, and one third of the energy
used for production, processing and packaging is expended in exporting countries.
Irrespective of the sincerity of individual initiatives, it is this larger dynamic
driven by global capital that both creates poverty, as workers are outsourced,
casualised or simply made redundant, and degrades local and global environments.
And it is in the interests of global capital that the voluntary codes and standards
are brought into being. Tree planting may bring its own benefits in particular cases,
but offsetting carbon emissions just from agriculture would require more land
than the planet has to offer. The question then arises as to whose land will be
appropriated as the carbon market clamours for offsets.

220
Toxic Futures
Box 7.5 Climate change on the farm
Wine farmers in the Western Cape have had several meetings with climate
scientists and are well aware of the threats. They expect that as the climate dries
out they will grow varieties now suited to the dry margins of the winelands. Agri-
Weskaap’s Opperman thinks there should be more active agricultural research
to help farmers deal with the coming changes but notes that national research
capacity has been run down. His vision for responding to climate change is not
limited to the Western Cape. He sees South African farmers expanding into the
rest of Africa as the next option. It seems unlikely that African peasants will
welcome this even if their governments do. Regulars at a Kalk Bay coffee shop
are less sanguine about climate change as they contemplate the possibility that
the railway line running along the coast will disappear under the water. Residents
of the low-lying Cape Flats have more immediate reason for concern. Many
settlements already experience regular flooding in storms and the intensity of
storms is likely to increase.
THE LOGIC OF AN ELITE FUTURE
The Western Province has set a target for 14% renewable energy by 2015 – the
most ambitious in the country. At the level of cities, Cape Town is leading the
debate with plans to expand renewable energy and boost efficiency. Its sustainable
energy policy aims to provide affordable energy for all while promoting the city’s
economic competitiveness.27 It thus repeats the dual strategy noted above.
South Africa certainly has plenty of scope for expanding renewables but it
should not be expected to sustain growth. Elmar Altvater comments that while
‘life on earth remains dependent on the radiation of the sun . . . it is impossible to
power the machine of capitalist accumulation and growth with thin solar radiation-
energy’ (2006: 9). This is because industrial capitalism works by debt financing
driven by compound interest. The owners of capital, whether they are lenders or
investors, require a profit that increases their capital. The enlarged sum must then
be reinvested because the system cannot tolerate ‘idle’ capital: profit itself must
make profit and the system as a whole must accelerate. This is achieved through
two strategies: increased productivity within the production system or by ‘making
the other guy pay’, that is through accumulation by dispossession.
The command of dense energy is essential to increasing productivity. At the
global scale, the International Energy Agency’s (IEA) projections of energy demand

221
Power trip
through to 2030 show what is required to maintain economic growth. Following
the point of peak oil, there will still be copious quantities of oil to be had, but
declining production will terminate growth in returns from rising productivity for
the system as a whole. What is left is accumulation by dispossession. This strategy
– enclosing people’s resources and externalising costs on to people and the
environment – pre-dates industrial capitalism and provided the initial capital for
industrialisation, but did not then disappear. It has always subsidised the ‘internal’
return of profits from the production system, imposing untold misery on people
in the colonies, the Third World and the global South. Since the ‘signal crisis’ of
the US-led regime of accumulation, and with the triumphant turn to neo-liberalism
in the 1980s, increasing returns from dispossession have compensated for
diminishing rates of return from the production system.
The logic of the crisis of the regime of accumulation thus converges with the
logic of the crisis of energy depletion. The dynamic of capitalism post-peak will
intensify present processes. In contrast to Bush, the Obama administration has
adopted a more inclusive rhetoric but has not abandoned accumulation by
dispossession or the war on terror 28 because it cannot abandon growth. Nor should
it be expected that any other nation state will spontaneously abandon growth for
this is the foundation of legitimacy within the international state system that brought
them into being.
Growth, however, is an impossible strategy in a shrinking energy system. The
supposedly common good of abundant energy will therefore be ‘transformed into
a “positional”, oligarchical or “club” good’ (Altvater 2006: 13) with access regulated
by price and violence. In spatial terms, this means it will be expropriated for the
ever more exclusive benefit of the elite enclaves brought into being in the past two
decades. Even as growth within these enclaves is sustained through the subsidy
from dispossession, increasingly pursued in the mode of disaster capitalism, the
enclaves of growth themselves will, in time, inevitably shrink. This, finally, is the
lesson of the 2006 power outages in Cape Town. The incompatibility of economic
growth with redistributive equity will grow ever more acute but the space of the
rich city itself will shrink as energy becomes unaffordable even to the middle
classes.

222
Toxic Futures
8
Future power
THE NATIONAL POWER CRASH in January 2008 appeared to come as a
shock. The public might be forgiven for not anticipating it. The Western Cape
blackouts were portrayed as a local matter while government and Eskom punted
South Africa’s cheap and abundant electricity to anyone with a few billion bucks
and a plan for massive additional consumption. Major corporations were most
forthcoming with such projects and utterly indifferent to energy efficiency. In
September 2007, Eskom briefed government and business to expect load-shedding.1
It nevertheless ‘reacted as if it were caught unaware’ when the lights went down,
according to the National Energy Regulator of South Africa’s (NERSA) report on
the crisis (2008: 9). It approached the crisis with eyes wide shut, forgetting the
Western Cape experience as one would a bad dream and making no active
preparations for a major loss of power. Further, it allowed its coal stockpiles to
decline throughout 2007, exaggerating a trend that began around 2001, even as it
used more coal to run plant harder to keep pace with rising demand.
The bulk of Eskom’s coal is supplied through long-term contracts from tied
collieries operated by major mining houses while the remainder is supplied through
short-term markets and trucked in. Eskom favoured emerging BEE companies
for both coal and trucking and purposely ran down its stockpiles from 60 to 20
days supply to expand the short-term business.2 At the same time, the tied mines
supplied to the lower limit of their contracts, according to Eskom, as the big
corporations focused on exports that were then returning rising profits.3
The weakness of Eskom’s management had long been cushioned by a very
large spinning margin. As the margin narrowed, plant was run harder, things broke
down and what had hitherto been shrugged off as minor problems turned into
major risks. Management could not see the difference. Nor, it seems, could any of
the other major players in the energy system within South Africa. All were captivated

223
Future power
by the faith of cheap and abundant power for industry. Bobby Godsell, a former
Anglo executive brought out of retirement in 2008 to chair Eskom’s board through
the crisis, subsequently joked that ‘South Africa has the cheapest energy in the
world . . .we just don’t happen to have any in stock’.4 Opening Eskom’s case for the
2009 price applications, he said the price must now cover the costs of expansion.
The national power crisis shifted the politics of energy. It exposed that politics
to unprecedented scrutiny and provoked conflicting responses. It opened a space
for public dissent but also confirmed the deep-rooted instincts of state and capital.
The first part of this chapter looks at the immediate response to the crisis and the
institutional fragility that it exposed and locates it in relation to the larger crises of
the times – into which South Africa also walks with eyes wide shut. The second
part looks at the contested future of power that is now under construction.
THINGS FALL APART
The response to the crisis was in marked contrast to that in the Western Cape.
Cabinet declared a national emergency on 25 January promising ‘vigorous and
coordinated action’ from what came to be called ‘team South Africa’. The heart of
the response was to be the Power Conservation Programme, intended to ration
demand in the short term while Eskom recovered itself, with longer-term demand-
side interventions to be fast-tracked. The pressure on Eskom’s margins would only
be relieved once the first of its big new coal-fired power plants came online in
2012. At the same time, Eskom’s new build would be accelerated.
It was soon evident that ‘team South Africa’ was government, Eskom and
corporate business, with the unions in the corridors and the rest of civil society not
invited. Government established two structures to manage the crisis: the Forum
of Energy Executives, composed of the state’s energy mandarins and meant to co-
ordinate government’s response; and the broader National Electricity Response
Team (NERT), which was chaired by the Department of Minerals and Energy
(DME) and included business and labour along with government departments and
state entities.
In the event, team South Africa barely held together. Despite the rhetoric, top-
level leadership from government was not evident. Eskom muddled through the
immediate crisis by imposing a 10% supply reduction on the big energy users, who
co-operated more or less grudgingly, with load-shedding for the rest. As the threat
of rolling blackouts receded after May, government lost interest and, following
Mbeki’s ousting, it abandoned NERT to the corporates. The DME chair did not
appear at meetings and money for the management of the structure was unpaid.5

224
Toxic Futures
NERSA opened another channel for a rather more vigorous public contestation
through its hearings on Eskom’s applications for price increases. Debate on South
Africa’s energy future thus appeared to be confined to the issue of price. Participants,
however, broached the questions of who was paying and for what. Eskom itself
extended the theatre of dissent through its own ineptitude. It repeatedly failed to
submit applications on time and then submitted interim applications with the
apparent intention of provoking panicked decisions in its favour while holding out
for doubled increases. Consequently, it repeatedly returned to NERSA with new
applications, each of which was met by a storm of protest from all sectors.
Nevertheless, it did manage to wring out a series of increases over the five
years to 2013, which totalled up to 137% above inflation. This is far less than it
asked for and said was needed both to pay the rising costs of coal and to finance
the borrowing for its ever-more expensive new build programme. The process
pointed out its own vulnerability on funding and access to capital but also the
vulnerability to which it exposes ordinary people and the country as a whole.
Government meanwhile lounged on the sidelines, raising the odd cheer for Eskom
but otherwise leaving a policy vacuum. In particular, it neglected to produce an
Integrated Resource Plan (IRP) required by law to guide both Eskom’s planning
and NERSA’s decision making. The Department of Energy (DOE, formerly DME)
finally produced a paltry three-pager of dubious legal standing on the eve of
NERSA’s 2010 hearings into Eskom’s multi-year price determination (MYPD)
application.6 It was immediately evident that, far from giving direction to Eskom,
it had taken direction from Eskom’s application. Policy on power, it seems, remains
with Eskom and, as ever, at the service of energy-intensive corporate industry.
As if to confirm this, the DOE implicitly admitted that it was incapable of
producing an IRP and, in February 2010, called in the minerals-energy complex A
list – Eskom, Anglo American, BHP Billiton, Sasol, Xstrata and the Chamber of
Mines – to do it for them. The existence of this ‘technical committee’ was revealed
through leaks to the press, meetings were behind closed doors and civil society
requests for minutes were refused.7 Of course, committee members had to share
‘proprietary’ technical information and the IRP 2010 finally released for public
comment was shorn of these details. It thus confirms that confidentiality is not an
issue between these competitors but is an issue between corporate South Africa
and the public.
Meanwhile, team Eskom was also falling apart. A boardroom tussle resulted in
Godsell resigning from the board and CEO Jacob Maroga being sacked. Maroga
sued for compensation of R95 million in lost earnings and benefits, exposing yet

225
Future power
again the inflated remuneration of top executives. At issue was his failure to present
a coherent funding model to the board and to renegotiate Special Pricing
Agreements with BHP Billiton. Maroga claimed neither issue was within his powers:
Eskom’s funding crisis resulted from the extraordinary costs of the new build and
the funding plan had to be negotiated with government. It was then subject to
NERSA’s decision on tariffs. ‘Buying back’ the power from Billiton would cost
$800 to 900 billion and was unaffordable. The sum presumably indicates the long-
term value of the contract to Billiton. The Special Pricing Agreements could not
be renegotiated without political backing from government, which was not
forthcoming.8 If this was true, it would appear that the political backing then
materialised. In April 2010, Eskom and Billiton announced that a new agreement
was being negotiated and that it ‘may involve BHP Billiton assuming responsibility
for the commodity pricing and currency exchange risks related to the contracts’
[emphasis added].9 The deal is claimed to be in the interests of both parties and of
the public. The public, however, is unlikely to gain any insight into its putative
benefits as the new deal will, like the existing deal, be ‘confidential’.
Economic hit
The chaos of the Western Cape was repeated across the country as water treatment
and sewage plants failed, small businesses floundered and large businesses installed
backup generators. Energy Minister Buyelwa Sonjica gave the nation tips on energy
saving and told people to stop whinging and go to bed early. The real focus was on
big industry.
Industry claimed large losses from both the outages and rationing and threatened
redundancies while labour rallied in defence of jobs. NERSA subsequently estimated
that R50 billion had been lost to the economy.10 Neva Makgetla, a former union
economist in the Presidency, attributed a decline in GDP growth from 5 to 2.1%
in the first quarter of 2008 directly to the power cuts. ‘For most of its history,’ she
argued, ‘South Africa has benefited from the tendency of precious metals prices to
rise when the world economy faces a crisis.’11 The power crisis undermined this
benefit. She recommended that residential and commercial users conserve electricity
in favour of the mines to restore ‘hopes for renewed growth’ – a proposal that
suggested the continued subordination of other interests to mining.
That was July. In October, the commodity boom turned to bust. The gold
price held up but, by the end of 2008, some 22 000 jobs were lost across the
economy with mining (including gold) and metal industries leading the losses.
Casualised workers were the first to go and it is doubtful that they were properly

226
Toxic Futures
represented in these figures. Industry said it was working to protect ‘permanent’
jobs but massive job cuts were planned in all sectors including services. Mining
giant Anglo American alone planned to cut 19 000 jobs. The flagship auto industry
shed thousands of jobs and more were lost on the showroom floor as both export
and domestic markets shrank. Government meanwhile represented its infrastructure
programme as a ‘countercyclical’ stimulus to the economy. The construction industry
is the immediate beneficiary of the programme, yet even here corporations were
getting rid of workers. Murray and Roberts retrenched 3 385 workers despite rising
profits. By the end of 2009, a million jobs had been lost across the economy and
more followed as the 2010 World Cup stadiums were completed.
Recession saved Eskom. As smelters and mines closed or went on to short
time, the spinning margin was restored from 5% in January 2008 to 14% in January
2009 – one point short of Eskom’s target of 15%. By 2010, commodity prices
were on the way back up and electricity demand followed. Eskom said it would
reach 2007 levels during the year and, although it added another 1 000 MW of new
build capacity in 2009, it anticipated a tightening spinning margin. Recession saved
another margin too: that between global oil supply and demand.
The sweet spot
The economic crash exposed the hollow foundations of growth even as it
demonstrated the vulnerability to its failure of those made dependent on it. Three
years earlier, reporting growth of 4.4% for 2004, Trevor Manuel said the economy
was ‘hitting the sweet spot’.12 It grew sweeter yet as the commodity boom pushed
growth to around 5.5% in 2007, seemingly within striking distance of the 6%
target. Yet the boom itself etched a corrosive insecurity into the fabric of the
economy and particularly into the lives of poor people.
In terms of energy security, South Africa’s vulnerability to peak oil and rising
oil prices appeared to be offset by its considerable coal reserves, by the large
proportion of fuel supplied by Sasol’s coal-to-liquid (CTL) plant, and by its sizeable
reserves of uranium. Nevertheless, imported crude oil still provides close to 70%
of fuel for transport and most people and goods were and are moved by road.
With very poor public transport and sprawling cities, the cost of working escalated
dramatically. So too did the cost of shopping at car-dependent malls, which rely on
road transport to bring in the goods. The growing and lucrative international tourist
trade was also beginning to feel the effects of high and volatile fuel prices. South
Africa’s energy-intensive agriculture saw steeply rising input costs with little benefit
from agricultural chemical production associated with the CTL process as Sasol
fixed prices at parity with imports.

227
Future power
A modicum of energy security does not protect South Africa from the economic
winds blowing through the global economy or that may be expected with peak oil.
Oil is South Africa’s largest import item and the rising cost was the key contributor
to the growing gap between the value of imports and exports in 2007. Record
trade deficits were covered by ‘hot money’ capital inflows as mining bosses started
talking of a commodity ‘super-cycle’ and prices escalated. The strong rand mitigated
the high price of oil imports but came at the cost of manufacturing, assumed to be
the major creator of jobs, as South African products were priced out of export
markets while cheap imports flooded into the local market.
Yet the commodity price boom was now being driven by the derailment of
global capital. Various commentators blamed the oil-price spike to $145 a barrel
on speculators but this was only part of the story. Money flooded into commodities
because all other options looked increasingly dire. When commodities collapsed in
mid-2008, the rand crashed to eleven to the dollar. In February 2009, The Economist
marked South Africa’s economy as one of the most vulnerable in the world as its
exports dried up, the trade deficit ballooned and the prospects for investment
seemed remote. It concluded: ‘The rand, which has already fallen sharply, remains
one of the most vulnerable emerging-market currencies’.13
The rand, however, defied expectations and rose sharply. First, the trade gap
shrank as corporate South Africa cut imports of machinery and plant for expansion
projects and indebted consumers stopped buying. Next, commodities recovered
to around the 2007 levels for two reasons: China’s massive stimulus programme
partly substituted for declining Northern demand for commodities including iron
ore, platinum and coal; and fund managers were once more buying into commodities
as a least worst option to dollars and equities. Finally, the rand was supported by
the ‘carry trade’ – money borrowed at zero interest in the US, Europe and Japan
and invested in relatively high interest regimes in the South. This is a species of
round tripping symptomatic of financialisation. It is initially paid for by Northern
taxpayers through the bailouts of the banks but then siphons money out of Southern
economies through dividends or profit taking on shares while also reducing the
competitiveness of exports. It thus supplements global capital’s pyramidal profits.14
In sum, rand strength has been less a sign of the resilience of the local economy
than of the weakness of the dollar and everything else. Meanwhile, the volatility of
the rand in an increasingly volatile global economy remains a key point of
vulnerability for South Africa’s economy.
The oil price escalation through to 2008 also fuelled inflation. In response, the
Reserve Bank lifted interest rates several times but, as Hendler et al. (2007) noted,

228
Toxic Futures
this cure seemed as likely to provoke a recession and so prove worse than the
illness. Indeed, it is a moot point whether the rising interest rate did not simply
compound the inflation imported with crude oil. But while ‘shocking inflation
numbers’ provided the justification for raising interest rates, it seems that the threat
to the value of the rand from the record trade deficits was the real concern.15 The
imperative was to keep the hot money flowing in. Food price inflation was
particularly severe and increases were steepest in poor urban and rural areas.
Unregulated trading created a volatile market in maize, the staple of poor South
Africans, and the price rose steeply from R500 a tonne in October 2005 to R1 300
in 2006 and over R1 900 in 2007.16 On 29 September, Western Cape farmworkers
on the minimum wage marched on parliament protesting that there had never
been such hunger in the land. Their cry was echoed around the world as bread riots
broke out in one country after another.
Booming the climate
The boom also produced an extraordinary intensification of greenhouse gas
emissions beyond even the worst-case scenario projected by the Intergovernmental
Panel on Climate Change (IPCC). Climate change, however, was not and is not a
compellingly immediate issue in the minds of politicians. South Africa ratified the
Kyoto Protocol covering the ‘first commitment period’ to 2012 as a ‘Non-Annex I’
country. As such it had no commitments to reduce emissions but is obliged to
collect climate-relevant information, to report its plans for mitigation and adaptation,
and to raise awareness. Ratifying Kyoto thus cost nothing but barely concealed
government hostility to what it made out to be a Northern environmental agenda
intended to constrain Southern development and keep the South in its subordinate
place. Thus, in the lead-up to the 2002 World Summit on Sustainable Development
in Johannesburg, South Africa’s top environmental official told the parliamentary
portfolio committee on environment that ‘developing countries were “taken for a
ride” in Rio with all the emphasis on environment and no focus on economic and
social issues’.17
Government later professed to take climate change seriously. In 2005, it paraded
six ministers at the first National Climate Change Conference. Speaking at the UN
in September 2007, Mbeki berated the US for not taking climate change seriously
and managed to sound like an environmental justice activist:
To billions of the poor [the] linkages [between poverty, the environment
and the use of natural resources] are real, the combination of their empty

229
Future power
bellies, their degraded environment and their exploited natural resources,
for which they benefit nothing, defines a hopeless and heart-wrenching
existence.18
However, his government’s priority for economic growth remained absolute. It
was widely expected that developing (Non-Annex I) countries would take
commitments to reduce emissions during the ‘second commitment period’
beginning in 2012. As the international climate negotiations began to focus on the
post-2012 deal, government participated more vigorously with the clear aim of
avoiding such commitments. This was in continuity with South Africa’s 2004
Response Strategy, which argued the priority for development over environment
in terms of global equity. It suggested that ‘the relocation of energy intensive
industries from Annex I [developed] to Non-Annex I [developing] countries should
be promoted’ although it recognised that this ‘may give rise to negative environmental
impacts’ and ‘do little to alleviate the problem of unemployment’. Further, South
Africa’s export coal markets should be expanded and protected: ‘Annex I parties
. . . should initially concentrate on domestic actions that will not negatively impact
on the market for fossil fuels from developing countries’ (DEAT 2004: 7).
South Africa was also an avid supporter of carbon trading, treating the Clean
Development Mechanism (CDM) as an alternative strategy to attract fixed direct
investment and complaining only that Africa does not get its share. The first South
African CDM project was an NGO initiative to install solar water heaters for people
in Kuyasa, in Cape Town’s Khayelitsha township. The project is repeatedly cited as
proof of the benefits of CDM. But the big money is not in solar water heaters or
in energy for poor people. In the polluted Vaal Triangle, the chemicals company
Omnia calculated on creating 500 000 carbon credits per year by reducing its nitrous
oxide emissions. Omnia got World Bank backing for trading the credits and expected
to make around R60 million a year – not a bad return on a capital investment of
R46 million.19 Similarly, Sasol registered a nitrous oxide abatement project and
‘expected to earn significant income’ from carbon credits. The credits started to
flow in August 2008 and the corporation is looking to develop several more CDM
projects.20 The logic is chilling: CDM is good business for polluters and the bigger
the polluter, the greater the opportunity for carbon credits.
The perverse rewards created by Kyoto’s trading regime played into the climate
negotiations. Southern countries came under heavy Northern pressure to accept
commitments on the Northern model of ‘grandfathering’ emissions rights. This
means that future emission reductions are tied to the ‘baseline’ of historic emissions.

230
Toxic Futures
So those countries with the biggest baseline get the biggest share of rights to emit
in the future. If South Africa had a conscious strategy for pushing up its greenhouse
gas emissions in anticipation of future reduction commitments, that strategy would
look exactly like what it was in fact doing before the power tripped out.
In the event, negotiations for the second commitment round collapsed in
multilateral recrimination and distrust in Copenhagen in December 2009 and
Southern countries will not be taking on binding commitments. South Africa,
however, made a voluntary offer to reduce its emissions by 34% from baseline by
2020 and to start reducing emissions in absolute terms around 2035. Baseline
represents the forecast for rising emissions if no mitigating action is taken. It was
calculated in 2006 in the middle of the commodity boom and was not revised to
take account of the bust. The offer has been held up as proof of South Africa’s
climate commitments and hence as justification for Eskom’s new build. We will
return to this in Chapter 10.
REMAKING THE COAL ECONOMY
If the blackouts lent a panicked urgency to the new build, the economic crash put
the squeeze on Eskom’s plans to fund it – particularly the capital plant imports –
from international capital markets. Credit was drying up and the Wall Street credit
ratings agencies – the watchdogs of global capital – put Eskom on ‘negative watch’.
In the 2008 budget, Finance Minister Trevor Manuel gave the utility a R60-billion
‘subordinated loan’ – effectively a capital injection – to shore up its balance sheet.
But the ratings agencies were looking for a steep increase in the price of electricity
to support repayment of loans for the expansion. Eskom applied to NERSA for a
60% hike but was granted 27%. Moody’s then downgraded Eskom’s credit rating
by four notches so raising the cost of capital on international finance markets. The
next day, news was fed to the media that Eskom was negotiating with the World
Bank for a $5-billion loan.
The Bank was thus cast as saviour and Bank president Robert Zoellick drove
the point home when he told the African Union that the loan was an example of
scaled-up assistance to African countries affected by the financial crisis.21 The image
of the Bank as the friend-in-need to Southern countries contrasted starkly with its
reputation for dictating structural adjustment programmes to supposedly sovereign
countries in order to enforce debt repayment to global capital. South Africa itself
had, in the Bank’s own words, previously regarded it as an ‘unwelcome suitor’.22
Given South Africa’s weight in Africa, Zoellick used the loan to signal that the
Bank’s political credibility was restored and/or that no country could afford to
avoid it.

231
Future power
In the event, the loan was subsequently fixed at $3.75 billion. The Bank said it
would bring financial stability to Eskom, support future economic growth, contribute
to poverty alleviation, and help South Africa on to a ‘low-carbon path’. This fits
with the Bank’s view of sustainable development and with the image it must cultivate
to support its aggressive positioning as the world’s leading broker of climate funding.
The use to which the loan will be put also fits with the Bank’s actual practice that is
starkly at odds with this image.
The first news of the loan drew sharp criticism and opposition has since grown.
It combines several strands in the justice movement: South Africans appalled by
the social and environmental costs; Africans who argue that South Africa has already
accumulated a ‘climate debt’ to the rest of the continent and see escalating carbon
emissions as a threat to survival; and international and local groups opposed both
to the World Bank’s fossil agenda and to its use of debt to dictate policy in the
South in the interests of global capital.
Pumping demand
Energy planning works on the assumption of growing demand and planning supply
to meet it. The electricity system is primarily designed to supply power to large
energy-intensive industries and mines that consume over 60% of power in most
years. The 36 members of the Intensive Energy Users Group consume 40%. The
very biggest users are the metal smelters supplied under long-term Special Pricing
Agreements at well below the cost of production.
Speaking in 2006 of the supply constraints, Public Enterprise Minister Erwin
said ‘we were caught napping by our own economic success’.23 Eskom was instructed
to base its planning on ASGISA’s 6% GDP growth target instead of actual growth
projections of around 4%, a planning assumption that risked inflating the figures
for future demand and over-building to meet them. Government policy of leveraging
the ‘competitive advantage’ of cheap energy was calculated to ensure that actual
demand did indeed inflate irrespective of the shrinking spinning margin.
A deal luring Rio Tinto Alcan to invest in an aluminium smelter at the Coega
Industrial Development Zone was symptomatic. While smelters were shutting down
in the North, largely because of the relatively high cost of electricity, South Africa
baited the deal with a hefty energy and tax subsidy to win it from China and Brazil.
As the deal was announced so too was the Developmental Electricity Pricing
Programme (DEPP). Alcan was to be the first beneficiary and would use half the
cut-rate power made available through the programme.

232
Toxic Futures
The rationality of this deal was questioned even by South Africa’s growth-
obsessed business press. A Business Day editorial asked: ‘How far will the government
go to attract foreign direct investment – and at what cost?’ Government spending
on Coega was heading towards R20 billion including R6.4 billion in high-voltage
transmission infrastructure to supply the power for the smelter. ‘As if that was not
enough, the government sweetened the deal with a R1.93 billion tax incentive.’
Business Day concluded:
Essentially, South Africans will therefore be heavily subsidising the Coega
smelter with cheap electricity at a time that they themselves will cough up
considerably more for power – if they can get it. It’s a lot to give away to a
project that can in no way guarantee that Coega will become the industrial
hub its creators dreamed of. 24
Alcan’s smelter was to produce 720 000 tonnes of aluminium a year from imported
alumina and would require 1 355 MW. As with BHP Billiton’s existing smelters,
South Africa would effectively export energy provided through the DEPP at cut
prices for at least 25 years. It was not clear if the DEPP replicated, or was additional
to, the commodity-linked pricing deal already enjoyed by Billiton. Government,
Eskom and Alcan used the usual alibi of ‘commercial confidentiality’ to conceal
just how cut the price was. The environmental organisation Earthlife Africa went
to court to force Eskom to reveal details of the deal in the public interest but was
refused.
Local organisations also questioned the deal, arguing that the environmental
and health costs would outweigh the benefits to the local economy. Greg Smith of
the Nelson Mandela Bay Municipality Local Environmentalists said decision makers
were ‘stuck in the poverty versus environment scenario. It doesn’t have to be like
that. We don’t have to destroy people’s health to give them jobs’. Alcan would
create only 1 000 jobs at a cost of R5 million each and ‘at least 300 will only be
available to highly skilled professionals, probably many from overseas’.25 The
pollution, however, would destroy other jobs and opportunities along with the
resources of an environmentally sensitive area.
Government invested its prestige as well as big money in Coega. After a decade
of trying to lure an anchor tenant, it evidently saw Alcan as a make-or-break deal
and anticipated that other transnationals would follow its lead. On its own account,
the Coega Development Corporation relied almost exclusively on ‘cheap and reliable
power’ to sell itself to investors and it ‘projected’ that other investments, not counting
Alcan, would result in the Industrial Development Zone consuming more power

233
Future power
than the 810 MW consumption of the Nelson Mandela Bay metro.26 Alcan pulled
the plug on the deal in 2009 citing Eskom’s inability to guarantee the power supply
but without mentioning the crashing commodity markets. Since then, Coega
Development Corporation has been scouting for an independent power producer
(IPP) to build a plant in the Industrial Development Zone. More broadly,
government is punting Thuyspunt, west of Port Elizabeth, as the site of a major
new nuclear plant on the grounds of its proximity to Coega.
Coega was not alone. Cheap energy for the capital- and energy-intensive
industries at the heart of South Africa’s minerals-energy complex remained central
to the state’s strategy for growth in the ‘first economy’ and to Eskom’s own growth
strategy. Major expansions were either planned or in progress in the Mpumalanga
platinum mines, at the Hillside and Mozal aluminium smelters, at Columbus Steel
and ArcelorMittal, and at Sasol, while Indian conglomerate Tata had started
construction on a high-carbon ferrochrome plant at Richards Bay. In each case, the
corporations would be haggling over the electricity price and seeking to ensure
that increases following from the costs of building new generating capacity were
laid at someone else’s door. The net result would be to lock in carbon-intensive
economic growth for the foreseeable future.
The Cape Town blackouts in 2006 stirred Eskom to a renewed rhetoric on
demand-side management (DSM). The DSM programme was introduced in 2003
to save 3 000 MW by 2013 and 8 000 MW, the equivalent of two new coal-fired
power stations, by 2025. It consistently missed its targets for energy savings until
the national blackouts compelled urgency. The 2013 target was then brought forward
to 2011. For 2008/2009, Eskom claimed savings of 916 MW against a target of
645 MW and cumulative savings of 2 000 MW since 2003. The programme was
focused on energy-efficient lighting, solar water heating and energy-efficient electric
motors used in industry. Cancellation of the Rio Tinto Alcan smelter, by comparison,
instantly knocked off 1 355 MW from forecast demand.
Cumulative savings on lighting seems more doubtful than Eskom claims. It
includes the savings made during the Western Cape crisis but subsequent research
has shown that households are replacing blown compact fluorescent lights (CFLs)
with cheaper bulbs (Mohlakoana and Annecke 2008). The solar water heater
programme appeared to end Eskom’s and government’s long-standing hostility to
this most basic of technologies. But the ‘roll-out’ has done anything but roll. The
programme provides subsidies in the form of a rebate following installation to
offset high capital costs. These costs have more or less doubled since the introduction
of the programme largely in response to Eskom’s technical requirements. In its

234
Toxic Futures
first year the programme supported the installation of just 1 400 units which hardly
adds to existing sales of 35 000 units a year. The subsidy amount was increased
substantially at the beginning of 2010 and now compensates fully for the increased
price. In 2010, the Department of Trade and Industry (DTI) also got round to
supporting ‘green’ industries. Its second Industrial Policy Action Plan (IPAP2)
specifies support for the solar water heaters and aims to increase the market to
250 000 units a year with domestic production rising from 20 000 to 200 000 units
over the next three years. IPAP2 notes that the industry is labour-intensive along
‘the entire supply chain’ (DTI 2010: 42) which rather begs the question of why it
has taken so long to support it.
IPAP2 also aims to ‘design and launch’ a programme promoting industrial
energy efficiency (45), a matter that has hitherto escaped its attention despite being
nominally part of Eskom’s DSM programme since 2003. Economic and industrial
expansion is the DTI’s raison d’êre and the basic assumption of Eskom’s planning.
The Jevons paradox therefore applies: energy efficiency expands overall energy
demand in the medium to long term. This may contradict assumptions made in
South Africa’s energy planning that efficiency correlates to energy ‘savings’, but
does not contradict either government or Eskom’s priority for growth.
In their vision of the future, energy conservation – with the intention of
reducing overall consumption – appears largely as a contingency. Conserving liquid
fuels by transforming transport is scarcely on the agenda while Eskom’s DSM is
primarily driven by the power shortage. The utility expects to have restored its
reserve margin of supply over peak demand by 2012. A second consideration is to
save on the escalating cost of building new power plants. This, however, goes
against the grain of Eskom’s history of aggressive marketing to expand electricity
sales. Even Engineering News observed the irony of Eskom ‘having to champion
efforts to curb consumption’ and suggested that its new-found devotion to
conservation might not survive once the new build programme had restored a
comfortable spinning margin.27 As with Eskom, government’s record suggests that
getting a return on its infrastructure investments will trump conservation as soon
as an expanded power supply is secured and irrespective of any rhetorical devotion
to climate mitigation. Its short attention span on NERT is symptomatic: con-
servation is an issue when the lights flicker out.
New build
Eskom CEO Jacob Maroga gave an update on the new build in January 2009 as
shown in Table 8.1. These are the projects initiated since 2004 and most are either

235
Future power
completed or under construction and will add 17 000 MW of capacity by 2018.
These generation projects are complemented by a major expansion of the grid
transmission capacity particularly on the long lines to Cape Town and to the new
demand centres such as the platinum basin and Coega.
Some 5 000 MW of this is peaking plant – either diesel-fired Open Cycle Gas
Turbines (OCGTs) or pumped storage. The OGCT plants are all running and the
Ingula pumped storage is under construction. Tubatse was postponed indefinitely
as Eskom saw the economic recession reducing peak power demand. The Sere
wind farm is not a peaking plant but was presumably too insignificant to be given
a separate category. Eskom has since talked up its commitment to renewables,
apparently under pressure from the World Bank, which needed a cloak, however
Table 8.1 Eskom’s new build.
Technology Name and location MWh
Peaking Plant Ankerlig,
OCGTAtlantis, Cape Town
2 080Gourikwa,Mossel Bay, Western Cape
Ingula,
Pumped storageVan Reenen, KZN/Free State
1 352
Tubatse,Limpopo/Mpumalanga
1 500
Wind Sere 100
Total 5 032
Expansion Arnot 300
Camden,Ermelo, Mpumalanga
1 520
Grootvlei,Balfour, Mpumalanga
1 170
Coal-fired base plant Komati,Middelburg/Bethal, Mpumalanga
955
Medupi,
New coalLephalale, Limpopo
4 764
Kusile,Witbank, Mpumalanga
4 800
Total 13 509
Source: Eskom CEO Jacob Maroga: ‘Presentation to the Media, 23 January 2009’.
Return to serviceof mothballedplant

236
Toxic Futures
thin, for its massive investment in coal. Sere is now due for completion in 2012.28
Eskom has also committed to build a 100 MW concentrated solar plant as a pilot
project.
The rest of the new build is base-load plant and all 13 500 MW is coal-fired.
Of the mothballed plants now being returned to service, Camden is complete and
several of the generating units in the other two plants have also been commissioned.
The two new plants, Kusile and Medupi, are under construction and will be the
third and fourth largest power plants in the world if completed. The first of Medupi’s
six units is to be commissioned in 2012 – although there are rumours that the
deadline will not be met – with the others following at six-monthly intervals for
completion in 2015. The first unit at Kusile was to come on line in 2013 with
completion in 2016 but the project has been delayed for a year. Eskom planned to
build a third such plant – known as Coal 3 – by 2018 but has cancelled it for want
of funding. It nevertheless said that the plant is necessary and that IPPs must build
the equivalent capacity.29 Coal 4 was to follow later in the decade.
The draft IRP 2010 displays the minerals-energy complex perspective on future
power. Integrated resource planning was introduced to shift planning from a one-
dimensional focus on supply. However, the IRP is best understood as a traditional
power expansion plan that justifies itself by projecting accelerated demand growth,
largely driven by a major expansion of minerals processing, topped by a 30%
spinning margin – double the international norm.30 It has two components: the
IRP itself covers the period to 2030 while a Medium-Term Risk Mitigation Plan
(MTRM) focuses in on the immediate future.
Assuming high-demand growth, MTRM anticipates short supplies through to
2016 despite Eskom’s new capacity and more active demand management. IPPs
are seen as filling the gap. Several major corporations are negotiating subsidies to
build or expand their own power production and ‘well advanced . . . projects can
produce between 1 000 MW and 1 500 MW by 2014’.31 Sasol was first up, expanding
its steam and power plant at Secunda from 320 to 600 MW to supply about half its
power demand. No electricity will go to the grid but Eskom will pay Sasol above
tariff rates and sell back at tariff rates. Anglo American and Xstrata are looking to
build plants fired by the coal wastes heaped at their mines on similar terms.32 Xstrata’s
project is specifically intended to power a new ferrochrome smelter.
Renewables are largely seen as the business of IPPs. In 2003, government set a
very modest target of 4% electricity production from renewables by 2013 but did
nothing to achieve it ahead of the power crash and the global depression. NERSA
237
Future power
set renewable feed in tariffs – which pay a higher rate for each kWh produced –
for several technologies in 2008. IPPs have lined up several projects but have been
blocked in negotiations with Eskom over the cost of connecting to the grid amongst
other things. MTRM sees IPPs installing 1 025 MW of renewables by 2014, less
than 2% of capacity and about 0.6% of production.
Over the longer term, IRP 2010 shows total capacity expanding to 80 500 MW
by 2030 and, from 2022, the new plant also replaces Eskom’s older coal-fired stations
which are due for decommissioning. Government now sees a niche role for
renewables both to create jobs and to moderate the carbon intensity of the economy.
The final IRP takes some account of declining costs and adds a further 17 800 MW
between 2014 and 2030. It does not take adequate account of very large savings in
water and associated infrastructure costs. Big base load remains the priority with
the equivalent of Coal 3 and half of Coal 4 (6 250 MW) being built between 2014
and 2030. This implies that coal-fired power survives at least to 2090.
Nuclear power is held to provide the only viable base-load alternative. Nukes
have long gripped the elite imagination. In 2007, government ministers talked up
extravagant plans for 20 000 to 27 000 MW of new nuclear capacity by 2030. The
bulk of it was to come from conventional pressurised water reactors (PWRs) while
25% was to come from Pebble Bed Modular Reactors. Eskom had already invited
bids from Areva and Westinghouse to build the first PWR – a very large 3 500
MW plant dubbed ‘Nuclear 1’ – but baulked at the price when the bids came in
and shelved the project. It has not revealed the price tag on the bids, but a good
guess would be two or three times the R100 to R120 billion that Eskom had
estimated and with plenty more room for escalation.
Government nevertheless insisted on pressing ahead with nuclear power and
its ambition to develop the nuclear supply chain industry from uranium mining
through to fuel fabrication. Instead of inviting bids for individual PWR stations, it
invited the nuclear corporations to bid for the role of ‘strategic partners’ in its
overall nuclear programme including a ‘fleet’ of PWRs. The IRP 2010 makes this
a fleet of six new plants totalling 9 600 MW. Supporting these plans, DTI’s IPAP2
observes: ‘A future nuclear programme will cost in excess of R1 trillion. This will
place enormous strain on the balance of payment and without an effective
localisation programme will have severe consequences for the South African
economy’ (2010: 88).
If they pull it off, the conventional nuclear programme will displace the Pebble
Bed Modular Reactor as the largest and most secretive industrial development

238
Toxic Futures
programme. Government sank several billions into developing this ‘fourth genera-
tion’ nuclear technology in which South Africa fancied itself a world leader. With
nothing to show for it, the programme was finally abandoned in 2010. Even the
skills necessary for localisation of the conventional programme have melted away.33
Government touts nuclear power as the means to reduce the extraordinary
carbon intensity of South Africa’s economy. Given its ambition to establish a full
supply chain, the nuclear industry as a whole will scarcely mitigate emissions. Be
that as it may, it seems that government hopes to get financial transfers on the back
of climate change to pay for what it patently cannot afford. At the same time, it is
looking for cheap nuclear options from South Korea and Russia.
Overall, IRP 2010 results in the following energy mix in 2030: coal produces
65% of the supply, nuclear 20% and renewables 9%. The rest is supplied by peaking
plant, a little gas and imports. DSM displaces 3 420 MW capacity, less than half
Eskom’s original target of 8 000 MW by 2025, equivalent to just 4% of the supply.
Coal and carbon
South Africa’s carbon dioxide emissions for 2004 are estimated at 440 million tonnes
(mt) with Eskom accounting for around 45%. In the year to March 2010, Eskom
burnt over 122 mt of coal and emitted 224.7 mt of carbon dioxide. As shown in
Table 8.2, the coal and carbon figures have increased with rising production as
Eskom has run its plant harder to keep up with demand. Coal use and carbon
emissions per unit of production are markedly up even though higher 2010 emissions
also reflect historical under-reporting as earlier figures do not include emissions
from the diesel peaking power plants. Eskom still does not report methane emissions
but is reckoned to emit 2 267 tonnes (49 874 CO2e) or close to 60% of national
methane emissions (Worthington 2009). IRP figures suggest that power system
emissions will peak at over 300 mt CO2 in 2022 and then level off at 275 mt in the
later 2020s.
Table 8.2 Production, coal and carbon.
Year to March 2010 2008 2004 2000
Production (GWh sold) 218 591 224 366 206 799 178 193Coal consumed (tonnes) 122 700 000 125 300 000 109 600 000 92 500 000Carbon dioxide (tonnes) 224 700 000 223 600 000 197 700 000 161 200 000
Adapted from Eskom Annual Reports 2008; 2010.
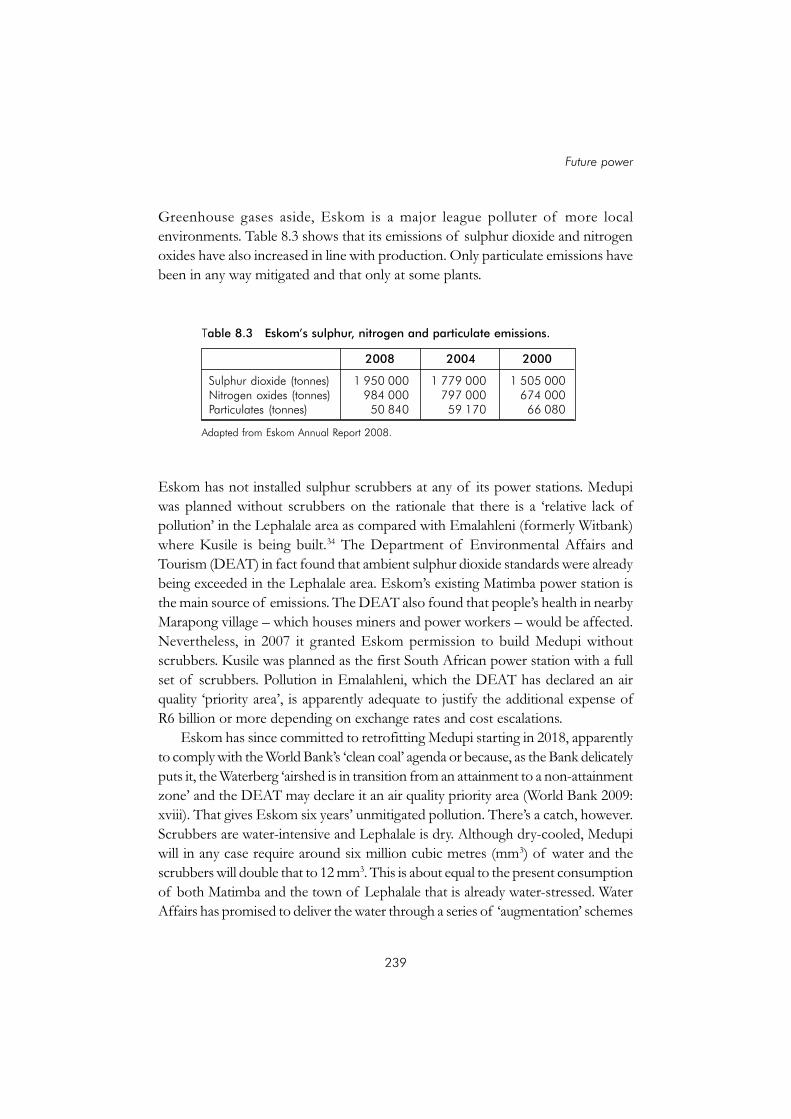
239
Future power
Greenhouse gases aside, Eskom is a major league polluter of more local
environments. Table 8.3 shows that its emissions of sulphur dioxide and nitrogen
oxides have also increased in line with production. Only particulate emissions have
been in any way mitigated and that only at some plants.
Eskom has not installed sulphur scrubbers at any of its power stations. Medupi
was planned without scrubbers on the rationale that there is a ‘relative lack of
pollution’ in the Lephalale area as compared with Emalahleni (formerly Witbank)
where Kusile is being built.34 The Department of Environmental Affairs and
Tourism (DEAT) in fact found that ambient sulphur dioxide standards were already
being exceeded in the Lephalale area. Eskom’s existing Matimba power station is
the main source of emissions. The DEAT also found that people’s health in nearby
Marapong village – which houses miners and power workers – would be affected.
Nevertheless, in 2007 it granted Eskom permission to build Medupi without
scrubbers. Kusile was planned as the first South African power station with a full
set of scrubbers. Pollution in Emalahleni, which the DEAT has declared an air
quality ‘priority area’, is apparently adequate to justify the additional expense of
R6 billion or more depending on exchange rates and cost escalations.
Eskom has since committed to retrofitting Medupi starting in 2018, apparently
to comply with the World Bank’s ‘clean coal’ agenda or because, as the Bank delicately
puts it, the Waterberg ‘airshed is in transition from an attainment to a non-attainment
zone’ and the DEAT may declare it an air quality priority area (World Bank 2009:
xviii). That gives Eskom six years’ unmitigated pollution. There’s a catch, however.
Scrubbers are water-intensive and Lephalale is dry. Although dry-cooled, Medupi
will in any case require around six million cubic metres (mm3) of water and the
scrubbers will double that to 12 mm3. This is about equal to the present consumption
of both Matimba and the town of Lephalale that is already water-stressed. Water
Affairs has promised to deliver the water through a series of ‘augmentation’ schemes
Table 8.3 Eskom’s sulphur, nitrogen and particulate emissions.
2008 2004 2000
Sulphur dioxide (tonnes) 1 950 000 1 779 000 1 505 000Nitrogen oxides (tonnes) 984 000 797 000 674 000Particulates (tonnes) 50 840 59 170 66 080
Adapted from Eskom Annual Report 2008.

240
Toxic Futures
but it remains to be seen whether Eskom’s commitment will hold come 2018, or
whether it then says that installing scrubbers is not feasible.
The coalfields of the Vaal and eastern highveld are now being depleted and the
Waterberg, said to hold 50% of remaining reserves, is identified as the new frontier.
Medupi is the first of a number of projects planned or mooted for the area. They
include further power plants – whether built by Eskom or IPPs – and Sasol’s
Mafutha project as well as the associated mines and coal export ventures. The
Department of Water Affairs (DWA)35 projects water demand rising more than
ten-fold to around 140 mm3 a year. Re-plumbing the local rivers at an estimated
cost of R10.5 billion barely covers the demand from Medupi without scrubbers.
Further development requires ‘augmentation’ from the Vaal and implies a massive
increase in water flow from the Vaal Dam and ultimately from the Lesotho Highlands
Water Scheme, the Thukela and other catchments on the Drakensberg escarpment.36
The governments of South Africa and Lesotho have approved Phase 2 of the
Lesotho Highlands Water Scheme – the construction of the Mashai Dam and water-
transfer infrastructure. This will be the third major dam to be built and, like the
others, will flood local people’s best valley lands. The existing dams have already
severely affected the downstream ecology of the rivers. The Mashai will add to the
impact as Lesotho’s rivers are drained dry.37 On a wider scale, the Crocodile River
augmentation would link the Limpopo into the national river plumbing that extends
in the other direction to the Sundays River in the Eastern Cape.
The combination of projects lining up for investment in the Waterberg thus
represents what David Harvey calls a ‘spatial fix’ on a grand scale. It involves not
just the fixing of investment in the Waterberg itself but the massive infrastructure
necessary to make them viable and to realise profits from them. There is a certain
reciprocity here. If the area is not developed on a grand scale, then the investment
in water infrastructure is not viable even on the narrow economic terms in which
it is justified. Supplying the water to Medupi thus already assumes the rapid expansion
of the area’s coal economy and must be accompanied by the roads, rails, wires and
pipelines to get the product out and, if Sasol’s project goes ahead, by a whole new
corporate-branded town.
Mining
Coal remains central to government’s vision of South Africa’s energy future. The
industry’s fortunes were boosted during the oil crisis of the 1970s, and it similarly
benefited from rising oil prices in the 2000s. The price of coal rose sharply from
$35 a tonne in 2003 to $65 in 2006, prompting speculation that coal ‘may overtake

241
Future power
oil as the best performing energy investment’.38 In the first half of 2008, it spiked
at $200 in European markets before crashing and then recovering along with the
oil price.
Eskom is fed the cheap stuff. Most is produced under long-term supply contracts
at ‘cost plus’. This creates the economic base of the coal industry, which can then
respond to market opportunities for higher-value exports and coking coal. Eskom’s
expansion requires a massive expansion in coalmining. In 2009, its planners said
R100 billion must be invested in coalmining with some 40 new mines required by
2018, including 35 new mines devoted to supplying Eskom.39
Exxaro’s Grootgeluk Mine on the Waterberg coalfield near Lephalale currently
supplies 14.6 mt a year to the Matimba power station as well as coking coal for
ArcelorMittal and coal for export. It is now being expanded to supply another
14.6 mt a year for Medupi under a long-term contract with Eskom. Sasol is currently
conducting field tests on the Waterberg coal characteristics as part of its feasibility
studies for Project Mafutha. The coalfield straddles the border with Botswana
where Canadian corporation CIC is planning the Mmamabula power plant intended
to export electricity to South Africa.
Emalahleni (formerly Witbank) on the Mpumalanga highveld has been at the
centre of the coal industry since the late nineteenth century when it supplied fuel
for the gold mines and subsequently for power stations. Eskom has contracted
AngloCoal to supply the Kusile plant with 17 mt a year. Some coal will come from
existing mines but the bulk will come from Anglo’s New Largo project, described
as a ‘greenfield’ development. Emalahleni’s designation as an air quality priority
area – or pollution hot spot – is well deserved. The mines add to the pollution
from the cluster of power stations in the area. Apart from emissions from heavy
equipment, opencast mines, mine tailings and old works are prone to spontaneous
combustion. In some places, fires have smouldered underground for over half a
century and the carbon emissions do not appear to be included in the national
account.
The pollution of water is even more intense. The streams and rivers downstream
of Emalahleni are ruined by acid mine drainage as described in Chapter 4. Nationally,
over 100 mines (not only coal) are operating without water permits. Water Affairs
Minister Buyelwa Sonjica told parliament that the department was ‘negotiating’
with them.40 Eskom’s mothballed plants are also located on the Mpumalanga
highveld and bringing them back into operation has driven new mining development.
The most convenient, and previously undeveloped, coal resource lies in the
Mpumalanga Lake District at the source of three major river catchments – the

242
Toxic Futures
Vaal, the Usuthu and the Komati. A rash of mining applications has been waved
through by the DME and some corporations have not waited even for its rubber
stamp. Most of the coal deposits are small-scale and will be worked out in as little
as five years. Acid mine drainage lags mine development by five to ten years. As the
mines close, the rivers will be poisoned at the source.
With the rising price, the export channel was pushed to its limit. By 2007,
South Africa was exporting about 72 mt of coal per year. Expanding the capacity
of the Richards Bay terminal and the rail corridor leading to it to over 90 mt was
the first priority in Transnet’s infrastructure development programme. The cost
was then put at R4.9 billion of Transnet’s five-year capital spend budget of
R47 billion. The Richards Bay terminal achieved its target of 91 mt capacity in
2010 but rail capacity lagged behind. Transnet is now targeting 81 mt on the coal
line in the next few years. It is also expanding capacity on its iron-ore export line
from the Sishen mines to Saldhana Bay and looking to develop a manganese export
channel possibly through Coega. Transnet’s 2010 five-year budget has increased to
R95 billion, with R52 billion for rail expansions, and it plans to invite exporters to
supplement that investment in ‘private public partnership’ deals.41
Europe remained the biggest export market during the boom but its demand
contracted sharply in 2008. India and China took up much of the slack. To maintain
economic growth of 8 to 10% a year, India plans a gargantuan expansion of its
power system from 148 000 to 800 000 MW by 2030. In the short term, it intends
increasing its coal-fired capacity from 77 000 to 127 000 MW.42 India routinely
runs short of supplies despite massive coal reserves and, assuming that it builds
only a fraction of what it plans, its appetite for imported coal would seem insatiable.
China is both the world’s largest producer and consumer of coal and, in the last
couple of years, has become a net importer on a grand scale.43 In contrast to Europe,
India and China are less demanding of quality. This suggests that expanding coal
exports will increasingly be in competition with Eskom’s low-quality demand.
Whether to Europe or Asia, it seems doubtful that climate change diplomacy will
penalise coal or energy-intensive exports any time soon.
The money
The World Bank’s loan was complemented by several other loans more or less
under World Bank management: two loans from the African Development Bank
(AfDB) totalling $3.1 billion and a Clean Technology Fund loan of $250 million.
Another $1.7 billion or so has been secured through the German and French export
credit agencies (ECAs) from private European banks to fund the boilers and turbines
243
Future power
for the coal plants.44 This adds up to some R60 billion.45 Medupi gets the bulk of
the money – $3 billion of the World Bank loan and $2.6 billion from the AfDB.
The World Bank loan allocates another $490 million to building a coal rail to the
Majuba power plant that is currently supplied by road. The Bank calls this an energy-
efficiency project. The remaining $260 million is allocated to the Sere wind farm
and the concentrated solar power pilot plant. The Clean Technology Fund loan is
also slated to support these two projects together with IPP wind projects, municipal
and private sector solar water heating projects, and industrial energy-efficiency
investments.
Treasury stands surety for the loans to Eskom. The World Bank required
Treasury guarantees and Manuel’s 2009 budget provided for R176 billion of loan
guarantees, covering both development bank and private lending. The risk was
thus shifted to the public purse.
Impressive as the figures were, a cavernous funding gap remained. From the
first announcement of the new build in 2005, Eskom’s five-year capital expenditure
has risen in giant steps. Eighty-four billion rand, a staggering sum at the time,
nearly doubled to R150 billion a year later. In February 2009, when Manuel recast
the infrastructure programme as ‘countercyclical spending’ to stimulate growth,
the spend to 2014 was put at R385 billion.46 The big coal-fired plants were central
to the escalation. First estimates were R30 billion for a big ‘six-pack’.47 By 2007, the
price tags on Medupi and Kusile were put at R79 billion and R84 billion respectively.
That has now escalated to R125 billion and R140 billion and it won’t stop there.
In September 2009, Eskom submitted its delayed application to NERSA for
the second MYPD. It asked for a 45% tariff increase in each of the three years
from 2010 to 2012 and indicated that it would spend R638 billion in the five years
to 2015. The application was greeted with the now familiar protest storm and, in
November, Eskom submitted a revised application for a 35% annual increase. The
five-year expenditure was then reduced to R500 billion while total spending in the
ten years to 2015 would come in at R645 billion.48
On Eskom’s account, these reductions followed from a review of its demand
forecast. Reduced demand resulted from a more aggressive implementation of
DSM and of the solar water heater programme in particular. But the most significant
reduction was from the cancellation of the Rio Tinto Alcan smelter.49 The lower
demand forecast then allowed a one-year delay on Kusile and so shifted major
spending to beyond 2012. This still left a R40 billion hole in Eskom’s funding and
the application indicated that Kusile was unaffordable without another round of
major tariff hikes. Eskom also cancelled Coal 3 and put a two-year delay – from
244
Toxic Futures
2020 to 2022 – on the first nuclear plant coming on stream to shift massive costs
out beyond 2015.
In part the price escalation reflected the general escalation of prices (steel,
cement, etcetera) during the boom when Eskom was contracting. This was a ‘seller’s
market’ in which utilities globally were competing for construction projects. In
2009, Eskom hoped that some prices would come down in a buyer’s market. There
is little sign of it in Eskom’s figures. Moreover, the big capital equipment is to be
imported and the import bill will be around 45% of the cost. The value of the rand
is thus likely to be more significant than any price reductions and Eskom’s own
demand for dollars will put considerable pressure on the currency. As Manuel put
it:
Lower consumer demand and the softer real exchange rate will dampen
import demand in 2009, but infrastructure investment will continue to draw
in capital goods. This will continue to generate a sizeable current account
deficit, expected to average 6.7 per cent a year over the period ahead.50
If Eskom thought 45% tariff hikes would later make 35% seem reasonable, it
miscalculated. Only government supported it, saying the lights would go out without
the increase. Business and labour said the economy would go out with it. During
the blackouts, they had both called for the new build programme to be expedited
but they also agreed that Eskom’s tariff demands would jeopardise a fragile recovery
and threaten jobs. The mines and big industry, however, accepted that Eskom
must recover costs. They thought 25% annual increases would be sufficient. On
this cue, that is indeed what NERSA finally decided. Eskom’s funding gap gaped
wider. It said it was R190 billion short over the seven years to 2017.51 Nearly
R100 billion of this was for the new build already under construction and most of
that was for Kusile. The remaining R90 billion was for projects still in planning –
mostly the first phases of its nuclear ambition. It appointed JP Morgan and Credit
Suisse to advise, respectively, on its funding plan and the sale of shares in Kusile.
COSATU rejected the increase and proposed the new build should be financed
through a special tax on corporations. Community groups and environmental justice
organisations were already on the streets at the NERSA hearings. They protested
that increasing numbers of South Africans would be cut off, resulting in increased
indoor air pollution from coal and paraffin with severe consequences for people’s
health. They also denounced the climate and other environmental impacts of the
new build. They too rejected NERSA’s award, noting that the 137% real increase in

245
Future power
tariffs in the five years to 2013 was unaffordable to the majority of households.
Following the NERSA hearings, and with the World Bank’s executive board still to
approve the loan to Eskom, they refocused their campaign to stop it and so pull
the funding on the new build. Two critical questions were at the core of their
concerns: cost recovery from whom and to pay for what?
Government was caught off guard by the intensity of the opposition to the
loan and was clearly affronted at being challenged by civil society in an international
forum. Energy Minister Dipuo Peters called opposition to the loan unpatriotic.
Finance Minister Pravin Gordhan misrepresented the campaign as the initiative of
Northern NGOs who were placing ‘environmental concerns . . . above the
economic needs of South Africa’. South Africa, he said, had committed to reducing
carbon emissions at the 2009 Copenhagen conference on climate change and it
had ‘a very clear plan’ to do so.52 The next chapter looks at the plan. The board
finally approved the loan in April 2010 but with four countries abstaining.
Box 8.1 The World Bank’s brighter future
Cost recovery is integral to the World Bank’s view of sustainability. It claims that
‘access to modern energy’ is critical to its core mission of fighting poverty because
it would liberate African people from subsistence chores and relieve women in
particular of the burden of gathering wood or carrying water. Private investment
is, in the Bank’s view, the evident answer. Small investors could, for example,
develop village-based energy systems using renewable technologies. Public-
private partnerships, if not outright privatisation of utilities, would take care of
larger investments. In either case, commercial terms are necessary to attract
private investment, which in turn ‘sharpens cost-consciousness and enforces
payment discipline’ according to a Bank paper put out for the World Summit on
Sustainable Development and titled ‘A brighter future? Energy in Africa’s
development’. It gets around the problem of how people without money will pay
market rates by ignoring it. Not surprisingly, hardly any investment in village
energy or renewables has taken place. As noted in Chapter 6, the Bank’s actual
projects have nothing to do with supplying local people or alleviating poverty
but are overwhelmingly about getting the resources out to the global markets.
246
Toxic Futures
At the NERSA hearings, community groups testified that many households would
be driven into penury by the increases demanded by Eskom. NERSA responded
by introducing a rising block tariff, long called for by civil society, covering all
residential consumers. This reduces the inequity within the residential sector as it
works somewhat like tax bands – those who consume more pay higher rates. The
distribution of the blocks is questionable however. Low-consumption households
would still face a sharp and unaffordable increase in electricity costs and it is not
clear how the scheme will be extended to those on prepaid meters. With only four
blocks, the top block captures most suburban and many township households and
adds no extra penalty for truly heroic consumers.
On the other side, as NERSA finally confirmed after years of evading the
issue, industries with long-term Special Pricing Agreements were exempt from the
tariff increases. Their very substantial share of the costs of the new build is thus
transferred to tariff customers. This is rather rich coming on top of the news that
Eskom made a R9.5 billion loss on ‘embedded derivatives’ – code for the link
between the price of electricity to BHP Billiton and the international aluminium
price – in 2008/2009. How much Billiton profited from this remains secret.53
Moreover, new questions were raised about actual prices charged to Eskom’s
energy-intensive tariff customers. In March 2010, Eskom told parliament that 138
large industrial customers would pay increased tariffs but that both the actual tariff
paid by each of them and the tariff increases were confidential.54 Earthlife Africa
shows that Eskom sells to them at very little over cost or at below cost. In 2008/
2009 it made a R3.2 billion ‘operating loss’ on top of the embedded derivatives
loss. The average selling price across all customers was 24.97 against average costs
of 27.63 cents/kWh. For 2007/2008, Earthlife estimated average tariffs at 11 to
14 cents/kWh for Billiton and 15 to 19 cents/kWh for other big users, as compared
with 38 cents/kWh for suburban consumers and 45 cents/kWh for people on
prepaid meters.55
Eskom argues that it is cheaper to supply bulk electricity to big users. This may
be so but largely because the entire electricity infrastructure is designed to deliver
to their needs. It hardwires social power relations into the technology of electrical
power. The new build reproduces that bias: it is required by industry, not households.
Government now says that the era of cheap power is over. Yet the wall of secrecy
protecting energy-intensive corporations from public scrutiny strongly suggests
that cheap and abundant power for industry remains at the core of South Africa’s
strategy for international competitiveness while households are made to buffer the
cost. To be sure, industrial tariff customers will face a sharp hike. This is offset by
rising power prices elsewhere in the world and it may be anticipated that the increase

247
Future power
is calibrated to keep the costs to power-hungry corporations comparatively low.
Since the largest consumers are listed in the major financial centres, the profits
reaped from cheap energy are returned to global investors to invest wherever in
the world will yield the highest return. When full power is restored, South Africa
will again offer cheap power to attract foreign direct investment by transnational
corporations. The capital for such investments will be from a global pool of profits,
which includes the profits originally produced by operations in South Africa.
Box 8.2 Coal stain
The World Bank’s loan specifically excludes the boilers and turbines for Medupi.
The African Development Bank (AfDB) loan is specifically for these components
only. The AfDB is to all intents and purposes the World Bank’s less scrutinised
branch in Africa and the two loans were clearly co-ordinated. The reason for this
split in funding is that Eskom awarded a R40 billion contract to Hitachi Power
Africa to supply the boilers for both Medupi and Kusile. They will be made by
Hitachi Europe which is located in Germany – hence the German export credit
agency loan.
Chancellor House, an investment company set up to fund the ANC, is Hitachi
Africa’s accredited BEE partner with a 25% shareholding. The ANC consequently
gets a very large rent off the deal. At the time that the boiler contract was awarded,
Valli Moosa was both chair of the Eskom board and on the ANC’s National
Executive Committee. The public protector, not hitherto known for making findings
that discomfort the ruling party, found that Moosa’s conduct was improper in
that he did not manage the conflict of interests appropriately. Prior to this finding,
ANC Treasurer Matthews Phosa admitted the conflict of interest and said that
Chancellor House would withdraw its stake in Hitachi. It did not do so.
The World Bank’s procurement rules prohibit lending to projects that benefit
a political party. The comfortable arrangement with the AfDB, which operates
under less stringent criteria, was patently a subterfuge to circumvent the rule.
The major European countries and the US are members of the AfDB as they are
of the World Bank. It must be assumed that they knew very well what the game
was. Once the matter was splashed across the international media, it seems that
some heavy diplomacy followed. Within days of the vote, Phosa again promised
that Chancellor House would sell the shares but was immediately contradicted
by ANC General Secretary Gwede Mantashe.56 Chancellor House has sub-
sequently said that it has no intention of selling its shares.

248
Toxic Futures
TERMINAL LOGIC
Despite the government makeover following the ANC’s Polokwane conference,
the executive has consistently reiterated its support for Eskom’s tariff applications.
Public Enterprise Minister Barbara Hogan sounded much like her predecessor
Alec Erwin as she argued that the new build would stall and the country black out
if the utility’s demands were not met. This view was shared by the World Bank and
other investors. According to the Bank, ‘effective pricing and cost recovery are key
for achieving financial sustainability for [South Africa’s] electricity sector’.57
Pricing is also a condition for private capital investment and opening up the
sector to transnational power corporations. Production costs from Eskom’s new
coal plants will be far higher than from existing plants in part because of the costs
of paying off the debt. New private plants will similarly need to pay off the capital
and, in addition, return a profit to the investors. Negotiations between IPPs and
Eskom, as the ‘single buyer’ of their electricity, have mostly foundered on the
question of price.
Price is, of course, capitalism’s basic approach to DSM although recession
proved rather more effective. Eskom attributes its 2009 operating loss to reduced
sales and increased coal costs. Its 2009 interim price application noted the potential
for higher prices to cut into demand as a critical risk. The failure of economic
recovery would result in an additional drop in sales and shrinking revenues would
further destabilise operations. This clearly points to the corporation’s dependence
on expanding volumes and to the limits of its conception of DSM. It also indicates
the other side of ‘effective pricing’. If the price increase retards economic recovery,
then Eskom is cutting at its own revenue base. It thus raises the possibility that cost
recovery and expanding sales have become incompatible.
This incompatibility will be exacerbated into the future. The major economic
actors focused on price but not on what they are paying for. They did not question
either the need for the new build nor its base in coal. Eskom made the rising coal
prices central to its argument for a higher tariff and argued that ‘the true economic
cost’ includes ‘the cost of increasingly scarce primary energy and the cost of shifting
to cleaner and renewable electricity generation technologies’.58 It did not mention
the external costs of pollution.
Government and World Bank statements notwithstanding, Eskom’s traditional
aversion to renewables remains evident in the limited ambition of the IRP 2010.
Instead, the new build ties power production to coal for the next 50 to 60 years on
the logic that South Africa’s energy-intensive economy relies on base load that
cannot be met by renewables. The limits of the global capacity to expand oil

249
Future power
production have been obscured by the recessionary collapse in demand. Even in
the absence of economic recovery, it is doubtful that supply will meet demand
much beyond 2012. Coal will then once more follow oil prices up even if the coal
supplies can be expanded. The moment of peak oil marks a terminal point in the
logic of the regime of capitalist accumulation.
A second terminal point is visible in the economic crisis. Eskom calls it a
‘downturn’ while government acknowledged in 2009 that South Africa was in
‘recession’. Neither word was adequate to the moment. The world was entering a
major depression. In contrast to the recession of the 1980s, which was managed to
restore the political power of the US, the managers of global capital have lost
control. Investors run from pillar to post to find a safe haven – now into US bonds,
now into emerging markets, now into commodities. The result is increased economic
volatility. Peak oil plays into the crisis. At the first sign of ‘green shoots’, the oil
price spikes as investors rush in only to strangle the shoots. There may be more
booms and even bigger busts to come but the global political and economic order
will not survive the next few decades.
Increasing the spinning margin is no doubt essential. Building R140-billion
power stations in anticipation of supplying yet more energy-intensive corporates
with cut-price power is hardly a sensible way of doing it. In taking on the debt, the
Treasury is making a double bet: that future economic growth, and the continuous
expansion of the energy system, will more than cover repayments; and that the
rand will hold its value. Otherwise the debt becomes a trap as it did for many
Southern economies in the 1980s. Neither bet looks good. Moreover, in conventional
economic terms, they pull in opposite directions. Because the debt must be repaid
in dollars, growth must be led by exports to earn the dollars. A high rand value,
however, will suppress exports of everything but commodities while also reducing
the rand value of commodities. Either way, the corporations listed in the global
centres will take the benefit of higher dollar prices while the squeeze is put on the
local operation and specifically on wages. In October 2010, the Treasury made its
choice in a game of double or quits. It doubled the guarantee on Eskom’s debt to
R350 billion rather than call it quits on Kusile, which, it appears, would not otherwise
be funded. On top of this, it indicated that it would inject a further R20 billion of
equity into Eskom.
The third terminal point is the ecological crisis. The costs are now escalating at
all scales, from the local consequences of pollution and the destruction of ‘ecological
services’ to the global consequences of climate change. The regime of accumulation
founded on growth is not compatible with addressing climate change. While the

250
Toxic Futures
global managers have thrown stupendous sums of money at saving the economy,
losing it now presents the best prospect of inadvertently saving the climate.
Anderson and Bows come to the reluctant conclusion that a ‘planned economic
recession’ would be necessary to avoid warming, not of 2 ºC, but of more than
4 ºC (2008: 18).
The World Bank, deeply involved in climate negotiations and financing as it is,
is not the institution to support the drastic change in direction that is required. The
South African government’s own assumptions are not very different from the Bank’s.
The new build is, after all, a home-grown idea. It was nurtured in an economy that
is based on cheap labour and cheap energy. For big industrial users, but not for
people, it provides the cheapest power in the world. This is the competitive advantage
that has made the country one of the world’s most carbon-intensive economies.
The managers of SA Inc are determined to retain the advantage. In doing so, they
are recreating the logic of an economy that is internally subordinated to the interests
of the minerals-energy complex and externally subordinated to the imperial market.
This is the economic model that the Bank set out to save with its loan.

251
Driving climate change
9
Driving climate change
THE PEOPLE ON THE STREETS of Copenhagen chanted, ‘Change the
system, not the climate’. Down the road, behind the police cordons and a
world away in the Bella Centre, the official delegates to the 2009 climate conference
did not hear them. Negotiating a serious response to climate change was not the
real agenda. It is precisely for that reason that heads of state felt compelled to
‘emphasise our strong political will to urgently combat climate change . . .’.1 Strong
political will was certainly evident in Copenhagen. The purpose of all major parties
was to defend their respective interests in the global accumulation of capital. In
their vision, this is what is meant by ‘development’. Their disagreements reflect the
conflicts inherent within that agenda. In particular, they reflect the dominance of
the North and the subordination of the South within the orders of capitalist
development.
The official meeting finally abandoned efforts at an agreement on the second
commitment period within the United Nations Framework Convention on Climate
Change (UNFCCC) process. It produced instead the ‘Copenhagen Accord’, a
political agreement made in a back room by the US with the ‘Basic’ countries –
Brazil, South Africa, India and China – and then endorsed by the leaders of 26
countries at a ‘non-meeting’ that lesser countries were told wasn’t happening. The
Danish chair of the final plenary of the official process tried to gavel agreement
on the Accord without discussion and before some delegations had even seen it.
When that failed, arm-twisting and threats followed. Finally, the Accord was not
adopted but merely ‘noted’ and its substance – or lack of it – was greeted with
dismay. Copenhagen broke up in disarray but, one year of heavy diplomacy later,
national delegates meeting in Cancun, Mexico, applauded themselves as they
effectively adopted the Accord. They had, they said, saved the UN process but,
some added, sacrificed the climate and people (Khor 2010).

252
Toxic Futures
Copenhagen marked the end of a pretence. The international process, or some
international process, will of course continue. It will be a ghostly charade, no longer
a pretence but now the pretence of a pretence, made necessary because the world’s
leaders cannot announce their failure nor admit the futility of a process that refuses
to address the central issue: the capitalist economy over which they preside cannot
be reconciled with a credible response to climate change. As La Via Campesina
leader Josie Riffaud put it: ‘Money and market solutions will not resolve the current
crisis. We need instead a radical change in the way we produce and we consume,
and this is what was not discussed in Copenhagen’.2 The organisation concluded
that the only way forward was with people’s movements.
This chapter gives a brief critical review of the history of the negotiations in
order to explore the common interest that lies beneath the conflict between the
parties. It then looks at South Africa’s Copenhagen offer to see how it stacks up
against the research that is said to underpin it. A critique of that research, the
Long-Term Mitigation Scenarios (LTMS), wraps up the chapter.3
FALSE DEALINGS
The UNFCCC and the Kyoto Protocol were negotiated under the sign of the
Washington Consensus. They make governments responsible for implementation
while private sector corporations are made the agents of implementation. This
agency, however, is voluntary and supposedly driven by the carbon market brought
into being by states.
The Convention recognises that developed and developing countries have
‘common but differentiated responsibilities’. This principle is meant to secure
developmental equity between North and South and its inclusion was seen by
Southern countries as a major victory. The Convention thus recognises first that
Northern countries are responsible for the bulk of emissions to date and are better
resourced to implement the agreement, and second that Southern countries have a
priority for development. It then emphasises ‘sustainable economic development’
within an ‘open international economic system’ – meaning a capitalist system –
and allows that all countries will define sustainable development in line with their
own development priorities. It distinguishes between Annex I (developed) countries
and ‘non-Annex I’ (developing) countries, with the former taking tougher
commitments and supporting the latter with financial and technology transfers.
The UNFCCC initially relied on voluntary reduction targets for Annex I
countries. No one volunteered. A binding agreement was therefore called for. Kyoto
is based on a proposal put forward in 1997 by the US under Bill Clinton and sets up

253
Driving climate change
emissions trading. This followed an earlier Brazilian proposal, rejected out of hand
by the US, that Northern countries exceeding their reduction targets should pay a
fine into a common pot that could then be used to finance projects in Southern
countries. The US proposal also displaced European proposals for a carbon tax.
The US essentially proposed a cap-and-trade scheme similar to one that it
claimed had successfully reduced sulphur dioxide emissions in the US. Larry
Lohmann (2006) has since shown the claim was in fact dubious although no one at
Kyoto had the information to dispute it.4 Nevertheless, no one really believed cap-
and-trade would work to reduce global carbon. The proposal was finally adopted
for two distinct reasons of political expediency. First, the preferred ‘market
mechanism’ of European Union (EU) negotiators was to tax emissions but, because
any EU tax requires a consensus of all member states, trading offered a politically
easier route (MacKenzie 2007). Second, it appeared that trading was a precondition
for US agreement. Having imposed its preferred system, however, the US exempted
itself from abiding by it. The Clinton administration avoided putting it to Congress
for ratification and, under George Bush, the US actively rejected Kyoto.
The Bush administration rejected Kyoto on the grounds that it was unfair for
Northern countries to take commitments if Southern countries did not. The US,
of course, knew Southern countries would not accept this. From the start, they
have refused commitments until the North demonstrates real reductions. They
argue that Northern countries developed on the back of high emissions and still
produce the majority of emissions. They also suspected, with some justification,
that the North was using the climate negotiations to lock in economic dominance
by blocking development in the South.
Following the US withdrawal, the EU took over as the champion of Kyoto and
of ‘multilateralism’. It led a series of negotiations culminating in the adoption of
the Kyoto Protocol at Bonn in 2001. The US nevertheless maintained a strong
presence in these negotiations where it used its outsider position, and the bait of
its possible ratification, to weaken the agreement. It thus substantially shaped the
outcomes of negotiations while exempting itself from the rules being negotiated.
Kyoto set mandatory emission reduction targets – the would-be cap5 – to be
achieved in the ‘first commitment period’ (2008 to 2012). It specified targets for
each Annex I country of between 8% below and 10% above emission levels in the
‘baseline’ year of 1990. This worked out as an overall reduction for all Annex I
countries of about 5%. NGOs under the umbrella of the Climate Action Network
International welcomed mandatory targets. Although the targets were woefully
inadequate, it was argued that they would be ratcheted up in successive five-year

254
Toxic Futures
commitment periods. Thus, in the ‘second commitment period’ beginning in 2012,
it was expected that Annex I countries would take on tougher targets while Non-
Annex I countries would also take mandatory reduction targets. The targets
themselves, however, were founded on the deeply inequitable principle of
‘grandfathering’ by which historic inequalities are enshrined and projected into the
future.
Kyoto set up carbon trading through three ‘flexible mechanisms’: Emissions
trading allows Annex I countries and corporations that exceed their reduction
targets to trade their surplus allocation with other Annex I countries that do not
meet the targets; Joint Implementation projects enable investors in one Annex I
country to invest in projects that produce less emissions than a business-as-usual
project in another Annex I country and to claim ‘carbon credits’ for the difference;
the Clean Development Mechanism (CDM) works in the same way except that the
investors must be from Annex I countries and CDM projects must be located in
Non-Annex I countries.
The stated objective of CDM was to support sustainable development in
Southern countries while reducing the costs to Annex I countries of meeting their
reduction targets. Thus, Northern polluters could invest in ‘clean development’
projects in the South and claim carbon credits known as ‘Certified Emissions
Reductions’ (CERs). Alternatively, they could buy CERs produced from CDM
projects on the market. The explicit reasoning behind this was first that the costs
of meeting targets would be unaffordable to Northern economies and second that
reductions would be cheaper in the South. It is thus founded on unequal
development – that is, on economic, social and environmental injustice.
Wolfgang Sachs (2005) concluded that negotiators ‘were charged with protecting
economic growth and not the climate’ to which end Kyoto embodies three strategies:
Northern obligations are transferred to the South and East – through CDMs and
Joint Implementations; obligations are discharged through sinks – that is, through
‘carbon-offset’ projects mainly located in the South and again funded through CDM;6
and negotiations are framed to focus on the economic tailpipe and exclude discussion
of driving interests in the engine room.
The effects of trading on carbon emissions are predictably dismal. The EU set
up its own internal emissions trading scheme, which has delivered profits to polluters
and traders without reducing emissions. This followed the over-allocation of give-
away emission rights to big corporations, notably the power utilities, effectively
lifting the cap right off the corporate heads and leading to a collapse in the carbon
price. It was then proposed to ratchet down the cap and also to auction emission
rights to corporations rather than give them away. Both proposals were the subject

255
Driving climate change
of intense political wrangling. A minor portion of credits (7%) have been auctioned
in Britain and Germany since 2008 and these two countries have since resisted the
formation of a single European auction system.
The crash in commodity prices similarly crashed the carbon price. European
industry slumped, energy consumption shrivelled, corporate revenues dwindled
and the creditors came knocking at their doors. What they had in surplus was
carbon credits that were sold off to plug the holes in their balance sheets. Got free,
they produced pure profit at whatever price. Credits dropped from around
33 euros to under 10 euros and have since traded at 12 or 13 euros. The only reason
the price didn’t disappear off the bottom of the charts is that corporations were
allowed to store up pollution rights by rolling their credits over from one year to
another. The cap evaporated.
CDM has an equally inglorious record. It invites players to ‘game the system’
and they have embraced the invitation. But even if the rules are followed, the
carbon accounting is based on a series of fictions and false assumptions, particularly
in respect of sinks. For Southern countries, CDM has simply created a new arena
of competition for foreign direct investment. Real or not, the carbon credits are
subtracted from the Northern country’s total carbon count and must logically be
added to the Southern country’s count. This is fudged. Thus, Sasol includes its
CDM projects in its strategy for reducing its greenhouse gas emissions. So it takes
the money from selling CERs but still reports the carbon reductions that are
simultaneously claimed by the buyers.7
Box 9.1 Trading targets away
Britain’s climate change bill was put to parliament in 2008. It requires that the
country’s CO2 emissions are cut by 60% by 2050 with legally binding interim
targets every five years. This, however, is at odds with its energy policy.
Environmental journalist George Monbiot observes that an obscure government
briefing note shows how the contradiction will be resolved:
It explains that, during the latest stage of the bill, the government ‘remov[ed]
the quantified limit on the use of internationally traded credits in meeting
the UK’s targets’. In other words we could buy the entire cut from other
countries . . . But there are three problems. The first is that we are exporting

256
Toxic Futures
emissions that are difficult to address and importing, through carbon
trading, the easiest and cheapest cuts.
The second is that while the emissions we export are certain and
verifiable, the cuts we buy through carbon credits are often fraudulent.
For example, as the writer Oliver Tickell documents, 96% of the carbon
credits from hydroelectric dam construction were issued after construction
had begun: the dams would have been built without the carbon market,
so no additional cuts have been achieved. Around 30% of all carbon
credits comes from the sale of trifluoromethane cuts by Chinese and Indian
companies making refrigeration gases. Many of them are still producing
this pollutant only because they make so much money from cleaning it
up: the carbon market pays them 47 times more for these cuts than the
gas costs to remove.
Behind these problems lurks a much greater one, which is mathemat-
ically impossible to resolve. You can trade your way out of trouble when
the cut you are trying to achieve is a small one. But when the global cut
required to prevent two degrees of warming is 60 or 80 or 90%, then
every rich nation must reduce its emissions by roughly the same amount.
Otherwise half the world would have to buy credits equivalent to 180% of
the emissions produced by the other half.
The government will have to impose some kind of cap on carbon
trading. But I bet it will be set high enough to cover any failures in domestic
policy, as measured by the rigged accounting methods civil servants use.
This means that successive governments will have no legal incentive to
change their energy policies. The carbon trading provision torpedoes the
useful content of the entire [climate change] bill.
Source: George Monbiot, ‘Traded away’, The Guardian (London), 24 July 2008.
The second non-commitment
The Fourth Assessment Report of the Intergovernmental Panel on Climate Change
(IPCC AR4) made it clear that the world is running out of time. Following its
release in 2007, the political classes appeared genuinely alarmed at the prospects of
climate change. The EU committed to a 20% unilateral reduction by 2020 and said
it would up this to 30% if equivalent reductions were forthcoming from other
Annex I countries – meaning the US. It gave itself generous space to meet these

257
Driving climate change
targets through trading CDM and Joint Implementation credits. In the US, Bush’s
denial of climate change became politically untenable and even ExxonMobil gave
up on this line.8 German proposals at the 2007 G8 for more stringent Annex I
targets were, however, rejected by the US, which proposed an alternative agreement
between major emitters, implying that the US won’t move without China and India
taking equal commitments.
China specifically ruled this out while announcing its own climate action plan,
claiming that ‘China will not tread the traditional path of industrialisation, featuring
high consumption and high emissions. In fact, we want to blaze a new path to
industrialisation’.9 In the world’s most polluted country, this seemed a somewhat
belated ambition. China has since become the world leader in building renewables
but remains the world leader in new coal projects and has overtaken the US as the
world’s largest emitter of CO2. The US still emits four times more per person but
China’s per capita emissions are now above the world average and well above any
credible per capita carbon allowance. On the basis of historical emissions per person,
Chinese academics argue that the country has used only 28% of its 1900 to 2050
carbon budget whereas the US has used 320% and most other Annex I countries
are also in deficit.10
The Bali conference of the parties, in December 2007, was to initiate the series
of negotiations to agree on the carbon regime for Kyoto’s second commitment
period. Here, the US appeared increasingly isolated as nation after nation castigated
it for blocking progress. In fact, the US was merely repeating the negotiating tactic
that had proved so successful at Kyoto. Once more it made its own participation in
‘the Bali roadmap’ the defining issue at the conference, holding out till the last
moment in order to create an appropriate level of desperation and exhaustion,
before appearing to concede. It then joined the ‘global consensus’ on the Bali
roadmap, but the roadmap now appeared without even the targets that were held
to be Kyoto’s saving grace. At the same time, Bali entrenched carbon trading.
National delegates, North and South, brooked no questioning of it. South Africa’s
environment minister spoke for the consensus view when he said there was no
going back on carbon trading. The result: trade but no cap.
Nevertheless, the world’s assembled politicians applauded the US ‘return to
multilateralism’. At the same time, the US attempted to keep open alternative
negotiations between big polluters and so to circumvent the multilateral UNFCCC
process. There were no takers as Bush limped off stage but the strategy was driven
through under President Barack Obama. The Copenhagen Accord was the result.
As George Monbiot remarked, negotiators would have done better to sign a blank
piece of paper.11 While small island states and Africa had argued that global warming

258
Toxic Futures
should be restricted to 1.5 ºC, the Accord aims for 2 ºC and avoids any mention of
the scale of reductions required to meet it. Instead, it invites each country to set its
own target, effectively restoring the voluntary pre-Kyoto approach, endorses carbon
trading and links it with sink offsets through ‘Reducing Emissions from
Deforestation and Forest Degradation’ (REDDs).12 In response to Southern
demands for financial transfers, US Foreign Secretary Hillary Clinton triumphantly
held out a bag marked $100 billion. There was nothing in it. It was a photo
opportunity promise and the excuses for breaking it are written into the Accord:
‘This funding will come from a wide variety of sources, public and private, bilateral
and multilateral, including alternative sources of finance’. No obligations for the
US or for Europe there. And it came with the threat that money would be made
available through the Accord – those who did not sign up would not be eligible.
Promises on technology transfer, another key Southern demand, are similarly empty
– as they have been since the signing of the UNFCCC.
This is what the delegates adopted in Cancun. By then, the sum of country
‘pledges’ made under the Copenhagen Accord, assuming they stick to them, implied
global heating of 4°C. The agreed 2°C target is thus meaningless. Carbon trading
saturates the text but is no longer supported even by the fraudulent logic of Kyoto
because the agreement dispenses with the very notion of a cap. Cancun did establish
a ‘Green Climate Fund’ under UN control, providing a glimmer of light that was
immediately snuffed out by putting the still empty fund under World Bank
management. It also established a ‘technology mechanism’ but, at the insistence of
the US and over Bolivian protests, avoided discussion of intellectual property rights,
the single most important block to technology access. Further, Cancun recognised
carbon capture and storage (CCS) as a valid mitigation technology eligible, amongst
other things, for carbon trading credits.
The international consensus was already in tatters on the way to Copenhagen.
The Europeans gave up on Kyoto as the US refused to buy into it. Southern nations
then rallied to ‘save Kyoto’ as they saw the North wriggling out of binding
commitments while shifting the burden of emission reduction onto the South.
Northern nations responded that without commitments from ‘major economies’
there was no hope of mitigating climate change. Southern commitments were
indeed anticipated in the second commitment period but this assumed that the
North would have already proved its credentials through serious reductions in the
first period. Most have effectively missed their modest targets – but for the recession,
all would miss it – and Canada simply tossed them in the bin because its targets
were incompatible with developing the tar-sands. ‘Binding’ has proved anything
but. Besides, the entire logic of Kyoto was to shift the burden south.

259
Driving climate change
Southern countries are clearly justified in treating Northern negotiators with
suspicion. Bad faith at the World Trade Organisation (WTO) negotiations is echoed
in the bad faith of Kyoto and Copenhagen. At the start in 1992, major Southern
countries essentially treated climate change as a Northern scam aimed to prevent
them climbing the ladder of development. They have since used the principle of
‘common but differentiated’ responsibilities merely to refuse significant
commitments. In doing so, they signed over to the North the power to define the
global response to climate change in its own interests. Kyoto’s one achievement
was to institute the carbon-trading regime. As one trader emphasised to negotiators,
‘the market’ cares only about the price of carbon, not about carbon reductions or
sustainable development (Lohmann 2006: 296). As a response to climate change,
Kyoto was bankrupt from the beginning. As an expression of the financialisation
of global capital, it remains exemplary.
Carbon bubbles
To recall, financialisation was one of two strategies to compensate for the squeeze
on profits consequent on over-accumulation. Spinning financial assets based on
debt through ever-more complex derivatives required the suspension of state
regulation in favour of market regulation to facilitate systemic fraud. Carbon trading
similarly turns the state’s regulatory function over to the markets in order to create
new profit streams out of thin air. This does not, however, imply the retreat of the
state. To the contrary, the profits of the market depend on the state’s creation of
property rights, which are not in carbon as such but in ‘avoided’ carbon emissions.
They are, curiously, rights in what is not. Within the European trading system, you
can sell the carbon you did not emit against what the state gave you the right to
emit. In the CDM, what you did not emit is calculated against what you would have
emitted in the business-as-usual world without the CDM project – that is, it is
calculated against a story of what will not be. As Lohmann (2006) argues, the
CDM ‘saves’ carbon against that fictional alternative future but has no relationship
to total carbon emissions. For example, CDM projects producing energy from
landfill gas in South Africa are held to displace energy from coal-fired plants
but do not relate to shutting down the equivalent amount of existing coal-fired
energy.13
The scope for gaming the system in this market is, as Monbiot put it, wide
enough to drive a Hummer through.14 More broadly, the hallmark of global
financialisation is stamped on the carbon market. It creates new instruments of
profit from trading, innovative accounting or outright fraud to compensate for

260
Toxic Futures
declining profits from production. Those profits then join the global pool of capital
and must be reinvested wherever the profiteer can find the best return. The profits
of trading must either go into expanding production – irrespective of whether
that is in a coalmine, a wind farm, a Hummer plant or a perfumery – or into the
bubble economy.15 Carbon funds grew fast. By 2008, $12.5 billion was invested and
being spun out through new derivatives according to Nicholas Hildyard (2008).
The good from Copenhagen-Cancun is that it deflated the market. Durban may
well be accounted a success if it provides air for that new bubble demanded by
investors. It is a market that awaits its Enron.
The profits of financialisation are not cost-free. Although counted as ‘value-
added’, Ben Fine argues that they are in fact ‘value-subtracted’ from the economy
(2008a). They represent a transfer of wealth from poor to rich in all countries and
from South to North globally. This appropriation relates financialisation to the
second, and interlinked, strategy used to compensate for declining profits of
production: accumulation by dispossession. Both externalisation and enclosures
have been documented as direct results of carbon trading. Externalisation is visited
on fenceline communities living next to polluting plants that can buy carbon credits
to stay in business. It is also visited on the neighbours of dodgy CDM projects.
Durban’s Bisasar Road landfill gas-to-energy project is a case in point. According
to the original proposal, it burns ‘dirty, low calorific value gas’ because this gas is
too dirty for use elsewhere and the costs of cleaning it were reckoned to be too
high for profitability.16 Enclosures are most often associated with sink offset projects.
Most involve planting trees and need land that is cheapest and where people’s
rights are not recognised. In Uganda, land in the Mount Elgon National Park has
long been disputed. In 2003, local people ripped up 400 hectares of exotic eucalyptus
trees planted to offset emissions from Dutch power stations. Subsequently, they
won a court ruling recognising their rights to the land. Ironically, these farmers
then started planting their own tropical fruit trees but these trees will get no carbon
credits because no Northern investor has rights in them.17
Theatre of conflict
The climate conflict was also played out in the politics of fossil-fuel funding prior
to the World Bank decision on the Eskom loan. Just as Copenhagen was reaching
its anti-climax, the US Treasury issued a guidance note saying that, to assist
developing countries mitigate carbon emissions, the Bank should not fund coal
projects except as a last resort. This looked very much like carbon imperialism.

261
Driving climate change
The US itself produces about a quarter of the world’s coal-fired power and it
provides large subsidies to domestic coal production.18 Indeed, in 2007 the US
industry looked to be booming with 150 new coal plants planned. The boom was
headed off by three factors: an unexpected reduction of gas prices consequent on
the shale gas boom; the recessionary contraction of demand; and a vigorous
campaign by environmentalists who blocked planning permission for over 130
plants. Further, the guidance was sent to World Bank president Robert Zoellick on
the day that the US announced to the Copenhagen conference that it would commit
to reducing carbon emissions by a mere 4% by 2020 – as compared with the 40%
that is the minimum requirement from Northern countries if even the inadequate
2 ºC target is to be met.19 The note thus embodied the US intention to impose
responsibility for carbon reductions on the South.
Southern country representatives on the Bank board objected strongly to the
use of the World Bank as an instrument of US power. At the same time, they
defended the use of Bank funding for fossil energy and specifically coal-fired power
stations, which they justified as necessary for ‘achieving poverty alleviation and
economic growth’.20 This is what India’s climate justice movement, in a memo
criticising their government’s approach to climate change negotiations, describes
as ‘hiding behind the poor’.21 The easy association of growth and poverty alleviation
ignores the rank dispossession and growing inequality that accompanies economic
growth in all countries. As the memo puts it, this development ‘has witnessed the
exploitation of natural resources, the greater displacement of adivasis and other
forest dwellers, intensified exploitation and continued pauperization of the urban
poor, casualisation and contractualisation of labour, and the promotion of
consumption by and production for elites’. The poor are mostly left worse off
than before. Even where their income improves on the conventional measures, the
gains are lost to cost recovery, to health costs imposed by pollution, to the loss of
resources including land and water, and to the increased cost of access to amenities
previously provided as public goods. And increasing numbers of poor people are
already feeling the harsh impacts of climate change.
As in South Africa, World Bank coal-power projects are primarily designed to
supply industry, not people. The industries in turn are mostly geared for export
and controlled by transnational corporations. The goods are then consumed
primarily in developed countries. The Southern countries themselves compete
vigorously for Northern corporate investments as industries move South looking
for the cheapest energy, labour and environmental regimes while the North rigs
the rules to keep profits, cheap goods and strategic resources flowing North.

262
Toxic Futures
The US drove the policies that resulted in this global restructuring of industry
and sent the Bank to impose them. It now calls for carbon savings in developing
countries while depending on them to produce carbon-intensive goods on the
cheap for the home market. Similarly, developing countries defend carbon-intensive
production in order to produce those goods while calling on developed countries
to reduce consumption. But neither side in fact wants what it is asking for – and it
is certainly not what they ask for in the WTO negotiations. It is difficult to avoid
the conclusion that the guidance note was intended to provoke the Southern
reaction.22 It keeps the conflict over climate change on the boil and conceals the
deeper common interest.
At the climate negotiations, the US is justifiably seen as the spoiler in chief but,
commenting on the 2008 G8 meeting, Walden Bello remarks that all Northern
governments ‘hang on to the position that economic growth can be “decoupled”
from energy use’ and energy decarbonised with a magical technofix or two. This is
a symptom of ‘growthmania’, a concept he takes from environmental economist
Herman Daly:
Growthmania . . . is a cultivated ideological predisposition that serves as a
protective shield for global capitalism. Capitalism is an expansive mode of
production, and it can only reproduce itself by continually transforming
living nature into dead commodities. This is essentially what growth is all
about. This is why ever-increasing consumption is so central to the engine
of profitability that drives capitalism.
The G8 – the directorate of global capitalism – is trying hard to avoid
just such radical controls on growth, consumption, profits, and the market
that a viable strategy to stave off the looming climate catastrophe will
necessitate. Voluntary cuts, technofixes, and carbon trading are desperate
efforts to prevent the inevitable.23
But growthmania is not the preserve of the North. In the name of ‘development’,
Southern governments are equally determined to defend economic growth and, as
Bello observes in another article, have shown a determination to catch up with the
North at whatever cost to the environment and to people. He disputes that this
elite view represents the South’s perspective on the environment and documents
the emergence of growing environmental and other movements resisting ‘a model
of growth that has failed both the environment and society’.24
263
Driving climate change
The disputes between Northern and Southern governments are the product
of a long history of unequal power relations but they conceal a common interest
in a dysfunctional climate regime. As Bello puts it:
When the Bush administration says it will not respect the Kyoto Protocol
because it does not bind China and India, and the Chinese and Indian
governments say they will not tolerate curbs on their greenhouse gas
emissions because the US has not ratified Kyoto, they are in fact playing
out an unholy alliance to allow their economic elites to continue to
evade their environmental responsibilities and free-ride on the rest of the
world.
A dysfunctional climate regime allows each to use the other as an alibi for inaction
or failure while rallying the home crowd in support. It also provides an alibi for the
world’s middle classes. In the European context, Monbiot observes that politicians
‘know that inside their electors there is a small but insistent voice asking them to
try and to fail. They know that if they have the misfortune to succeed, our lives
would have to change. They know that we can contemplate a transformation of
anyone’s existence but our own’ (2006: 213).
Several countries refused to let the Copenhagen Accord pass in the final plenary
at Copenhagen. They did so both in defence of the UN process and on substantive
grounds. US envoy Jonathan Pershing subsequently confirmed that the US would
sideline the UN process in favour of negotiations between the largest polluters.
He accused four Latin American opponents of US imperialism – Bolivia, Venezuela,
Nicaragua and Cuba – of blocking agreement on the Accord because they saw the
process ‘not so much as a solution to climate change, but in fact as a mechanism to
redistribute global wealth’.25 This misrepresents the scale of opposition to the
Accord. Nevertheless, it touches on the heart of the issue. In response to
Copenhagen, Bolivian president Evo Morales called a People’s Conference on
Climate Change and Mother Earth Rights in the city of Cochabamba, renowned
for the social movement that defeated the attempt to privatise Bolivia’s water.
Opening the conference, he put the issue bluntly: ‘Either capitalism lives or Mother
Earth lives’.26 Yet even here, the state initially tried to close down the dissident
‘Table 18’ where local movements fighting mine developments pointed to the
conflict between Bolivia’s promotion of privately owned extractive industries and
the conference theme of people living well with the earth. It may be hoped that
the movements of which Bello speaks will take charge of the processes that emerge

264
Toxic Futures
from the conference, that it is the sign of a growing power to shape the world’s
response to climate change.
For its part, Bolivia has kept faith with Cochabamba, attempting to insert key
demands into the negotiating text and, in a manner that can only be described as
heroic, standing alone against the abject agreement at Cancun. Word from insiders
to the negotiations is that several delegations wanted to support Bolivia but were
silenced by their political bosses. Morales was the only head of state who could not
be bullied or bribed into ordering his delegation into acquiescence. In breach of
UN procedure, which requires consensus, the agreement was gavelled over Bolivia’s
expressed objections.
SOUTH AFRICA’S OFFER
The South African offer at Copenhagen was hailed as a bold initiative. It is said to
be founded on the LTMS, a study commissioned by the Department of
Environmental Affairs and Tourism (DEAT) in 2006. The World Bank and
government itself have repeatedly cited both the offer and the LTMS as proof of
South Africa’s climate commitments. Medupi and Kusile, they say, are already
factored into the promised reduction so there can be no objection to these plants
on climate grounds.
The Copenhagen offer is for a 34% ‘deviation’ below baseline by 2020 and
42% below baseline by 2025. The baseline represents the projected increase in
emissions assuming ‘business as usual’ so these cuts are intended to trim the rate
of growth of emissions. Emissions are then to level off: ‘With financial, technology
and capacity building support from the international community, this will enable
South Africa’s greenhouse gas emissions to peak between 2020 and 2025, plateau
for approximately a decade and decline in absolute terms thereafter’. The offer is
conditional on ‘an ambitious, fair, effective and binding multilateral agreement under
the UNFCCC and its Kyoto Protocol’ being finalised at Mexico in December
2010.27 As the South African negotiators have repeated several times: no money,
no deal. And without a deal, no action.
The LTMS put forward two scenarios: ‘Growth without Constraints’ (GWC)
and ‘Required by Science’ (RBS). These two scenarios produce top and bottom
lines for emissions through to 2050 with 2003 as the starting year. Four ‘strategic
options’ look at ways of bending the top to the bottom line. Each is more ambitious
than the last. The first three options are called ‘Start Now’, ‘Scale Up’ and ‘Use the
Market’. Together they ‘only get South Africa two thirds of the way’ to RBS (DEAT
2007: 20).28 The fourth strategy, ‘Reach for the Goal’ attempts to close the remaining
gap.

265
Driving climate change
Growth without Constraints
GWC extrapolates from present trends. It assumes no action to mitigate climate
change and sees greenhouse gas emissions rising four-fold from 440 mt in 2003 to
1 600 mt by 2050. It shows emissions of about 750 mt of CO2e per year in 2020
and 870 mt in 2025.29 This is the baseline for South Africa’s offer and seems to
imply emissions targets of 495 mt in 2020 and 504 in 2025. This depends, however,
on how government rigs the numbers. Civil society demands for clarity were initially
met with silence but, eighteen months later, DEAT officials finally presented an
unusually candid take on the numbers and suggested ‘a new expression of our
objectives’ to take account of the ‘error range’ in the GWC projection.30 The 2020
target could then be put at between 418 and 571 mt and the 2025 target at between
412 and 599. Since they also confirmed that current emissions are around 540 mt
per year – and Medupi and Kusile alone will add another 60 to 70 mt – it seems
clear that it is the higher numbers that count.
The scenario reflects the assumptions that have shaped actual policy – before
those assumptions tripped on the power outage and the global depression. In GWC,
industrial policy remains focused on energy-intensive industries while coal and
Figure 9.1 GWC and RBS carbon emissions to 2050.
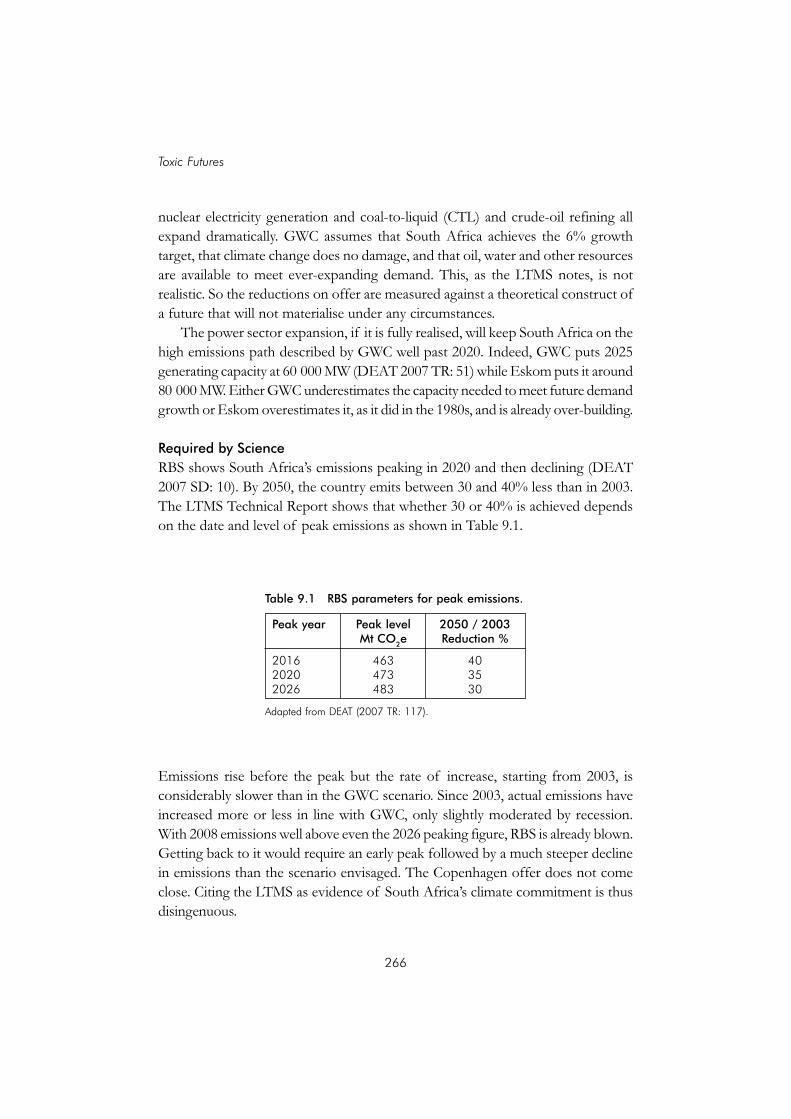
266
Toxic Futures
nuclear electricity generation and coal-to-liquid (CTL) and crude-oil refining all
expand dramatically. GWC assumes that South Africa achieves the 6% growth
target, that climate change does no damage, and that oil, water and other resources
are available to meet ever-expanding demand. This, as the LTMS notes, is not
realistic. So the reductions on offer are measured against a theoretical construct of
a future that will not materialise under any circumstances.
The power sector expansion, if it is fully realised, will keep South Africa on the
high emissions path described by GWC well past 2020. Indeed, GWC puts 2025
generating capacity at 60 000 MW (DEAT 2007 TR: 51) while Eskom puts it around
80 000 MW. Either GWC underestimates the capacity needed to meet future demand
growth or Eskom overestimates it, as it did in the 1980s, and is already over-building.
Required by Science
RBS shows South Africa’s emissions peaking in 2020 and then declining (DEAT
2007 SD: 10). By 2050, the country emits between 30 and 40% less than in 2003.
The LTMS Technical Report shows that whether 30 or 40% is achieved depends
on the date and level of peak emissions as shown in Table 9.1.
Emissions rise before the peak but the rate of increase, starting from 2003, is
considerably slower than in the GWC scenario. Since 2003, actual emissions have
increased more or less in line with GWC, only slightly moderated by recession.
With 2008 emissions well above even the 2026 peaking figure, RBS is already blown.
Getting back to it would require an early peak followed by a much steeper decline
in emissions than the scenario envisaged. The Copenhagen offer does not come
close. Citing the LTMS as evidence of South Africa’s climate commitment is thus
disingenuous.
Table 9.1 RBS parameters for peak emissions.
Peak year Peak level 2050 / 2003Mt CO
2e Reduction %
2016 463 402020 473 352026 483 30
Adapted from DEAT (2007 TR: 117).

267
Driving climate change
The next question is whether RBS itself is adequate. This scenario is defined
by the goal or target. It is not derived from the economy but from the logic of
climate change as set out by the IPCC AR4 produced in 2007. Having set the target
of a 30 to 40% reduction, it then works backwards to identify what needs to be
done to reach it. The target band is calculated on the assumption that the world
must reduce emissions by 50% by 2050 and that Northern countries make reductions
of 80%, so allowing more modest reductions in Southern countries. However, the
50% global reduction is at the bottom end of the range of 85 to 50% reductions,
which the IPCC says is necessary to keep temperature rise within the 2 to 2.4 ºC
range. Similarly, the LTMS says that global emissions must peak in 2015 whereas
the IPCC says emissions must peak between 2000 and 2015.31 Finally, by bundling
South Africa with the South in general, the LTMS gives it a free ride on the really
low emissions from least developed countries.
The IPCC report was itself a conservative assessment of the pace of climate
change. The reports are produced under the scrutiny of governments who cavil
over findings that might imply some qualification to their economic interests, and
they cannot take account of the latest studies. By the time of its publication such
studies showed, amongst other things, that actual emissions are running higher
than the most pessimistic of earlier IPCC projections, that the expected impacts
of climate change are happening earlier than expected, and that a 1 ºC rise is already
dangerous. The implications are: first, a 2 ºC rise may soon be inevitable but will
not prove ‘tolerable’; second, ecological feedbacks are already kicking in and picking
up pace; and third, reductions must be considerably more ambitious than the IPCC
says (see Box 5.1 in Chapter 5).
It must be concluded that the LTMS’s early target for South Africa’s emissions
to peak in 2016 is cutting it fine and, even if 2 ºC is accepted, the RBS bottom line
of a 40% reduction by 2050 is still too high. Limiting the rise in temperature
to 1.5 ºC, as demanded by the small-island states that will otherwise drown,
would require that carbon emissions are pretty much shut down within the next
decade.
That said, RBS ‘imagines a post-carbon world very different from ours, one
that is therefore difficult to describe in detail’ (DEAT 2007 SD: 11). Part of the
reason why it is difficult to imagine is that the energy planning model could not
find a way to meet projected future energy demands while at the same time meeting
the RBS target. The Technical Report concludes:

268
Toxic Futures
The RBS climate target cannot be met within this framework. This suggest[s]
that either one need[s] to redefine what is realistic (eg, re-considering the
extent to which mitigation options can be achieved ‘realistically’); or the
analysis needs to be conducted outside of the confines of a constrained
modelling approach (DEAT 2007P TR: 16).
The modelling tool in question is Markal (Market Allocation). It was developed by
the International Energy Agency (IEA) and is widely used by planners to model
possible energy futures. ‘The model is demand-driven, in that it starts from
projections of useful energy demand’ and is designed to match supply to growing
demand at the least cost (12). It assumes first, that supply can match projected
demand – Markal does not admit shortage – and second, that investors and
consumers make ‘rational choice’ decisions based on costs. For the reference case
(GWC), it assumes that development is a continuation of present trends: ‘For
instance, energy efficiency is only increased in line with historical trends’ (13). To
define mitigation actions within the first three strategy options, the model is
‘constrained’ by external criteria, such as a limit on carbon emissions or a target for
energy efficiency or renewable energy, imposed by the modellers. It then finds the
least-cost options within these parameters. These mitigation actions are nicknamed
‘wedges’ because, represented on a graph, each action shows a rising wedge of
carbon savings over time. As ever, the ‘saving’ is measured against business as usual
and represents a reduced rate of increase rather than a reduction of emissions.
The LTMS story of development
Although the economic costs of RBS cannot be modelled, LTMS finds this scenario
‘more robust’ than GWC. Table 9.2 shows the conditions in which each scenario
can survive, as presented by LTMS.
That GWC is entirely unrealistic has been noted above. In addition, LTMS
observes that both scenarios will fail if climate impacts become unmanageable but
adds that GWC actively contributes to that outcome. This point is well made but
the other assumptions shown in the table are less convincing. With the exception
of peak oil, they refer primarily to two international negotiation processes: the
UNFCCC and (implicitly) WTO processes.
Taking the assumptions relating to RBS:
• International climate consensus reached and effective: The LTMS does not
consider the possibility that a global consensus is reached but is not effective.

269
Driving climate change
The agreement in Cancun, however, confirms that ineffectiveness is the
condition of consensus.
• International flows of appropriate technology/finance: The UNFCCC
already promises technology transfers from North to South. The promise is
contradicted in the WTO process and has been dishonoured. Intellectual
property rights, leveraged on and designed to sustain unequal power relations,
remain at the core of the global technology regime.
• Peak oil arrives, oil scarce and expensive, coal premiums: Peak oil may drive
greater energy efficiency and technology innovation. Already, however, it is
driving greater energy and carbon intensity and dirtier production. There is
no reason to think that governments or corporations will focus innovation
driven by peak oil only on low carbon options rather than wringing the last
drops of liquid from fossil fuel by whatever means possible.
• High degree of trade integration and globalisation: Globalisation and
expanded trade have hardly contributed to reduced carbon emissions. The
WTO agenda is itself largely determined by those with power and in their
own interests. Indeed, the challenge to those interests by the more powerful
Southern states is the primary reason for the failure of the Doha Round.
The Southern challenge itself, however, is trapped within the same calculus
of power that dictates the position of Northern countries: it is about
competition for the rewards, in political and economic clout, of growthmania.
The LTMS does not in fact make an argument as to why it finds these four conditions
significant. It appears rather to take its cue from the IPCC Special Report on
Emissions Scenarios (SRES). IPCC has proved critical in terms of understanding
Table 9.2 Conditions under which the scenarios are plausible.
GWC is only robust if: RBS is only robust if:
• International climate consensuscollapse/fragment
• Technologies not developed ordon’t flow freely
• Oil cheap and abundant, nocarbon premium on coal
• Fragmented trade systems,bilaterals and free for all
• International climate consensusreached and effective
• International flows of appropriatetechnology/finance
• Peak oil arrives, oil scarce andexpensive, coal premiums
• High degree of trade integrationand globalisation
Source: DEAT (2007 SD: 12).

270
Toxic Futures
the biophysical processes driving climate change but is a good deal less convincing
when it comes to the social and economic systems because it cannot address power
relations or talk about capitalism. It sees patterns of inequality but cannot take
account of the interests that create, and are sustained by, inequality.
SRES develops four ‘scenario families’ through to 2100. These are not predictive
but designed to ‘explore’ the relationship between the main drivers of emissions,
which SRES identifies as economic growth, population and technology
development.32 All scenarios portray a wealthier world with reduced inequality,
though some less than others. Those scenarios with high levels of ‘global
convergence’ produce the best results for equity and, depending on technology
choices, the best long-term results for emissions reductions. Scenarios describing a
heterogeneous world in which societies are regionally or locally oriented end up, in
2100, with larger populations, greater inequality and higher emissions than the
equivalent globalised scenarios. The growing inequality actually produced by
globalisation thus far does not appear to inform the underlying assumptions.
IPCC naturalises ‘five stages of economic development’, which LTMS assumes
will shape future GDP growth in South Africa (TR: 25, 26):
• First, the pre-industrial economy, in which most resources must be devoted
to agriculture because of the low level of productivity;
• Second, the phase of capacity-building that leads to an economic acceleration;
• Third, the acceleration itself (about two decades);
• Fourth, industrialisation and catch-up to the ‘productivity frontiers’ prevailing
in the industrialised countries (about six decades);
• Fifth, the period of mass consumerism and the welfare state.
This harks back to the development theory constructed in the US in the 1950s and
1960s to provide economic mechanisms for extracting resources from the Third
World as a substitute for the direct colonial control of European imperialism. In
the context of the Cold War, that theory provided a justification for US global
hegemony in conflict with the Soviet Union and held up capitalism as the model
for all to copy. This is what defines the politics of ‘catch-up’.
As the LTMS applies the five stages to South Africa, the whole of the twentieth
century seems to disappear from the history of economic development. In one
brief reference to the apartheid legacy of inequality, it echoes Mbeki’s metaphor
of the dual economy. It then concludes: ‘South Africa could be described as being
an accelerating economy (stage 3)’ (TR: 26). This fits with ASGISA’s growth
objectives that LTMS explicitly takes into account. However, whereas ‘governments

271
Driving climate change
would like to project a continuously high GDP growth’, an examination of ‘other
developed regions of the world’ shows that ‘GDP growth increases, reaches a peak
and then declines’ (TR: 25). GDP growth is therefore projected to increase over
the next ten years or so to peak in about 2020 and then decline over time, ‘flattening
out around 3%’ by 2050 (27). Following the peak, South Africa presumably enters
the ‘industrialisation and catch-up’ stage and is on the way to the more equal society
implied by the fifth stage of ‘mass consumerism and the welfare state’.
There are several problems with this story of GDP growth. It is constructed
with reference to developed and industrialising states: post-war Europe and Japan,
South Korea between 1965 and 1990 and China since 1980. Except for China, all
these countries were on the frontiers of the Cold War and received massive US
support in the age of global Keynesianism. The neo-liberal Washington Consensus
since 1980 has been considerably less expansive. Countries where growth and
industrialisation failed, or which were de-industrialised, are not mentioned. Indeed,
economic growth in South Africa itself was running at 6% in the 1960s – just a
little below Korea’s 7% and certainly good enough to qualify as an accelerating
economy. Black workers and their families saw little benefit then and the working
classes will see little benefit now.
China’s industrialisation, on the back of massive peasant dispossession and
pitifully low wages for workers, signals a major shift in global power relations. It
does not, however, leave much space for industrialisation (stage 4) elsewhere. In
the triangular ordering of the global economy, South Africa’s dependence on
resource extraction is confirmed. Far from promising stages 4 and 5, this reinforces
the centrality of South Africa’s increasingly capital-intensive minerals-energy
complex.
LTMS is undoubtedly right to challenge government’s assumption of constantly
high growth. But the smooth graph of its own projection is embedded in a narrative
of development that equates development to GDP growth. This narrative is
now exhausted and will be shredded in the coming crisis. If anything, this adds
urgency to finding a path to, and beyond, RBS for reasons other than climate
change. It indicates the need for a wholesale transformation of power relations
within which a different logic of development can be articulated. This cannot be
led by the interests of corporate capital centred on the minerals-energy complex
that have shaped development to date. If such a transformation is to be achieved,
then people must organise for it and create the social movements that can bring it
into being.

272
Toxic Futures
Strategic options
The LTMS process was somewhat closed and, if not exactly secret, certainly very
discrete. This was justified on the grounds that Cabinet needed to be able to make
an ‘objective’ assessment of it free from political pressure. Participation in a
‘Scenario-Building Team’ was by invitation. Participants were selected ‘to cover’
different stakeholder groups and economic sectors and for their ‘known technical
expertise’ on climate change. They were supposedly there as individuals but are
mostly referred to as ‘stakeholders’. The Scenario Building Team was heavily
weighted in favour of government and industry.
The first three strategic options, and the wedges that compose them, were
modelled ‘bottom-up’ according to the Technical Report: ‘Stakeholders defined
mitigation actions [wedges], which were then modelled by the research teams’ (10).
The wedges are thus defined by economic sectors as they exist now and by
comparison with the way they are expected to grow in GWC. In general, they also
rely on data provided mostly by participants from government and industry and
on their assumptions about what is or is not feasible. The effect is that each wedge
is bound to the dominant interests in the relevant sector and, for the most part, the
emission savings are made without jeopardising those interests.
These first three options are composed of wedges that are modelled for costs,
emission reductions and economy-wide impacts. They fall into three categories:
energy supply, energy use and non-energy sectors (industrial process emissions,
waste and agriculture). Because it stalled the planning model, the fourth strategic
option has a different logic from the first three.
‘Start Now’ is rather modest. It includes a set of wedges that save money – or
at least cost very little – over time. The major wedges relating to energy use are
industrial energy efficiency, more people using public transport in preference to
private cars, and energy efficiency in cars. By 2050, the energy supply in this option
is 27% renewables, 27% nuclear and 27% ‘cleaner coal’. The remaining 19% is
traditional dirty coal. Renewables and nuclear, which is assumed to emit no carbon,
provide the big wedges. ‘Scale Up’ starts costing money. It adopts all the wedges
from ‘Start Now’, extends some and adds some. The extended wedges are for
renewables and nuclear energy, which each provide 50% of electricity in 2050.
This requires much larger generation capacity to compensate for the variability of
some renewables. Capacity is 180 000 MW in 2050 compared with 120 000 MW in
GWC.
‘Use the Market’ might more accurately have been titled ‘Economic Measures’.
Taxes on carbon emissions and subsidies for renewables influence prices to effect
decisions across the economy. A rising carbon tax – from R100/t CO2e in 2008, to
273
Driving climate change
R250 in 2020, and then to R750 after 2040 – produces the largest single wedge
modelled by LTMS. Coal-fired power starts closing down after 2025 as existing
stations reach the end of their life. New build is biased to renewables because of
the subsidy, with 118 000 MW installed by 2050 while nuclear adds 25 000 MW.
Total installed capacity is 150 000 MW. In liquid fuels, coal-to-liquid (CTL) is phased
out but five more crude refineries are built. The carbon tax has a smaller effect on
demand ‘than one would expect in reality’ and industry and transport emissions
continue to rise. In transport, this is because ‘other options are limited’ (DEAT
2007 SD: 19).
‘Start Now’ produces a saving to the economy but this is pocketed by the rich.
The poor are worse off. The cost to the economy comes in at about 1% of GDP
in ‘Scale Up’ and 2% in ‘Use the Market’. Here, however, the poor do slightly
better as the rich carry most of the cost. The LTMS does not show it but these
results reflect the bias inherent in GDP and other macro-economic indicators.33 A
percentage increase in the wealth of the rich contributes more to GDP growth
than a percentage increase in the wealth of the poor and a ‘saving to the economy’
is effectively a saving to the rich and to the corporations in which they invest. This
is what happens in ‘Start Now’ where savings are largely produced through energy
efficiency.
Industry dominates energy demand, has neglected efficiency and is responsible
for a high proportion of emissions. Industrial energy efficiency therefore makes
for the biggest wedge on the demand side as boilers, fans and pumps, etcetera are
made more efficient. The largest transport savings come from more efficient
vehicles, including limiting the market for SUVs and so forcing a shift to smaller
cars. The LTMS does not draw the conclusion that the conspicuous consumption
of the rich – which adds to GDP – is at the expense of everyone else as well as the
environment.
Nor does it take account of the ‘Jevons paradox’, explained in Chapter 5, that
energy efficiency leads to an overall increase in energy use within a capitalist
economy. The present Eskom crisis demonstrates both that a limit on energy supply
may push efficiency and that efficiency is meaningless if, as Bobby Godsell quipped,
there is no energy in stock. On the other hand, a radical reduction in demand
makes meeting it relatively easy. As a first step, the campaign against the World
Bank loan to Eskom called for phasing out the supply to the aluminium smelters,
so cutting demand by 10%.
The greater cost to the economy in the next two strategic options hits the class
of investors, corporate and individual, and must therefore curtail economic growth.
274
Toxic Futures
This is not a result that is wanted and the LTMS gets around it in two ways. In
‘Scale Up’ it assumes financial and technology transfers under the UNFCCC. In
‘Use the Market’ it proposes that the costs of the carbon tax should be offset by
government recycling the revenues through the economy. How that revenue is
distributed or invested would then become a critical political issue.
While cabinet has ‘adopted’ the LTMS, it is not clear what exactly that means.
Moreover, there is some dissonance between the LTMS and policy as it is revealed
by the actions of the state. Thus, the modest ‘Start Now’ shows renewables
producing 27% of electricity by 2030 while the latest revision of Integrated Resource
Plan (IRP) 2010 indicates 9%.34
Eskom itself is rather more excited by ‘clean coal’ technologies than by
renewables. In fact, Eskom has been researching most of these technologies for
well over a decade and long before it felt constrained to recognise climate change,
let alone to develop a ‘climate strategy’.35 For the most part they are simply the
latest coal-burn technologies given a green spin. Some are mature technologies
being applied in South Africa for the first time. Medupi and Kusile, for example,
will be supercritical steam generators and this is expected to improve the energy
conversion efficiency from 35% to around 40%.36 Others have yet to be proved
internationally. Thus, Eskom has a long-running research and development
programme on Underground Coal Gasification. The original motivation was to
access energy from coal in situations where, for geological reasons, mining is not
possible. It is thus primarily intended to expand the usable coal resource.37
Environmental benefits are nevertheless claimed relative to the impacts of mining.
Carbon capture and sequestration is the one technology that responds specifically
to climate change. Government and the big corporations have grasped this technical
fix to get coal off the climate hook. Kusile is to be ‘CCS ready’ although Eskom’s
technical supremo, Steve Lennon, admits that ‘no one really knows what that is at
the moment’.38 LTMS is distinctly cool towards CCS on power plants and allows
just 2 mt CO2 per year saving from it – which scarcely seems worth the cost. It
allows 23 mt per year for CCS from Sasol’s Secunda plant but remains sceptical for
three reasons: ‘South African geological conditions are not favourable for CCS’;
there is a severe penalty on conversion efficiency; and the technology is not proven
(DEAT 2007 TR: 81). Nevertheless, at the behest of government and with
sponsorship from Eskom, Sasol and Anglo American, a ‘CO2 Storage Atlas’ has
been prepared by the South African National Energy Research Institute and the
potential talked up.
The favoured option for ‘low-carbon’ generation was always nuclear power.

275
Driving climate change
For the generator, nuclear is indeed a low-carbon technology since carbon emissions
associated with nuclear are in construction, mining uranium, fabricating fuel,
disposing nuclear waste and finally, in decommissioning plant. Most of these
emissions will be attributed to someone else’s carbon account. Eskom’s 2008 Annual
Report shows nuclear saving about 70 mt of CO2 in 2025,39 which is more or less
in line with the LTMS ‘Scale Up’ projections. With government now talking of
9 600 instead of 20 000 MW of nuclear capacity by 2030 there is evidently a large
hole in Eskom’s climate strategy. While promoting nuclear power, neither Eskom
nor government seem particularly bothered by the contamination on the West
Rand discussed in Chapter 4.
In more optimistic times, Eskom liked to boast about the scale of capital
investment in the new coal plants, comparing the cost of Medupi and Kusile with
that of China’s Three Gorges Dam. These investments now carry a real risk of
bankrupting the country. The nuclear fantasy will escalate the risk. If a white rabbit
is plucked from the hat of climate funding, it will be just that – a conjuring trick
diverting attention from who gets stuck with the bill. And the initial investment
will be compounded by rising fuel prices.
The proponents of renewables see these massive investments as wasted
resources. South Africa has very good renewable resources, particularly for solar
energy, which have hitherto been ignored. Moreover, the development of a
renewables industry is within the scope of South Africa’s capacities. There would
now be a functioning industry if, in the last decade, renewables had been supported
on the scale of the Pebble Bed Modular Reactor. LTMS notes that renewables
create more jobs, particularly for lower-skilled workers, than conventional fossil
energy. In contrast, nuclear leads to an overall loss of jobs and most are high-
skilled (DEAT 2007 TR: 141). Holm et al. (2008) identify several other advantages
for renewables, including that several technologies are composed of many small-
scale units that can be built relatively quickly in response to actual demand rather
than uncertain projections of future demand; and that, being widely distributed,
they reduce transmission costs and minimise the risks of grid and plant failures.
‘Reach for the Goal’
The fourth strategic option does not follow the logic of wedges and, like RBS
itself, the economic costs of ‘Reach for the Goal’ cannot be calculated because it
relies on ‘unknown technologies and behavioural change’ (DEAT 2007 SD: 21).
LTMS proposes four sets of actions for this option:

276
Toxic Futures
1. New technology: Investing in technologies for the future
LTMS calls for ‘aggressive’ research and development. Technologies should be
identified for their potential to reduce emissions, particularly in the carbon-intensive
energy system, and on the level of risk and the potential for international technology
transfers. These last criteria assume that successful new technologies are those that
are developed and adopted globally rather than in isolation. Technologies are also
seen as integrated into systems and interacting with ‘human behaviour’: ‘An example
would be a decentralised grid, in which citizens can generate their own electricity
and pass surpluses back to the grid’ (SD: 21).
2. Resource identification: Searching for lower-carbon resources
LTMS proposes further investigation on importing hydro power from the Congo
and importing gas from the southern African region to substitute for coal.
3. People-oriented measures: Incentivised behaviour change
‘Changes in social behaviour, whether driven by policy, education, or awareness,
may yet prove to have large scale and low cost mitigation effects’ (SD: 22). In fact,
most of the changes proposed are systemic: changing the pattern of urban
development, including reducing distances between home, work and amenities;
shifting to public transport; localising food production and consumption, implying
a major effort around urban agriculture as well as enabling rural markets; responding
to urban population (including urbanisation) growth ‘and high commodity
expectations’; and ‘greening’ towns. People’s behaviour is located within systems:
however ‘aware’ they are, they can’t get on a bus that isn’t there.
4. Transition to a low-carbon economy: Redefining our competitive advantage
‘Perhaps the most difficult but most fundamental approach to mitigation would be
to shift South Africa’s economy away from its energy-intensive path’ (SD: 23).
LTMS argues that policy still defines South Africa’s competitive advantage around
energy-intensive sectors. This must change and moving to a low-carbon economy
must be integrated into industrial policy. This implies redirecting investment,
removing incentives designed to attract energy-intensive investments and using
the money to promote low-carbon sectors. Strategies to support energy-intensive
industries and workers to make the transition would also be needed. LTMS suggests
that such measures would support what is a natural process: ‘Over time, most
economies shift from primary and secondary sectors to tertiary sectors. South
Africa’s GDP has already shifted significantly from mining through manufacturing
to services’.

277
Driving climate change
With the exception of point 2, this seems to represent a radical departure from
present development policies. Whether it is or not, however, depends on how it is
read. The assumptions behind the LTMS’s larger story of development – the five
stages leading to a service-based economy – seem present in Cabinet’s adoption of
the strategy that commits to redefining competitive advantage and shifting to ‘a
climate-friendly path as part of a pro-growth, pro-development and pro-jobs
strategy’ and an industrial policy promoting ‘sectors using less energy per unit of
economic output’.
Yet the shift to services is not necessarily what it seems. First, many services
are dependent on energy-intensive industries as with Sasol’s chemical engineering
design services. Second, the development assumed by the LTMS is not universal
but reflects geo-political power and ranking. The major Northern economies have
outsourced production, along with the carbon emissions, and it is through services
that they retain control of production. Finally, Fine (2008a) notes that financial
services are now held to account for 20% of South African GDP. He argues that
this is a symptom of financialisation and does not represent the banks’ contribution
to the economy but the economy’s contribution to the banks. Further, the banks
themselves are closely tied to the major corporations at the heart of the minerals-
energy complex. One might add that carbon trading falls under financial services
and is similarly symptomatic of the parasitic financialisation of the global economy.
The LTMS doggedly abstracts its analysis from social power relations, but the
first real test of government commitment to RBS must lie in its readiness to confront
the power of the minerals-energy complex to shape development and appropriate
the proceeds. To date, it has acted to entrench the state’s own interest in the minerals-
energy complex. The ‘people-oriented measures’ imply major social and economic
investment. This will not be made within the terms allowed by the minerals-energy
complex or, indeed, by capital more broadly. As the evidence from Cape Town
shows, economic growth driven by global competitiveness and pro-poor
development are not compatible.
If the people-oriented measures are to mean anything, they must define the
shift to a low-carbon economy. These two sets of actions cannot be treated
independently of each other. Resources currently devoted to capital- and energy-
intensive growth in the service of capital must be redirected to create an economy
in the service of people. This will not be accomplished unless the process starts
with people and is about people taking control of their economies through the
process. Similarly, it should be recognised that technologies are not neutral but that
they embody social power relations. Investments in new technologies must therefore
278
Toxic Futures
be conceived as integral to this process. A decentralised grid based on many small
generators, for example, embodies a very different set of social relations to a
centralised grid based on a few giant plants while nuclear power entrenches the
political power of the minerals-energy complex and the security establishment
and, beyond that, of the imperial powers.
Out of bounds
RBS is uncosted because it cannot be achieved within the confines of current
planning models. The assumption that informs these models is that economic growth
constitutes the central organising principle of development. This is not because
growth is needed to alleviate poverty but because it is needed to reproduce capital.
This is what determines the bounds of realism in planning and it is this realism
that has produced the crisis of climate change, the crisis of peak oil and the political
and economic crisis gripping global capital.
The wedges were developed within the bounds of planning realism. Some
wedges indicate pathways leading out of these bounds but others are based on
interests vested in the present realism. In particular, LTMS energy modelling assumes
ever-increasing demand. It is this that could not be reconciled with the carbon
reductions required by science and it is this that will not be reconciled with declining
global oil production following peak oil. While the LTMS sees that RBS takes the
country into uncharted realms, it retains growth as the central organising principle
of development. It then takes the definition of national competitiveness as the
fundamental issue. National competitiveness, however, becomes necessary because
it is a function of growth. Rather than redefining national competitiveness, what is
needed is a radical redefinition of what is meant by development and who defines
it.
First, the central organising principle should be sustainable development
founded on economic, social and environmental justice. This means a commitment
to growing human solidarity and equality as well as a relationship to the environment
that enhances rather than degrades the functioning of ecosystems both for their
intrinsic value and for the ‘eco-services’ they provide. Put differently, it implies that
people recognise themselves as a living part of earth’s ecology. This does not imply
that economy and production are unimportant, but that the economy must serve
people, as may be inferred from the ‘people-oriented measures’, rather than people
serving the economy.
Second, peak oil implies either a compelled shift to economic localisation or
the exclusion of ever-more people from the shrinking enclaves of elite development.

279
Driving climate change
The choice for localisation follows from the choice for justice and is essential to
any serious programme to avoid catastrophic climate change. This implies that
national resources should be focused on supporting people’s capacities to direct
local development.
Third, if we are to address climate change, the energy system must be
transformed as a matter of urgency. The resistance to the new build programme
and the focus on energy-intensive industries and development creates the beginnings
of a movement with that purpose. Overall, energy systems including power
generation should be localised and placed under people’s common control.
Maintaining a level of national and regional grid capacity will remain important
and this capacity should be provided by renewables. An aggressive programme of
renewable energy, including solar water heaters, should therefore be prioritised.
Supporting the capacity for local production of renewable energy components
should be made central to industrial development policy.
Fourth, the transition to a different energy and development order will require
energy inputs from the declining fossil-fuel system. If these investments go into
the declining system, they will represent a permanent loss. In the period between
now and the latest credible peak emission target date of 2015, fossil-fuel resources
should therefore be used to build the new system.
Fifth, food is the most basic form of energy for people and the food system
must be thoroughly transformed to enable people to define and take control of
production and consumption and hence of their own futures.

280
Toxic Futures
10
Change coming
AGRICULTURE IS OFTEN represented as a backward sector of the economy.
In the post-war period it was progressively industrialised, with state support,
throughout the world and this process has been accompanied by a depopulation
of the rural landscape as machinery and chemicals increasingly replaced labour.
Investments and growth in local economies were associated both with job-shedding
and with a concentration of land ownership as smaller commercial farmers fell
behind in the technology race. In most countries, the better part of the value of
state support was captured by large corporations. Now, with the withdrawal of
state support in Southern countries, the market is capitalising on those earlier
investments and the process of depopulation is intensified.
What has happened on the farms is now happening in the factories. The industrial
landscape is being depopulated. Workers are being swept out of both farms and
factories and they and their families are forced to find shelter where they can in
increasingly impoverished urban settlements. The service sector – particularly
tourism and call centres – is now looked to for jobs. Services are, however, very
diverse and people are already being replaced by computerisation in many areas
such as financial services. Indeed, call centres themselves exemplify this. As they
centralise functions such as bookings and information in one place, they destroy
local jobs in other places both within South Africa and across the world. Globally,
they destroy more jobs than they create and they pay less per job. In the name of
productivity, that is precisely what they are meant to do.
The post-war promise of full employment within the Fordist regime of
production, backed by the safety net of the welfare state, held good only for the
First World. It was the outcome of struggles between Northern social movements
and the managers of capital but it was underpinned by the transfer of resources
from the Third World. Since the 1980s, under the neo-liberal regime, employment

281
Change coming
and welfare in the industrialised countries have been leached away. As financier
Warren Buffet is reputed to have said: ‘If there is such a thing as class war, my
side is winning’. In the Third World, full employment was the political privilege
afforded only to certain categories of people – whites in South Africa. For most
of the rest, labour was coerced into the factories at pitiful wages and only as it was
needed.
Across the Third World now, the workers abandoned to poverty are being
joined by people whose subsistence economies subsidised industrialisation to much
the same effect as the ‘reserves’ and ‘homelands’ did in South Africa. These
economies staggered under the burden and the environmental resources of land,
water and biodiversity that maintained them, and were previously maintained
by them, eroded away. This erosion has undermined the resilience of local
environments, making them ever-more vulnerable to the stress of drought and
flood. On the other side of the fence, industrial agriculture has also undermined
environmental resilience, destroying forests and wetlands, compacting soils under
the weight of machinery and substituting chemicals for organic fertility. Thus it
was, in the drought of the early 1990s, that thousands of people abandoned what
remained of production in the homelands and thousands of farmworkers lost
their jobs, creating a ‘pulse’ of migration to towns and cities.
These disasters are still called ‘natural’. They get less natural all the time. It is
no longer just that environmental resilience is destroyed on the ground, but the
climate itself is made more erratic and extreme under the impact of industrial
emissions. The people who flee these unnatural disasters mostly join those already
crowded in urban shack settlements located on land that is not valued by the urban
real estate market. This land is often in flood zones, on steep slopes or in polluted
areas, and the shack settlements are inadequately served, if at all, with water, energy,
sanitation and waste removal. Here, people face a new round of environmental
disaster from contaminated floodwater and mudslides, from periodic outbreaks of
disease, and from the fires that repeatedly burn through them.
A third of the world’s urban people now live in slums, mostly in the Third
World, in old working-class areas drained of income as well as in shack settlements.
Almost all the growth in the world’s population is being absorbed into the ranks of
the urban poor while the population in rural and richer urban areas is, or soon will
be, declining. Both the absolute number of people and the proportion of the world’s
population living in slums are therefore rising fast. At the same time, inequality
between rich and poor countries and between rich and poor people everywhere
has been taken to an extremity as the proceeds of economic growth are appropriated

282
Toxic Futures
almost exclusively by the rich. Thus has the plight of the wretched of the earth
come full circle. Those dispossessed in the countryside and forced into, or to
subsidise, the work of urban industrialism are now also dispossessed in the cities
to which they were and are being driven.
Contrary to the spurious arguments of the World Bank and major powers, the
environmental impacts associated with poverty are not caused by poverty. Poverty
is as much a sign of unsustainable development as environmental degradation and
for the same reason: both are produced by the working of the economy that
concentrates wealth in the hands of the few – and particularly in the hands of
fewer and fewer corporations who are then able to decide where and how to reinvest
it and so determine the future of development. Under the rule of neo-liberalism,
the practices of capital at the periphery have thus returned to its centre and the
system as a whole now feeds on its own entrails.
FOR PEOPLE’S POWER
It may be tempting to trust that peak oil and economic depression will achieve the
necessary reductions in carbon dioxide emissions. That depression is the best hope
for credible emission reductions in the elite future is the ultimate expression of the
meaning of unsustainable development. The politics of elite power remains
inseparable from capitalist growth. As that power begins to fail, it is ever-more
brutally imposed every day on people and their environments and it will finally
cost the earth. Those who are represented as the leaders of the world cannot
conceive another way and cannot confront the challenges of the time. Time is
short: the world is on the cusp of runaway climate change – the point at which
natural feedback loops such as the melting of ice become more significant than
industrial emissions. Time is short: the growth machine is running low on fuel
while the elites remain determined to suck the last drop of oil to preserve an
impossible political order. It is necessary that a different order and logic of politics
come into being.
The elite energy agenda creates resistance everywhere and everywhere people
create the possibilities of new life. This chapter tries to convey something of the
creativity of people’s responses to crisis. It recounts people’s call for food and
energy ‘sovereignty’ – the demand that people must control the resources necessary
for life, that they take the power of decision making and, in so doing, that they
make a future fundamentally different to that planned by the elites. How they
respond is different in different places. In Cuba the state followed and supported
the people’s lead. Elsewhere, people are consciously anticipating peak oil. In very
283
Change coming
many places, crisis is visited on people by those who speak in their name but put
themselves at the service of elite power. Resistance is then made an immediate
necessity of life but it is always accompanied by a vision of another world. It is in
these actions that hope resides.
New life
In the way industrial economies are described, agriculture appears almost as a residual
sector contributing a minor proportion of GDP and invariably bracketed from the
rest of the economy. Thus, major economic indicators such as employment are
often qualified as ‘non-farm’. Services and industry are what matter. But this conceals
how much of services and industry finally rely on what is produced on farms and,
indeed, how much of what is now defined as industry – processing food, fibres
and timber – was once part of the farm or household economy.
It now takes about ten calories of fossil energy to produce one calorie of food
energy. This includes the chemicals and machines, the fuel and electricity necessary
for industrial farming, food processing and packaging, transport over ever-greater
distances and refrigeration all the way along the fresh produce supply chains to the
supermarkets. In Britain, getting food to the plate consumes 20% of total national
energy. At the wealthy end of global production networks, a brief blockade of fuel
depots in 2000 revealed how vulnerable Britain’s food supply is to fuel shortages.
Within days, the supermarkets shelves were emptied of even such basic commodities
as bread. At the poor end of the networks, many permanent as well as seasonal
farmworkers can scarcely afford the price of a loaf.
The global elite has long claimed that industrial farming is necessary to feed
the growing population of the world. Proponents of organic agriculture have long
since recognised that this argument is really a cover for promoting the interests of
corporate agriculture – in much the same way that the bias against renewables
reflects the interests of big oil. University of Michigan researchers Ivette Perfecto
and Catherine Badgley have recently refuted the elite claim. They calculate that
organic farming in developed countries would produce 92% of what industrial
farming produces but, in developing countries, it would produce 80% more than
industrial farming. They specifically refute the much-repeated claim that organic
farming cannot overcome the loss of nitrogen fertilizers.1 A 2007 report from the
UN Food and Agriculture Organisation (FAO), long an advocate of industrial
agriculture, found organic farming superior in terms of food security, productivity
and local economic returns while it reverses the ill-effects on the health of workers
and consumers and on the environment.2

284
Toxic Futures
These findings chime well with the Nyeleni Declaration on food sovereignty
adopted in February 2007 by organisations of peasants, pastoralists and artisanal
fisher-folk, amongst others, from 80 countries meeting in Mali. They declared
themselves ‘ready, able and willing to feed all the world’s peoples’. They defined
food sovereignty as:
. . . the right of peoples to healthy and culturally appropriate food produced
through ecologically sound and sustainable methods, and their right to define
their own food and agriculture systems. It puts those who produce, distribute
and consume food at the heart of food systems and policies rather than
the demands of markets and corporations.
It defends the interests and inclusion of the next generation. It offers a
strategy to resist and dismantle the current corporate trade and food regime
. . . prioritises local and national economies and markets . . . promotes
transparent trade that guarantees just income to all peoples and the rights
of consumers to control their food and nutrition . . . ensures that the rights
to use and manage our lands, territories, waters, seeds, livestock and
biodiversity are in the hands of those of us who produce food.
Food sovereignty implies new social relations free of oppression and
inequality between men and women, peoples, racial groups, social classes
and generations.
This agenda resonates with the call for local control of resources and energy
sovereignty made by communities affected by the fossil-fuel industries. In September
2005, civil society activists met in opposition to the agenda of the World Petroleum
Congress in Sandton, Johannesburg. This agenda proclaimed the oil elite’s intention
to shape the world’s energy future. Mindful of the scale of human and environmental
atrocity associated with big oil’s activities all along the production chain, as well as
the consequences of climate change, the activists responded that ‘another energy
future is necessary’. They endorsed the conclusions of The groundWork Report 2005,
that the oil elite’s power ‘is neither stable nor inevitable and that it is always and
everywhere contested and renegotiated’ and that the potential for people’s energy
‘lies in connecting the promise of renewable energy sources and technologies with
social movements struggling for deep transformation of the way the world works’
(2005: 121).
In September 2006, member organisations of Friends of the Earth from
51 countries adopted the Abuja Declaration. It took up the theme that ‘another

285
Change coming
energy future is necessary’ and linked it with the idea of ‘energy sovereignty’. It
observes that struggles for economic, social and environmental justice are linked
through their common resistance to the elite economic and political order and
calls for the co-ordination of ‘energy struggles around the world by adopting a
global strategy for resisting environmental degradation, destruction of local
livelihoods, and rights abuses associated with corporate controlled energy sourcing
and consumption globally’. It resolves that another energy future is necessary based
upon:
• Abandoning the belief in export-led growth in favour of servicing local . . .
needs;
• Restructuring the price and production of energy;
• A new approach to restructuring ownership of the energy regimes; and
• Abandoning the mistaken dichotomy between development and environment.
It declared support for ‘community struggles towards energy sovereignty and
democratic control of natural resources that will be the basis for alternative fair
and just trade regimes that link producers with consumers, eliminating corporate
led control of our energy systems’. It particularly noted the role of women in
those struggles and said that they should be ‘fully involved in all negotiations over
energy production and allocation of natural resources’.
In summary, it called on governments to:
• declare a global moratorium on new oil and gas exploration and development;
• terminate neo-liberal trade agreements and economic policies that strip people
of their entitlements to basic resources and lead to their impoverishment;
• enforce strict environmental standards and redirect the super-profits of the
oil multinationals to clean up the mess;
• repudiate Joint Venture Agreements between governments and corporations
and replace them with agreements between governments and local com-
munities;
• resolve the Niger Delta crisis through democratic dialogue; and
• support decentralised, democratically controlled and sustainable energy
systems using clean energy like wind and solar energy.
The struggle to make the vision of food, energy and resource sovereignty real
faces formidable opposition. It is a struggle that is carried on in different ways and
different circumstances by millions of people across the globe and for many it is a
matter of life and death. There is no guarantee of success but, as The groundWork
Report 2005 put it,

286
Toxic Futures
. . . even if these social and environmental justice movements do not succeed
against the enormous power of the current regimes, and the descent into a
post-fossil-fuel (and post-US empire) era of uncertainty and collapse
continues, then the spaces of self-reliance and local democracy created
through such struggles will emerge as the only viable basis for rebuilding a
new world (groundWork 2005: 121).
Yet the moment of crisis is also a moment of opportunity and hope, as the Cubans
showed in their extraordinarily creative response to an energy crisis that provided
a preview of peak oil.
Cuba
Just as Taiwan and South Korea were subsidised by the US on one side of the Cold
War frontier, Cuba and North Korea were subsidised by the Soviet Union on the
other. When the Soviet Union collapsed, these two countries found themselves
isolated and under virtual siege by the US. Both were dependent on subsidised oil
from the Soviet Union and both had adopted the centralised high-input agricultural
systems that mirrored the technologies of the green revolution. North Korea’s oil
imports were slashed by 60%. Although well endowed with coal, the power and
transport systems failed because the country was cut off from technical support to
maintain its Soviet-built infrastructure. Agriculture collapsed. Industrial agriculture
had produced enough grain for the country’s needs and the rigid North Korean
regime attempted the impossible project of sustaining it. Famine wracked the
country and over three million people are thought to have died.
In the three years between 1989 and 1992, Cuba’s petroleum imports were
more than halved and fertilizer and pesticide imports dropped by 77% and 63%
respectively and, without oil, there was no feedstock for its own agricultural chemicals
industry. In addition, Cuba was heavily dependent on food imports, which were
also cut by half as the country’s foreign exchange dried up. Thus began the ‘special
period’ in Cuba. People’s food consumption was dramatically reduced and people
did go hungry, with the number of under-nourished people rising from 5 to 30%,
but there was no famine. By 1995, Cuba had transformed agricultural production
and restored adequate levels of nutrition.
Prior to 1990, Cuban agriculture was dominated by state-owned estates
expropriated from capitalist plantation producers during the 1959 revolution.
Ownership aside, agricultural ecologist Peter Rosset (2000) observes that the
management and technology regimes were similar to corporate agriculture in
287
Change coming
California. The estates were water- and energy-intensive, producing sugar and other
cash crops for export to the Soviet Union at five times world market prices and
exchanged for energy imports. A small peasant sector – co-operatives and individual
farmers – produced 40% of food on 20% of the land.
Unlike North Korea, Cuba turned to organic agriculture supported by massive
household, animal and human waste recycling. The first initiative was taken by
urban people who cleared waste land for gardens and learnt how to grow food
organically using the methods of permaculture, and by peasants who responded to
rising food prices and used animal draft for ploughing and transport. The state
followed their lead. Amongst other things, it supported the establishment of farmers’
markets to ensure that the value was not captured by intermediaries but returned
to producers, it focused its formidable scientific expertise on issues such as organic
pest control, and it supported a draft animal breeding programme. With this, the
urban agriculture movement ‘exploded to near epic proportions’ (Rosset 2000)
while peasants acquired a new status in society and thousands of urban people
migrated to the country to take up farming. In contrast, the large estates floundered
as the management regime precluded the relationship to the ecology of the land
required by organic production. Most of the estates were consequently broken up
and later turned over to the workers.
The transformation of energy appears less decisive. Cuba has small reserves
of very low-quality crude oil and has expanded both production and exploration
through product-sharing agreements with independent oil corporations and, more
recently, with the Petróleos de Venezuela and China’s Sinopec. In 2002, Venezuela
agreed to supply crude and fuel to Cuba on very favourable terms and so relieved
the shortage. More recently, it entered a partnership with Cuba to upgrade the
mothballed Cienfuegos Refinery with production of 65 000 b/d starting up in
December 2007. Cuba’s two other refineries are old, dirty and dangerous.
For power, most Cubans continued to rely on the grid. Most power plants
were designed to use heavy fuel oil. Lacking this fuel, the state instead used the
crude oil from its production sharing agreements. As well as polluting the
neighbourhood, this wrecked equipment and resulted in plant failure and extended
blackouts in 2004 and 2005. In 2006 government responded with the ‘energy
revolution’. Diesel generators were installed in 116 of Cuba’s 169 municipalities
and linked through the grid to restore the power supply at a cost of $1 billion.3 The
state developed some renewable generating capacity from wind and from bagasse.4
It also made a concerted effort to light up off-grid areas, particularly schools and
clinics, with photovoltaic (PV) electricity. Energy efficiency and conservation was

288
Toxic Futures
critical to the energy revolution and Cuba dramatically reduced petroleum
consumption in the two years to 2009.
Not quite paradise then but, in 2006, the conservative World Wildlife Fund
rated Cuba the world’s most sustainable country as measured by ecological impact
and human well-being (WWF 2006: 19). The experience illustrates some key points.
First, technologies are not neutral but embody relationships of power and, as for
sustainable agriculture, so for sustainable energy and sustainable production in
general, the institutional relations of production are critical. High-energy large-
scale production in all sectors generally requires centralised management irrespective
of ownership. Energy efficiency can certainly be improved within this regime and
niche-market renewables can be established – but within limits. Ultimately, these
systems are not compatible with sustainable development or social justice.
Second, the cheap-energy, cheap-food, cheap-goods regime of production
claims to represent the interest of consumers. This ignores that consumers are also
workers. Cheap goods are the product of cheap labour and polluting production
and part of the arsenal of managing labour demands. Energy-intensive agriculture
is justified on the basis of productivity but small-scale production is generally more
productive per hectare than industrial agriculture unless the machinery and chemical
inputs are heavily subsidised. Peasants and small farmers are not being wiped out
for lack of productivity but for want of power in a market constructed by and for
corporate production and the extreme concentration of economic power secured
by these means. Similarly, fossil-fuel energy is made to appear more economic than
sustainable-energy technologies through massive subsidies, including the
externalisation of environmental and social costs.
Third, Cuba was and is an authoritarian and patriarchal state. The path of
sustainable agriculture was forced on it as a matter of national security. The
alternatives were famine or allegiance to Washington. Refusing dependence on the
global regime of accumulation, Cuba was also excluded from development aid and
famine relief, which elsewhere acts as a palliative for ‘market failure’. Yet, however
imperfect, and unlike North Korea, Cuba’s political elite appears to retain the
egalitarian spirit of the revolution. During the special period, the state imposed
equal food rations on all citizens irrespective of status. According to Pat Murphy
of the Community Solution (in Morgan 2006), this prevented a situation in which
competition for declining resources would lead to social disintegration and instead
created the essential basis for social solidarity. Cubans felt that they were facing a
common crisis together. The role of the state has been decisive – both in making
the conditions of dependence on the Soviet bloc and in supporting and building

289
Change coming
on the creativity of people’s response to the crisis. Since the alliance with Venezuela
has partially restored cheap-energy supplies, it may be that the Cuban state will
choose to revert to high-energy agriculture and so repeat its earlier dependence on
the Soviet Union.
Yet it appears that people will defend what they have created. The ‘green
revolution’ involved everybody in a way that resonates with the aspirations articulated
in the Nyeleni Declaration on food sovereignty. It ended the regime of the ‘passive
consumer’ for food as for energy. It changed people’s imagination of the world,
creating a new sense of social identity in which people see themselves making their
own future and remaking in their daily lives the social solidarities previously made
over to the paternal state. Reflecting on the experience, Cuban lawyer Rita Pereira
comments that ‘we can be happy with less’ and she sees the potential of peak oil as
‘a time for sharing, for cooperation, for solidarity. Maybe we’ll have a better world’
(in Morgan 2006).
From the point of view of the state, it seems that sustainability is the last resort
rather than the first choice. The South African state has not faced a crisis of last
resort, although many of its people face a crisis of survival on a daily basis. The
state’s policy choices are for integration into the global circuits of capital
accumulation and climbing the ladder to what that system defines as higher value
production.
Anticipating peak oil
The assumption that energy expansion is never ending informs energy planning in
most countries. Cuban town planner Miguel Coyula remarks that countries
dependent on imported oil are not seriously thinking about alternative energy and
are, in effect, ‘just planning for the next week’ (in Morgan 2006). People’s initiatives
at local level are challenging this. In the North, a growing movement is drawing
together the permaculture and localisation movements to confront both peak oil
and climate change.
This movement makes several basic assumptions that distinguish it from those
discussed in the renewables section in Chapter 5. First, renewables cannot
compensate for declining fossil energy enough to power never-ending accumulation
and economic growth. Peak oil thus implies a radical restructuring of economies
including enforced localisation. People and governments therefore need to plan
for an ‘energy descent’ or, in Heinberg’s phrase, to ‘power down’ (2004). This
would certainly include an expansion of renewable energy systems and the
construction of local mini-grids as well as a heroic drive for energy conservation.
Local production of food and other goods would produce local livelihoods and

290
Toxic Futures
radically cut the energy now used to transport goods around the world. People
would still trade but only after satisfying local needs. In this vision, the ideal future
is a democratically directed, locally centred, steady state economy compatible with
natural energy flows that cannot be expanded.
Second, powering down is also necessary to limit global warming. Even if oil
production declines faster than anticipated, it is unlikely to match the very steep
decline in carbon emissions required now. Using more than a fraction of the
remaining oil, gas and coal is planetary suicide. The elite’s proposal for the technical
fix of carbon capture and sequestration is at best a massive gamble because it
cannot be shown that it will work on the scale required – that is, that 80% of global
emissions can be safely sequestered. More likely, it is a cynical pretence at action
designed to save fossil corporations rather than address climate change. Nuclear
energy similarly fails to address climate change and leaves an additional toxic heritage.
It also adds to the threat of nuclear weapons proliferation and multiplies the excuses
for the US to embark on imperial wars.
The key challenge for this Northern movement is seen to be persuading people
that the energy descent is both doable and desirable. The alternative is the impossible
politics founded on economic growth to which the elites are wedded. Given the
inevitable failure of growth, and the collapse of the market in jobs, this implies a
descent into chaos and fascism as people seek scapegoats for their pain.
The movement is therefore supporting people’s planning processes, which
consciously anticipate peak oil by developing local ‘energy-descent plans’. The
process builds the local movement and creates the popular support and pressure
for local councils to adopt the plans. In Britain, this process has been captured in
the idea of ‘transition towns’ advanced by permaculture designer Rob Hopkins
(2006). Just as Pereira considers peak oil an opportunity for a better world, so too
does Hopkins argue that ‘life with less oil could, if properly planned for and designed,
be far preferable to the present’ (undated: 5). Anticipation of peak oil and the
enforced localisation of economies is thus embraced as an opportunity for reviving
local democracy and relations of mutual solidarity and creating local livelihoods
founded on environmentally sustainable practices.
Green activists Caroline Lucas, Vandana Shiva and Colin Hines give a wider
dimension to this vision, arguing that the rules of global trade are designed to
prevent both local and democratic control of economies. Further, the organisation
of the global economy supported by these rules has the effect of ‘making poverty
inevitable’ (2005). Localisation in the North is thus the other side of the coin to
ending the plunder of the South.

291
Change coming
The concept of an energy transition poses the question of how to use the
resources now available to society as a whole to create the basis of a future energy
regime that will provide for people but not for profit. Environmentalists have
commonly argued that a sustainable-energy regime will create more jobs than the
centralised fossil-energy regime.
Urbanist Mark Swilling adds that a policy priority for ecological sustainability
ahead of economic growth will create greater social equity even if this choice is
accompanied by economic recession. The ‘consumption city’ can be, and should
be, replaced by a ‘sustainable city’ in which improving living standards are decoupled
from rising (and unsustainable) resource consumption. Such a city, composed of
sustainable neighbourhoods
. . . generates more energy than it consumes, generates zero waste (both
liquid and solid), meets most of its basic food requirements from local
sources, requires little or no fossil fuels to transport people, and releases
minimal amounts of CO2 into the atmosphere. The ‘sustainable neighbour-
hood’ helps to rebuild eco-systems and mitigates the risks associated with
the rising costs of fossil fuels as these non-renewable resources run out
(Swilling 2007: 5).
In south Durban, people believe that the new round of industrial modernisation
being pushed through by the City authorities is not only destructive but that it
assumes a future which will not materialise. Being founded on planning realism, it
does not in fact prepare for the real future. The South Durban Community
Environmental Alliance (SDCEA) notes that the City’s spatial development plan
stakes the future on ‘accelerated growth based on large-scale investments, where
attracting capital is a first priority’. Thus far, this strategy has resulted in job-shedding
and dispossession. This ‘should indicate a need to rethink the social and ecological
relations of production’.5
The City is planning for the continued expansion of container traffic through
the harbour and on the roads, of petrochemical industries, of international tourism
and of exports of energy-intensive products through the new international airport.
This will lead to over-investment leaving stranded assets and a legacy of intensified
pollution as the global economic recovery fails and oil supplies decline. Indeed, the
assumption that investments in 2010 football World Cup infrastructure would be
justified by a major boost to tourism has already foundered.
Durban is already feeling the impact of climate change. Sea levels are beginning
to rise, storms are more intense but also less frequent and the temperature is rising.

292
Toxic Futures
SDCEA observes that the City is beginning to take the issue seriously and welcomes
its focus on adaptation and its recognition that ‘eco-services’ are essential ‘to the
future functioning of the city’. Mitigation, however, is entirely absent from its
planning as the City continues to ‘invest in development that is reliant on fossil
fuels’. SDCEA calls on the City to recognise ‘that unsustainable oil dependent
industries must be phased out within the next 20 year planning period’.
In August 2009, SDCEA organised a hearing on climate change and poverty.
The recurring theme of people’s testimonies was that the City treated them with
contempt and ignored their needs. Where they were consulted, plans were already
predetermined and in some cases construction was already underway. Thus, the
route for Transnet’s multi-fuel pipeline avoided rich areas and was taken through
poor and densely settled rural communities on the urban edge. The people were
alerted by SDCEA and not by the authorities. In the words of a participant from
the area: ‘They are taking the pipeline through our gardens. What will happen
when there are leaks and explosions? Why are they taking it through our area?
They don’t talk to us, they don’t care about us, because we are poor’.
The demand for people-centred development, starting with democratic
participation in the decisions that shape people’s lives and futures, is at the core of
SDCEA’s project. It suggests an inversion of the planning process: that it should
start with people at the local scale and work outwards to meet the world rather
than starting with the assumption that corporate capital shapes development and
the local must be fixed for its demands. The crisis of capital sharpens the question
of politics in these and a thousand other struggles in South Africa and around the
world. They are a part of what Harvey calls the struggle for ‘the right to the city’:
To claim the right to the city in the sense I mean it here is to claim some
kind of shaping power over the processes of urbanization, over the ways in
which our cities are made and re-made and to do so in a fundamental and
radical way (2008: 2).
In the neo-liberal period since the late 1970s, the making, unmaking and remaking
of the city, and of the hinterland it makes of the country, has been driven by global
finance capital. It has impoverished people in the country as much as in the city
while creating globally connected enclaves of ‘world-class’ affluence. The battle
for the city cannot therefore be a parochial affair but it is also always the struggle in
each country district, town and city. It challenges trade unions and social movements
to join forces in struggle and to respond to the question of the future. If capital is
293
Change coming
terminated in the struggles that intensify over the next decades, what will be the
base, to succeed the corporation, for organising production and doing so
democratically and without laying waste to the planet?
Everyone’s village
Aamar Gram, Tomar Gram, Shobar Gram: Nandigram, Nandigram.
My village, your village, everyone’s village: Nandigram, Nandigram.
The chant was taken up across India after police killed fourteen people at Nandigram,
West Bengal, in March 2007. The people were part of a massive protest against the
enclosure of their land which the state wanted for ‘development’ to sustain economic
growth at over 8%. Nandigram was to be one of the many Special Economic
Zones being set up around India in areas close to mineral resources, to energy
sources and to ports from which export goods can be shipped. In most, people are
stripped of their rights to land and fisheries as the transnational corporations move
in and are granted exemptions from tax and from labour and environmental
regulations. For writer Amit Sengupta, the chant links the ‘thousands of farmers,
dalits, tribals, being forcibly displaced to benefit big business and big projects, in
Kashipur, Kalinganagar, Bastar, Punjab, Dadri, the Narmada valley, Tehri Garhwal’.6
And it links these protests to the long history of resistance to dispossession stretching
back to the great 1857 rebellion against the British Raj.
It is a chant that might echo around the world as states and corporations collude
in appropriating people’s rights in order to maintain profits and growth and, when
they resist, assaulting the people themselves. In the Niger Delta, people’s struggles
against big oil’s despoliation of their land and water have locked in a large proportion
of oil production; in Ireland, the people of Rossport are blocking the state’s
appropriation of their land in favour of Shell which wants it for a gas pipeline; in
Colombia, peasants and small-scale miners are resisting removals designed to benefit
AngloGold Ashanti subsidiary Kedahda; in Britain, activists gathered at a ‘climate
camp’ next to Heathrow Airport protesting government’s expansion of airports;
in China, local peasant and worker rebellions are now a daily occurrence.
In South Africa’s northern province of Limpopo, platinum mining boomed to
meet world demand for catalytic converters among other things. Reducing car
emissions is no doubt an environmental good so long as the world is dependent on
cars. As with much ‘green consumerism’, however, the environmental and social
costs are relocated up the production chain. AngloPlatinum, part of the giant Anglo
American, topped groundWork’s 2006 Corpse Award for worst corporate practice.

294
Toxic Futures
It was nominated by the Mapela people for ‘removing communities from their
ancestral land, stealing peoples’ resources and gagging voices of resistance’. The
corporation claims its rights on the basis of agreements obtained by bullying and
buying off leaders who, according to the community, had no mandate from them.
By mid-2009, ‘approximately 15 000 residents [had] been forced to relocate
and at least 10 000 more [had] lost most or all of their farming land’.7 People were
removed to a dusty relocation village where they say there is no adequate infra-
structure for energy and water and no livelihood prospects. More are threatened
with removal and are resisting through legal and direct actions. Their fields have
been literally enclosed with security fencing by the mines, their water supply
destroyed and their houses rocked by mine blasting. People have repeatedly asserted
their rights to their land, taking down the fences, ploughing the land and forming
human chains in front of the bulldozers. The police have consistently enforced the
rights claimed by the corporation, arresting people and using rubber and live
ammunition to break up protests. In September 2007, the people of Maandagshoek
detained mine officials who ‘illegally entered Maandagshoek community land’ despite
warnings to keep out. Community leaders then called the police to arrest the officials:
When police arrived (in large numbers) they instead refused to open a case
and indicated they would arrest all the community . . . members present.
Not surprisingly, people legitimately resisted and clashed with the police.
Chief Isaac Kgwete and [Maandagshoek Development Committee] Chair,
Michael Kgwete, were beaten and arrested and then charged with robbery,
public violence and kidnapping . . . The situation in Maandagshoek today
is reminiscent of the old apartheid days when mining corporations did
exactly as they pleased to any community and were protected by the police
and the government.8
Land is not the only resource in question. The development of these huge opencast
platinum mines contributes significantly to the expansion of national electricity
demand. It also drives the construction of dams on Limpopo’s rivers. This is a
generally arid area susceptible to periodic droughts and the water table has been
sinking for some decades due to heavy extraction by commercial agriculture. The
new dams are justified in the name of ‘delivering’ water to people. The thirsty
mines, however, take precedence. Already, the indications are that in dry years
there will be little left for the people or for the legally required ‘ecological reserve’
needed to sustain the rivers.

295
Change coming
The enclosure of people’s resources precedes the second form of dispossession:
the externalisation of environmental costs. In many cases, there is a direct continuity
between these forms of dispossession as pollution poisons people’s resources –
their land, crops and water – and diminishes their livelihoods. Finally, pollution is
an assault on people themselves. After long years of campaigning, the people of
south Durban have forced official corroboration of the health impacts of living in
the neighbourhood of two of South Africa’s largest refineries and of several hundred
smaller smokestack industries.
The South Durban Health Study confirmed that the transgression of people’s
constitutional right ‘to an environment that is not harmful to their health or well-
being’ is systemic: it is built into the economic fabric. And whereas the state is
obliged by the Constitution to enforce and promote the realisation of this right, it
has in fact protected and promoted corporate polluters in its efforts to ‘grow the
economy’. For people living in South Africa’s pollution hot spots, demonstrating
the health impacts has been integral to a larger campaign to force government to
withdraw the extraordinary rights it has granted to corporations and to take
responsibility for the devastation that it has promoted in the name of development.
This campaign has seen some success with the enactment of the new law on air
quality and, after years of neglect, more determined regulation of polluters in
some areas. Thus, the unrestrained freedom to pollute in south Durban has been
curtailed and routine emissions from the refineries reduced. Incidents, however,
are still part of the everyday reality of life in the shadow of the chemicals industry
throughout South Africa.
Even as the regulatory system is being tightened in some respects, it is being
loosened in others, particularly in respect of planning permissions. Thus, the
Environmental Impact Assessment (EIA) process was ‘streamlined’ in 2005 on
the rationale that it was delaying ‘development’ and so inhibiting South Africa’s
drive to 6% growth. Development is always about the future and specific projects
are details of a picture of the future to be built. Along with other planning laws,
EIAs are a way of securing the appearance of consent to the elite future but they
carry the risk of opening that future to contestation. The focus on the detail of
single projects to the exclusion of the broader implications and cumulative impacts
narrows the scope of contestation and thus manages the risk. Thus, the vigorously
contested EIA for South Africa’s Pebble Bed Modular Reactor was restricted to
the demonstration plant alone and excluded the implications of the broader plan
for twenty to thirty plants – with twenty times the nuclear fuel, transport and waste
while the risk of accidents would multiply faster than the number of plants.

296
Toxic Futures
In the Philippines, by contrast, resistance to plans to build new coal-fired power
stations has resulted in government declaring the island of Negros a fossil-free
zone. Local activist Romana de los Reyes comments on the necessity of vigilance
in defence of this declaration because the state ‘conveniently forgets the fossil-free
policy’ when lobbied by investors.9 In a context where much of the generating
capacity is supplied by private-sector independent power producers (IPPs),
democratic governance is the first casualty of corporate proposals for new coal
plants. Proponents have typically campaigned for the projects by securing the
sponsorship of powerful politicians at national and local levels ahead of community
consultations required by Philippine law. These elite figures have then not hesitated
to use the coercive power of the state to suppress resistance, including posting
armed police outside public scoping meetings to exclude opponents. The opposition,
by contrast, campaigned from the bottom up to build a broad movement founded
on local churches and people’s organisations and including elements of the local
elite, particularly professionals. Using the procedural requirements of planning
laws to focus action and build the movement, they reclaimed democratic decision
making from corporate subversion.
This confrontation of campaigning styles was also accompanied by the
confrontation of information and images of the future. In the Philippines, as in
South Africa and everywhere else, ‘host communities’ were promised new jobs
and ‘multiplier effects’ that would create rising local prosperity. Indeed, it is generally
the case that the larger the project, the more exaggerated the benefits. ‘Only time
exposes the empty words of the coal plant proponents,’ observes De los Reyes
(2006: 1). The proposed future, however, is mostly already the experience of people
elsewhere. People living with coal power stations told those where new plants were
planned what the reality is like. They told of lost health, lost land and polluted
water. The told of plants wilting in the fields and orchards, animals dying and
fisheries in decline. They told of the daily battle with coal-dust and ash in their
houses, on their dishes and on their washing. They told of the smell and the noise.
They told of the lost beauty of their land. They said: ‘Do not allow the coal plant
to be built in your area. You will end up suffering like us’ (quoted by De los Reyes
2006: 15).
Industrial Development Zones are the South African equivalent of India’s
Special Economic Zones. Coega is the most ambitious Industrial Development
Zone to date and the state has sunk billions into it, claiming that it will create
thousands of jobs, boost economic growth and contribute substantially to eradicating
poverty in the impoverished Eastern Cape province. The benefits to Alcan were

297
Change coming
obvious and confirmed by the very secrecy that obscured their precise value. As in
the Philippines, the local campaign of resistance disputed the promised benefits
but foresaw heavy costs to local communities, including the litany of environmental
impacts from just the aluminium smelter. With that project cancelled, the Coega
Development Corporation’s hopes now rest with PetroSA’s proposed refinery. Their
vision entails the construction of a new pollution hot spot bought at considerable
expense to the public purse. The local activist group Nelson Mandela Bay
Municipality Local Environmentalists has proposed environmentally friendly
alternatives for the area but have been disregarded by government.
Organised public opposition has persuaded the conservative German
Chancellor, Angela Merkel, against trying to revive the nuclear industry. The annual
ritual of this opposition is the turnout of hundreds of thousands of demonstrators
to obstruct the delivery of radioactive waste for disposal in Gorleben by literally
putting their bodies on roads and railway lines. This opposition has radicalised the
residents of what was a parochial region, changing their attitude both to nuclear
energy and to public participation in national decision making.
In 2007, Eskom identified several potential sites for the Nuclear 1 pressurised
water reactor (PWR) plant. The communities expected to ‘host’ the plant went on
to high alert. Veteran anti-nuclear campaigner Mike Kantey attended public meetings
in these areas and reported that ‘each and every site has an active anti-nuclear
lobby’ linked to each other ‘through an informal anti-nuclear network’.10 Public
debates in Thuyspunt, close to Port Elizabeth and the nearby Coega, questioned
the fact that alternative sources to nuclear power were not being discussed. In the
Northern Cape, there were well-founded fears that the Vaalputs low-level nuclear
dump will eventually be made to take high- and low-level waste from the expanded
nuclear industry. The community of Komaggas in the Northern Cape said they
would not allow Eskom to go ahead with its plans to build a nuclear power station
on their land. Andy Pienaar, a community representative, threatened: ‘I think from
here on we are going [to] shut these people out of the community and we are
going [to] make every effort to make sure that they do not erect a power station at
Brazil or Schulpfontein for that matter’.11 Residents resisting the new uranium
enrichment plant planned for Pelindaba organised themselves into the Pelindaba
Working Group, also part of the new nationwide anti-nuclear alliance. Government’s
nuclear ambitions have not diminished with the cancellation of Nuclear 1. Although
the outcome of Eskom’s EIAs seems predetermined, they have provided the focus
for continuing opposition.
The blatant ambition of agricultural corporations such as Monsanto to take
control of food systems through genetic engineering and patenting of seeds has

298
Toxic Futures
similarly run up against serious resistance in Africa, Europe and Asia. European
consumers reject it because of concerns about food safety while African and Asian
farmers understand that it is a threat to their very ability to produce food.
Struggles in tension
South Africa remains a sharply divided society. The historical divide, where race
and class were virtually synonymous, is now cut across with the emergence of a
black middle class and increasing stratification within the working class. For many
white people, environment has been primarily about nature conservation. For many
black people, environment was an elite white concern. However, most of those
who live on the fenceline of polluting industry are black and working class and are
increasingly resistant to carrying the costs of pollution.
These divisions are always at issue in any attempt at building broad campaigning
coalitions and, on this ground, the elite representation that the environment must
be played off against development – ‘balanced’ is the usual word – has traction.
David Harvey (2005) argues that, during the ‘golden age’ of post-war capitalism,
the exploitation of labour was the primary means of accumulation and this created
a working-class politics for ‘expanded reproduction’. The working-class gains made
then have been severely eroded. Moreover, these gains were largely confined to the
First World and were not shared by Third World workers. Now inequality is growing
in all countries and the promises of development ring hollow. Yet they retain great
power because there is no evident escape from dependence on capital: if there are
no jobs on offer, then there is nothing but scavenging scraps from the world’s
overflowing rubbish dumps. Yet the numbers of those made destitute through the
enclosures and externalities of accumulation by dispossession grows every day,
while the potential for expanded reproduction within industrial capitalism shrinks
and will collapse with peak oil.
Nevertheless, the tension that Harvey sees in contemporary struggles for justice
between demands for expanded reproduction and demands for an end to
dispossession grows sharper but also more ambiguous. Thus, for example, there is
an evident tension in Nigerian demands for cheap petrol while the delta and its
people are trashed. As argued in The groundWork Report 2007, the demand is not
only about the price of transport but also resistance to oil corporations running
off with windfall profits while people pay for it in higher costs. Similarly, in South
Africa, a series of strikes have won wage increases above government’s inflation
target but below the actual rate of inflation, particularly for food, experienced by
most workers.12 For economists, this raised the threat of ‘second round’ inflation.

299
Change coming
For workers, it was about barely keeping up with the cost of living. They had,
moreover, seen corporate managers walking off with record multimillion-rand
bonuses in 2006. Few economists saw inflationary dangers in these inflated rewards.
This dynamic will be terminally destructive in environmental, social and
economic terms. It is rooted not in the demands of workers and consumers but in
the massive appropriation by the elite classes that has created gross inequality globally
and in most countries. At present, scarcity for some and plenty for others is
engineered through the markets. As scarcity of energy, food and other goods
becomes absolute with peak oil, and assuming that capitalist accumulation survives
for some years past the date of peak oil, this dynamic will intensify. The contrast
with the food rations that imposed equality, at least in the bare means of life, in
Cuba could not be sharper.
Equality is no longer only about a utopian hope or the survival of the poor. It
is now also a matter of planetary survival. The fundamental problem with Kyoto is
that it evades this necessity and, to the contrary, promotes growing inequality and
environmental injustice through its carbon-trading regime and the grandfathering
of rights.
Movement
Given the urgency of climate change, many civil society organisations have
concluded that those who now hold decision-making power – in the state system
and capital – must be persuaded of the necessity for change. As corporations
proclaimed themselves ‘part of the solution’, this strategy met with the dubious
success of Kyoto, winning targets for carbon reductions, which, it was hoped,
would be made more rigorous over time, but at the cost of acquiescing to the
carbon-trading regime.
That the governments who claim to speak in the name of citizens, and the
corporations who are given such powers by the nation states, must be confronted
with the devastation of the future that they are bringing into being is clear. But the
tactic of persuasion misses the logic of the power that it would persuade. As the
Retort group argues:
. . . right at the heart of capitalist modernity . . . has been a process of endless
enclosure. The great work of the past half-millennium was the cutting off of
the world’s natural and human resources from common use. Land, water,
the fruits of the forest, the spaces of custom and communal negotiation,
the mineral substrate, the life of rivers and oceans, the very airwaves –

300
Toxic Futures
capitalism has depended, and still depends, on more and more of these
shared properties being shared no longer, whatever the violence or absurdity
in converting the stuff of humanity into this or that item for sale (2005:
193–4, original emphasis).
Retort goes on to quote war apologist Thomas Friedman: ‘. . . the hidden fist that
keeps the world safe for Silicon Valley’s technologies to flourish is called the US
Army, Navy, Air Force and Marine Corps’ (195).
In his compelling critique of carbon trading, Larry Lohmann argues:
Defining the climate crisis . . . as a problem to be solved through indefinite
capital accumulation, state subsidies for large corporations and consultants,
transnational capital flows, international trade and national ‘development’,
makes it almost impossible to connect top-down emissions targets with
support for effective actions at the local level (2006: 349).
For activists in the environmental justice tradition, the issue is not only about what
decisions must be made, but about where decisions are made and who makes
them. It is, in short, about the order of power in society.
Environmental justice requires a radical redistribution of rights from private
capital and corporations to people. Across the world, the daily struggle over rights
takes place every day at innumerable locations and on many fronts. The tactics
used vary according to circumstances. In many cases, particularly in the South, it
involves a direct clash as people’s lands and resources are invaded and enclosed. In
other cases, as with the transition towns, it involves softer tactics but still works for
a transformation in power. This too will finally lead to a confrontation of power
for it should not be expected that capital will relinquish its rights in people’s
lives without a fight – even if the fight is on the edge of the precipice of its self-
destruction.
Central to this approach is solidarity with community and popular resistance to
enclosure of people’s commons and to the global institutions supporting enclosures,
including the International Monetary Fund, World Bank, WTO and, indeed, Kyoto.
Lohmann warns against ‘silver bullet’ solutions such as carbon trading that play
into the hands of such powerful institutions and try to avoid the messy stuff of
‘democratic political organising and an uphill political struggle’ (337). Thus, on the
question of the subsidies enjoyed by fossil-fuel corporations, he argues:

301
Change coming
Powerful enough political movements could shift [subsidies] towards a
coherent programme of, for example: renewable energy development;
community-based planning for lower-carbon lifestyles; support for local
movements protecting land, forests and smallholder agriculture; better
insulation and heating; promotion of public debate and exchange on climate
change; and just treatment for those who would otherwise suffer from the
transition to less carbon-intensive industry, including fossil fuel workers
and the poor (331).
This raises the fundamental question of whether the broad justice movement can
indeed create ‘powerful enough’ movements. This may hopefully prove to be the
real significance of Copenhagen. In the spirit, although not always the practice, of
the World Social Forum, such movements would have to be created without
replicating the vanguard activism that has hitherto provided the means of unified
mass mobilisation but has also repeated, and often exaggerated, the authoritarianism
that it seeks to undo. Such movements must therefore honour the specificity of
local struggles and respect the leadership of local people in those struggles. Solidarity
that turns to the colonisation of local struggles to the benefit of movement
leadership is no solidarity.
In 2005, Oilwatch issued an open-ended invitation for dialogue with others to
create ‘powerful enough’ movements. It is a powerful statement of the need and it
does not duck the difficulties. And it may be observed that capital itself is linking
together the crises that it engineers in people’s lives. Thus, the turn to biofuels has
the effect of repeating the invitation to dialogue between the movements for energy
and food sovereignty.
Never before have the limits of the current development model based on
hydrocarbons been so clear or close. Never before has the relationship
between oil and the networks of power that control the world been so
clearly understood, nor have the relationships between oil and the main
causes of misery that affect humanity been so evident . . .
For the Southern part of the world, the oil model has meant the
perpetuation of inequitable exchange, technological dependence, indebted-
ness, and impoverishment. The ecological debt between North and South,
which began during the colonial years, rose with unequal economic and
ecological exchange.
We have accepted separately each one of these aggressions. Or worse
still, fought among ourselves: inhabitants of one country fighting against

302
Toxic Futures
another, oil workers against indigenous communities, people from the North
against those from the South, the poor of the cities against indigenous and
peasant peoples . . . those that propose against those that criticize . . . And
the list goes on and on.
What are the organizations and networks with whom we can start a
positive collaboration in the fight against the oil civilization? What are the
social, local and global movements that cannot be ignored in our efforts?
What are the international agreements and programs that can best help us
in this process? What are the new initiatives that we could and should
devise?
To answer these and other needs, Oilwatch is inviting sympathetic
networks to initiate a joint dialogue on our struggles and launch a global
campaign against a civilization based on oil.
We invite you to share your opinions, comments, suggestions and ideas,
to build a new path together . . . where we can reflect each and every one
of our struggles. This way, each and every one of our battles will gain a
new dimension.
Oilwatch, 16 September 2005
Box 10.1 Enough
Climate change has revealed our home on the planet to be fragile. We have
reached the limits of what the planet can absorb in waste and pollution, and still
remain liveable. ‘If all the countries of the globe followed the industrial model,
five planets would be needed to provide the carbon sinks required by economic
development’ (Sachs et al. 2002: 19). We have only one. The situation invites us
to think about what is enough.
Continuing greenhouse gas emissions above the safe limit, with enough
knowledge of the consequences and the means to change, is no less than climate
crime. There is a difference between what carbon emissions, from cows and rice
paddies releasing methane, are needed for subsistence and for necessary
industrial production, and that which is superfluous, including elite travel and
transport in search of the cheapest sweatshop labour. While it may not always be
easy to draw the line between ‘necessary’ and ‘criminal’ activities, there is such
a difference, embodied in the time-honoured and multifaceted concept of enough.
303
Change coming
Enough means poor people must be able to enjoy more of the earth’s riches,
and rich people must not endanger everyone by consuming more than their
share.
Enough – besides being a spiritual goal of not only material self-sufficiency
but also happiness in oneself – also promises a series of non-monetary rewards:
community, time, health and a clean conscience! In the Jo’burg Memo, prepared
for the 2002 World Summit on Sustainable Development in Johannesburg,
Wolfgang Sachs and his co-authors propose reducing consumption through
‘wealth alleviation’ instead of the inept meddling of ‘poverty alleviation’. Better
still would be the eradication of wealth that sustains unequal power relationships
and starvation in a world of potential abundance.
‘Enough’ is not only a restraint. It is also autonomy in that, when enough is
achieved, the overwhelming majority of people will not need anything from the
capitalists because they will have reversed the enclosure of resources. ‘Enough’
is the hope that people can throw off dependency as the power of the current
rulers erodes so that a fair sharing of the resources of the planet and those
created by people becomes possible.
In the words of Peter Kropotkin:
That we are Utopians is well known. So Utopian are we that we go to the
length of believing that the Revolution can and ought to assure shelter,
food and clothes to all – an idea extremely displeasing to middle-class
citizens, whatever their party colour, for they are quite alive to the fact that
it is not easy to keep the upper hand of a people whose hunger is satisfied
(1913: 69).

304
Notes
INTRODUCTION
1. ‘People’s action for corporate accountability’, groundWork Newsletter, September 2002.
2. The Gini coefficient is a somewhat rough measure and the use of different datasets
results in different numbers. Thus, Leibbrandt et al. (2010) show it rising from 0.66 to
0.70 between 1993 and 2008. There is general agreement, however, that inequality was
rising over this period (Seekings 2007).
3. This figure was produced by the Presidency using a method developed by Servaas van
der Berg, an independent analyst who has generally come to optimistic readings on
poverty and inequality using ‘controversial methods’ (Seekings 2007: 5).
4. This is a classic case of ‘technological enclosure’: water is available to those with the
most powerful pumps. The concept of enclosure is discussed under ‘The global scale of
ecological debt’ in this chapter.
5. SAMWU Media Release, 20 February 2008.
6. ‘Water contamination cited in E. Cape child deaths’, SAPA, 30 April 2008.
7. The Digest of South African Energy Statistics, produced by the Department of Minerals and
Energy (DME), is intended to give timely and accurate information on energy. Timely it
is not. The first edition, which came out in 2005, and the 2006 edition give stats up to
2004. These are the latest available on the DME website. There are major discrepancies
between its figures and those of the Energy Outlook produced in 2002. The DME said
this is the result of improved information, minor changes to methods of collecting data
and what appear to be substantial changes in assumptions used in allocating energy use
to different sectors. In general, the Digest makes South Africa’s energy performance, and
the energy sector’s environmental performance, look better than the Energy Outlook did.
8. A joule is a basic measure of energy. A petajoule is 1 000 000 000 000 000 joules and
3.6 PJ is equivalent to one terawatt hour (TWh), or 1 000 000 000 kilowatt hours (kWh),
of electric energy.
9. Apart from Vanderbijlpark, ArcelorMittal has plants at Vereeniging, Newcastle and Saldanha.
10. Two plants are at Richards Bay. The Mozal plant outside Maputo is not included in the
South African statistics but is supplied by Eskom. It consumes more power than the rest
of Mozambique.
305
11. Treasury, Discussion paper for public comment: ‘Reducing green house gas emissions:
The carbon tax option’, December 2010, p. 16.
12. In March 2011, the Department of Environmental Affairs estimated total greenhouse
gas emissions of 540 million tonnes per year. This is up from 440 mt/y in 2003 and
suggests per capita emissions of around the OECD average of 11 tonnes.
13. The rubbish figures are discussed in detail in The groundWork Report 2008. The CSIR
report issued several cautions on the data: it relied on information from corporations,
most of whom knew little about waste, had no waste information, and would only speak
on condition of confidentiality because they thought the information might involve
‘commercial risks’ (1992: 5).
CHAPTER 1
1. William D. Hartung and Frida Berrigan, ‘Militarization of US Africa policy, 2000 to
2005’, factsheet prepared March 2005, World Policy Institute at www.worldpolicy.org.
2. Ba Karang, ‘Africom and the USA’s hidden battle for Africa’, posted at The Hobgoblin
Online Journal, 19 March 2010.
3. See Green Left Weekly, 11 May 2005, at www.greenleft.org.au.
4. See www.newamericancentury.org.
5. Naomi Klein, ‘The rise of disaster capitalism’, The Nation, 2 May 2005.
6. Shalmali Guttal, ‘Reconstruction: An emerging paradigm’, Focus on Trade, No. 107, February
2005, Focus on the Global South.
7. Quoted by Naomi Klein, ‘The rise of disaster capitalism’, The Nation, 2 May 2005.
8. Seminar given at Rhodes University: ‘From Washington Consensus to Beijing Consensus’,
2 May 2007. This figure represents state borrowing. It does not include equity investments
in US stocks, profits and royalties returned to US corporations from foreign investments,
never-ending Third World debt repayment or the corrupt collusion of Northern banks
and Southern elites by which capital flight from the South is organised to the benefit of
global finance capital.
9. Walden Bello, ‘Chain-gang economics: China, the US, and the global economy’, posted at
Counterpunch, 1 November 2006.
10. In 2006, they were spending as much as $1.22 for every $1.00 that they earned.
11. Yale economist Jacob Hacker quoted by Ambrose Evans-Pritchard in ‘Spending spree
over as Americans walk tightrope without safety net’, The Telegraph, London, 6 February
2007.
12. Video: Enron: The Smartest Guys in the Room, directed by Alex Gibney, HDNet Films,
2005.
13. Presentation: ‘Finance and investment factors’ to International Forum on Globalisation:
Global Economic Transitions Project Seminar, 23–25 February 2007, London.
14. See Manuel Castells (2000a: 141) for evidence that these institutions were taking orders
directly from the US Treasury.
15. Martin Wolf, ‘Do not learn wrong lessons from Lehman’s fall’, Financial Times
(www.FT.com), 15 September 2009.
Notes to Introduction and Chapter 1

306
16. Jeremy Thomas, ‘Cats get fat on a diet of junk stocks’, Sunday Times (Johannesburg),
9 August 2009.
17. Jack Grubman, Citigroup executive, quoted in Brenner 2003.
18. In October 2008, the derivative exposure of US banks alone was ‘estimated at a
breathtaking $180 trillion . . . three times the gross domestic product of all the countries
in the world combined,’ according to Ellen Brown, ‘Financial meltdown: The greatest
transfer of wealth in history’, posted at www.opednews.com, 18 October 2008.
19. There is a special irony here. Johnson was part of the IMF hit squad sent out to discipline
Indonesia during the Asian crisis and so support the transfer of Asian assets to Wall
Street. He was not wrong about crony capitalism in that country but has evidently mistaken
his part in the theatre of global capital.
20. Cited by Paul Krugman in his op-ed column in New York Times, 18 July 2008.
21. Janet Bush, ‘Monetary jihad?’ The New Statesman, 4 October 2004. See also Paul Harris,
‘Petro-dollar or petro-euro?’ ASPO Newsletter, No. 29, May 2003.
22. Robert Fisk, ‘The demise of the dollar’, The Independent (London), 6 October 2009. All
parties predictably denied the story but Fisk is too good a journalist not to take seriously.
23. This is not, of course, a hard and fast divide. Some economists follow the conclusions of
the geologists while some geologists take the industry position.
24. The reserve is the total amount of oil that it is possible to pump from the ground. The
resource is the total amount of oil calculated to be in the ground. Typically, less than
40% of the resource can be extracted.
25. The list includes geologists, academics, investors, retired Middle Eastern officials, and
even Volvo Trucks. Most have spent a lifetime in the field.
26. In general, oil analysts tend to privilege oil as the key driver of the broader economy.
Rising or falling oil prices are thus seen as dictating economic health rather than as
symptoms of broader political and economic relations. This view will become more
convincing after peak.
27. Steven Mufson, ‘OPEC says it will cut 1.2 million barrels a day’, Washington Post, 20
October, 2006. Oil tycoon T. Boone Pickens describes Saudi surplus capacity as ‘good
for asphalt’.
28. Interview with Le Monde reported in The Oil Drum: Europe (www.europe.theoildrum.com),
28 June 2007.
29. Steve Connor, ‘Warning: Oil supplies are running out fast’, The Independent (London),
3 August 2009.
30. David Strahan, Guest Commentary, ODAC Newsletter, 28 August, 2009. In 2010, the IEA
acknowledged that conventional oil production had already peaked around 2006.
31. Financial Times, 24 January 2006.
32. See Hirsch 2007.
33. The Times (London), ‘World “cannot meet oil demand” ’, 8 April 2006.
34. Cited by Chris Martenson, ‘It’s official: The economy is set to starve’, posted at www.
energybulletin.net, 24 November 2010.
35. This suggests a much more rapid rise in sea levels than indicated by the Intergovernmental
Panel on Climate Change Fourth Assessment Report (IPCC AR4 2007). McKibben (2007)
Notes to Chapter 1

307
points out that the latest findings are not included in the IPCC report because the politics
of its production keep it some years behind current research.
36. Sulphur dioxide aerosols reflect heat outwards and so reduce warming. Particulates visible
as ‘brown haze’, on the other hand, absorb heat and so increase warming.
37. Roger Harrabin, ‘How climate change hits India’s poor’, BBC News Mobile, 1 February
2007 at http://news.bbc.co.uk/2/hi/south_asia/6319921.stm.
38. The link was made by Louis Pasteur, Robert Koch and Ignaz Semmelweis in the second
half of the nineteenth century.
39. Cremation was indeed the word used for incineration in the nineteenth century.
40. This represents a much smaller proportion of the population as fewer people live in
wealthy households than in poor households.
41. Abahlali baseMjondolo, ‘Statement on the xenophobic attacks in Johannesburg’, 21 May
2008.
42. Abahlali baseMjondolo, ‘Statement on the xenophobic attacks in Johannesburg’, 21 May
2008.
43. Kennedy Road Development Committee (KRDC) Emergency Press Release, 27
September 2009.
44. Statement by Sibusiso Zikode, ‘The ANC has invaded Kennedy Road’, 29 September
2009. See also, Kerry Chance, ‘The work of violence: A timeline of armed attacks at
Kennedy Road’, School of Development Studies Research Report No. 83, University of
KwaZulu-Natal.
CHAPTER 2
1. Eskom was Escom – the Electricity Supply Commission – until 1987 when the Afrikaans
acronym was preferred. Iscor was taken over by Mittal and renamed Ispat Iscor in 2004,
then Mittal South Africa in 2005 and finally ArcelorMittal South Africa – following Mittal’s
takeover of European steelmaker Arcelor.
2. The estate was named after Lewis and Marks’s Zuid Afrikaansche en Oranje Vrijstaatsche
Kolen en Mineralen Vereeniging – the South African and Orange Free State Coal and
Mineral Mining Association.
3. VOCs are also reported as ‘non-methane hydrocarbons’ in corporate reports.
4. Sasol Sustainable Development Report 2005: 58.
5. ArcelorMittal South Africa Sustainability Report 2008: 19. See also Mittal Steel South
Africa, Annual Reports 2004 and 2005.
6. Eskom Annual Report 2005: 120.
7. The researchers can verify these symptoms from personal experience, even from relatively
brief exposure during visits to the area.
8. Sasolburg Community Working Group Minutes, 31 August 2005. Ppb is parts per billion.
See Sasolburg Community Working Group Minutes 28 June 2006 for 2005/2006 incidents.
9. groundWork and SAQMC letter to DEAT, 2 December 2006. DEAT made some
recommendations to Sasol but there was no indication that their implementation would
be monitored or, indeed, that the corporation was obliged to implement them.
Notes to Chapters 1 and 2

308
10. Calculated from the daily average for February and March 2006, including raw and
potable water, given in Sasolburg Community Working Group minutes for 26 April
2006.
11. Calculated on ArcelorMittal’s reported consumption of 2.82 kilolitres per tonne of steel
produced.
12. Speech by Mrs L.B. Hendricks, Minister of Water Affairs and Forestry, on Vaal River
Eastern Sub-System Augmentation Project (VRESAP) function for the commissioning
of part of the project, 1 April 2009. The minister noted with apparent satisfaction that
Sasol uses ‘11.5 litres of water to produce one litre of petrol and Eskom requires
1.5 litres of water for every kilowatt-hour’.
13. Mittal Steel Vanderbijlpark and the Environment, brochure, 2006.
14. Annual Report 2004: 64. Pickle liquor is usually sulphuric or hydrochloric acid used to
clean scale and oxides from steel.
15. Beeld, 17 January 2006.
16. Tony Carnie, ‘Workers march with coffin’, Mercury, 26 February 2008.
17. Sasol press release, 6 June 2006.
18. The apartheid work regime is described in The groundWork Report 2006. Karl von Holdt
(2003: 33) gives a detailed account of baasskap in the iron and steel industry.
19. See Mittal South Africa Annual Reports for 2004 (p. 54) and 2005 (p. 45).
20. Meyerton falls outside Emfuleni. Vereeniging, Vanderbijlpark and all the major black
settlements of the Vaal Triangle north of the river fall within Emfuleni.
21. The narrow definition of unemployment includes only those of working age who are
actively seeking work. The broad definition includes those who would like to work but
have given up looking. The ‘economically active population’ is the number of people
employed added to the number unemployed. The ‘potential’ work force includes all
adults of working age who are able to work.
22. This observation accords well with the results of the Durban Health Study (see Chapter
3). The findings suggest that long-term exposure makes people more vulnerable to further
exposure. People’s bodies do not get used to pollution.
23. This figure combines industrial, mining and power station sources. See Scorgie (2004:
Table 5.1).
24. Industrial combustion does not include particulate dust blown off industrial waste and
coal-heaps. See Scorgie (2004: Tables 3.35 and 3.36).
25. By comparison, Patrick Bond notes that in Europe people pay twice as much as industry
(2005: 8).
26. ‘The rich list’, Sunday Times, 6 August 2006.
27. groundWork and VEJA air quality workshop, 4 May 2006.
28. Community exchange strategy meeting, Bosco Centre, 26–28 July 2006. The meeting
included participants from south Durban, Secunda and other pollution hot spots.
Notes to Chapter 2

309
CHAPTER 3
1. This view was advanced by, among others, the Industrial Strategy Project, see Joffe et al.
1993.
2. The ANC won the first democratic elections handsomely but invited other parties to
join it in the Government of National Unity, which included the former ruling National
Party.
3. ‘Who is the dominant class in South Africa?’ Mail and Guardian, 28 July–3 August 2006.
4. Davis notes that Habitat was conservative in its definition of slums and so also in
numbering the people who live in them.
5. See Trevor Manuel in the Sunday Times, 13 August 2006.
6. Brent Johnson, ‘The idiot’s guide to EIAs’, Mail and Guardian, 18–24 August 2006.
7. The technical definition of a recession is two-quarters of contraction. This, however, is
merely a bureaucratic convention given a supposed objectivity by the word ‘technical’.
8. The distinctions are not always clear, particularly when it comes to choosing ministerial
cars.
9. Published in mid-2009 under the presidency of Zuma.
10. IODSA 2002: ‘King report on corporate governance for South Africa’.
11. These struggles are documented in greater detail in The groundWork Report 2008. Primary
sources include the archive of EJNF and groundWork newsletters.
12. See The groundWork Report 2008, which draws on Butler (1997) as well as EJNF and
groundWork newsletters.
13. The groundWork Report 2002, p. 36.
14. Tony Carnie, ‘Suffer little children’, The Mercury, 10 September 2000.
15. In 2011, the vulnerability of the new air quality system was starkly revealed. Having
painstakingly developed one of the best local monitoring and regulatory systems, Durban
City Health abruptly cut the staff complement by more than half. Pollution control, it
seems, has once more been abandoned.
16. ‘From the smoke stack’, groundWork Newsletter, March 2003.
17. Ambient limits are set for different timeframes and the concentration of each pollutant
is averaged out over that duration. Short-term limits are much higher than long-term
limits. Thus, for sulphur dioxide, the annual limit is 19 parts per billion, the daily limit is
48 and the ten-minute limit is 191. The standards system thus allows pollution peaks up
to the relevant short-term limit. The assumption is that higher levels of exposure can be
tolerated for shorter time periods.
18. PM10
is generally visible as smoke or dust. PM2.5
is not visible and is produced from
higher temperature combustion such as in industrial processes, incinerators or motor
engines.
19. At present, Benzene, toluene, ethyl benzene and xylene (BTEX) are monitored in Durban.
20. Speech by Marthinus van Schalkwyk, Minister of Environmental Affairs and Tourism, at
the Eighth Conference of the International Network for Environmental Compliance
and Enforcement, Cape Town, 7 April 2008.
21. In 2002, the Air Quality Bill had already gone through six drafts. One of these was
leaked to civil society organisations by a source in the business sector.
Notes to Chapter 3
310
22. Parliamentary Monitoring Group, Meeting report on discussion on incineration, 4 March
2008, at www.pmg.org.za.
CHAPTER 4
1. Old Mutual followed by Sanlam and Liberty Life.
2. Damian Brett, ‘Trends and players in the mining industry’, presentation to UNCTAD
Expert Meeting on FDI in Natural Resources, 20–22 November 2006.
3. Moody is managing editor of the Mines and Communities website at www.minesand
communities.org.
4. The US uses imperial measures: hence ‘tons’ rather than metric ‘tonnes’.
5. About 378 million litres.
6. Terence Creamer, ‘Acid drainage response team to seek “affordable” solutions’, Engineering
News, 19 August 2010. The issue has received extensive coverage in Mining Weekly over
the last two years and, in 2010, increased coverage in the mainstream media.
7. Department of Water Affairs, ‘Final Report of the Interdepartmental Committee
Regarding Dolomitic Mine Water: Far West Rand’, November 1960 (known as the Jordaan
Report).
8. Interview by Victor Munnik, 7 April 2008.
9. See ‘South Africa: Paying the price for mining’, Irin, 15 February 2008, at www.irinnews.
org/Report.aspx?ReportId=76780.
10. AngloPlatinum produces 40% of global platinum supply and controls 60% of platinum
resources.
11. Interview with Zav Rustomjee by Victor Munnik in May 2006. See also documents on
the Competition Tribunal’s website: www.comptrib.co.za.
12. Business Report, 25 August 2004. Iscor’s name changed first to Ispat Iscor, then to Mittal
Steel and finally to ArcelorMittal.
13. Terence Creamer, ‘Minister Davies to seek urgent meetings with Kumba, ArcelorMittal
and Anglo’, Engineering News, 27 February, 2010. At the time of writing, the matter was
not resolved.
14. In chemistry, ‘organic’ refers to compounds containing carbon. These are found in living
organisms, as well as the hydrocarbons that make up fossil fuels and are used as the
building blocks of plastics.
15. These figures, and those below, are given in the ‘Draft Scoping Report’ for an environ-
mental impact assessment on the closure of the slag-heap and the opening of a new one
(right next to it) at the Vanderbijlpark site, prepared by consultants Strategic Environmental
Focus.
16. Maggie Fox, ‘Air pollution damages across generations – study’, Reuters, 11 December
2002, at www.planetark.com.
17. Jan de Lange, ‘BHP pulls rug under metal firms’, www.Fin24.com, 2 May 2010.
18. Mozambique’s own energy production is chiefly from the Cabora Bassa Dam, which
adds 2 000 MW to South Africa’s 40 000 MW installed capacity. The World Resource
Institute puts Mozambique’s CO2 emissions at 1.2 mt/y in 2000. Its overall CO
2e emissions
Notes to Chapters 3 and 4
311
are put at 15 mt/y – but this includes methane from cattle farting and is really a measure
of how the industrialised world is trying to make the non-industrial world co-responsible
for climate change.
19. Statement issued by Pieter van Dalen MP, Democratic Alliance, 21 April 2010.
20. Sector-specific sustainability reports are not evident on Billiton’s website for later years.
21. groundWork, ‘Comments on: Environment Conservation Act, 1989: Waste tyre
regulations’, 23 March 2007.
22. F. Carrasco, N. Bredin and M. Heitz, (2002) ‘Atmospheric pollutants and trace gases:
Gaseous contaminant emissions as affected by burning scrap tyres in cement
manufacturing’ in Journal of Environmental Quality 31: 1484–90.
23. DEAT media statement, ‘Green Scorpions embark on countrywide “clean cement”
campaign’, 27 May 2008.
24. Following the Beijing spectacular, Olympic officials challenged London to beat it.
25. Abahlali baseMjondolo (AbM), the Western Cape Anti-Eviction League, the Landless
People’s Movement and the Anti-Privatisation Forum, amongst others, made the point.
AbM, for example, saw the KwaZulu-Natal Slums Act as the means to ‘clean’ the city of
shack settlements ahead of the World Cup (press release 21 June 2007). AbM subsequently
won a Constitutional Court ruling against the Act.
26. Martin Creamer, ‘Raw export rise flies in face of beneficiation calls’, Engineering News,
8 December 2010.
CHAPTER 5
1. The seven sisters were: Standard of New Jersey (later called Exxon), Socony-Vacuum
(Mobil), Standard of California (Chevron), Texaco, Royal Dutch Shell, BP and Total.
The first three were all successors to John Rockefeller’s Standard Oil, the original monopoly
broken up under US anti-trust legislation.
2. David Teather, ‘Open skies deal will undo curbs on CO2, say greens’, The Guardian
(London), 24 March 2007.
3. These figures are on the low side. The most recent research estimates 2005 emissions at
7.9 Gt of carbon, which is just short of 29 Gt of carbon dioxide (see Levin and Pershing
2007).
4. Total CO2 emissions, including industrial process and agricultural emissions, in 2004
were just over 30 Gt while total greenhouse gas emissions were 49 Gt of CO2e, according
to the IPCC 2007 report.
5. This rationality is discussed in relation to South Africa in Chapter 9.
6. Steve Connor, ‘Carbon emissions set to be the highest in history’, Reuters, 22 November
2010.
7. ‘Summary for policymakers of the synthesis report of the IPCC Fourth Assessment
Report’, p. 21.
8. The authors intentionally made optimistic assumptions about reduced deforestation and
reductions in greenhouse gases other than carbon dioxide. If these assumptions failed,
neither 450 nor 550 would be possible.
Notes to Chapters 4 and 5

312
9. In its discussion of the 450 scenario, the WEO says annual reductions of 0.67 Gt would
be needed after 2020 (446) when it puts energy emissions at 33 Gt. This is just over 2%.
Elsewhere, it says the 450 target requires that greenhouse gas emissions ‘peak in the next
few years followed by annual reductions of “6% or more” ’ (411). This does not seem to
inform its number crunching.
10. Meinshausen et al., published in Nature in April 2009, cited by George Monbiot, ‘Not
even wrong’, The Guardian (London), 31 August 2009.
11. WEO 2008 converts this to 400 ppm CO2e [411, note 4], which implies that other
greenhouse gas emissions are substantially reduced as indicated by Hansen et al. (2008:
12). For a high probability of avoiding 2 ºC, Meinshausen calculates that stabilisation
should be at 350 CO2e (cited in Anderson and Bowes 2008).
12. Allen et al., published in Nature in April 2009, cited by George Monbiot, ‘Not even
wrong’, The Guardian (London), 31 August 2009.
13. IEA, Oil Market Reports: 10 July 2009 and 13 October 2010. This report revised 2007
figures upwards as actual data came in higher than previously anticipated.
14. Colin Campbell, ASPO Newsletter 97, January 2009.
15. Associated Press, ‘Rising demand may outpace Saudi output capacity’, www.gulfnews.com,
5 April 2006.
16. Greg Muttitt, ‘Iraq’s oil field bid rounds – Development or “stabilization”?’ Middle East
Economic Survey, Vol. LII. No. 19, 11 May 2009.
17. Low-quality oil is more dense (thicker) and has a higher sulphur content. Refineries must
‘crack’ high-density oils to make petrol and diesel, a process that is both energy-intensive
and highly polluting. A high sulphur content produces high sulphur dioxide emissions at
refineries or, if the sulphur is removed in compliance with environmental regulations,
ever-growing mountains of waste sulphur. Despite efforts to find new uses for sulphur,
the market is already glutted.
18. John McQuaid, ‘The Gulf of Mexico oil spill: An accident waiting to happen’, posted at
Yale Environment 360, 10 May 2010.
19. David Strahan, ‘Pipe dreams’, The Guardian (London), 3 December 2008. Strahan is a
trustee of the Oil Depletion Analysis Centre (ODAC).
20. The solid wastes settle out in the ponds.
21. H2Oil Factsheet: ‘Health and human impacts’ at http://h2oildoc.com.
22. Quoted in David Luhnow and Peter Millard, ‘How Chávez aims to weaken US’, Wall
Street Journal, 1 May 2007.
23. See The groundWork Report 2006.
24. WEO’s figures for gas are given in billion cubic metres. They are converted here to
enable comparison with oil.
25. Chris Nelder, ‘Step on the gas’, Energy and Capital, 24 July 2009. See also Arthur Berman,
‘Lessons from the Barnett shale suggest caution in other shale plays’, posted at Aspo-
USA, 10 August 2009.
26. Sunita Dubey, ‘Trojan horse: Hidden costs of coal-to-liquids in the USA’, groundWork
Newsletter, June 2007.
Notes to Chapter 5

313
27. Vaclav Smil, ‘Long-range energy forecasts are no more than fairy tales’, Letter to Nature,
Vol. 453, 8 May 2008.
28. See Creamer’s Mining Weekly, 16–22 March 2007.
29. Most Internet comment is by investment touts who talk up the investment opportunity
in uranium created by the disaster. See, for example, Energy and Capital website
(www.energyandcapital.com). See Cameco’s website (www.cameco.com) for its version.
30. Julio Godoy, ‘Niger: French state-owned company “poisoning” poor’, Inter-Press Service
News Agency, 12 April 2010.
31. A Greenpeace review of nuclear construction shows that 75 US reactors ‘were predicted
to cost $45bn but the actual cost was closer to $145bn’. Indian costs have similarly run
300% over budget. See Terry Macalister, ‘Nuclear power a “dangerous distraction” says
Greenpeace’, The Guardian (London), 3 May 2007.
32. www.precaution.org/lib/nuke_ghg_emissions.060224.pdf.
33. ‘Chernobyl radiation killed nearly one million people: New book’, Environmental News
Service, 26 April 2010. The book draws on East European scholarship not previously
published in the West: Alexey Yablokov, Vassily Nesterenko and Alexey Nesterenko,
2010. Chernobyl: Consequences of the Catastrophe for People and the Environment, New York
Academy of Sciences.
34. See The groundWork Report 2006, p. 159ff.
35. World Bank Press Release: ‘This can be a century of African growth and opportunity,
World Bank president says following Africa visit’, 20 August 2009.
36. Brady Yauch, ‘More odious debts for the Democratic Republic of Congo if the World
Bank gets its way’, Probe International, Wednesday, 19 August 2009.
37. Terri Hathaway, ‘Congo’s Inga: Great power for whom?’ International Rivers Network,
1 August 2006; and ‘Scramble to dam the Congo keeps Africans in the dark’, Pan-African
Press Association, 23 April 2008. See also ‘International Rivers’ at www.international
rivers.org/en/africa/grand-inga-dam.
38. Republic of Tanzania website: ‘The economic survey 2005’.
39. Originally the Owen Falls Dam on the Nile just below Lake Victoria. British colonial
engineers blasted out the lip of Lake Victoria, so turning the whole lake into a reservoir
subject to the management regime at the dam.
40. International Rivers Network (IRN) press release, 26 April 2007.
41. Ann David and Russell Gold, ‘US biofuel boom running on empty’, Wall Street Journal,
27 August 2009.
42. The study in question is Farrel et al. 2006 in Science, 311: 506–508.
43. George Monbiot, ‘The most destructive crop on earth is no solution to the energy crisis’,
The Guardian (London), 6 December 2005.
44. Statement by organisations and social movements of Brazil, Bolivia, Costa Rica, Colombia,
Guatemala and the Dominican Republic, gathered at a forum on the expansion of the
sugarcane industry in Latin America, 28 February 2007. Available at www.mstbrazil.org.
45. Edivan Pinto, Marluce Melo and Maria Luisa Mendonça, ‘The myth of biofuels’, posted
at www.viacampesina.org and www.mstbrazil.org, 13 March 2007.
Notes to Chapter 5

314
46. ‘Response to UK Department for Transport consultation on the draft Renewable Transport
Fuel Obligation’, from: Africa Biodiversity Network, Kenya; Melca Mahiber, Ethiopia; Envirocare,
Tanzania; Climate and Development Initiatives, Uganda; Nature Tropicale, Benin. May 2007.
47. See Hussein Bogere, Emmanuel Gyezaho, Mercy Nalugo and Zurah Nakabugo, ‘MPs
arrested’, The Monitor (Kampala), 17 April 2007; International Rivers Network, ‘Fast
facts on Mabira Forest, Uganda’, 17 April 2007; Fred Pearce, ‘Biofuel plantations fuel
strife in Uganda’, New Scientist, 19 April 2007; Xan Rice, ‘Uganda “averts tragedy” with
reversal of decision to clear virgin forest for biofuel’, The Guardian (London),
29 October 2007.
48. Lester R. Brown, ‘Supermarkets and service stations now competing for grain’, Eco-
Economy Update, 13 July 2006, and ‘Massive diversion of US Grain to fuel cars is raising
world food prices’, Eco-Economy update, 21 March 2007 at www.earth-policy.org.
49. John Ross, ‘The plot against Mexican maize: Big biotech takes advantage of corn crisis
to force farmers to buy GM seeds’, The Independent, 22 February 2007.
50. Sam Burcher, ‘FAO promotes organic agriculture’, Institute of Science in Society Press
Release, 10 September 2007, at www.i-sis.org.uk.
51. Grain, 2008. ‘Seized: The 2008 land grab for food and financial security’, Briefing October
2008, at www.grain.org/go/landgrab.
52. Small-scale biodigesters are widely used in rural China and India. There are also a very
few large-scale biodigesters. The City of Stockholm, for example, runs its buses and
municipal vehicles off the gas.
53. Kate Ravilious, ‘Weather hots up under wind farms’, www.newscientist.com, 4 November
2004.
54. Tadit Anderson, ‘The Nature of the Jevons Paradox’, posted at www.economics.arawakcity.
org on 7 May 2009.
CHAPTER 6
1. This and all subsequent references to the NEPAD document are to paragraph numbers
rather than pages.
2. GCIS IRPS Media Briefing, 6 May 2005.
3. The groundWork Report 2005 gives a detailed account of the ecological and human assault
at every step in the upstream production process.
4. MEND statement quoted by Reuters, ‘Oil blow to Nigeria as rebels hit offshore facility’,
20 June 2008.
5. The calculation of the ‘landed price’ contains a number of fictional costs that turn into
guaranteed profits for the oil refineries.
6. The oil supermajors are, of course, making super profits from crude oil but their refineries
in South Africa still have to pay the going rate.
7. Quoted by Kevin Davie, ‘The clawback which wasn’t’, Mail and Guardian, 4–10 August
2006. The information on subsidies is mostly based on a number of articles by Davie in
the Mail and Guardian: ‘Govt’s R6bn gift to Sasol’, 23–29 September 2005; ‘From Ogies
Notes to Chapters 5 and 6

315
with love’, 4–10 August 2006; ‘No windfalls here’, 18–24 August 2006. See also Hallowes
2005.
8. Deregulation is the word used in the policy. Reregulation would perhaps be more accurate
since government would effectively empower a limited number of very powerful
corporations. Government regulation in phase 3 would then mediate between these
corporations.
9. Muzi Mkhize, ‘Chief director: Hydrocarbons, is South Africa ready for market pricing/
deregulation?’ Oil Summit, Midrand, 9 October 2008.
10. Ann Crotty, ‘Fierce rivalries keep powerful oil players in check’, Business Report,
2 November 2005.
11. See SAPIA Annual Report 2006, Appendices 1 and 2. Subsequent annual reports do not
give the industry’s financial results or value-added statement, purportedly because this
requires information sharing and so facilitates price collusion.
12. OCGT plants gulped 346 million litres of diesel in 2008. This was reduced to 29 million
as economic recession relieved Eskom’s spinning margins.
13. This calculation assumes a strong rand at seven to the dollar and a weak rand at eleven to
the dollar. The rand could of course go much lower.
14. Formerly Kellogs, Brown and Root.
15. Sasol presents the information in a bar chart. These numbers are the best reading I can
make of it.
16. This is the last year that The groundWork Report was able to access figures for local site
emissions as opposed to global emissions.
17. Sasol’s 2005 Sustainable Development Report said that such information was available
on request. When requested, corporate officials acknowledged that this was ‘a bit
misleading’ as it wasn’t.
18. Sasol is a signatory to the UN Global Compact initiated by General Secretary Kofi
Annan and widely criticised by environmental justice organisations as corporate ‘blue
wash’.
19. Sasol’s 2009 SDR says nothing about it and the Sasolburg SH&E report has not been
updated since 2006.
20. E-mail, Sandra Redelinghuys to Bobby Peek, 5 November 2008.
21. R.J. Morris, 2003. ‘Sulphur surplus in the making impacts refineries’, The Sulphur Institute.
22. Organic chemicals are based on carbon, inorganic chemicals are not.
23. At www.plasfed.co.za.
24. Packaging Council of South Africa submission, 15 November 2007.
25. At www.stopcorporateabuse.org.
26. eThekwini Municipality 2004, ‘Integrated Waste Management Plan’. eThekwini has
subsequently introduced recycling with privatised curbside collection thus far confined
to upmarket areas. It is motivated primarily by the need to reduce the municipal waste
stream and so save ‘air space’ at the dumps. Waste managers have next to zero influence
on the production system and hence on how much waste is produced in the first place.
Notes to Chapter 6

316
CHAPTER 7
1. Louise Flanagan, ‘Worst load shedding day so far’, Daily News, 25 January 2008.
2. Interview with Wendy Annecke and Nthabiseng Mohlakoana by David Hallowes and
Victor Munnik, 20 April 2007.
3. Minister Alec Erwin, ‘Economic cluster: Higher growth, sustained growth, and shared
growth’, Parliamentary Media Briefing, 17 February 2005.
4. Siseko Njobeni, ‘Minister’s electricity revenue shock for cities’, Business Day, 4 March
2009.
5. In 2011, government abruptly cancelled the REDs project so it appears that the distribution
industry will not in fact be changed any time soon.
6. Figures are taken from Sustainable Energy Africa 2003 and DME’s Energy Statistics
2006.
7. City of Cape Town, State of Cape Town 2006, p. 37.
8. ‘Towards 2010: Going global leaves poor further behind’, Cape Argus, 23 May 2007.
9. ‘Down with ANC policies!’ www.news24.com, 17 July 2007.
10. NERSA Newsletter, August 2006. The finding did not refer to the bolt in the rotor incidents
which, according to NERSA, was subject to another government enquiry.
11. Areva press kit, ‘SA government reception for the first group of engineers returning
from training with Areva’, 2 July 2003.
12. ‘Western Cape electricity crisis: Declaration of meeting of 8 March 2006’.
13. Interview, 18 April 2007.
14. ‘Western Cape recovery plan’, p. 23.
15. Open letter to the minister and officials from DME, NERSA, Eskom, CEF and city
electricity departments from Sustainable Energy Africa and twenty other organisations,
26 June 2006.
16. The US Environmental Protection Agency standard is 5 milligrams, so 5 million CFLs
contain 25 kilograms of mercury. However, poor-quality CFLs contain more. Mercury is
an excellent conductor of electricity and has found many applications but has also caused
severe health problems for workers. See D’Itri and D’Itri 1977.
17. Micheal Sheridan, ‘ “Green” lightbulbs poison workers’, The Sunday Times (London),
3 May 2009.
18. The Cape Town Partnership’s advocacy on behalf of CBD businesses is evident in an
email from CEO Alex Boraine to the PMT, 9 June 2006.
19. Interview with David Nicol, 18 April 2007.
20. Reported in the Cape Times, 31 March 2006.
21. Cape Business News quoted in Von Ketelholdt (2006: 15).
22. These farms and cellars are a minority but represent the most profitable leading edge of
the industry. Bulk wine producers have struggled to adapt to the new order and are now
feeling the competition from imports.
23. Willemse, Power Point presentation: ‘Economic position of agriculture in Western Cape’,
2006.
24. Ewart and Du Toit (2005) report increasing use of mechanised harvesting, with each
machine replacing 70 pickers and enabling quicker harvesting when sugar levels are
Notes to Chapter 7

317
right. However, this advantage is offset because mechanical harvesting cannot discriminate
for grape quality and also results in foreign matter in the harvest.
25. Interview with Carl Opperman, CEO Agri-Weskaap, 20 April 2007.
26. See FTFA website at www.trees.co.za. PricewaterhouseCooper’s own website is silent on
its accreditation.
27. City of Cape Town, 2006, ‘Energy and Climate Change Strategy’.
28. Obama chose the supposedly ‘good’ war in Afghanistan over the ‘bad’ war in Iraq.
The withdrawal from Iraq, however, involves a sleight of hand. Large US bases
remain in remote areas along with the green zone defined by the US embassy precinct in
Baghdad.
CHAPTER 8
1. Louise Flanagan, ‘Eskom documents show business knew of the crisis’, The Star,
11 February 2008.
2. James Myburgh, ‘Eskom: The real cause of the crisis’, Politicsweb, 1 February 2008.
3. Eskom’s response is carried as an annex to NERSA’s report, p. 44ff. The utility rather
quaintly avoids understanding NERSA’s criticism that national energy security had been
subordinated to its ‘business objectives’ – that is, promoting BEE entrants, cutting short-
term costs and boosting management bonuses.
4. Terence Creamer, ‘Power prices have to begin reflecting true costs – Godsell’, Engineering
News, 6 February 2009.
5. See Terence Creamer, ‘Electricity crisis response team hits turbulence’, Engineering News,
3 November 2009, and ‘Government at fault for inertia around power-crisis structures,
Manuel admits’, 8 December 2009.
6. The MYPD stipulates annual price increases over a three-year period, supposedly to
bring certainty to both Eskom and its customers.
7. See McDaid 2010; Lynley Donnelly, ‘Cloud over power plan’, Mail and Guardian,
19 March 2010; Chris Yelland, ‘National integrated resource plan for electricity, or conflict
brewing?’ EE Publishers, 22 April 2010.
8. Louise Flanagan, ‘Eskom couldn’t afford to buy back power – Maroga’, Business Report,
31 March 2010.
9. BHP Billion statement quoted in ‘BHP, Eskom review aluminium smelter power
agreements’, Engineering News, 5 April 2010.
10. This estimate was based on the assumed cost of ‘unserved’ energy and not on any direct
evidence. See NERSA, ‘Inquiry into the national electricity supply shortage and load
shedding’, 12 May 2008, p. 8.
11. Neva Makgetla, ‘SA can’t afford to neglect energy needs of mines’, Business Day, 25 June
2008. Makgetla is now at the newly formed Department of Economic Development.
12. The source of this quote is quaintly appropriate: Ian McDonald, ‘Hitting the sweet spot’,
South Africa: The Good News.
Notes to Chapters 7 and 8

318
13. ‘Where could emerging-market contagion spread next?’ The Economist, 26 February 2009.
14. In the 1990s, the carry trade was sourced from Japan as it attempted to revive its stagnant
economy with near zero interest rates. It is an integral feature of Ponzi capital and its
replication on a larger scale is symptomatic of the global attempt to revive the bubble
economy. The logic of doing so is that there is no other viable basis for growth – which
is to say finally that there is no viable basis for growth.
15. ‘Trade gap jumps to record on oil imports’, Reuters, 30 November 2007.
16. Tumi Makgetla, ‘Forget oil, look at food prices’, Mail and Guardian, 22 October 2006; and
‘Food price inflation under scrutiny’, Mail and Guardian, 20 May 2007; Neva Makgetla,
‘Hunger stalks poorer households as maize prices fuel inflation’, Business Day, 6 June
2007; ‘Farmers expected to plant more maize’, Business Report, 25 September 2007.
17. A. d’Angelo, ‘Politics stands to undermine effectiveness of World Summit’, Business Report,
8 May 2002. Rio refers to the 1992 United Nations Conference on Environment and
Development in Rio de Janeiro.
18. Address by the President of South Africa, Thabo Mbeki, at the Sixty-Second Session of
the United Nations’ General Assembly, New York, 25 September 2007.
19. See Omnia’s Annual Report 2008. One tonne of nitrous oxide is equivalent to 310
tonnes of carbon dioxide, so such projects provide cheap credits and have been favoured
in the carbon market. The return no doubt declined with the carbon price in 2008 but by
then it was money for free.
20. ‘Sasol clinches world first with emissions reducing project’, Engineering News, 23 July
2007; and Sasol Facts 2009.
21. Robert Zoellick, President of the World Bank Group, speech to the Twelfth Ordinary
Session of the Assembly of the African Union, Addis Ababa, Ethiopia, 9 February 2009.
22. World Bank (IBRD, IFC and MIGA), ‘Country partnership strategy for the Republic of
South Africa for the period 2008–2012’, 12 December 2007, p. 4.
23. ‘Alec Erwin, Minister of Public Enterprise: Generating electricity’, 31 May 2006 at www.
dpe.gov.za.
24. 25 June 2007.
25. Letter to the Eastern Cape Herald, 15 June 2007.
26. CDC Annual Reports, 2008/2009 and 2007/2008.
27. Terence Creamer, ‘Powering down’, Engineering News, 7–13 September 2007.
28. In 2009, Sere was ‘delayed’ to shave a splinter off the funding requirement. See Engineering
News, 5 June 2009 and Eskom’s New Build News, No. 7, March 2009.
29. Chanel Pringle, ‘Electricity decision needed in the next year – Eskom’, Engineering News,
7 September 2009.
30. Hilton Trollip, IDASA presentation on the IRP 2010, Durban, 22 October 2010; the
DOE’s draft IRP, published in October 2010, put forward several scenarios and
recommended a ‘revised balanced scenario’. This was again revised following a round of
public consultation. The figures quoted here are from the ‘policy adjusted IRP’ contained
in the final report approved by Cabinet in March 2011.
31. ‘MTRM’, p. 13. MTRM assumes even higher growth to 2016 than IRP.
Notes to Chapter 8

319
32. Terence Creamer, ‘Secunda to produce 800 MW of own power, sell 200 MW to Eskom’,
Engineering News, 21 October 2010.
33. Keith Campbell, ‘SA squanders lead just as nuclear sector begins to grow globally’,
Engineering News, 26 March 2010.
34. Eskom CEO Jacob Maroga quoted by Engineering News, 27 July 2007. The comment
echoes the notorious internal memo circulated by World Bank official Lawrence Summers,
in which he argued that poor countries were under-polluted and ‘the economic logic
behind dumping a load of toxic waste in the lowest-wage country is impeccable . . .’.
35. DWA used to be DWAF before Zuma’s reshuffle. Then, for a short while, it was DWEA
(water and environment), then the departments did not amalgamate after all, although
the ministries did, so now DWAF is DWA and DEAT is DEA (minus tourism).
36. For details of DWA planning, see ‘Mokolo and Crocodile water augmentation project:
Presentation to the Waterberg forum meeting’, 23 November 2009. Broader plans are
given in Strategic Planning for Water Resources in South Africa, 2009.
37. Transformation Resource Centre, ‘Too many dams, too little water – Lesotho’s rivers
could become “waste water drains” ’, www.internationalrivers.org, 31 October 2000.
38. ‘Emerging energy heavyweight’, Mining Weekly, 11–17 August 2006.
39. ‘Eskom says SA needs “at least” 40 new coal mines’, SAPA, 11 August 2009.
40. Esmarie Swanepoel, ‘Over 100 South African mines operating without water licences’,
Engineering News, 29 September 2009.
41. Terence Creamer, ‘Transnet to spend R52 billion on rail unit in the next five years’,
Engineering News, 16 March 2010.
42. Sonal Patel, ‘Powering the people: India’s capacity expansion plans’, Power Magazine at
www.powermag.com, 1 May 2009.
43. Driven by the stimulus package, China’s net imports for 2009 came in at over 100 mt,
putting it in third place behind Europe and Japan, as compared with net exports of
34 mt in 2006. More moderate imports are expected over the next few years.
44. Northern country export credit agencies guarantee debt to secure contracts for their
home industries – in this case for the boilers and turbines for Medupi and Kusile. They
eliminate the risk to banks, effectively taking over unpaid debts, but not to the recipient
country. They now hold a substantial proportion of Southern debt.
45. Calculated at R7.5 to the dollar.
46. This was the figure generally attributed to Eskom sources. Manuel put it at a marginally
more modest R356 billion in the 2009 budget speech.
47. A power station with six boiler-generator sets.
48. The revised MYPD2 application (30 November 2009) compares spending based on the
45% and the 35% tariff applications. It gives total capital spend for the seven years from
2008/2009 to 2014/2015 as R755 billion in the 45% case (p. 64) and R619 billion in the
35% case (p. 65). Eskom’s 2008 Annual Report gives total spending to 2007/2008 as
26 billion (p. 64).
49. Revised MYPD application p. 35ff.
50. Budget speech 2009.
Notes to Chapter 8

320
51. Eskom, ‘Presentation to the portfolio committee on public enterprises, funding model
and World Bank loan’, 4 May 2010.
52. Quoted by Terence Creamer, ‘SA would “cope” should World Bank fail to grant Eskom
loan’, Engineering News, 1 April 2010.
53. Responding to requests for information from the Naspers Media24 group, Eskom
said disclosure would be detrimental to Billiton’s commercial interests. See, amongst
others, Carli Lourens, ‘Naspers sues Eskom to disclose BHP power discount’, Bloomberg,
18 March 2010; SAPA, ‘Hogan doesn’t give Eskom deal details’, The Times (Johannes-
burg), 19 March 2010.
54. Quoted by Tony Carnie, ‘Sour taste over sweetheart deals’, The Mercury, 18 March 2010.
See also Melanie Gosling, ‘Eskom’s secret business deals come to light’, Business Report,
10 March 2010.
55. Earthlife Africa, ‘Sustainable energy briefing 18: Eskom costs and tariffs, 2009’, submission
to NERSA on Eskom’s MYPD2 application, 30 November 2009.
56. Rob Rose, ‘Chancellor House cloud over $3.75bn Eskom loan’, Business Times, 11 April
2010.
57. Personal communication, Sarwat Hussain, Senior Communications Officer, Africa Region
External Affairs, World Bank, 2 June 2009.
58. Eskom, ‘Application for an interim price increase’, April 2009, p. 7.
CHAPTER 9
1. Copenhagen Accord, UNFCCC, 18 December 2009.
2. La Via Campesina Press Release, ‘Traders failed in Copenhagen: The future lies in people’s
hands’, Copenhagen, 19 December 2009.
3. The critique of the LTMS is based on a paper written for the Sustainable Energy and
Climate Change Project of Earthlife Africa, Johannesburg (Hallowes 2008a).
4. See Lohmann (2006: pp. 57ff and 84ff ).
5. There is no real cap without it being global. Without the US and the big Southern
countries, cap-and-trade has no basis – even if it is believed to work in principle.
6. Sinks such as forests, land, oceans and ice absorb carbon and so prevent it entering the
atmosphere. CDM sink projects are focused on tree plantations, begging several questions
including: Whose land will be taken to create the sink? What confidence can there be
that the carbon will stay sunk? Is carbon emitted by industry in fact equivalent to carbon
circulating through ecological systems?
7. Sasol reports ‘good earnings’ from reducing nitrous oxide emissions (Annual Review
2009: 61), but reports the full reduction in its performance data (Sustainable Development
Report 2009: 56).
8. Denial was subsequently reasserted by the Republican ‘tea party’ and the election of
several representatives to Congress, backed by corporate financing, who made good
their promise to block climate legislation. That the proposed legislation, based on cap-
and-trade, was itself regressive is another question.
Notes to Chapters 8 and 9

321
9. Ma Kai, head of the National Development and Reform Commission, quoted by Jonathan
Watts, The Guardian (London), 4 June 2007.
10. Pan Jiahua, Chen Ying and Li Chenxi, ‘Balancing the carbon budget’, posted at
WorldChanging, 15 December 2009. The ‘Carbon budget proposal’ assumes global peak
emissions in 2020 and a 50% reduction on 2005 emissions by 2050. This indicates that
the budget of 2.33 tonnes CO2 per person per year for the 150 years is overly generous.
The authors propose that the budget be balanced through a combination of reductions
and financial transfers.
11. George Monbiot, ‘Copenhagen negotiators bicker and filibuster while the biosphere
burns’, The Guardian (London), 19 December 2009.
12. As is so often the case, the title REDDs belies the real content. For a short critique, see
the World Rainforest Movement, ‘From REDD to HEDD’, November 2008.
13. As well as ‘displacing’ coal, the landfill gas projects convert methane (a more powerful
GHG) into carbon dioxide, resulting in an overall decline in CO2e. Lohmann (2008)
argues that the equivalence of other GHGs to CO2 (e.g. 1 tonne methane = 22 tonnes
CO2) is itself arbitrary, but making this equivalence was necessary for a carbon market to
function.
14. George Monbiot, ‘So far the Bali deal is worse than Kyoto’, The Guardian (London),
17 December 2007.
15. The boundary between production and finance is now so blurred that this is not strictly
a choice.
16. Undated document titled ‘Landfill gas to electricity project’, prepared by L. Strachan
(eThekwini Municipality), B. Couth (Consultant) and R. Chronowski (Prototype Carbon
Fund, World Bank).
17. Lohmann (2006: 219ff.) documents a series of carbon-offset land-grabs in Latin America,
Africa and Asia. For the Mount Elgon case, see also Stephan Faris, ‘The other side of
carbon trading’, Fortune Magazine, 29 August 2007.
18. Coal subsidies are enumerated in Johnston et al. 2010.
19. The US statement at Copenhagen, reiterated in its letter signing on to the Copenhagen
Accord, said it would reduce emissions by 17%. This, however, is against the baseline
year of 2005 as against the 1990 baseline used by all other Annex I countries.
20. Letter to World Bank president Robert Zoellick signed by nine Southern country executive
directors (undated).
21. Memorandum to the Government of India on the UNFCCC’s Fifteenth Conference of
the Parties at Copenhagen, signed by the National Alliance of People’s Movements and
eighteen other organisations, 24 November 2009.
22. The State Department leads US climate negotiations but the Treasury Department has
been intimately involved from the start.
23. Walden Bello, ‘The anti-climate summit’, posted at truthout, 15 July 2008.
24. Walden Bello, ‘The environmental movement in the Global South: The pivotal agent in
the fight against global warming’, Focus on the Global South, 12 October 2007.
25. Note to Bolivian Press Release, ‘Bolivia rejects US blame game on Copenhagen and calls
for the people to decide’, 18 January 2010.
Notes to Chapter 9
322
26. Tina Gerhardt, ‘Bolivia’s people’s conference calls for system change, not climate change’,
posted at Grist, 25 April 2010.
27. Letter to UNFCCC Executive Secretary from Alf Wills on behalf of the South African
Focal Point, 29 January 2010.
28. The LTMS (2007) produced three documents known as the Scenarios Document (SD)
that gives the conclusions to the study, the Technical Report (TR), which discusses methods
and gives detailed findings, and a Process Report (PR). Discussion of the LTMS is based
on a more detailed paper prepared for Sustainable Energy and Climate Change Project
of Earthlife Africa Johannesburg (Hallowes 2008).
29. LTMS produces a graph without giving the actual figures for these dates, but this
approximation was subsequently confirmed by Department of Environmental Affairs
figures presented to NEDLAC.
30. Department of Environmental Affairs, ‘South Africa’s desired greenhouse gas mitigation
outcomes – to define or not to define’. Presentation to the 3rd meeting of NEDLAC
National Climate Change Response Green Paper Joint Task Team, 25 March 2011.
31. See Table SPM.5 in AR4 Working Group III report on mitigation, p. 23.
32. The effect of climate policy is specifically excluded from the scenarios although policies
addressing other environmental concerns, primarily pollution, are included.
33. For a critique on the inflation index, see Dick Forslund, ‘Official inflation reports and
“the government of the wealthy” ’, Amandla, March/April 2010, Issue No. 13. The method
of calculating inflation is actually called ‘plutocratic indexing’ – hence ‘government of
the wealthy’.
34. IRP puts renewables capacity at 14.5% in 2030 but production is lower from variable
renewables than it is from constant base load.
35. Eskom got around to developing a climate strategy in 2005.
36. This means that the electric energy produced by the new power stations will amount to
40% of the primary energy embodied in the coal.
37. Eskom’s interest in Underground Coal Gasification originates with poor planning for its
Majuba plant. Majuba was designed as a pithead power station but a fault in the coal
seam made the proposed mine unviable. Coal is now trucked in by road at considerable
economic and environmental cost. Gasification would enable Eskom to use the original
coal resource to fuel the plant. Underground Coal Gasification involves controlled burning
of the coal in situ in a low-oxygen environment – much the same technique as is used to
produce charcoal. It thus replaces the entire mining operation and is being considered
for other areas where coal is difficult or expensive to extract including deep deposits on
the Waterberg. Long-term environmental costs, including the possibility of uncontrolled
underground fires, are uncertain.
38. Quoted in Earthlife Africa’s submission to NERSA on Eskom’s MYPD2 application,
30 November 2009.
39. Carbon savings are represented on a graph (p. 70) that cannot be precisely read.
Notes to Chapter 9

323
CHAPTER 10
1. Catherine Brahic, ‘Organic farming could feed the world’, New Scientist, 12 July 2007.
2. Institute of Science in Society (ISIS) Press Release, 10 September 2007. The report is
titled ‘Organic agriculture and food security’. It does not represent the dominant view
within FAO but rather a challenge to that view.
3. China Daily, 14 June 2006.
4. Bagasse is organic waste from sugar and is commonly used to power sugar mills. Its
alternative use is as a compost, indicating the choice of power or soil fertility.
5. SDCEA, ‘Comments on the draft central spatial development plan’, 20 October 2009.
6. Amit Sengupta, ‘The train stops at Nandigram’, Hardnews, April 2007 at www.hardnews
media.com.
7. Press release issued by Richard Spoor, attorney for the Mohlohlo Community, ‘Anglo
Platinum mining community members acquitted’, 31 July 2009.
8. Maandagshoek Development Committee, Press Statement, 9 September 2007.
9. Personal communication.
10. Email network communication, 6 August 2007.
11. Email network communication, 15 July 2007.
12. Inflation on those goods that the poor spend most of their money on is higher than
official inflation.
Notes to Chapter 10
324
Toxic Futures
Select bibliography
ActionAid. 2008. ‘Precious metal: The impact of Anglo Platinum on poor communities
in Limpopo, South Africa’ (Mark Curtis). Johannesburg: ActionAid.
Alexander, N. 2009. ‘Let us return to the source: In quest of a humanism of the twenty-
first century’. Sipho Maseko Memorial Lecture, 8 October 2009, University of the
Western Cape, Cape Town.
Allison, I., N. Bindoff, R. Bindschadler, P. Cox, N. de Noblet, M. England, J. Francis,
N. Gruber, A. Haywood, D. Karoly, G. Kaser, C. le Quéré, T. Lenton, M. Mann,
B. McNeil, A. Pitman, S. Rahmstorf, E. Rignot, H. Schellnhuber, S. Schneider,
S. Sherwood, R. Somerville, K. Steffen, E. Steig, M. Visbeck and A. Weaver. 2009.
The Copenhagen Diagnosis, 2009: Updating the World on the Latest Climate Science. Sydney:
University of New South Wales Climate Change Research Centre (CCRC).
Alston, D. 1993. ‘Environment and development: An issue of justice’. In Hidden Faces:
Environment, Development, Justice: South Africa and the Global Context, ed. D. Hallowes.
Scottsville: Earthlife Africa.
Altvater, E. 2006. ‘The social formation of capitalism, fossil energy, and oil-imperialism’.
Colloquium on the Economy, Society and Nature, Centre for Civil Society, University
of KwaZulu-Natal, Durban.
Anderson, K. and A. Bows. 2008. ‘Reframing the climate change challenge in light of
post-2000 emission trends’. Philosophical Transactions of the Royal Society. doi:10.
1098/rsta.2008.0138, published online at http://rsta.royalsocietypublishing.org/
content/366/1882/3863.full.pdf+html.
Annecke, W. 2006. ‘The ethics and economics of including women in the ESI’. In ESI
Africa 3.
Arrighi, G. 2005. ‘Hegemony unravelling–1’. In New Left Review 32, March–April 2005.
———. 1994. The Long Twentieth Century: Money, Power and the Origins of Our Times. London:
Verso.
Baird, E. 2003. World Petroleum Congress Handbook 2004. Fifth Dewhurst Lecture given to
the Seventeenth World Petroleum Congress on 3 September 2002, Rio de Janeiro,
Brazil.

325
Select bibliography
Bénit, C. and P. Gervais-Lambony. 2005. ‘The poor and the shop window: Globalisation,
a local political instrument in the South African city?’ In Transformation 57.
Bertelsen, E. 1998. ‘Ads and amnesia: Black advertising in the new South Africa’. In
Negotiating the Past: The Making of Memory in South Africa, eds S. Nuttall and C. Coetzee.
Cape Town: Oxford University Press.
BHP Billiton. 2006. Aluminium Customer Sector Group (CSG) Sustainable Development Report
2005–2006. BHP Billiton.
Bond, P. 2005. ‘What’s wrong with our energy system?’ In Trouble in the Air, eds P. Bond
and R. Dada. Durban, Centre for Civil Society, University of KwaZulu-Natal.
Brenner, R. 2003. ‘Towards the precipice’. London Review of Books, Vol. 25, No. 3.
Butler, M. 1997. ‘Lessons from Thor Chemicals’. In The Bottom Line: Industry and the
Environment in South Africa, eds L. Bethlehem and M. Goldblatt. Cape Town: University
of Cape Town Press and International Development Research Centre.
Campbell, C. 2008. Newsletter 90, June 2008. Association for the Study of Peak Oil (ASPO),
Available at www.peakoil.ie.
———. 2007. Newsletter 75, March.
Canadian Centre for Policy Alternatives (CCPA). 2006. ‘Fuelling fortress America: A
report on the Athabasca tar sands and US demand for Canada’s energy’. H. McCullum
for CCPA.
Castells, M. 2000a. The Information Age: Economy, Society and Culture, Volume I: The Rise of the
Network Society. Second edition. Oxford: Blackwell.
———. 2000b. End of Millennium. The Information Age: Economy, Society and Culture, Volume
III. Second edition. Oxford: Blackwell.
Chipkin, I. 2003. ‘The South African nation’. In Transformation 51.
Christian Aid. 1999. Who Owes Who? Climate Change, Debt, Equity and Survival. London:
Christian Aid.
Cock, J. 2001. ‘Gun violence and masculinity in South Africa’. In Changing Men in South
Africa, ed. R. Morrell. Pietermaritzburg: University of Natal Press and London: Zed
Books.
Cock, J. and V. Munnik. 2006. Throwing Stones at a Giant: An Account of the Struggle of the
Steel Valley Community against Pollution from the Vanderbijlpark Steel Works. Durban: Centre
for Civil Society, University of KwaZulu-Natal.
Danmarks Naturfredningsforening (DN) and South Durban Community Environmental
Alliance (SDCEA). 2003. Comparison of Refineries in Denmark and South Durban in an
Environmental and Societal Context: A 2002 Snapshot. Durban: SDCEA and DN.
Davis, D. 2002. When Smoke Ran Like Water: Tales of Environmental Deception and the Battle
against Pollution. New York: Basic Books.
Davis, M. 2004. ‘Planet of slums’. In New Left Review 26, March/April.
———. 2002. Late Victorian Holocausts: El Nino Famines and the Making of the Third World.
London: Verso.

326
Toxic Futures
De los Reyes, R. 2006. Impacts of Coal Plants on Communities. World Wildlife Fund.
Department of Environmental Affairs and Tourism (DEAT). 2007. Long-Term Mitigation
Scenarios (LTMS). Strategic Options for South Africa (the Scenarios Document or SD);
Technical Report (TR), ed. H. Winkler, Energy Research Centre Report for the DEAT.
———. 2006. South Africa Environment Outlook: A Report on the State of the Environment.
———. 2004. A National Climate Change Response Strategy for South Africa.
Department of Minerals and Energy (DME). 2007. Energy Security Master Plan: Liquid
Fuels.
———. 2006. Digest of South African Energy Statistics.
———. 2005. Digest of South African Energy Statistics.
———. 2004. Status of Radio-Active Waste Management in South Africa.
———. 2002. Energy Outlook. DME, Eskom, Energy Research Institute, University of
Cape Town.
———. 2001. Electricity Distribution Industry Blueprint Report.
Department of Trade and Industry (DTI). 2010. Industrial Policy Action Plan (IPAP2).
———. 2007. Implementation of Government’s National Industrial Policy Framework: Industrial
Policy Action Plan. September.
———. 2002. Accelerating Growth and Development: The Contribution of an Integrated
Manufacturing Strategy (IMS).
Desai, A. and R. Pithouse. 2004. ‘But We Were Thousands’: Dispossession, Resistance, Repossession
and Repression in Mandela Park. Durban: Centre for Civil Society, University of Natal.
D’Itri, P and F. D’Itri. 1977. Mercury Contamination: A Human Tragedy. New York: John
Wiley and Sons.
Dobreva, R. 2006. Trade and Poverty in South Africa: The Link between Trade and Poverty: The
Case of Polymers. Cape Town: University of Cape Town, Southern Africa Labour and
Development Research Unit (SALDRU).
Down, C.G. and J. Stocks. 1977. Environmental Impact of Mining. London: Applied Science
Publishers.
Doyle, J. 2002. Riding the Dragon: Royal Dutch Shell and the Fossil Fire. Boston: Environmental
Health Fund.
Dugard, J. 2010. ‘Power to the people? A rights-based analysis of South Africa’s electricity
services’. In Electric Capitalism: Recolonising Africa on the Power Grid, ed. D. McDonald.
London: Earthscan and Pretoria: HSRC Press.
Eberhard, A. 2005. From State to Market and Back Again: South Africa’s Power Sector Reforms.
Cape Town: Graduate School of Business, University of Cape Town.
Eberhard A. and C. Van Horen. 1995. Poverty and Power: Energy and the South African State.
Cape Town: UCT Press and East Haven: Pluto Press.
Emfuleni Local Municipality. 2005. Integrated Development Plan 2005/2006.
327
Select bibliography
Environmental Rights Action (ERA) and Oilwatch. 2000. Pipe Dream: The West African
Gas Pipeline Project and the Environment. Environmental Rights Action/Friends of the
Earth Nigeria and Oilwatch.
EnviroServ. Annual Report 2007.
———. Annual Report 2006.
Eskom. Annual Reports 2009, 2008, 2007.
Ewart, J. and A. du Toit. 2005. ‘New fault lines in the countryside: Restructuring in the
Western Cape wine industry’. In Beyond the Apartheid Workplace: Studies in Transition,
eds E. Webster and K. von Holdt. Pietermaritzburg: University of KwaZulu-Natal
Press.
Extractive Industries Review. 2003. Striking a Better Balance. Volume I: The World Bank Group
and Extractive Industries. Volume II: Stakeholder Inputs: Converging Issues and Diverging Views
on the World Bank Group’s Involvement in Extractive Industries. EIR.
Farrell, A. and A. Brandt. 2006. Risks of the Oil Transition. Environmental Research Letters.
Berkeley, California: University of California, Energy and Resources Group.
Ferguson, J. 2005. ‘Seeing like an oil company’. In American Anthropologist, Vol. 107, No. 3.
Fig, D. 2005. Uranium Road: Questioning South Africa’s Nuclear Direction. Johannesburg: Jacana.
Fiil-Flynn, M. and P. Naidoo. 2004. ‘Nothing for mahala: The forced installation of prepaid
water metres in Stretford, Extension 4, Orange Farm, Johannesburg’. Centre for
Civil Society Research Report 16. Public Citizen, Anti-Privatisation Forum, Coalition
Against Water Privatisation. Durban: Centre for Civil Society, University of Natal.
Fine, B. 2008a. ‘Engaging the MEC’. Paper for School of Development Studies Workshop
on the Minerals and Energy Complex, University of KwaZulu-Natal, June.
———. 2008b. ‘The minerals-energy complex is dead: Long live the MEC?’ Paper for
Amandla Colloquium, April.
Fine, B. and Z. Rustomjee. 1996. The Political Economy of South Africa: From Minerals-Energy
Complex to Industrialisation. Johannesburg: Witwatersrand University Press.
Gary, I. and T. Karl. 2003. Bottom of the Barrel: Africa’s Oil Boom and the Poor. Catholic Relief
Services.
Gentle, L. 2009. ‘Escom to Eskom: From racial Keynesian capitalism to neo-liberalism’.
In Electric Capitalism: Recolonising Africa on the Power Grid, ed. D. McDonald. London:
Earthscan and Pretoria: HSRC Press.
German Advisory Council on Global Change (WBGU). 2009. Solving the Climate Dilemma:
The Carbon Budget Approach. Berlin: WBGU.
Graham, S. 2007. ‘War and the city’. In New Left Review 44, March/April.
Greenberg, S. 2010. Status Report on Land and Agricultural Policy in South Africa. Research
Report 40, Institute for Poverty, Land and Agrarian Studies (Plaas). Cape Town: Univer-
sity of the Western Cape.
———. 2006. The State, Privatisation and the Public Sector in South Africa. SAPSN and AIDC.

328
Toxic Futures
Greenpeace. 2006. Plastic Debris in the World’s Oceans. Written by M. Allsopp, A. Walters, D.
Santillo and P. Johnston.
The groundWork Reports
———. 2008. Wasting the Nation: Making Trash of People and Places, (D. Hallowes and V.
Munnik).
———. 2007. Peak Poison: The Elite Energy Crisis and Environmental Injustice, (D. Hallowes
and V. Munnik).
———. 2006. Poisoned Spaces: Manufacturing Wealth, Producing Poverty, (D. Hallowes and V.
Munnik).
———. 2005. Whose Energy Future? Big Oil against People in Africa, (D. Hallowes and M.
Butler).
———. 2004. The Balance of Rights: Constitutional Promises and Struggles for Environmental
Justice, (D. Hallowes and M. Butler).
———. 2003. Forging the Future: Industrial Strategy and the Making of Environmental Injustice,
(D. Hallowes and M. Butler).
———. 2002. Corporate Accountability in South Africa: The Petrochemical Industry and Air Pollution,
(M. Butler and D. Hallowes).
groundWork. 2003. Air Quality Report 2003.
Hallowes, D. 2009. The World Bank and Eskom: Banking on Climate Destruction. groundWork.
———. 2008a. A Critical Appraisal of the LTMS. Johannesburg: Earthlife Africa.
———. 2008b. Capital Meltdown, Kyoto and Civil Society. Johannesburg: Earthlife Africa.
———. 2005. ‘Sustainable energy: Towards a civil society review of South African energy
policy’. Discussion Paper for Earthlife Africa, Johannesburg.
———. 1993. Hidden Faces: Environment, Development, Justice: South Africa and the Global
Context. Johannesburg: Earthlife Africa.
Hansen, J. 2006. ‘The threat to the planet’. In New York Review of Books, 13 July.
Hansen, J., M. Satoa, P. Kharechaa, D. Beerling, R. Bernerd, V. Masson-Delmottee, M.
Paganid, M. Raymof, D. Royerg and J. Zachosh. 2008. Target Atmospheric CO2: Where
Should Humanity Aim? Submitted at arXiv.org, 7 April 2008 and revised 18 June 2008
(ref: arXiv:0804.1126v2).
Harley, J. 2006. ‘Report on cement kilns’, prepared for groundWork.
Harvey, D. 2008. The Right to the City. Available at http://davidharvey.org/media/righttothe
city.pdf.
———. 2005. The New Imperialism. London: Oxford University Press.
Heinberg, R. 2007. ‘Bridging peak oil and climate change activism’. Paper for International
Forum on Globalisation Seminar, London, 23–27 February.
———. 2005. The Party’s Over: Oil, War and the Fate of Industrial Societies. Second edition.
Gabriola Island, Canada: New Society Publishers.
———. 2004. Powerdown: Options and Actions for a Post-Carbon World. Gabriola Island, Canada:
New Society Publishers.

329
Select bibliography
Hendler, P., J. Holliday, S. Ratcliffe and J. Wakeford. 2007. ‘Current global challenges and
alternative futures for South Africa: The inter-connection between oil depletion, climate
change and global financial imbalances’. ASPO South Africa.
Hildyard, N. 2008. A (Crumbling) Wall of Money: Financial Bricolage, Derivatives and Power.
Sturminster Newton, Dorset: The Corner House.
Hirsch, A. 2005. Season of Hope: Economic Reform under Mandela and Mbeki. Pietermaritzburg:
University of KwaZulu-Natal Press.
Hirsch, R. 2007. ‘Peaking of world oil production: Recent forecasts’. In World Oil Magazine,
April.
Hirsch, R., R. Bezdek and R. Wendling. 2005. ‘Peaking of world oil production: Impacts,
mitigation and risk management’. Report prepared for the National Energy Technology
Laboratory of the US Department of Energy.
Hobbs, P., S. Oelofse and J. Rascher. 2008. ‘Management of environmental impacts from
coal mining in the upper Olifants River catchment as a function of age and scale’. In
International Journal of Water Resources Development 24: 3.
Holm, D., D. Banks, J. Schäffler, R. Worthington and Y. Afrane Okese. 2008. ‘Renewable
energy briefing paper: Potential of renewable energy to contribute to national electricity
emergency response and sustainable development’. Prepared for Trade and Industry
Policy Studies (TIPS).
Hopkins, R. 2006. ‘Energy descent pathways: Evaluating potential responses to peak oil’.
MSc. dissertation for the University of Plymouth.
———. Undated. ‘Powerdown and permaculture: At the cusp of transition’. In Permaculture
Magazine 50.
Human Rights Watch. 2005. Rivers and Blood: Guns, Oil and Power in Nigeria’s Rivers State.
HRW Briefing Paper.
———. 2002. The Niger Delta: No Democratic Dividend. HRW Briefing Paper.
Intergovernmental Panel on Climate Change (IPCC). 2007a. Climate Change 2007: The
Physical Science Basis. Summary for Policymakers, Contribution of Working Group I to
the Fourth Assessment Report of the Intergovernmental Panel on Climate Change.
———. 2007b. Climate Change 2007: Climate Change Impacts, Adaptation and Vulnerability.
Summary for Policymakers, Contribution of Working Group II to the Fourth Assess-
ment Report of the Intergovernmental Panel on Climate Change.
———. 2000. Special Report on Emissions Scenarios (SRES).
International Energy Agency (IEA). World Energy Outlook 2010, Executive Summary.
———. World Energy Outlook 2008.
———. World Energy Outlook 2006.
Joffe, A., D. Kaplan, R. Kaplinsky and D. Lewis. 1993. ‘Meeting the global challenge: A
framework for industrial revival in South Africa’. In South Africa and the World Economy
in the 1990s, eds P. Baker et al. Pretoria: IDASA and The Aspen Institute.

330
Toxic Futures
Johnston, L., L. Hamilton, M. Kresowik, T. Sanzillo and D. Schlissel. 2010. ‘Phasing out
federal subsidies for coal’. Report by Synapse Energy Economics.
Joubert, L. 2006. Scorched: South Africa’s Changing Climate. Johannesburg: Witwatersrand
University Press.
Keegan, T. 1986. Rural Transformations in Industrializing South Africa. Johannesburg: Ravan
Press.
Kemmer, F. 1971. ‘Pollution control in the steel industry’. In Industrial Pollution Control
Handbook, ed. H.F. Lund. Columbus, Ohio: McGraw-Hill.
Khor, M. 2010. ‘Complex implications for the Cancun climate conference’. In Economic
and Political Weekly, Vol. XIV, No. 52.
Kovel, J. 2002. Enemy of Nature. London: Zed Books.
Kretzmann, S. and I. Nooruddin. 2005. Drilling into Debt: An Investigation into the Relationship
between Debt and Oil. Oilchange International, Jubilee USA Network, Institute for Public
Policy Research, Milieu Defensie, Amazon Watch.
Kropotkin, P. 1913. The Conquest of Bread. London: Chapman and Hall.
Kull, D. 2006. ‘Connections between recent water level drops in Lake Victoria, dam
operations and drought’, available at International Rivers Network website.
Lahiff, E. 2003. ‘The politics of land reform in southern Africa’. Sustainable Livelihoods
in Southern Africa Programme.
Leggett, J. 2005. Half Gone: Oil, Gas, Hot Air and the Global Energy Crisis. London: Portobello
Books.
Leibbrandt, M., I. Woolard, A. Finn and J. Argent. 2010. ‘Trends in South African income
distribution and poverty since the fall of apartheid’. OECD Social, Employment and
Migration Working Papers No. 101.
Leonard, A. 2008. The Story of Stuff. Video and referenced and annotated script, at
www.storyofstuff.com.
Levin, K. and J Pershing. 2007. Climate Science 2006: Major New Discoveries. World Resource
Institute.
Lohmann, L. 2008. ‘Toward a different debate in environmental accounting: The cases of
carbon and cost-benefit’. In Accounting, Organizations and Society (forthcoming) and
available at www.thecornerhouse.org.uk.
———. 2006. ‘Carbon trading: A critical conservation on climate change, privatisation
and power’. In Development Dialogue 48.
Lucas, C., A. Jones and C. Hines. 2006. Fuelling a Food Crisis: The Impact of Peak Oil on Food
Security. The Greens/European Free Alliance in the European Parliament.
Lucas, C., V. Shiva and C. Hines. 2005. ‘Making poverty inevitable: The consequences of
the UK government’s damaging approach to global trade’. At www.carolinelucas
mep.org.uk.
MacKenzie, D. 2007. ‘The political economy of carbon trading’. In London Review of Books,
Vol. 29, No. 7, 5 April.

331
Select bibliography
Marais, H. 2001. South Africa Limits to Change: The Political Economy of Transition. London:
Zed Books and Cape Town: UCT Press.
Maré, G. 2003. ‘The state of the state’. In State of the Nation: South Africa 2003–2004, eds
J. Daniel, A. Habib and R. Southall. Pretoria: HSRC Press.
McCarthy T. and K. Pretorius. Undated. ‘Coal mining on the highveld and its implications
for future water quality in the Vaal River system’. Paper for South African Environ-
mental Observation Network (SAEON).
McCluney, R. 2005. ‘Renewable energy limits’. In The Final Energy Crisis, eds A. McKillop
and S. Newman. East Haven: Pluto.
McDaid, L. 2010. Power to the People: Raising the Voice of Civil Society in Electricity Planning –
Integrated Resources Plan 2010 Inputs and Departmental Responses. Cape Town: Institute for
Security Studies, September.
McDonald, D. and L. Smith. 2004. ‘Privatising Cape Town: From apartheid to neo-
liberalism in the mother city’. In Urban Studies, Vol. 41, No. 8, July.
McKibben, B. 2007. ‘Warning on warming’. In New York Review of Books, 15 March.
McKillop, A. 2006. ‘Peak oil to peak gas is a short ride’. In Energy Bulletin, 12 December.
McRae, I. 2006. The Test of Leadership: Fifty Years in the Electricity Supply Industry in South
Africa. Nooitgedacht, Gauteng. EE Publishers.
Metsimaholo Municipality. 2003. Integrated Development Plan 2003.
Ministry of Finance. 1995. Growth, Employment and Redistribution: A Macroeconomic Strategy.
Mobbs, P. 2005. Energy beyond oil. Leicester: Matador Publishing.
Mohlakoana, N. and W. Annecke. 2008. ‘Finally breaking the barriers: South African case
study on LPG use by low-income urban households’. Istanbul Pre-Conference
Workshop on Clean Cooking Fuels, 16–17 June.
Monbiot, G. 2006. Heat: How to Stop the Planet Burning. London: Penguin/Allen Lane.
Moody, R. 2007. Rocks and Hard Places: The Globalization of Mining. Cape Town: David
Philip and London: Zed Books.
Moore, C. 2003. ‘Trashed: Across the Pacific Ocean, plastics, plastics, everywhere’. In
Natural History, Vol. 112, No. 9, November.
Morgan, F. (dir.). 2006. The Power of Community: How Cuba Survived Peak Oil. Video: The
Community Solution.
Munn, A. 2004. ‘Emission reductions at Engen Refinery in south Durban’. Paper delivered
to the Eighth World Congress on Environmental Health held at International
Convention Centre in Durban, 22–27 February.
Murray, R. 2002. Zero Waste. London: Greenpeace Environmental Trust.
Naidoo, R., N. Gqaleni, S. Batterman and T. Robins. 2006. South Durban Health Study.
Centre for Occupational Health, University of KwaZulu-Natal; Department of En-
vironmental Health Sciences, University of Michigan; Department of Environmental
Health Sciences, Durban Institute of Technology.
332
Toxic Futures
National Nuclear Regulator (NNR). 2007. The Wonderfontein Catchment Area Public Report,
Results and Corrective Action, TR-NTNS-07-0001.
NEPAD. October 2001. Available from www.nepad.org.
National Energy Regulator of South Africa (NERSA). 2008. Inquiry into the National Electricity
Supply Shortage and Load Shedding. Report by the Energy Regulator. 12 May.
Nolan, P. and J. Zhang. 2010. ‘Global competition after the financial crisis’. In New Left
Review 64, July/August.
O’Hagan, A. 2007. ‘The things we throw away’. In London Review of Books, 24 May 2007.
Okonta, I. 2006. Behind the Mask: Explaining the Emergence of the MEND Militia in Nigeria’s
Oil-Bearing Niger Delta. Economies of Violence Working Paper No. 11, Institute of
International Studies, University of California, Berkeley.
———. 2005. ‘Asari Dokubo: Insurgent or self-serving opportunist’. In This Day, 8 January
2005, and posted by Black Looks at http://okrasoup.typepad.com/black_looks/.
Okonta, I. and O. Douglas. 2003. Where Vultures Feast: Shell, Human Rights and Oil in the
Niger Delta. London: Verso.
Pallister, D., S. Stewart and I. Lepper. 1987. South Africa Inc. The Oppenheimer Empire. London:
Corgi.
Pelupessy, W. 2000. ‘Can Restructuring of Industry Create Jobs in South African Town-
ships?’ Development Research Institute, Tilburg University.
Pichtel, J. 2005: Waste Management Practices: Municipal, Hazardous and Industrial. New York:
CRC Press.
Pimentel, D. and T. Patzek. 2005. ‘Ethanol production using corn, switchgrass and wood;
biodiesel production using soybean and sunflower’. In Natural Resources Research, Vol.
14, No. 1, March.
Pimentel, D., T. Patzek and G. Cecil. 2007. ‘Ethanol production: Energy, economic and
environmental losses’. In Reviews of Environmental Contamination and Toxicology 189.
New York: Springer.
Pithouse, R. 2006. ‘Our Struggle is Thought, on the Ground, Running’: The University of Abahlali
baseMjondolo. Durban: Centre for Civil Society, University of KwaZulu-Natal.
Polanyi, K. 2001. The Great Transformation: The Political and Economic Origins of our Time.
Second edition. Boston: Beacon Press.
Pomeranz, K. 2009. ‘The great Himalayan watershed’. In New Left Review 58, July/August.
Pone, J.D.N. et al. 2007. ‘The spontaneous combustion of coal and its by-products in the
Witbank and Sasolburg coalfields of South Africa’. In International Journal of Coal
Geology 72.
PPC. Annual Report 2007.
———. Annual Report 2006.
The Presidency. 2008. Towards a Fifteen Year Review. South African Government.
———. 2003. Towards a Ten Year Review.
333
Select bibliography
Raupach, M., G. Marland, P. Ciais, C. le Quéré, J. Canadell, G. Klepper and C. Field. 2007.
Global and Regional Drivers of Accelerating CO2 Emissions. Proceedings of the National
Academy of Sciences, available at www.pnas.org.
Retort. 2005. Afflicted Powers: Capital and Spectacle in a New Age of War. Written by I. Boal, T.
Clark, J. Matthews and M. Watts. London: Verso.
Roberts, S. and Z. Rustomjee. 2009. ‘Industrial policy under democracy: Apartheid’s grown
up infant industries? Iscor and Sasol’. In Transformation 71.
Robinson, K.E. and G.C. Toland. 1979. ‘Case histories of different seepage problems for
nine tailings dams’. In Mine Drainage: Proceedings of the First International Mine Drainage
Symposium, eds G.O. Argall and C.O. Brawner. San Francisco: Miller Freeman.
Roesner, T. et al. 2001. ‘A preliminary assessment of pollution contained in the unsaturated
and saturated zone beneath reclaimed gold-mine residue deposits’. Water Research
Commission Report 797/1/01.
Rogers, H. 2005a. Gone Tomorrow: The Hidden Life of Garbage. New York: The New Press.
———. 2005b. ‘A brief history of plastic’. In The Brooklyn Rail, May.
Rosset, P. 2000. ‘Cuba: A successful case study of sustainable agriculture’. In Hungry for
Profit: The Agribusiness Threat to Farmers, Food and the Environment, eds F. Magdoff,
J. Bellamy Foster and F. Buttel. New York: Monthly Review Press. Also at the Cuba
Organic Support Group site www.cosg.org.uk.
Ruiters, G. 2005. ‘Knowing your place: Urban services and new modes of governability in
South African cities’. Institute for Social and Economic Research, Rhodes University;
paper for Centre for Civil Society Seminar, University of KwaZulu-Natal, 6 October.
Runge, C. F., and B. Senauer. 2007. ‘How biofuels could starve the poor’. In Foreign Affairs,
May/June.
Sachs, W. 2005. ‘Equity in the greenhouse: How just is the Kyoto Protocol?’ In Reading the
Kyoto Protocol: Ethical Aspects of the Convention on Climate Change, ed. E. Vermeersch.
Delft: Eburon Academic Publishers.
Sachs, W. and T. Santorius. 2007. Fair Future: Resource Conflicts, Security and Global Justice.
London: Zed Books.
Sachs, W., H. Acselrad, F. Akhter, A. Amon, T. Egziabher, H. French, P. Haavisto,
P. Hawken, H. Henderson, A. Khosla, S. Larrain, R. Loske, A. Roddick, V. Taylor,
C. von Weiszaecker and S. Zabelin. 2002. The Jo’burg Memo: Fairness in a Fragile World.
Second edition. Memorandum for the World Summit on Sustainable Development.
Heinrich Böll Foundation, World Summit Papers.
Samson, M. 2008. ‘Reclaiming livelihoods: The role of waste reclaimers in municipal
waste management systems’. Report for groundWork.
———. 2004. Organizing in the Informal Economy: A Case Study of the Municipal Waste
Management Industry in South Africa. International Labour Organisation.
Sasol. Annual Reports 2009, 2007 and 2006 (AR 2009; AR 2007; AR 2006).

334
Toxic Futures
———. Sustainable Development Reports 2009, 2007 and 2006 (SDR 2009; SDR 2007; SDR
2006).
———. Sasolburg Safety, Health and Environment (SH&E) Briefs 2006 and 2005 (SH&E
2006; SH&E 2005).
———. 2005. Sustainable Development Report 2002–2004.
———. 2004. Annual Review 2004.
Scorgie, Y. 2004. ‘Air quality situation assessment for the Vaal Triangle region’. Report for
the Legal Resource Centre.
Seekings, J. 2007. Poverty and Inequality after Apartheid. Cape Town: University of Cape
Town, Centre for Social Science Research.
Simms, A. 2001. ‘Ecological debt: Balancing the environmental budget and compensating
developing countries’. Pamphlet for the World Summit on Sustainable Development.
International Institute for Environment and Development (IIED).
Simms, A., J. Oram and P. Kjell. 2004. The Price of Power: Poverty, Climate Change, the Coming
Energy Crisis and the Renewable Revolution. London: New Economics Foundation.
Slabbert, T. 2004. ‘An investigation into the state of affairs and sustainability of the
Emfuleni economy’. Doctoral thesis, Faculty of Economic and Management Sciences,
University of Pretoria.
Solomon, S., G-K. Plattner, R. Knuttic and P. Friedlingstein. 2009. Irreversible Climate
Change Due to Carbon Dioxide Emissions. Proceedings of the National Academy of
Sciences available at www.pnas.org.
South African Government (SAG). 2009. South Africa Year Book 2008/09.
———. 2006. ‘Background document: A catalyst for Accelerated and Shared Growth –
South Africa (ASGISA)’. Media Briefing by Deputy President Phumzile Mlambo-
Ngcuka, 6 February.
———. 2004. South Africa Year Book 2003/04.
South African Labour Bulletin (SALB). 2002. ‘The DTI’s integrated manufacturing strategy:
Is it all just packaging?’ In SALB, Vol. 26, No. 3, June.
Statistics South Africa (Stats SA). 2008. Income and Expenditure of Households 2005/2006:
Analysis of Results. Statistics South Africa.
Steffen, W., A. Sanderson, P. Tyson, J. Jager, P. Matson, B. Moore, F. Oldfield, K. Richardson,
H. Schellnhuber, B. Turner and R. Wasson. 2004. Global Change and the Earth System: A
Planet under Pressure. The IGBP Series. New York: Springer Press.
Stern, N. 2006. ‘The economics of climate change’ (The Stern Report). Review for the UK
Treasury.
Stockman, L. and G. Muttitt. 2005. Pumping Poverty: Britain’s Department for International
Development and the Oil Industry. London: Platform Research, Friends of the Earth and
Plan B.
Stover, R., K. Evans and K. Pickett. 1996. Report of the Berkeley Plastics Task Force. Berkeley:
The Ecology Centre.

335
Select bibliography
Supiot, A. 2006. ‘Law and labour: A world market of norms?’ In New Left Review 39,
May/June.
Sustainable Energy Africa (SEA). 2003. City of Cape Town State of Energy Report. Available
at www.sustainable.org.za.
Swilling, M. 2007. Cape Town 2025: A City of Sustainable Neighbourhoods. Cape Town:
Sustainability Institute.
———. 2006. Sustainability and Infrastructure Planning in South Africa: A Cape Town Case
Study. Cape Town: Environment and Urbanisation.
Taylor, T. 2007. The Political Economy of Power. Johannesburg: Earthlife Africa.
The Economics of Ecosystems and Biodiversity (TEEB). 2009. ‘Factsheet’, prepared for
Fifth Intergovernmental Conference: Biodiversity in Europe, 22–24 September 2009,
Liege, Belgium.
———. 2008. An Interim Report. European Communities.
Thompson, J. and H. Anthony. 2005. The Health Effects of Waste Incinerators. Fourth Report
of the British Society for Ecological Medicine.
Tissington, K. 2009. ‘The deficiency of reality in the Joe Slovo judgment’. Johannesburg:
University of the Witwatersrand, Centre for Applied Legal Studies.
Turner, T. and L. Brownhill. 2004. ‘Why women are at war with Chevron: Nigerian
subsistence struggles against the international oil industry’. In Journal of Asian and
African Studies, Vol. 39, No. 1/2.
Turton, A.R. 2008. Water and Mine Closure in South Africa: Development that is Sustainable?
Available at www.sidint.org/development.
Tyndall Centre. 2005. Decarbonising the UK: Energy for a Climate Conscious Future. Tyndall
Centre for Climate Change Research at www.tyndall.ac.uk.
United Nations Environmental Programme (UNEP). 2002. Global Environmental Outlook
3. UNEP and London: Earthscan.
Vallette, J. and S. Kretzmann. 2004. The Energy Tug of War: The Winners and Losers of World
Bank Fossil Fuel Finance. Washington DC: Institute for Policy Studies, Sustainable Energy
and Economy Network.
Von Holdt, K. 2003. Transition from Below: Forging Trade Unionism and Workplace Change in
South Africa. Pietermaritzburg: University of KwaZulu-Natal Press.
Von Ketelhodt, A. 2006. ‘The long term impact of electricity shortage on small and
medium sized businesses in Cape Town’. MBA thesis, University of Pretoria.
Walsh, S. (dir). 2009. H2Oil. Loaded Pictures. Web site: www.h2Oildoc.com.
Watts, M. 2009. ‘Tipping point: Slipping into darkness’. Economies of Violence Working
Paper No. 23. Berkeley: University of California, Institute of International Studies.
———. 2008. ‘Blood oil: The anatomy of a petro-insurgency in the Niger Delta, Nigeria’,
Economies of Violence Working Paper No. 22. Berkeley: University of California,
Institute of International Studies.

336
Toxic Futures
Webster, E. and K. von Holdt. 2005. ‘Work restructuring and the crisis of social
reproduction: A southern perspective’. In Beyond the Apartheid Workplace: Studies in
Transition, eds E. Webster and K. von Holdt. Pietermaritzburg: University of KwaZulu-
Natal Press.
Whyte, Anne V. (ed.). 1995. Building a New South Africa: Volume 4: Environment, Reconstruction
and Development: A Report from the International Mission on Environmental Policy. International
Development Research Centre.
Wiley, D., C. Root and S. Peek. 2002. ‘Contesting the urban industrial environment in
South Durban in a period of democratisation and globalisation’. In (D)urban Vortex:
A South African City in Transition, eds W. Freund and V. Padayachee. Pietermaritzburg:
University of Natal Press.
Winkler, H. 2007. ‘Energy policies for sustainable development in South Africa’. In Energy
for Sustainable Development, Vol. XI, No. 1, March.
Wolmarans, J. 1984. ‘Ontwatering van die dolomietgebied aan die Verre Wesrand
(Dewatering of the dolomite area of the Far West Rand)’. Unpublished DSc. (Geology)
thesis, Potchefstroom University.
World Bank. 2009. Draft Safeguards Diagnostic Review for South Africa Eskom Investment Support
Project, 3 November.
World Business Council for Sustainable Development (WBCSD). 2010. Vision 2050: The
New Agenda for Business. WBCSD.
World Wildlife Fund (WWF). 2006. Living Planet Report 2006.
Worthington, R. 2009. ‘Cheap at half the cost: Coal and electricity in South Africa’. In
Electric Capitalism, ed. D. McDonald. London: Earthscan.
Xaba, T. 2001. ‘Masculinity and its malcontents’. In Changing Men in South Africa, ed. R.
Morrell. Pietermaritzburg: University of Natal Press and New York: Zed Books.
Yergin, D. 1991. The Prize: The Epic Quest for Oil, Money and Power. New York: Free Press.
Zibechi, R. 2007. The Militarization of the World’s Urban Peripheries. Americas Policy
Programme, 9 February 2007, at www.americaspolicy.org.
Zittel, W. and J. Schindler. 2007. ‘Crude oil: The supply outlook’. Report for Energy
Watch Group (EWG).
Zizek, S. 2002. Welcome to the Desert of the Real. London: Verso.

337
Index
Index
Abahlali baseMjondolo 48–9, 206,
311 n.25
Abuja Declaration 284–5
Accelerated and Shared Growth Initiative
for South Africa (ASGISA) 46,
87, 88, 89, 91, 205, 231, 270–1
access to information see information
control
accumulation of capital see capitalism
acid fallout/rain 38, 123
acid mine drainage 14, 110–11, 112,
241, 242
ActionAid 116, 117, 118
Acts (South Africa)
Air Pollution Prevention (1965) 96,
98, 99
Air Quality (2004) 100, 103, 309 n.21
Environmental Conservation (1989)
129
Key Points (1980) 96, 100
Mineral and Petroleum Resources
Development (2002) 117–18
Mineral and Petroleum Resources
Royalty (2008) 118
National Environmental Management
(1998) 94, 95, 99, 193
Promotion of Access to Information
(2000) 99
Waste (2008) 103–4, 129, 130, 192,
193
African Development Bank 242, 243, 247
African National Congress (ANC) 48–9,
81, 83, 84, 85, 94, 177–8, 198, 201,
247, 248
Africom 21
Afrisam 127
Agrelek 217
Agri-Weskaap 218, 220
agriculture 7–8, 12, 38, 45, 61, 156,
157–8, 216–20, 280, 281, 283,
286–7, 288, 294, 297–8
chemicals 189, 190, 226
air emissions see pollution, air
Alberta 144–5
Alcan see Rio Tinto Alcan
Alexander, Neville 81, 82
Alston, Dana 93
aluminium smelting 10, 123–7, 154,
231–2, 233, 246, 273, 297
ancestral graves 117
Anglo American 51, 53, 77, 108–9, 119,
124–5, 224, 226, 236, 274
AngloCoal 112, 241
AngloGold Ashanti 169, 293
AngloPlatinum 116–17, 293–4, 310 n.10
Angola 69

338
Toxic Futures
Anthropocene era 37
anti-apartheid movement and struggle
77, 80, 81, 201
Anti-Privatisation Forum 73, 85
ArcelorMittal 50, 53, 54, 55, 56, 57, 58,
59, 60–2, 64, 66–7, 69, 77, 120,
122, 123, 125, 191, 233, 241, 304 n.9,
307 n.1
Areva 151, 208, 209, 237
Asari, Dokubo 172
Asbestos Relief Trust 124
Asian tsunami 22
Assmang 63
Association for the Study of Peak Oil
(ASPO) 32, 33–4, 36
asthma 102
Athabasca River 144
Australia 124, 125, 158
bagasse 287, 323 n.4
Bali roadmap 257
Bangladesh 154–5
bank bailout 27–9, 306 n.18 & n.19
Basic Income Grant 87
basic oxygen furnaces see furnaces
bauxite mining 124
Benin 157, 168
Berkeley Plastics Task Force 191
Bhopal 96
BHP Billiton 53, 77, 109, 112, 123–4,
125–6, 127, 154, 224, 225, 232, 246
biodiesel see biofuels
biodiversity 12, 38
biofuels 155–9, 160, 301, 314 n.52
biomass 9–10
Black Economic Empowerment (BEE)
83, 88, 109, 118, 176
blast furnaces see furnaces
Boipatong 54, 61
Bolivia 258, 263–4
Bolivian Alternatives for the Americas
146
Bophelong 54, 70, 71, 72–3
Botswana 21, 241
BP 36–7, 96, 143, 146, 163, 174, 176,
180
Brazil 46, 119, 155, 156–7, 231
brickmaking 185
Britain 25, 30, 255
bucket sampling 57, 59, 98
Buffet, Warren 281
Bushveld Mineral Complex 117
Business Action for Sustainable
Development 92
Butler, Mark 4
Caltex 173, 174, 176
Cameco 151
Campaign Against Water Privatisation
74
Canada 123, 143–4, 181, 258
Canadian Centre for Policy Alternatives
144, 145
cancer 101–2, 144
Cape Flats 204, 220
Cape Plc 124
Cape Town 173, 191, 195, 200–1,
202–14, 216, 220, 277
Cape Town Partnership 214, 216
capitalism 1–2, 4, 15, 19, 22, 23, 24, 25,
26, 30, 40–1, 46, 49, 76, 77–8, 86,
105, 107, 108, 131, 139, 157, 160,
163, 220, 221, 249, 251, 259,
262–3, 270, 271, 289, 298, 299–300
carbon capture and storage 150–1, 182,
258, 274, 290, 320 n.6
Carbon Standard 218–19
carbon trading 107, 219, 229, 253,
254–6, 257, 258, 259–60, 277, 299,
300, 318 n.19, 321 n.10

339
Index
cassava 157
Castells, Manuel 168
catalytic crackers 188
Cato Ridge (KwaZulu-Natal) 63, 93
cement 127–30, 185
Cement and Concrete Institute 127–8
Cement Sustainability Initiative 128
Central Energy Fund 176
Certified Emissions Reductions 254, 255
Chad 142
Chamber of Mines 224
Chancellor House 247
Chávez, Hugo 145, 146
Chemical and Allied Industries Association
92
Chemical, Energy, Paper, Pulp, Wood and
Allied Workers Union 64
chemical industry see petrochemicals
industry
Chernobyl (Ukraine) 152
Chevron 36, 54, 69, 98, 146, 169, 170,
171, 181, 183, 186, 203, 216
children 68, 98–9, 101, 102, 112, 153
China 23–4, 29, 119, 131, 146, 149,
154, 166, 181, 185, 213, 227, 231,
242, 256, 257, 263, 271, 275, 293,
319 n.43
China National Petroleum Corporation
146
Chirac, Jacques 208
CIC 241
Clean Development Mechanism 219,
229, 254, 255, 257, 259, 260,
320 n.6
Clean Technology Fund 242, 243
Climate Action Network International
253
climate change 3, 8, 11, 12, 14, 19, 37–8,
39, 59, 62, 134–5, 137, 138, 139,
140, 150, 151, 156, 160, 179, 182,
218, 219, 220, 228–30, 238, 242,
249–50, 251–79, 281, 282, 289,
290, 291–2, 299, 300, 302, 307 n.36
Climate Group 219
Clinton, Hillary 258
coal 8–9, 10, 12, 13, 19, 30, 50, 51, 53,
54, 58, 60, 111–12, 121, 128, 129,
136, 139, 141, 148–50, 159, 181,
182, 222, 236, 237, 238, 240–2,
244, 248–9, 257, 260–1, 274, 296
dust 72, 296
gasification 148, 274, 322 n.37
coal-to-liquid (CTL) 148–9, 150, 165,
173, 180, 181, 182, 226, 273
Coega Development Corporation 232,
233, 297
Coega Industrial Development Zone 51,
180, 231–3, 242, 296–7
Coetzee, Sas and Douw 114–15
coke ovens 121–2
Colombia 293
Committee for Environmental Co-
ordination 95
commodity boom 55, 118, 185, 197,
225, 226, 230
Communities for a Better Environment
(US) 98
Community Awareness and Emergency
Response committee 96
Community Solution 288
compact fluorescent lights (CFLs) 210,
212–13, 233
Competition Commission 120
confidentiality see information control
Congo River 153
Congress of South African Trade Unions
(COSATU) 210, 244
ConocoPhillips 146
Constitution (SA) 2, 76, 77, 91, 100, 103,
295

340
Toxic Futures
Constitutional Court (SA) 207
construction industry 226
Consultative National Environmental
Policy Process (CONNEPP) 91–2,
94, 95, 97
consumerism 82–3
consumption neighbourhoods 204, 206
Copenhagen Accord 251–2, 257–8,
259, 260, 261, 263, 321 n.19
Corporate Accountability International
192
corporate greenwash 163
corporate social responsibility 72, 183
corruption 71, 83, 167, 168, 177–8,
180, 206
Côte d’Ivoire 169
credit ratings agencies 230
criminality 83, 172
Crocodile River 240
Cuba 263, 282, 286–9, 299
cults, Nigerian 172
Cupet 146
dams 7, 39, 59, 60, 114, 153, 154, 157,
197, 240, 256, 294 see also tidal dams
Danmarks Naturfredningsforening (DN)
187
Davis Commission 93
De Klerk, F.W. 203
decentralised energy systems 162–3
deforestation 38, 40
Delft (Cape Town) 206, 207
Democratic Republic of Congo (DRC)
154, 276
Denel 87
Denmark 187–8
Department of
Defence 100
Energy 224 see also Department of
Minerals and Energy
Environmental Affairs and Tourism
3, 12, 56, 59, 91, 93, 94, 95, 96, 97,
100, 102–3, 104, 106, 118, 128,
129, 130, 193, 239, 264, 265,
319 n.35
Health 100–1
Manpower 93
Minerals and Energy 109, 115,
117–18, 176, 177–8, 197, 198, 200,
202, 212, 215, 223, 242 see also
Department of Energy
Trade and Industry 91, 104, 120,
191, 234, 237
Water Affairs and Forestry 61, 93,
94, 112, 113, 239, 240, 319 n.35
Desertec 162
development 1–2, 4, 8, 15, 19, 76, 79,
81, 85–9, 106–7, 163–4, 221, 262–3,
270–1, 276–7, 278
enclave 68–9, 70, 72, 131, 169, 221,
278, 292
Developmental Electricity Pricing
Programme 231, 232
developmental state 86–91
dewatering 113–14
diesel 31, 178, 188, 189, 196, 216, 235,
238
disease 12, 41
drought 59, 158, 281
Durban 50, 96, 97, 101, 173, 174, 183,
191, 291–2, 295, 309 n.15, 315 n.26
Earthlife Africa 93, 94, 211, 232, 246
Eco-Institute (Darmstadt) 152
ecological debt 14–15
economic depression 26, 309 n.7
eco-services 40–1
electric arc furnaces see furnaces
Electricité de France 208
341
Index
electricity 9, 10, 11, 73, 126, 149, 150,
153–4, 161, 178, 195–202, 204–5,
206, 207–13, 214, 215, 216–17,
222–6, 231–40, 242–7, 248–9, 250,
296, 308 n.25
blackouts 178, 195–6, 207–8, 209–16,
218, 221, 222–6, 233, 244
block tariffs 246
demand-side management 211, 213,
233, 234, 238, 243, 248
distribution 200–1, 205
power stations 51, 53, 55, 57–8, 60,
195, 196, 197, 198, 199, 223, 234–5,
236, 237, 239, 240, 241, 242–3, 249,
250, 261, 322 n.36
price increases 224, 230, 243–5, 246,
317 n.6, 319 n.48
special pricing agreements 225, 231,
246–7, 320 n.53
transmission lines 162, 195, 196,
197, 202, 203, 207, 208, 232, 235,
276, 278, 279, 289
see also Regional Electricity Distributors
Emalahleni (Witbank) 111–12, 239, 241
Emfuleni 67, 70, 73–4, 75, 308 n.20
enclosure 1, 15, 170–1, 221, 260, 295,
298, 299–300, 303, 304 n.4
energy 8–11, 19, 220–1
alternative 289–90
declining 31, 36, 141, 152, 164, 221,
290–1
efficiency 163–4, 211–13, 214, 216,
218, 222, 234, 243, 273, 288
policy and planning 134–7, 231
renewable 9–10, 159–63, 176, 210,
220, 236–7, 242, 248, 257, 272,
273, 275, 279, 284, 287, 289,
322 n.34
Energy Development Corporation 176
energy return on energy invested (EROEI)
34, 143, 144, 147, 152, 156, 161
Energy Risk Management Committee
209, 210, 211
Energy Security Master Plan: Liquid Fuels
178–9
Energy Watch Group 141
energy-efficient lightbulbs see compact
fluorescent lights
Engen 96, 97, 98, 173, 176, 183, 185–6,
187, 188
Enron 24–5
environmental
degradation 8, 15, 77, 78, 86, 113–14,
132, 157, 158, 219, 228–9, 281,
282, 285
justice and injustice 1, 2, 3, 4, 6,
15–16, 44, 55, 79, 89, 92, 93–4, 97,
183, 254, 261, 278, 285, 299, 300
policy 91–2, 94–6
regulation 84, 93, 94, 95, 96, 99,
102, 103
rights 76
environmental impact assessment (EIA)
89, 295, 297
Environmental Justice Networking
Forum (EJNF) 94, 97
environmental management co-operative
agreements (EMCAs) 94, 95
Environmental Management Inspectorate
102, 106, 130, 186–7
Environmental Protection Agency (US)
187, 193
Environmental Rights Action 3
EnviroServ 127
Equatorial Guinea 167, 170
Erwin, Alec 198, 207, 231, 248
Escravos Women’s Coalition 171
Eskom 3, 9, 10, 13, 50, 53, 57–8, 59,
65, 76, 87, 108, 109, 124, 126, 128,
342
Toxic Futures
178, 195, 196, 197–202, 203, 205,
207, 208, 209–10, 211–12, 213,
216–17, 218, 222–6, 230–1, 232,
233–40, 241, 242, 243–5, 246–7,
248–9, 250, 260, 266, 273, 274,
275, 297, 307 n.1, 317 n.3
Essop, Tasneem 210, 211
ethanol see biofuels
European Union (EU) 156, 253, 254,
256–7
Evaton 54, 70
exclusion 1, 70, 80, 93, 131, 278
Expanded Public Works Programme
(EPWP) 87, 91
export credit agencies 242, 319 n.44
extinction of species 39
Extractive Industries Review 166–7
Exxaro 241
ExxonMobil 36–7, 142, 146, 147, 257
failed states 22–23, 69
Far West Rand Dolomitic Water
Association 114
Federation for Sustainable Environments
115
ferroalloys 123, 233, 236
financialisation 4, 25, 107, 227, 259–60,
277
fire hazards 73, 215, 241
firewood 10, 72, 161, 202, 245
fish 39, 62, 112, 144, 150, 186
floods 62, 220, 281
Food and Agriculture Organisation
(FAO) 158, 283
food and food security 19–20, 38, 155,
157–9, 219, 228, 279, 283–4, 286–7,
289, 297–8
Food and Trees for Africa 218–19
football World Cup (2010) 90, 91, 128,
131, 205, 226, 291
forced removals 47, 53, 153, 154, 294
foreign investment 5, 22, 84, 86, 229,
232, 247, 255, 261
forests 139, 156, 157
Forum of Energy Executives 223
fracking see hydraulic fracturing
France 151, 208–9
freshwater hydrology 153
Friends of the Earth 284–5
fruit farming 217
furnaces 122–3
gas 34, 37, 97, 141, 144, 145, 146–8,
159, 168–9, 170, 210, 213–14, 261
flaring and venting 148, 165, 186,
187
landfill 160, 259, 321 n.13
liquefied natural 147
non-conventional 147, 148
pipelines 293
gas-to-energy 260
gas-to-liquid 147, 149, 170, 176, 177,
181–2
Gencor 123–4, 125
generators 216, 218, 225
genetically modified seed 158
Georgia 20
geysers 210, 212
Ghana 169
Gini coefficient 4–6, 304 n.2
Giokoo (Nigeria) 171
Glencore 77–8
Global Nuclear Energy Partnership 152
Global Reporting Initiative 104
globalisation see neo-liberalism
Godsell, Bobby 223, 224, 273
gold 51, 112–13
Good Neighbour Agreement 97
Gordhan, Pravin 245
Government of National Unity 83

343
Index
Grand Inga project (DRC) see Inga dams
grants 68, 70, 71, 84, 87, 117
Green Climate Fund 258
Greenpeace 152, 313 n.31
green politics see environmental, justice
and injustice
green revolution 45, 286, 289
Green Scorpions see Environmental
Management Inspectorate
groundWork 2–4, 8, 16, 59, 98, 99–100,
106, 118, 128, 149, 165, 168, 185,
186, 284, 285–6, 293, 298
Growth, Employment and Redistribution
(GEAR) 83, 84, 86, 88, 89, 91, 97
Haiti 23, 46
Halliburton 21, 143, 180
Harmony Gold 120
Harvey, David 1–2, 4, 131, 240, 292, 298
health 58, 68, 73, 98, 100–2, 244, 295,
307 n.7, 308 n.22
Highveld Steel 112
Hitachi Power Africa 247
Hogan, Barbara 248
Hosaf Fibres 191
houses 6, 70–1, 72–3, 84, 87, 206–7, 216
Hubbert, M. King 31, 32, 33
Human Rights Watch 171, 172
hydraulic fracturing 148, 181
hydro-electric power 153–5, 160, 161,
197, 235, 256, 275
IGas 176
Ijaw Youth Council 171
Impala Platinum 124
Imvume Management 177–8
inbuilt obsolescence 105
incineration 92, 95, 103, 128–30, 193–4
independent power producers 198, 202,
233, 236, 237, 240, 243, 248, 296
India 149–50, 154–5, 166, 181, 242,
256, 257, 261, 263, 293, 296
Indonesia 149, 156, 181, 306 n.19
industrial
incidents 58–9, 61–2, 63, 64, 65,
186–7, 295, 307 n.9
subsidies 10, 119, 174, 175, 300
Industrial Development Corporation
(IDC) 119, 124, 170, 181
industrial development zones 84, 125,
180, 296
industrialisation 51, 108, 131
industry 10, 147, 273, 280
inequality 2, 4–6, 14
inflation 86, 227–8, 298–9, 322 n.33,
323 n.12
informal sector 87–8, 91
information control 2, 24–5, 33, 61, 78,
98, 99–101, 152, 182–3, 187, 197,
202, 210, 224, 225, 232, 246, 320 n.53
Inga dams (DRC) 153–4
integrated gasification combined cycle
(IGCC) 182
Integrated Manufacturing Strategy (IMS)
86, 91
Integrated Pollution and Waste
Management 95
Integrated Pollution Control 94
intellectual property rights 258, 269
Intensive Energy Users Group 231
interest rates 227–8
Intergovernmental Panel on Climate
Change (IPCC) 38, 135, 139, 228,
256, 267
Special Report on Emissions Scenarios
269–70
International Council of Chemical
Associations 96
International Emissions Trading
Association 219

344
Toxic Futures
International Energy Agency (IEA) 35,
36, 37, 134, 135, 137, 141, 143,
145, 146, 148, 149, 151, 153, 159,
220–1, 268, 306 n.30
International Mission on Environmental
Policy 94
International Monetary Fund (IMF) 22,
26, 27, 84, 88, 119, 166, 300,
306 n.19
Iran 20, 29, 152, 174
Iraq 20–1, 22, 29, 35, 46, 49, 142, 165,
173, 177
iron and steel industry 10, 51, 53, 60–2,
119–23, 233
iron mines 50, 119, 120, 242
irrigation 6–7, 39
Iscor 50, 51, 53, 63–4, 65, 66, 71, 108,
109, 119–20, 122, 307 n.1
Island View chemical storage tanks
(Durban) 30, 186
Israel 47, 152
Jevons paradox 163, 234, 273
jobs see labour
Joe Slovo shack settlement (Vaal Triangle)
72
Joe Slovo shack settlement (Cape Town)
206–7
Jubilee 118
Kaiama Declaration 171
Keep America Beautiful 193
Kennedy Road settlement (Durban)
48–9
kerosene see paraffin
Khayelitsha (Cape Town) 229
kilns 128–30
King Commission on corporate
governance 91
Koeberg 116, 195, 203, 207, 208, 209,
210, 316 n.10
Kumba Resources 119, 120
Kusile 236, 239, 241, 243, 244, 247,
249, 264, 265, 274, 275
Kyoto Protocol 150, 163, 228–9, 252–4,
257, 258, 259, 263, 264, 299, 300,
320 n.5
Kyrgyzstan 20
La Via Campesina 252
labour 40–1, 65, 66–7, 78, 107, 197,
202, 203, 217, 218, 219, 225–6,
280, 281, 288, 298–9
brokers 64
law 89, 90
see also outsourcing; retrenchment;
strikes; trade unions; unemployment
Lafarge 127
Lake Victoria 154, 157, 313 n.39
land 7, 40–1, 84, 156–7, 159, 219
landfills see waste, dumps
Landless People’s Movement 85
Lephalale (Limpopo) 239, 241
Lesotho 51, 59, 60, 178, 240
Lesotho Highlands Water Scheme 240
Limpopo (province) 6–7, 180, 293–4
liquefied natural gas see gas, liquefied
natural
Liquid Fuels Charter 176
litter see waste
load-shedding see electricity, blackouts
localisation 7, 162, 278–9, 289–90
Long-Term Mitigation Scenario (LTMS)
264–79, 322 n.28 see also pollution,
air
Loskop Dam 112
loss, valuing of 40–1
Lukoil 146
345
Index
Macro-Economic Research Group
(MERG) 80, 81
Makgetla, Neva 225
Malaysia 156, 166
Mandela, Nelson 96, 97
manganese 50, 53, 62–3, 242
Mantashe, Gwede 247
Manuel, Trevor 56, 83, 86, 90, 175, 226,
230, 243, 244
manufacturing sector 80, 131, 227
Maputo 51, 124, 125, 179
Maputo Corridor 125
Markal 268
Market Allocation model see Markal
Maroga, Jacob 224–5, 234
Matimba (Limpopo) 239, 241
Matsepo, Strike 61
Mbeki, Thabo 86, 87, 90, 208, 223,
228–9, 270
Mdladlana, Membathisi 187
Medupi 198, 236, 239, 240, 241, 243,
247, 264, 265, 274, 275
Melamet Commission 81
Mellon, Andrew 26
mercury 93, 213, 316 n.16
metal recovery 185
Metsimaholo (Free State) 67–8
Mexico 158
Meyerton 53
migrant labour 50, 66
Millennium Development Goals 40,
168
minerals-energy complex 8, 50, 56, 80,
85, 108, 109, 125, 132, 203, 224,
233, 236, 250, 271, 277, 278
mines, abandoned 111–12
mining 108–19, 225, 241 see also specific
minerals
Mittal, Lakshmi 54, 119–20
Mlangeni, Mabuti 64
Monbiot, George 156, 255–6, 257, 259,
263
Mondi 96, 100
Monsanto 297–8
Moosa, Valli 247
Morales, Evo 263, 264
Mossel Bay 176, 177
Mossgas 175
Motor Industry Development Programme
175
Movement for the Emancipation of the
Niger Delta 172
Movement for the Survival of the Ogoni
People 171
Movimento Sem Terra (Brazil) 156–7
Mozambique 97, 170, 310–11 n.18
multi-year price determination see
electricity, price increases
Municipal Infrastructure Grant
programmes 205
municipalities 70, 200–1, 205
Munnik, Victor 4
Murray and Roberts 226
N2 Gateway Housing Project 206–7
Nandigram (West Bengal) 293
Natal Portland Cement 127
National Climate Change Conference 228
National Electricity Response Team 223,
234
National Electrification Forum 201
National Energy Regulator of South
Africa (NERSA) 202, 207, 222,
224, 225, 230, 236–7, 243, 244–5,
246, 317 n.3
National Environmental Awareness
Campaign 92
national grid see electricity, transmission
lines
National Nuclear Regulator 114–15, 209
346
Toxic Futures
National Strategy for Sustainable
Development 60
National Union of Metalworkers of
South Africa 63
National Waste Management Strategy 95
nationalism, Third World 26, 133, 142
natural disasters 22, 281
natural gas liquids see gas
natural resources 7, 228–9, 285
negotiated transition 81, 84, 91
Nelson Mandela Bay Municipality Local
Environmentalists 232, 297
neo-liberalism 15, 22, 26, 81, 82, 83–4,
86, 88, 107, 133–4, 166, 205, 221,
252, 271, 280–1, 282, 285, 292
networked production 104, 105
New Economics Foundation 159, 162
New Partnership for Africa’s Development
(NEPAD) 168–9, 170
Nicaragua 22, 263
Niger 151–2
Niger Delta 3, 39, 49, 165, 170–3, 181,
285, 293
Niger Delta People’s Volunteer Force
172
Nigeria 168–9, 170–3, 174, 177, 180,
298
Nigerian National Petroleum Company
173
Non-Proliferation Treaty 152
North American Free Trade Agreement
145, 158
North Korea 286–8
Nuclear Energy Corporation of South
Africa 209
Nuclear Fuel Corporation 208
nuclear power 116, 151–2, 203, 207,
208, 210, 233, 237–8, 244, 274–5,
278, 290, 295, 297, 313 n.31
Nyeleni Declaration 284, 289
occupational health 62–4, 93, 100
oceans 43, 150, 161
Odi (Nigeria) 172
Odioma (Nigeria) 165
off-shore listing 85, 109, 124
Ogoniland 170–1
Ogoni Bill of Rights 171
oil and oil industry 3, 9, 19, 20–21, 22,
24, 26, 30–1, 34, 35–7, 55, 69, 96,
133, 137–8, 141–7, 159, 163,
165–91, 194, 221, 226–7, 248–9,
284, 285, 293, 298, 301–2, 311 n.1,
312 n.17 see also petrochemicals
industry
bunkering 172, 173
deep water 143, 170
extra-heavy 145, 149
peak 19, 31–4, 35, 36, 37, 134, 137,
139, 143, 148, 149, 160, 162, 164,
165, 179, 196, 221, 226, 227, 249,
269, 278, 282, 289, 290, 299,
306 n.23, n.24, n.25, n.26 & n.30
pipelines 136, 147, 148, 165, 171,
172, 175, 176, 179, 186, 187, 292
South African regulation and pricing
mechanism 174–6, 191, 314 n.5
& n.8
spills 165
strategic reserve (Ogies) 175
unconventional 143–5
Oilwatch 301–2
Okerenkoko (Nigeria) 172
Okuntima, Paul 171
Omnia 229
Open Cycle Gas Turbine generators 178,
196, 235, 315 n.12
Operation Murambatsvina 47
Orange Farm (Evaton) 54, 72, 74, 75
organic farming 283, 287

347
Index
Organisation for Economic Cooperation
and Development (OECD) 35
Organisation of Petroleum Exporting
Countries (OPEC) 26, 29, 33,
131, 142, 145, 166
outsourcing 64, 67, 210, 219, 277
packaging 42, 192–4
Pahad, Aziz 169
Papua New Guinea 110
paraffin 31, 72, 73, 204, 214, 215, 244
Paraffin Safety Association of South
Africa 215
Paraffin Users’ Household Energy Summit
215
Pebble Bed Modular Reactors 237–8,
275, 295
Pelindaba 116, 203, 297
People’s Conference on Climate Change
and Mother Earth Rights 16,
263–4
Peters, Dipuo 202, 245
Petrobras 146
petrochemicals industry 10, 13, 54, 55,
165, 173–94, 277
Petróleos de Venezuela 145, 146, 180,
287
Petroleum Agency SA 176
Petronas 176, 181
Petropars 146
PetroSA 169–70, 176, 177–8, 180, 183,
297
Philippines 296, 297
Phosa, Matthews 247
photovoltaic power 161, 287
plastics 42, 43, 165, 189, 190–4,
310 n.14
Plastics Federation of South Africa 191,
193
platinum 116–18, 233, 293, 294
Polanyi, Karl 40
pollution 8, 19, 70, 134, 182–3, 232,
248, 249, 295, 298, 302, 308 n.22,
309 n.15
air 8, 11, 12–13, 14, 37–8, 50, 56–9,
72–3, 77, 92, 93, 96–7, 98, 99, 100,
101–2, 103, 107, 121–2, 123,
126–7, 129, 135–6, 137–40, 144,
148, 149, 150, 151, 153, 156, 160,
163, 181–2,183–4, 186, 187, 189,
204, 218, 229–30, 231, 238–40,
241, 244, 245, 252–9, 264, 281,
293, 295, 302, 305 n.12, 309 n.17
& n.18, 311 n.4
water 7, 14, 39, 59–62, 75, 93,
110–15, 117, 144, 186, 204, 241 see
also acid mine drainage
polymers 190–1
Port Harcourt (Nigeria) 172
poverty 5–6, 8, 44, 45–6, 47–8, 49, 68,
69, 74, 77, 78, 85–6, 87, 166–8, 178,
194, 201, 204, 205, 206, 212–14,
215, 216, 219, 226, 228–9, 231,
232, 245, 261, 278, 281–2, 292, 303
power see electricity
Power Conservation Programme 223
pressurised water reactors 237, 297
Pretoria Portland Cement (PPC) 127,
128–9, 130, 185
PriceWaterhouseCooper 218–19
private-public partnerships see public-
private partnerships
privatisation 22, 84, 85, 87, 198, 202,
208, 210, 245
production networks 54, 69, 89, 106–7,
181, 217, 219, 283
Project Mafutha 180, 181, 240, 241
Project Turbo 179, 191
protest action 46, 47, 49, 85, 177, 244,
245, 293, 294, 296, 297

348
Toxic Futures
Provincial Monitoring Team 210, 211,
213, 214
Public Investment Corporation 127
public-private partnerships 51, 72, 85,
205, 245
pumped storage systems see hydro-electric
power
Qatar Petroleum 54, 147, 181
radioactivity 116, 151–2
rand exchange value 83, 85, 86, 227,
228, 249, 318 n.14
Reconstruction and Development
Programme (RDP) 70, 81, 84, 201
recycling see waste, recycling
red mud see aluminium smelting
Reducing Emissions from Deforestation
and Forest Degradation 258
Regional Electricity Distributors (REDs)
200–1, 202, 316 n.5
renewable energy see energy, renewable
Renewable Transport Fuel Obligation
157
resource curse 167–8
resource nationalism see nationalism,
Third World
retrenchment 62–4, 65, 66, 67, 69
Richards Bay 50, 51, 124–6, 242
Rio Tinto Alcan 109, 110, 231, 232,
233, 243, 296–7
Rossport (Ireland) 293
rubbish tips see waste, dumps
Russia 20, 147, 148
sacrifice areas 110
Safripol 191
Sahara Desert 162
Saldanha Bay 50, 51, 119, 242
Samancor 53, 58, 62–3, 64, 112
Samancor Retrenched Workers Crisis
Committee 63
sanitation 7, 44, 73, 75, 281
SANS Fibres 191
Sappi-Saiccor (Umkomaas) 98–9
Sapref 96, 173, 182, 183, 186, 187
Sarkozy, Nicolas 208
Saro-Wiwa, Ken 170, 171
Sasol 8, 9, 10–11, 13, 50, 54, 55, 56, 57,
58, 59–60, 62, 64–5, 66, 71, 72,
76–7, 97, 98, 99, 108, 148, 170,
173, 174–5, 176, 179–80, 181–2,
183, 184–5, 187, 189, 190–1, 224,
226, 229, 233, 236, 240, 241, 255,
274, 277
Sustainable Development Reports 10,
183, 184, 315 n.17–18
Sasolburg 47, 54, 58, 62, 67, 71, 72, 76,
98, 100, 173, 184, 185, 187, 189,
191
Sasolburg Air Quality Monitoring
Committee 57, 59
Saudi Arabia 29, 33, 35–6, 174
Saudi Aramco 33, 146
scavenging 44, 46, 47, 67, 75, 76, 103–4
scrap metal 121, 122
Sebokeng 54, 71, 75
second economy see informal sector
Secunda 51, 59, 62, 97, 148, 173, 179,
182, 183, 184, 187, 189, 236, 274
Senegal 21
service delivery 69–70, 74
sewage 112, 160, 225
Sharpeville 3, 54, 61
Shell 33, 36, 96, 123, 163, 170, 171,
172, 174, 176, 180, 181, 293
Shenhua Ningxia Coal Group 181
sinkholes 113–14
Sinopec 287
Sishen 242

349
Index
Sisulu, Lindiwe 206
slag-heaps 61, 121, 123
social movements 85, 104
social welfare 84, 87, 91, 117
soils 39, 115, 156
solar energy 9, 159, 160, 161, 162, 210,
212, 220, 229, 233–4, 243, 275, 285
Somalia 21, 93
Sonangol 180
Sonjica, Buyelwa 111, 201, 225, 241
South African Municipal Workers’ Union
7
South African National Energy Research
Institute 274
South African Oil and Gas Corporation
see Sasol
South African Petroleum Industry
Association 177, 178
South African Regional Science Initiative
98
South Durban Community Environmental
Alliance 2, 55, 77, 96, 97, 98, 99,
100, 101, 186, 187, 291, 292
South Durban Environmental Forum 96
South Durban Health Study 101, 103, 295
South Korea 119, 238, 271, 286
Southern African Customs Union 178
Southern African Development
Community 169
sovereignty, food and energy 162, 282,
284, 285–6, 289, 290, 292, 300, 301
Soviet Union 20, 81, 92, 139, 286, 287,
289
Spatial Development Initiatives 84, 119,
125
Spoor, Richard 118
sport utility vehicles (SUVs) 133, 158,
273
Steel Valley (Vanderbijlpark) 61, 62,
120–1
Stern Report 138
stoves
coal 72–3
paraffin 215
Strategic Fuel Fund 176, 177–8
strikes 65, 298
sugar 156, 157, 287
Suriname 124
Sustainable Energy Africa 208, 213
Table View Residents Association 186
Talisman Energy 181
Tanzania 154
tar-sands 143–5, 258
Tata 181, 233
Thor Chemicals 93, 94, 185, 213
Thyspunt (Port Elizabeth) 233, 297
throwaways 192–3, 194
tidal dams 161
Togo 169
Total 36, 54, 146, 174
trade unions 65, 67, 84, 85, 89, 92, 94,
119–20, 292
transnational corporations 5, 20, 24, 84,
89, 106, 107, 134, 157, 159, 169,
172, 174, 232, 247, 248, 261, 285
Transnet 87, 124, 128, 179, 242, 292
Transocean 143
transport 134, 141, 163, 219, 226, 234,
273
Transvaal and Delagoa Bay coalmine 111
triple bottom line reporting 91, 104
Turton, Anthony 114
Tyndall Centre 161–2
Uganda 21, 154, 157, 260
Uhambo 176
underground coal gasification see coal,
gasification
unemployment 68, 308 n.21

350
Toxic Futures
United Nations Conference on
Environment and Development 85,
92
United Nations Earth Summit 15
United Nations Environment Programme
11
United Nations Framework Convention
on Climate Change 219, 251, 252,
257, 264, 268, 269, 274
United States
and biofuels 155, 157
and climate change 252–3, 256, 257,
258, 260–1, 263, 320 n.8, 321 n.19
economic dominance 23–4, 25, 29,
146, 166, 262, 270, 271, 305 n.8
military spending and action 21, 152,
290, 300, 317 n.28
relations with Africa 21, 165–6, 167,
181
United States Energy Information
Administration 36–7
Universal Declaration of the Rights of
Mother Earth 16
uranium 110, 113, 114–15, 151–2, 203,
208, 226, 237, 275, 297
urbanisation 39, 45, 131, 273
Uzbekistan 20, 181
Vaal Dam 60, 240
Vaal Environmental Justice Alliance 3,
55–6, 77, 101, 118
Vaal Research Group 67
Vaal River Eastern Sub-System
Augmentation Project 59, 60
Vaal Triangle 50–78, 229
Vaal Working Class Crisis Committee
71
Vaalputs (Namaqualand) 116, 297
Vale 109
Vanchem 112
Vanderbijlpark 53–4, 60–2, 66, 72, 75,
121, 122
Venezuela 23, 29, 143, 145–6, 157, 263,
287, 289
Vereeniging 51, 75, 307 n.2
volatile organic compounds 56–8, 63,
102, 121, 182, 307 n.3
war on terror 20, 21–2, 46, 49, 221
Washington Consensus see neo-liberalism
waste 75, 108, 131, 302, 305 n.13
ash 184–5
burning see incineration
catalyst 185–6
dumps 42, 50, 75, 76, 92, 94, 160,
185, 298
electronic 105–6, 107, 185
hazardous 183, 185–6
information system 95
management 7, 13–14, 41–5, 75, 92,
95–6, 103–4, 161
mine 109–16, 117
radioactive 115–16, 152, 209, 275, 297
recycling 47, 67, 75, 76, 105, 125,
128, 192, 193, 204, 213, 287, 315 n.26
smelting 125, 127
steel plant 121–3
toxic 14, 30, 44, 50, 92, 93, 95, 102,
104, 105, 127, 185, 189, 319 n.34
zero 104, 105
water 6–7, 12, 38, 39, 59, 73–4, 155,
204–5, 225, 239, 240, 245, 294,
308 n.12
Waterberg (Limpopo) 180, 239, 240, 241
Wentworth (Durban) 97
West African Gas Pipeline 168–9
Western Cape Anti-Eviction Campaign
206
Western Cape Regional Chamber of
Business 216

351
Index
Westinghouse 237
wetlands 14, 39, 60, 61–2, 281
White Paper on Energy (1998) 198,
200, 208
wind energy 161, 210, 235, 243, 285
wine farming 17, 218, 219, 220, 316 n.22,
316–17 n.24
Wiwa, Owens 171
Wolfensohn, James 86, 159
women 6, 10, 68, 74, 153–4, 215, 285
wood as fuel see firewood
World Bank 15, 22, 23, 26, 45, 47, 81,
83–4, 86, 87, 88, 91, 125, 133, 148,
150, 153, 154, 159, 160, 166–7,
169, 170, 181, 205, 229, 230–1,
235–6, 239, 242, 243, 244, 247,
248, 250, 258, 260, 261, 264, 273,
282, 300, 319 n.34
World Business Council for Sustainable
Development 15, 92, 104, 107, 219
World Congress on Environmental
Health 188
World Economic Forum 219
World Energy Council 153
World Energy Outlook 134–7, 138, 139,
141, 142, 143, 145, 146, 147, 148,
149, 150, 151, 153, 155, 156, 159
World Health Organisation 102
World Petroleum Congress 3, 30, 32,
194, 284
World Social Forum 55, 301
World Summit on Sustainable Development
(WSSD) 2, 85, 92, 228, 245, 303
World Trade Organisation 107, 259,
262, 269, 300
World Wildlife Fund 288
Xstrata 224, 236
Zamdela 54, 57, 58, 71, 72
Zikode, S’bu 49
Zoellick, Robert 153, 230, 261
Zuma, Jacob 90–1, 208

352
Toxic Futures