014 -diele-ctric pro'perties4 - defense technical … · 014 rock -diele-ctric...
TRANSCRIPT

AD-766 05-0
EFFECT OF FREQUENCY AND TEMPERATURE014 ROCK -DIELE-CTRIC PRO'PERTIES4
Aida S. K-halafalla
Honeywell,, Inciorporated
Prepared for:
Bureau of Mines,Advanced Rese-arch Projects -gency
July 1973
'DISTRIBUTEDBY:f
National Technical Information ServiceUi. S. DEPARTMENT OF COMMERCE5285 Port Royal .Road, Springfield Va. 22151

IVY
L
I July 1913
Effect of Frequencyand Temperature onRock Dielectric Properties
Final Report
NAI TECHNICAL
INFORhMATION SERVICE
2816-3001

-UnclassifiedSp'*niy Classification
H"Effec f equenc and. DielctrcPrperie
(Final, Report)'74 C rn iv OTa7 .i.w eJ,..E)I, Final Report 6/15/72 - 6/'14/73 1S AU T.0ft15 (firtie Rnw.. Vear intial, 16080800)
a A~xo'rOAP I. TOTAL NO. OF PAGVtS 176. NO OF mRIES
15___July____1973__ 76 .I 10eCON-TMACT Oil GRNT 04O, ISGINATON'S IMPORT HNMEUCS)
H0220054& P 01.;CC t PO 2816-3001
~A-flPA Order No7 1579 . Amend. 394.e RE~NNPORT No(%) (Any other numibers that mety be sooianod
d
IIR84TOn~ON TATC&ACftY
Distribution ~of this document is unlimited.
41I 1%jPPLCuECNTAftVNOT9S Ia. SPONSORING MILITARY ACTIVITY
Advan ced Research Projects Agency
3 Ab5Ta~Y -Washington, D.C0., 20301
- The real and imaginary components of dielectric constant were determined for basalt,*granite and quartzite in the frequency range 10MHz to 4 GHz. The variation ofdielectric permittivity with temperature was determined from room temperature to45M0 . No dielectric dispersion or rock relaxation was observed in thea frequencybang Inve sti gated. Hence, the rock r'elative dielectric constant and, relative lossshowed mild variation, with frequency with no discontinuity or sharp peaks as thosepreviously observed in, the low frequency range (up to 2 K~iz). The temper'aturecoefficienit of the relative dielectric const;.4 ht was related to the isobarrice -thermal
3 expansion coefficient of the rock. The reiative dielectric loss of basalt and, granitefollowed an Arrhenius exponential increase-with temperature suggesting the lossmechanism, to be associated with activated particulate diffusion in the rock lattice.Activation energy for the conductance process depended on the temperature rangeand appeared to be independent of frequency. Quartzite showed an anomalous temn-perature variation of its conductivity.
47 RPLACES 0 OI 147 Iii JAN 44. WHICH s
DDPaM ecurity CtsolficsitlonN 49oo.v O ~hYU~ icasfe

Diekiesrfea0cltp CAsictr
L~oss TangentFrequency I-PBermittivityPolarization1G ra nit e
Quaz~tzAt
'1 'IX
1 I A.
Unlasiie

Final Report July 1973
EFFECT -OF FREQUENCY AND TEMPERATUREI ON RocK DIELECTRIC PROPERTIES
3 Sponsored by
Advanced Research Projects AgencyARPA Order No. 1579, Amendment 3:
ProgramCode No. 2F10
.1 Contract No. H0220054Amount of Contract: $39,570Effective Da'e of Contract: June 1972Contract Expiration Date-: June 197-3
-IContractor
Honeywell Inc.Systems and Research Centeri2600 Ridgway Parkway
Minneapolis, Minnesota
ACKNOWiEDGEMENT
This research was supported by the Advanced Research ProjectsAgency of the Department of Defense and was monitored by the
- U. S. Bureau of Mines under Contract No. H022'0054.
Prepared by; .Approved by:r db A. S. Khalafalla-/PhD R, r bn '
Sr. Prinipal-Research Scientist tper sorTel, 612/,331-4141, Ext. 4555 Material Science Group
Tel. 612/331-41:41, Ext. 5801
I The views and conclusions contained in this document are those of the authorand should not be interpreted as necessarily representing the official policies,either expressed or implied, of the Advanced Research 'Projects Agency of'the U.S. government.
(1A
i--Id

ACKNOWLEDGEMENT5
The assistance of Principal Research, Engineer Lyle Koehlier and Research
Assistant John Viner is gratefully acknowledged for their contribution to the
electronic and engineering aspects of this research effort.j
U'
I
2816-3001

CONTENTS
Page
SECTION I PROJECT OBJECTIVES AND 'SIONIFICANT 1-1RESULTS;
Research Objectives 1-1
Significant Results -SECTION II INTRODUCTION' 2-1
Review of Dielectric Measurement Techniques 2-1Lumped-Circuit Measurements 2-1R-X Impedance Bridge 2-4,Slotted-Line Measurements 2-4
SECTION -III EXPERIMENTAL WORK 3-1
Slotted&Line Measurement Procedure 3-1Sample Preparation 35 V'High Temperature, Measurements 3-7
SECTION IV ROCK DIELECT!RIC PROPERTIES IN THE 4-1MEGA- AND GIGA-HERTZ FREQUENCYRANGE
Bridge,'Measurements with Coaxial Sample 4-8HolderSlotted-Line Measurements 4-8
SECTION V EFFECT OF FREQUENCY ON ROCK 5-1DIELECTRIC PROPERTIES
SECTION VI ROCK DIELECTRIC PROPtE±TIES AT 6-1ELEVATED TEMPERATURE4
SECTION VII EFFECT OF TEMPERATURE ON ROCK T7;-i
DIELECTRIC PERMITTrITY
1 SECTION VIII EFFECTOF TEMPERATURE ON THE 8-iRELATIVE DIELECTRIC LOSS
ISECTION IX TECHNICAL REPORT SUMMARY AND 9-1RECOMMENDATIONS FOR FUTURE WORK
j SECTION X REFERENCES 10-1
1 2816-3001

ILLUSTRATIONS
Figurie Page
2-1 F~-Bridge Block Diagram25
2 -2 Sdhering Bridge Circuit 2-5
2--3, Heter.odyne Slotted- Line, System 2-7
2 -4 Thcperiiiiental C onfigurationt 2-8
3 -1 Dielect3'ie. Paramet_-r.§ from R~esonance Meithods 3-2 13- 2' Samples -of Drilled lPbeks 3-6
Dat SapeHaeJor High Temperature Dielectric 3-
4;-1 Relative Dielectric Constants of Basalt.4-'Measuremnent with the 'R-X Meter using theParallel-Plate Method
4-2, Loss Tangent of~ Basalt. Measurement with R-X 4-3'Meter using the Parallel-Plate Method,
4"3 Dielectric Parameters. of Granite- Measured with the 4 -5R-X Meter using the Parallel-Plate Method
4.?-4 Loss Tangent of' Graiiite Measured with the R-X 4-5Meter using the Parallel- Plate Method
4-,5 D~ielectric Parameters of Quartzite Measuredwith, 4 -7the R-X Meter using the Par.alel -Plate Method
4-' Loss Ta'ngent of Quart zite Measured with the R-X 4-7Meter-using the Parallel-?lateMethod
4- I Dielectric Parameters of Basalt. Bridge Method 4-10with Coaxial Sample Holder
1- 8 ~Dielectric Parameters of Granite. BridgeTVMethod 4-11with Coaxial Sample Holder l
4-9- Dielectric Parameters of Quartzite. Bridge Method 4-12
with Coaxial Sample Holder
2816-3001

4,-10 Relative Dielectric Constant of Basalt from 4-1410 MHz to 2 GHz
1'4-11 Loss Tangent of Basalt from 10 MHz to 2 GHz 4-14
4-12 Relative Dielectric Constant of Granite in the 4-8Frequency Range 10 MHz +o 2 GHz
4-13 Loss Tangent of Granite in the Frequency Range 4-1810-MHz to 2 GHz
4-14 Relative Dielectric Constant of Quartzite: in the 4-193 Frequency Range 10 MHz to 2 GHz
4-15 Loss Tangent of Quartzite in the F-tequency Range 4-1910-MHz to 2 GHz j1
6-1 Variation with Temperature of Basalt'sRelative Dielectric 6-3Constant, and'Dielectric Loss at Two Frequencies,
6-2 Variation-of Basalt's Loss Tangent with. Temperature 6-4
36-3 Effect of Temperature on the Relative 'Dielectric Constant 6-7and-the Relative Dielectric Loss of Granite at- a Nominal'Frequency of 1.5 GHz
6-4 Effect of, Temperatur6* on the Loss Tangent of Granite 6 -8at a Nominal Frequency of 1. 5 GHz
6-5 Effect of/Temperature on the Relative Dielectric Constant 6-115of Quartzite at a Nominal Frequency of 1.80 GHZ
l 6-6 Effect of Temperature on the Relative Dielectric Loss 6-11iTangent of Quartzite at a Nominal Frequency of 1. 80GHz
7-1 Variation of the Rock Thermal Expansion Coefficient 7-SIwith Temperature
6-1 Arrhenius Plot of Basalt's Electric Conductivity' 8-7
8-2 Arrhenius Plot of the Electric Conductivity of Granite& 8-9
-I 8-3 Electric Conductivity of Quartzite Showing Anomalous 8-10Arrhenius Plot Due to Locss of Water
2816-3001
~1
i tLiTABLES K
U',Page
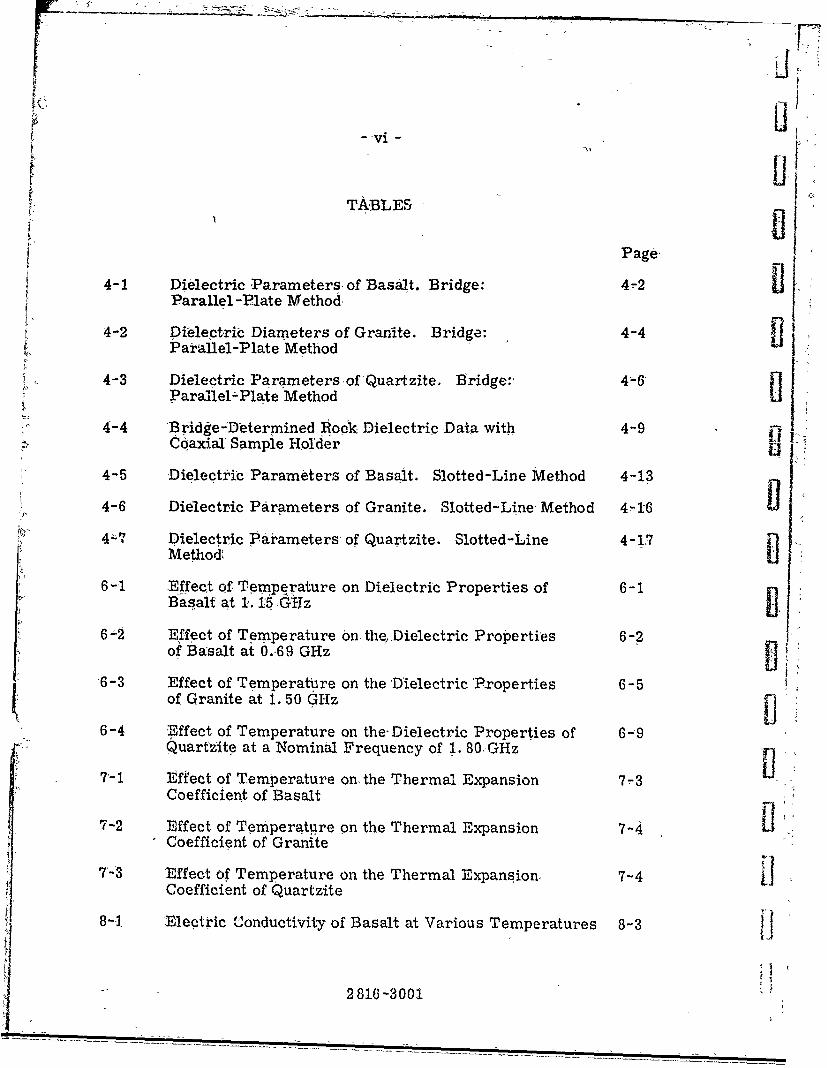
4-1 Dielectric Parameters of Basalt. Bridge: 4-2Parallel -Plate V ethod
4-2 Dielectric Diameters of Grarite. Bridge: 4-4,Parallel-Plate Method
4-3 Dielectric Parameters of Quartzite. Bridge: 4 -6Parallel-Plate Method 0
4-4 Bridge-Determined Rock Dielectric Data with 4-9Coaxial Sample Holder
4-5 Dielectric Parameters of Basalt. Slotted-Line Method 4-13
4-6 Dielectric Parameters of Granite. Slotted-Line Method 4,16
M , 17 Dielectric Parameters of Quartzite. Slotted-Line 4-17i ~ ~Method
6-1 Effect of Temperature on Dielectric Properties of 6-1Basalt at 1.15 GhzV
6-2 Effect of Temperature On the Dielectric Properties 6-2of Basalt at 0.A69 GHz
,6-3 Effect of Temperature on the Dielectric Properties 6-5of Granite at 1.50 GHz I
6-4 Effect of Temperature on the-Dielectric Properties of 6-9Quartzite at a Nominal Frequency of 1. 80GHz
7-1 Effect of Temperature on, the Thermal Expansion 7r3Coefficient of Basalt
7-2 Effect of Temperature on the Thermal Expansion 7-4 iiCoefficient of Granite
7-3 Effect of Temperature on the Thermal Expansion. 7-4 iiCoefficient of Quartzite
8-1 Electric tUonductivity of Basalt at Various Temperatures 8-3 i
2 816 -3001

-vii -
8-2 Electric Conductivity of Granite at Various temperatures: 8-4
>18-4 Electric Conductivity of Qartzt at Various, 8-5,- Temperatures
Te~rnperatures Notiinal Frequency 0. 69,GHz
286-00

SECTION I
I PROJECT OBJECTIVES AND, SIGNIFICANT RESULTS
SRESEARCH OBJECTIVES
The goal of this research was to deveop reliable. methods, to measure the
dielectric permittivity of rocks at high frequencies and at high temperatures.I The real and imaginary parts of, the dielectric constant were determined- for
three rock' samples in the frequency range 10 MHz to 4 GHz. Measurement
*Itenperature was varied from room temperature to 4500 C. The temperature
coefficient of the dielectric constant was used to derive other rock thermcs-
i I physical properties such as the coefficient of thermal expansion and the
activation energy for ionic or vacancy diffusion in the rock. The data- thus
obtained and their scientific analysis are relevant :to-solving such practical
problems as. dielectric heating and rock fragmentation by electrothermalt
methods.
SIGNTFICANT RESULTS
Determination of the standing wave pattern in rock samples allowed measure-
ment of their electrical parameters in the frequency range 0. 2 to 2 GHz. The
data, from, the slotted-line technique were checked with those determined by
the conventional bridgebalancing techniques at the overlap frequency range;
i. e., that range at which both methods are applicable.
Dielectric constants and dissipation factors were determined for three ,hock
$ samples over the 10 MHz to 2 GHz fi'equency .range. The r eal part, tr's of
the relative complex permittivity decreases slightly with increasing frequency
i I up to 20 MHz. From 0. 2 to 2 GHz,, ' increases slowly with frequency. The
12816-30014

1-2,
loss tangent, tan 6, decreases slowly with frequency in the. entire frequercy
range. Both the relative dielectric constant and the- loss, factor increase
with temperature rise. I
Application of the Clausius-Mosotti relationship to the relative dielectric 3constant of rocks allows an estimation of their thermal coefficient of volume
expansion at a series of, temperatures. This method, which is reported here
for the first time, may be used instead of the commonly used thermal dila-tometric methods, especially for materials of low volume ex insion coefi-
ficient. IRock conductivities have been calculated from the relative dielectric loss.
The variation with temperature of the rock conductivity appears tb-.be fitted
to an, activated concept of ionic diffusion in the lattice. The activation energy, Ior the barrier height, for particl. ,motion in the rock lattice has been deter-
mined f6r basalt and granite and found to depend onthe temperature range
but not on the frequency. An anomalous behavior was found in thevariationwith temperature of quartzite conductivty and was. attributed, to the evolution
of water from the rock microporcp-
I
2816-3001 '

'I2-1
SECTIONI!
3 INTRODUCTION
IMV IEW OF DIELECTRIC MEASUREMENT TECHNIQUES
I LUMPED-CIRCUIT MEASUREMENTS
At frequencies from dc to about 109 Hz, complex, permittiviy ,may be deter-
mined, by lumped-circuit measurements. That is, the sample in its holder
may be considered as part ofa conventional R-L-C circuit. Typically,
dielectric measurements of solid specimens at low frequencies are made on
flat samples with parallel-rplate electr'odes.
Above 10 Hz the inductance of the electrodes can- introduce serious measure-
I ment errors. Using resonant-cavity techniques, the measurement range
can be extended to about 10 Hz. Beyond this frequency the sample dimen-
'I sins are no longer negligible compared to the electrical wavelength, and
distributed-circuit measurements must be used. A section of waveguide or
3 Itransmission line which is partially filled with the specimen is typically
used at UHF and microwave frequencies. The principles of transmission-
line measurements folloW directly from the relations involving e and 11 in
the wave equations.
I Coaxial transmission lines may be used for measurements at frequencies
for which the conductor spacing is small compared to a wavelength; at higher
I frequencies it becomes necessary to use a hollow waveguide. Since the
geometric relations for a coaxial capacitor are well defined, a coaxial-line
sample holder may also be used for lumped-circuit measurements at low
frequencies. The total measurement range of the coaxial-line technique
extends from near dc to above 4 GHz.
1 28-16-3001

I
2-2
For this sftudy, the required measurement -range is 17Hz to 4 X 10~ Hz. 1Measdrements of complex permittivity were performed :at temperatures from
room temperature to 450 01C. The coaxial-line technique is well suited for these
measurementsbecause it not only covers the entire frequency range but is
also capable of withstanding the severe environment of the high-temperature Imeasurements. Continuity of data is enhanced because the same rock speci-
mens can be measured at all temperatures and frequencies.
COAXIAL-LINE MEASUREMENTS i
At frequencies for which the section of, line which comprises the sample
holder is much less than one wavelength long, the holder may be considered
as a-coaxial capacitor, and its impedance Z at a frequency f is given by I;
Z =--(2:-V2
4Tr f e e ' to -
Where b and a are the radii, of the outer and inner conductors, respectively,
tis the length of the holder, and e ° is the permittivity of free space. (It Jis assured here thatthe specimen completely fills the sample holder and that
its permeability & = I. ) Conventional bridge Or resonance techniques may
be used to determine Z.
When the length of the specimen is an appreciable fraction of a wavelengthi it Ibecomes necessary to treat the sample holder as a length of transmission
line and to apply the line equations in order to extract er from a measure-
ment of the line input impedance. An open-circuit coaxial-line sample holder
haying a characteristic impedance Z 1, and propagation constant -/1, when 3filled with a dielectric sample whose propagation constant is y 2, will have an
input imp6dance I
?816-1001 I

I. 2-3
zA Z1 () coth y (2-2)
The propagation, constant y for a material wh6se complex permeability
IIo, is given by
_ .j2T, 2 (2-3)
!11 If the sample length kis sufficiently short, coth V2 -- The error in
this approximation is less than 3 percent -wen-
1
I -- r < 0. 3 (2-4)
II Then the input impedance becomes
z. "z (2-5)
in1 / 2,t
-I and if the losses in the sample holder are negligible, y1 j (2rlX) so that the
expression further simplifies to
"- 1 (2-6)i n )I.2 77 r t ,
Then
"jXZ 1
r 2 in
12816-3001

2-4
t can be shown that Equations (2-i) and (2-6) are identical, so that the condition 1__ 1< 2 . 3 represents the short-wavelength limit for the validity ofXI rof the lumped-circuit coaxial capacitor measurement.
For a medium or low-loss dielectric sample (tan 6 <0. 1), which has r 10,
and -L = 10 cm, the lumped-circuit approximation is valid at frequencies up to
about 45 MHz. 3
R-X IMPEDANCE BRIDGE
To-deterimine the input impedance of the coaxial line at frequencies below ,82. 5 x 10 liZ, a wide-range R-X bridge is used. The bridge used in our
laboratory is a modified Schering bridge with a self-contained signal source
and heterodyne detector. Figure 1 is a block diagram of the Complete instru-
ment, and Figure '2 is the equivalent circuit of the Schering bridge.
The bridge circuit operates over the frequency range from 0. 5 t 250 MHz.
It can measure equivalent parailel resistance, Rp, from 15 ohms to 105 ohms,
p p pand equivalent parallel capaCitancej Cp, from -100 pf (inductive, Lp=l/w 2C )
to + 20 pf. Because the capacitance of the coaxialholder plu& sample generallyIexceeds 20 pf, a compensating inductance or reactive transmisslon-line stub
is used to carry out the measurements. ]i
SLOTTED-LINE MEASUREIv:ENTS
A precision slotted line is used for measurements between 50 MHz and 4 GHz. j
In principle, the slotted line literally consists of a coaxial transmission line
with a slot in its outer conductor through which a traveling rf-voltage or
current probe may be inserted. A source of radio-frequency energy at the
desired frequ-,-y d Aves the line, and the unknown impedance is connected to
2816-3001

2-5
3 TESTFREQUENCYF " F
250, MC F
LOCALOSCILLATOR2
2.6 TO~50.1 MC OKON
Figure 29-1. -R-X Bridge Block Diagrami
C.A TEST
_ _ C jJ
I Figure 2-2. Schering Bridge Circuit
1 2816-3001

2-6
-re Opposite end. Fromthe relative magnitudes and- Positions ofthe -voltage
or current maxima and minima, it is possible to calculate the complex
- impedance of the unknown.
A block diagram of the slotted-line measurement setup is shown in Figure 2-3.
The signal source has a frequency range from 0. 5 MHz to4 Hz. Heterodyne
detection of the voltage on the traveling probe is used rather than a square-
law rectifier circuit. The heterodyne detector, consistingot the local
oscillator, mi6er, i-f amplifier, andvoltmeter, actually cOrresponds-to a
-sensitive receiver which can be tuned to the signal frequency. It provides high
sefisitivity and linear response as well as rejection of harmonics and other
:-spurious signals.
Figure 2-4 is a photograph of the actual experimental configuration. From left
to righ' the equipment functions 'are: power meter (above), signal oscillator(belo/), bw-frequency sign~aloscillatorplug-in unit, coaxial slotted line
-.with mixer (front), local oscillator with power supply (rear), i-f amplifier-
-detettor (rear), R-X impedance bridge with coaxial holder mounted and- oven.
~I
- ~
F2816-,3001H
]' -

2-7
w"
0-
LUoL..
U- LLi ix
0- CL
44
w ~ U. I
ca -a0J o10-W-<.0z% E=r -
ca -J0 a -
0'H-
< CD- C*L 00
H cc
g0in G.
2 0
*. CS. 4.'
2816-300

2-8
Figure 2-4. F' oerimental 'o-afi'quratloln
2 P16 -3"

3-1
I SECTION IIIEXPERIMENTAL WORK
l SLObTTED- LINE MEASUREME&T PROCEDIRE'
Although the slotted-line techffique-,involies -b-,easurer-ent of the Voltage
stand ing-wav e, ratio (s4WR = V ni-x/V rain) on-the liie it is not 'necessary to
measure the actual maximum and' minimum voltages in allcases. Whernthe
I SWR ishigh, it. can- be measured'quite accurately by determining-the width of
a single null, defined as the distance between points at which the voltage is
I F times the minimum value. 'Thus, it is possible to use the slotted line even
at frequencies for which the lire ,is less than a half-wavelength long.
A number of procedures are commonly used for dielectric measurements
i With the slotted line (Refs. I and 2). Three specific cases are -of speBcialI interest to us. They are (-1)' short-circuited sample holder, sample length a
multiple of X/ 2, (2) shortw-circuited sample holder, sample length an ddd
multiple'ofi/4, and (3) open-circuited sample holder, sample length less
than X/4. Case 1 is preferred' for measurements of qr' when-the sample is
at least a half-wavelengh long. However, the error in determination of eris greatest at half-wavolength intervals. Thus, the quarter-wave resonant
* condition of case 2 is'used to obtain accurate measurements~of dielectric
loss. At lower frequencies, where the sample length does not permit"resonaht" measurements, the. best accuracy is offered by the open-circuited
sample holder. Although the general solution of the transmission-line equa-
tions can be used to obtain measurements at any frequency, the resonant
Iconditions are preferred b.cause the computations are greatly simpiified and
the measurement errors are minimized.
An outline of the experimental procedure for measuring q ' and tan 6 of a
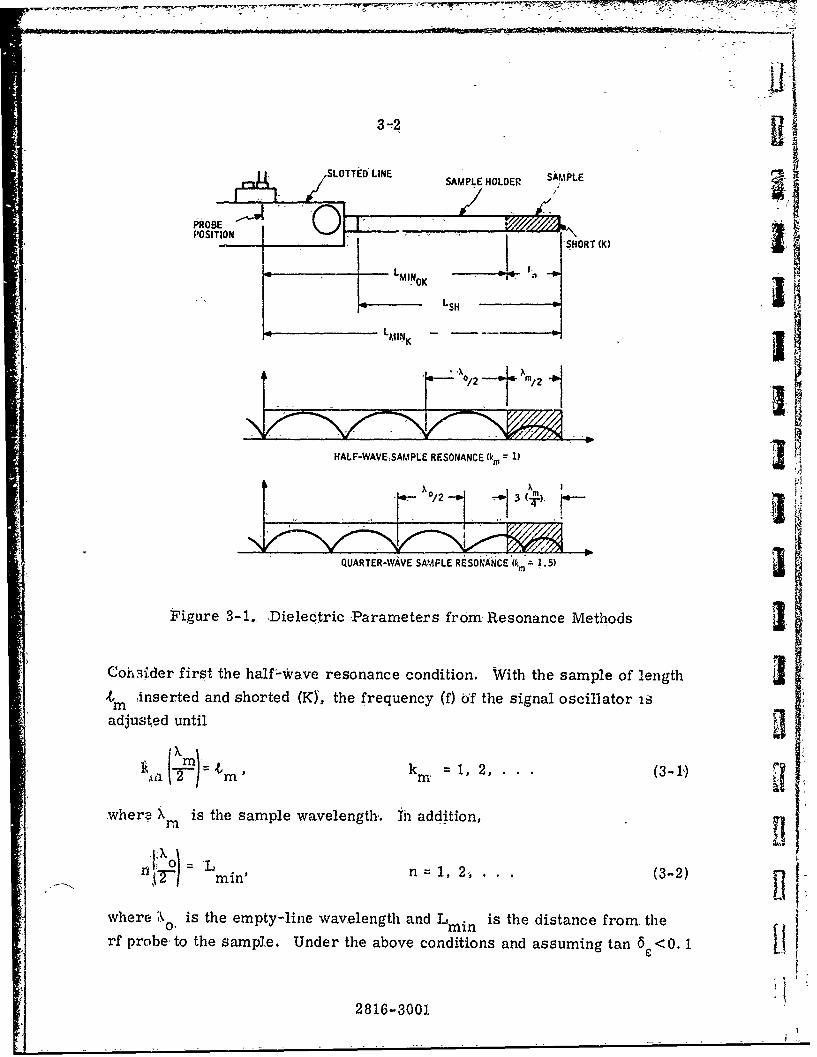
j rock sample using resonance methods follows. Figure 3-1 shows the slotted
line with both half-wave and quarter-wave sample resonance conditions.
2816-3001
,SLOTTED LINE SAMPLE HL~~SML
LMIIOK
LcH
HALF-WAVESAMPLE RESONJANCE (k, 1) Ai
QUARTER-WAVE SAMPLE RESONANCE (h, 1.5)
Figure 3- 1., Dielectric Parameters from Resonance Methods
Cotoider first the half-Wave resonance condition. With the sample of length34 inserted and shorted (KY~, the frequency (f) of the signal oscillator isadusm e until
S M ' km 1, 2, ... (3-1)
wher- is the sample wavelength . In addition,
n4.l 2 = 'Lmnn= 1, 2, (3-2)
where 01 is the empty-line wavelength and Lnmin is the distance from, therf prbto the sample. Under the above conditions and assuming tan 6<0.1 Ii
2816-3001

3 -;3
2 2
r, 2 (3-3)
and C! may be.c lculated from Xo, k andi.
f " Next c-insider the quarter-wave resoftirce condition. With the, sample of
lengthm inserted and shorted (K), the frequency (f)- of the signal oscillator
is adjusted until
2kA= km " k - 0.5, 1.5, 2.5, (37-4)
where X is the sample wavelength. In additionii n
2n ( n( =Lmin, fi = 0.5, 1.5, 2.5, (3-5)
where X is the empty-line wavelength and Lmin, is the distance from the
Urf probe to the sample. Under the: above condition and assuming tan 6
<0. i, -then
2 (3-6)
the measurement of tan 6 is made at quarter-wave resonance. The quarter-
wave condition gives minimum error in tan 6 because maximum field strength
Vmi.. s applied to the sample. The, inverse VSWR m = m provides, a measure- t ' " max
of tan 6 To minimize rf probe loading, m can be found by measuring the
-width ofmihimum A,. Then,
2816-3001

3-4
-- m i ('3 - 7 )
1 + sin2 I
If m <.0.1, then to a good approximation
m -- (3-8)X0
With the sample in-place, : is measured at a Voltage minimum under, a :
quarter-wave sample resonancecondition. 64J* gives m-" by using equation
(3-8). The ratio m* represents losses from three sources: (i) the sample, of
length 4r! (2) the sample holder around the sample.of length Lm;.,and (3) the
sample holder plus. the slottedline of'length, LminoK"
Let-A4 o andthus mo representthe losses due to the length of line LminoK .
Then
,m o 0(3-9) -0
'The attenuation factor of the sample holder a gives a measure of the sample
holder losses around the sample. Both-6At o and a 'may be experimentally jdetermined by making width-of-minimum measurements on the empty andshorted sample holder.
Finally, knowing m", m o, and a then tan 6 may be calculated fromx// ' % I
tan 6 = M, m - (3-10)
r
2816-3001 1

~3-5 . -
Again if m*, in0 < 0. 1, then to a good appro:xir.ation,
tan6=o -o - j(3-1)
In r
SAMPLE PREPARATION
One requirement for the coaxialline technique is that the rock specimens
-5 imust be prepared to-fit precisely in a coakxial sample hbldek. The allowable
tolerances- are. quite stringent; the specimen dimensions and tolerances for
the nominal 14 mm coaxial-lifte sample holder are given 'below:
+0. 000 in.I Outside Diameter: 0. 5625 0.0028 in.
Holei +0. 0012; in.Diameter: 0. 24425 -0.,000'in.
9 Concentricity: ±0,005 in,
These tolerances are required for measurement eri-ors-below 10 percent in3 a low or medium loss sample with er 10.
Samples with the required outer dimensions were supplied by the .Bureau ofI Mines. To drill the center holes we used an ultrasonic drilling machine in
which a diamond bit is simultaneously rotated, and vibrated ultrasonically as
:it advances. This machine is capable of drilling precise holes up. to ,6 incheslong in extremely hard materials. A photograph of a few drilled rock samples
_ is shown-in Figure 3!-,2.
Initial drilling efforts failed because of a mechanical misalignment in the
machine which made it impossible to maintain concentricity between the inner
and-outer diameters. The machine had to be returned to the manufacturer.
"I Although the problem was eventually corrected, the beginning of the measure-
ment program was delayed by-about two months.
2816-3001

j7
3-6
;I I
U'Al
U[I
2
U£1
U
J [1
173Figure 3-2. Samples of Drilled docks Ft
LI
28l6-3T~1
F:

1 3-7
3 Three samples of different geometry were measured for each rock type.
Disk -satiples were -measured With the parallel plate method; coaxial samples
25 mim in diameter were measured using the R-X bridge; and 14-mm coaxial
-samples-were measured with the slotted-line technique. It was intended that
several physically similar =samples of each rock type would be measured-to
I improve the statistical relevance of the data. Because of difficulties in
sample preparation, coupled with the time consumed in obtaining each data
m point at a given frequency and temperature, it was impractical to repeat the
measurement sequence for multiple samples.
i HIGH TEMPERATURE MEAS-UREMENTS
Measurements at other than room temperature were conducted with the
'I coaxial sample holder inside a controlled-temperature chamber. This chamber
accommodated a 30 cm. sample length. Through a combination of electric
heating ard inert gas flow, the ten. erature was maintained at any predeter-
mined Value up to-4500 C. A sketch of the- oven, thermocouple andsample
I holder ,-stem is shown in Figure 3-3.
I ARGON GAS
.F SAMPLE HOLDER,
I ~ ~ E iM .6 - SHORT'CIRCUITSLOTTED'*~
I I- 19.5 CM 9.5 CM 0CM
I
-OVEN
1I Figure 3-3. ]Rock Sample Heater for High Temperature Dielectric Data
U
j 2816-3001

3-8
Because of the coaxial sample holder's simple mechanical construction, theproblems associated with the severe temperature environment are minimized.However, to protect the surfaces of the holder against corrosion at elevatedtemperature, an argon protective atmosphere was necessary. The coaxial
transmission line between the measuiement equipment (bridge or slotted line)was maintained at a slight positive pressure, using high-purity argon gas.
Some gas will escape through the sample holder, maintaining a continuousflush of inert gas to sweep out reactive gases which may-be driven out of the
rock samples. In addition, by using two thermocouples in physical contact
with the outer conductor of the sample holder, it was possible to measure andcontrol the temperature of the rock sample at the desired setting.
2816-3001

4-IISECTION IV
ROCK DIELECTRIC PROPERTIES IN THE MEGA-AND GIGA-HERTZ FREQUENCY RANGE
A Boonton type 250A RX meter was used to determine er ' and tan 6 at room
temperatures and at frequencies between 10 and 100 MHz. The rocks were
cylindrical in shape with a diameter of 1.0 in. The granite rock was 0.250 in.
31 long, while the basalt and quartzite samples were each 0. 125 in. long.
-Experimental data for basalt are given in Table 4-1. The variation of each
of er' and tan 6 with frequency is shown in Figures 4-1 and 4;-2. The results
show that er ' is relatively constant, while tan,6 decreases slightly from 10 tor
70 MHz whenboth parameters begin t6 increase with increasing frequency.
Thebridge data for the granite sample are shown in Table 4-2. Figures, 4-3
and 4-4 illustrate the variation of gianite dielectric parameters with fre-
quency- Here again, er' remains essentially constant at a value of slightly
rnore than one-half of that of basalt up to a frequency of about 70 MHz.
Above that frequency, er' appears to rise appreciably with frequency. The
I loss tangent, on, the other hand (Figure 4-4),, was about one-third of that of
basalt and decreased, slowly with frequency.
The experimental data for the quartzite rock are given in Table 4-3. Varia-I
tion of each of er and tan 6 with frequency for quartzite is shown in Fig-
ures 4-5- and 4-6. Here e is about one-third that of basalt and appears to
increase steadily with frequency, while tan 6 is about one order of magnitude
U less than that of basalt and appears to increase with frequency above 70 MHz.2
1 2816-3001

4-!2
00 00 0000
j44 = '0 -9 1' 0 'o 4. 4 ' U
4) -i - 4
C- L4indo 9
0 % - V; 0 V;
43 0
C~o a . -
E N 0 0
U V~ : o o o . -co 2 N~ %r4 U) 40
S 1)G.~28 1 -3001- -

1 4-3
1 231
FRQEC I QMa
Figure 4.;;. Relative Dielectric Constants of Basalt.Measurement with the R-X Meter using:3 the 'Parallel-FPlate Method
3 0.12-
z
0-
10 20 40 '70 100 140 200
FRE4UENCY I(WHOI
Figure 4-2. Loss Tangent of Basalt. Measurement with
R-X Meter using the Parallel- Plate Method
2816-3001

* a~0 0 - t 0 0 a 3
aq aa 000 or o o
4) 0 m -W m w0
P4C0 3 350 ft~
£ U I - w C) - l VI* C
cc M
9.4 )1
0
g o co0 tm0
cc m3 wN -o N -
co -M w m 0 N0 30 3-
in U
~joooIt o s ao
2816-3001

;I
1 4-5,
12
-- '8.0.21 z a
6o
2 --
I 0
Figre 4-3. Dielectr'ic Parameiers ofGranite Measured wththe A-X Meter using the- Parallel-Plate Method-
0.03 0
10 20, 40 7 16 10 2 0
FR UEQUENCY f (MHZ)I Figure 4-4. Loss tangent of Granite Measured with the
R-X Meter using the Parallel-Plate Method
! ___________
I

4;-6 I
N~ -4 'r 2 .3,
0, v* 4 V N8 1 4
m2 "- - t- wi
0) 29 5 . ..
14 ) C) 0 C) 0 - e
rc
c2 0
*~C A4 04C, ~ 800 042 800 042
.9.Z
~ 0 0 0~ 14 - ~ 0 0 ~14CCC. -~C1
2816-300

1 4-7
10 0.05
4-' -0.0~I- V - -. 02
FRQEC f(MUz
0.[0.0
04'002
IN ERROR
0 -------- j0 20 40 70 100 140 200
FREQUENCY (Mill)
I Figure 4-6. Lectri T anetr of Quartzite Me asured witht,tR-X Meter using 'the Parallel-Plate Method
1 28160-30

4-8
BRIE MEASUREMENTS WTH COAXIAL 11
Expekiaientaldata with the coaxial sample holder are given in Table 4 for the
three .. bck samples. The frequencies used here did not exceed 50 MHz. The T-data obtained are not in essential agreement with those recorded with the cylin- A
dria sample-holder in the previous experiments. Figure 4-7 'shows the vari- ;ation cif e ', e" and itan 6 With frequency for basalt. Figures 4-8.-and 4-9
illusfxate the variation of these three parameters for granite and quartzite,
respus(tively. As expected, the three dielectric parameters decrease slowly
wifth icireasing frequency.
SLOTTED- LINE MEASUREMENTS
Roor b temperature measurements were performed on a basaltic :cylindrical
sample of length 10.16 cm, WMh_2- outside diameter of 14 mm and an insidediameter of 6 mm. The data obtained zre given in Table 4-5. The variation
of the real part, c', of the relative complex permittivity with frequency is
sho-wi in curve C of Figure 4-10. Curves A and Bin the same figure show the U'measurements, obtained withthe bridge with parallel-plate sample holder
and the bridge with- coaxial sample holder, respectively. As is evident, the,
three techniques do not give identical results when measurements are made Uin the same ftequerwcy range; neither does the data follow the same trend at
nearby frequency ranges.
Figure 4- 11 shows the variation of the loss tangent of basalt with frequency.
Curves A, B, and C depict the data obtained with the bridge (parallel-plate),
the bridge with coaxial sample holder, 'and the slotted-line, respectively.
Here the bridge data show a dissipation factor that decreases with frequency,
while the slotted-line indicates an increasing loss factor with frequency. Here
again, obvious discrepancies between the three methods are rather alarming. -
260
2816-3001
o-

4-R
I Table 4-4. Bridge-Determined Rodk DielectricData with Ctoaxial Sampliie HolderI
1.Basalt - C = 11 cm
f(MH z) Cp(pf) Rp(KQ) xxp(0) rtan a
9 82.35 1.73 191 13.81, 1.71 0.124
118 78. 88 1.-02 99.9 13.... 1.31 0.11.0'
50 '78. 32 0.407 40.3 .13.1 1.31 0.0998
'2. Granite- t,= 12. 4cm
10 45.78 5.58 347 6. 79 4.22 xc 1071 6. 22 x 1i-2
, 20 44.32 3. 5'8 179 S3. 58& 3.,2 9 x 101 5. 00 x M.
50 4-3.52 1.74 73.1 6.46 2.71'xl01 4. 20 x10-2
3. Quartzite ;- t = 10.4 cmr
I10 26.66 66.7 597 4.73 4. 24 x 10-2 8. 95 x 10-3
120 26.29 48.1 302 4. 65 2. 92' x 1072 6. 28 x10,
50 .25.48 20. 6. 12,5 4'.51 2. 74 x 10ov2 6. 07 x 1i,3
28 16-3001

4-10,
,, M 8 .L3 SS01 3AIIV13S
In 0
C.d
4-40
W, cdU
t:4
r44
CD)
INVINOO 1413131 3A~VI389 NI'IN9NVISS0
2816-300

iF
11' _,Ij
6- 0.6
:0.5
-J 4.- 0.4 t
,, 3 - 0 .3 ,
!!21oo , --7 0...0-
0.05-0
07 -- "l. I i " . , i .
0.04
10 20 40 70 100
TREQUENCYl (MHz).
Figure 4-8. Dielectric Parameters of Granite. Bridge Method.. 7- with CoaxialSample'tHolder
2816-3001
. .A

14 10
-~~~~~ 05IV ~~l3 I1
00
4)
+10
010
a 10
w I
2816-300

In44-4
94-
414
A 0
LZ
L ~~~ ---------
20 811030

4-14
-B
z8
> 3.1 'A BRIDGE-COAXLALI
SLOTTED'LINE
BRIDGE--PARALLEL PLATEw 10 C-
0.01 0.02 0.04 0.07,0.1 0.2, 0.4 0.7 1.0 2 4 7 10FREQUENCY f(MHz)
Figure 4-10. Relative 'Dielectric Constanit of Basalt from10 MHz to 2 GxHz.
0.2.
BRIDGE -COAXIAL
0.1 ~ ~ -
0.07:
SLOTTED LINEw
o0.06-A 'BRIDGE--PARALLEL PLATEA
CC
0.00 .1 0. 1.0 5.'0 10FREQENC I I I I I
Figure 4-11, Loss Tangent of Basalt from 10 MHz to 2 GHz
2816- 3001

14-15
I Coaxial-line data of a granite sample with the same dimensions as the previous
basaltic sample are given in Table 4-6. The relative dielectric constant, rr
increases slowly with frequency in the range O. 2 to 2 MHz as shown in curve C
of Figure 4-12. By contrast, the bridge data suggest a slight decrease of er ,rj with frequency (curve B), or an independence of frequency (curve A of Fig-
ure 4-12). Figure 4-13 shows the variation of the loss tangent of granite with
frequency. Here the three methods of measurement yield data that decrease
with increasing frequency. Actually, the bridge method with coaxial sample
holder generates data that can be roughly extrapolated to the data generated
I with the-siotted-line (see curves B and C in Figure 4-13).
The slotted-line technique was, also-used to determine the dielectric -paramt-eters of a quartzite cylindrical sample with the same diiiensions as those of
basalt and granite. The data obtained with quartzite is shown in Table 4-7.
In- this case, the variation of er, with frequency is shown in curve C of Fig-
ure 4-14. The data seem to riae to a maximum at about 1.5 GHz. It should
also be noted that the measurements taken with the bridge method and the
coaxial sample 'h6lder appear to be consistent with those determined by the
plotted-lfie method (see curves B and C of Figure 4-11). The loss tangent of
quartzite decreases steadily with frequency as shown in Figure 4-15, curves
UB and C. The data, measured with the parallel-plate bridge method (curve A)
appear to-be unreliable. The points at 10 and 20 MHz depart considerably
from those determined with the same technique at 40,and 70 MHz due to the
bridge inaccuracy for high values of R p(Rp >100KO).
I2
I 2816-3001

4-16
10 01
0
0o EN do
44 -0 C
0V -I C , -
10 ~ a~ .9E Ec
0.)E ~ 0
0a4 C:E 0 . . . c
E - -C' toI, -
E -
0 0 0 0
a m C,m- m w 0 'rc
e -E C; 0i C
12I
286)00

r4 -
.n I
8 8t
06
.'~ 0 e
of0
4 E
E- -0 Do C1
IZ NO w V) CI
:1. .4
.-. C <5 N
2816-3001

4-18
BRIDGE - PARALLEL PLATEA
B
6 C , l SLOTTEDOLINE
BRIDGE-COAXtAL
SLOTTED LINE .Figure 4-42. Rkelative DielecticConstant of-Gfanite, in the
Frequency Rane 10 MHz to 2 GHz.
0.06-
0-B5 BRIDGE--COAXIALj
0.04 1I0.03-1
BRIDGE- PARALLEL PLATE SLTEDLN
0.02.
0.01 0.05 0.1 0.5 1 .0 5.01 10
FREQUENCY I (GHz) GRANITE7COMPOSITE
Figure 4- 13. Los s T angent of Granite in the F reque ncy Rlang e10 MHz to 2 GHz.
2816-30011

~rJ 4-19
1 BRIDGE - PARALLEL PLATE
A ( (AT A-
(DDATA--3 P.100-102)
Figure 4-14., Relative Dielectric C onstant of Quartzite in, the3F-requency Range 1.0 -MHz to- 2 GHz,
1 0.01"
0.008-BRIDGE - PARALLEL PLATE
A
30.006- 8
f3 SLOTlED LINE
BRIDGE - COAXIAL"0.004
C
j 0.002-
0.01 0.05 0.1 0.5 1.0 5S.0 16,
FREQUENCY I WGHO QUARTrZITE :- COMPOSITE
Figure 4-15. Loss Tangent of Quartzit- in the Freqaency Range
1 10 MHz to 2 GHz
2816-3001

I5-1
SECTION V
EIFECT OF FREQUENCY ON ROCK DIELECTRIC PROPERTIES
The experimental data presented in Section IV suggest that one or possibly more
of the techniques used to measure rock dielectric permittivity is giving the
wrong answers. In general, the parallel-plate bridge method deviates from
the bridge method with coaxial sample holder and also from the slotted-line
method. The latter two methods appear to extrapolate with eac% other reason-
ably well, suggesting a continuity -of the general trend of resultsobtained
therefrom.
Theories of dielectric relaxation predict that both the real, r ' and therimaginary, e ', parts of the relative, complex permittivity should decreaseIr with increasing frequency, provided that We are working at frequencies in
excess of the turnover, or characteristic frequency of the system. The loss
rfactor, tan 6 = '" is also theoretically expected to decrease, with fre-r r
quency since e " decreases much faster than c' with frequency. This isr rSbecause ' approaches its value at infinite frequency, e ", by linearlybeas r Go..
descending along the abscissa. Any increase -in these dielectric parameters.
with frequency can only happen at frequencies less than the characteristic
frequency. Except for data obtained with the parallel-plate bridge techmiques
at frequencies between 70 and 100 MHz, and for the e' data of granite and
1l quartzite with the slotted 'line, as well as taxi 6 of basalt, the rest of the data
shows the expected decrease in both c' and tan 6 with increasing frequency.rThe rise in and tan 6 above 70 MHz is most probably in error in the partof the parallel-plate bridge methods (see Figures 4-1 through 4-6). It is
concluded from this limited amount of data that the bridge method with coaxial
sample holder yields the most reliable rock permittivity data between 10-and
50 MHz, while the slotted line appears to give reliable information between
0. 2 and 2 GHz.
2816-3001

ii
5-2
Unlike the low-frequency spectra ,of rock electrical parameters, the present
high-frequency data do not show any sign. of dielectric dispersion, suggesting
the absence of relaxation effects due to large structural) units (e. g., silica
tetrahedra, [SiO I units or the presence of water in the rock) that would give
a dispersion at frequencies lower than those investigated in this report.
Measurements on basalt indicate-a general spectrum of relative dielectric
constant of about 13.1 at 50 MHz to about 9. 6 at 1 GHz, and loss tangent of
0.10 at 50 MHz to 0. 056 at 1 GHz, with no frequency dispersion in either.
Measurements on granite indicate a, relative dielectric constant of about 6.5at 50 MHz and 6. 1at 1 GHz, and a loss tangent of 0. 042 and 0. 02 at thesetwo-frequencies. Measurements-:on- quartzite indicate -a relative dielectric
constant of about 4.5 at both 50 MHz and 1 GHz, and a loss tangent of 0. 006at 50-AAHz decreasing to 0.0034 at 1 GHz.
The above -numbers indicate that at a given frequency the relative, dielectric
constant of basalt is nearly twice that of granite and three times that of quart-
zite. The loss tangent of basalt-is about three times that of granite and about
fifteen times Ilarger than that of quartzite. These trends can be correlatedwith the presaerqe of ilmenite (mixed oxide of iron, and titanium, FeTiO3 ) inbasalt,, and iti--virtual absence from granite and quartzite. Chemical analysis
of these three rock Samples indicates that basalt, granite, and quartz co ntain
48.4, 63.5, and 97. 8-percent silica and 6.2, 2, and 0.2 percent iron oxide
(mostly Fe0), respectively. Only basalt showed a measurable analysis of1.9 percent Titania (TiO2 ).
The dielectric permittivity of a system, which is an :unordered mixture of two
components, can be computed with the aid of Lichtenikers' formula (Ref. 3) 1log e =0 log e + 0 loge2 (5-1)r 2 120
where c' and e' are the permittivities of the two components and 01 and
02 are their volume fractions. The above formula can also be written as
2816-3001

C = it C' .1 (5-2)r
When there is A large difference in. the dielectric perrnittivities, Adelevskiis
formula (Ref. 3) 'had been reported to give better results I
r' 1B+ 22 (5-3)
where
(30 I)l+(0 l-
The dielectric permittivity of TiO2 is reported (Ref. 3) to be 78 (when present
as brookite), adtvrybetween '89 and 173 when present as rutile. That of~~I pure silica varies between 5. 6 and 7.5. For magnetite, 'c ' is more than
3 3. 7 and less than, 8 1, and the same values are reported (Ref. 3) for ilmenite.
The rest of the alkali metal oxides and alkaline earth oxides would havee
values between 5Sand 10. The densities of TiO2 1 SiO2 , Fe 3 04 , F eTi0 3 , and Na 2O,C aO are, respectively, 3. 9 to 4. 2, 2. 5to 2. 6, 4.9 to 5.-2, 4. 4 to 5, and I to
286300

I F6-1.
SECTION VI
ROCK DIELECTRIC PROPERTIES ATELEVATED TEMPERATURES
The objective of this phase of the investigation was to determine how the
relative dielectric constant (er), the relative dielectric loss (e ") and theloss tangent (tan 6) change with temperature at a fixed frequency. Slotted-
line measurements were first made at a nominal frequency of 1. 15 GHz on-a basaltic rock cyllinder of length Im = 10. 16 cm, d = 14 mm, and
d in: 6 mi; the measurement data are presented in Table 6-1.
Table 6, 1. Effect of Temperature on DielectricProperties of Basalt at 1. 15 GEz
I o 1*ro Lx"Temerature Lmi x0aO 0-4erit 0 (oK- )
24 10.72 25.24' 1.188 9.67 1.556 '0. 0501 0.484 3.37so 5 10.86 25.32 1.184, 9.72 1.554 0.0554 0.539 3.10
100 11.81 25.89- 1.158 10.14 1.542 0.0606 0.615 2.68
150 12.82 26.48 1.132 10.63 1.528 0.0677 0.721 2.36• 200 **2.11I 250 **1.91
I2IrL XoTan 6 =7 - CIO0
cr
ii ***No resonance was possible.
81 0i12816-3001

6 -2'
Because of the difficulty-of obtaining resonance at 1. 15 GHz and at tempera-
tures above 150°C, measurements Were repeated on basalt at a nominal frc -
quency of 0. 69 GHz; results are-presented in Table 6-2.
Table 6-2. Effect of Temperature on the DielectricProperties of Basalt at 0.69 GHz
Temerature, • min 'o fres c* o x 10It 6 0
( C) j(cm) (cm) (GHz) (Nep/cm) Tan 5** , " 00(K "1 1
25 12.56 42.43 0.707 9.86 1.24 0.0485 "0.478 3.37
50 12.76 42.76 0.702 9.96 1.23 0.0538 0.536 3.10
100 20.30 43.26 0,694 10.20 1.23 0.0598 0.610 2.68
150 21.04 43.79 0.685 10.45 i.22 0.0732 0.765 2.36
200 21.,66 44.28 0.678 10.68 1.22 0.0812 0.867 2.11
250 21.95 44.53 01674 10,80 1.21 0.0912 0.985 1.91
300, 22.14 44.70 0.672 10.89 1.21 ,0.1021 1.113 1.75
L ko rn4
**Tan 6 - ALr-j~ , o I** r a
The variation of the relative dielectric constant and the loss-tangent of
Dresser basalt with temperature is illustrated in Figures 6-1 and 6-2.
The effect of temperature on the dielectric parameters of granite was also
investigated. Following the basalt tests, the sample holder was cleaned with Icrocus cloth and cleaning fluid. Molybdenum disulfide was also put on thescrew threads to prevent their seizure by exposure to high temperature. IThe results obtained with a granite cylindrical rock sample of length
10.17 cm are shown in Table 6-3.
2816-3001 F

U 6-3
3 11.0 -1.20
10.9
10.8.10 1.10
3 10.7
10.6+
10.5- -. 0
10J J
0.90<10.2-
1 0.0- 0.80 "'LU
W "'9.9 wJ
2- 9.8- a, a\- 1.15 GHZ.
t b, b - 0.69 GHZ 0.70I97
NONPRIMEDLEGENDS REFER TO THE REALCOMPONENT OF THE RELATIVEDIELECTRIC
9.6 CONSTANT. PRIMED LEGENDS REFER TO THEIMAGINARY2PART OF THE'RELATIVEJ."DIELECTRIC CONSTANT
9.5. 0.60
9.3-0.50
9.1
9.0 0.400 50 100 150 200 250 3(0 350
!; I TEMPERATURE (C)
A Figure 6-1. Variation with Temperature of Basalt's RelativeDielectric Constant and Dielectric Loss at Two
Il Frequencies
j ?816-3001

-6-4
0.08 jIb
NOMINALFREQUENCY:a - 1.15 GHzb-0.69 GHz
0.07 'a
- I-
w 0.06
IDI
aa
0%.05
0 AI
'0' 50 I0 a.O 2005 0 300, 350, 400-
f PEERATURE (°C)
- Figure 6-2. Variation of Basalt's Loss Tangent With Tempe.rature
2816-3001

6-5
-, 4 0 co en '.i v. t0- 0) t
$. 4 v- -i4 v. .4 --- 3 3
1 oo0000 0 0~ 0 0
C.) 40 r- 0) ) V* CO M) r 4
-4 No
0, -~ v-4 C) c 0) C o C t
cE ccc C;00 0
I D O C :) Co o VD C t- LO t
CI o _o4 o to C O to
0 r- m1 0l -W to - m O 0' v " to (.- 1 1-4 v.4 Cli C11 N 0')ri
to C to CD D CD CD D C C;
04)
Cd I to co to4 0o) to C 10 b 0 ' toco to CD co to CD I- tC-
rk 14 V-I IT C 1 - i4-i r4I
E-4 (. D 0to CD) -CD to C o-o t CD
$4 M. 0 M *o *O Lo&4o o 0 c0 0 0 0 0o 0o 0t
I CO V to COCLov-*X i
v, - T -4 V -4 r -( 4 i l - r- r- 4 -
0 00 0 0 0- 0-
0 U) 0 C) 0 OD 0 C)C9,v- -ci C') Cq, N" C4,1 2 ~
Zi
1 28 10-300
IL!

6-6
The variation of e 'and. £e "of granite with temperature is shown in Figure 6-3.
The effect of temperature on the loss tangent of granite is shown in Fig-
ure 6-4.
The high-temperature dielectric properties of quartzite -were determinedfollowing a clean-up- of the sample holder from the previous measurementson granite. The same procedure of sample holder clean-up and screw thread,
treatment was repeated-as was performed before measurements on granitewere taken. The experimental data recorded on a -quartzite cylindrical rock-sample of length 9. 644-cm are given in Table 6-4.
The variation of the relative dielectric- constant -of- quartzite with temperature-is shown in Figure 6-5. The change of quartzite loss tangent with- temperatureis shown in Figure 6-6. In the previas two rocks of basalt and granite, theloss taigent increased with temper'ature rise. In the case of quartzite, theloss tangent exhibits 'a minimal value of 4. 37 x 10. 3 at 1000C. Simul-taneously, the relative-dielectric loss of quiartzite exhibits on minimal valueof 2. 04 x 10- '2 at 100'C. Because the relative dielectric loss is directlylinked-to~the rock conductivity, it appears that two mechanisms are operativein the electrical "onductance of quartItLe. The electrolytic mechanism con-tributes a conductivity that increases with increasing water conterit in the rockmicropores. Upon heating the rock, the water is Oriven off and the contribu-tion to rock conductivity by the electrolytic mechanism is reduced. The othermechanism responsible for electric conductance in rock is the ionic-pumpmechanism. Here, ionic constituents of the lattice are the mobile particlesthat diffuse either interstitially or by a vacancy mechanism. This type ofconductance increases with temperature rise and often follows, an exponentialincrease. Section VIII contains a theoretical treatment of the ionic conduc-tivity in rocks. The combined effect of temperature on the two types of con-ductance, one decreasing and the other increasing with temperature rise, canexplain the occurrence of a minimum in Figure 6-6.
2816-3001

6-7
I = OU~~ SS01 3WL33131 IU Y3
cm3
oo
M in
(4) 4)
0 U 0
N w
4-)0-, w,4 tI ~~~~~ ~ ~ Q WNJSO 3II.-3G31V3
1 2816-3001i
fw

6-8 I
in
4r.
0
w0 L
4 110
>J>
0No W 1
0 0n
(9 NV) 1. 3ONV SS3

* ___6-9
I" a4cI
v.) ND~ ' C) 0 ~t-0 0 0 04 ( 0 r
to v 0 0 04 0 0 0 0lOl 60 0 0* 0w 0
L4 0
C;C ;*~ ; 0 0
- t C4 v-4 o CD N 14 - 1-4 VI 0 0 0 c o o C) c) co co
C _____ v-z I- z-
04 to to 00 T4 Mt cocc CD to co CD CD t
t- m- r-4 co4 '.4 E-
o. on o) 000 co c
C.) 4-C) 0 3
coI C4 tn4 N7)CU~~ ~ m- w- . - '4 r -
14', to 0 0 0 0.) 0 0C -I'00 cq to 0 LO 0 in 0 go'
0* r-4 H- q N c)1
1 2816- 3001

6-10
0 i0|N
IxI
o s Ic 1
o1
d
• , - t ,1
u4J4-C
t.-
zz
wo0 0> 1
W
3 NINO38D33 0 lV3
- - -- -' -- 0 -1

I
10.01
1| 9.0
I8.0-
w
Z 7.0
4
I4 .0
II
3 6.0 IiI
So50 100 150 200 250 300 350
I TEMPERATURE (0 C)
Figure 6-6. Effect of Temperature on the Relative Dielectric LossTangent of Quartzite at a Nominal Frequency of 1. 80GHz
I

7-1
SECTION VII
EFFECT OF TEMPERATURE ON ROCK
DIELECTRIC PERMITTIVITY
Dielectric measurements on rocks at various temperatures can reveal a host
of rock thermophysical andmechanical properties. Because of the complex
structure of rocks, we followed the recommendation of Hugg ins (Ref. 4) in
I5 using local structural groupings as the basic structural units in rocks. The
term structon was -used to signify a specific type of atom with specific kinds
and numbers of close neighboirs.
The relationship between polarizability ) and the relative dielectric permit-
tivity (P') is given fo simple systems by the Clausius-Mosotti equationr
(Ref. 5) asIe' -1 '
/'+4 r
I where n is the number of particles per unit volume. The total polarizability(a) is sometimes regarded as equal to the sum of electronic (ae) plus atomic
.1 (aa ) plus molecular or orientational (a m ) polarizabilities. In general, ae and
aa are temperature insensitive. Unless the number density of elementary
particles shows a significant decrease with rise in temperature (as in -gases
or liquids), the change with temperature of e' due to-electronic or atomic' r
polarizations will be overshadowed by the large changes in orientation polari-
zation. Orientation of dipoles in an applied electric field will depend on
temperature, complete orientation prevented by thermal agitation. Polari-
zability under these conditions will decrease with rise of temperatur'.
according to
am = /3kT (7-2)
2816-3001
II

7-2
where gi is the electric moment of the polar group in the molecule, k is
Boltzmann' s constant, and T is the absolute temperature. In the presence
of polar molecules, the lausius-Mosotti relation was amended by Dtye 3(Ref. 5) in the form
€n a + s ,~ (7-3)ef +2 -Tr
where a s now refers to the structural polarizability, equal to (a + aa). In
this form, physical chemists have extensively used Equation (7-3) to elucidate ,
molecular structure and molecular dipole moments. 3In the absence of permanent dipole moments (i.e., when = 0), we applied
the Clausius-Mosotti relations for rocks in the form
-1 e'1 4n TI
where n is now the number of rock structons per unit volume and a. is the
structon's polarizability, equal to the cube of its average radius (assumed
spherical). The product na may, therefore, be regarded as the true
volume, cp, of"the solid rock, excluding the pores, fractures, or solid imper-fections, whose addition to cp gives V, the total or apparent rock volume.
Upon differentiating Equation (7-4) with respect to temperature at constant
pressure, one obtains
e'- 1 2 6T c 6) (75)i
or I. (28 17-0)
2816-3001

7-3
where 8 is the isobarric coefficient of vnlume, expansion. In the present
investigation, Equation (7-6) was usedffor the first time to evaluate the
coefficient of thermal expansion for the three representative rock samples(Dresser basalt, charcoal granite, and Sioux quartzite).
The dielectric data obtained with basalt at a nominal frequency of .0.69 GHz*i in the temperature range 25 to 300*C are shown in Table 7-1. The estimated
coefficient of -thermal expansion is listed at each temperature in the third! column- of that table.
Table 7-1. Effect of Temperature on the Th -mal"I'I Expansion Coefficient of Basalt
Temperature C r I x 104
(oc) r __oc__ I( )
25 9.86 1.03
1 50 9.96 1.18
100' 10.20 1.31
150 10.45 1.22
1200 -10.68 0.85
250 10.80 0.57I 300 10.92 0.56
I The' granite dielectric data measured at a nominal frequehcyof 1. 50 GHz
were also used'to estimate the thermal expansion coefficient of that' rock;
the results are given in Table 7-2.
I The relative dielectric constants of quartzite at a nominal frequency of1. 80GGHz were also used to estimate the thermal expansion coefficient of that
I rock. The data obtained at various temperatures are shown in Table 7-3.
2816-3001

7-4
'table 7-2. Effet Temperature on the ThermalExpansion Coefficient of Granite
(C) [ r'1)
25 6.03. 5.2N.
50 6.,05 6.3
100 6.10 6.5
150 6.14 4.3
200 6.16 2.1
-250, 6.11-7 1.4
300 6.18 2.1-
350 6.20 2.8,
400, 6.22 3.5
450 6.25, 4.8
Table, 7-3., Effect of Temperature on the ThermalExpansion Coefficient of Quartzite
Temperature ex i0 5(00 r 0-1)
25 4.63 5.8
50 4.65 8.0
100 4.66 7.3
150 4.68 6.11
200 4.71 6.,0
250 4.73 6.0
300 4.76 5.91
2816-3001I

7-5
The thermal expansion coefficient is a complex function- of temperature.
The variation of this coefficient with temperature is illustrated in Figure 7-i
for the three rocks investigated. For basalt, the -thermal exPansion coef.
ficient exhibits a maximum of 1.31 x 10- 4 oC-1 at about 100C. For quartzite,
a maximum in-0 is estimated as 8.5 x 10 5 °C' 1 at about 70 0 C. For granite,
shows a maximum value of 6.7 x 10 -' 5 0C I at about 800C.
II
I
I
I 2816-3001

7-6
1-a - BASALT3b -GRANITE
13 c - QUARTZ ITE
1'
a
9-4
0w
x
3-32-
1-3
0 100, 200 300 400 500
TEMOERATURE ('C),
F igure- 7-1. Variationof the Rlock Thermal R xpansionCoefficient with Ternp-rature
2816 -3001

SECTION V'VIEFFECT OF TEMPERATURE ON TIE
RELATIVE DIELECTRIC :LOSS
The relative -dielectric loss is expected to foilow--an Ar rhenius type of
a_ dependence on temperature. This is because dielectric loss i §interrelated
with electric conductaricei, q, according to
- 'C, =we:'' =e 'a o " - (8-1)
I0 Twt!ere w is the angular frequency, e" is the imaginary component of the
dielectric perrmittivity, and- c is the permittivity of freq spacei,
The variation of the conductivity, c, of solid -mlnrals-in a rock with-tempera-
I .ture oi often given by
C't Coe-Q/2kT- (8-2)
i!I where Q is an activation energy. Equation (8-2) is \valid When the minerals
ate electron semiconductors. When the minerals in the rock ar~e dielectric
SI insulators, then the conductivity variation with temperature becomes
I tao eQ/ (8-3)
Il In either case,,, the conductivity will increase, and- the resistivity will de-
crease with a rise in temperature. The plot of tn t with the reciprocal of
i absolute temperature, 1, will, in a well-behaved system, give a straight
line whose slope is -Q for dielectric insulators and - - for semiconductors.:1k 2k
1 2816-3001

8-2
At subzero temperatures, Parkhomenko (Ref. 3) was able to draw the
following general conclusions from the experimental data available on rocks
- A pronounced change in resistivity as a function of tempera-
ture is associated with the freezing or thawing of an electro-
lyte in the pores of a rock.
* The actual resistivity at low temperatures depends on the
water content, the chemical composition of the electrolyte,
and the grain size of the rock.
* The resistivity of fine-graine d rocks (shale) increases less
abruptly with decreasing temperature than does the resistivity
of coarse-grained rocks.
* With increasifig salinity of the pore water, the increase in
resistivity on freezing is reduced. Data on the relationship
between resistivity and ice content at freezing temperatures
may be used in interpreting electrical geophysical surveysmade in permafrost areas.
Resistivity of water-bearing rocks will result from the combined effects of
its liquid and solid fractions. The resistivity of electrolytes decreases, and,
hence, its conductivity increases with a temperature rise.
The temperature coefficient of the conductivity of most electrolytes averages Iabout 2. 5 percent per degree centigrade. The value of this coefficient in-
creases with decreasing salinity. Because sedimentary rocks lie in the upper
part of the earth's crust :(where the temperatures do not exceed 200 to 250 0 C),
a decrease in resistivity with depth caused by the decrease in the resistivity Iof the pore water with temperature is observed.
I2816-3001

8-3
III When the rise in temperatuke causes an evolution of water from the rock,
'the resistivity will change anomalously. Studies of the temperature-resistivity
curve for various -types of coal, as well as for various rocks, under laboratory
conditions indicate that evolution of water is accompanied by a characteristic
change in resistivity. the greater the original water content of a rock, the
greater will be the anomalous rise in the resistivity on evolution.
IIn dry rocks without fractures, the relationship between resistivity and
temperature is well described by Equation (8-3). When the log a versus
curve has a change in slope, an expression containing two exponential terms
would fit the results
Q1 Q2
kY T e + e2 (8-4)
T his correspondsto two mechanisms of conduction with two activation
energies In the low- and high-temperature ranges.
ICalculations of the rock. conductivity from the previously determined relative
dielectric losses (Section VI) were made. The results for basalt are given
in Table 8-1.
Table 8-1. Electric Conductivity of Basalt atVarious Temperatures
Temperature 100 0 (*K- 1) f I 2_ f _ _ _ _ _
_( _C) I I (GHz) (radsec) r (farad meter) (ohm. meter)"
24 3.37 1.'188 7.464 x 10⁹ 0.484 4.28 x 10⁻¹² 3.19 x 10⁻²
50 3.10 1.184 7.439 x 10⁹ 0.539 4.77x 10,12 3.55x 1
100 2.68 1.158 7. 276-x 109 0.615 5.44 x 10- 2 3.96 x 10⁻²
150 2.36 1.132 7.112x 10⁹ 10.721 6.38x 10⁻¹² 4.54x10- 2
• 8.85 x 10" 12 farad/meter.
1 2816-3001

8-4
Similar calculations of the granite and. quartzite electric conductivity are
given in Tables 8-2 and 8-3, respectively.
Table 8-2. Electric Conductivity of Graniteat Various Temperatures
I Te m r ture ij . f:") a 2 ~ I C C ; 'L =
____K'I)_(G IR (radlsec) r (faradl iter) j.(ohm' r)1
25 3.37 1.503 9.443x 10 9 0.204 9;20x 10-13 8.691 f- 3
50 3.10 1.500 9;424 x 109 0.120 1.06 x 10⁻¹² 9.99 x 10- 3
100 2.68 1.494 9;'387 x 109 0.135 1. 19.x 10-12 1.12 10" 2
150 2.36 .1.489 .9.355.x-109 O0. 147 1.30 x 10"1 2 1.22x 10 2
200 2.11 . 1.486 9.337x 10⁹ 0.170 1.50x 10 - 12 1.40,x 10- 2
250 1.91 1.485 9.330x I09 0.'181 1.60x I0-12 1.49x 10⁻²
300 1.75 1.485 9..330x 109 0.190 1.68 x 10- 12 1.57 x I0- 2
350 1.61 1.480 9.299 x 10⁹ 0.214 1.89 x 10⁻¹² 1.76 x 10⁻²
400 1.49 1.479 9.293 x 10⁹ 0.218 1.92 x I0 " 12 1.7 x I0- 2
450 1.38 1477 9.280 x 10⁹ , 0.228 2.02 x 10- 12 1.87 x, 10.2
i2816-3001

I
i8-5
Table 8-3. Electric Conductivity of Quartziteat Various Temperatures
ri 1 2v Tr C 0CWlTemperature 1 ( u=2.f H, r e" I = mt"
(______T (GHz) __rad/se_) [ (faradlmeter) (ohm meter) 1
25-- 3.37 1.807 1. 135x I010 0.0211 '1.86,x10-13 2.11 x 10;3
50 3.10 1.803, L133x 1010 0.0206 1.82x 10⁻¹³ 2.06x 10 - 3
t09T 2.68 1.801 1.132x 10¹⁰ 0.0204 1.81x,10- 1 3 2.05x 10- 3
1 '150 2.36 .1.796 1.128x 10¹⁰ 0.0219 1. 94 x10,i 2.19x 10- 3
200 2.11 1.792 1.126x 10O 0.020 2.12x c 1 3 2.39 x10- 3
250 1.91 1.787 1.123 x 10¹⁰ 0.0284 2.51 x 10⁻¹³ 2.81 x i0 3
300 1.75 1.781 1.119 x iO 0.04791 4.24x10"I3 4.74 x 10- 3
II.
The previously determined dielectric loss data (Section VI) for basalt at a
nominal frequency of 0.69 GHz were also used to calculate the electric con-
ductivity of that rock at that frequency. These calculations are shown ,in
I Table 8-4.
Table 8-4. Electric Conductivity of Basaltat Various TemperaturesNominal Frequency = 0.,69 GHz
Temp rature 1 0,(K-1 2iYf , r j ell 1 el wC= to
(°C) (___ z) _ (rad/sec) (farad/meter) (ohm meter)-
25 3.35 0.707 4. 44x-10 9 0.478 4.23 x l012 1.88 x 10⁻²
50 3.10 0.702 4.41x 10⁹ 0.536 4.74x 10- 12 ' 2.09x 10²
100 2.68 0.694 4.36x 10⁹ 0.010 5.40x 10⁻¹² 2.35x 10⁻²
1 150 2.36 0.685 4.30x 10⁹ 0.765 6.77 x 10⁻¹² 2.91 x 10⁻²
200 2.11 0,678 4.26 x 10⁹ 0.867 7.67 x 10¹² 3.27 x 10²
250 1.9D! 0.674 4.23x 10⁹ 0.985 8.72x 10¹² 3. ,x 02
300 1.75 0.670 4.21x10⁹ 1,113 9.85x 10" 12 4.14x 10- 2
I2816-3001

8-6
The variation of the logorithm of the electric conductivity of basalt with the
reciprocal absolute temperature is shown in Figure 8-1. At a nominal fre-
quency of 1. 15 GHz, the conductivity data are best fitted by the Arrhenius
line -(a) whose slope indicates an activation energy (Q) of 665 cal/mole or
2. 68 x 10-2 ev. At a nominal, frequency of 0.69 GHt, the data are fitted on
two Arrhenius -lines.. The low-temperature line (b) is closely parallel to
line (a) and indicates an activation energy of 660 cal/mole or 2. 86 x 10-2 ev
below 100*C.
Above 150 0 C, the basalt electric conductivity data fall op- Arrhenius line bwhich indicates an activation energy of 1. 109 kcal/iuole or 4.81 xt 10 2 ev.
The foregoing experimental data on basalt at the lower frequency of 0. 69 GHzare best explained by Equation (8-4) given in Parkhomenko monograph (Ref. 3).
at = orI e'Ql/kT + a 2 e-Q2/kT (i8-4)I
whereiQi and Q2 are the activation energies corresponding to a low and a
high temperature conduction mechanism. Experimentally, it was difficult
to achieve resonance conditions with basalt in the slotted line at the higher
frequency of 1. 15 GlIz when the rock temperature was 200°C and above(refer to Table 6-1). Because the relative dielectric loss (e ") increases*
~with frequency, increasing both 'frequency and temperature may render thedielectric properties of the relatively conducting basalt difficult to measure
in slotted lines. Hence, no data can be obtained with the present equipment
to support the high-temperature conduction mechanism for'basalt at the
higher frequency of 1. 15 GHz. It is gratifying, hpwv :er, to note that the
activation energy at the low-temperature range is inidependent of the operatingfrequency as seen by the close parallelism of lines a and bI in Figure 8-1.
It may be concluded, therefore,, that the conduction mechanism in rocks,and hence the activation energy. (Q), does not depend on the operating fre-quency, but can significantly depend on the temperature range at which
2316-3001

18-7
7 x 10 - 2 NOMINAL FREQUENCY INGIGAHERTZa - 1.15bi , 1 2 - 0.69
6 x 10 - 2
5x 10⁻²
4 x 10 2
0
-
a
I -b?
ole
10-2 665 0-2,2.88 x 12ev
, 0t BELOW 1000"CIIbQ 6.60callrnole
I 210.20 ev
I -6.60calmol
02.86 x10² evABOVE 1500C
Qb= 7,109 cal/mole
=4.81 x10⁻²ev
I21.0 1. . 002.5 1 3.0 3.5 4.0
T
Figure 8-1. Arrhenius Plot of Basalt's Electric Conductivity
2 81G6-3001

8-8
measurements are taken. More experimental work is needed to support or
refute this seemingly logical conclusion. I
The Arrhenius diagram for the electric conductivity data of granite at a
nominal frequency of 1.5 GHz is shown in Figure 8-2. Here the data fit a3
single straight line in the temperature range 250 to 450 0 C. The slope of the02
line indicates an activation energy of 756 cal/mole or 3.28 x 10² ev. The Igranite rock is about 7-5 percent less conductive than basalt, and hence
dielectric measurements were pc .sible at the high frequency of 1. 5 GHz
and temperatures up to 450 0 C.
-The electric -conductivity data of -quartzite- did- not fit to -the Arrhenius- diagram I(Figure 8-3); but exhibit a minimum conductivity-of about 2 x 10³
(ohm - meter)-1 at about 100°C. This anomalous change of conductivity 3with temperature has been shown-by Parkhomenko (Ref. 3) to-be caused by
an evolution of water from the rock. The greater the original water content
of a rock, the greater will be the anomalous rise in the resistivity (or fall
in conductivity) with rise in temperature (or upon water evolution).
In a solid lattice, like that of rocks, the conducting'particles and vacancies
(or the electrons and holes in semiconductors) will. migrate with a time
average velocity Ky¢>, which is to a good approximation proportional to the
field, E, if IE] is riot too large. The electric mobility, p., is defined (Ref. 6)
by
V (8-5)
The positive sign in Equation (8-5) applies for positively charged particles
(or anion vacancies, or holes), and the negative sign applies for negatively
charged particles (or cation vacancies, or elec rons). Equation (8-5) is a
simple representation of linear relations between components of vectors,
with the mobilities represented by symmetric tensors. 3
2816-3001 I
- - -

8-9
mI~ 2x10-21
100
'-430w 3 0
00- 10-2
\ \> 9x10-
33 0Mo 8x10"3
z
Sxo 710-3
3 -
W 6 x i0-3'_
I Q= 756 cal/mole 3.28 x 10- 2 ev
5 x 10 3
4 x 10"3
1.0 1.5 2.0 2.5 3.0 3.5 4.0
1 1000 (OKl)
Figure 8-2. Arrhenius Plot of the ElectricConductivity of Granite
I 2816-3001I ( - J " - •••m •

33
q8-10
7 x 10⁻³ 3S6x 10'
4j-3-
wj 6x10⁻³ WI
I-.T
1.0 1.j. . . . .100 4x10 3
)0T
Figure 8 lcrcCrdciiYO urzt hwnAnmlu rhnu lt u t oso ae
286V"0

ii8-11
The electric conductivity, a, of a, specimen containing n mobile- particles of
charge ±ze per -unit volume is given by
zen (sa zelrn = (8-6)
where z is the valence of the conductive particle (or--vacancy), and e is the
electronic 'charge.
'The diffusion coefficient (DMY is related to mobility by the Stokes-Einstein
equation (Ref. 7):
D -- F (8-7)'Ie
where k is the Boltzmann constant, and T is the absolute temperature.
Combining Equations (8-1), (8-6), and. (8-7) leads to
a=coe" = zen 1 = (ze)2 nD (8-8)
Hence,
(ze)nD (ze),nD (8-9)wkT 2n kfTI
where f -is the frequency at which the imaginary component, e", of dielectric
perrmittivity, or dielectric loss, is measured.
Diffusion in solid media is regarded as an activated process (Ref. 8) with
the diffusion coefficient usually given by
D D=D8 eQ-RT (8-10)
1 2816-3001

8-12-
Equations (8-3), (8-9), aid (8-10) show that the activation-energy is really
the same quantity for dielectric loss, conductance, and diffusion.
Zener and Wert (Ref. 9) made an estimate of the entropic or the pre-
exponential term D in Equation (8-10) for activated diffusion. They assumed
that. the diffusion activation -energy (Q) is spent in deforming ,the crystal, lattice
elastically in the vicinity of the saddle point. Although ZenerO s treatment
applies for metallic lattices,, it can be extended to.,c.ompounds by assuming
their lattices to be represented by two interpenetratin, elemental lattices.
The Zener model also pictures the energy changes associated with diffusional
motion as reflected in elastic strains in the lattice. The free energies of
formation and motion are accordingly treated as elastic strain energies, and
the entropic -term is .determined from the measured temperature variation
of the elastic properties. The frequency factor in Zener' s model is accord-
ingly given by
D 2 e .'Q/TmDO ve m (8-11)
where 6 is the average jump distance; v is the Debye frequency; X is an
empirical constant equal to a 0. 55 for substitutional diffusion in fcc lattices,
and 1. 0in bcc latticices, and equal to 0.35 for interstitial diffusion;
- = dlg is, related to the temperature derivative of the elastic
shear modulus L; Q is the measured activation energy for the diffusion process;
and Tm is the melting temperature of the diffusion medium.
The foregoing relationships are given to illustrate that dielectric measure-
ments on rocks can reveal some of their thermophysical and mechanical
properties that are obviously needed for scientific optimization of the rock
fragmentation process.
2816-3001

119-1
SECTION IX
I TECHNICAL REPORT SUMMARY AND RECOMMENDATIONSFOR FUTURE WORK!I
A Boonton 250A RX Bridge was selectedto measure the complex permittivity
I of rock samples over the frequency range 10 7 Hz to 2.5 r 108 Hz., A slotted-
line heterodyne detection was assembled for measurementcof complex per-
mittivity over the frequency range 108 Hz to. 4 x 10 Hz. The latter' system-
consists of a GR900LB slotted-line, several GR unit oscillators, an HP sweep
I oscillator, a -crystal- mixer, andt-a 30 MHz IF amplifier-detector.
[ Accurate dielectric measurements on low-loss rock samples require very
precise measurement of'high standing-wave ratios with the sletted-line
equipment. The square-law detector probe supplied with the slotted line is
- satisfactory for conventional transmission-line measurements Where standing-
wave ratios are usually less than 20. However, the detector response did not
follow an ideal square-law characteristic at low levels, and the sensitivity
was not sufficient for accurate measurements of the -minima in the standing-
j wave pattern. Heterodyne detection was thus used in all of-the slotted-line
measurements to provide the necessary sensitivity and linearity.
-Heterodyne detection requires a separate local-oscillator source in addition
to the r-f generator used to drive the transmission line. Both r-f sources
must be very stable in frequency to keep the difference frequency centered
within the i-f amplifier response curve during the measurement interval. A
I stable local-oscillator source covering the frequency range above 2 GHz was
not available until the end of the contract period, and there was insufficient
3 time to perform the desired measurements in the 2- to 4-GHz range. It should
be possible, however, to extrapolate the dielectric constant and loss tangent
data considerably beyond the 2-GHz measurement limit because there is no
experimental or theoretical evidence of dispersion in this frequency regime.
2816-3001

' -9;-2
'The 2,. 45 .GHz frequeny allocated for Lidustrial, scientific and, medical uses
is -,ofcoienderable interest -for rock-fragmentation studies. This. frequency
is well within. the valid;e xtrabl:tioir xange-ofthe data.
The first coax ial sample -holder used in this investigation consisted of GR874
air line with a brass center conductor. Rock sampies of basalt, granite, and
quartzite in cylin&Iail form and of the proper outside diameter were providedby the U.S. Bureau of Mines, Twin -Cities Mhinig Research Center. A hole
drilled along the cylindrical axis of' each rock sample accepts the centralcgoiuctor of the sample :holder. Despite delays due -to drilling madhine mis-
alignment, drill. breakage and-nonuniform dr.ill travel, it was possible to -secure-a few pr-ecision drilled samples for use in the slotted line. A second 'coaxial
sample holder consisting of GR90OLZ -precision air lines and a silver platedcenter conductor Was, procured. A new set of rock cylinders to fit the new
samnple holder was obtained.
Over the frequency- range 107 to 108 Hz, five data points of the complex per-
mittivity were taken for Dresser basalt, charcoal granite, and Siouxquartzite. using the RX bridge, The measurements were in error at the higher
'frequencies due to the invalid .lumped-circuit assumptions at these frequencies, ..
Slotted-line measurements were made over the frequency range 3.x 10 8 to2 x 19 Hz. Approximately seven data points were collected -for each rock
type. Measurements were taken at rock sample quarter- and half-wave
resonance conditions. Here the rock length limited the low-frequency end
of the measurements. Each data'point requires a knowledge of the position,
of the standing wave minimum from- the sample input and the width of the wave
at that standing wave minimum. The minimum positin: gives the real part ofdielectric permittivity, and the width of the minimum gives a measure of the
loss tanagent and hence the imaginary part of dielectric pe.-mittivity. The
least error in measuring the real component of permittivity occurs at half-
wave resonance, and the least error in measuring the imaginary componentof dielectric permittivity occurs at quarter-wave sample resonance.
2816-3001

9-3
Since a lumped circuit approach is invalid above 4 Hz, transmission-
line techniques mustbe used.- Difficulties in measurement then arisdedue to
iaccuracie in ltihe qength determinations and nonuniformity of loss. parm-eters .throughout the.1ines. Trc -reduce the uncertainties .in dielectric -mea-
J surements, a miethod,depending. on samples of various, lengths should be
devised in futuike work to-eliminate the need of knowing accurately the length
| of the transmission line. Slotted-line, measurements should~be extended out-
| side of the quarter- and half-wave resonance conditions-.
The variation of e' and e " with frequency for the three rock samples of basalt,
• r "rgranite, and quartzite indicated the- absence of dielectric dispersions in the
frequency range 1 9to Hz. Hence, dielectric i-laxatibn is absent in
rocks at these high frequencies, apparently because the atoms and electrons
in the rock are able to faithfully oscillate with the field with no time lag.
Dielectric polarization by electron- motiou results from electrons moving
relative to the nucleus in an atom or ion under the influence of an external
electric field. The time required for pol~tization-byelectron displacement
is of the ,order of 10-15 to 1016 second, xhich requires frequencies much
I higher than those investigated in this research. Hence, dielectric permit-
tivity of rocks caused by electron displacement shows no dispersion over the
whole frequency range from zero to optical frequencies. Polarization by
ionic or atomic displacement requires times of the order of i0 1 3 to 10 12
second. For a material to exhibit dielectric relaxation due to thic type of
polarization, frequencies of the order of 1012 Hz (0. 03 cm wavelength in the
infrared part of the spe',trum) may be neeaed. For larger structural units
n in rocks, dielectric relaxation was found to occur in rocks (last year's
research, final report Z9506-3007) in the kHz frequency range. Hence, the
displacement of some local structural units (structons) in rocks requires
times of the order of 1o 2 to second. The absence of dielectric relaxa-
I tion and the consequent inability to measure rock relaxation times or turnover
frequencies in this year's research suggests the absence of smaller structural
units in rocks that can resonate ". the frequency range 10 to 109 1-z.
2816-3001
I- i Mm m m ~ M an m

9-4 pThe slotted-line equipment was adapted to enable measurements, of rock
dielectric parameters at elevated temperatures. The equipment modifications
included a temperature-egulate-oven, a temperature-isolating section of Icoaxial line between the slotted-line and sample holder, a heat sink at the
input to the slotted line, and an inert gas (argon) supply into the sample
holder to prevent-corrosion of its inside surfaces.
Rock complex permittivity data were gathered between 25 and 4500 C at 500 1intervals. Data for basalt could only be taken up to 300'C due to higher order
resonance modes that caused inaccurate readings. Data for quartzite -could
only-be taken to 3000 C due to rock sample -deterioration. Nodata were taken
above- 4505)C tozprevent-excessive sample-holder deterioratonD. JThe temperature variation of the real part of dielectric permittivity has been
successfully analyzed in the light of the Clausius-Mosotti equation. Dielectric
permittivity caused by electronic or atomic displacement is practically inde- i:pendent of temperature. Unless the number -density of these elementary
particles shows, a significant decrease with rise in temperature (as with gases
or liquids), the dielectric permittivity of rocks due to electronic or atomic
polarization should not change with temperature. The observed change in
rock permittivity can therefore be safely assumed to be due to the polariza-
bility of the local structural units (or structons). The change in polariza-
bility (( volume) of these structons with temperature is, therefore, respon-
sible for the change in dielectric permittivity with temperature, their total
number remaining constant in a given rock sample. By slightly modifying the
terminology of polarizability in the Clausius-Mosotti equation to include the
polarizability of the structon (refer to Section VII), it was possible to relate
the isobarric thermal expansion coefficient to the temperature coefficient of the 3relative dielectric constant. On this basis, the volume expansion coefficients
of the three rocks investigated have been determined from the temperature
coefficient of their relative dielectric constant. The coefficient of volume
2130I,2816-30011

~9-5
expansion. of rocks has been found to vary with. temperature (Figure 7-1) in
an unpredictable manner. In well-behaved systems, theirmal expansion
coefficients are expected to increase slightly and monotonally with tempera-] ture according to the -Gruneisen's formula (Ref. 10). Structural and phase
transitions in rocks might be responsible for the maxima occuring in their
1- thermal expansion coefficients (Figure 7-1). Validation-of these conclusions
and of- this novel method to determine rock volume expansion coefficients is
Jrecommended for future research. Accurate knowledge of the volume expan-
sion coefficient is required for optimization of rock fragmentation processes! I by a combination of dielectric heating and-thermal stzoss fracturing.
The variation with temperature of the relative dielectric loss was found to
follow the Arrhenius relation for basalt and granite. Because dielectric loss
is interlinked with electric conductance, the activation energies obtained from
I the Arrhenius diagrams (Section VIII) would give a measure of the efiergy
height of the "saddle point" for particle diffusion in the rock lattice. Rock
mechanical and thermophysical properties can be derived- from this type of
study in the light of a solid-state diffusion model. For example, the Zener
i and Wer. diffusion model (Ref. 9) can relate the entropic or pre-exponential
diffusion term to the De',ye frequency and to the temperature derivative of
the elastic shear modulus in rocks. The present research illustrates only
the beginning steps in this somewhat a-ademic but nevertheless important
information on rock thermophysical properties. The relationships betweendielectric loss, rock conductivity, diffusivities in rocks, etc., is anotherarea of research that should be pursued by further research.
2816-3001

10-1
SECTION XREFERENCES
1. Von Hipple, Arthur, Dielectric Materials-and Applications, TechnologyPress, Massachusetts Institute of Technology, Cambridge, Mass.,, 1954.
1 2. Spalding, H., Ed., "Material-Characteristics Measurement," Munchen 8,West Germany, Rohde Schwartz, Die Kurzinformation 3 + 4/1962,
3. Parkhomenk0, E. I., Electrical Properties of Rocks, Plenum Press,New York (1967) pages 20, 24, 25. 1,44," 148.
4. Huggins, R. A. ndHuggins, l11. L., "Structural Defect Equilibrium inVitreous Silica and Dilute Silicates," Journal ofSolid-State'Chemistry,Vol. 2, 1970, 385-395.
5. Daniel, Vera V., Dielectric Relaxation, Academic Press, London,1967, p. 212.
6. Menzel, D.H., Fundamental Formulas of Physics, Vol. 2, DoverPublications, Inc., New York, "1960, p. 613.
1 7. .Dekker, A. J., SolidState Physics, Macmillan & Co., Ltd., London,1958, p. 177.
8. Glasston'e, S., J. J. Laidler and H4 Eyring, The Theory of Rate Pro-cesses, McGraw-Hill, New York, 1951.
9. Zener, C. and C. Wert, "Interstitial Atomic Diffusion Coefficients,"Phys. Rev. Vol. 76, 1949, 1169-1175.
10. Gray, E. E., American Institute of Physics Handbook, Second Edition.iMcGraw-Hill Book Co., Inc., New York (1963), Chapter 4, p. 64.
!
J
-A