01_nt wholesale alcohol supply for 2005-2012 · web viewsince the previous (2004 – 2011)...
TRANSCRIPT

Department of Business www.nt.gov.au
Northern TerritoryWholesale Alcohol Supply
2005 to 2012

Northern Territory Wholesale Alcohol Supply – 2005 to 2012
T a b l e o f C o n t e n t s
Wholesale Alcohol Supply..............................................................................................................1
Summary........................................................................................................................................2
Per Capita Consumption.................................................................................................................3
Wholesale PAC Supply....................................................................................................................4
Northern Territory Total..................................................................................................................4
Regional Composition....................................................................................................................8
Darwin............................................................................................................................................9
Palmerston...................................................................................................................................13
Alice Springs................................................................................................................................17
Katherine......................................................................................................................................21
Tennant Creek..............................................................................................................................25
Nhulunbuy....................................................................................................................................29
NT Balance...................................................................................................................................33
Department of Business i
Northern Territory Wholesale Alcohol Supply – 2005 to 2012
Wholesale Alcohol SupplyWholesalers registered to trade alcohol in the Northern Territory (NT) provide the Department of Business with data on the volume of alcohol supplied to licensed retailers by product type (cask wine, bottled wine, fortified wine, cider, standard spirits, pre-mixed spirits, full-strength beer, mid-strength beer and low-strength beer)1.
The volume of each product supplied in the NT is multiplied by its estimated fraction of alcohol content so that the amount of pure alcohol associated with each product type can be compared. The figures presented in this document represent the wholesale supply in litres of Pure Alcohol Content (PAC). Wholesale PAC supply statistics are presented for the NT as a whole; each of the major urban centres (Darwin, Palmerston, Alice Springs, Katherine, Tennant Creek and Nhulunbuy) and for the NT Balance2.
An estimate of the apparent per capita consumption of alcohol in the NT is determined by dividing the total alcohol supplied in the NT by an estimate of the population likely to be drinking. National statistics include those people aged 15 years and above as the likely drinking population. As the NT is a major centre for tourism, the total population likely to be drinking is derived by adding the estimates of the NT interstate and international tourist numbers3 to the Australian Bureau of Statistics’ (ABS) NT population estimates4, aged 15 years and over. Apparent consumption can only be reliably calculated for the whole of the NT as population estimates are considered unreliable at lower geographic levels. Where population changes are cited for regional areas, they are based on the Australian Bureau of Statistics’ total estimated drinking-age residential population for those regions.
This report is a revision of the original 2005 to 2012 publication and contains changes to alcohol supply data and revised ABS population estimates.
1 Since the previous (2004 – 2011) publication, some data exceptions were detected in the alcohol returns submitted by wholesalers in previous years. This required some data to be revised. These data revisions may result in minor changes to previously published figures.
2 NT Balance is defined as the rest of the NT after the urban centres (i.e. Darwin, Palmerston, Alice Springs, Katherine, Tennant Creek and Nhulunbuy) have been removed.
3 Based on calendar year estimates from Tourism Research Australia of interstate and international tourist nights for tourists aged 15 years and over.
4 Based on annual estimates from the Australian Bureau of Statistics publication: 3235.0 – Population by Age and Sex, Regions of Australia. The ABS has recently revised the population estimates used in this publication. These data revisions may result in minor changes to previously published figures.
Department of Business 1

Northern Territory Wholesale Alcohol Supply – 2005 to 2012
Summary1. Estimated per capita consumption of alcohol in the Northern Territory increased to 13.4 litres
per person in the 2012 calendar year.
Estimated per capita consumption in 2012 was one percent greater than in 2011, and twelve percent less than in 2005.
2. Wholesale alcohol supply (litres pure alcohol content) in the Northern Territory in 2012 was three percent more than in 2011.
3. Wholesale alcohol supply (litres pure alcohol content) in Darwin in 2012 was four percent more than in 2011.
4. Wholesale alcohol supply (litres pure alcohol content) in Palmerston in 2012 was seven percent greater than in 2011. Palmerston is historically a high population growth region and the ABS estimated drinking-age residential population increased by five percent during 2012.
5. Wholesale alcohol supply (litres pure alcohol content) in Alice Springs in 2012 was two percent less than in 2011.
6. Wholesale alcohol supply (litres pure alcohol content) in Katherine in 2012 was four percent less than in 2011.
7. Wholesale alcohol supply (litres pure alcohol content) in Tennant Creek in 2012 was one percent more than in 2011.
8. Wholesale alcohol supply (litres pure alcohol content) in Nhulunbuy in 2012 was six percent less than in 2011. This is the lowest supply value recorded for Nhulunbuy in the period 2005 to 2012.
9. Wholesale alcohol supply (litres pure alcohol content) in the NT Balance in 2012 was four percent more than in 2011.
Department of Business 2

Northern Territory Wholesale Alcohol Supply – 2005 to 2012
Per Capita ConsumptionTable 1 and Figure 1 show the estimated per capita consumption of alcohol in the Northern Territory for the calendar years 2005 to 2012.
Table 1 Estimated Per Capita Consumption – Northern Territory2005 2006 2007 2008 2009 2010 2011 2012
Consumption 15.25 14.82 14.71 14.30 13.90 13.40 13.20 13.38
PAC Supply 2,688,663 2,706,671 2,748,430 2,733,794 2,751,916 2,734,608 2,662,887 2,733,964
Population Estimates 176,321 182,686 186,852 191,109 197,948 204,098 201,755 204,404
In 2012, the NT estimated per capita consumption of alcohol increased by 1%, from 13.2 litres per person to 13.4 litres per person.
Between 2005 and 2012, estimated per capita consumption of alcohol in the NT has generally been decreasing.
Figure 1 Estimated Per Capita Consumption of Alcohol – Northern Territory
1.50
1.75
2.00
2.25
2.50
2.75
3.00
13.0
13.5
14.0
14.5
15.0
15.5
16.0
2005 2006 2007 2008 2009 2010 2011 2012
Popu
latio
n (1
00,0
00) -
Who
lesa
le P
AC S
uppl
y (1
,000
,000
Litr
es)
Con
sum
ptio
n (L
itre)
NT Estimated Per Capita Consumption (Litre) NT Wholesale PAC Supply (1,000,000 Litres) NT Population Estimate (100,000)
Department of Business 3

Northern Territory Wholesale Alcohol Supply – 2005 to 2012
Wholesale PAC SupplyNorthern Territory TotalTable 2 and Figure 2 show the wholesale PAC supply by types of alcohol products in the Northern Territory for the years 2005 to 2012.
Table 2 Wholesale PAC Supply – Northern Territory2005 2006 2007 2008 2009 2010 2011 2012
Cider 45,058 43,106 39,879 47,735 60,677 68,134 80,031 101,491
Total Wine 745,117 723,555 653,794 601,016 565,553 568,460 491,703 516,836
Total Spirits 612,929 632,771 682,182 663,947 663,552 674,303 684,522 721,282
Total Beer 1,285,559 1,307,239 1,372,574 1,421,096 1,462,132 1,423,711 1,406,631 1,394,355
Total 2,688,663 2,706,671 2,748,430 2,733,794 2,751,916 2,734,608 2,662,887 2,733,964
In 2012, the total wholesale PAC supply increased by 3%. Cider increased by 27%, total wine increased by 5% and total spirits increased by 5%, while total beer decreased by 1%.
Between 2005 and 2012, the total wholesale PAC supply increased by 2%. Cider exhibited an increasing trend of about 12% per year and total spirits exhibited an increasing trend of about 2% per year, while total wine exhibited a decreasing trend of about 5% per year. Total beer increased by 8% over the period.
Figure 2 Wholesale PAC Supply – Northern Territory
0
500,000
1,000,000
1,500,000
2,000,000
2,500,000
3,000,000
2005 2006 2007 2008 2009 2010 2011 2012
PAC
(Litr
e)
Total Total Wine Total Spirits Total Beer Cider
Table 3 and Figure 3 show the wholesale PAC supply of wine in the Northern Territory for the years 2005 to 2012.
Department of Business 4

Northern Territory Wholesale Alcohol Supply – 2005 to 2012
Table 3 Wholesale PAC Supply Wine – Northern Territory2005 2006 2007 2008 2009 2010 2011 2012
Wine Cask 437,221 444,277 315,776 257,235 210,529 210,927 134,780 117,517
Wine Bottle 234,352 248,843 285,224 306,592 323,011 330,756 329,097 359,545
Wine Fortified 73,544 30,435 52,794 37,188 32,014 26,777 27,825 39,773
Total Wine 745,117 723,555 653,794 601,016 565,553 568,460 491,703 516,836
In 2012, the total supply of wine increased by 5%. Bottled wine increased by 9% and fortified wine increased by 43%, while cask wine decreased by 13%.
Between 2005 and 2012, the total supply of wine decreased by 31%. Cask wine exhibited a decreasing trend of about 17% per year, while bottled wine exhibited an increasing trend of about 6% per year. Fortified wine decreased by 46% over the period.
Figure 3 Wholesale PAC Supply Wine – Northern Territory
0
100,000
200,000
300,000
400,000
500,000
600,000
700,000
800,000
2005 2006 2007 2008 2009 2010 2011 2012
PAC
(Litr
e)
Total Wine Wine Cask Wine Bottle Wine Fortified
Table 4 and Figure 4 show the wholesale PAC supply of spirits in the Northern Territory for the years 2005 to 2012.
Table 4 Wholesale PAC Supply Spirits – Northern Territory2005 2006 2007 2008 2009 2010 2011 2012
Spirits Standard 342,880 346,234 366,639 415,152 435,456 442,421 469,486 486,882
Spirits Pre-mixed 270,049 286,537 315,543 248,795 228,097 231,881 215,036 234,400
Total Spirits 612,929 632,771 682,182 663,947 663,552 674,303 684,522 721,282
In 2012, the total supply of spirits increased by 5%. Standard spirits increased by 4% and pre-mixed spirits increased by 9%.
Between 2005 and 2012, the total supply of spirits increased by 18%. Standard spirits exhibited an increasing trend of about 5% per year. Pre-mixed spirits decreased by 13% over the period.
Department of Business 5

Northern Territory Wholesale Alcohol Supply – 2005 to 2012
Figure 4 Wholesale PAC Supply Spirits – Northern Territory
0
100,000
200,000
300,000
400,000
500,000
600,000
700,000
800,000
2005 2006 2007 2008 2009 2010 2011 2012
PAC
(Litr
e)
Total Spirits Spirits Standard Spirits Pre-mixed
Table 5 and Figure 5 show the wholesale PAC supply of beer in the Northern Territory for the years 2005 to 2012.
Table 5 Wholesale PAC Supply Beer – Northern Territory2005 2006 2007 2008 2009 2010 2011 2012
Beer Full 901,897 913,554 940,155 988,269 1,009,165 983,196 976,464 947,485
Beer Mid 250,489 279,691 297,801 310,909 313,988 317,970 319,750 368,937
Beer Low 133,173 113,995 134,618 121,918 138,980 122,545 110,418 77,934
Total Beer 1,285,559 1,307,239 1,372,574 1,421,096 1,462,132 1,423,711 1,406,631 1,394,355
In 2012, the total supply of beer decreased by 1%. Full-strength beer decreased by 3% and low-strength beer decreased by 29%, while mid-strength beer increased by 15%.
Between 2005 and 2012, the total supply of beer increased by 8%. Mid-strength beer exhibited an increasing trend of about 6% per year. Full-strength increased by 5% while low-strength beer decreased by 41% over the period.
Department of Business 6

Northern Territory Wholesale Alcohol Supply – 2005 to 2012
Figure 5 Wholesale PAC Supply Beer – Northern Territory
0
200,000
400,000
600,000
800,000
1,000,000
1,200,000
1,400,000
1,600,000
2005 2006 2007 2008 2009 2010 2011 2012
PAC
(Litr
e)
Total Beer Beer Full Beer Mid Beer Low
Department of Business 7

Northern Territory Wholesale Alcohol Supply – 2005 to 2012
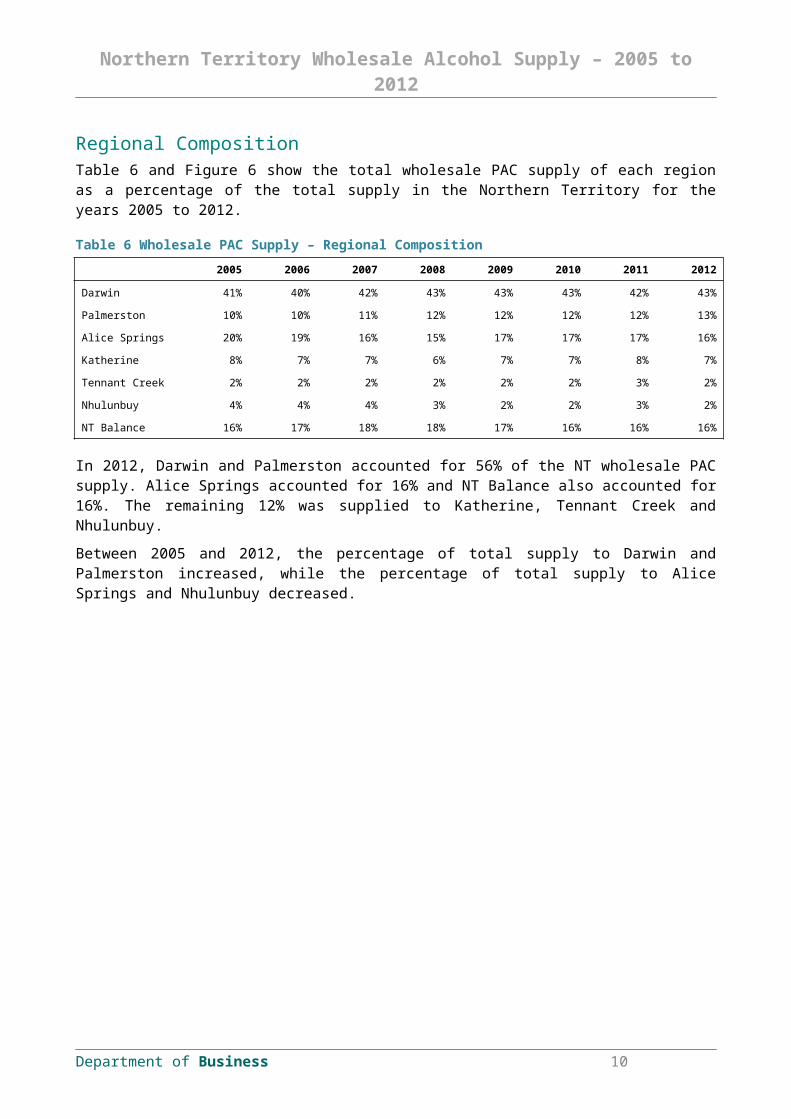
Regional CompositionTable 6 and Figure 6 show the total wholesale PAC supply of each region as a percentage of the total supply in the Northern Territory for the years 2005 to 2012.
Table 6 Wholesale PAC Supply – Regional Composition2005 2006 2007 2008 2009 2010 2011 2012
Darwin 41% 40% 42% 43% 43% 43% 42% 43%
Palmerston 10% 10% 11% 12% 12% 12% 12% 13%
Alice Springs 20% 19% 16% 15% 17% 17% 17% 16%
Katherine 8% 7% 7% 6% 7% 7% 8% 7%
Tennant Creek 2% 2% 2% 2% 2% 2% 3% 2%
Nhulunbuy 4% 4% 4% 3% 2% 2% 3% 2%
NT Balance 16% 17% 18% 18% 17% 16% 16% 16%
In 2012, Darwin and Palmerston accounted for 56% of the NT wholesale PAC supply. Alice Springs accounted for 16% and NT Balance also accounted for 16%. The remaining 12% was supplied to Katherine, Tennant Creek and Nhulunbuy.
Between 2005 and 2012, the percentage of total supply to Darwin and Palmerston increased, while the percentage of total supply to Alice Springs and Nhulunbuy decreased.
Figure 6 Wholesale PAC Supply – Regional Composition
0%
10%
20%
30%
40%
50%
60%
70%
80%
90%
100%
2005 2006 2007 2008 2009 2010 2011 2012
Perc
enta
ge o
f Tot
al P
AC
NT Balance
Nhulunbuy
Tennant Creek
Katherine
Alice Springs
Palmerston
Darwin
Department of Business 8

Northern Territory Wholesale Alcohol Supply – 2005 to 2012
DarwinTable 7 and Figure 7 show the wholesale PAC supply in Darwin for the years 2005 to 2012.
Table 7 Wholesale PAC Supply – Darwin2005 2006 2007 2008 2009 2010 2011 2012
Cider 17,143 16,938 16,725 20,473 26,457 31,974 38,438 50,981
Total Wine 300,685 303,649 330,162 323,800 295,817 294,668 248,757 271,161
Total Spirits 274,574 277,132 294,045 293,271 285,953 287,211 296,375 295,266
Total Beer 499,411 496,211 514,959 549,042 566,867 554,328 540,433 555,446
Total 1,091,813 1,093,930 1,155,891 1,186,586 1,175,095 1,168,180 1,124,004 1,172,853
During 2012, the total supply increased by 4%, while the estimated drinking-age residential population increased by 2%. Cider increased by 33%, total wine increased by 9% and total beer increased by 3%. Total spirits remained relatively steady.
Between 2005 and 2012, the total supply increased by 7%. Cider exhibited an increasing trend of about 17% per year, total spirits exhibited an increasing trend of about 1% per year and total beer exhibited an increasing trend of about 2% per year, while total wine exhibited a decreasing trend of about 1% per year.
Figure 7 Wholesale PAC Supply – Darwin
0
200,000
400,000
600,000
800,000
1,000,000
1,200,000
2005 2006 2007 2008 2009 2010 2011 2012
PAC
(Litr
e)
Total Total Wine Total Spirits Total Beer Cider
Department of Business 9
Northern Territory Wholesale Alcohol Supply – 2005 to 2012
Table 8 and Figure 8 show the wholesale PAC supply of wine in Darwin for the years 2005 to 2012.
Table 8 Wholesale PAC Supply Wine – Darwin2005 2006 2007 2008 2009 2010 2011 2012
Wine Cask 154,211 150,648 164,689 141,155 101,664 103,081 57,613 53,273
Wine Bottle 134,800 139,730 152,304 163,774 173,205 175,181 173,592 191,563
Wine Fortified 11,674 13,272 13,169 18,871 20,948 16,406 17,552 26,324
Total Wine 300,685 303,649 330,162 323,800 295,817 294,668 248,757 271,161
During 2012, the total supply of wine increased by 9%. Bottled wine increased by 10% and fortified wine increased by 50%, while cask wine decreased by 8%.
Between 2005 and 2012, the total supply of wine decreased by 10%. Cask wine exhibited a decreasing trend of about 14% per year, while bottled wine exhibited an increasing trend of about 5% per year and fortified wine exhibited an increasing trend of about 12% per year.
Figure 8 Wholesale PAC Supply Wine – Darwin
0
50,000
100,000
150,000
200,000
250,000
300,000
350,000
2005 2006 2007 2008 2009 2010 2011 2012
PAC
(Litr
e)
Total Wine Wine Cask Wine Bottle Wine Fortified
Table 9 and Figure 9 show the wholesale PAC supply of spirits in Darwin for the years 2005 to 2012.
Table 9 Wholesale PAC Supply Spirits – Darwin2005 2006 2007 2008 2009 2010 2011 2012
Spirits Standard 167,983 167,634 175,048 194,917 198,831 200,803 221,107 212,337
Spirits Pre-mixed 106,591 109,498 118,997 98,354 87,122 86,408 75,268 82,928
Total Spirits 274,574 277,132 294,045 293,271 285,953 287,211 296,375 295,266
During 2012, the total supply of spirits remained relatively steady. Standard spirits decreased by 4% while pre-mixed spirits increased by 10%.
Department of Business 10

Northern Territory Wholesale Alcohol Supply – 2005 to 2012
Between 2005 and 2012, the total supply of spirits increased by 8%. Standard spirits exhibited an increasing trend of about 3% per year, while pre-mixed spirits exhibited a decreasing trend of about 4% per year.
Figure 9 Wholesale PAC Supply Spirits – Darwin
0
50,000
100,000
150,000
200,000
250,000
300,000
2005 2006 2007 2008 2009 2010 2011 2012
PAC
(Litr
e)
Total Spirits Spirits Standard Spirits Pre-mixed
Table 10 and Figure 10 show the wholesale PAC supply of beer in Darwin for the years 2005 to 2012.
Table 10 Wholesale PAC Supply Beer – Darwin2005 2006 2007 2008 2009 2010 2011 2012
Beer Full 363,092 362,178 369,501 408,828 414,715 410,661 402,615 406,677
Beer Mid 78,807 84,347 85,846 89,627 99,647 95,882 94,594 117,244
Beer Low 57,512 49,686 59,613 50,587 52,505 47,786 43,224 31,525
Total Beer 499,411 496,211 514,959 549,042 566,867 554,328 540,433 555,446
During 2012, the total supply of beer increased by 3%. Full-strength beer increased by 1% and mid-strength beer increased by 24%, while low-strength beer decreased by 27%.
Between 2005 and 2012, the total supply of beer increased by 11%. Mid-strength beer exhibited an increasing trend of about 6% per year, while low-strength beer exhibited a decreasing trend of about 8% per year. Full-strength beer increased by 12% over the period.
Department of Business 11

Northern Territory Wholesale Alcohol Supply – 2005 to 2012
Figure 10 Wholesale PAC Supply Beer – Darwin
0
100,000
200,000
300,000
400,000
500,000
600,000
2005 2006 2007 2008 2009 2010 2011 2012
PAC
(Litr
e)
Total Beer Beer Full Beer Mid Beer Low
Department of Business 12

Northern Territory Wholesale Alcohol Supply – 2005 to 2012
PalmerstonTable 11 and Figure 11 show the wholesale PAC supply in Palmerston for the years 2005 to 2012.
Table 11 Wholesale PAC Supply – Palmerston2005 2006 2007 2008 2009 2010 2011 2012
Cider 5,232 5,239 5,097 6,025 7,131 7,650 9,649 12,553
Total Wine 55,037 61,729 74,853 71,727 67,188 63,021 54,926 58,946
Total Spirits 72,908 76,107 85,636 87,574 92,243 93,089 93,484 103,667
Total Beer 132,685 132,980 140,146 157,902 169,684 166,678 169,489 175,975
Total 265,863 276,055 305,732 323,227 336,246 330,438 327,548 351,141
During 2012, the total supply increased by 7%, while the estimated drinking-age residential population increased by 5%. Cider increased by 30%, total wine increased by 7%, total spirits increased by 11% and total beer increased by 4%.
Between 2005 and 2012, the total supply exhibited an increasing trend of about 4% per year. Cider exhibited an increasing trend of about 13% per year, total beer exhibited an increasing trend of about 4% per year and total spirits exhibited an increasing trend of about 5% per year. Total wine increased by 7% over the period.
Figure 11 Wholesale PAC Supply – Palmerston
0
50,000
100,000
150,000
200,000
250,000
300,000
350,000
400,000
2005 2006 2007 2008 2009 2010 2011 2012
PAC
(Litr
e)
Total Total Wine Total Spirits Total Beer Cider
Department of Business 13

Northern Territory Wholesale Alcohol Supply – 2005 to 2012
Table 12 and Figure 12 show the wholesale PAC supply of wine in Palmerston for the years 2005 to 2012.
Table 12 Wholesale PAC Supply Wine – Palmerston2005 2006 2007 2008 2009 2010 2011 2012
Wine Cask 33,355 38,434 48,356 40,809 33,452 28,931 16,913 15,057
Wine Bottle 18,538 20,003 22,814 27,163 29,672 29,691 31,740 35,431
Wine Fortified 3,145 3,291 3,683 3,754 4,063 4,399 6,273 8,458
Total Wine 55,037 61,729 74,853 71,727 67,188 63,021 54,926 58,946
During 2012, the total supply of wine increased by 7%. Bottled wine increased by 12% and fortified wine increased by 35%, while cask wine decreased by 11%.
Between 2005 and 2012, the total supply of wine increased by 7%. Cask wine exhibited a decreasing trend of about 11% per year, while fortified wine exhibited an increasing trend of about 15% per year and bottled wine exhibited an increasing trend of about 10% per year.
Figure 12 Wholesale PAC Supply Wine – Palmerston
0
10,000
20,000
30,000
40,000
50,000
60,000
70,000
80,000
2005 2006 2007 2008 2009 2010 2011 2012
PAC
(Litr
e)
Total Wine Wine Cask Wine Bottle Wine Fortified
Table 13 and Figure 13 show the wholesale PAC supply of spirits in Palmerston for the years 2005 to 2012.
Table 13 Wholesale PAC Supply Spirits – Palmerston2005 2006 2007 2008 2009 2010 2011 2012
Spirits Standard 35,643 36,423 39,101 48,924 52,509 51,229 53,049 58,718
Spirits Pre-mixed 37,265 39,684 46,535 38,650 39,735 41,859 40,435 44,949
Total Spirits 72,908 76,107 85,636 87,574 92,243 93,089 93,484 103,667
During 2012, the total supply of spirits increased by 11%. Both standard spirits and pre-mixed spirits increased by 11%.
Department of Business 14

Northern Territory Wholesale Alcohol Supply – 2005 to 2012
Between 2005 and 2012, the total supply of spirits increased by 42%. Standard spirits exhibited an increasing trend of about 7% per year while pre-mixed spirits increased by 21% over the period.
Figure 13 Wholesale PAC Supply Spirits – Palmerston
0
20,000
40,000
60,000
80,000
100,000
120,000
2005 2006 2007 2008 2009 2010 2011 2012
PAC
(Litr
e)
Total Spirits Spirits Standard Spirits Pre-mixed
Table 14 and Figure 14 show the wholesale PAC supply of beer in Palmerston for the years 2005 to 2012.
Table 14 Wholesale PAC Supply Beer – Palmerston2005 2006 2007 2008 2009 2010 2011 2012
Beer Full 84,905 85,454 88,400 100,750 105,938 105,114 106,362 110,319
Beer Mid 32,131 34,802 37,214 41,028 46,517 46,457 48,361 54,463
Beer Low 15,649 12,723 14,533 16,124 17,230 15,108 14,766 11,193
Total Beer 132,685 132,980 140,146 157,902 169,684 166,678 169,489 175,975
During 2012, the total supply of beer increased by 4%. Full-strength beer increased by 4% and mid-strength beer increased by 13%, while low-strength beer decreased by 24%.
Between 2005 and 2012, the total supply of beer increased by 33%. Full-strength beer exhibited an increasing trend of about 4% per year and mid-strength beer exhibited an increasing trend of about 8% per year, while low-strength beer decreased by 28% over the period.
Department of Business 15

Northern Territory Wholesale Alcohol Supply – 2005 to 2012
Figure 14 Wholesale PAC Supply Beer – Palmerston
0
20,000
40,000
60,000
80,000
100,000
120,000
140,000
160,000
180,000
2005 2006 2007 2008 2009 2010 2011 2012
PAC
(Litr
e)
Total Beer Beer Full Beer Mid Beer Low
Department of Business 16

Northern Territory Wholesale Alcohol Supply – 2005 to 2012
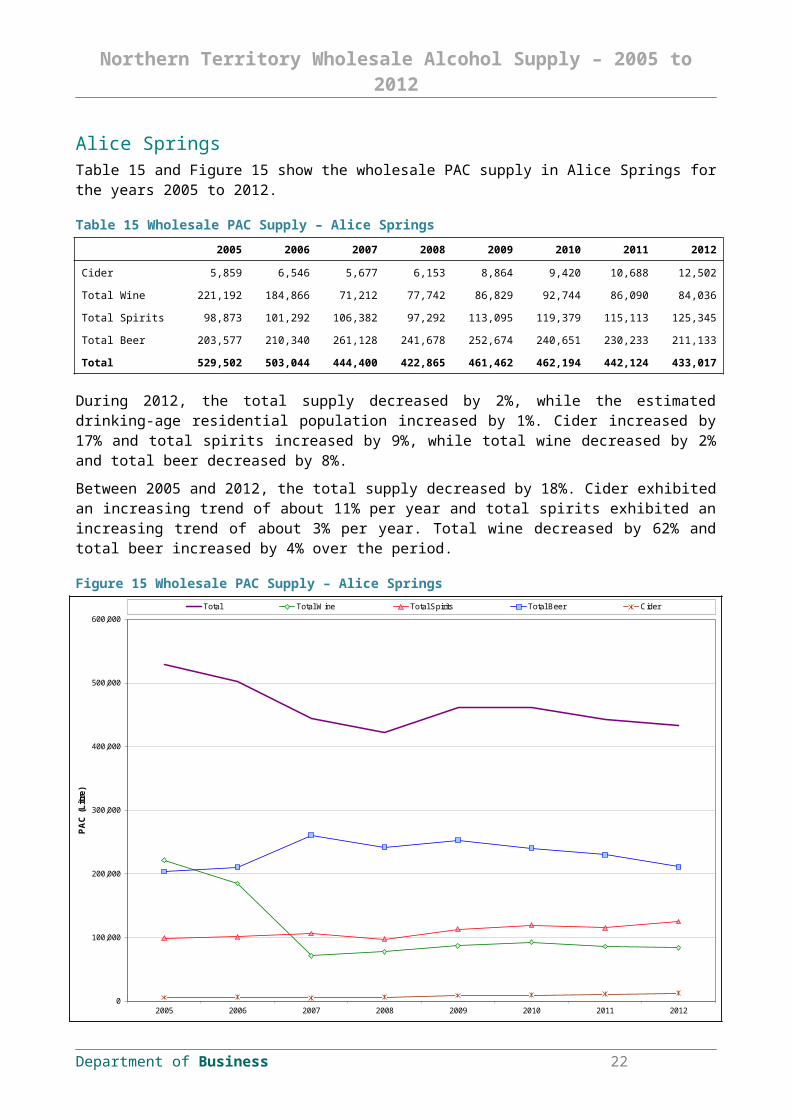
Alice SpringsTable 15 and Figure 15 show the wholesale PAC supply in Alice Springs for the years 2005 to 2012.
Table 15 Wholesale PAC Supply – Alice Springs2005 2006 2007 2008 2009 2010 2011 2012
Cider 5,859 6,546 5,677 6,153 8,864 9,420 10,688 12,502
Total Wine 221,192 184,866 71,212 77,742 86,829 92,744 86,090 84,036
Total Spirits 98,873 101,292 106,382 97,292 113,095 119,379 115,113 125,345
Total Beer 203,577 210,340 261,128 241,678 252,674 240,651 230,233 211,133
Total 529,502 503,044 444,400 422,865 461,462 462,194 442,124 433,017
During 2012, the total supply decreased by 2%, while the estimated drinking-age residential population increased by 1%. Cider increased by 17% and total spirits increased by 9%, while total wine decreased by 2% and total beer decreased by 8%.
Between 2005 and 2012, the total supply decreased by 18%. Cider exhibited an increasing trend of about 11% per year and total spirits exhibited an increasing trend of about 3% per year. Total wine decreased by 62% and total beer increased by 4% over the period.
Figure 15 Wholesale PAC Supply – Alice Springs
0
100,000
200,000
300,000
400,000
500,000
600,000
2005 2006 2007 2008 2009 2010 2011 2012
PAC
(Litr
e)
Total Total Wine Total Spirits Total Beer Cider
Department of Business 17

Northern Territory Wholesale Alcohol Supply – 2005 to 2012
Table 16 and Figure 16 show the wholesale PAC supply of wine in Alice Springs for the years 2005 to 2012.
Table 16 Wholesale PAC Supply Wine – Alice Springs2005 2006 2007 2008 2009 2010 2011 2012
Wine Cask 135,410 135,267 16,367 19,968 23,274 25,685 22,840 12,812
Wine Bottle 41,933 44,646 52,619 56,367 62,320 65,974 62,469 70,491
Wine Fortified 43,850 4,953 2,226 1,406 1,236 1,085 781 733
Total Wine 221,192 184,866 71,212 77,742 86,829 92,744 86,090 84,036
During 2012, the total supply of wine decreased by 2%. Cask wine decreased by 44% and fortified wine decreased by 6%, while bottled wine increased by 13%.
Between 2005 and 2012, the total supply of wine decreased by 62%. Bottled wine exhibited an increasing trend of about 8% per year, while fortified wine exhibited a decreasing trend of about 44% per year. Cask wine decreased by 91% over the period.
Figure 16 Wholesale PAC Supply Wine – Alice Springs
0
50,000
100,000
150,000
200,000
250,000
2005 2006 2007 2008 2009 2010 2011 2012
PAC
(Litr
e)
Total Wine Wine Cask Wine Bottle Wine Fortified
Table 17 and Figure 17 show the wholesale PAC supply of spirits in Alice Springs for the years 2005 to 2012.
Table 17 Wholesale PAC Supply Spirits – Alice Springs2005 2006 2007 2008 2009 2010 2011 2012
Spirits Standard 52,815 53,503 56,319 62,530 78,261 83,895 84,110 94,116
Spirits Pre-mixed 46,058 47,788 50,063 34,762 34,834 35,484 31,003 31,229
Total Spirits 98,873 101,292 106,382 97,292 113,095 119,379 115,113 125,345
During 2012, the total supply of spirits increased by 9%. Standard spirits increased by 12% and pre-mixed spirits increased by 1%.
Department of Business 18

Northern Territory Wholesale Alcohol Supply – 2005 to 2012
Between 2005 and 2012, the total supply of spirits increased by 27%. Standard spirits exhibited an increasing trend of about 9% per year, while pre-mixed spirits decreased by 32% over the period.
Figure 17 Wholesale PAC Supply Spirits – Alice Springs
0
20,000
40,000
60,000
80,000
100,000
120,000
140,000
2005 2006 2007 2008 2009 2010 2011 2012
PAC
(Litr
e)
Total Spirits Spirits Standard Spirits Pre-mixed
Table 18 and Figure 18 show the wholesale PAC supply of beer in Alice Springs for the years 2005 to 2012.
Table 18 Wholesale PAC Supply Beer – Alice Springs2005 2006 2007 2008 2009 2010 2011 2012
Beer Full 149,819 155,286 208,189 194,065 200,039 189,620 181,586 163,929
Beer Mid 34,347 38,168 34,772 32,839 35,148 34,826 33,677 38,231
Beer Low 19,411 16,886 18,168 14,774 17,487 16,205 14,970 8,973
Total Beer 203,577 210,340 261,128 241,678 252,674 240,651 230,233 211,133
During 2012, the total supply of beer increased by 8%. Full-strength beer decreased by 10% and low-strength beer decreased by 40%, while mid-strength beer increased by 14%.
Between 2005 and 2012, the total supply of beer increased by 4%. Low-strength beer exhibited a decreasing trend of about 10% per year. Full-strength beer increased by 9% and mid-strength beer increased by 11% over the period.
Department of Business 19

Northern Territory Wholesale Alcohol Supply – 2005 to 2012
Figure 18 Wholesale PAC Supply Beer – Alice Springs
0
50,000
100,000
150,000
200,000
250,000
300,000
2005 2006 2007 2008 2009 2010 2011 2012
PAC
(Litr
e)
Total Beer Beer Full Beer Mid Beer Low
Department of Business 20

Northern Territory Wholesale Alcohol Supply – 2005 to 2012
KatherineTable 19 and Figure 19 show the wholesale PAC supply in Katherine for the years 2005 to 2012.
Table 19 Wholesale PAC Supply – Katherine2005 2006 2007 2008 2009 2010 2011 2012
Cider 1,788 1,899 1,441 1,960 2,649 2,788 3,412 4,254
Total Wine 73,071 74,482 66,562 31,439 32,220 33,679 29,231 29,866
Total Spirits 38,547 39,867 45,391 42,914 41,530 44,856 47,888 55,568
Total Beer 90,651 86,589 87,960 98,096 109,261 113,139 129,561 112,595
Total 204,057 202,837 201,354 174,409 185,659 194,462 210,092 202,283
During 2012, the total supply decreased by 4%, while the estimated drinking-age residential population increased by 3%. Cider increased by 25%, total wine increased by 2% and total spirits increased by 16%, while total beer decreased by 13%.
Between 2005 and 2012, the total supply decreased by 1%. Cider exhibited an increasing trend of about 13% per year, total spirits exhibited an increasing trend of about 5% per year and total beer exhibited an increasing trend of about 3% per year, while total wine exhibited a decreasing trend of about 12% per year.
Figure 19 Wholesale PAC Supply – Katherine
0
50,000
100,000
150,000
200,000
250,000
2005 2006 2007 2008 2009 2010 2011 2012
PAC
(Litr
e)
Total Total Wine Total Spirits Total Beer Cider
Department of Business 21
Northern Territory Wholesale Alcohol Supply – 2005 to 2012
Table 20 and Figure 20 show the wholesale PAC supply of wine in Katherine for the years 2005 to 2012.
Table 20 Wholesale PAC Supply Wine – Katherine2005 2006 2007 2008 2009 2010 2011 2012
Wine Cask 59,837 60,915 32,131 11,834 17,352 18,814 13,674 13,489
Wine Bottle 10,365 11,005 12,290 12,876 13,315 13,867 14,562 15,560
Wine Fortified 2,870 2,562 22,140 6,729 1,553 999 994 817
Total Wine 73,071 74,482 66,562 31,439 32,220 33,679 29,231 29,866
During 2012, the total supply of wine increased by 2%. Bottled wine increased by 7%, while cask wine decreased by 1% and fortified wine decreased by 18%.
Between 2005 and 2012, the total supply of wine decreased by 59%. Cask wine exhibited a decreasing trend of about 19% per year and fortified wine exhibited a decreasing trend of about 16% per year, while bottled wine exhibited an increasing trend of about 6% per year.
Figure 20 Wholesale PAC Supply Wine – Katherine
0
10,000
20,000
30,000
40,000
50,000
60,000
70,000
80,000
2005 2006 2007 2008 2009 2010 2011 2012
PAC
(Litr
e)
Total Wine Wine Cask Wine Bottle Wine Fortified
Table 21 and Figure 21 show the wholesale PAC supply of spirits in Katherine for the years 2005 to 2012.
Table 21 Wholesale PAC Supply Spirits – Katherine2005 2006 2007 2008 2009 2010 2011 2012
Spirits Standard 19,879 20,163 22,418 25,650 26,912 29,362 32,032 37,235
Spirits Pre-mixed 18,668 19,704 22,972 17,264 14,618 15,493 15,856 18,333
Total Spirits 38,547 39,867 45,391 42,914 41,530 44,856 47,888 55,568
During 2012, the total supply of spirits increased by 16%. Both standard spirits and pre-mixed spirits increased by 16%.
Department of Business 22

Northern Territory Wholesale Alcohol Supply – 2005 to 2012
Between 2005 and 2012, the total supply of spirits increased by 44%. Standard spirits exhibited an increasing trend of about 9% per year. Pre-mixed spirits decreased by 2% over the period.
Figure 21 Wholesale PAC Supply Spirits – Katherine
0
10,000
20,000
30,000
40,000
50,000
60,000
2005 2006 2007 2008 2009 2010 2011 2012
PAC
(Litr
e)
Total Spirits Spirits Standard Spirits Pre-mixed
Table 22 and Figure 22 show the wholesale PAC supply of beer in Katherine for the years 2005 to 2012.
Table 22 Wholesale PAC Supply Beer – Katherine2005 2006 2007 2008 2009 2010 2011 2012
Beer Full 53,297 50,493 49,309 59,985 67,855 67,331 78,651 67,115
Beer Mid 28,228 28,269 27,728 29,181 31,106 35,733 42,440 39,872
Beer Low 9,127 7,826 10,923 8,930 10,300 10,076 8,470 5,608
Total Beer 90,651 86,589 87,960 98,096 109,261 113,139 129,561 112,595
During 2012, the total supply of beer decreased by 13%. Full-strength beer decreased by 15%, mid-strength beer decreased by 6% and low-strength beer decreased by 34%.
Between 2005 and 2012, the total supply of beer increased by 24%. Full-strength beer increased by 26%, while low-strength beer decreased by 39% over the period. Mid-strength beer exhibited an increasing trend of about 5% per year.
Department of Business 23

Northern Territory Wholesale Alcohol Supply – 2005 to 2012
Figure 22 Wholesale PAC Supply Beer – Katherine
0
20,000
40,000
60,000
80,000
100,000
120,000
140,000
2005 2006 2007 2008 2009 2010 2011 2012
PAC
(Litr
e)
Total Beer Beer Full Beer Mid Beer Low
Department of Business 24

Northern Territory Wholesale Alcohol Supply – 2005 to 2012
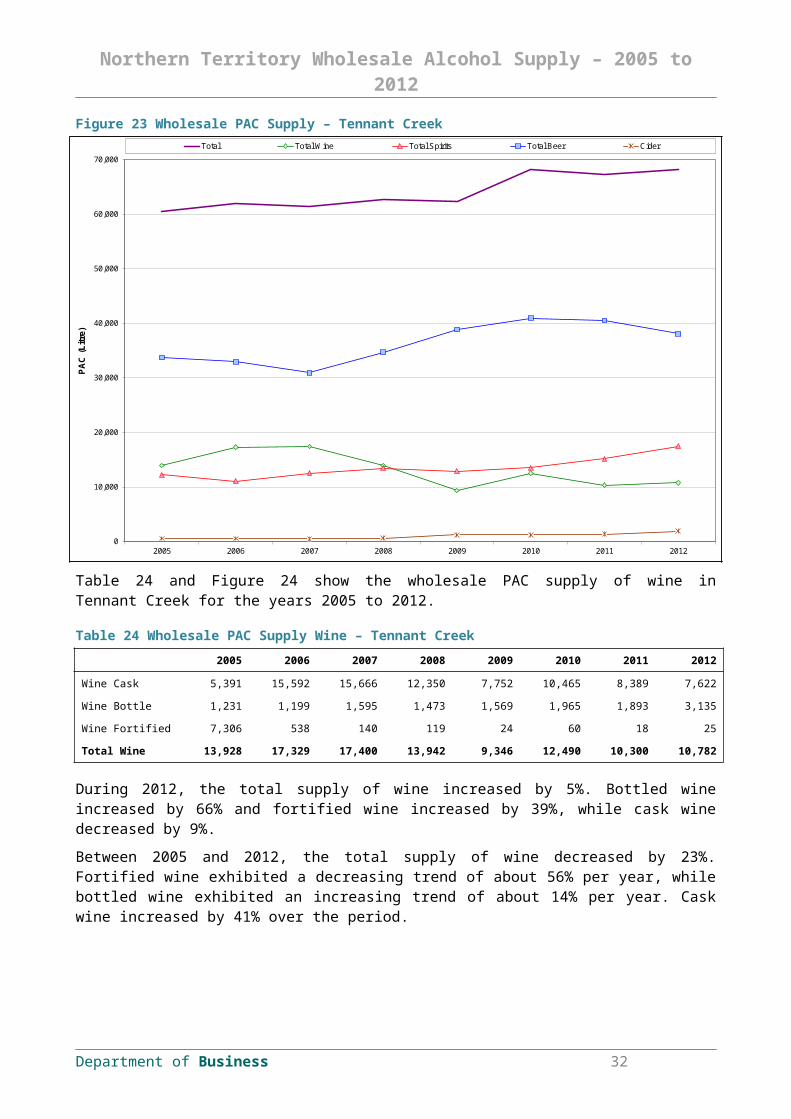
Tennant CreekTable 23 and Figure 23 show the wholesale PAC supply in Tennant Creek for the years 2005 to 2012.
Table 23 Wholesale PAC Supply – Tennant Creek2005 2006 2007 2008 2009 2010 2011 2012
Cider 565 564 529 645 1,231 1,270 1,354 1,893
Total Wine 13,928 17,329 17,400 13,942 9,346 12,490 10,300 10,782
Total Spirits 12,221 11,034 12,491 13,459 12,878 13,545 15,153 17,436
Total Beer 33,725 32,971 30,924 34,685 38,878 40,947 40,522 38,112
Total 60,439 61,897 61,345 62,731 62,333 68,252 67,330 68,222
During 2012, the total supply increased by 1%, while the estimated drinking-age residential population increased by 2%. Cider increased by 40%, total wine increased by 5% and total spirits increased by 15%, while total beer decreased by 6%.
Between 2005 and 2012, the total supply exhibited an increasing trend of about 2% per year. Cider exhibited an increasing trend of about 19% per year and total spirits exhibited an increasing trend of about 5% per year. Total wine decreased by 23%, while total beer increased by 13% over the period.
Figure 23 Wholesale PAC Supply – Tennant Creek
0
10,000
20,000
30,000
40,000
50,000
60,000
70,000
2005 2006 2007 2008 2009 2010 2011 2012
PAC
(Litr
e)
Total Total Wine Total Spirits Total Beer Cider
Department of Business 25

Northern Territory Wholesale Alcohol Supply – 2005 to 2012
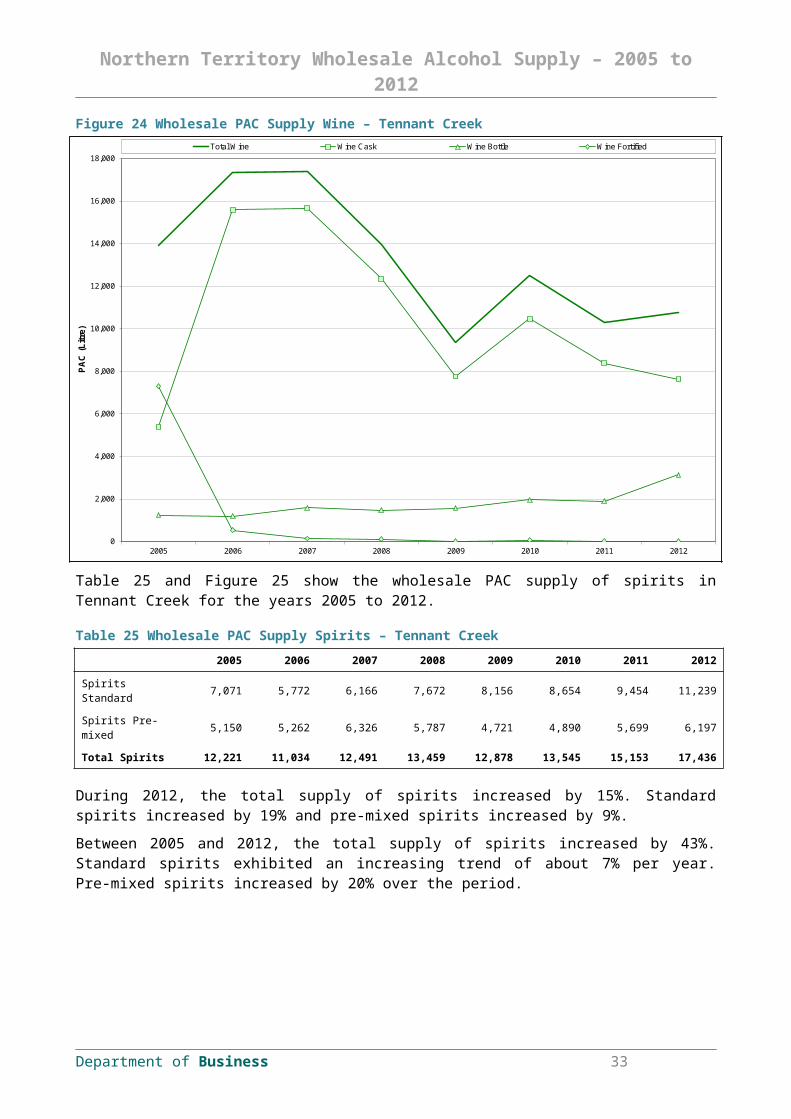
Table 24 and Figure 24 show the wholesale PAC supply of wine in Tennant Creek for the years 2005 to 2012.
Table 24 Wholesale PAC Supply Wine – Tennant Creek2005 2006 2007 2008 2009 2010 2011 2012
Wine Cask 5,391 15,592 15,666 12,350 7,752 10,465 8,389 7,622
Wine Bottle 1,231 1,199 1,595 1,473 1,569 1,965 1,893 3,135
Wine Fortified 7,306 538 140 119 24 60 18 25
Total Wine 13,928 17,329 17,400 13,942 9,346 12,490 10,300 10,782
During 2012, the total supply of wine increased by 5%. Bottled wine increased by 66% and fortified wine increased by 39%, while cask wine decreased by 9%.
Between 2005 and 2012, the total supply of wine decreased by 23%. Fortified wine exhibited a decreasing trend of about 56% per year, while bottled wine exhibited an increasing trend of about 14% per year. Cask wine increased by 41% over the period.
Figure 24 Wholesale PAC Supply Wine – Tennant Creek
0
2,000
4,000
6,000
8,000
10,000
12,000
14,000
16,000
18,000
2005 2006 2007 2008 2009 2010 2011 2012
PAC
(Litr
e)
Total Wine Wine Cask Wine Bottle Wine Fortified
Table 25 and Figure 25 show the wholesale PAC supply of spirits in Tennant Creek for the years 2005 to 2012.
Table 25 Wholesale PAC Supply Spirits – Tennant Creek2005 2006 2007 2008 2009 2010 2011 2012
Spirits Standard 7,071 5,772 6,166 7,672 8,156 8,654 9,454 11,239
Spirits Pre-mixed 5,150 5,262 6,326 5,787 4,721 4,890 5,699 6,197
Total Spirits 12,221 11,034 12,491 13,459 12,878 13,545 15,153 17,436
During 2012, the total supply of spirits increased by 15%. Standard spirits increased by 19% and pre-mixed spirits increased by 9%.
Department of Business 26

Northern Territory Wholesale Alcohol Supply – 2005 to 2012
Between 2005 and 2012, the total supply of spirits increased by 43%. Standard spirits exhibited an increasing trend of about 7% per year. Pre-mixed spirits increased by 20% over the period.
Figure 25 Wholesale PAC Supply Spirits – Tennant Creek
0
2,000
4,000
6,000
8,000
10,000
12,000
14,000
16,000
18,000
2005 2006 2007 2008 2009 2010 2011 2012
PAC
(Litr
e)
Total Spirits Spirits Standard Spirits Pre-mixed
Table 26 and Figure 26 show the wholesale PAC supply of beer in Tennant Creek for the years 2005 to 2012.
Table 26 Wholesale PAC Supply Beer – Tennant Creek2005 2006 2007 2008 2009 2010 2011 2012
Beer Full 22,856 22,195 21,695 24,435 28,590 30,273 30,779 28,600
Beer Mid 7,570 7,965 6,466 7,192 7,009 8,050 7,338 8,028
Beer Low 3,299 2,811 2,763 3,058 3,280 2,625 2,405 1,483
Total Beer 33,725 32,971 30,924 34,685 38,878 40,947 40,522 38,112
During 2012, the total supply of beer decreased by 6%. Full-strength beer decreased by 7% and low-strength beer decreased by 38%, while mid-strength beer increased by 9%.
Between 2005 and 2012, the total supply of beer increased by 13%. Low-strength beer exhibited a decreasing trend of about 11% per year, while full-strength beer exhibited an increasing trend of about 3% per year. Mid-strength beer increased by 6% over the period.
Department of Business 27

Northern Territory Wholesale Alcohol Supply – 2005 to 2012
Figure 26 Wholesale PAC Supply Beer – Tennant Creek
0
5,000
10,000
15,000
20,000
25,000
30,000
35,000
40,000
45,000
2005 2006 2007 2008 2009 2010 2011 2012
PAC
(Litr
e)
Total Beer Beer Full Beer Mid Beer Low
Department of Business 28

Northern Territory Wholesale Alcohol Supply – 2005 to 2012
NhulunbuyTable 27 and Figure 27 show the wholesale PAC supply in Nhulunbuy for the years 2005 to 2012.
Table 27 Wholesale PAC Supply – Nhulunbuy2005 2006 2007 2008 2009 2010 2011 2012
Cider 1,010 1,169 940 983 972 940 1,268 1,903
Total Wine 24,126 18,458 16,955 10,125 7,674 8,763 8,038 7,955
Total Spirits 25,724 30,687 31,386 23,192 18,336 19,053 19,687 18,631
Total Beer 43,402 52,208 49,137 46,014 38,707 39,367 38,100 34,410
Total 94,262 102,522 98,417 80,314 65,689 68,122 67,093 62,898
During 2012, the total supply decreased by 6%, while the estimated drinking-age residential population remained relatively steady. Total wine decreased by 1%, total spirits decreased by 5% and total beer decreased by 10% while cider increased by 50%.
Between 2005 and 2012, the total supply exhibited a decreasing trend of about 6% per year. Total wine exhibited a decreasing trend of about 15% per year and total beer exhibited a decreasing trend of about 3% per year. Total spirits decreased by 28% while cider increased by 88% over the period.
Figure 27 Wholesale PAC Supply – Nhulunbuy
0
20,000
40,000
60,000
80,000
100,000
120,000
2005 2006 2007 2008 2009 2010 2011 2012
PAC
(Litr
e)
Total Total Wine Total Spirits Total Beer Cider
Department of Business 29

Northern Territory Wholesale Alcohol Supply – 2005 to 2012
Table 28 and Figure 28 show the wholesale PAC supply of wine in Nhulunbuy for the years 2005 to 2012.
Table 28 Wholesale PAC Supply Wine – Nhulunbuy2005 2006 2007 2008 2009 2010 2011 2012
Wine Cask 17,686 9,566 1,685 756 657 673 1,053 1,044
Wine Bottle 5,930 6,883 8,032 7,180 6,685 7,685 6,788 6,710
Wine Fortified 511 2,009 7,238 2,189 332 405 197 201
Total Wine 24,126 18,458 16,955 10,125 7,674 8,763 8,038 7,955
During 2012, the total supply of wine decreased by 1%. Bottled wine decreased by 1% and cask wine decreased by 1%, while fortified wine increased by 2%.
Between 2005 and 2012, the total supply of wine decreased by 67% over the period. Fortified wine decreased by 61% and cask wine decreased by 94%, while bottled wine increased by 13% over the period.
Figure 28 Wholesale PAC Supply Wine – Nhulunbuy
0
5,000
10,000
15,000
20,000
25,000
2005 2006 2007 2008 2009 2010 2011 2012
PAC
(Litr
e)
Total Wine Wine Cask Wine Bottle Wine Fortified
Table 29 and Figure 29 show the wholesale PAC supply of spirits in Nhulunbuy for the years 2005 to 2012.
Table 29 Wholesale PAC Supply Spirits – Nhulunbuy2005 2006 2007 2008 2009 2010 2011 2012
Spirits Standard 13,689 16,111 17,544 16,231 13,561 13,546 13,987 12,863
Spirits Pre-mixed 12,035 14,576 13,842 6,961 4,775 5,507 5,700 5,767
Total Spirits 25,724 30,687 31,386 23,192 18,336 19,053 19,687 18,631
During 2012, the total supply of spirits decreased by 5%. Standard spirits decreased by 8% while pre-mixed spirits increased by 1%.
Department of Business 30

Northern Territory Wholesale Alcohol Supply – 2005 to 2012
Between 2005 and 2012, the total supply of spirits decreased by 28%. Standard spirits decreased by 6% and pre-mixed spirits decreased by 52% over the period.
Figure 29 Wholesale PAC Supply Spirits – Nhulunbuy
0
5,000
10,000
15,000
20,000
25,000
30,000
35,000
2005 2006 2007 2008 2009 2010 2011 2012
PAC
(Litr
e)
Total Spirits Spirits Standard Spirits Pre-mixed
Table 30 and Figure 30 show the wholesale PAC supply of beer in Nhulunbuy for the years 2005 to 2012.
Table 30 Wholesale PAC Supply Beer – Nhulunbuy2005 2006 2007 2008 2009 2010 2011 2012
Beer Full 26,220 33,833 32,280 30,895 26,564 27,272 26,387 23,669
Beer Mid 14,432 16,283 14,007 12,614 9,486 9,461 9,305 9,303
Beer Low 2,750 2,092 2,850 2,505 2,657 2,634 2,408 1,439
Total Beer 43,402 52,208 49,137 46,014 38,707 39,367 38,100 34,410
During 2012, the total supply of beer decreased by 10%. Full-strength beer decreased by 10% and low-strength beer decreased by 40%, while mid-strength beer remained relatively steady.
Between 2005 and 2012, the total supply of beer exhibited a decreasing trend of about 3% per year. Mid-strength beer exhibited a decreasing trend of about 6% per year. Full-strength beer decreased by 10% and low-strength beer decreased by 48% over the period.
Department of Business 31
Northern Territory Wholesale Alcohol Supply – 2005 to 2012
Figure 30 Wholesale PAC Supply Beer – Nhulunbuy
0
10,000
20,000
30,000
40,000
50,000
60,000
2005 2006 2007 2008 2009 2010 2011 2012
PAC
(Litr
e)
Total Beer Beer Full Beer Mid Beer Low
Department of Business 32
Northern Territory Wholesale Alcohol Supply – 2005 to 2012
NT BalanceTable 31 and Figure 31 show the wholesale PAC supply in NT Balance for the years 2005 to 2012.
Table 31 Wholesale PAC Supply – NT Balance2005 2006 2007 2008 2009 2010 2011 2012
Cider 13,460 10,752 9,471 11,496 13,373 14,093 15,222 17,405
Total Wine 57,076 63,042 76,650 72,241 66,480 63,095 54,361 54,091
Total Spirits 90,082 96,651 106,851 106,245 99,517 97,170 96,821 105,369
Total Beer 282,108 295,941 288,319 293,680 286,061 268,601 258,293 266,685
Total 442,727 466,387 481,290 483,662 465,432 442,959 424,697 443,550
During 2012, the total supply increased by 4%, while the estimated drinking-age residential population increased by 3%. Cider increased by 14%, total spirits increased by 9% and total beer increased by 3%, while total wine remained relatively steady.
Between 2005 and 2012, the total supply remained relatively steady. Cider exhibited an increasing trend of about 4% per year while total beer exhibited a decreasing trend of about 1% per year. Total wine decreased by 5% while total spirits increased by 17% over the period.
Figure 31 Wholesale PAC Supply – NT Balance
0
100,000
200,000
300,000
400,000
500,000
2005 2006 2007 2008 2009 2010 2011 2012
PAC
(Litr
e)
Total Total Wine Total Spirits Total Beer Cider
Department of Business 33

Northern Territory Wholesale Alcohol Supply – 2005 to 2012
Table 32 and Figure 32 show the wholesale PAC supply of wine in NT Balance for the years 2005 to 2012.
Table 32 Wholesale PAC Supply Wine – NT Balance2005 2006 2007 2008 2009 2010 2011 2012
Wine Cask 31,331 33,855 36,881 30,361 26,378 23,278 14,297 14,220
Wine Bottle 21,556 25,378 35,570 37,760 36,245 36,393 38,052 36,656
Wine Fortified 4,190 3,810 4,199 4,120 3,857 3,423 2,011 3,215
Total Wine 57,076 63,042 76,650 72,241 66,480 63,095 54,361 54,091
During 2012, the total supply of wine remained relatively steady. Cask wine decreased by 1% and bottled wine decreased by 4%, while fortified wine increased by 60%.
Between 2005 and 2012, the total supply of wine decreased by 5%. Cask wine exhibited a decreasing trend of about 11% per year and fortified wine exhibited a decreasing trend of about 4% per year, while bottled wine exhibited an increasing trend of about 8% per year.
Figure 32 Wholesale PAC Supply Wine – NT Balance
0
10,000
20,000
30,000
40,000
50,000
60,000
70,000
80,000
2005 2006 2007 2008 2009 2010 2011 2012
PAC
(Litr
e)
Total Wine Wine Cask Wine Bottle Wine Fortified
Table 33 and Figure 33 show the wholesale PAC supply of spirits in NT Balance for the years 2005 to 2012.
Table 33 Wholesale PAC Supply Spirits – NT Balance2005 2006 2007 2008 2009 2010 2011 2012
Spirits Standard 45,800 46,627 50,043 59,227 57,225 54,931 55,747 60,373
Spirits Pre-mixed 44,282 50,025 56,808 47,018 42,292 42,239 41,074 44,996
Total Spirits 90,082 96,651 106,851 106,245 99,517 97,170 96,821 105,369
During 2012, the total supply of spirits increased by 9%. Standard spirits increased by 8% and pre-mixed spirits increased by 10%.
Department of Business 34

Northern Territory Wholesale Alcohol Supply – 2005 to 2012
Between 2005 and 2012, the total supply of spirits increased by 17%. Standard spirits exhibited an increasing trend of about 4% per year. Pre-mixed spirits increased by 2% over the period.
Figure 33 Wholesale PAC Supply Spirits – NT Balance
0
20,000
40,000
60,000
80,000
100,000
120,000
2005 2006 2007 2008 2009 2010 2011 2012
PAC
(Litr
e)
Total Spirits Spirits Standard Spirits Pre-mixed
Table 34 and Figure 34 show the wholesale PAC supply of beer in NT Balance for the years 2005 to 2012.
Table 34 Wholesale PAC Supply Beer – NT Balance2005 2006 2007 2008 2009 2010 2011 2012
Beer Full 201,708 204,114 170,781 169,310 165,464 152,926 150,083 147,176
Beer Mid 54,974 69,857 91,769 98,428 85,076 87,563 84,035 101,796
Beer Low 25,426 21,970 25,769 25,941 35,521 28,112 24,176 17,712
Total Beer 282,108 295,941 288,319 293,680 286,061 268,601 258,293 266,685
During 2012, the total supply of beer increased by 3%. Full-strength beer decreased by 2% and low-strength beer decreased by 27%, while mid-strength beer increased by 21%.
Between 2005 and 2012, the total supply of beer decreased by 5% over the period. Full-strength beer exhibited a decreasing trend of about 4% per year. Mid-strength beer increased by 85%, while low-strength beer decreased by 30% over the period.
Department of Business 35

Northern Territory Wholesale Alcohol Supply – 2005 to 2012
Figure 34 Wholesale PAC Supply Beer – NT Balance
0
50,000
100,000
150,000
200,000
250,000
300,000
2005 2006 2007 2008 2009 2010 2011 2012
PAC
(Litr
e)
Total Beer Beer Full Beer Mid Beer Low
Department of Business 36