1 american library association ala finances 101 financial handout operating agreement, indirect...
TRANSCRIPT
1
American Library AssociationAmerican Library Association
ALA Finances 101 Financial Handout Operating Agreement,
Indirect Costs and Budget Guidelines

2
Operating AgreementOperating Agreement
History/Background – why is it needed? Relationship between the General Fund
and the Divisions (Policy 6.4.1) – see attached
Composite rate formula Services provided at no charge Services provided as a direct charge Non-overhead assessed revenues Overhead assessed revenues

3
Operating Agreement Relationship

4
OPERATING AGREEMENT HIGHLIGHTS
• Created over a two year period in the late 1980’s. Adopted in 1989 with a five year phase in period.
• Defines the relationship between divisions and core (administrative) structure of ALA.
• Reviewed annually at the Division/BARC Leadership meeting.
• Preamble:- Statement of purpose and values outlines the unique structure of ALA ie “one association with indivisible assets and a single set of uniform procedures.”
- Home of 11 Divisions and other units, “The nature of the relationship among the ALA units is a dynamic one, demanding collaboration and a willingness to work together.”
• Defines the financial responsibility between ALA and the Divisions.

5
OPERATING AGREEMENT HIGHLIGHTS
• The agreement provides a cooperative framework in which questions of organizational relationship can be addressed and resolved.
• Guiding Principles
- Shared values of unity, diversity, authority (delegated to individual Divisions) autonomy and collaboration/cooperation.
- Divisions assume financial responsibility for staff and programs, including some indirect costs for Division activities and services provided by ALA.
continued
- ALA will provide general administrative, financial, membership, publishing services to the Divisions.

6
OPERATING AGREEMENT SERVICES FUNDED BY THE GENERAL FUND AT NO
DIRECT CHARGE TO DIVISIONS
• Publishing - Rights and Permissions, copyright services and other specialized services.
• Finance/Accounting - Preparation of monthly budget reports, management of annual budgeting cycle, planning/budgeting support, credit & collections and annual audit.• OIF, Washington Office/OITP/OGR, OLOS, HRDR, OR, Executive Office, Diversity Office, Governance and IRO

7
OPERATING AGREEMENTDETERMINED OVERHEAD CHARGES
Overhead will not be assessed on revenues from:
• Division Dues
• Division Donations• Interest Income Earned by Divisions• ALA Royalties to Divisions• Travel Expense Reimbursement from Outside
Organizations• Separately-Ticketed Events at Conference (Tours and
Meal Functions)• Advertising in Publications Provided to Division Members
as part of Membership
8
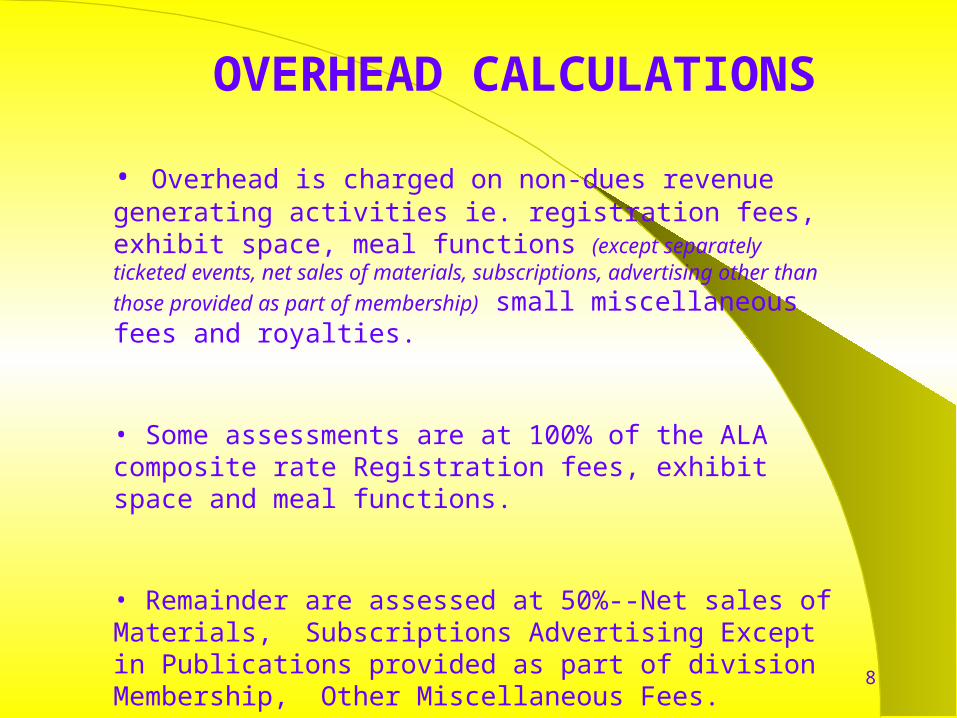
OVERHEAD CALCULATIONS
• Overhead is charged on non-dues revenue generating activities ie. registration fees, exhibit space, meal functions (except separately ticketed events, net sales of materials, subscriptions, advertising other than those provided as part of membership) small miscellaneous fees and royalties.
• Some assessments are at 100% of the ALA composite rate Registration fees, exhibit space and meal functions.
• Remainder are assessed at 50%--Net sales of Materials, Subscriptions Advertising Except in Publications provided as part of division Membership, Other Miscellaneous Fees.

10
OPERATING AGREEMENT HIGHLIGHTS
• Management Practicescontinued
- Interpretations of the Operating Agreement that guide the application of the Agreement. Provides for flexibility when new initiatives are proposed or services developed.
- Planners recognized that to support the diversity of needs and services within ALA and to membership and recognizing that Small Divisions do not have a sufficient membership base, the operating agreement provides for a supplement to support Small Divisions.
• Small Division Support

11
INDIRECT COST RATE FORMULA
Indirect Costs
Conferences + Graphics + Publishing + American Libraries
==Revenues
Conferences + Graphics + Publishing + American Libraries
Rate

12
VIII. Indirect Costs and StudyVIII. Indirect Costs and Study
Fact sheet Formula Allocation methods Process Division results Indirect cost rate history Divisions – Ten things to know
and love

13
INDIRECT COST RATE FORMULA
Indirect Costs
Conferences + Graphics + Publishing + American Libraries
==Revenues
Conferences + Graphics + Publishing + American Libraries
Rate

14
Allocation MethodsAllocation Methods
Sherri Vanyek
ITTS
# of phone lines, # of PC’s, # of phones, # of financial transactions
Cynthia Vivian
Human Resources Table of Positions ie # of Full Time Equivalent Employees
Cathleen Bourdon
Communications Membership Statistics
Al Campanio
Staff Support Assigned Square Footage inBuilding/Maintenance
Mark Gould
PIO Allocation of PIO Usage
Karen Muller
Library Allocation of Library Usage

15
Four Step ProcessFour Step Process(Flow Chart on Next Slide)
Allocate total ALA expenses across all units & activities
Update allocation methodologies & apply to indirect cost centers
Determine direct/indirect cost incurred by indirect cost centers (16) after methodology applied – See excel Human Resources example and excel “fully direct/indirect” sheets
Allocate indirect costs to indirect cost formula as required by Operating Agreement – Excel Formula detail sheet and Page 22

16
Flow ChartFlow ChartHuman Resources
Total direct expenses captured across all unitsHR = $587,863
Direct/Indirect costs for support units allocated to all units
Indirect cost allocated to support units based on methodologies
I/D + D = $587,863 + $111,507 =$699,370
Composite indirect cost rate determined22.6%
See excel worksheet“expense allocation”
See excel worksheet“fully allocated direct
indirect costs”
See excel worksheet“sample indirect costcenter” HR allocated
based on FTE’s
See excel worksheet“formula detail”
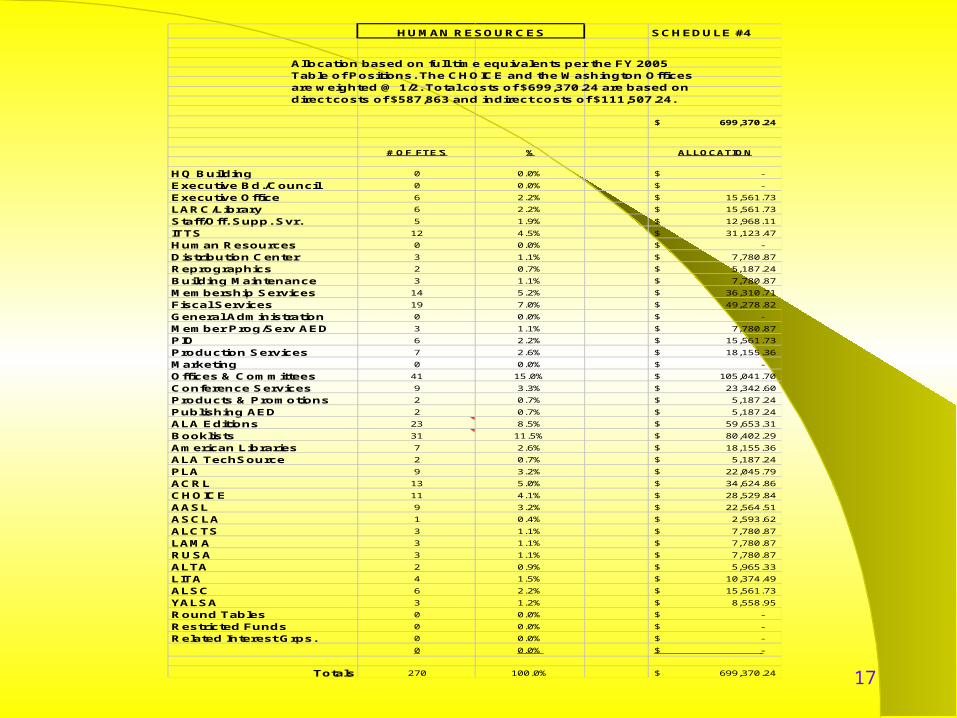
17
SCHEDULE #4
699,370.24$
# OF FTE'S % ALLOCATION
HQ Building 0 0.0% -$
Executive Bd./Council 0 0.0% -$
Executive Office 6 2.2% 15,561.73$
LARC/Library 6 2.2% 15,561.73$
Staff/Off. Supp. Svr. 5 1.9% 12,968.11$
ITTS 12 4.5% 31,123.47$
Human Resources 0 0.0% -$
Distribution Center 3 1.1% 7,780.87$
Reprographics 2 0.7% 5,187.24$
Building Maintenance 3 1.1% 7,780.87$
Membership Services 14 5.2% 36,310.71$
Fiscal Services 19 7.0% 49,278.82$
General Administration 0 0.0% -$
Member Prog/Serv AED 3 1.1% 7,780.87$
PIO 6 2.2% 15,561.73$
Production Services 7 2.6% 18,155.36$
Marketing 0 0.0% -$
Offices & Committees 41 15.0% 105,041.70$
Conference Services 9 3.3% 23,342.60$
Products & Promotions 2 0.7% 5,187.24$
Publishing AED 2 0.7% 5,187.24$
ALA Editions 23 8.5% 59,653.31$
Booklists 31 11.5% 80,402.29$
American Libraries 7 2.6% 18,155.36$
ALA TechSource 2 0.7% 5,187.24$
PLA 9 3.2% 22,045.79$
ACRL 13 5.0% 34,624.86$
CHOICE 11 4.1% 28,529.84$
AASL 9 3.2% 22,564.51$
ASCLA 1 0.4% 2,593.62$
ALCTS 3 1.1% 7,780.87$
LAMA 3 1.1% 7,780.87$
RUSA 3 1.1% 7,780.87$
ALTA 2 0.9% 5,965.33$
LITA 4 1.5% 10,374.49$
ALSC 6 2.2% 15,561.73$
YALSA 3 1.2% 8,558.95$
Round Tables 0 0.0% -$
Restricted Funds 0 0.0% -$
Related Interest Grps. 0 0.0% -$
0 0.0% -$
Totals 270 100.0% 699,370.24$
HUMAN RESOURCES
Allocation based on full time equivalents per the FY 2005 Table of Positions. The CHOICE and the Washington Offices are weighted @ 1/2. Total costs of $699,370.24 are based on direct costs of $587,863 and indirect costs of $111,507.24.

18
General Fund Support to Divisions 2006
Overhead Small Division General Fund
Unit Indirect Costs Paid Support Support
PLA 963,371.59$ 690,862$ 272,510$ ACRL 874,480.13$ 121,683$ 752,797$ CHOICE 469,474.98$ 311,875$ 157,600$ AASL 592,219.57$ 348,604$ 243,616$ ASCLA 101,919.45$ 1,792$ 56,154$ 156,281$ ALCTS 243,248.05$ 33,972$ 209,276$ LAMA 211,013.61$ 15,796$ 195,218$ RUSA 206,821.44$ 16,038$ 190,783$ ALTA 84,600.52$ 164$ 85,961$ 170,398$ LITA 223,141.39$ 37,641$ 185,500$ ALSC 398,897.09$ 82,364$ 316,533$ YALSA 249,766.75$ 14,658$ -$ 235,109$
Total 4,618,954.56$ 1,675,449$ 142,115$ 3,085,621$
19
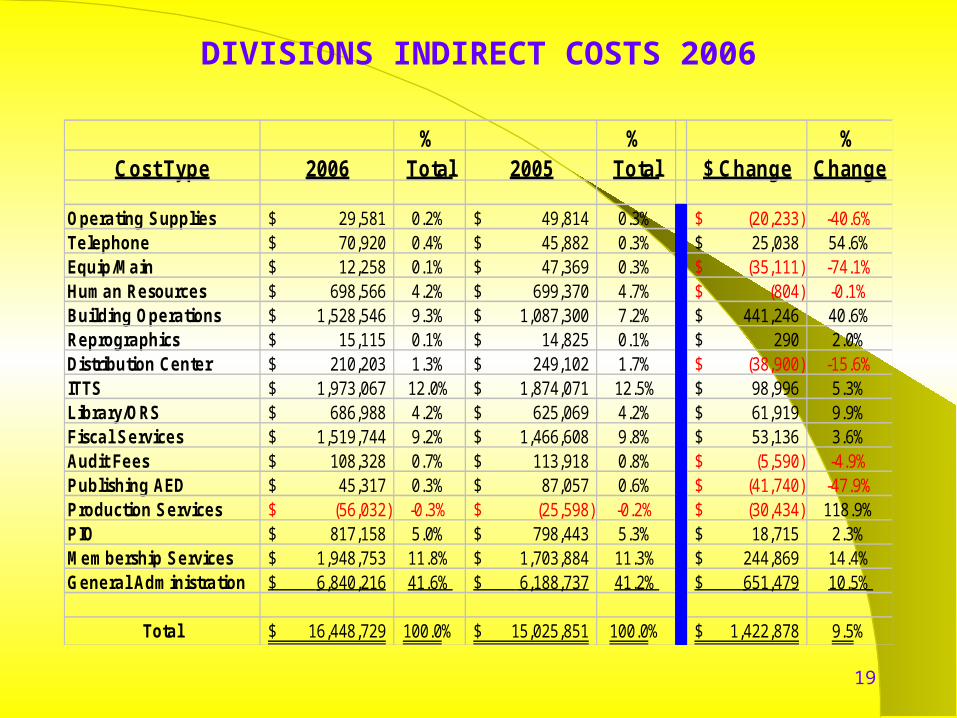
DIVISIONS INDIRECT COSTS 2006
% % %Cost Type 2006 Total 2005 Total $ Change Change
Operating Supplies 29,581$ 0.2% 49,814$ 0.3% (20,233)$ -40.6%Telephone 70,920$ 0.4% 45,882$ 0.3% 25,038$ 54.6%Equip/Main 12,258$ 0.1% 47,369$ 0.3% (35,111)$ -74.1%Human Resources 698,566$ 4.2% 699,370$ 4.7% (804)$ -0.1%Building Operations 1,528,546$ 9.3% 1,087,300$ 7.2% 441,246$ 40.6%Reprographics 15,115$ 0.1% 14,825$ 0.1% 290$ 2.0%Distribution Center 210,203$ 1.3% 249,102$ 1.7% (38,900)$ -15.6%ITTS 1,973,067$ 12.0% 1,874,071$ 12.5% 98,996$ 5.3%Library/ORS 686,988$ 4.2% 625,069$ 4.2% 61,919$ 9.9%Fiscal Services 1,519,744$ 9.2% 1,466,608$ 9.8% 53,136$ 3.6%Audit Fees 108,328$ 0.7% 113,918$ 0.8% (5,590)$ -4.9%Publishing AED 45,317$ 0.3% 87,057$ 0.6% (41,740)$ -47.9%Production Services (56,032)$ -0.3% (25,598)$ -0.2% (30,434)$ 118.9%PIO 817,158$ 5.0% 798,443$ 5.3% 18,715$ 2.3%Membership Services 1,948,753$ 11.8% 1,703,884$ 11.3% 244,869$ 14.4%General Administration 6,840,216$ 41.6% 6,188,737$ 41.2% 651,479$ 10.5%
Total 16,448,729$ 100.0% 15,025,851$ 100.0% 1,422,878$ 9.5%

20
DIVISIONS INDIRECT COSTS 2006
% % $ % Indirect Indirect 2006 Total 2005 Total Change Change Revenue Costs Rate
UnitPLA 963,371.59$ 20.9% 634,315.14$ 14.8% 329,056.45$ 51.9% 4,095,274$ 963,371.59$ 23.5%ACRL 874,480.13$ 18.9% 912,060.90$ 21.3% (37,580.77)$ -4.1% 2,011,553$ 874,480.13$ 43.5%CHOICE 469,474.98$ 10.2% 461,962.23$ 10.8% 7,512.75$ 1.6% 2,823,271$ 469,474.98$ 16.6%AASL 592,219.57$ 12.8% 570,579.58$ 13.3% 21,639.99$ 3.8% 2,216,846$ 592,219.57$ 26.7%ASCLA 101,919.45$ 2.2% 83,578.96$ 1.9% 18,340.49$ 21.9% 65,222$ 101,919.45$ 156.3%ALCTS 243,248.05$ 5.3% 231,223.69$ 5.4% 12,024.36$ 5.2% 493,514$ 243,248.05$ 49.3%LAMA 211,013.61$ 4.6% 238,827.55$ 5.6% (27,813.94)$ -11.6% 340,613$ 211,013.61$ 62.0%RUSA 206,821.44$ 4.5% 216,345.91$ 5.0% (9,524.47)$ -4.4% 431,447$ 206,821.44$ 47.9%ALTA 84,600.52$ 1.8% 107,788.58$ 2.5% (23,188.06)$ -21.5% 68,850$ 84,600.52$ 122.9%LITA 223,141.39$ 4.8% 240,513.30$ 5.6% (17,371.91)$ -7.2% 510,402$ 223,141.39$ 43.7%ALSC 398,897.09$ 8.6% 375,503.47$ 8.8% 23,393.62$ 6.2% 991,881$ 398,897.09$ 40.2%YALSA 249,766.75$ 5.4% 214,157.45$ 5.0% 35,609.30$ 16.6% 372,572$ 249,766.75$ 67.0%
Total 4,618,954.56$ 100.0% 4,286,856.76$ 100.0% 332,097.80$ 7.7% 14,421,445$ 4,618,954.56$ 32.0%

21
INDIRECT COST SUMMARY 2002 - 2006
FY06
FY05
FY04
FY03
FY02
$16,449,000
15,026,000
15,420,000
14,094,000
15,865,000
$4,619,000
4,287,000
4,680,000
4,447,000
4,784,000
28.1%
28.5%
30.3%
31.8%
30.2%
$1,676,000
950,000
1,359,000
801,000
1,169,000
$142,000
136,000
240,000
230,000
230,000
$3,086,000
3,473,000
3,566,000
3,876,000
3,845,000
Total Indirect Costs
Division Indirect Costs
% of Total
Total Indirect
Costs Paid
Small Division Support
Net General Fund
Support
0
5,000,000
10,000,000
15,000,000
20,000,000
Total Ind. Cst. Div. Ind. Cst. Div. Ind.Cst. Pd. Gen. Fund Sup. Small Div. Support
FY06 FY05 FY04 FY03 FY02

22
American
Conferences Graphics Publishing Libraries
Indirect Cost $1,557,459 $400,910 $2,230,663 $355,501 $4,544,533Revenue $8,106,316 $1,855,601 $9,016,038 $1,131,745 $20,109,700
Unit Rate 19.2% 21.6% 24.7% 31.4% 22.6%
Revenue per $ Indirect Cost $5.20 $4.63 $4.04 $3.18 $4.43
American
Conferences Graphics Publishing Libraries
Indirect Cost $1,556,381 $370,381 $2,002,708 $371,771 $4,301,241Revenue $8,018,918 $1,949,416 $8,923,740 $1,136,039 $20,028,113
Unit Rate 19.4% 19.0% 22.4% 32.7% 21.5%
Revenue per $ Indirect Cost $5.15 $5.26 $4.46 $3.06 $4.66
2005 2006Indirect Cost $4,286,857 $4,618,955
Revenue $11,639,576 $14,421,445
Revenue per $ Indirect Cost $2.72 $3.12
2005 2006Indirect Cost $14,408,610 $15,712,832
Revenue $38,556,819 $41,485,114
Revenue per $ Indirect Cost $2.68 $2.64
Previous Rate = 23.1% Current Rate = 23.9%2005
*Indirect Cos ts for Conferences+Graphics+Publishing+Am er.Lib./Revenues for Conferences+Graphics+Publishing+Am er.Lib.
**Division Indirect Costs/Division Revenues***Total ALA Indirect costs (less Restricted Fund and affiliates)/Total ALA Operating Revenues. Total operating revenueis defined as General Fund ($26,713,644), Divisions ($14,421,445), Round Tables ($350,025) and Plant Fund ($0).
Exhibit I
37.4%
TOTAL ALA COMPOSITE RATE***
=
+ +
+ +
37.9%
Publishing Deprtment
=
+
+ 22.6%
=
=
=
32.0%= 36.8%
Fiscal Year 2006
Fiscal Year 2005
=
=
=
=
=
DIVISION COMPOSITE RATE**
COMPOSITE RATE*
NEH RATE
Overall
Composite
Rate
Overall
Composite
Rate
=
21.5%

23
INDIRECT COST RATE HISTORY
Study
Rate
Budget Year Applied
20062005200420032002200120001999199819971996
22.6%21.5%21.8%18.8%20.3%19.6%18.9%18.5%18.0%16.5%16.7%
20082007200620052004200320022001200019991998