1 epidemiology update spf-sig advisory council september 2014 elizabeth eustis turf, ph.d
TRANSCRIPT
1
Epidemiology UpdateSPF-SIG Advisory Council
September 2014
Elizabeth Eustis Turf, Ph.D.
2
Outcomes-Based Prevention
Use of data to identify high levels of a substance-related consequence – AKA Outcome
Our outcome is MVCs with drinking drivers within the 15-24 year age range
All locations identified18-24 year olds as target Change in level of outcome over time
determines success of prevention activities
3
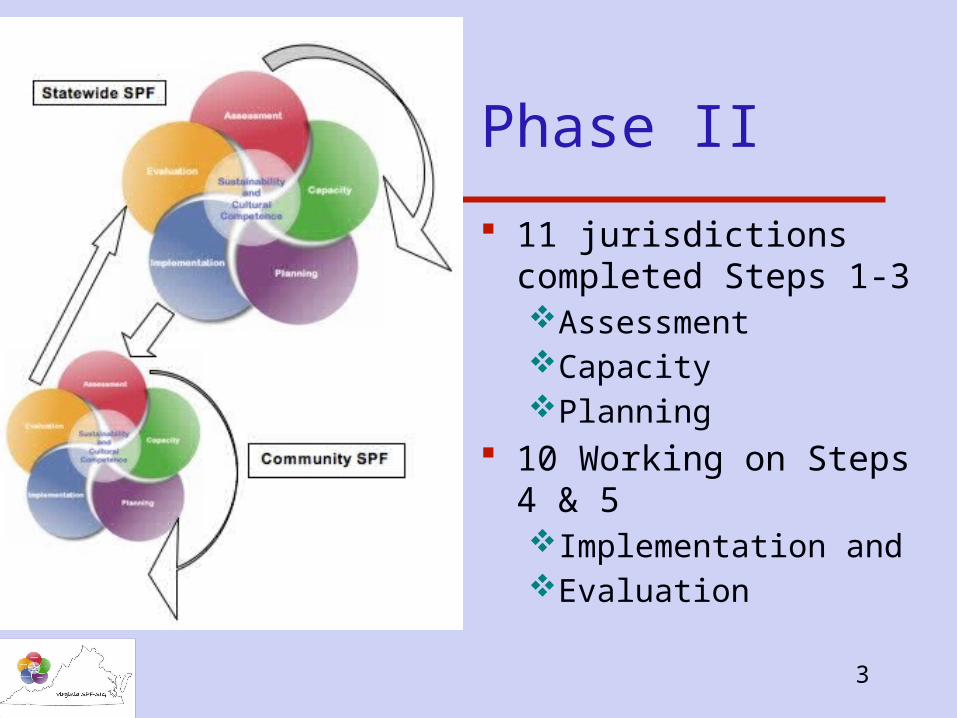
Phase II
11 jurisdictions completed Steps 1-3AssessmentCapacityPlanning
10 Working on Steps 4 & 5Implementation andEvaluation
4
Group 2
Hampton Newport News Montgomery County Stafford Spotsylvania
5
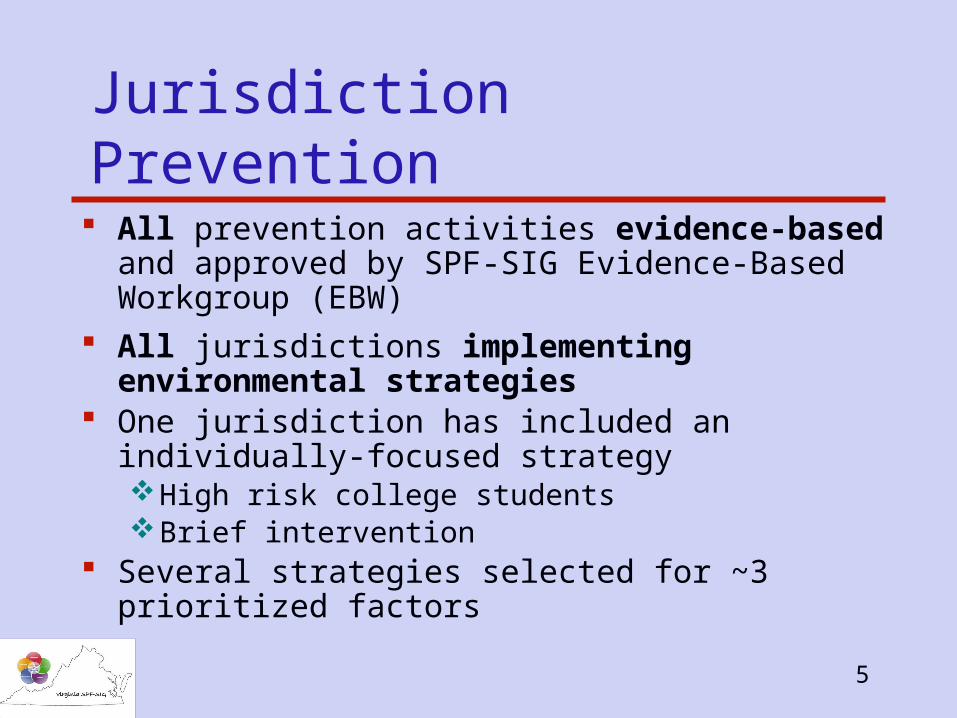
Jurisdiction Prevention
All prevention activities evidence-based and approved by SPF-SIG Evidence-Based Workgroup (EBW)
All jurisdictions implementing environmental strategies
One jurisdiction has included an individually-focused strategyHigh risk college studentsBrief intervention
Several strategies selected for ~3 prioritized factors
6
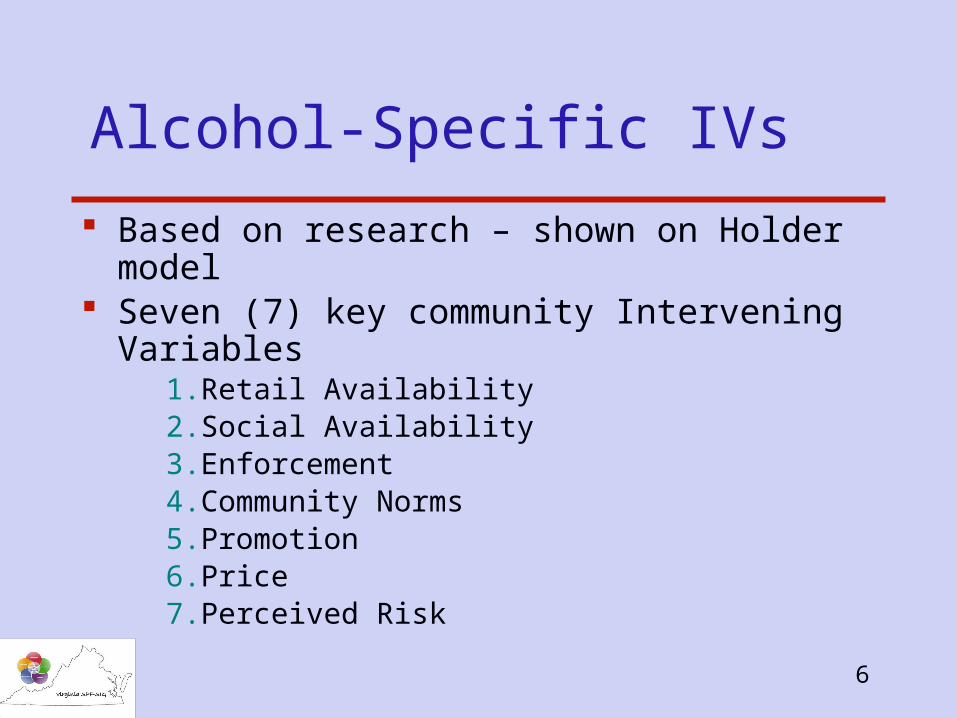
Alcohol-Specific IVs
Based on research – shown on Holder model Seven (7) key community Intervening Variables
1. Retail Availability2. Social Availability3. Enforcement4. Community Norms 5. Promotion 6. Price7. Perceived Risk
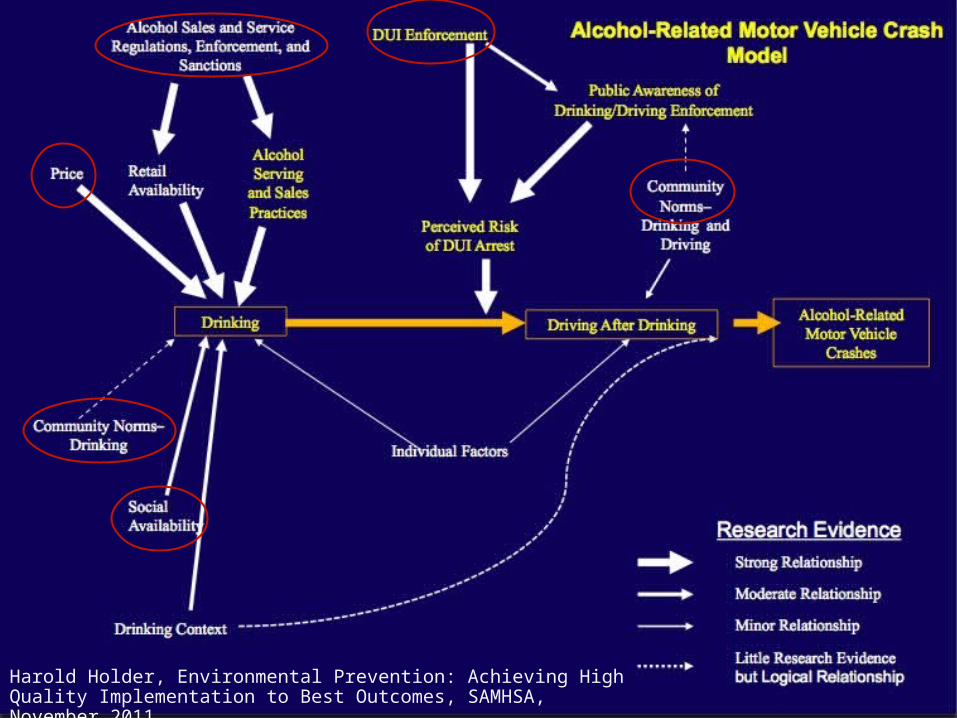
7Harold Holder, Environmental Prevention: Achieving High Quality Implementation to Best Outcomes, SAMHSA, November 2011
8
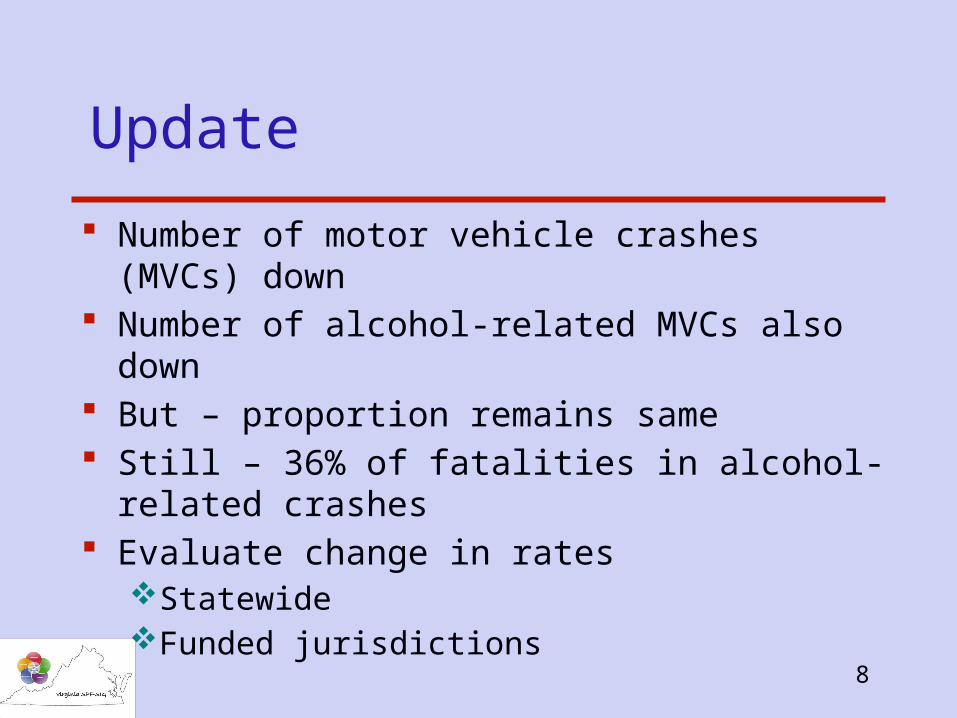
Update
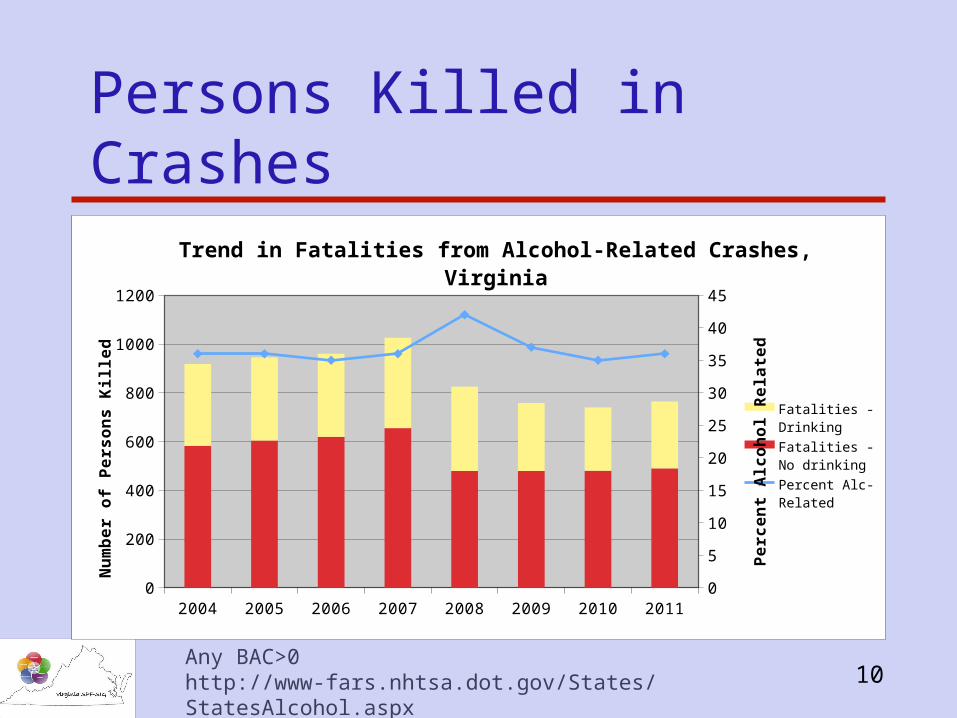
Number of motor vehicle crashes (MVCs) down Number of alcohol-related MVCs also down But – proportion remains same Still – 36% of fatalities in alcohol-related crashes Evaluate change in rates
StatewideFunded jurisdictions
9
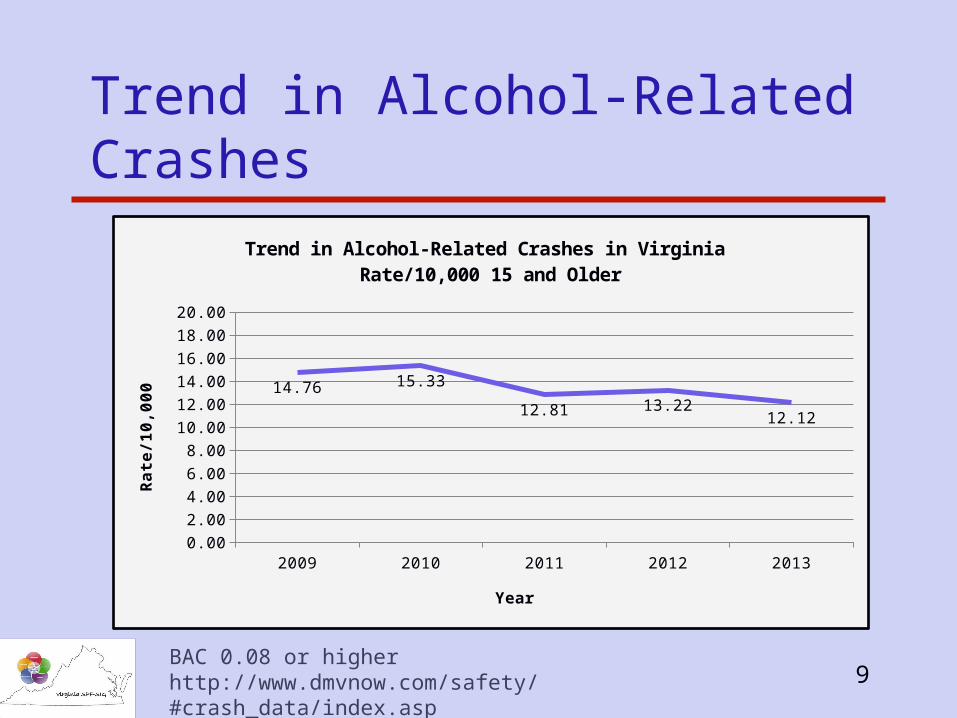
Trend in Alcohol-Related Crashes
BAC 0.08 or higherhttp://www.dmvnow.com/safety/#crash_data/index.asp
2009 2010 2011 2012 20130.00
2.00
4.00
6.00
8.00
10.00
12.00
14.00
16.00
18.00
20.00
14.76 15.33
12.81 13.2212.12
Trend in Alcohol-Related Crashes in Virginia Rate/10,000 15 and Older
Year
Ra
te/1
0,0
00
10
Persons Killed in Crashes
2004 2005 2006 2007 2008 2009 2010 20110
200
400
600
800
1000
1200
0
5
10
15
20
25
30
35
40
45
Trend in Fatalities from Alcohol-Related Crashes, Virginia
Fatalities - Drinking
Fatalities - No drinking
Percent Alc-Re-lated
Num
ber
of
Pers
ons K
ille
d
Perc
ent
Alc
ohol R
ela
ted
Any BAC>0http://www-fars.nhtsa.dot.gov/States/StatesAlcohol.aspx
11
Drinking Drivers 15-24
Number / rate of all MVCs downward trend Rate of MVCs w/ drinking drivers 15-24
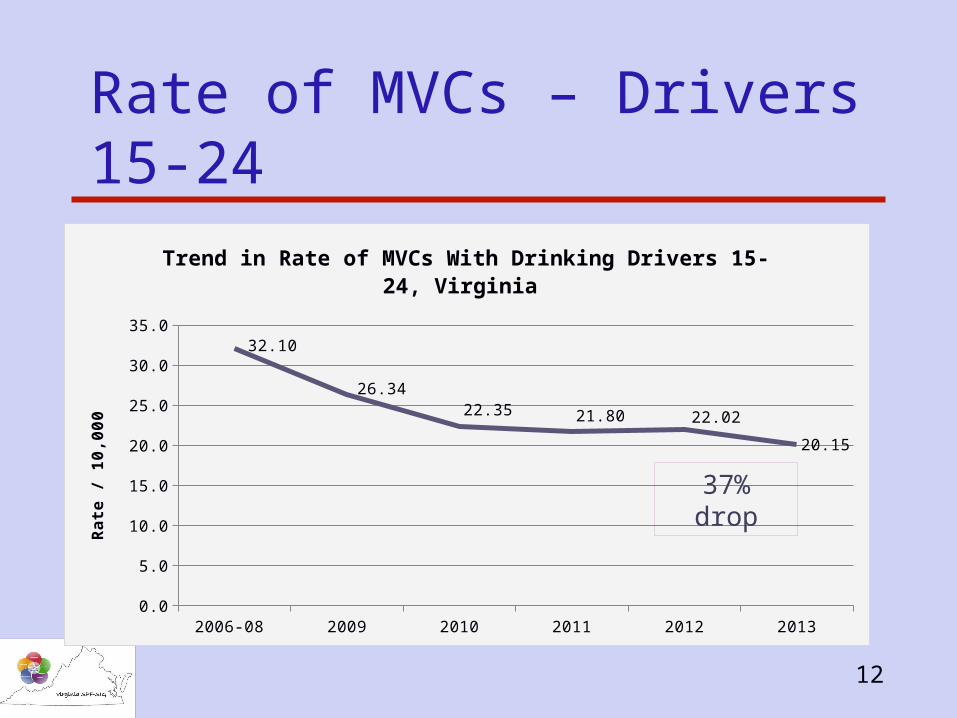
Any alcohol37% drop since project baseline 2006-2008 rate = 32.1/10,000 population 15-242013 rate = 20.1/10,000
Alcohol is consistently involved in 7-8% of all MVCs
12
Rate of MVCs – Drivers 15-24
2006-08 2009 2010 2011 2012 20130.0
5.0
10.0
15.0
20.0
25.0
30.0
35.0
32.10
26.34
22.35 21.80 22.02
20.15
Trend in Rate of MVCs With Drinking Drivers 15-24, Virginia
Ra
te /
10
,00
0
37% drop
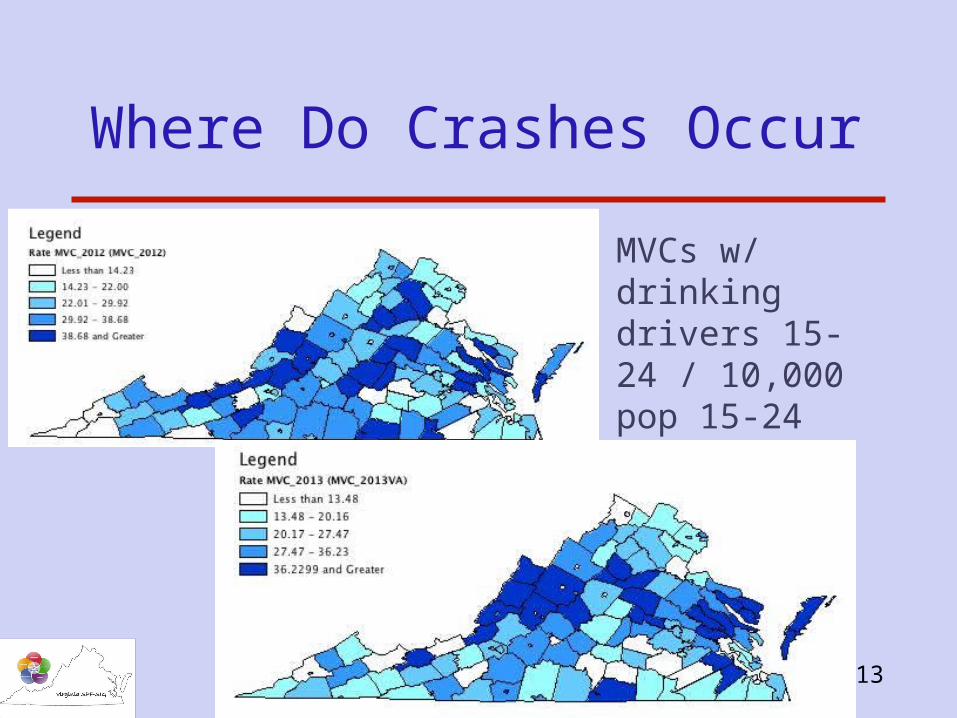
13
Where Do Crashes Occur
MVCs w/ drinking drivers 15-24 / 10,000 pop 15-24
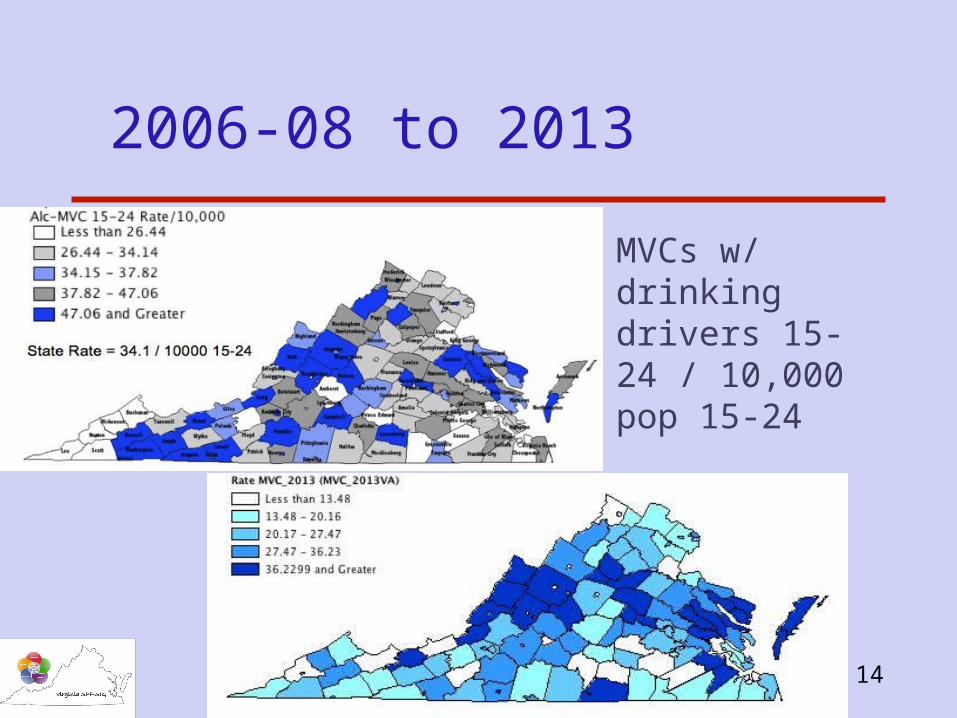
14
2006-08 to 2013
MVCs w/ drinking drivers 15-24 / 10,000 pop 15-24
15
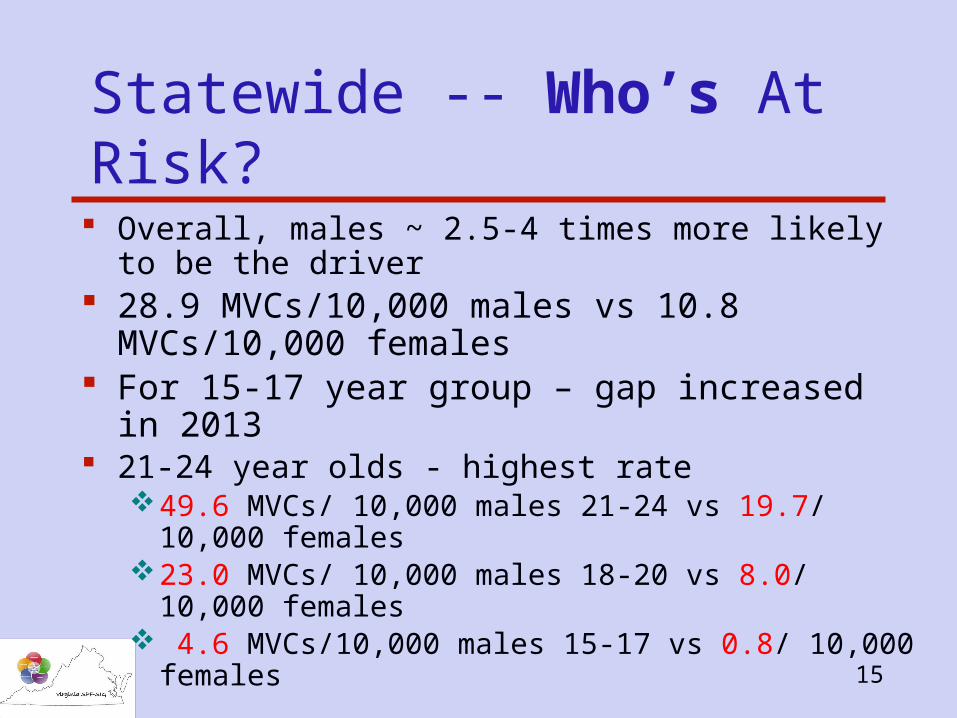
Statewide -- Who’s At Risk?
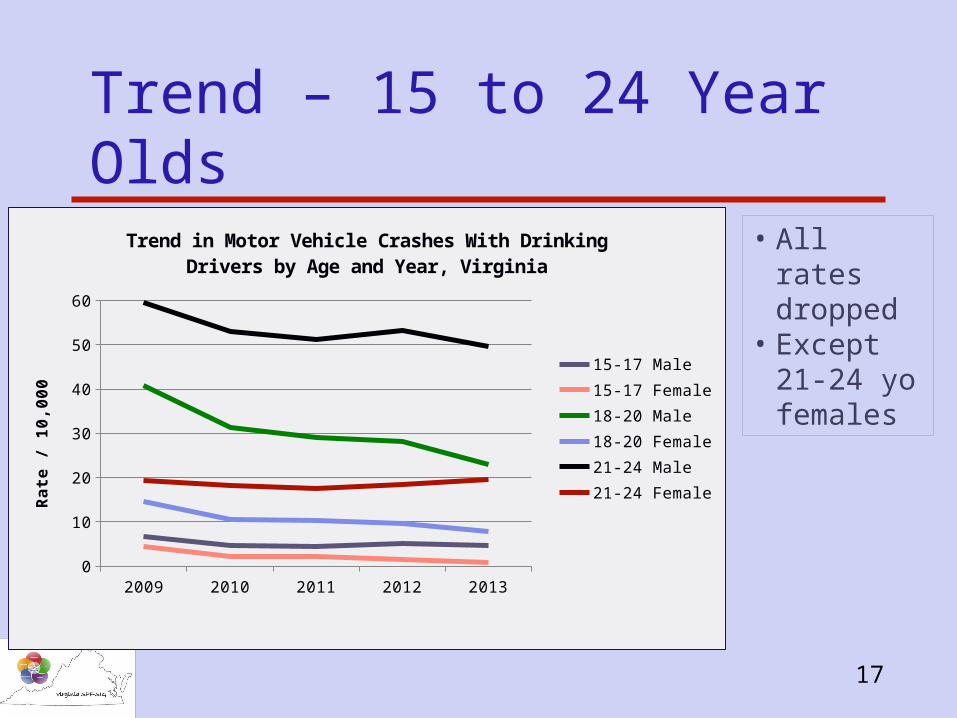
Overall, males ~ 2.5-4 times more likely to be the driver 28.9 MVCs/10,000 males vs 10.8 MVCs/10,000
females For 15-17 year group – gap increased in 2013 21-24 year olds - highest rate
49.6 MVCs/ 10,000 males 21-24 vs 19.7/ 10,000 females 23.0 MVCs/ 10,000 males 18-20 vs 8.0/ 10,000 females 4.6 MVCs/10,000 males 15-17 vs 0.8/ 10,000 females
16
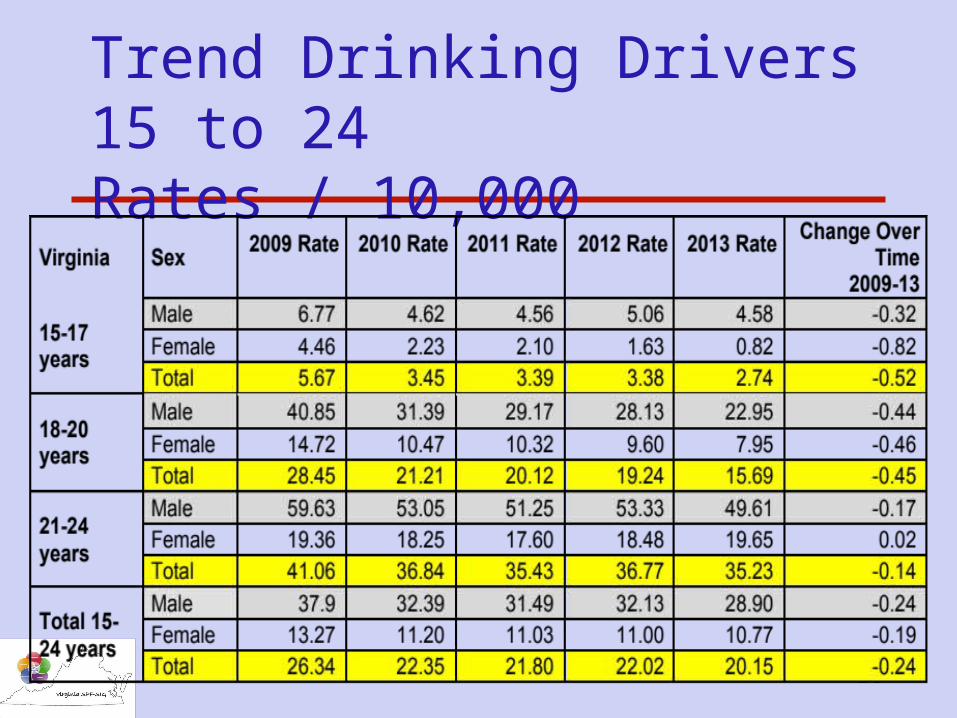
Trend Drinking Drivers 15 to 24 Rates / 10,000
17
Trend – 15 to 24 Year Olds
2009 2010 2011 2012 20130
10
20
30
40
50
60
Trend in Motor Vehicle Crashes With Drinking Drivers by Age and Year, Virginia
15-17 Male15-17 Female18-20 Male18-20 Female21-24 Male21-24 FemaleR
ate
/ 1
0,0
00
• All rates dropped
• Except 21-24 yo females
18
Specifics -- Fundees
Change in rate over time Goal - decrease of at least 10% from baseline Country-wide seeing decrease in rates Compare to statewide decrease
19
Specifics -- Fundees
Assessment activities began in 2012 Interventions began early 2013 Local data collected in late 2013
Change in usage-related behaviorsAwareness of prevention activities
MVC data -- 2006-08 baseline thru 2013
20
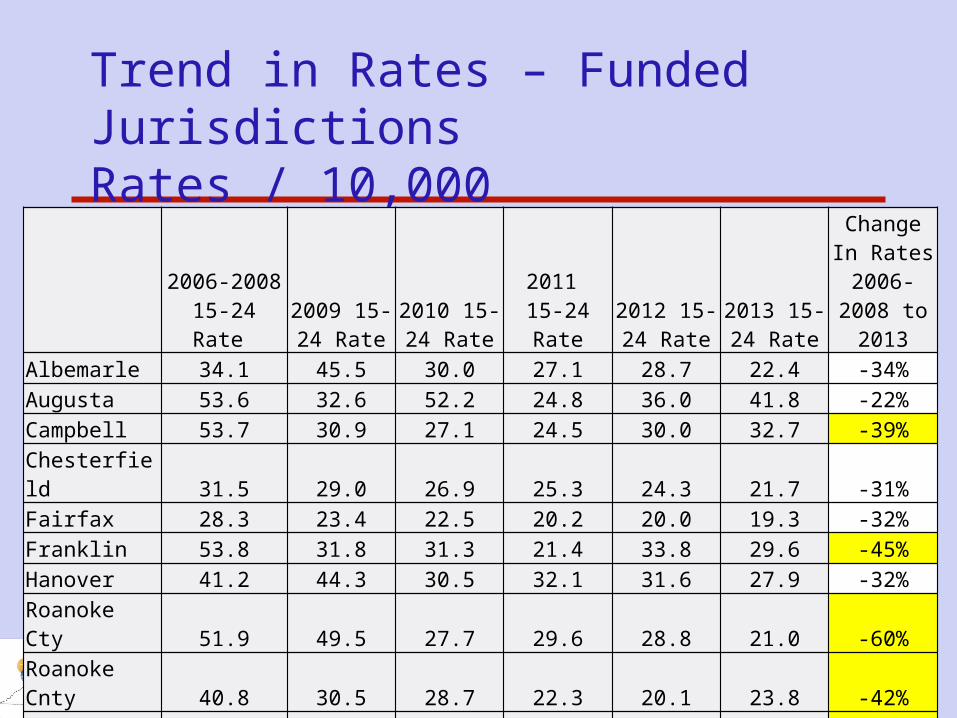
Trend in Rates – Funded JurisdictionsRates / 10,000
2006-2008 15-24 Rate
2009 15-24 Rate
2010 15-24 Rate
2011 15-24 Rate
2012 15-24 Rate
2013 15-24 Rate
Change In Rates
2006-2008 to 2013
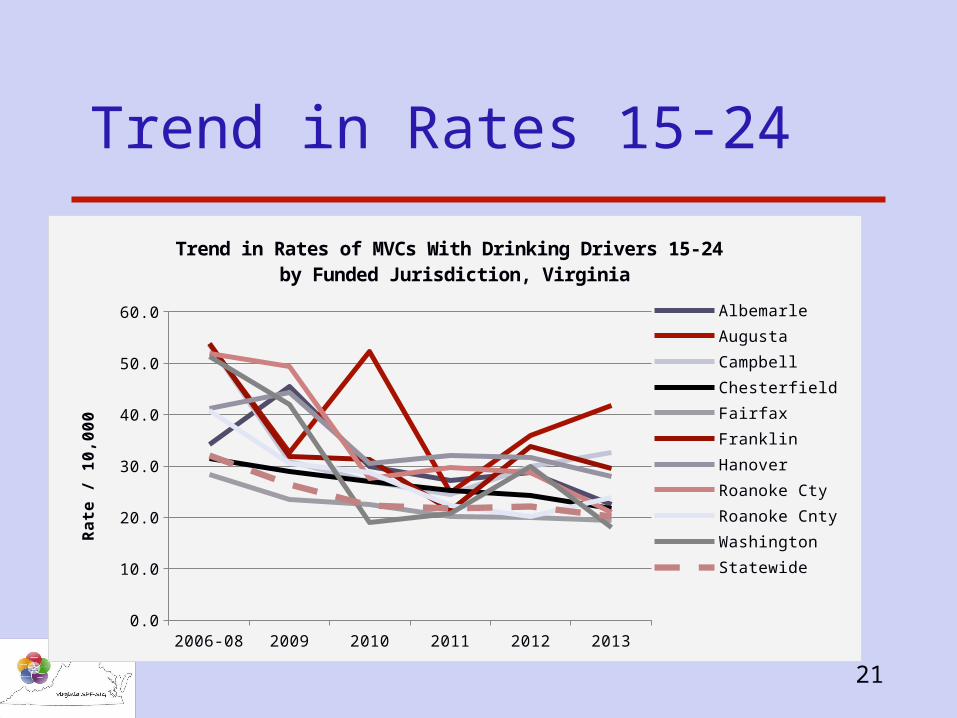
Albemarle 34.1 45.5 30.0 27.1 28.7 22.4 -34%Augusta 53.6 32.6 52.2 24.8 36.0 41.8 -22%Campbell 53.7 30.9 27.1 24.5 30.0 32.7 -39%Chesterfield 31.5 29.0 26.9 25.3 24.3 21.7 -31%Fairfax 28.3 23.4 22.5 20.2 20.0 19.3 -32%Franklin 53.8 31.8 31.3 21.4 33.8 29.6 -45%Hanover 41.2 44.3 30.5 32.1 31.6 27.9 -32%Roanoke Cty 51.9 49.5 27.7 29.6 28.8 21.0 -60%Roanoke Cnty 40.8 30.5 28.7 22.3 20.1 23.8 -42%Washington 51.4 42.1 19.1 20.7 29.9 18.0 -65%
Statewide 32.1 26.3 22.4 21.8 22.0 20.2 -37%
21
Trend in Rates 15-24
2006-08 2009 2010 2011 2012 20130.0
10.0
20.0
30.0
40.0
50.0
60.0
Trend in Rates of MVCs With Drinking Drivers 15-24 by Funded Jurisdiction, Virginia
AlbemarleAugusta CampbellChesterfield FairfaxFranklin Hanover Roanoke CtyRoanoke CntyWashington Statewide
Ra
te /
10
,00
0
22
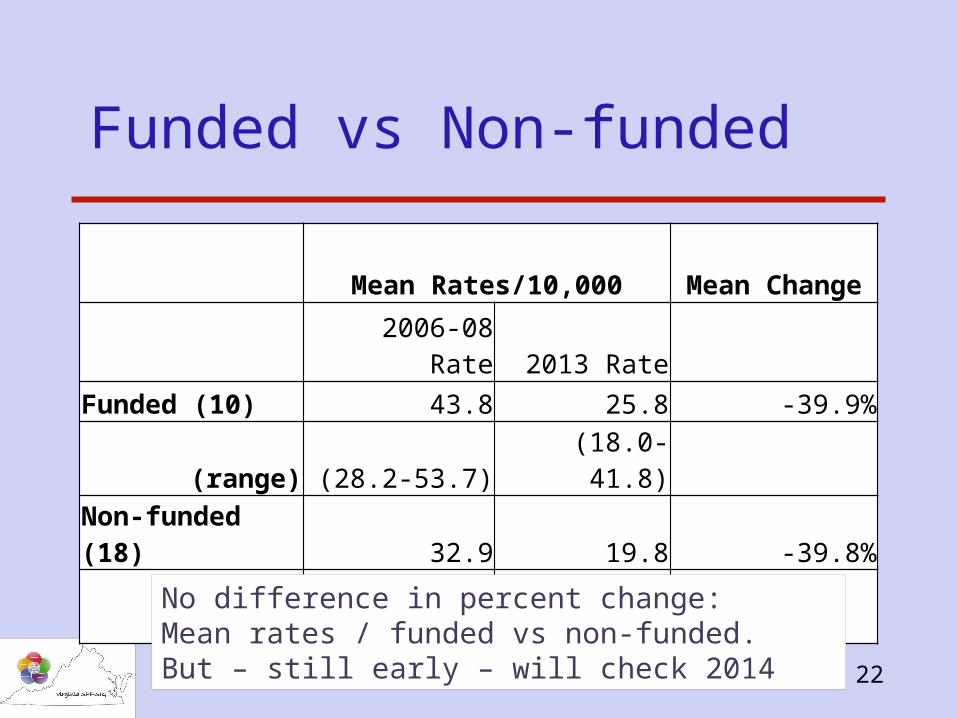
Funded vs Non-funded
Mean Rates/10,000 Mean Change
2006-08 Rate 2013 Rate
Funded (10) 43.8 25.8 -39.9%
(range) (28.2-53.7) (18.0-41.8)
Non-funded (18) 32.9 19.8 -39.8%
(range) (21.7-43.8) (12.8-35.2)
No difference in percent change: Mean rates / funded vs non-funded.But – still early – will check 2014
23
Statewide Update
5-year report Review use of all substances by all age groups
National Survey on Drug Use and HealthYoung Adult Survey – limitedYouth Risk Behavioral Survey
Review consequence dataAlcohol-relatedDrug-related
Consider changes
24
Statewide Update
BenchmarkingCompare current VA rates to US ratesDetermine if VA has higher prevalenceCompute Rate Ratio – Rate 1 / Rate 2
Change over timeCompute the percent change over past 5 yearsDetermine if rates have gone up
Look for key differences in patterns
25
Statewide Update in Usage
National Survey on Drug Use and Health (NSDUH), 2008-2012
Past month use of substances decreased overall from 2008-2012 in both 12-17 year olds and 18-25 year olds
Exception --- alcohol use and binge drinking among 18-25 year olds
26
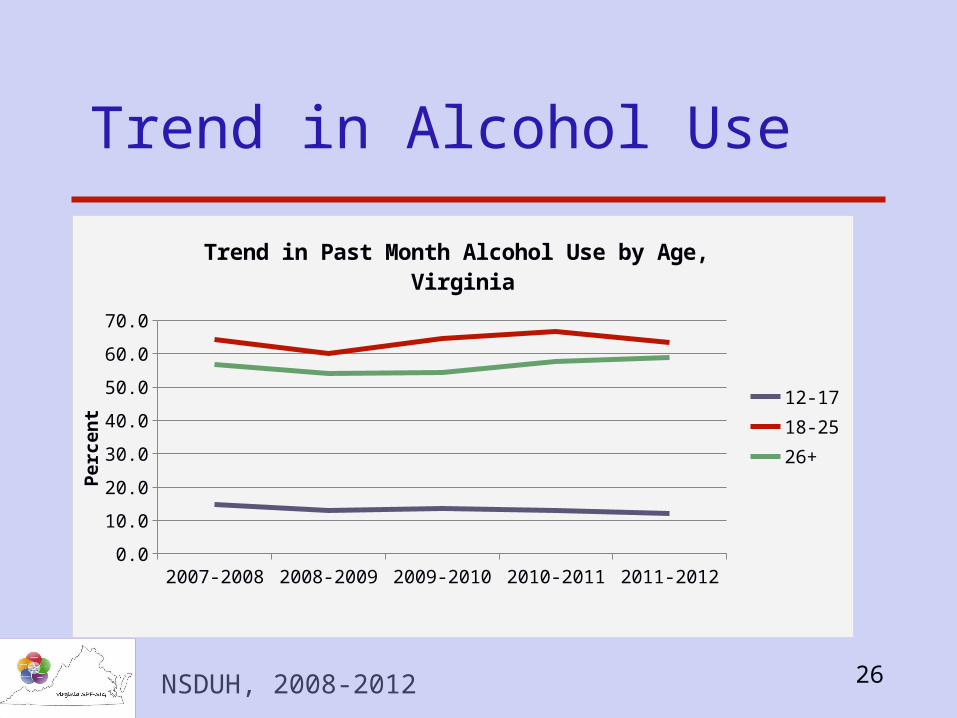
Trend in Alcohol Use
NSDUH, 2008-2012
2007-2008 2008-2009 2009-2010 2010-2011 2011-20120.0
10.0
20.0
30.0
40.0
50.0
60.0
70.0
Trend in Past Month Alcohol Use by Age, Virginia
12-1718-2526+
Pe
rce
nt
27
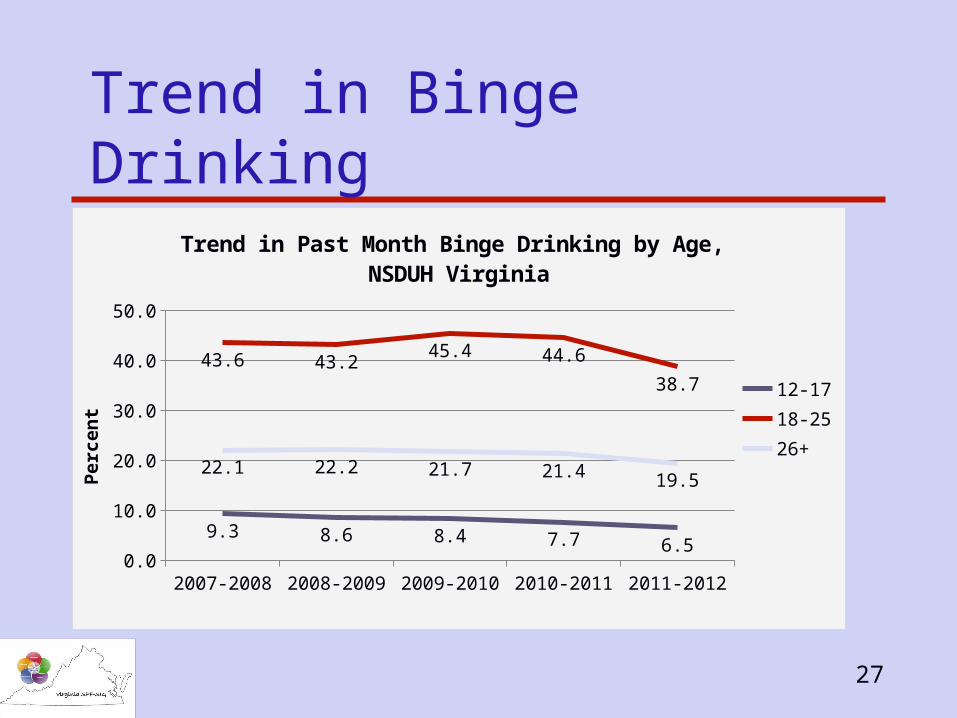
Trend in Binge Drinking
2007-2008 2008-2009 2009-2010 2010-2011 2011-20120.05.0
10.015.020.025.030.035.040.045.050.0
9.3 8.6 8.4 7.7 6.5
43.6 43.245.4 44.6
38.7
22.1 22.2 21.7 21.4 19.5
Trend in Past Month Binge Drinking by Age, NSDUH Virginia
12-1718-2526+
Pe
rce
nt
28
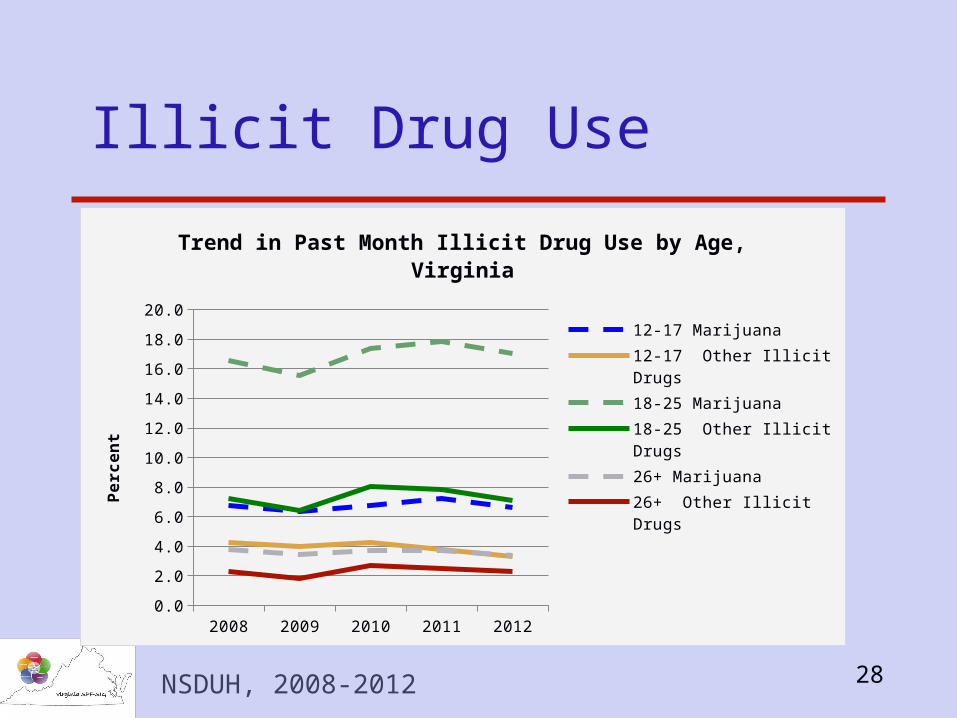
Illicit Drug Use
NSDUH, 2008-2012
2008 2009 2010 2011 20120.0
2.0
4.0
6.0
8.0
10.0
12.0
14.0
16.0
18.0
20.0
Trend in Past Month Illicit Drug Use by Age, Virginia
12-17 Marijuana 12-17 Other Illicit Drugs18-25 Marijuana 18-25 Other Illicit Drugs26+ Marijuana 26+ Other Illicit DrugsP
erc
en
t
29
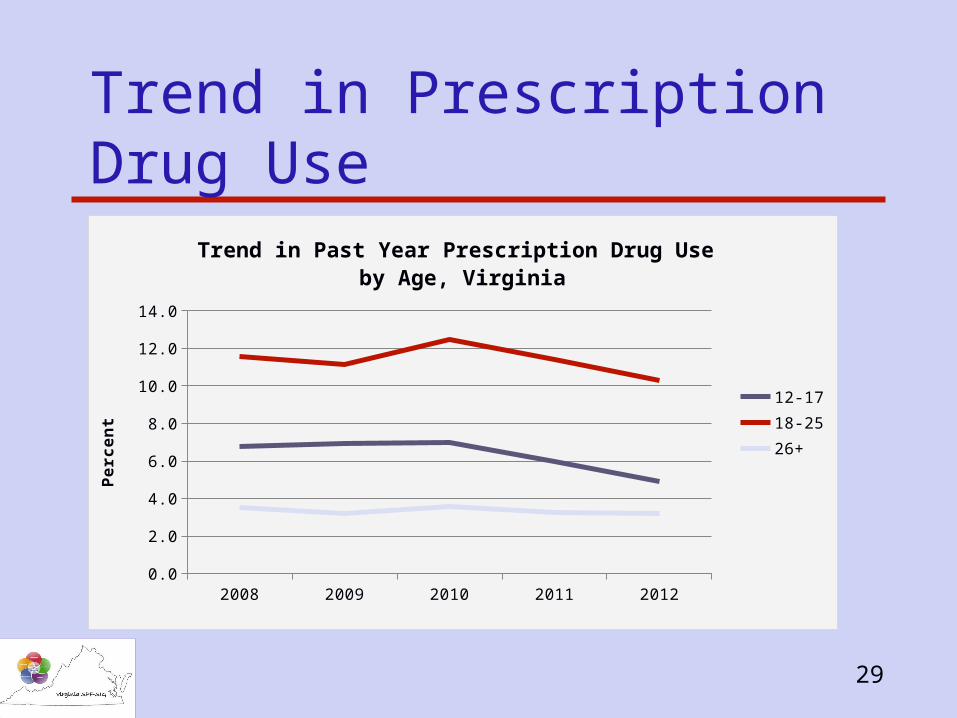
Trend in Prescription Drug Use
2008 2009 2010 2011 20120.0
2.0
4.0
6.0
8.0
10.0
12.0
14.0
Trend in Past Year Prescription Drug Use by Age, Virginia
12-1718-2526+
Pe
rce
nt
30
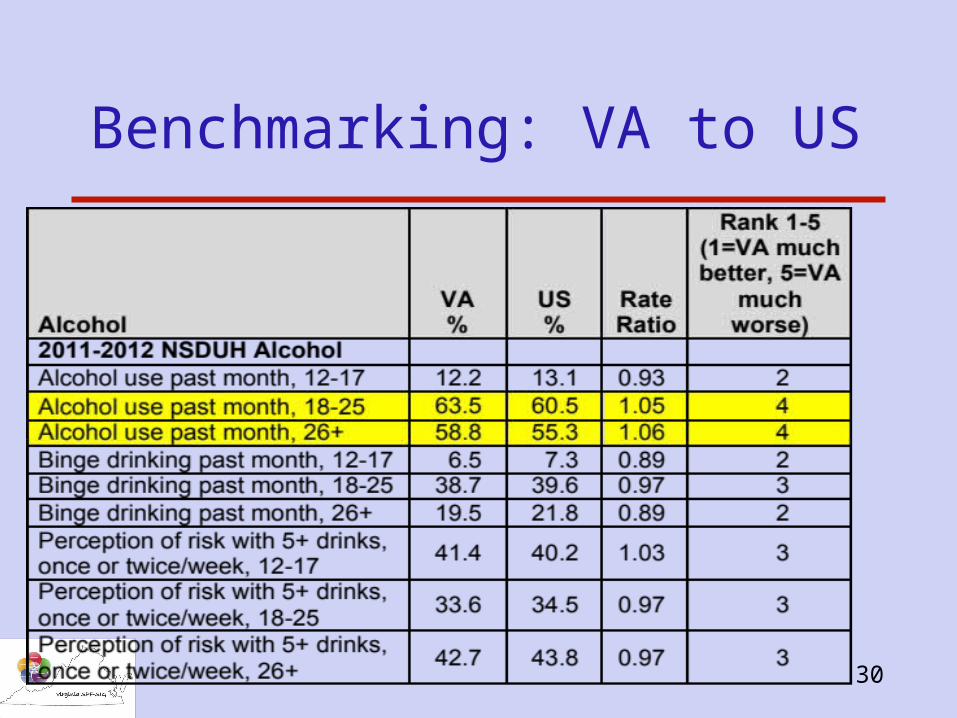
Benchmarking: VA to US
31
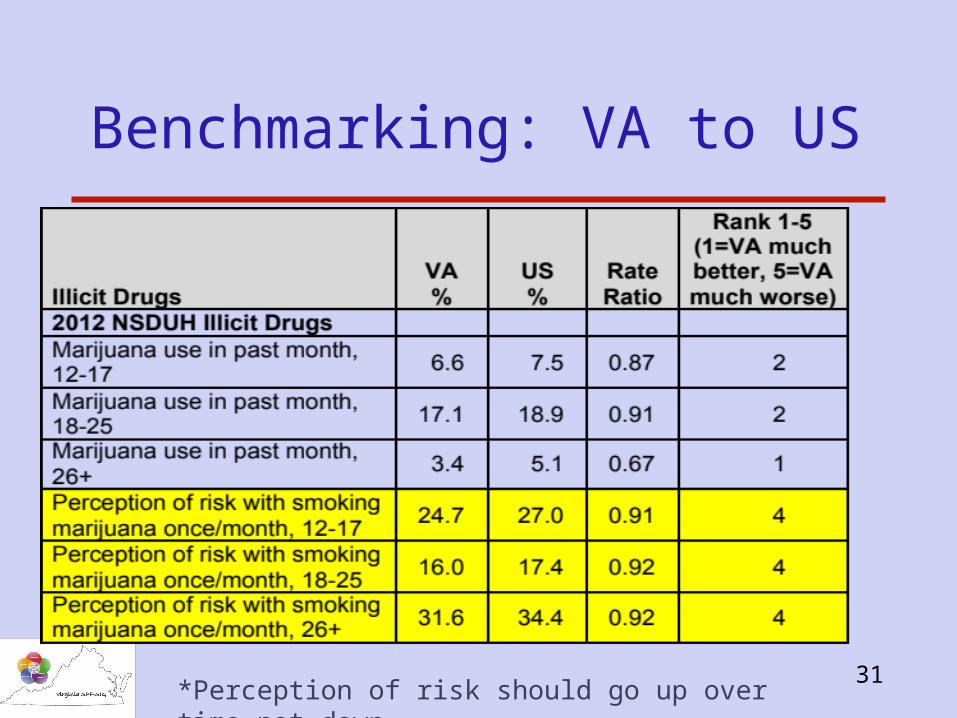
Benchmarking: VA to US
*Perception of risk should go up over time not down
32
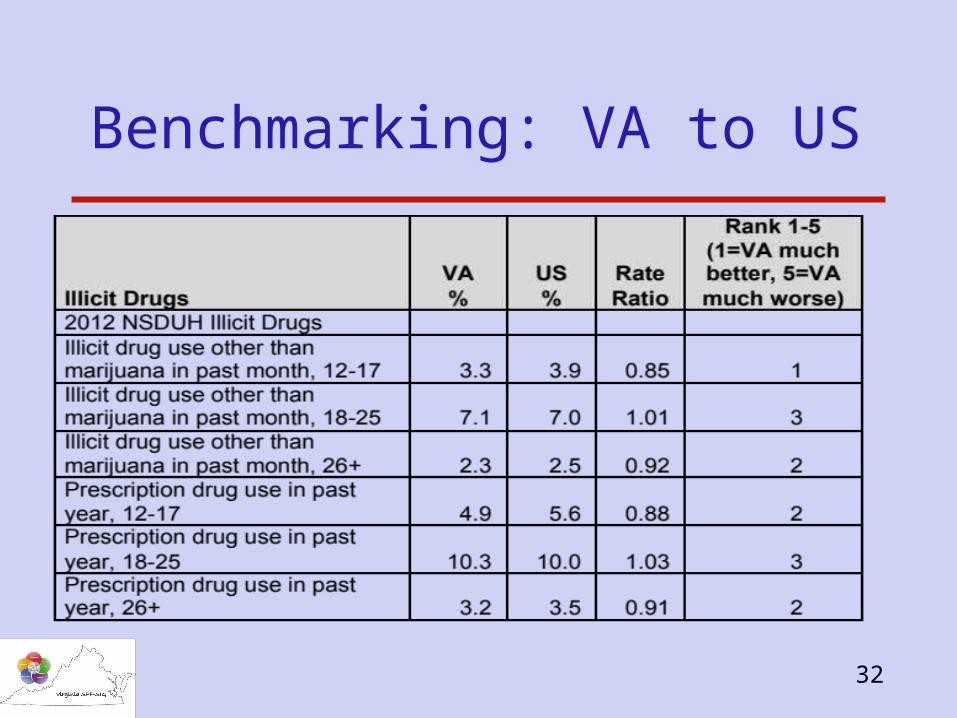
Benchmarking: VA to US
33
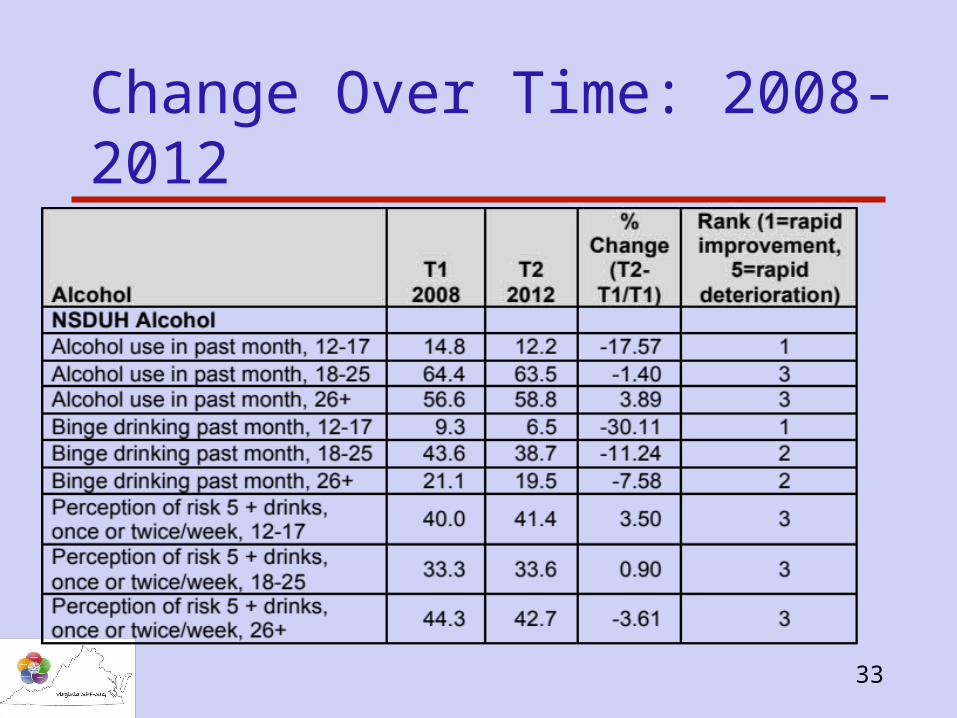
Change Over Time: 2008-2012
34
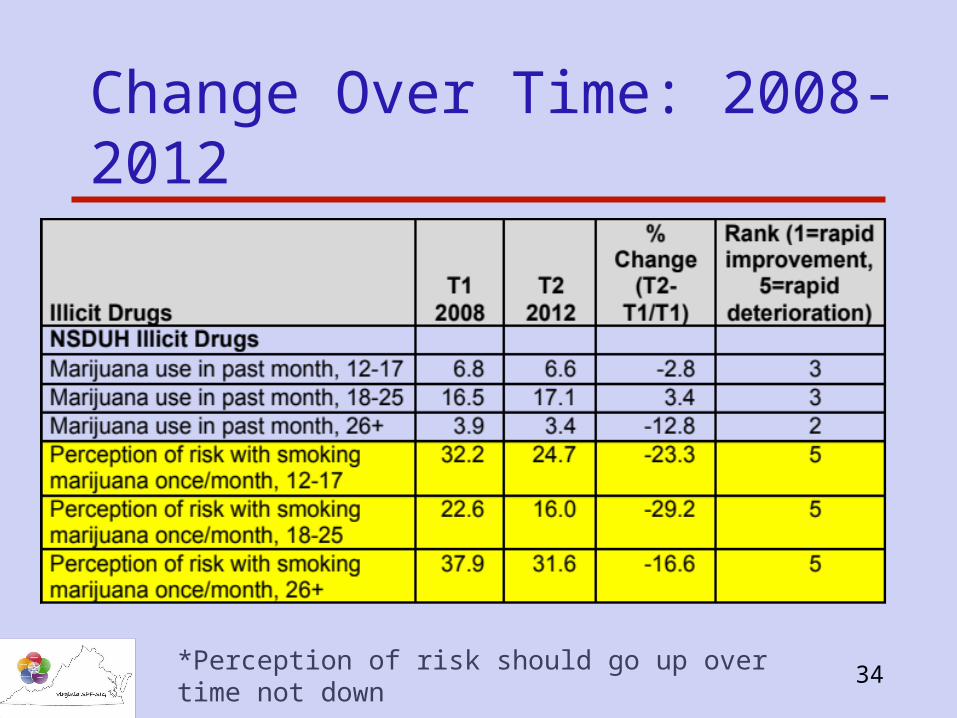
Change Over Time: 2008-2012
*Perception of risk should go up over time not down
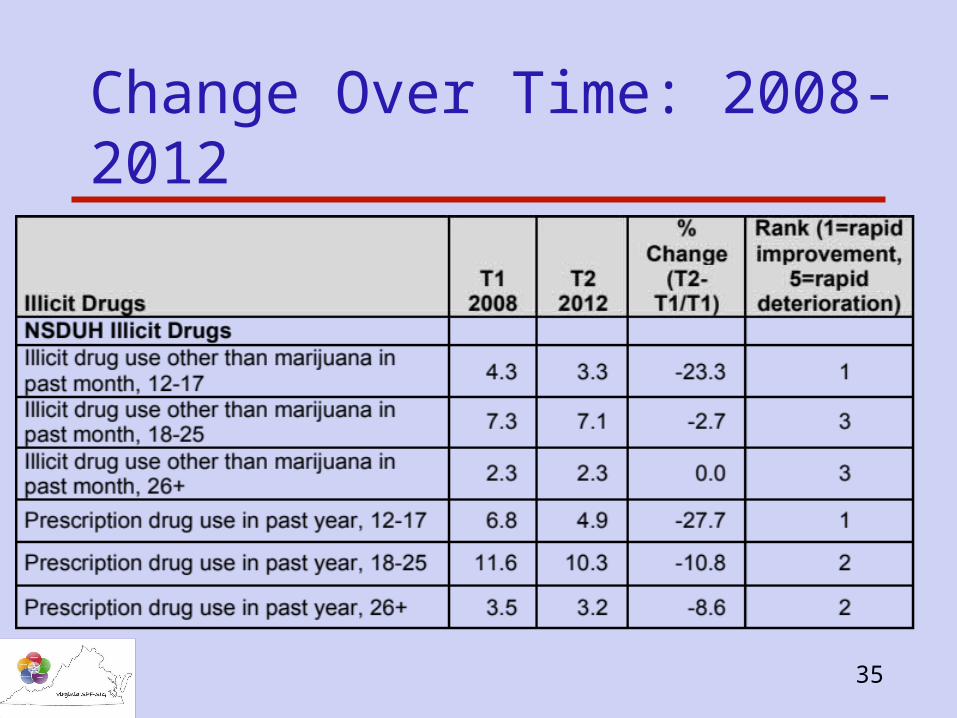
35
Change Over Time: 2008-2012
36
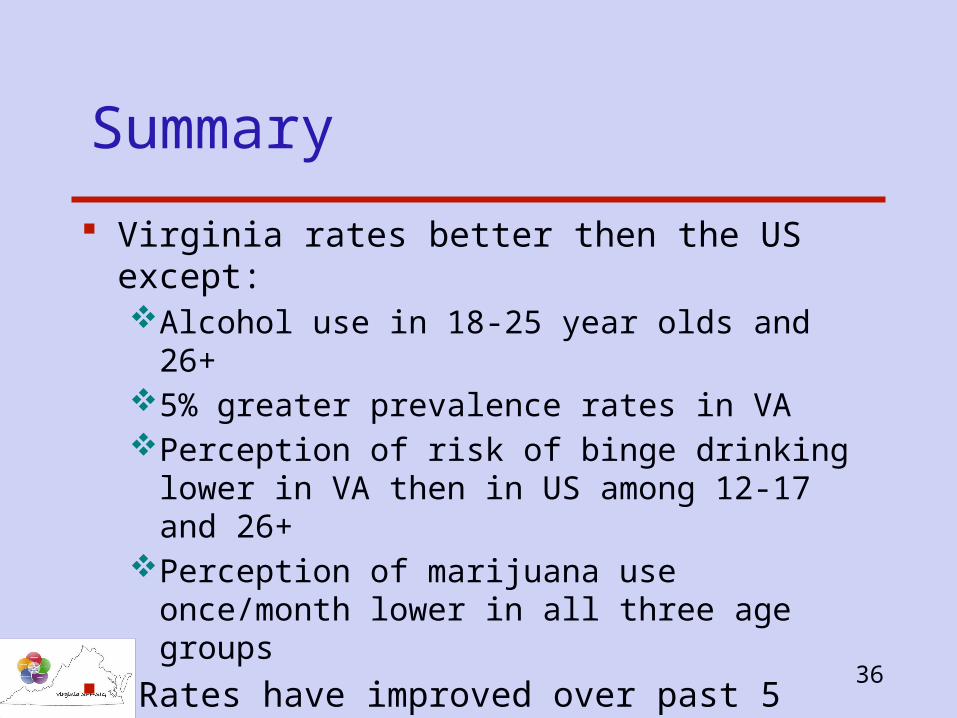
Summary
Virginia rates better then the US except:Alcohol use in 18-25 year olds and 26+5% greater prevalence rates in VAPerception of risk of binge drinking lower in VA
then in US among 12-17 and 26+Perception of marijuana use once/month lower in
all three age groups Rates have improved over past 5 years except:
Perception of risk of use of marijuana
37
SA-Related Consequences
SA-related consequences examined Deaths
Drug overdoseCirrhosis
DUIs Drug-related arrests Drug dependence or abuse
38
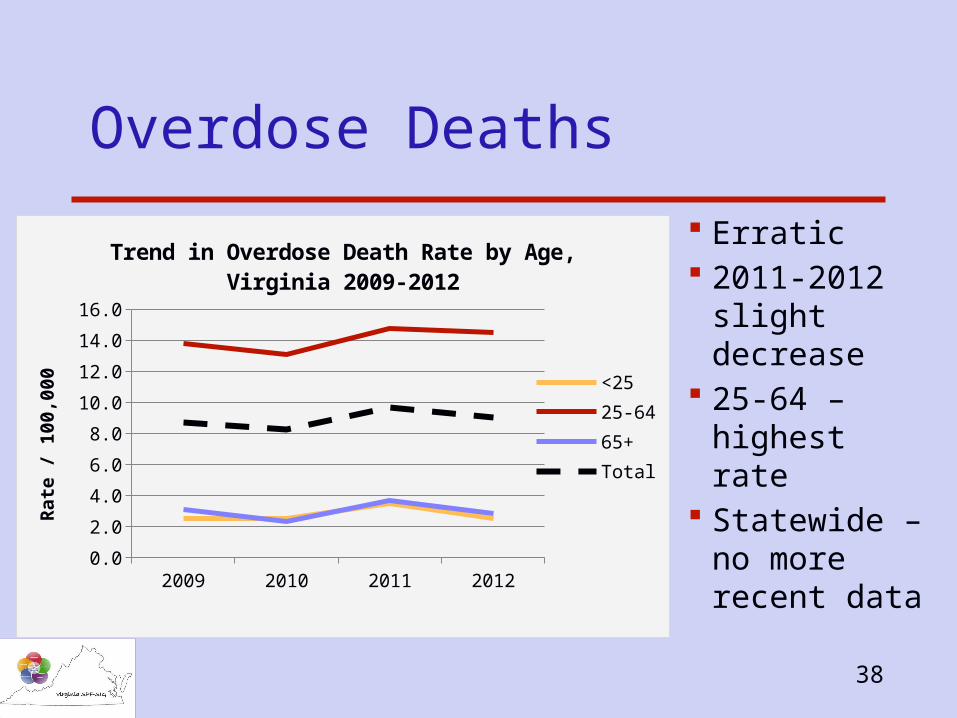
Overdose Deaths
Erratic 2011-2012
slight decrease
25-64 – highest rate
Statewide – no more recent data
2009 2010 2011 20120.0
2.0
4.0
6.0
8.0
10.0
12.0
14.0
16.0
Trend in Overdose Death Rate by Age, Virginia 2009-2012
<2525-6465+Total
Ra
te /
10
0,0
00
39
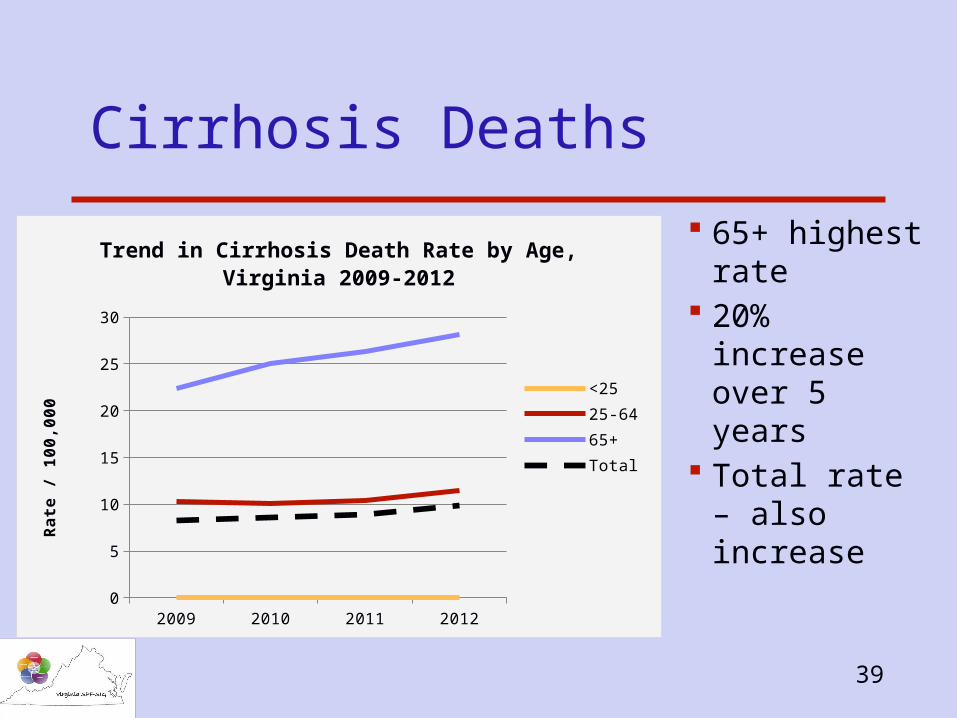
Cirrhosis Deaths
65+ highest rate
20% increase over 5 years
Total rate – also increase
2009 2010 2011 20120
5
10
15
20
25
30
Trend in Cirrhosis Death Rate by Age, Virginia 2009-2012
<2525-6465+Total
Ra
te /
10
0,0
00
40
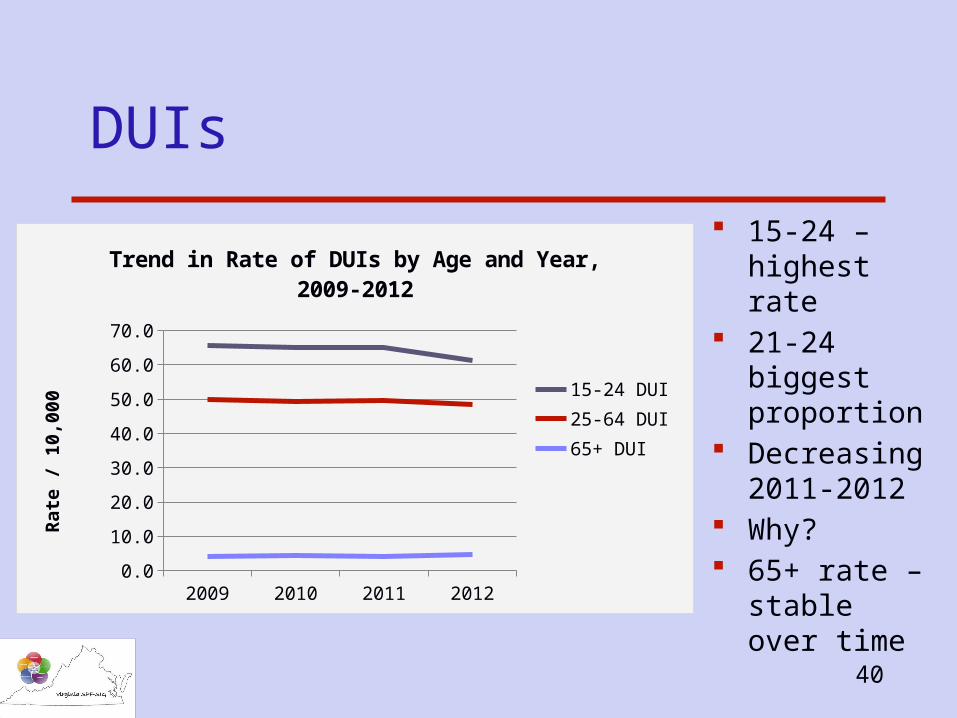
DUIs
15-24 – highest rate
21-24 biggest proportion
Decreasing 2011-2012
Why? 65+ rate –
stable over time2009 2010 2011 2012
0.0
10.0
20.0
30.0
40.0
50.0
60.0
70.0
Trend in Rate of DUIs by Age and Year, 2009-2012
15-24 DUI25-64 DUI 65+ DUI
Ra
te /
10
,00
0
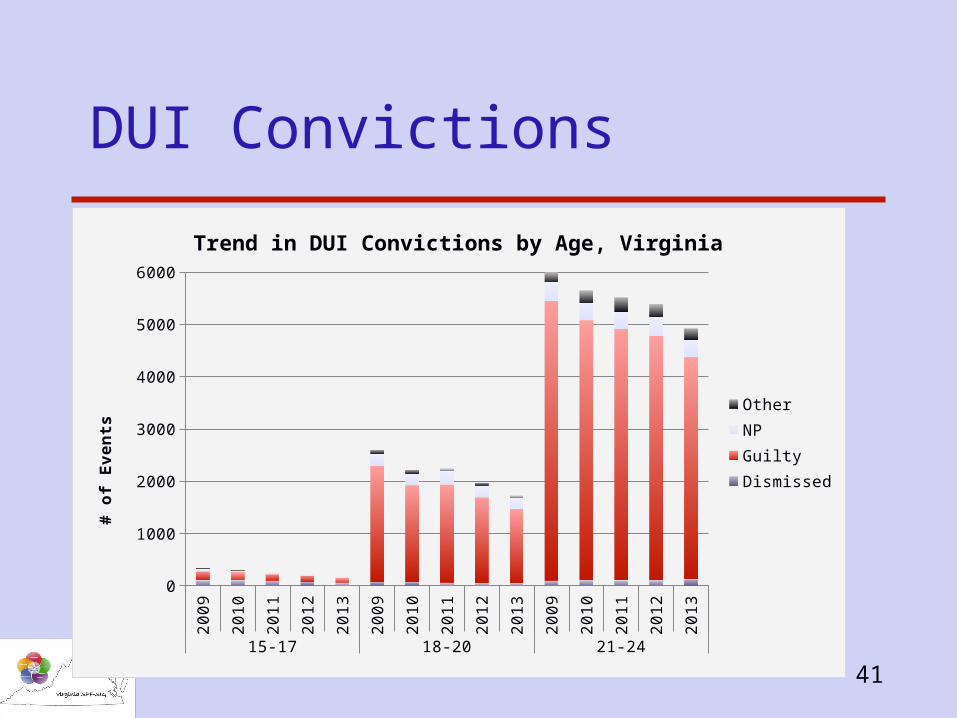
41
DUI Convictions2
00
9
20
10
20
11
20
12
20
13
20
09
20
10
20
11
20
12
20
13
20
09
20
10
20
11
20
12
20
13
15-17 18-20 21-24
0
1000
2000
3000
4000
5000
6000
Trend in DUI Convictions by Age, Virginia
OtherNPGuiltyDismissed
# o
f E
ve
nts
42
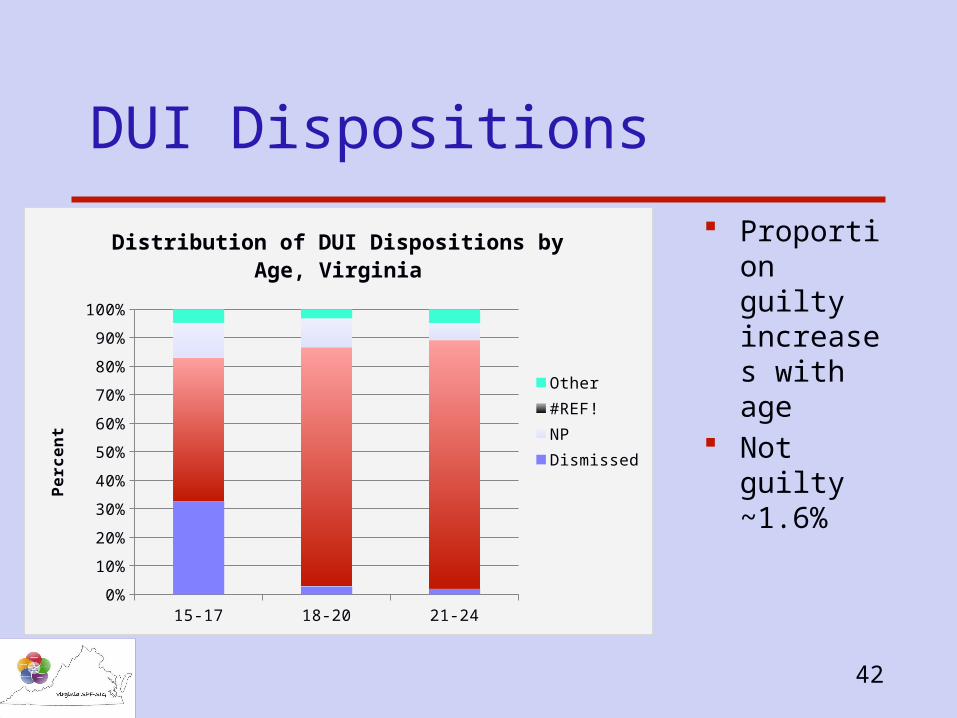
DUI Dispositions
Proportion guilty increases with age
Not guilty ~1.6%
15-17 18-20 21-240%
10%
20%
30%
40%
50%
60%
70%
80%
90%
100%
Distribution of DUI Dispositions by Age, Virginia
Other#REF!NPDismissed
Pe
rce
nt
43
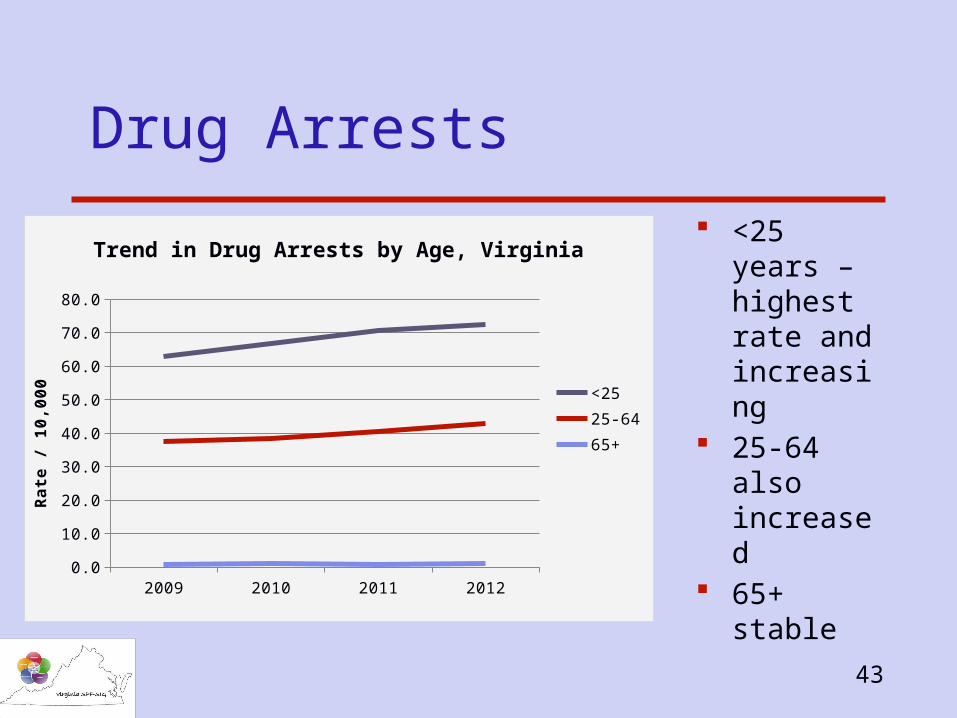
Drug Arrests
<25 years – highest rate and increasing
25-64 also increased
65+ stable
2009 2010 2011 20120.0
10.0
20.0
30.0
40.0
50.0
60.0
70.0
80.0
Trend in Drug Arrests by Age, Virginia
<2525-6465+
Ra
te /
10
,00
0
44
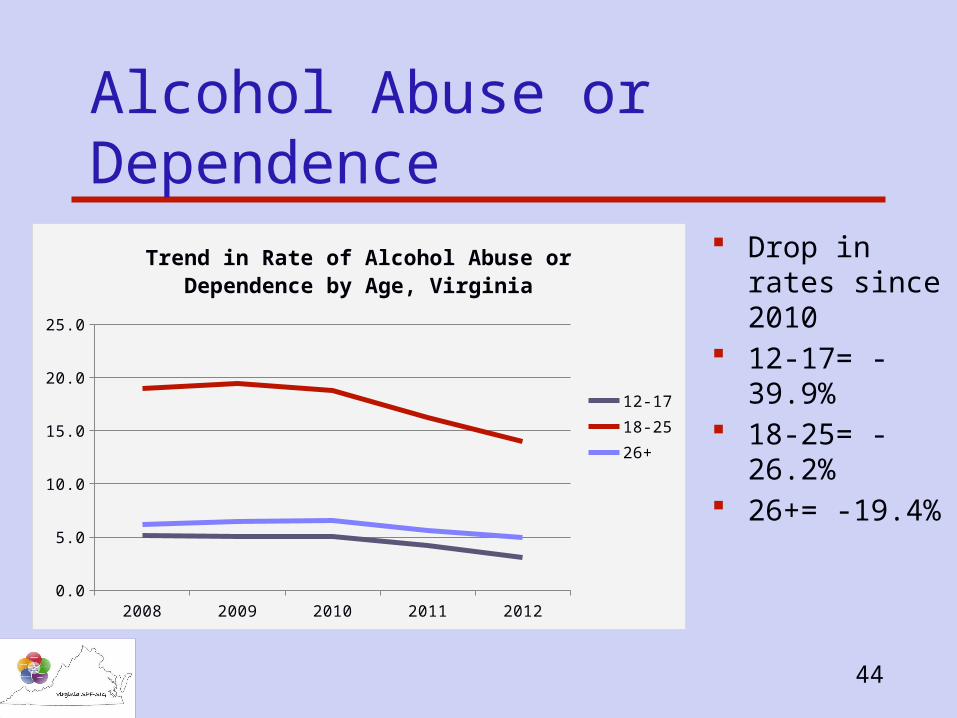
Alcohol Abuse or Dependence
Drop in rates since 2010
12-17= -39.9% 18-25= -26.2% 26+= -19.4%
2008 2009 2010 2011 20120.0
5.0
10.0
15.0
20.0
25.0
Trend in Rate of Alcohol Abuse or Dependence by Age, Virginia
12-1718-2526+
45
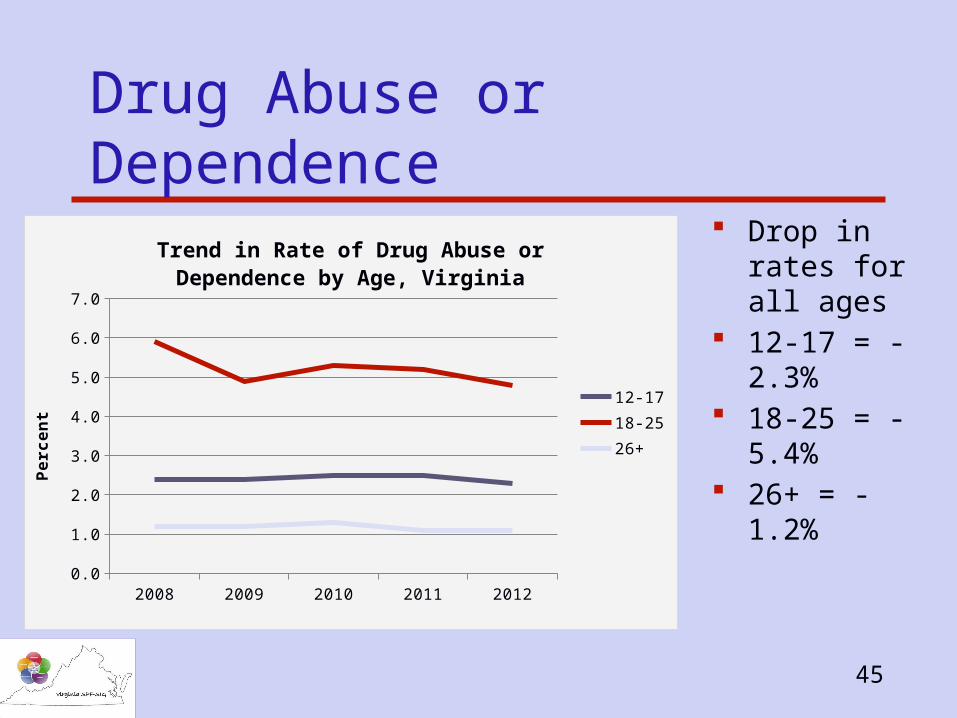
Drug Abuse or Dependence
Drop in rates for all ages
12-17 = -2.3%
18-25 = -5.4%
26+ = -1.2%
2008 2009 2010 2011 20120.0
1.0
2.0
3.0
4.0
5.0
6.0
7.0
Trend in Rate of Drug Abuse or Dependence by Age, Virginia
12-1718-2526+
Pe
rce
nt
46
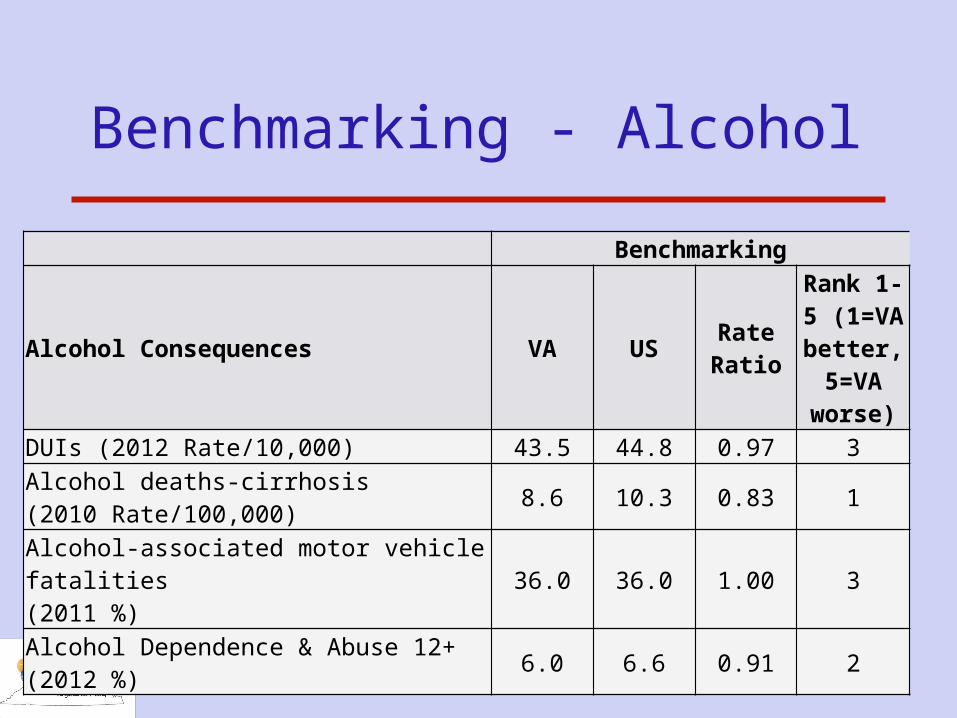
Benchmarking - Alcohol
Benchmarking
Alcohol Consequences VA USRate Ratio
Rank 1-5 (1=VA better, 5=VA
worse)
DUIs (2012 Rate/10,000) 43.5 44.8 0.97 3
Alcohol deaths-cirrhosis (2010 Rate/100,000)
8.6 10.3 0.83 1
Alcohol-associated motor vehicle fatalities (2011 %)
36.0 36.0 1.00 3
Alcohol Dependence & Abuse 12+ (2012 %)
6.0 6.6 0.91 2
47
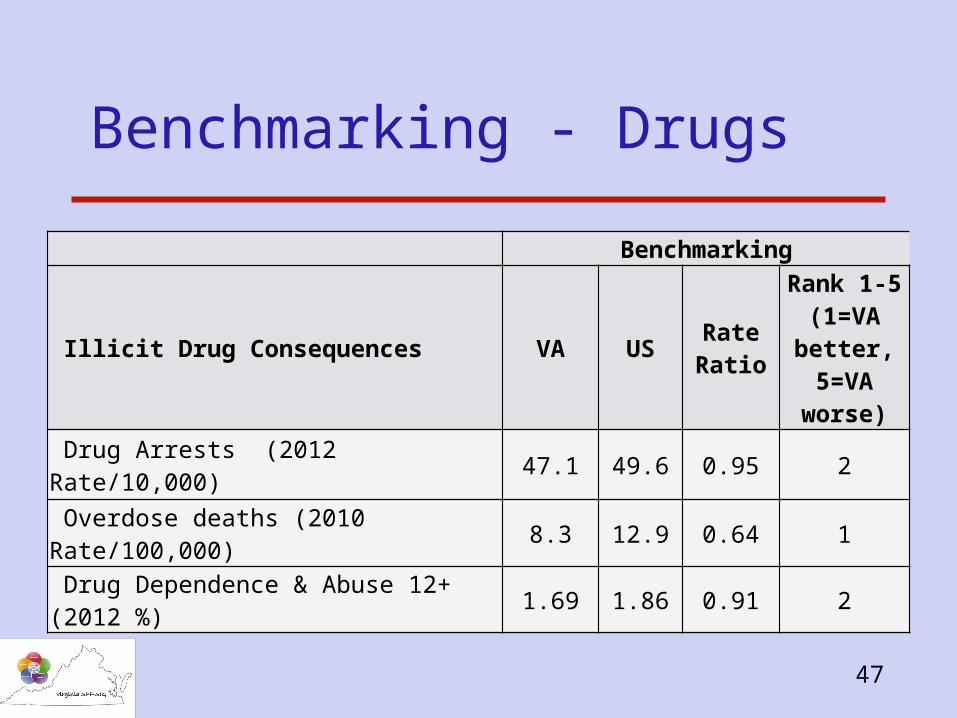
Benchmarking - Drugs
Benchmarking
Illicit Drug Consequences VA USRate Ratio
Rank 1-5 (1=VA better, 5=VA
worse)
Drug Arrests (2012 Rate/10,000) 47.1 49.6 0.95 2
Overdose deaths (2010 Rate/100,000) 8.3 12.9 0.64 1
Drug Dependence & Abuse 12+ (2012 %) 1.69 1.86 0.91 2
48
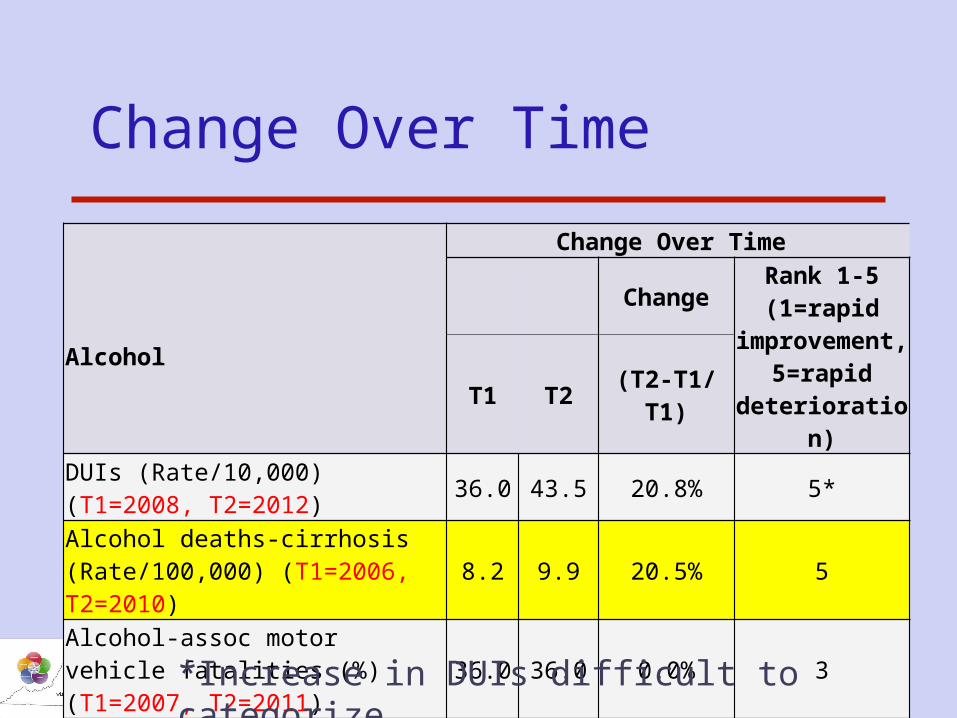
Change Over Time
Change Over Time
AlcoholChange
Rank 1-5 (1=rapid
improvement, 5=rapid
deterioration)T1 T2 (T2-T1/T1)
DUIs (Rate/10,000) (T1=2008, T2=2012)
36.0 43.5 20.8% 5*
Alcohol deaths-cirrhosis (Rate/100,000) (T1=2006, T2=2010)
8.2 9.9 20.5% 5
Alcohol-assoc motor vehicle fatalities (%) (T1=2007, T2=2011)
36.0 36.0 0.0% 3
Alcohol Dependence & Abuse 12+ (%) (T1=2008, T2=2012)
7.8 6.0 -23.1% 1
*Increase in DUIs difficult to categorize
49
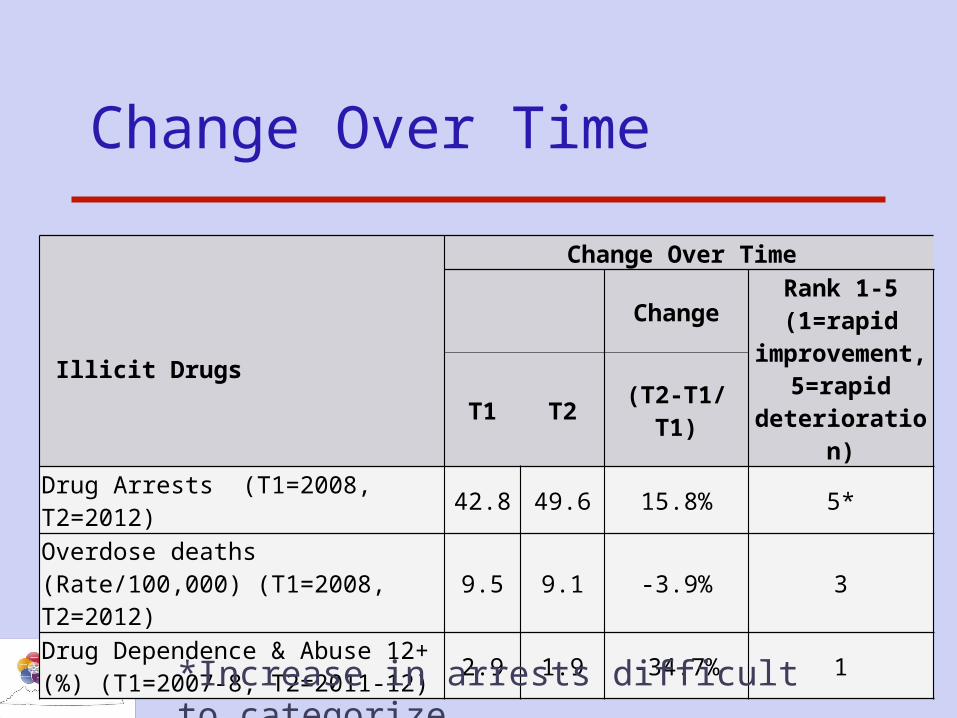
Change Over Time
Change Over Time
Illicit Drugs
ChangeRank 1-5 (1=rapid
improvement, 5=rapid
deterioration)T1 T2 (T2-T1/T1)
Drug Arrests (T1=2008, T2=2012) 42.8 49.6 15.8% 5*
Overdose deaths (Rate/100,000) (T1=2008, T2=2012)
9.5 9.1 -3.9% 3
Drug Dependence & Abuse 12+ (%) (T1=2007-8, T2=2011-12)
2.9 1.9 -34.7% 1
*Increase in arrests difficult to categorize
50
Treatment
TEDS Publicly funded only Only those in treatment Idea of frequently used substances Intakes – considers “primary drug of choice”
51
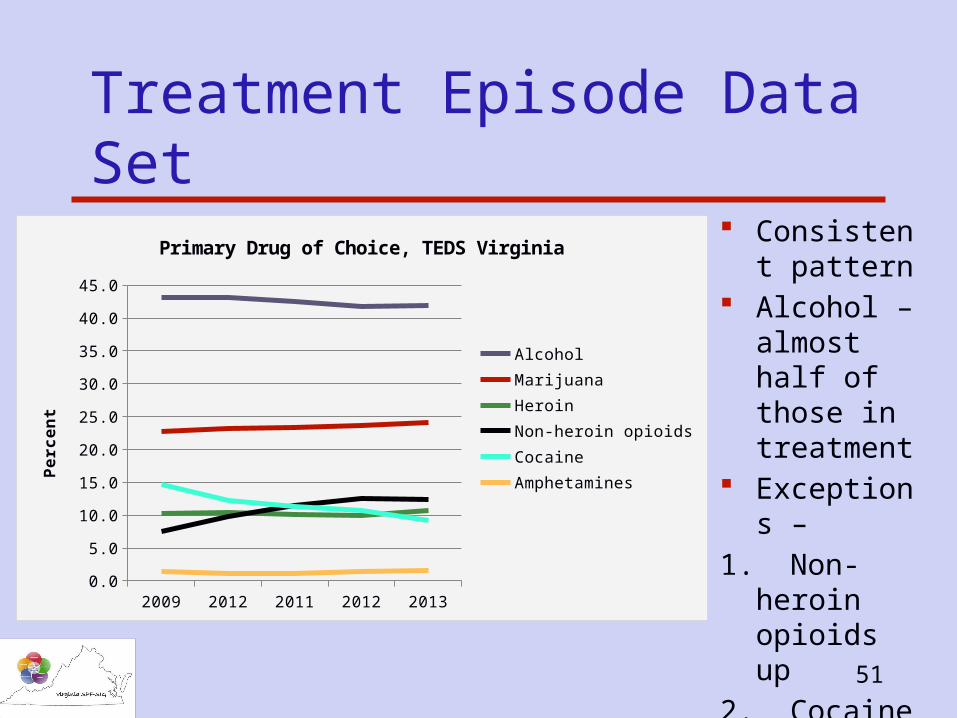
Treatment Episode Data Set
Consistent pattern
Alcohol – almost half of those in treatment
Exceptions –
1. Non-heroin opioids up
2. Cocaine -- down2009 2012 2011 2012 2013
0.0
5.0
10.0
15.0
20.0
25.0
30.0
35.0
40.0
45.0
Primary Drug of Choice, TEDS Virginia
AlcoholMarijuanaHeroinNon-heroin opioidsCocaineAmphetaminesP
erc
en
t
52
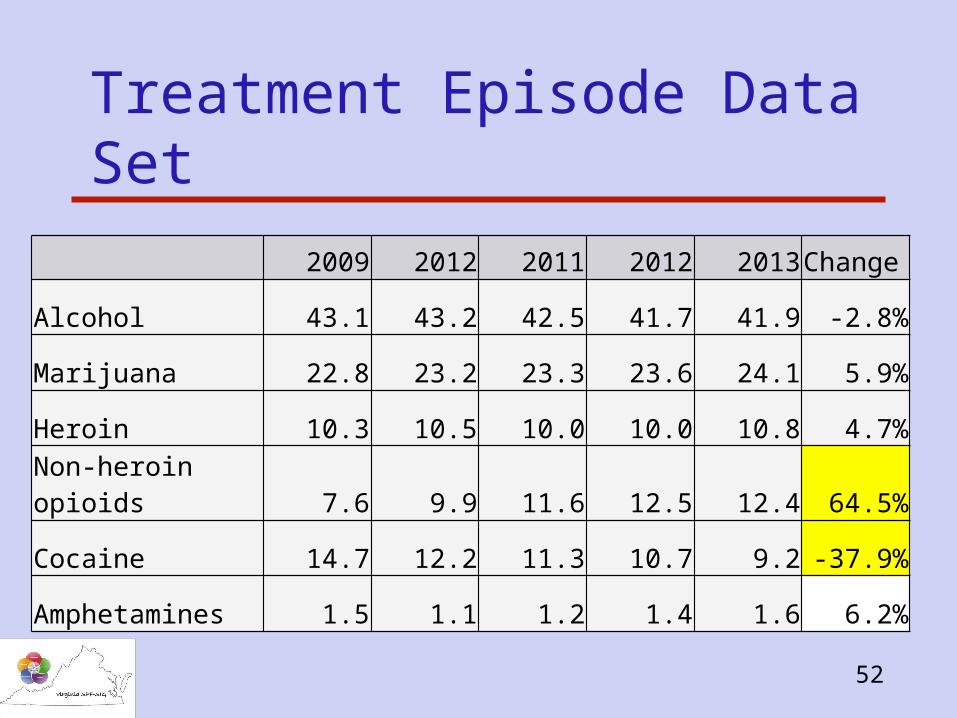
Treatment Episode Data Set
2009 2012 2011 2012 2013Change
Alcohol 43.1 43.2 42.5 41.7 41.9 -2.8%
Marijuana 22.8 23.2 23.3 23.6 24.1 5.9%
Heroin 10.3 10.5 10.0 10.0 10.8 4.7%
Non-heroin opioids 7.6 9.9 11.6 12.5 12.4 64.5%
Cocaine 14.7 12.2 11.3 10.7 9.2 -37.9%
Amphetamines 1.5 1.1 1.2 1.4 1.6 6.2%
53
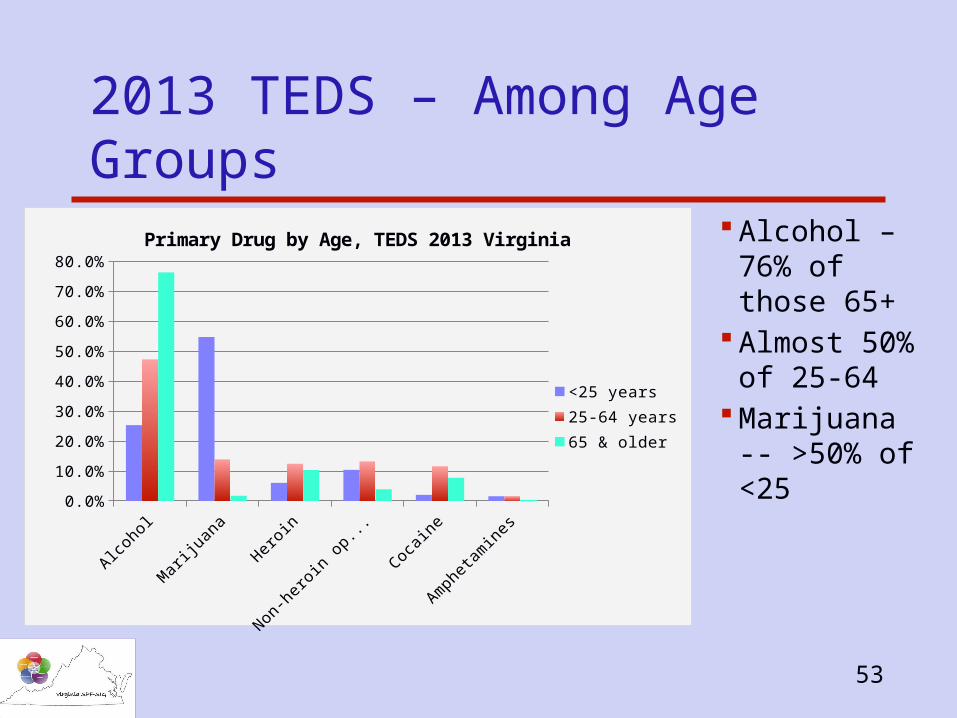
2013 TEDS – Among Age Groups
Alcohol – 76% of those 65+
Almost 50% of 25-64
Marijuana -- >50% of <25
Alcoho
l
Mar
ijuan
a
Heroi
n
Non-h
eroi
n op
ioid
s
Cocai
ne
Amph
etam
ines
0.0%
10.0%
20.0%
30.0%
40.0%
50.0%
60.0%
70.0%
80.0%
Primary Drug by Age, TEDS 2013 Virginia
<25 years25-64 years65 & older
54
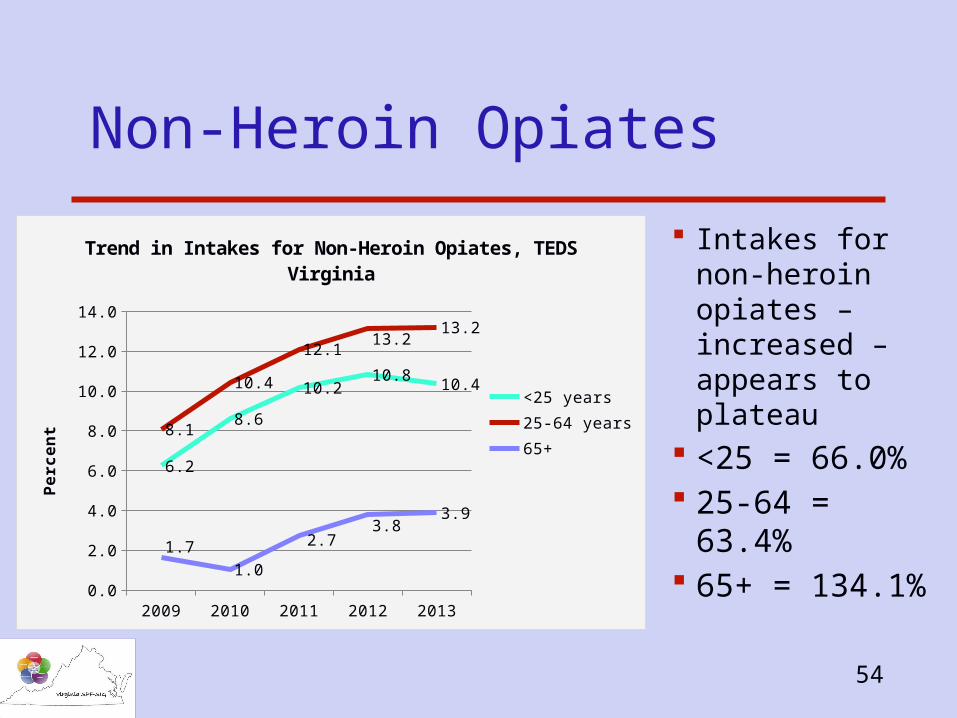
Non-Heroin Opiates
Intakes for non-heroin opiates – increased – appears to plateau
<25 = 66.0% 25-64 = 63.4% 65+ = 134.1%
2009 2010 2011 2012 20130.0
2.0
4.0
6.0
8.0
10.0
12.0
14.0
6.2
8.6
10.210.8
10.4
8.1
10.4
12.113.2
13.2
1.7
1.0
2.73.8
3.9
Trend in Intakes for Non-Heroin Opiates, TEDS Virginia
<25 years25-64 years65+
Pe
rce
nt
55
Youth Risk Behavior Survey
Survey of school-aged students:
Middle and High Schools
56
Youth Survey -- YRBS
Virginia conducted YRBS – 2013 Middle school – 6-8th grade High school – 9-12th grade Limited data available
MMWR report on High School findingsRegional tables for Middle School findings
Overall, lower rates then nationally
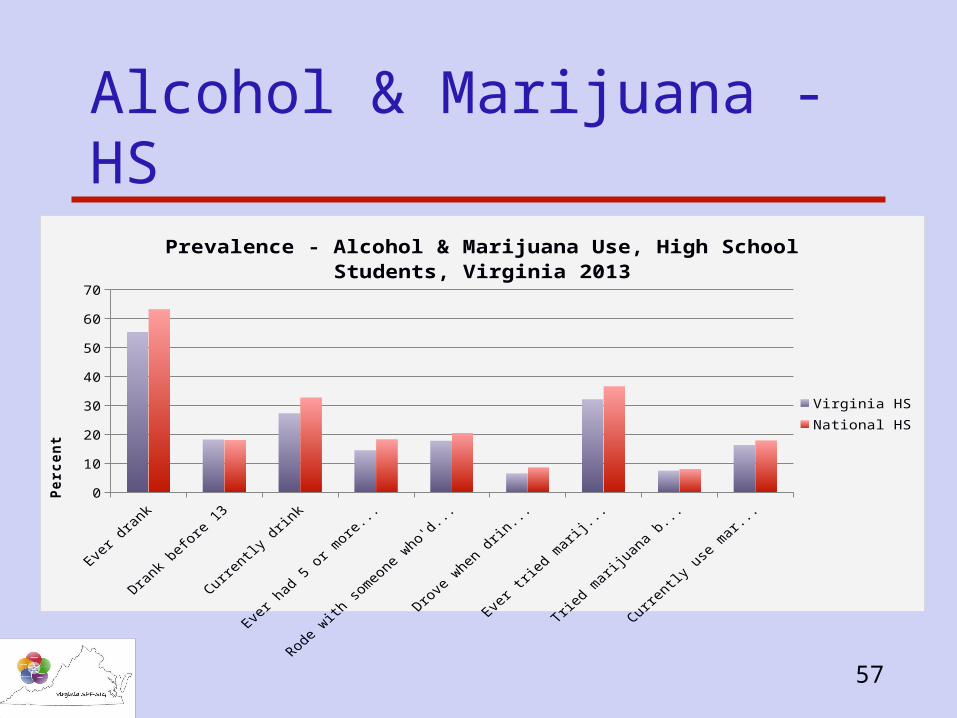
57
Alcohol & Marijuana - HS
0
10
20
30
40
50
60
70
Prevalence - Alcohol & Marijuana Use, High School Students, Virginia 2013
Virginia HS
National HS
Perc
en
t
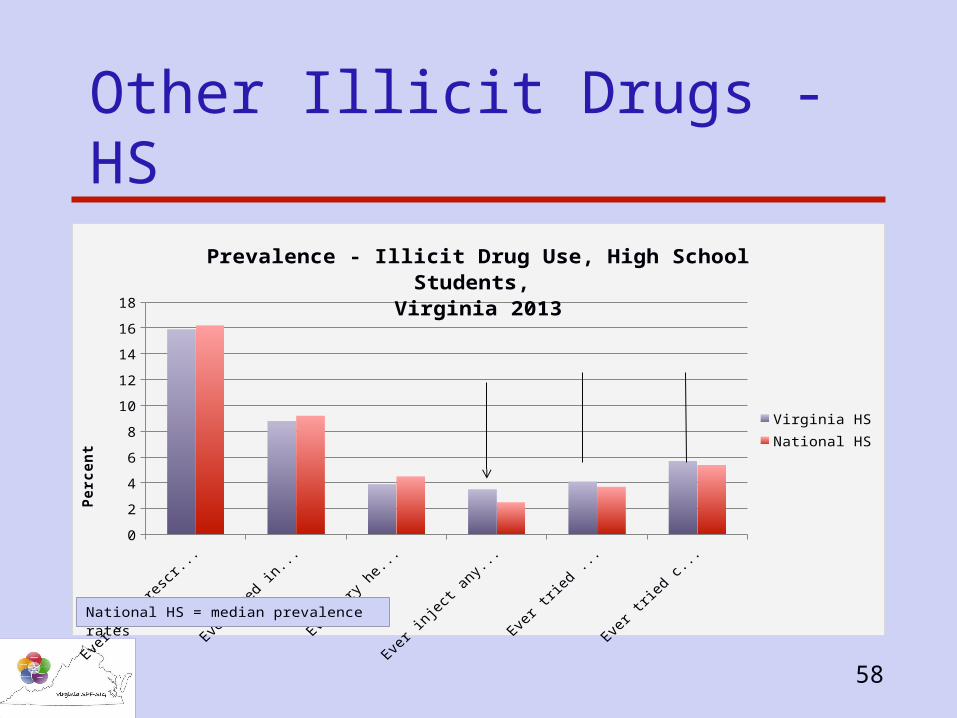
58
Other Illicit Drugs - HS
Ever use prescription
drug
Ever tred inhalant
Ever try heroin
Ever inject any illicit drug
Ever tried meth
Ever tried cocaine
0
2
4
6
8
10
12
14
16
18
Prevalence - Illicit Drug Use, High School Students, Virginia 2013
Virginia HS
National HS
Per
cen
t
National HS = median prevalence rates
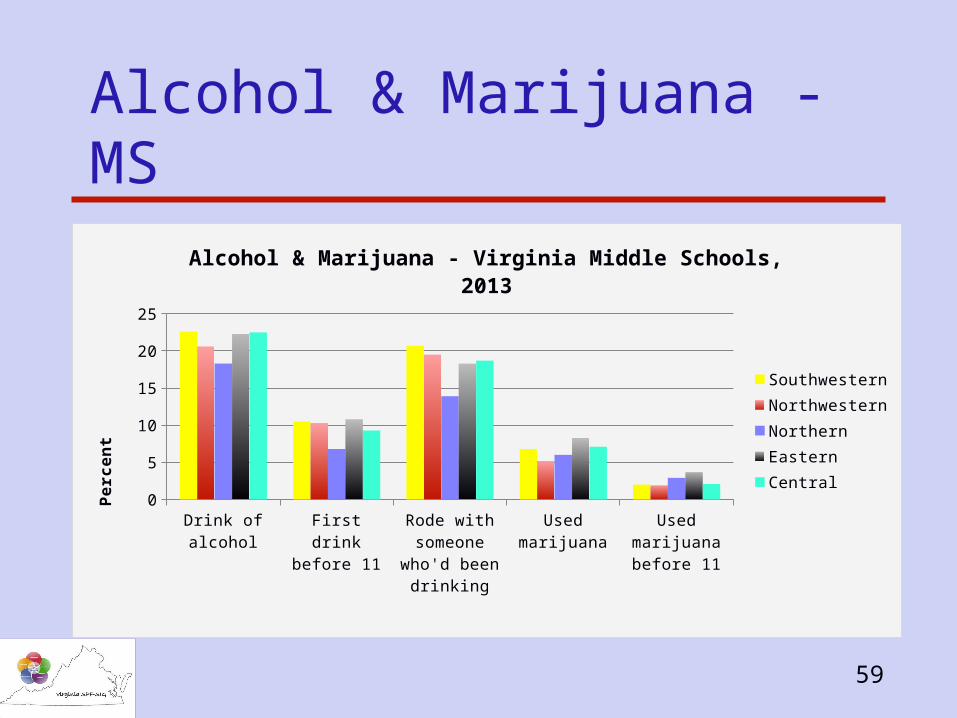
59
Alcohol & Marijuana - MS
Drink o
f alco
hol
First d
rink b
efor
e 11
Rode
with so
meo
ne w
ho'd
been
drin
king
Used
mar
ijuan
a
Used
mar
ijuan
a be
fore
11
0
5
10
15
20
25
Alcohol & Marijuana - Virginia Middle Schools, 2013
SouthwesternNorthwesternNorthernEasternCentralP
erc
en
t
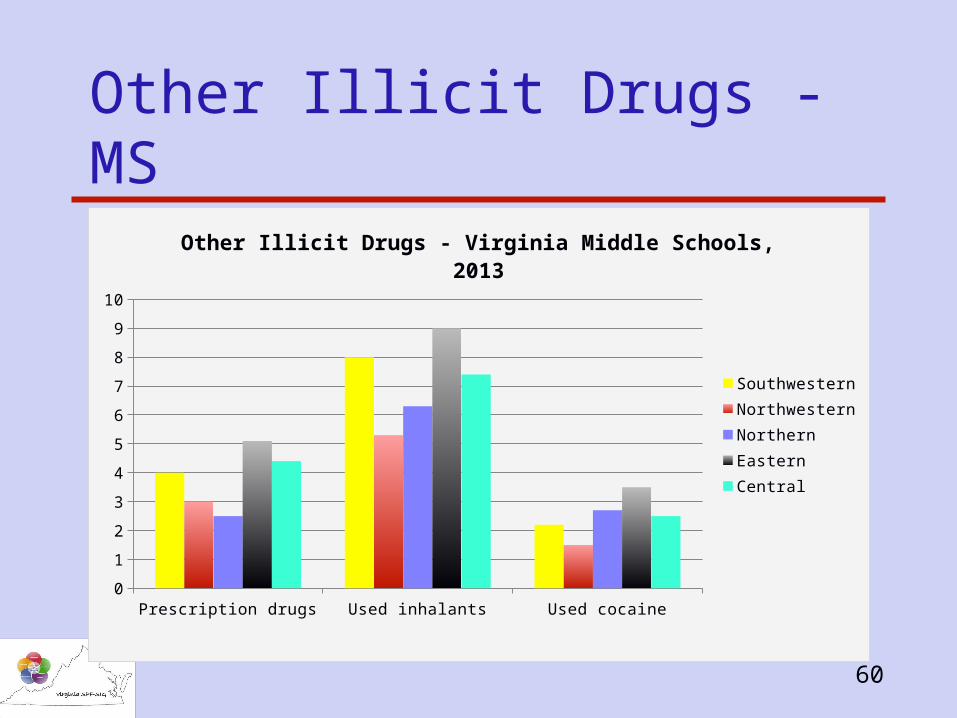
60
Other Illicit Drugs - MS
Prescription drugs Used inhalants Used cocaine0
1
2
3
4
5
6
7
8
9
10
Other Illicit Drugs - Virginia Middle Schools, 2013
SouthwesternNorthwesternNorthernEasternCentral
61
Young Adult Survey (YAS)
Survey of young adults 18-24 years of age
62
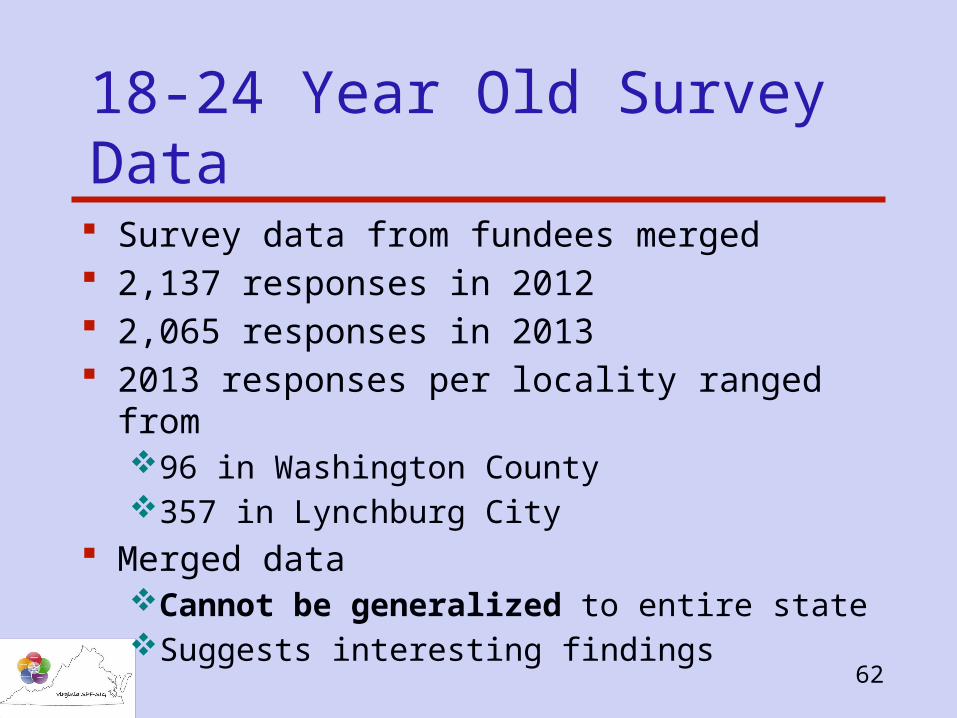
18-24 Year Old Survey Data
Survey data from fundees merged 2,137 responses in 2012 2,065 responses in 2013 2013 responses per locality ranged from
96 in Washington County357 in Lynchburg City
Merged data Cannot be generalized to entire state Suggests interesting findings
63
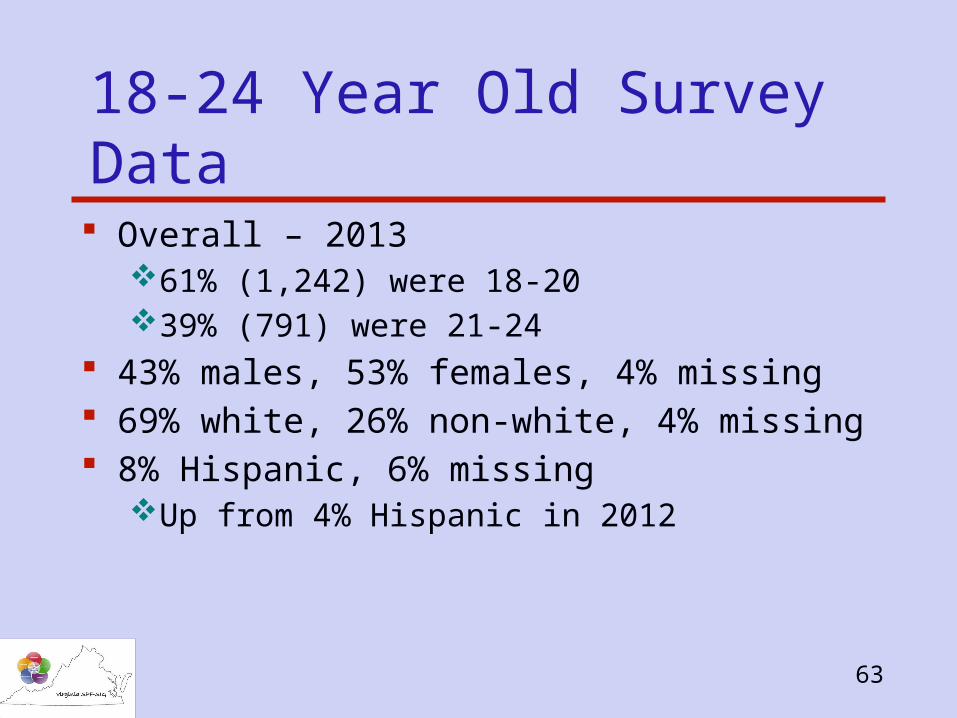
18-24 Year Old Survey Data
Overall – 201361% (1,242) were 18-2039% (791) were 21-24
43% males, 53% females, 4% missing 69% white, 26% non-white, 4% missing 8% Hispanic, 6% missing
Up from 4% Hispanic in 2012
64
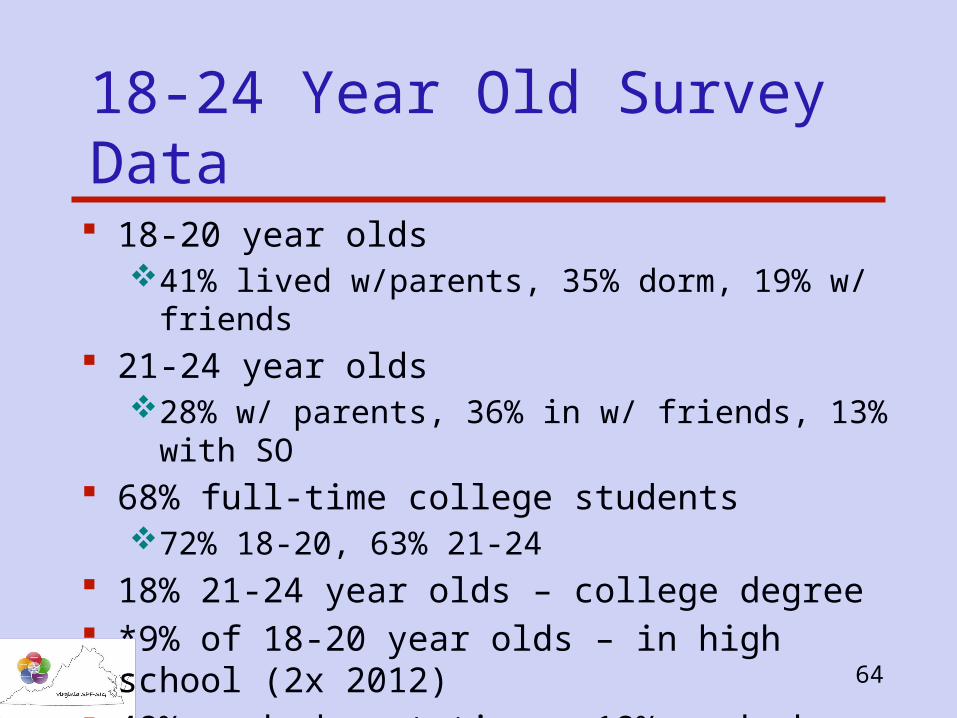
18-24 Year Old Survey Data
18-20 year olds41% lived w/parents, 35% dorm, 19% w/ friends
21-24 year olds28% w/ parents, 36% in w/ friends, 13% with SO
68% full-time college students 72% 18-20, 63% 21-24
18% 21-24 year olds – college degree *9% of 18-20 year olds – in high school (2x 2012) 48% worked part-time - 18% worked full-time
65
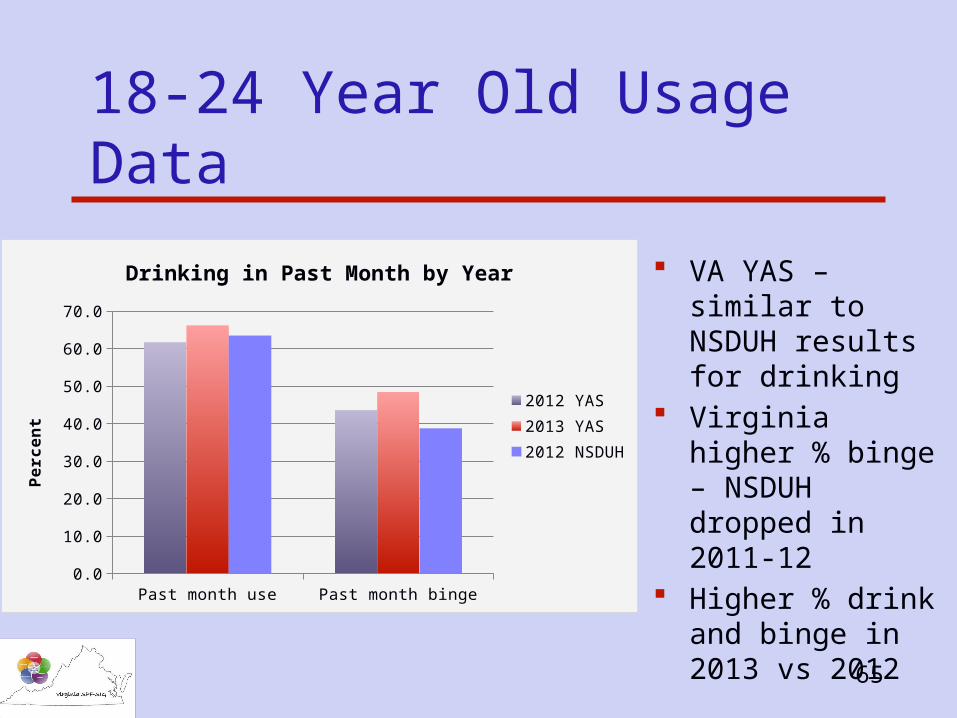
18-24 Year Old Usage Data
VA YAS – similar to NSDUH results for drinking
Virginia higher % binge – NSDUH dropped in 2011-12
Higher % drink and binge in 2013 vs 2012
Past month use Past month binge0.0
10.0
20.0
30.0
40.0
50.0
60.0
70.0
Drinking in Past Month by Year
2012 YAS2013 YAS2012 NSDUH
Pe
rce
nt
66
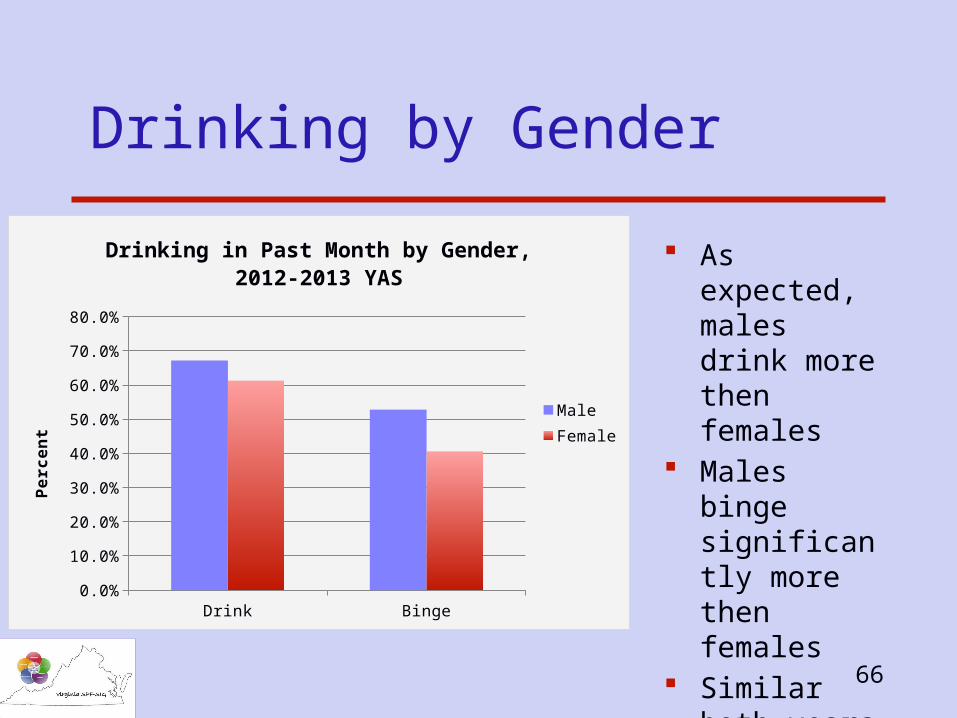
Drinking by Gender
As expected, males drink more then females
Males binge significantly more then females
Similar both years
Drink Binge0.0%
10.0%
20.0%
30.0%
40.0%
50.0%
60.0%
70.0%
80.0%
Drinking in Past Month by Gender, 2012-2013 YAS
MaleFemale
Pe
rce
nt
67
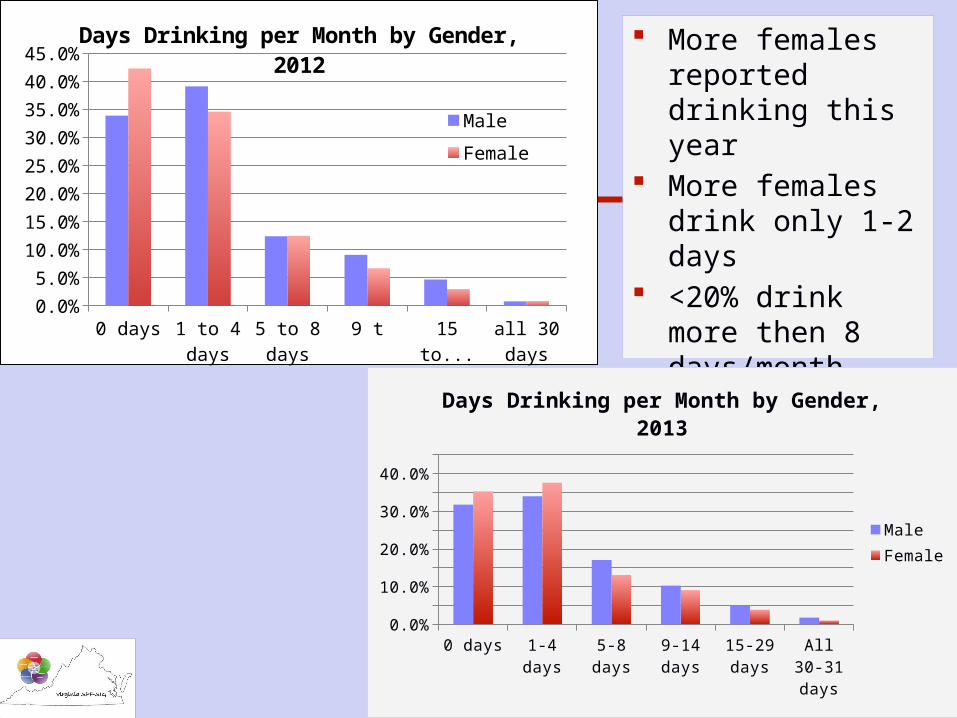
More females reported drinking this year
More females drink only 1-2 days
<20% drink more then 8 days/month
0 days 1-4 days 5-8 days 9-14 days
15-29 days
All 30-31 days
0.0%
5.0%
10.0%
15.0%
20.0%
25.0%
30.0%
35.0%
40.0%
45.0%
Days Drinking per Month by Gender, 2013
MaleFemale
0 days 1 to 4 days
5 to 8 days
9 to 14 days
15 to 29 days
all 30 days
0.0%5.0%
10.0%15.0%20.0%25.0%30.0%35.0%40.0%45.0%
Days Drinking per Month by Gender, 2012
Male
Female
68
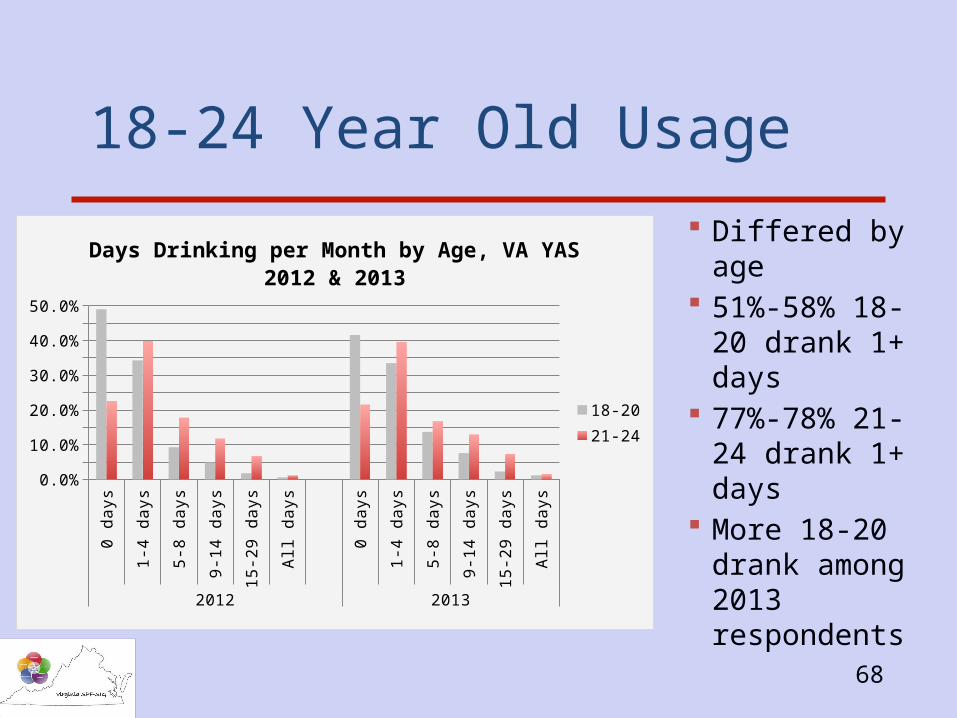
18-24 Year Old Usage
Differed by age 51%-58% 18-20
drank 1+ days 77%-78% 21-24
drank 1+ days More 18-20
drank among 2013 respondents
0 days
1-4 days
5-8 days
9-14 days
15-29
days
All days
0 days
1-4 days
5-8 days
9-14 days
15-29
days
All days
2012 2013
0.0%
5.0%
10.0%
15.0%
20.0%
25.0%
30.0%
35.0%
40.0%
45.0%
50.0%
Days Drinking per Month by Age, VA YAS 2012 & 2013
18-2021-24
69
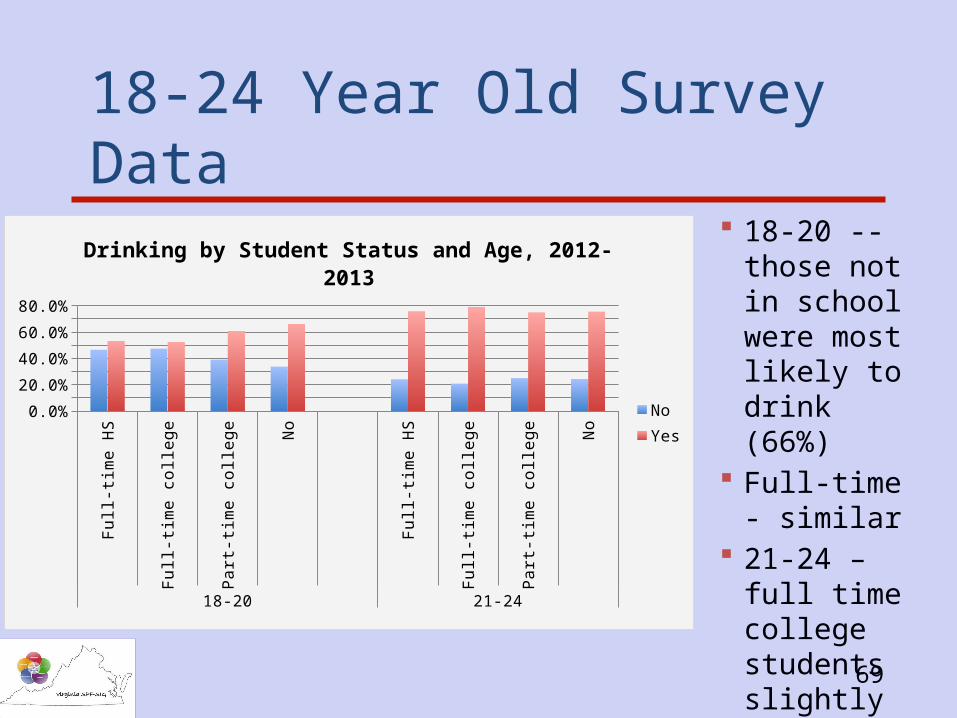
18-24 Year Old Survey Data
18-20 -- those not in school were most likely to drink (66%)
Full-time - similar
21-24 – full time college students slightly higher
Fu
ll-tim
e H
S
Fu
ll-tim
e c
olle
ge
Pa
rt-t
ime
co
lleg
e
No
Fu
ll-tim
e H
S
Fu
ll-tim
e c
olle
ge
Pa
rt-t
ime
co
lleg
e
No
18-20 21-24
0.0%
10.0%
20.0%
30.0%
40.0%
50.0%
60.0%
70.0%
80.0%
Drinking by Student Status and Age, 2012-2013
NoYes
70
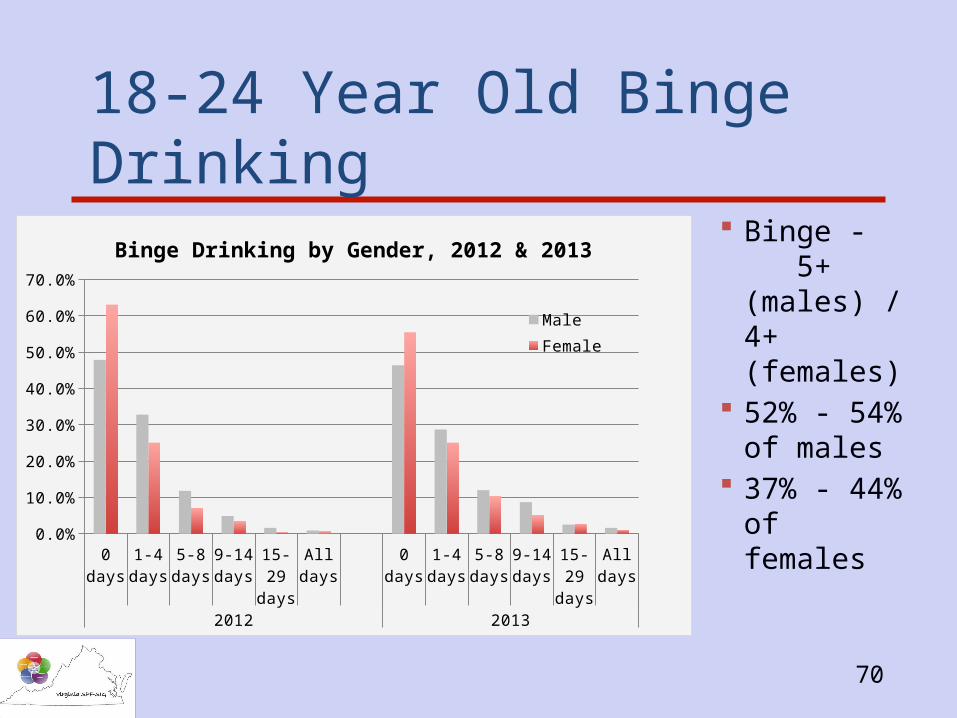
18-24 Year Old Binge Drinking
Binge - 5+ (males) / 4+ (females)
52% - 54% of males
37% - 44% of females
0 days
1-4 days
5-8 days
9-14 days
15-29
days
All days
0 days
1-4 days
5-8 days
9-14 days
15-29
days
All days
2012 2013
0.0%
10.0%
20.0%
30.0%
40.0%
50.0%
60.0%
70.0%
Binge Drinking by Gender, 2012 & 2013
Male
Female
71
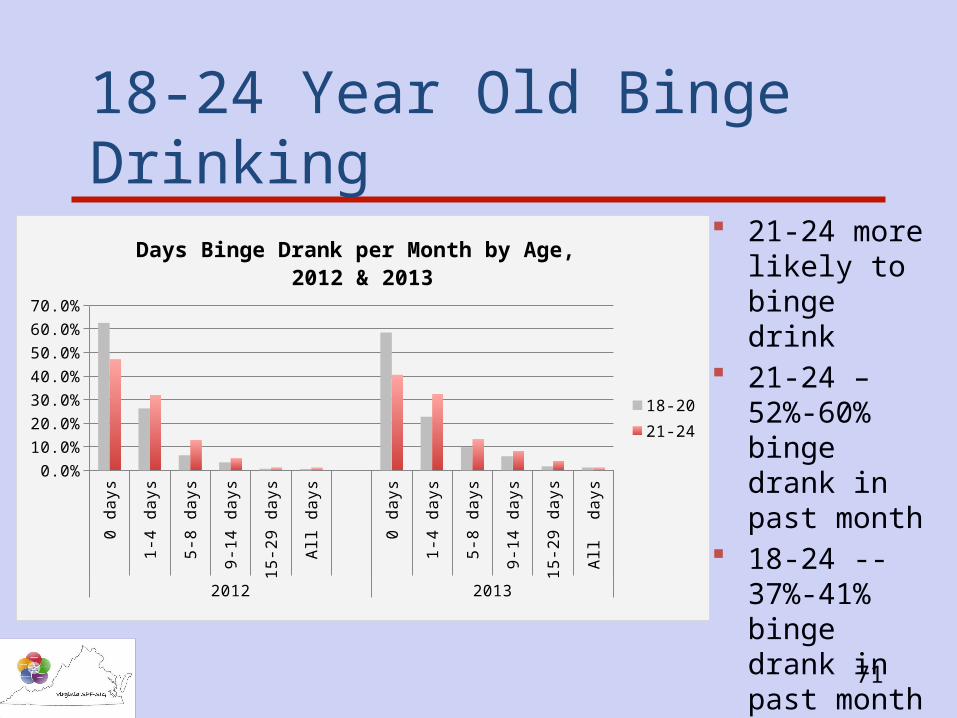
18-24 Year Old Binge Drinking
21-24 more likely to binge drink
21-24 –52%-60% binge drank in past month
18-24 -- 37%-41% binge drank in past month
0 days
1-4 days
5-8 days
9-14 days
15-29
days
All days
0 days
1-4 days
5-8 days
9-14 days
15-29
days
All days
2012 2013
0.0%
10.0%
20.0%
30.0%
40.0%
50.0%
60.0%
70.0%
Days Binge Drank per Month by Age, 2012 & 2013
18-2021-24
72
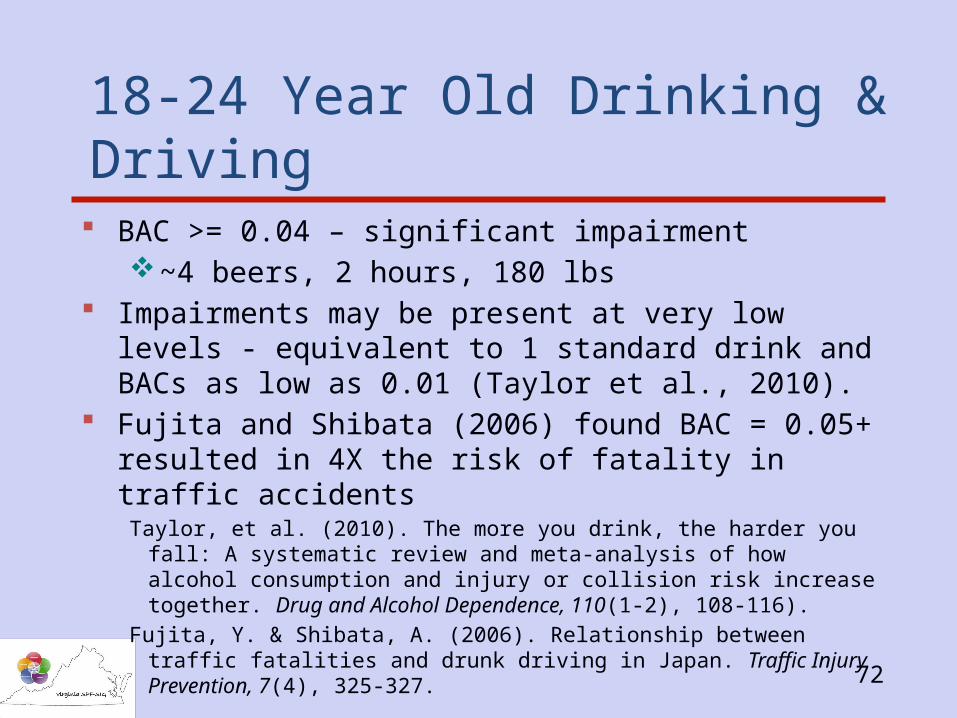
18-24 Year Old Drinking & Driving
BAC >= 0.04 – significant impairment~4 beers, 2 hours, 180 lbs
Impairments may be present at very low levels - equivalent to 1 standard drink and BACs as low as 0.01 (Taylor et al., 2010).
Fujita and Shibata (2006) found BAC = 0.05+ resulted in 4X the risk of fatality in traffic accidents
Taylor, et al. (2010). The more you drink, the harder you fall: A systematic review and meta-analysis of how alcohol consumption and injury or collision risk increase together. Drug and Alcohol Dependence, 110(1-2), 108-116).
Fujita, Y. & Shibata, A. (2006). Relationship between traffic fatalities and drunk driving in Japan. Traffic Injury Prevention, 7(4), 325-327.
73
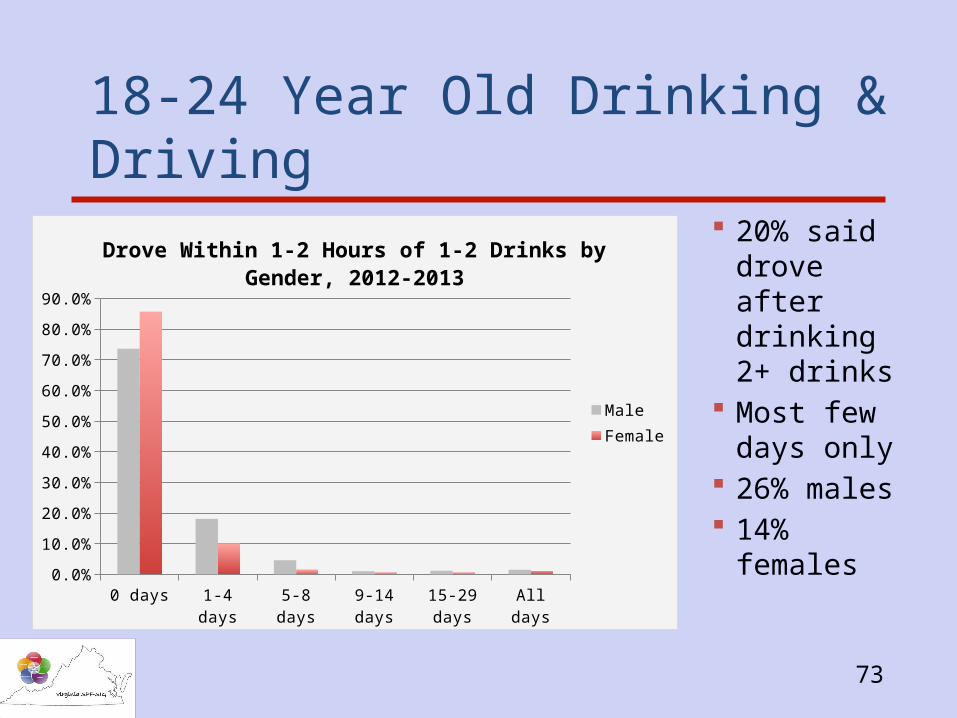
18-24 Year Old Drinking & Driving
20% said drove after drinking 2+ drinks
Most few days only
26% males 14% females
0 days 1-4 days 5-8 days 9-14 days 15-29 days
All days0.0%
10.0%
20.0%
30.0%
40.0%
50.0%
60.0%
70.0%
80.0%
90.0%
Drove Within 1-2 Hours of 1-2 Drinks by Gender, 2012-2013
MaleFemale
74
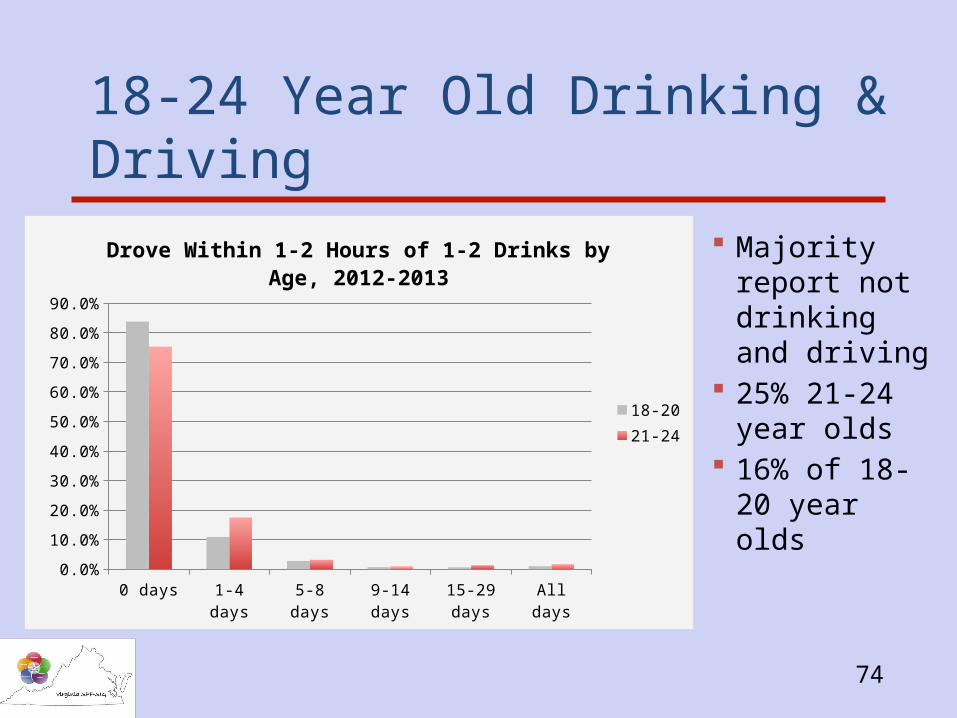
18-24 Year Old Drinking & Driving
Majority report not drinking and driving
25% 21-24 year olds
16% of 18-20 year olds
0 days 1-4 days 5-8 days 9-14 days 15-29 days
All days0.0%
10.0%
20.0%
30.0%
40.0%
50.0%
60.0%
70.0%
80.0%
90.0%
Drove Within 1-2 Hours of 1-2 Drinks by Age, 2012-2013
18-2021-24
75
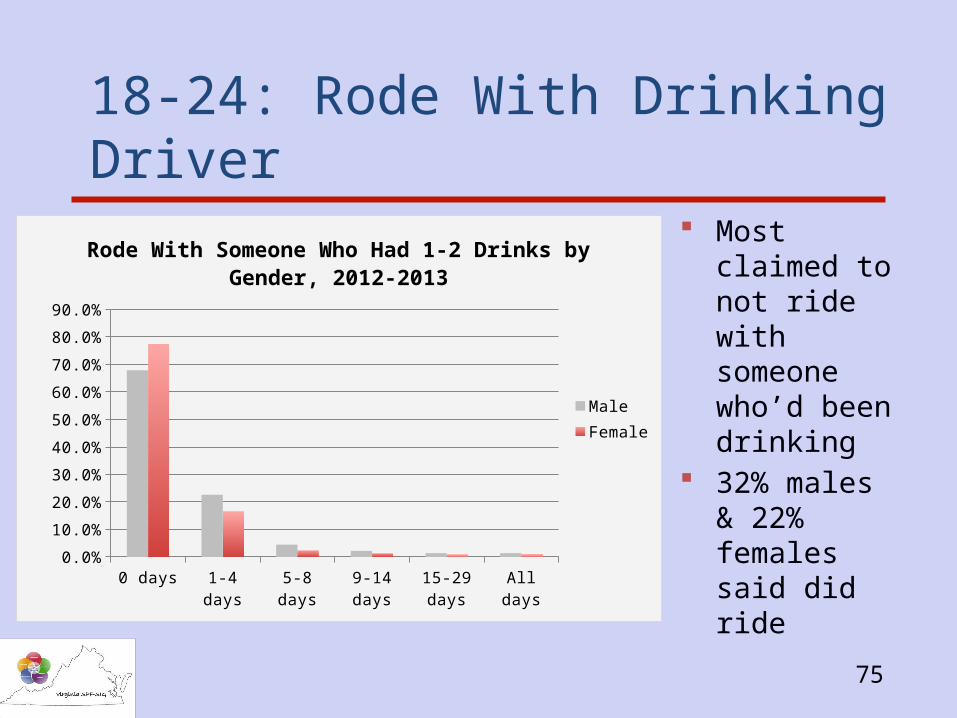
18-24: Rode With Drinking Driver
Most claimed to not ride with someone who’d been drinking
32% males & 22% females said did ride
0 days 1-4 days 5-8 days 9-14 days 15-29 days
All days0.0%
10.0%
20.0%
30.0%
40.0%
50.0%
60.0%
70.0%
80.0%
90.0%
Rode With Someone Who Had 1-2 Drinks by Gender, 2012-2013
MaleFemale
76
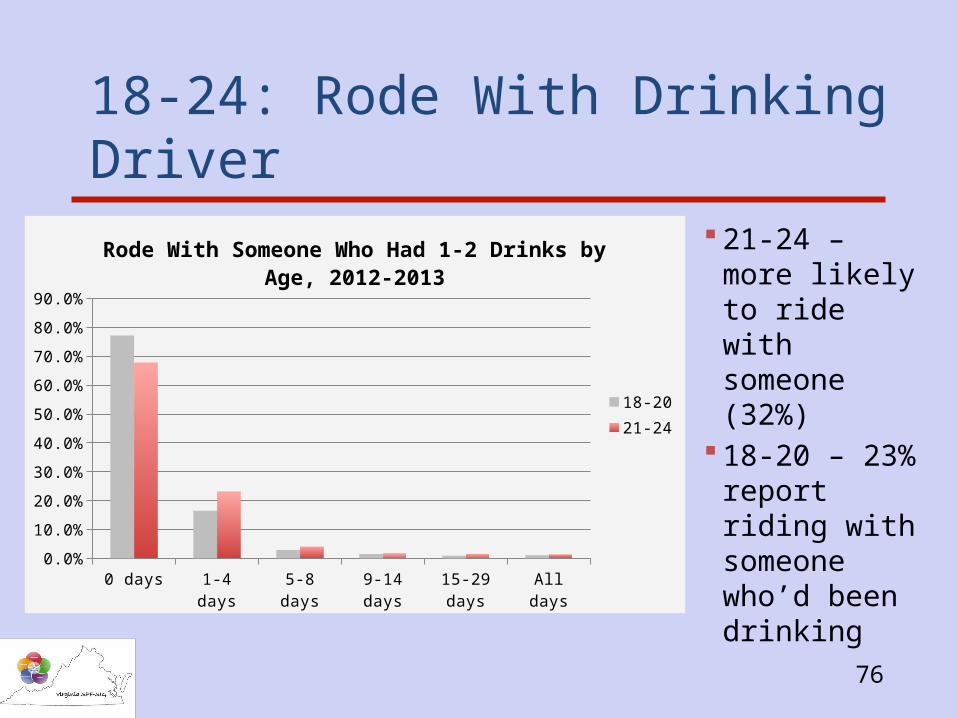
18-24: Rode With Drinking Driver
21-24 – more likely to ride with someone (32%)
18-20 – 23% report riding with someone who’d been drinking
0 days 1-4 days 5-8 days 9-14 days 15-29 days All days0.0%
10.0%
20.0%
30.0%
40.0%
50.0%
60.0%
70.0%
80.0%
90.0%
Rode With Someone Who Had 1-2 Drinks by Age, 2012-2013
18-2021-24
77
18-24 Year Old Risk Perceptions
Survey asked – “risk” of binge drinking and drink-driving*
Risk of drinking 5 (males) or 4 (females) drinks on a single occasion
Risk of driving after drinking 1-2 drinks Risk of driving after 5 (males) or 4 (females) drinks ~400 (10%) missing
*World Health Organization promotes this term globally
78
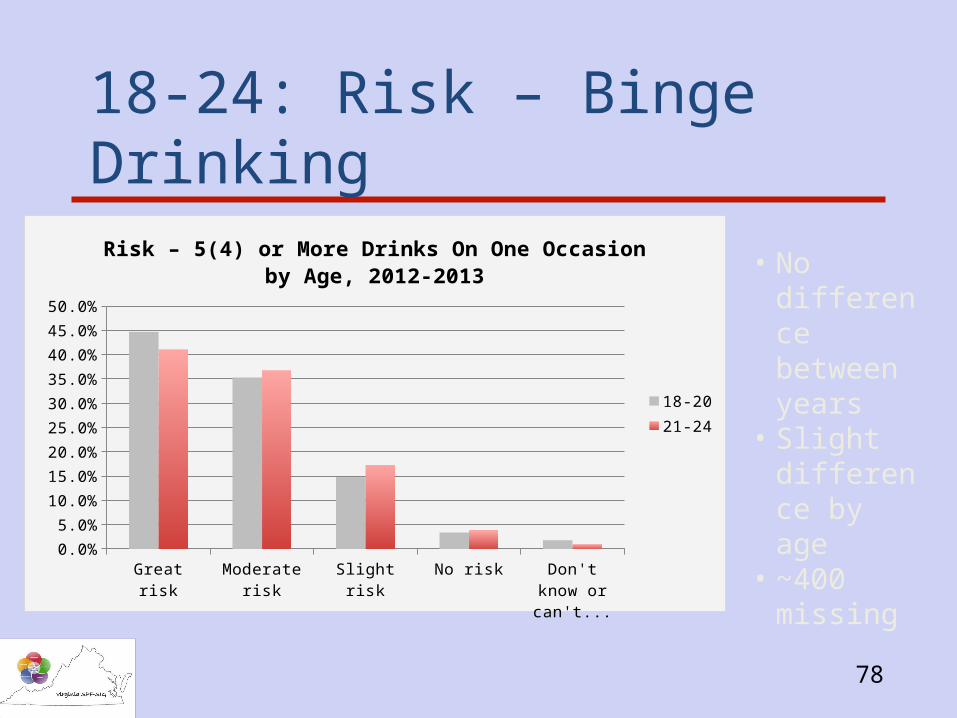
18-24: Risk – Binge Drinking
• No difference between years
• Slight difference by age
• ~400 missing
Great risk Moderate risk Slight risk No risk Don't know or can't say
0.0%
5.0%
10.0%
15.0%
20.0%
25.0%
30.0%
35.0%
40.0%
45.0%
50.0%
Risk – 5(4) or More Drinks On One Occasion by Age, 2012-2013
18-2021-24
79
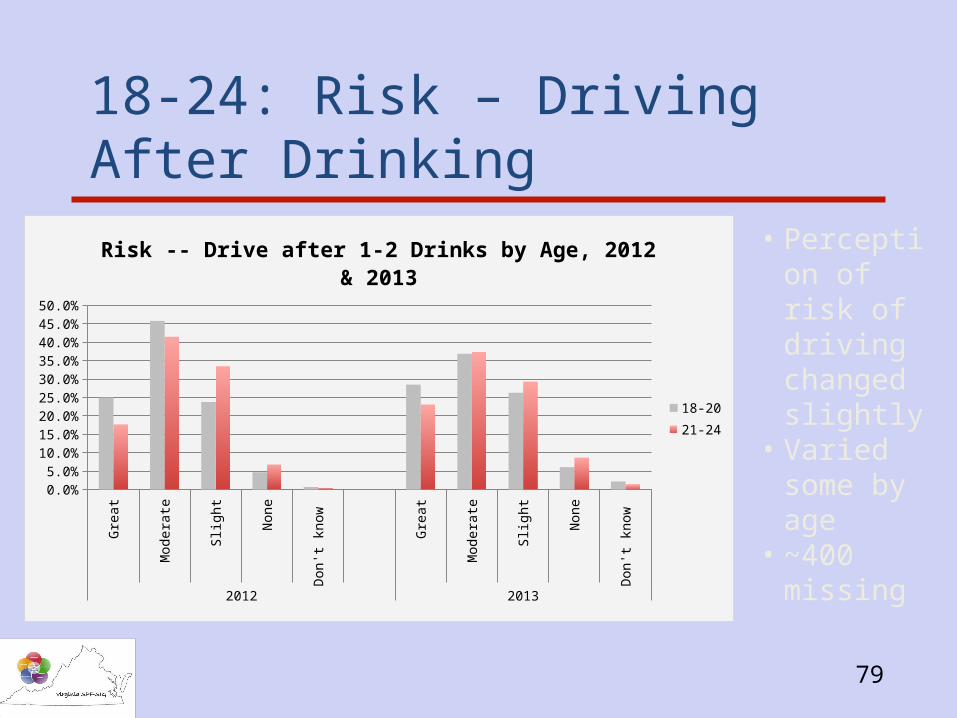
18-24: Risk – Driving After DrinkingG
reat
Mod
erat
e
Slig
ht
Non
e
Don
't kn
ow
Gre
at
Mod
erat
e
Slig
ht
Non
e
Don
't kn
ow
2012 2013
0.0%
5.0%
10.0%
15.0%
20.0%
25.0%
30.0%
35.0%
40.0%
45.0%
50.0%
Risk -- Drive after 1-2 Drinks by Age, 2012 & 2013
18-20
21-24
• Perception of risk of driving changed slightly
• Varied some by age
• ~400 missing
80
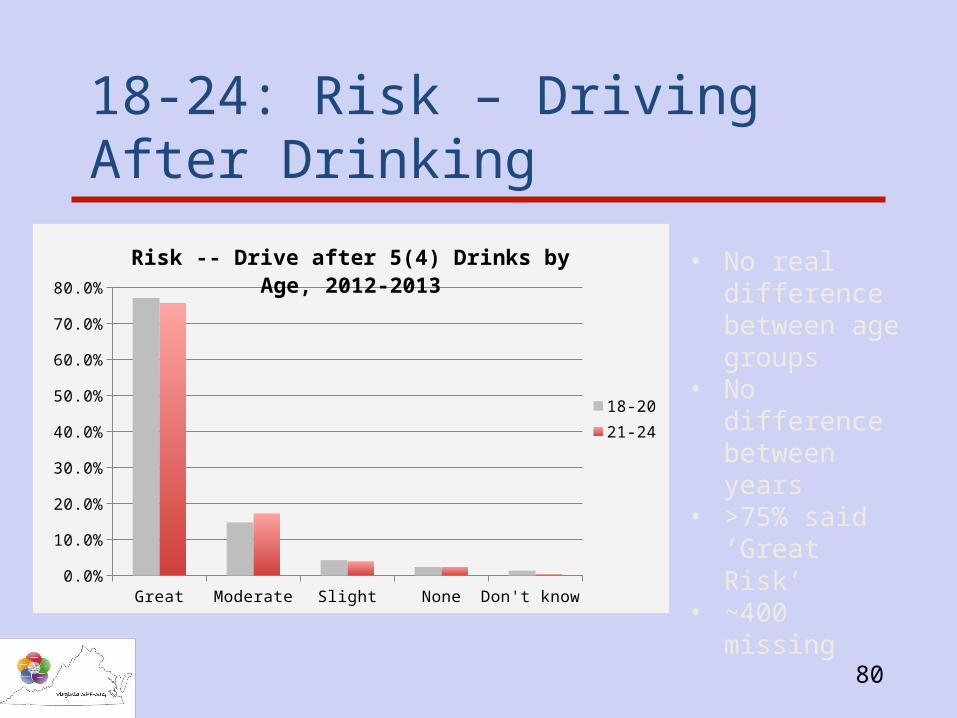
18-24: Risk – Driving After Drinking
• No real difference between age groups
• No difference between years
• >75% said ‘Great Risk’
• ~400 missing
Great Moderate Slight None Don't know 0.0%
10.0%
20.0%
30.0%
40.0%
50.0%
60.0%
70.0%
80.0%
Risk -- Drive after 5(4) Drinks by Age, 2012-2013
18-2021-24
81
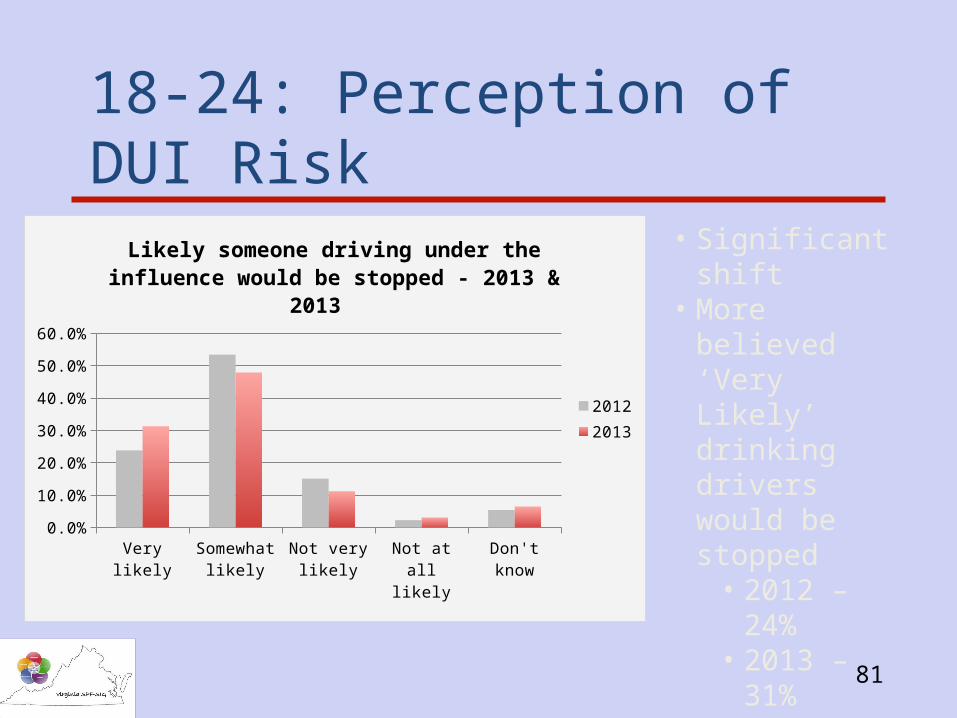
18-24: Perception of DUI Risk
Very likely Somewhat likely
Not very likely
Not at all likely
Don't know0.0%
10.0%
20.0%
30.0%
40.0%
50.0%
60.0%
Likely someone driving under the influence would be stopped - 2013 & 2013
20122013
• Significant shift• More believed
‘Very Likely’ drinking drivers would be stopped
• 2012 – 24%• 2013 – 31%
• ‘Not very or Not at all’ dropped
• 2012 – 17%• 2013 – 14%
82
18-24: Perceptions of Risk
70% said Very Likely or Somewhat Likely someone would be sold / served alcohol if drunk
83% said Very Likely or Somewhat Likely someone would be arrested if drinking and driving
Only question about being stopped So -- perception of being stopped improvedBut – perception of actually getting a DUI did not
83
18-24 Year Old Attitudes
34% said ‘Acceptable / Somewhat acceptable’ to provide alcohol for people <21
55% said ‘Acceptable/Somewhat’ for 18-20 year olds to have 1-2 drinks
38% said ‘Acceptable/Somewhat’ for 18-20 year olds to get drunk
Significant differences from 2012-2013 in attitudes about 15-17 year olds
84
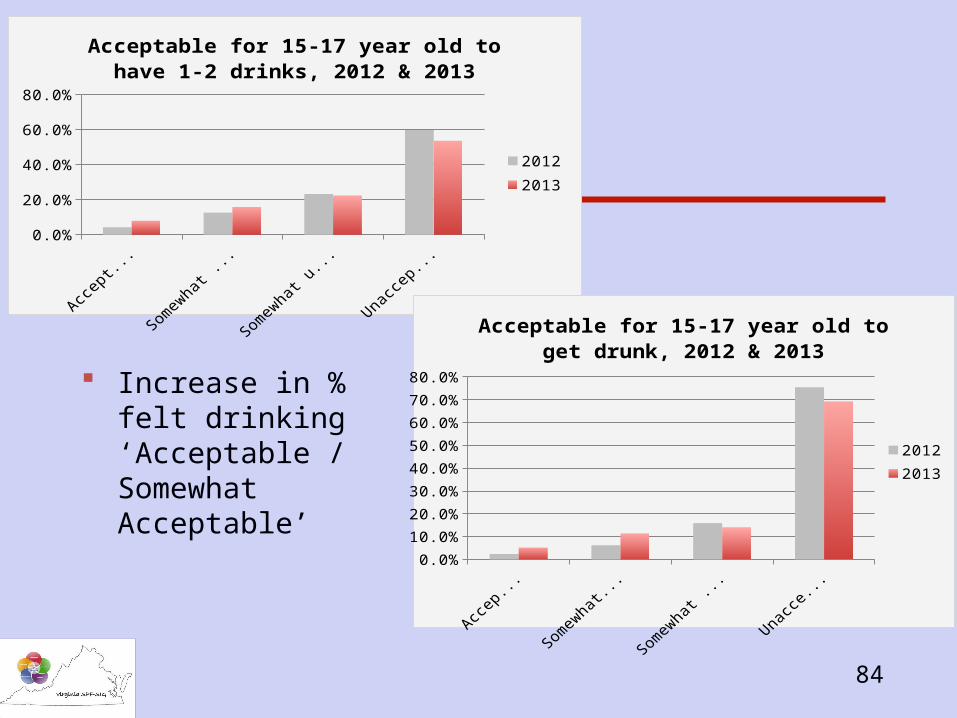
Increase in % felt drinking ‘Acceptable / Somewhat Acceptable’
0.0%10.0%20.0%30.0%40.0%50.0%60.0%70.0%
Acceptable for 15-17 year old to have 1-2 drinks, 2012 & 2013
2012
2013
0.0%
10.0%
20.0%
30.0%
40.0%
50.0%
60.0%
70.0%
80.0%
Acceptable for 15-17 year old to get drunk, 2012 & 2013
20122013
85
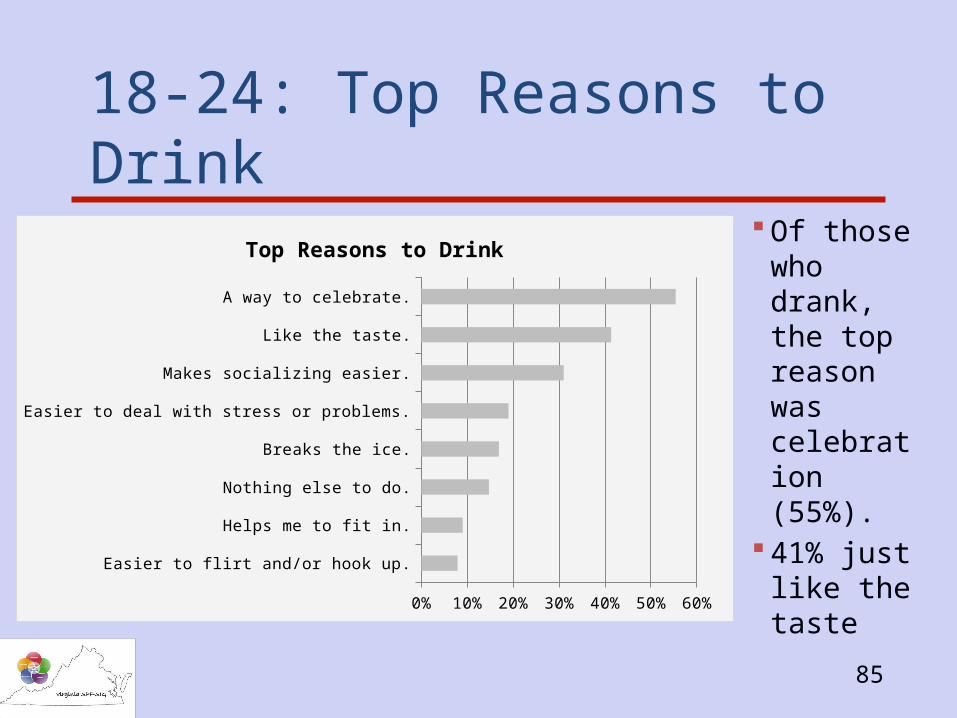
18-24: Top Reasons to Drink
Of those who drank, the top reason was celebration (55%).
41% just like the taste
Easier to flirt and/or hook up.
Helps me to fit in.
Nothing else to do.
Breaks the ice.
Easier to deal with stress or problems.
Makes socializing easier.
Like the taste.
A way to celebrate.
0% 10% 20% 30% 40% 50% 60%
Top Reasons to Drink
86
18-24: Getting Alcohol
62% said sort of /very easy to get alcohol if underage 90% of 21-24 year olds purchased alcohol 19% of 18-20 year olds purchased 72% of 18-20 year olds got from friends 29% of 18-20 year olds got from parents 9% of 18-20 year olds stole from parents or store
87
18-24: Getting Alcohol
37% of respondents said they were NOT asked to show an ID last time they bought alcohol – same as 2012
Overall 43% 21-24 year olds said they had provided alcohol to someone under 21
48% in 2013 – 38% in 2012 16% said they’d used a fake ID in 2013 –
compared to 9% in 2012
88
18-24: Drinking Games
Less then 50% localities included questions Of those that did –
Only 3% said ‘Not at all popular’ in 2012Increase to 11% in 201349% participated in 2012 – 44% in 2013
8% said rapid consumption not popular in 2012Up to 14% in 201335% participated both years
89
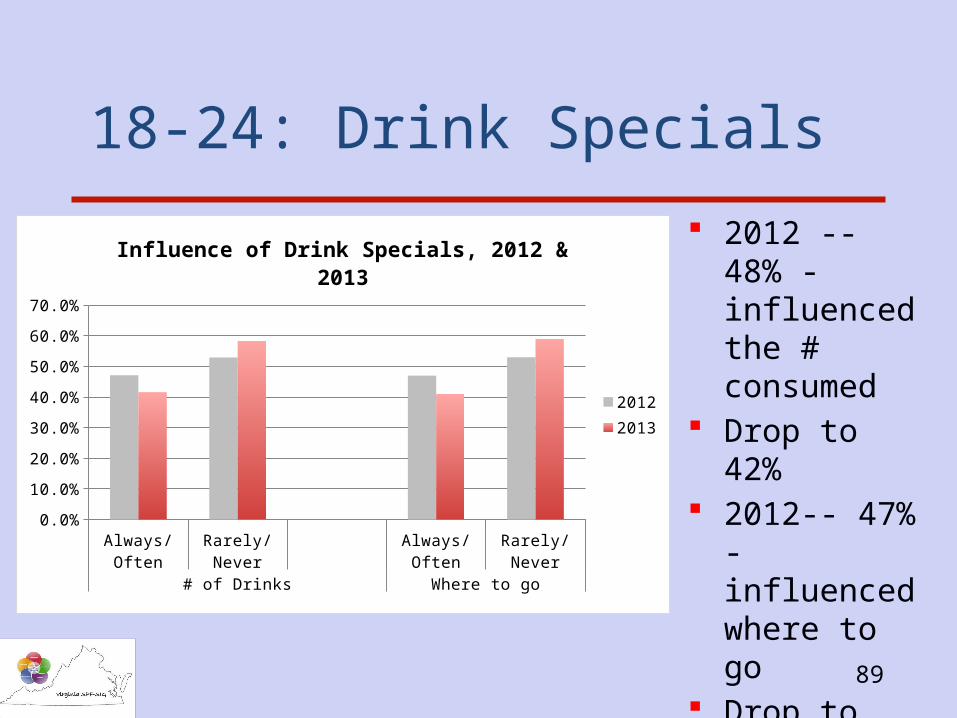
18-24: Drink Specials
2012 -- 48% - influenced the # consumed
Drop to 42% 2012-- 47% -
influenced where to go
Drop to 41%
Alw
ays
/Ofte
n
Ra
rely
/Ne
ver
Alw
ays
/Ofte
n
Ra
rely
/Ne
ver
# of Drinks Where to go
0.0%
10.0%
20.0%
30.0%
40.0%
50.0%
60.0%
70.0%
Influence of Drink Specials, 2012 & 2013
20122013
90
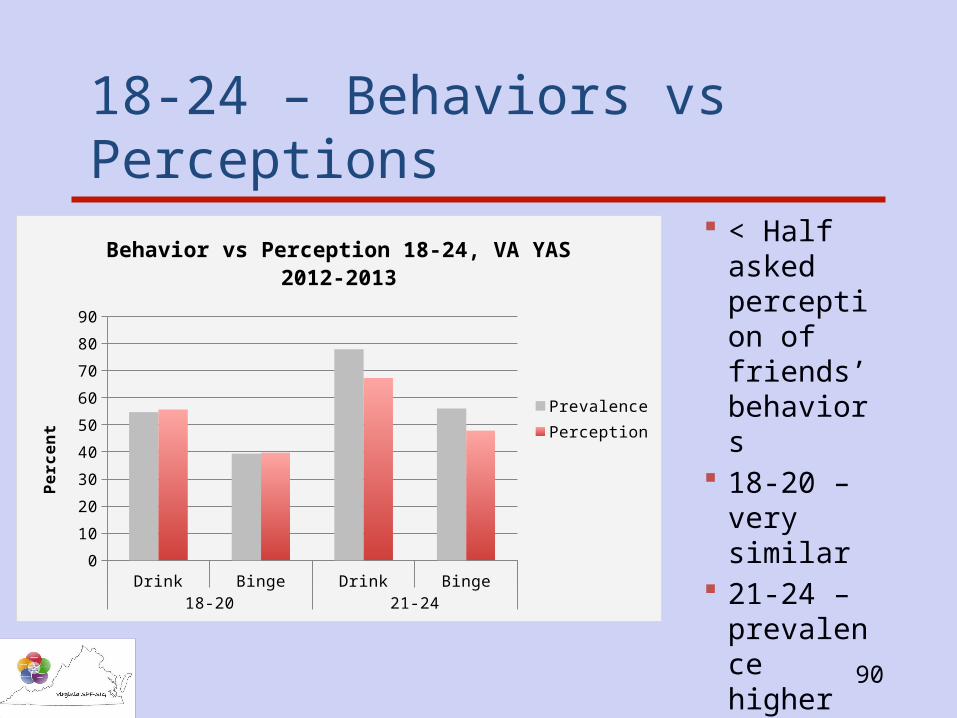
18-24 – Behaviors vs Perceptions
< Half asked perception of friends’ behaviors
18-20 – very similar
21-24 – prevalence higher then perceptionDrink Binge Drink Binge
18-20 21-24
0
10
20
30
40
50
60
70
80
90
Behavior vs Perception 18-24, VA YAS 2012-2013
PrevalencePerception
Pe
rce
nt
91
18-24 Year Old Survey
To be repeated third time late this year Localities including evaluation questions
regarding environmental strategies Hope to see decreases in risky behaviors in
localities appropriate for interventions
92
Warning System Aims to Detect Emerging Trends in Illegal Drug Use
A national surveillance system Use both traditional data collection strategies andScans of social media and web platforms toIdentify emerging designer synthetic drugs and
their metabolites (http://1.usa.gov/1mRw1XJ). NIDA-5 years of funding to the UMd Center for
Substance Abuse Research NDEWS
93
NDEWS
“NDEWS will generate critically needed information about new drug trends in specific locations around the country so rapid, informed, and effective public health responses can be developed precisely where needed...”
“By monitoring trends at the local level, we hope to prevent emerging drug problems from escalating or spreading to surrounding regions.”
NIDA Director Dr. Nora D. Volkow
Tracy Hampton, PhD. JAMA. 2014;312(8):779 doi:10.1001/jama.2014.10966
94
Final Notes
Co-morbidity – mental health / SANeed to explore data sources – nothing currently
available statewide1.7% of NSDUH 2002-2011 fit the definition of SMI and
drug or alcohol abuse/dependenceNumbers too small to get detail
Returning militaryNeed to explore data sources