1 financial statement analysis for credit by binam ghimire
TRANSCRIPT
1
Financial Statement Analysis for Creditby Binam Ghimire
Learning Objectives
Session 8
1. Cross Sectional Analysis; 2. Time Series Analysis; 3. Importance of Profitability, Liquidity, and Leverage
Session 91. Profitability, Liquidity and Leverage Ratios; 2. Making Credit Decisions; 3. Limitations of Financial Ratios
Introduction
Throughout the last few sessions we have examined the Published Financial Statements:Their content andBasic evaluation
In this session, we will take a detailed look at the Income Statement and Balance Sheet in order to assess whether organisations are eligible for credit by undertaking Financial Ratio Analysis
Financial Ratio Analysis
Financial Ratio Analysis is the process of reviewing and interpreting financial information for the purpose of appraising the financial health and operating performance of a company.
This may involve:
cross-sectional techniques
time-series techniques
Cross-Sectional Techniques
• The study of relationships within financial statements at a point in time
• e.g. comparisons of one company with other companies at the same point in time and
Time-Series Techniques
• The study of trends in relationships within financial statements over time
• e.g. comparisons of one company at different points in time
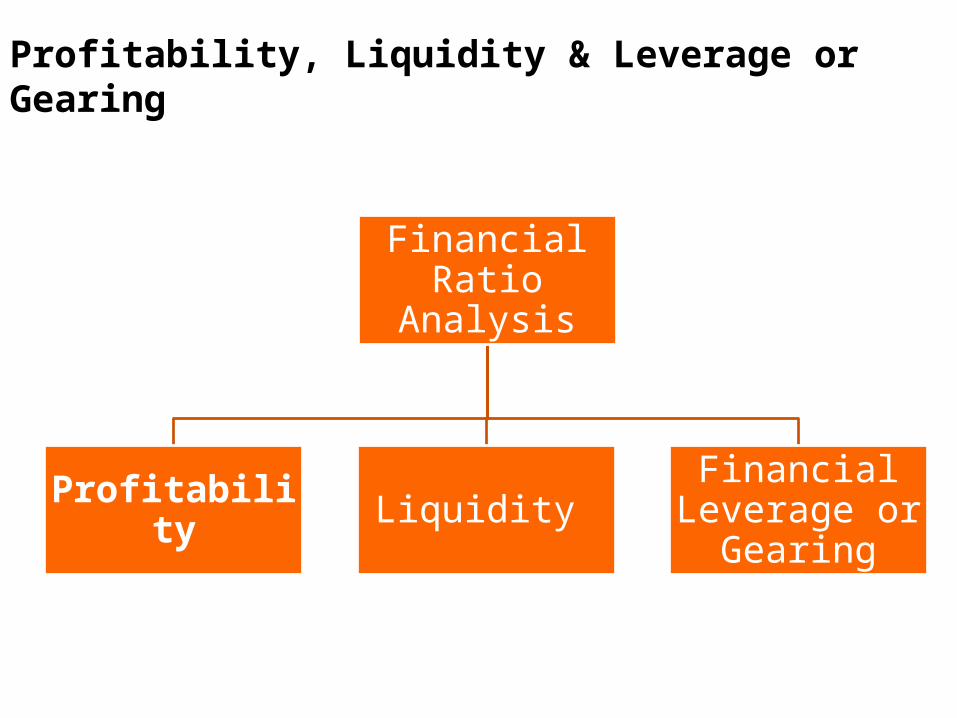
Profitability, Liquidity & Leverage or Gearing
Financial Ratio
Analysis
Profitability Liquidity Financial
Leverage or Gearing
The Importance of Profit
Businesses exist to make a Profit Profit will eventually turn into cash which can fund
future growth and provide a return for the owners Without profits you can’t pay Dividends and if
investors don’t receive a return on their investment they will eventually leave
Running at a loss will eventually result is cash deficits and ultimately liquidation
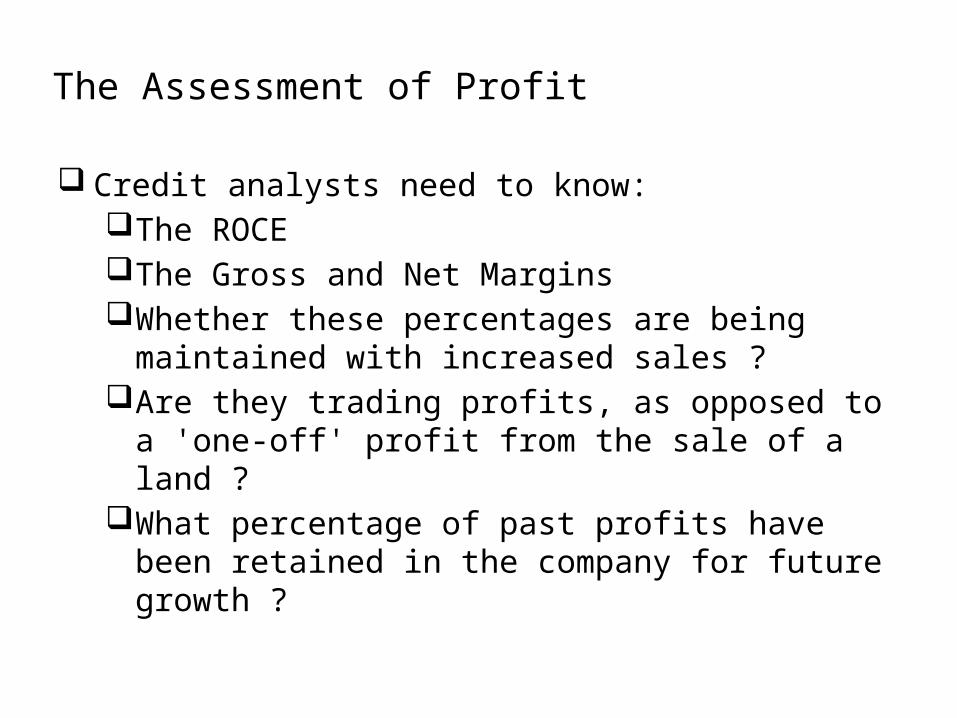
The Assessment of Profit
Credit analysts need to know:The ROCE The Gross and Net Margins Whether these percentages are being
maintained with increased sales ? Are they trading profits, as opposed to a 'one-
off' profit from the sale of a land ? What percentage of past profits have been
retained in the company for future growth ?
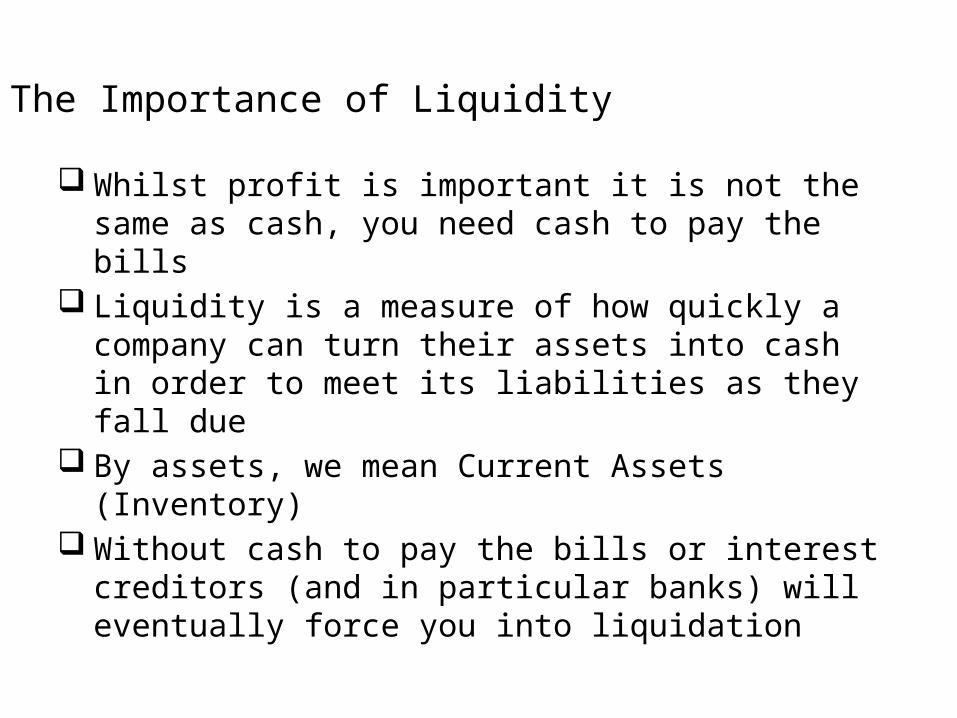
The Importance of Liquidity
Whilst profit is important it is not the same as cash, you need cash to pay the bills
Liquidity is a measure of how quickly a company can turn their assets into cash in order to meet its liabilities as they fall due
By assets, we mean Current Assets (Inventory) Without cash to pay the bills or interest creditors
(and in particular banks) will eventually force you into liquidation
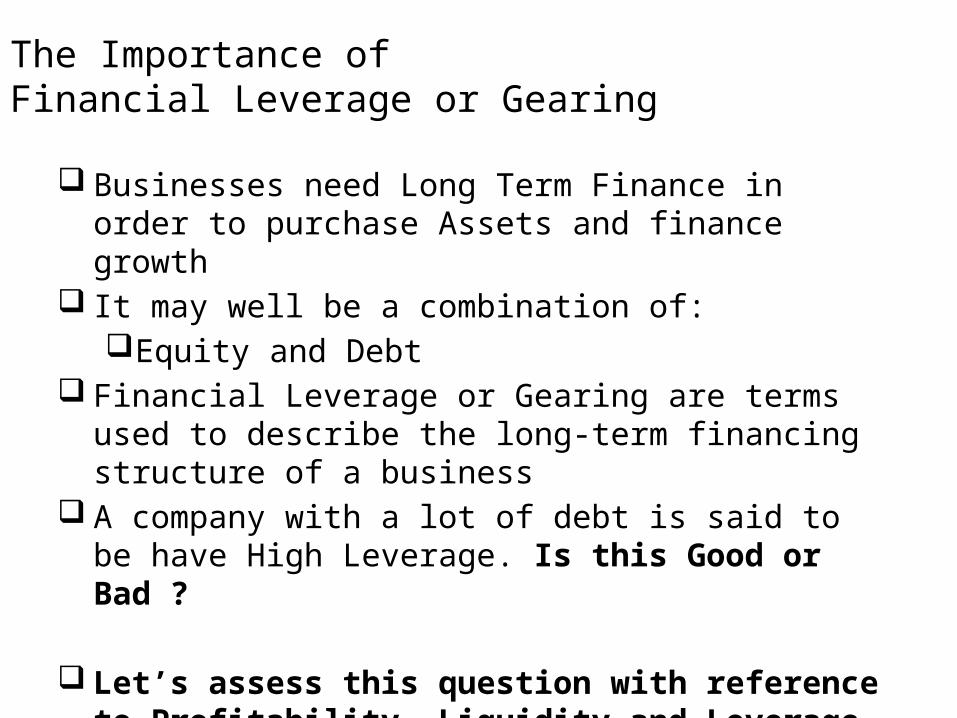
The Importance of Financial Leverage or Gearing
Businesses need Long Term Finance in order to purchase Assets and finance growth
It may well be a combination of:Equity and Debt
Financial Leverage or Gearing are terms used to describe the long-term financing structure of a business
A company with a lot of debt is said to be have High Leverage. Is this Good or Bad ?
Let’s assess this question with reference to Profitability, Liquidity and Leverage
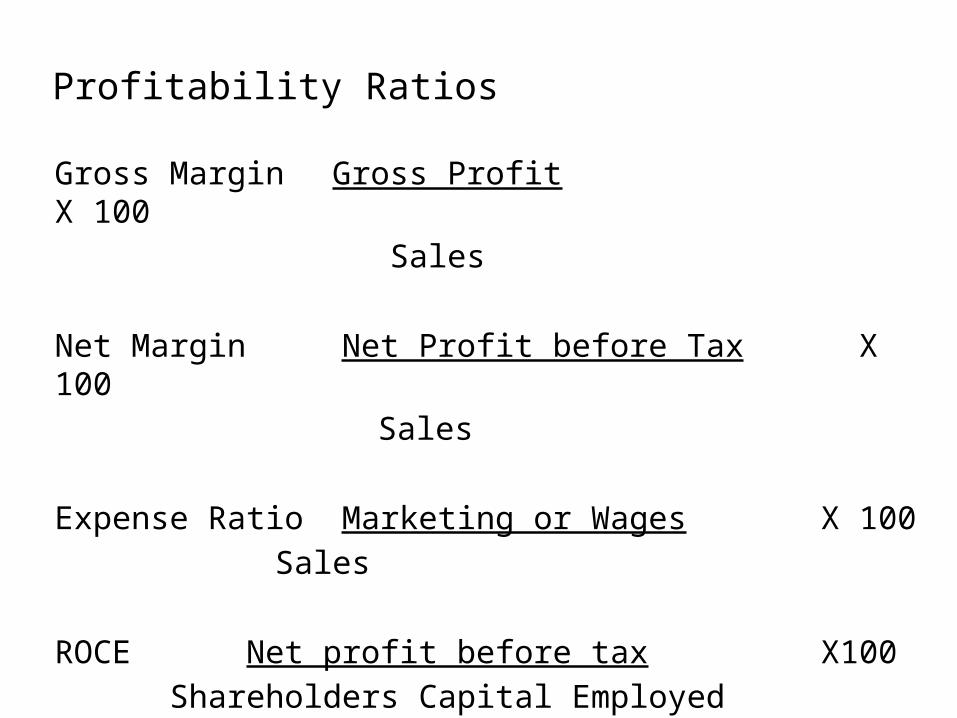
Profitability Ratios
Gross Margin Gross Profit X 100Sales
Net Margin Net Profit before Tax X 100Sales
Expense Ratio Marketing or Wages X 100 Sales
ROCE Net profit before tax X100 Shareholders Capital Employed
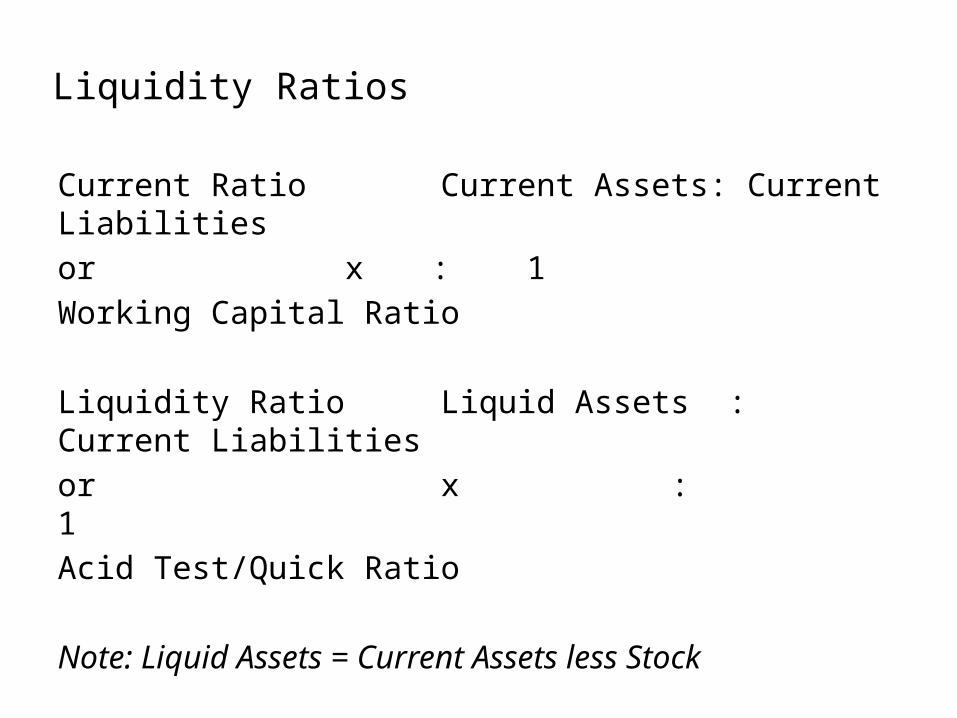
Liquidity Ratios
Current Ratio Current Assets: Current Liabilitiesor x : 1Working Capital Ratio Liquidity Ratio Liquid Assets : Current Liabilitiesor x : 1 Acid Test/Quick Ratio
Note: Liquid Assets = Current Assets less Stock
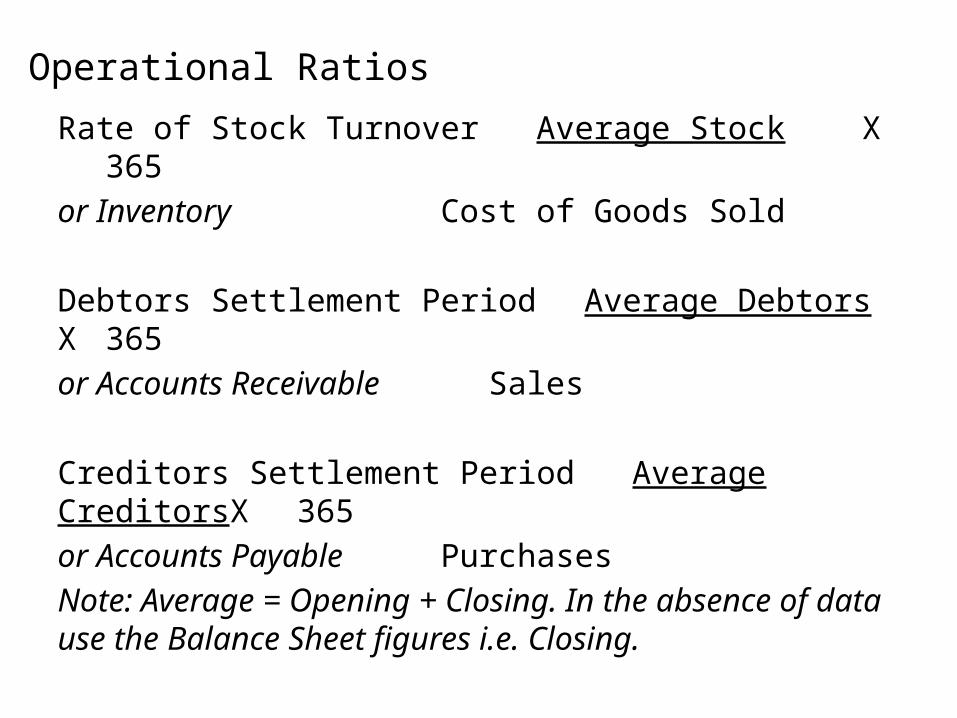
Operational Ratios
Rate of Stock Turnover Average Stock X365
or Inventory Cost of Goods Sold
Debtors Settlement Period Average Debtors X365
or Accounts Receivable Sales
Creditors Settlement Period Average CreditorsX365
or Accounts Payable Purchases
Note: Average = Opening + Closing. In the absence of data use the Balance Sheet figures i.e. Closing.
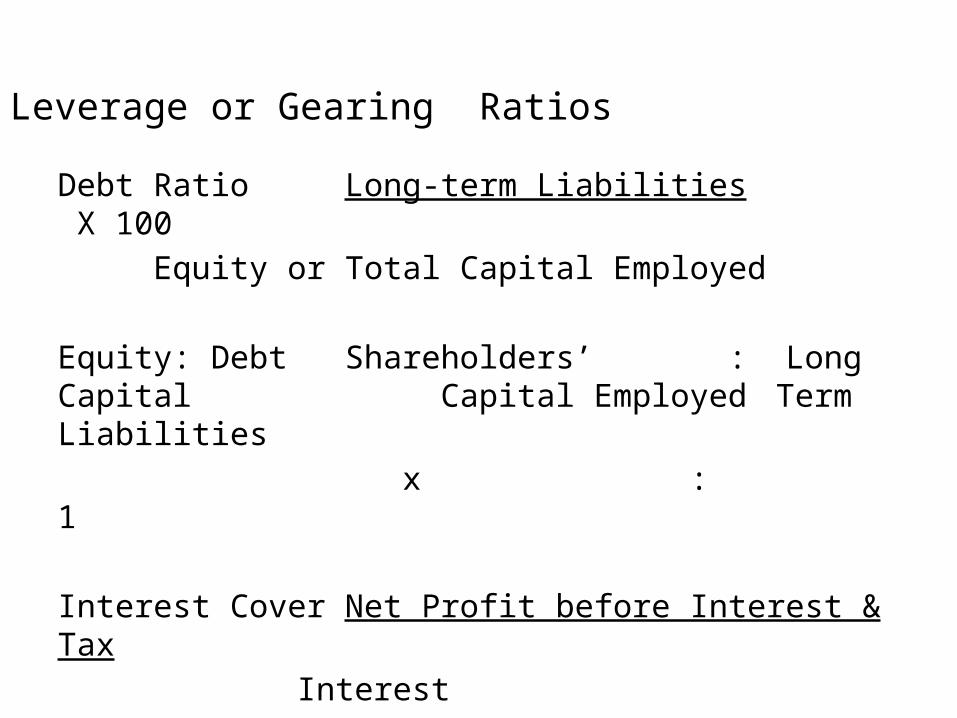
Leverage or Gearing Ratios
Debt Ratio Long-term Liabilities X 100
Equity or Total Capital Employed
Equity: Debt Shareholders’ : Long Capital Capital Employed Term Liabilities x : 1
Interest Cover Net Profit before Interest & TaxInterest
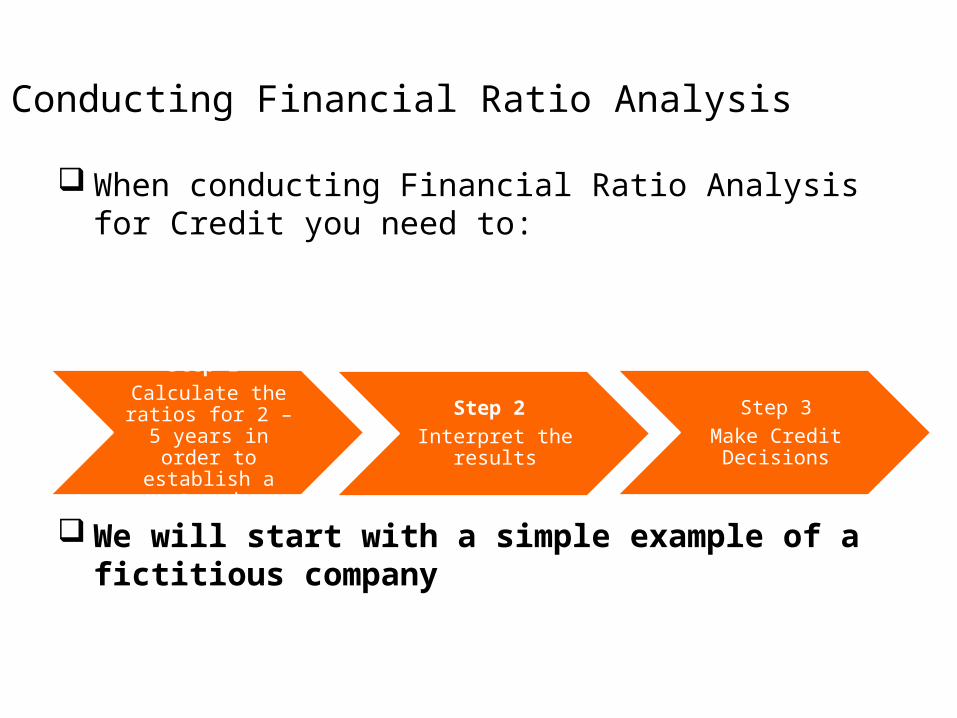
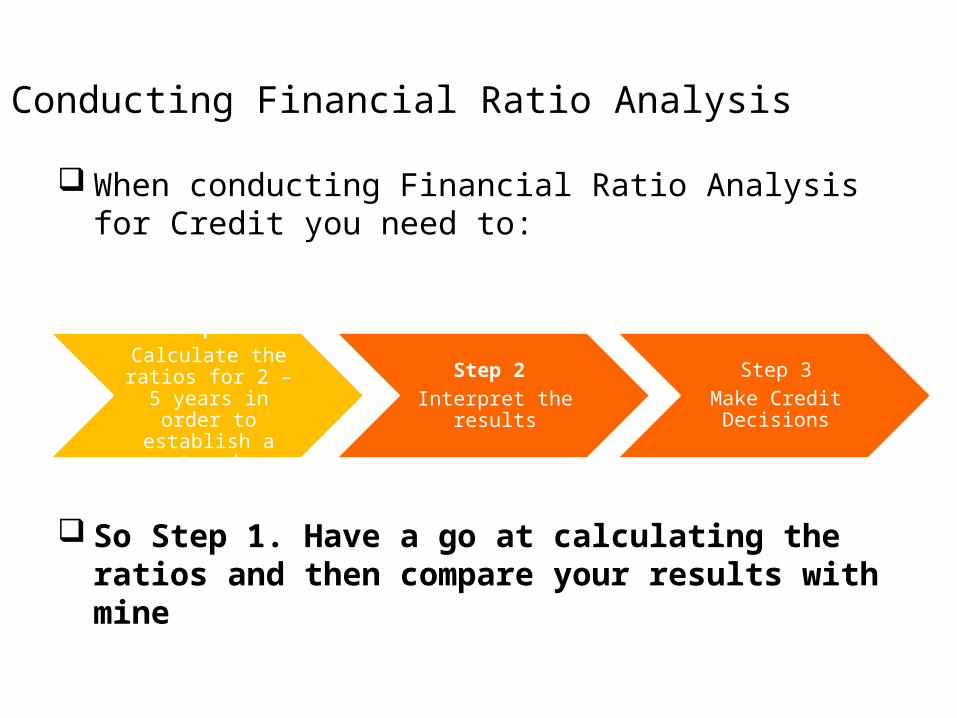
Conducting Financial Ratio Analysis
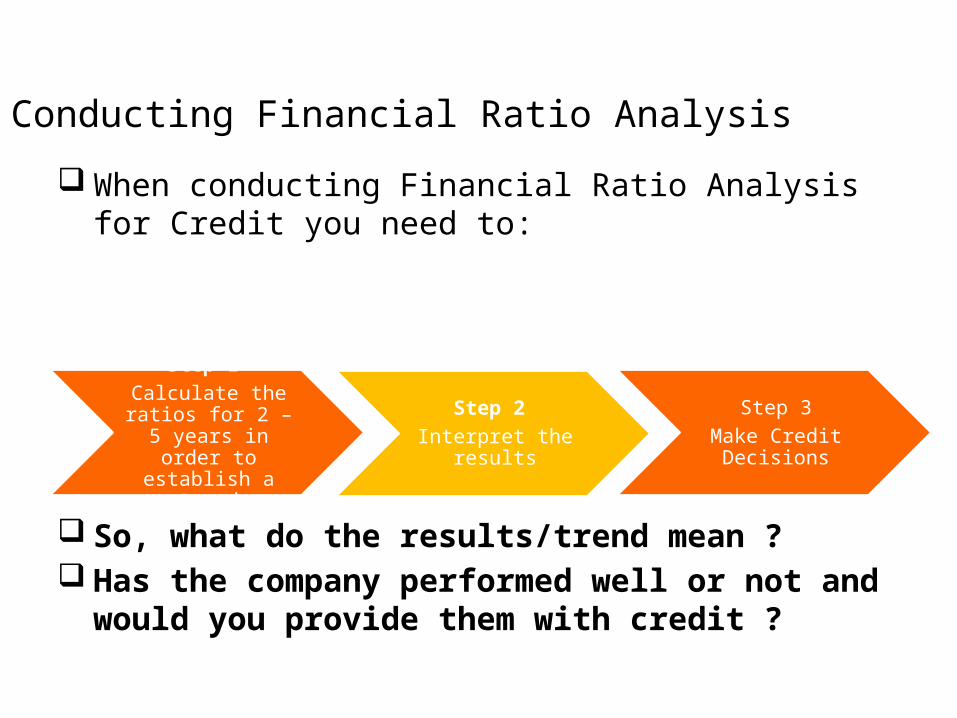
When conducting Financial Ratio Analysis for Credit you need to:
We will start with a simple example of a fictitious company
Step 1 Calculate the ratios for 2 – 5
years in order to establish a trend
Step 2 Interpret the
results
Step 3Make Credit Decisions
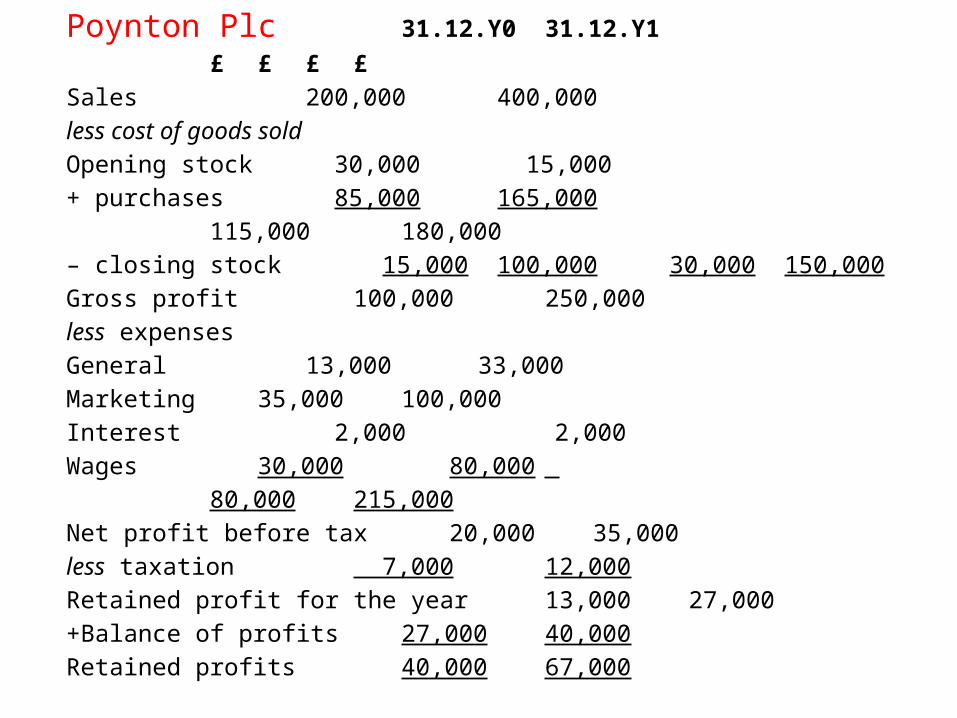
Poynton Plc 31.12.Y0 31.12.Y1
£ £ £ £Sales 200,000 400,000less cost of goods soldOpening stock 30,000 15,000+ purchases 85,000 165,000
115,000 180,000– closing stock 15,000 100,000 30,000150,000Gross profit 100,000 250,000less expensesGeneral 13,000 33,000Marketing 35,000 100,000Interest 2,000 2,000Wages 30,000 80,000
80,000 215,000Net profit before tax 20,000 35,000less taxation 7,000 12,000Retained profit for the year 13,000 27,000+Balance of profits 27,000 40,000Retained profits 40,000 67,000
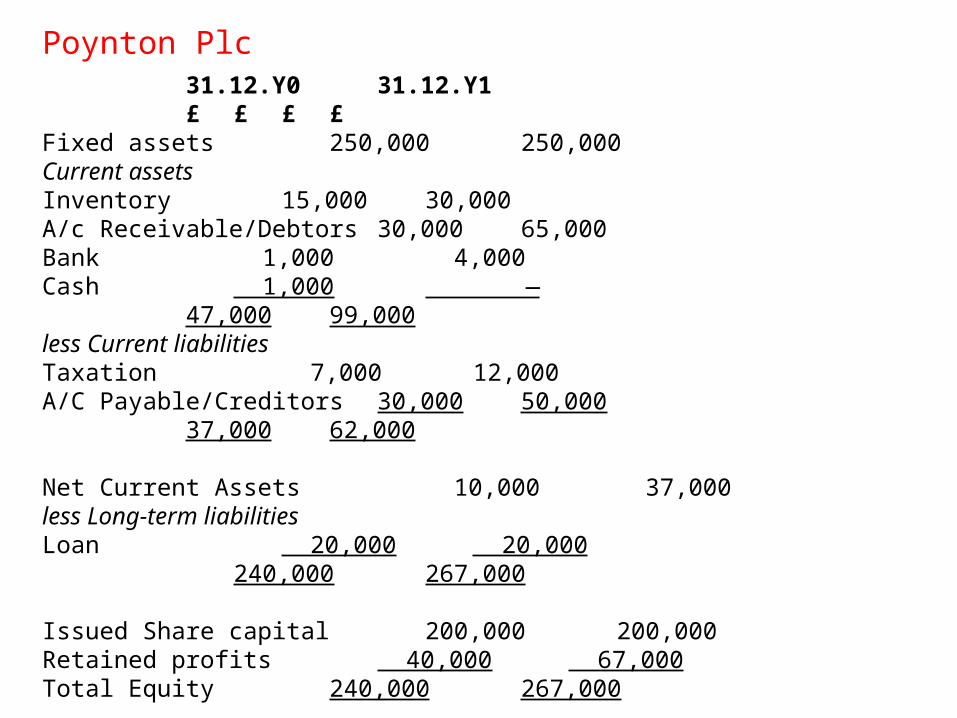
31.12.Y0 31.12.Y1£ £ £ £
Fixed assets 250,000 250,000Current assetsInventory 15,000 30,000A/c Receivable/Debtors 30,000 65,000Bank 1,000 4,000Cash 1,000 —
47,000 99,000less Current liabilitiesTaxation 7,000 12,000A/C Payable/Creditors 30,000 50,000
37,000 62,000
Net Current Assets 10,000 37,000less Long-term liabilitiesLoan 20,000 20,000
240,000 267,000 Issued Share capital 200,000 200,000Retained profits 40,000 67,000Total Equity 240,000 267,000
Poynton Plc
Conducting Financial Ratio Analysis
When conducting Financial Ratio Analysis for Credit you need to:
So Step 1. Have a go at calculating the ratios and then compare your results with mine
Step 1 Calculate the ratios for 2 – 5
years in order to establish a trend
Step 2 Interpret the
results
Step 3Make Credit Decisions
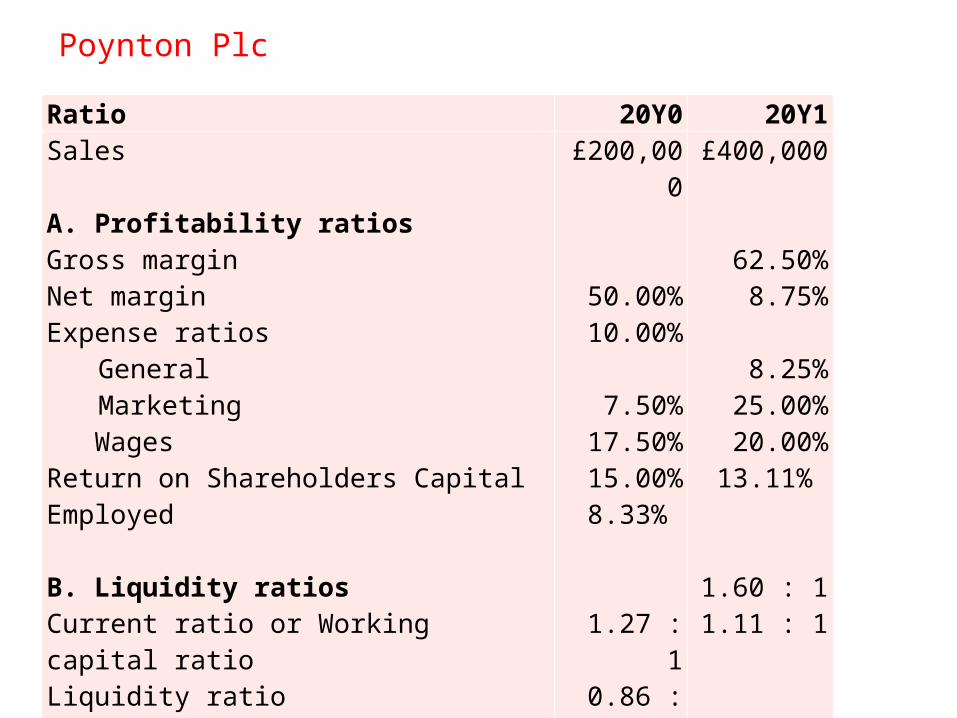
Ratio 20Y0 20Y1Sales A. Profitability ratiosGross marginNet marginExpense ratios
GeneralMarketingWages
Return on Shareholders Capital Employed
B. Liquidity ratiosCurrent ratio or Working capital ratio Liquidity ratio
£200,000
50.00%10.00%
7.50%17.50%15.00%8.33%
1.27 : 10.86 : 1
£400,000
62.50%8.75%
8.25%25.00%20.00%13.11%
1.60 : 11.11 : 1
Poynton Plc
20Y0 20Y1
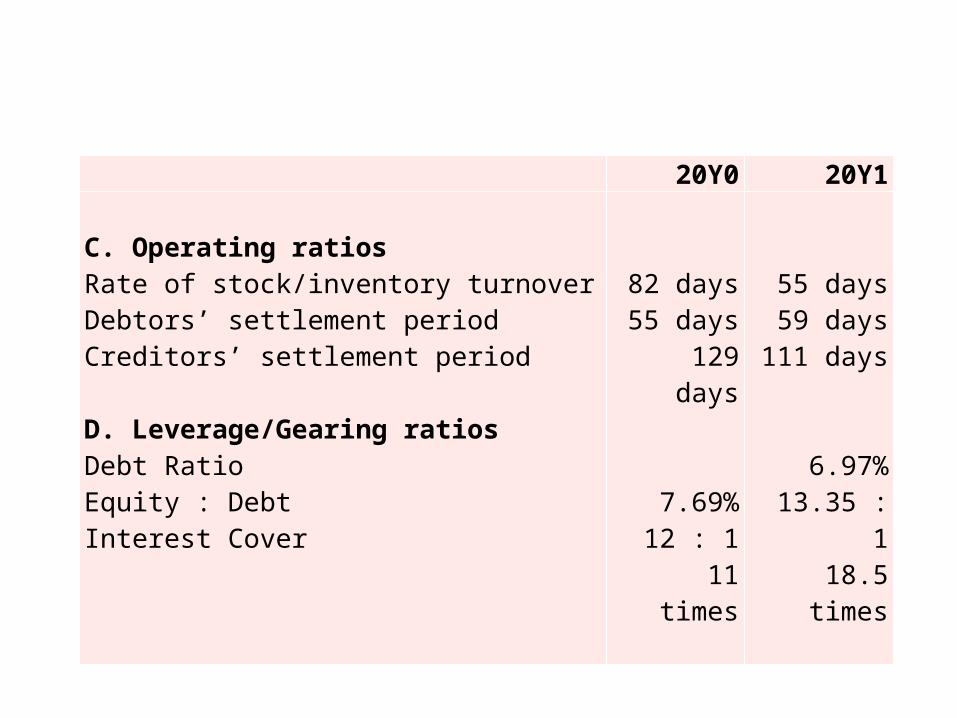
C. Operating ratios Rate of stock/inventory turnoverDebtors’ settlement periodCreditors’ settlement period D. Leverage/Gearing ratiosDebt RatioEquity : DebtInterest Cover
82 days55 days
129 days
7.69%12 : 1
11 times
55 days59 days
111 days
6.97%13.35 : 1
18.5 times
Conducting Financial Ratio Analysis
When conducting Financial Ratio Analysis for Credit you need to:
So, what do the results/trend mean ? Has the company performed well or not and
would you provide them with credit ?
Step 1 Calculate the ratios for 2 – 5
years in order to establish a trend
Step 2 Interpret the
results
Step 3Make Credit Decisions
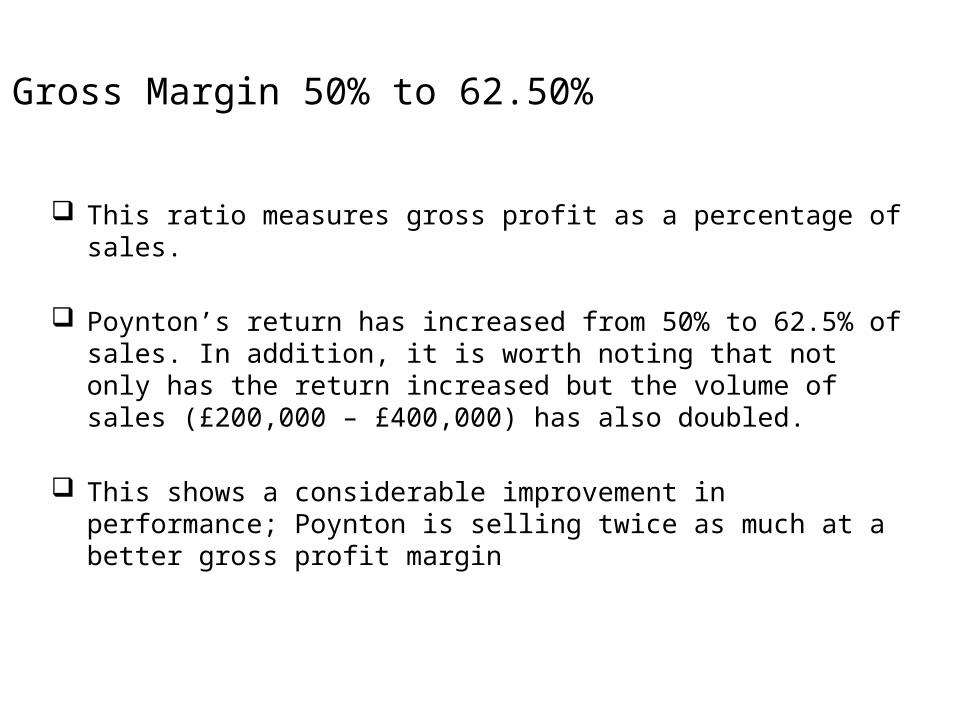
Gross Margin 50% to 62.50%
This ratio measures gross profit as a percentage of sales.
Poynton’s return has increased from 50% to 62.5% of sales. In addition, it is worth noting that not only has the return increased but the volume of sales (£200,000 – £400,000) has also doubled.
This shows a considerable improvement in performance; Poynton is selling twice as much at a better gross profit margin
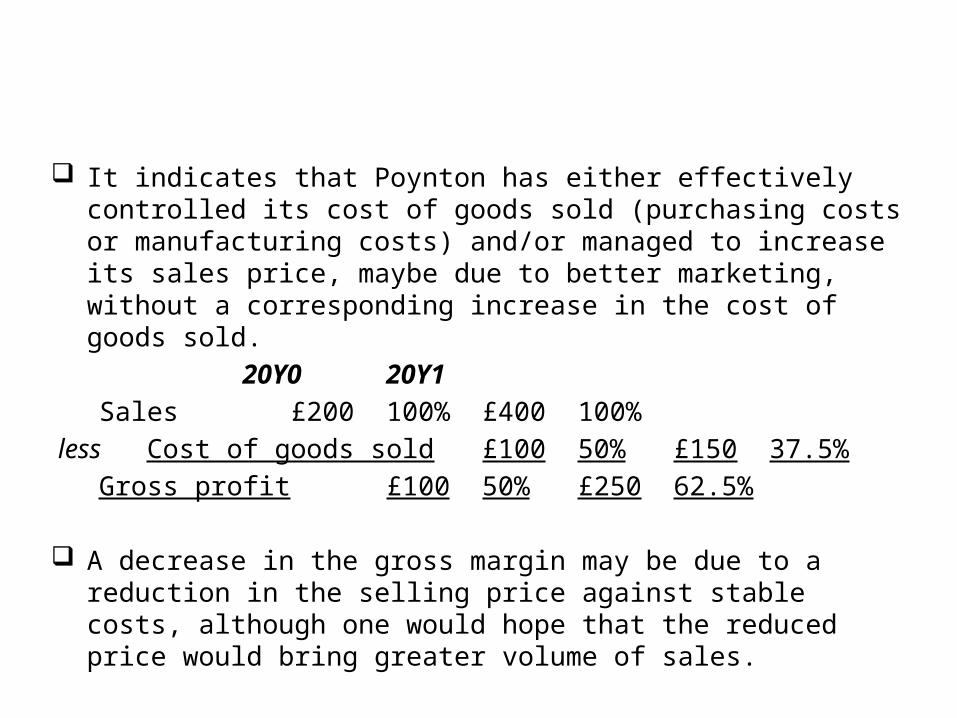
It indicates that Poynton has either effectively controlled its cost of goods sold (purchasing costs or manufacturing costs) and/or managed to increase its sales price, maybe due to better marketing, without a corresponding increase in the cost of goods sold.
20Y0 20Y1Sales £200 100% £400 100%
less Cost of goods sold £100 50% £150 37.5%Gross profit £100 50% £250 62.5%
A decrease in the gross margin may be due to a reduction in
the selling price against stable costs, although one would hope that the reduced price would bring greater volume of sales.
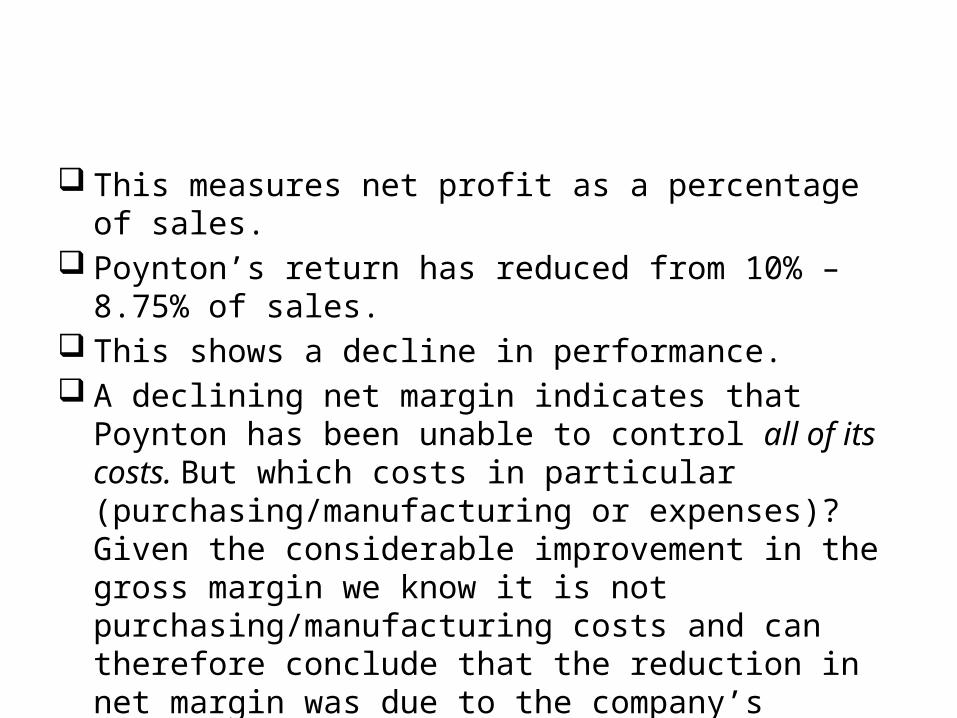
This measures net profit as a percentage of sales. Poynton’s return has reduced from 10% – 8.75%
of sales. This shows a decline in performance. A declining net margin indicates that Poynton has
been unable to control all of its costs. But which costs in particular (purchasing/manufacturing or expenses)? Given the considerable improvement in the gross margin we know it is not purchasing/manufacturing costs and can therefore conclude that the reduction in net margin was due to the company’s failure to control expenses.
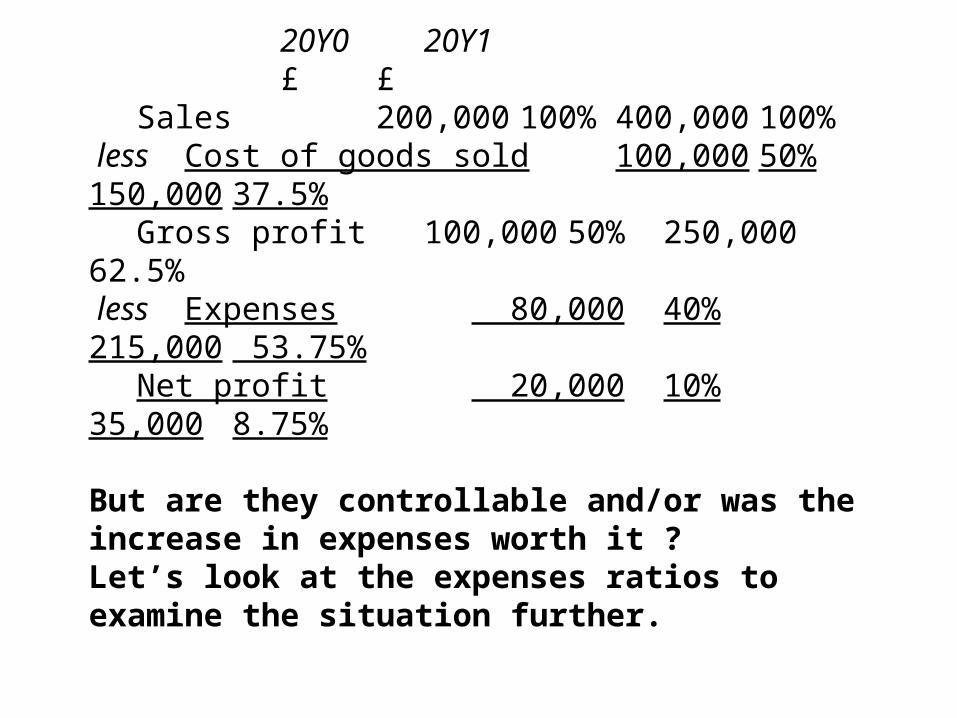
20Y0 20Y1£ £
Sales 200,000 100%400,000 100% less Cost of goods sold 100,000 50%150,000 37.5%
Gross profit 100,000 50%250,000 62.5% less Expenses 80,000 40%215,000 53.75%
Net profit 20,000 10%35,000 8.75%
But are they controllable and/or was the increase in expenses worth it ?Let’s look at the expenses ratios to examine the situation further.
Expenses Ratios
These measures the particular expense (in our case; General; Marketing & Wages) as a percentage of sales.
The improvement in Gross Margin and decline in Net Margin tells us that expenses have increased substantially as a percentage of sales but which expenses in particular. Poynton’s total expenses have increased from 40% – 53.75% of sales.
Each category of expense has increased and we need to ask: whether this has been for reasons beyond their
control or due to poor management control.e.g. General Expenses may have increased
due to a rates increase, or higher utility bills as a result of working longer hours to achieve the higher sales
whether the increase was a cost worth payinge.g. Marketing and Wages have increase but did they generate the 100% increase in turnover and the increase in Net Profit before Tax, from £20,000 - £35,000. Net Margin may have reduced but the actual profit in terms of £ has increased and I don’t know about you but I would rather have 1% of £10,000,000 than 50% of £1,000
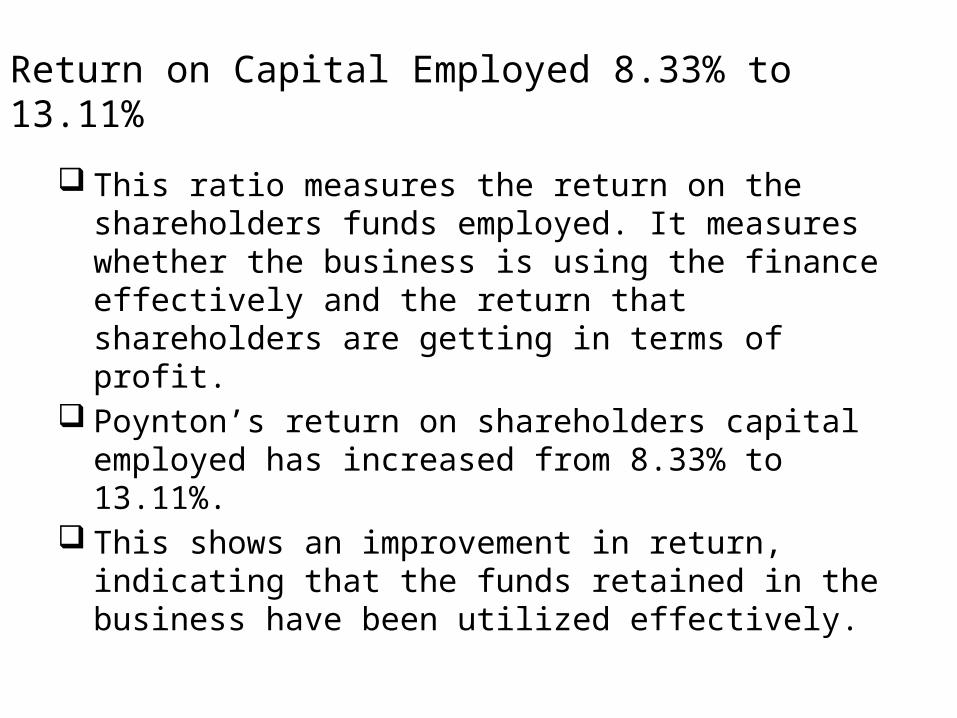
Return on Capital Employed 8.33% to 13.11%
This ratio measures the return on the shareholders funds employed. It measures whether the business is using the finance effectively and the return that shareholders are getting in terms of profit.
Poynton’s return on shareholders capital employed has increased from 8.33% to 13.11%.
This shows an improvement in return, indicating that the funds retained in the business have been utilized effectively.
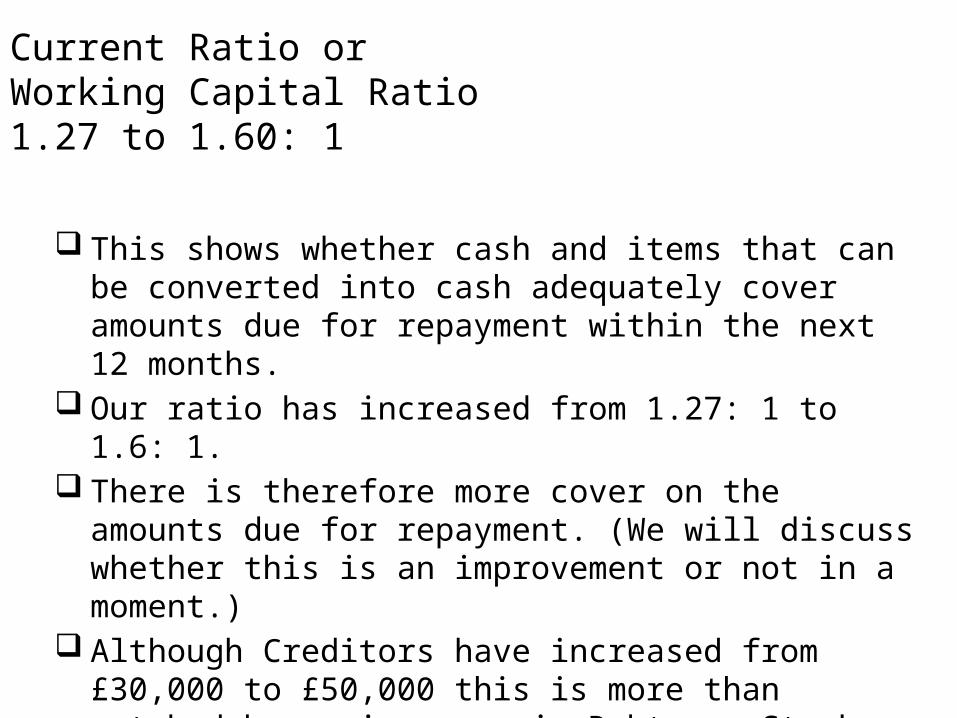
Current Ratio or Working Capital Ratio1.27 to 1.60: 1
This shows whether cash and items that can be converted into cash adequately cover amounts due for repayment within the next 12 months.
Our ratio has increased from 1.27: 1 to 1.6: 1. There is therefore more cover on the amounts due
for repayment. (We will discuss whether this is an improvement or not in a moment.)
Although Creditors have increased from £30,000 to £50,000 this is more than matched by an increase in Debtors, Stock and Bank.
Liquidity Ratio
By deducting Stock from the Current Assets we are able to compare the most liquid Current Assets with Current Liabilities to gain a more critical assessment of liquidity.
Cover has increased from 0.86: 1 to 1.11: 1. The company is therefore more liquid.
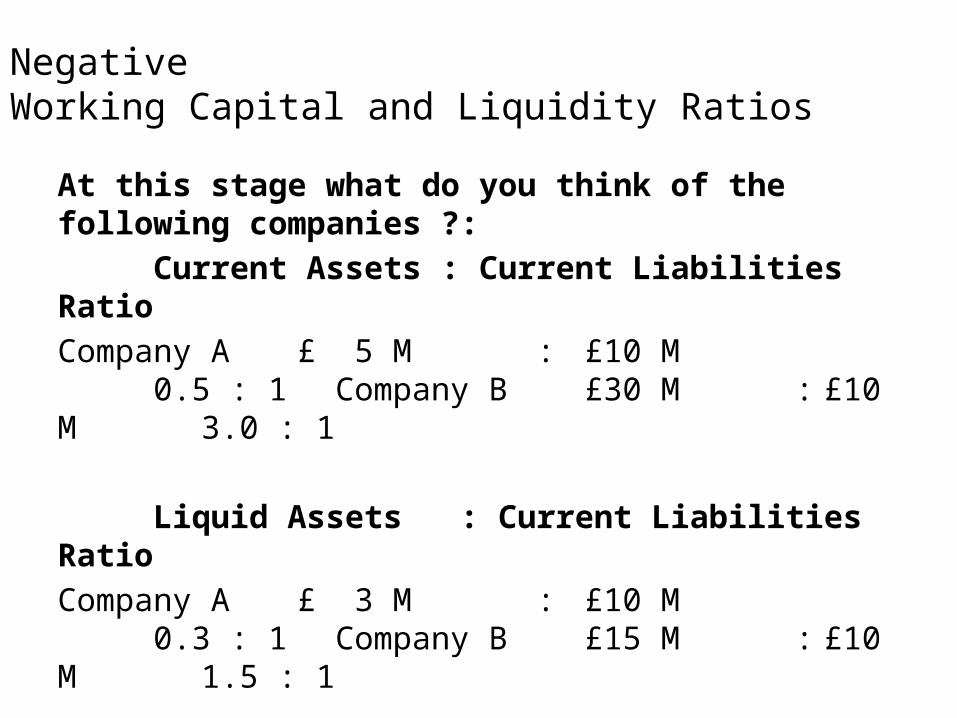
Negative Working Capital and Liquidity Ratios
At this stage what do you think of the following companies ?:
Current Assets : Current LiabilitiesRatio
Company A £ 5 M : £10 M 0.5 : 1 Company B £30 M : £10 M 3.0 : 1
Liquid Assets : Current LiabilitiesRatio
Company A £ 3 M : £10 M 0.3 : 1 Company B £15 M : £10 M 1.5 : 1
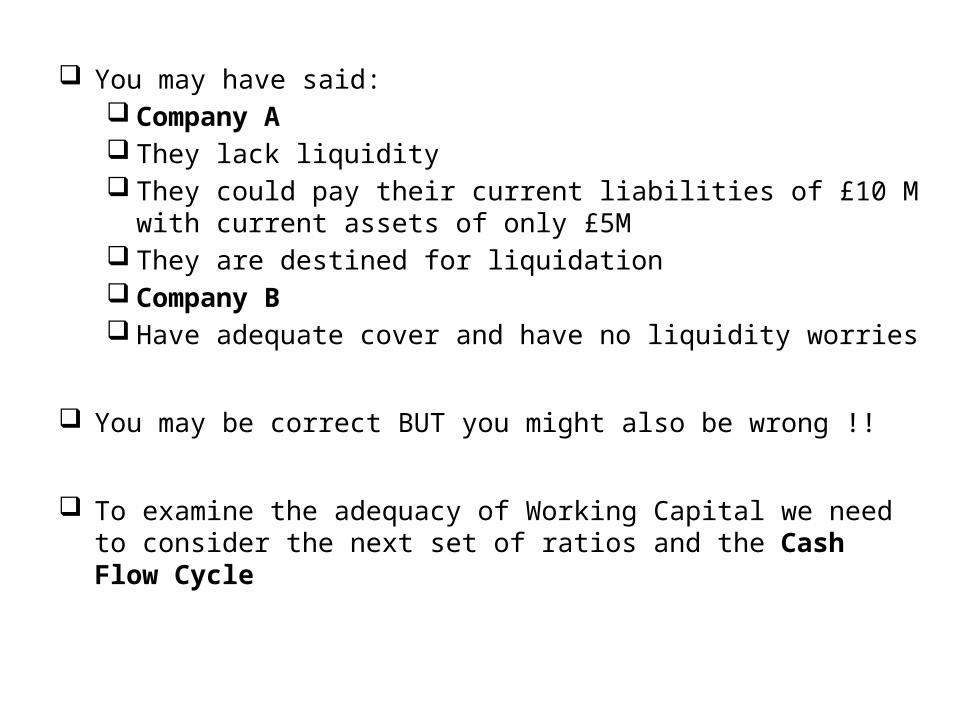
You may have said: Company A They lack liquidity They could pay their current liabilities of £10 M with
current assets of only £5M They are destined for liquidation Company B Have adequate cover and have no liquidity worries
You may be correct BUT you might also be wrong !!
To examine the adequacy of Working Capital we need to consider the next set of ratios and the Cash Flow Cycle
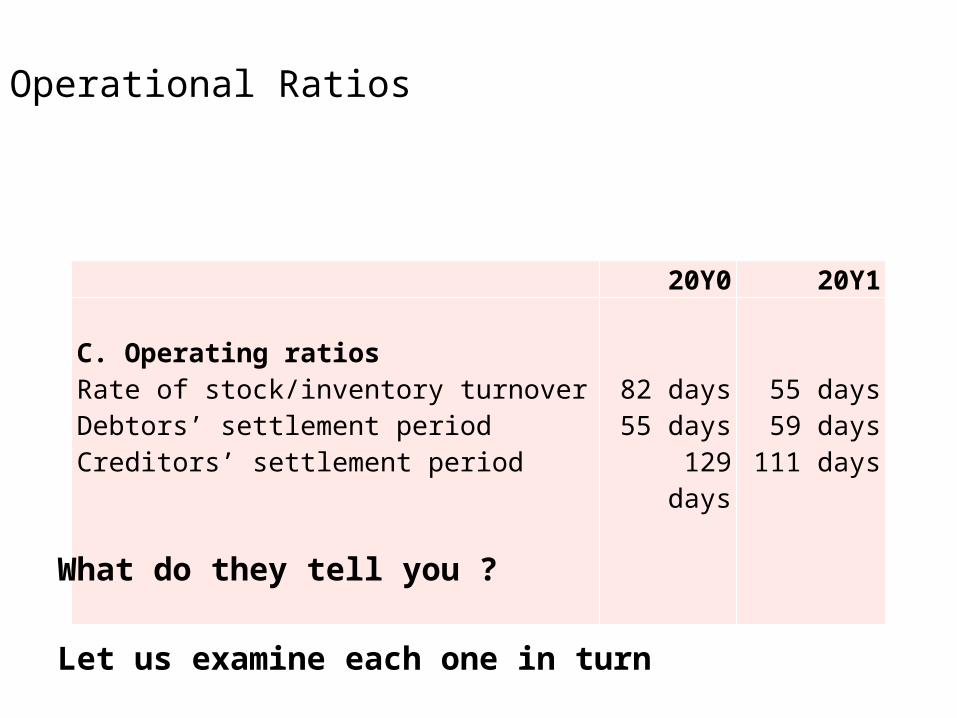
20Y0 20Y1
C. Operating ratios Rate of stock/inventory turnoverDebtors’ settlement periodCreditors’ settlement period
82 days55 days
129 days
55 days59 days
111 days
Operational Ratios
What do they tell you ?
Let us examine each one in turn
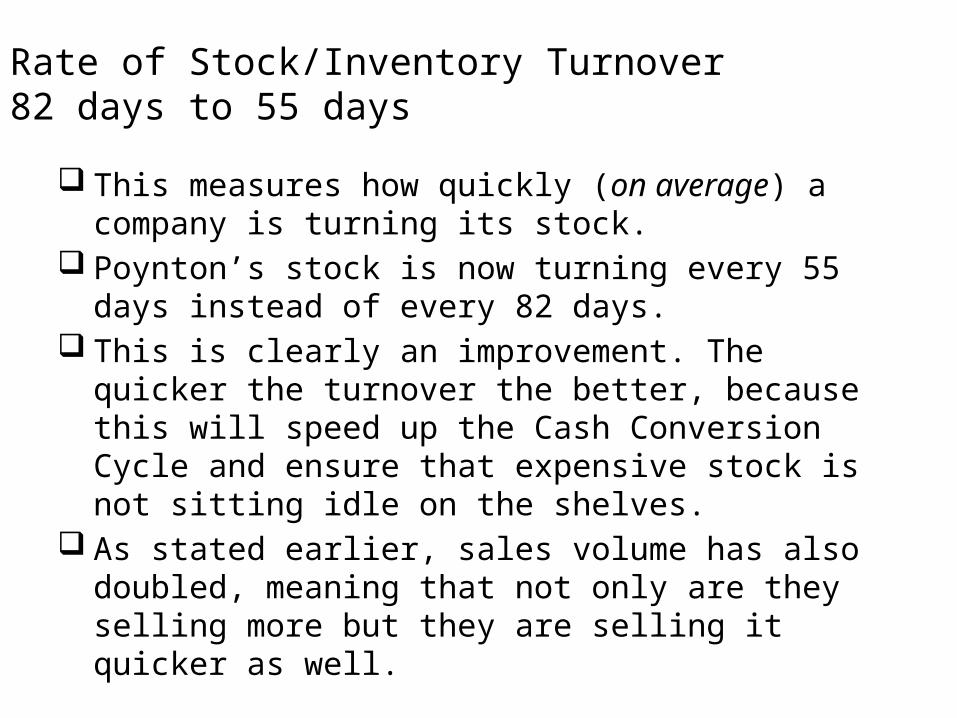
Rate of Stock/Inventory Turnover 82 days to 55 days
This measures how quickly (on average) a company is turning its stock.
Poynton’s stock is now turning every 55 days instead of every 82 days.
This is clearly an improvement. The quicker the turnover the better, because this will speed up the Cash Conversion Cycle and ensure that expensive stock is not sitting idle on the shelves.
As stated earlier, sales volume has also doubled, meaning that not only are they selling more but they are selling it quicker as well.
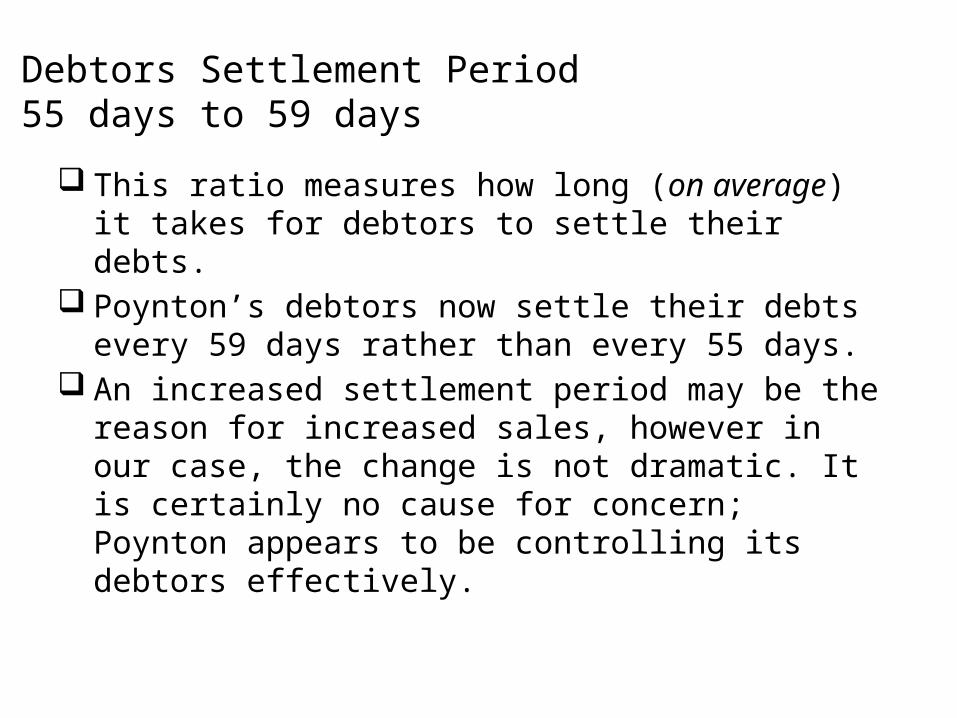
Debtors Settlement Period55 days to 59 days
This ratio measures how long (on average) it takes for debtors to settle their debts.
Poynton’s debtors now settle their debts every 59 days rather than every 55 days.
An increased settlement period may be the reason for increased sales, however in our case, the change is not dramatic. It is certainly no cause for concern; Poynton appears to be controlling its debtors effectively.
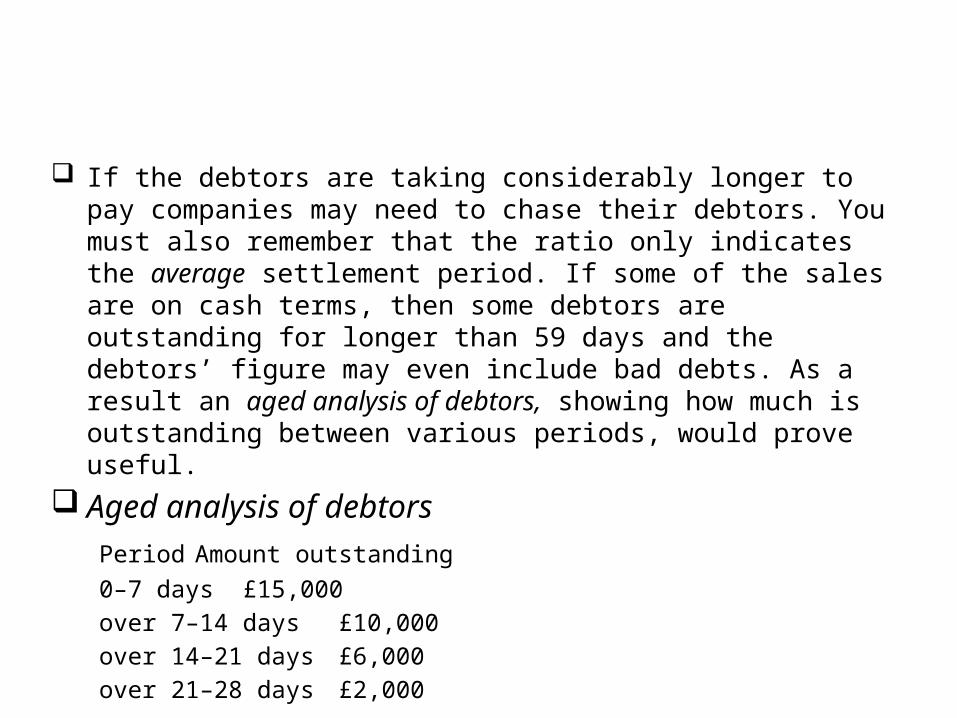
If the debtors are taking considerably longer to pay companies may need to chase their debtors. You must also remember that the ratio only indicates the average settlement period. If some of the sales are on cash terms, then some debtors are outstanding for longer than 59 days and the debtors’ figure may even include bad debts. As a result an aged analysis of debtors, showing how much is outstanding between various periods, would prove useful.
Aged analysis of debtorsPeriod Amount outstanding
0–7 days £15,000over 7–14 days £10,000over 14–21 days £6,000over 21–28 days £2,000
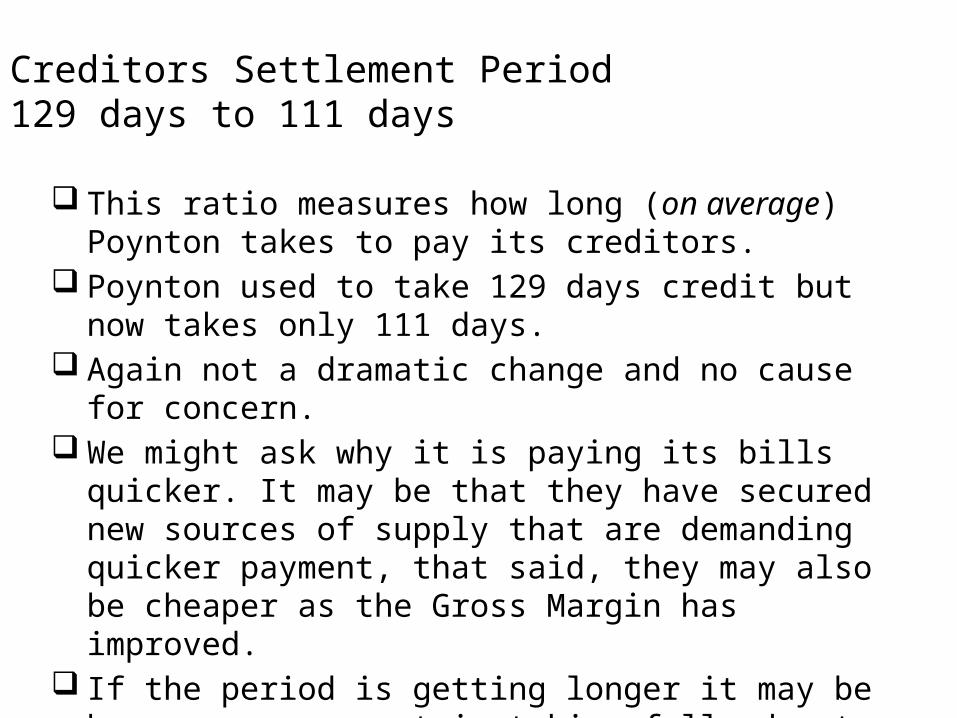
Creditors Settlement Period129 days to 111 days
This ratio measures how long (on average) Poynton takes to pay its creditors.
Poynton used to take 129 days credit but now takes only 111 days.
Again not a dramatic change and no cause for concern.
We might ask why it is paying its bills quicker. It may be that they have secured new sources of supply that are demanding quicker payment, that said, they may also be cheaper as the Gross Margin has improved.
If the period is getting longer it may be because management is taking full advantage of credit facilities, or it could be that it has a cashflow problem.
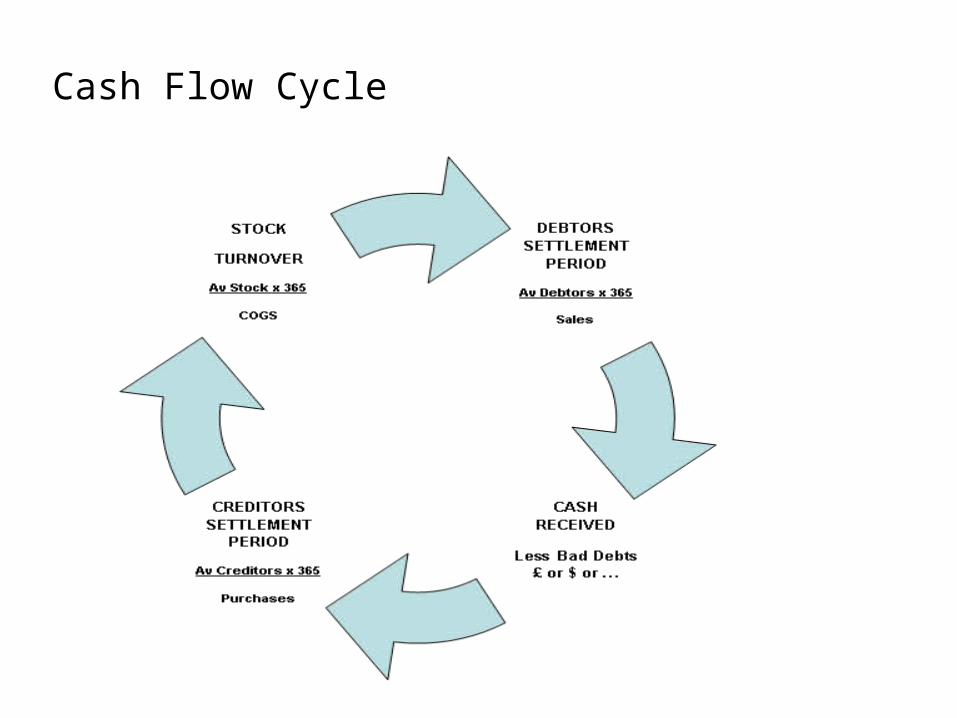
Cash Flow Cycle
Cash Flow Cycle
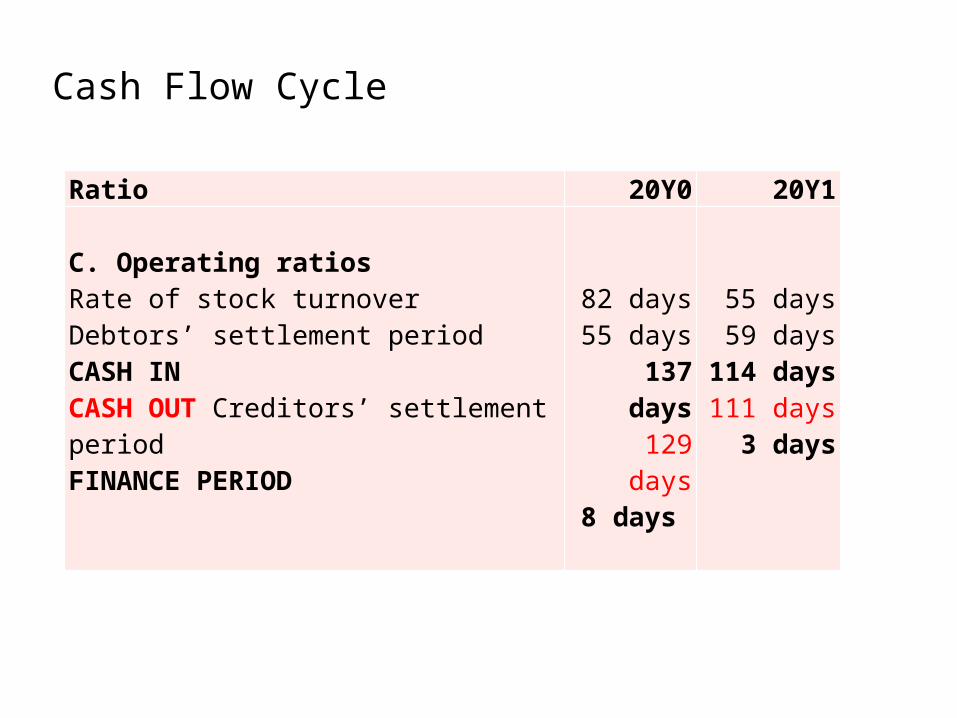
Ratio 20Y0 20Y1
C. Operating ratios Rate of stock turnoverDebtors’ settlement periodCASH INCASH OUT Creditors’ settlement period FINANCE PERIOD
82 days55 days
137 days129 days
8 days
55 days59 days
114 days111 days
3 days
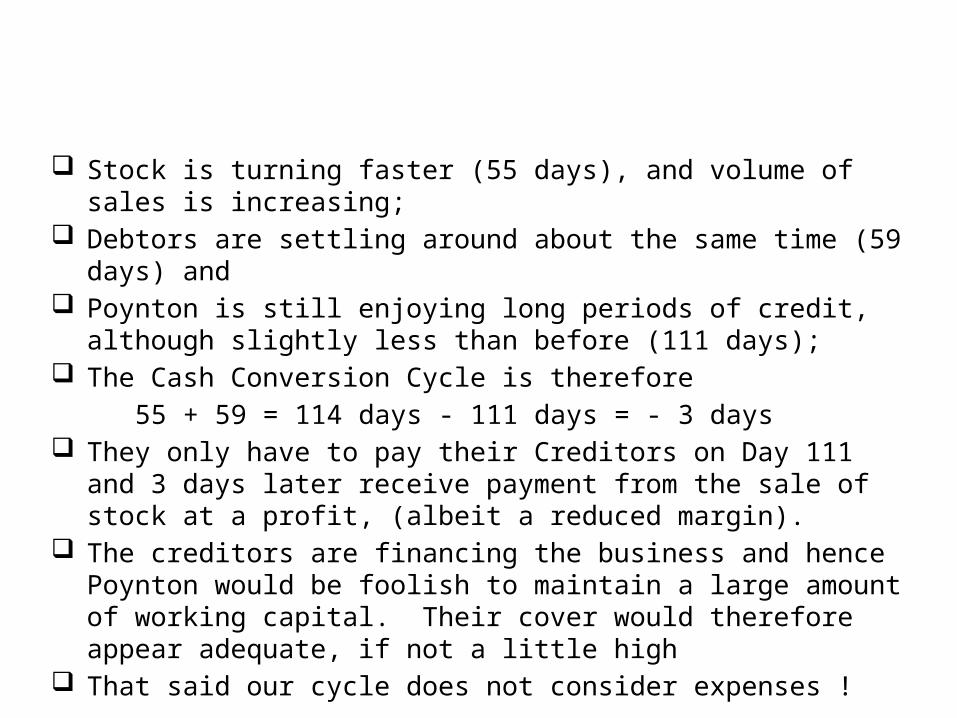
Stock is turning faster (55 days), and volume of sales is increasing;
Debtors are settling around about the same time (59 days) and
Poynton is still enjoying long periods of credit, although slightly less than before (111 days);
The Cash Conversion Cycle is therefore55 + 59 = 114 days - 111 days = - 3 days
They only have to pay their Creditors on Day 111 and 3 days later receive payment from the sale of stock at a profit, (albeit a reduced margin).
The creditors are financing the business and hence Poynton would be foolish to maintain a large amount of working capital. Their cover would therefore appear adequate, if not a little high
That said our cycle does not consider expenses !
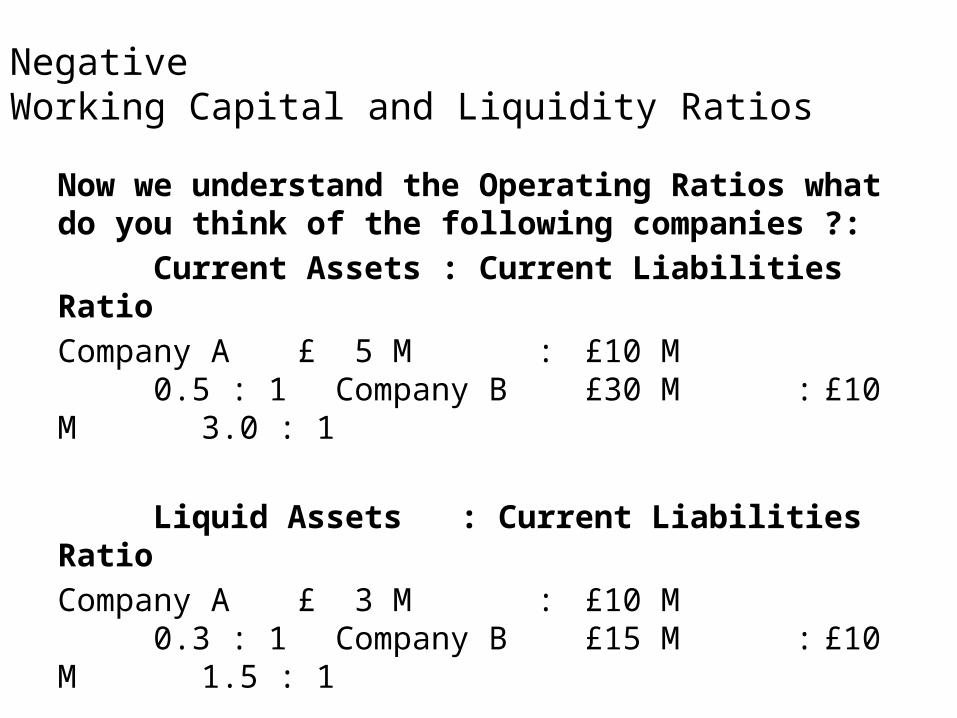
Negative Working Capital and Liquidity Ratios
Now we understand the Operating Ratios what do you think of the following companies ?:
Current Assets : Current LiabilitiesRatio
Company A £ 5 M : £10 M 0.5 : 1 Company B £30 M : £10 M 3.0 : 1
Liquid Assets : Current LiabilitiesRatio
Company A £ 3 M : £10 M 0.3 : 1 Company B £15 M : £10 M 1.5 : 1
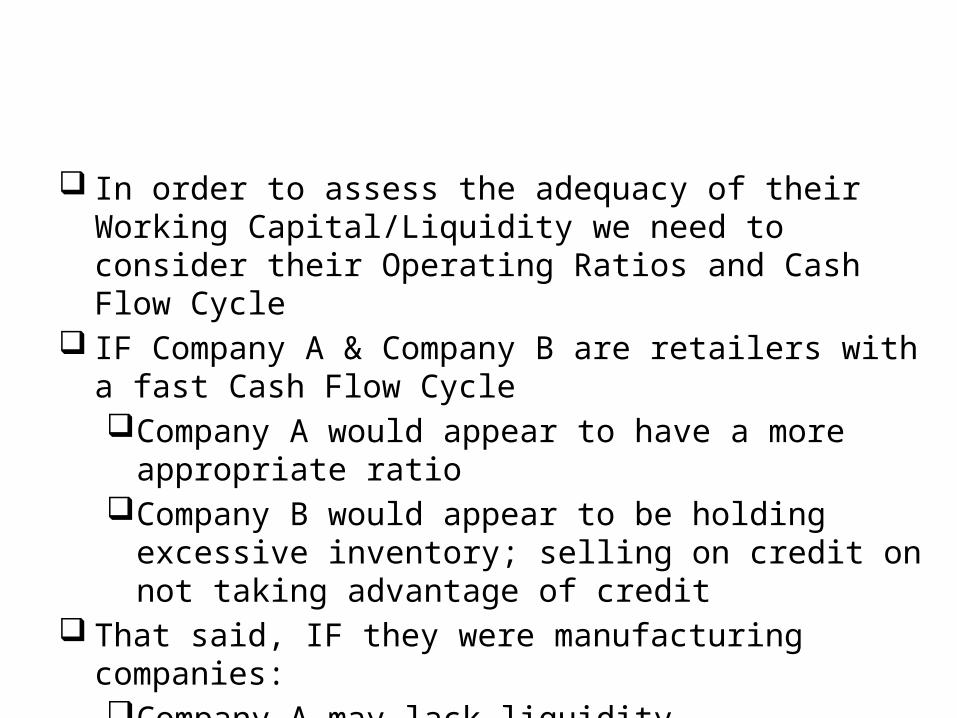
In order to assess the adequacy of their Working Capital/Liquidity we need to consider their Operating Ratios and Cash Flow Cycle
IF Company A & Company B are retailers with a fast Cash Flow Cycle Company A would appear to have a more
appropriate ratioCompany B would appear to be holding
excessive inventory; selling on credit on not taking advantage of credit
That said, IF they were manufacturing companies:Company A may lack liquidity
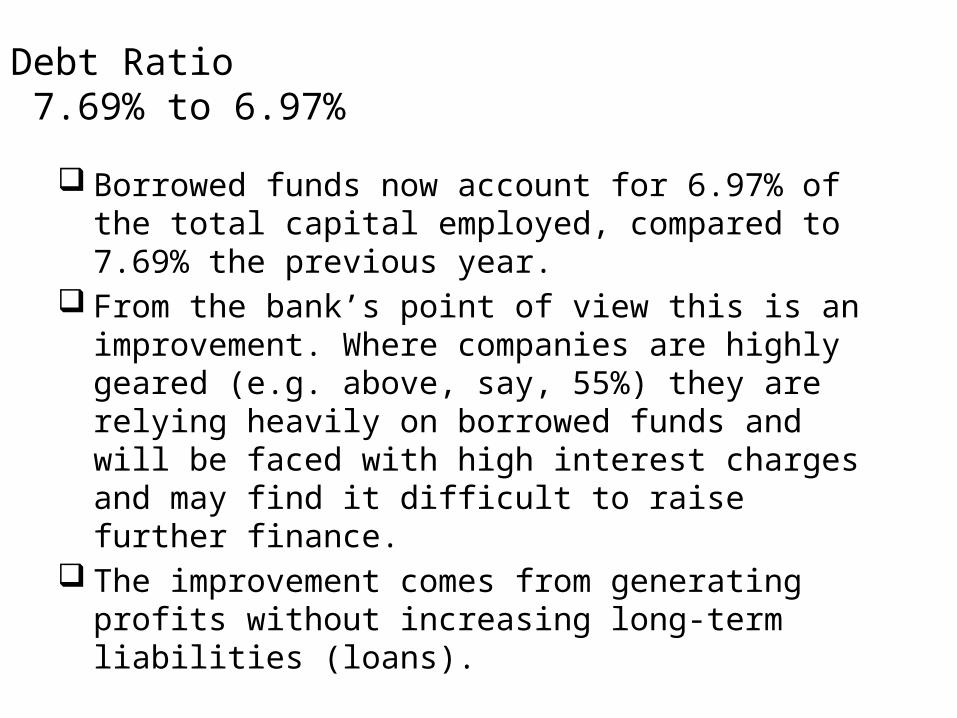
Debt Ratio 7.69% to 6.97%
Borrowed funds now account for 6.97% of the total capital employed, compared to 7.69% the previous year.
From the bank’s point of view this is an improvement. Where companies are highly geared (e.g. above, say, 55%) they are relying heavily on borrowed funds and will be faced with high interest charges and may find it difficult to raise further finance.
The improvement comes from generating profits without increasing long-term liabilities (loans).
Equity: Debt Ratio12 : 1 to 13.35 : 1
This ratio simply looks at Gearing from a different angle, i.e. it also examines the extent to which the company relies on borrowed funds by comparing debt (funds borrowed long term) with equity (shareholders’ funds).
The shareholders’ funds employed in the business are now 13.35 times bigger than borrowed funds employed in the business, compared to 12 times bigger the previous year.
From the bank’s point of view this is good because Poynton’s stake in the business is substantial.
Interest Cover11 times to 18.5 times
This ratio shows how many times the interest paid is covered by Net Profit before interest and tax and thereby examines whether interest payments are at risk
Cover has increased from 11 times to 18.5 times indicating that profit could reduce by 18.5 times and the company would still be able to pay their interest.
Clearly an improvement and one that will please the finance providers.
Conducting Financial Ratio Analysis
When conducting Financial Ratio Analysis for Credit you need to:
Step 3: Would you provide credit ?
Step 1 Calculate the ratios for 2 – 5 years in order to establish a trend
Step 2 Interpret the results
Step 3Make Credit Decisions
Credit Decision
Sales had doubled Trading Profit (Gross Margin) substantially
increased Net Margin gas slipped which needs to be watched
but this has financed the growth in sales Liquidity cover is adequate given the Cash Flow
Cycle Leverage is low In addition, there are Non Current Assets which
may act as security
All the signs are favourable however we should consider the limitations of our analysis
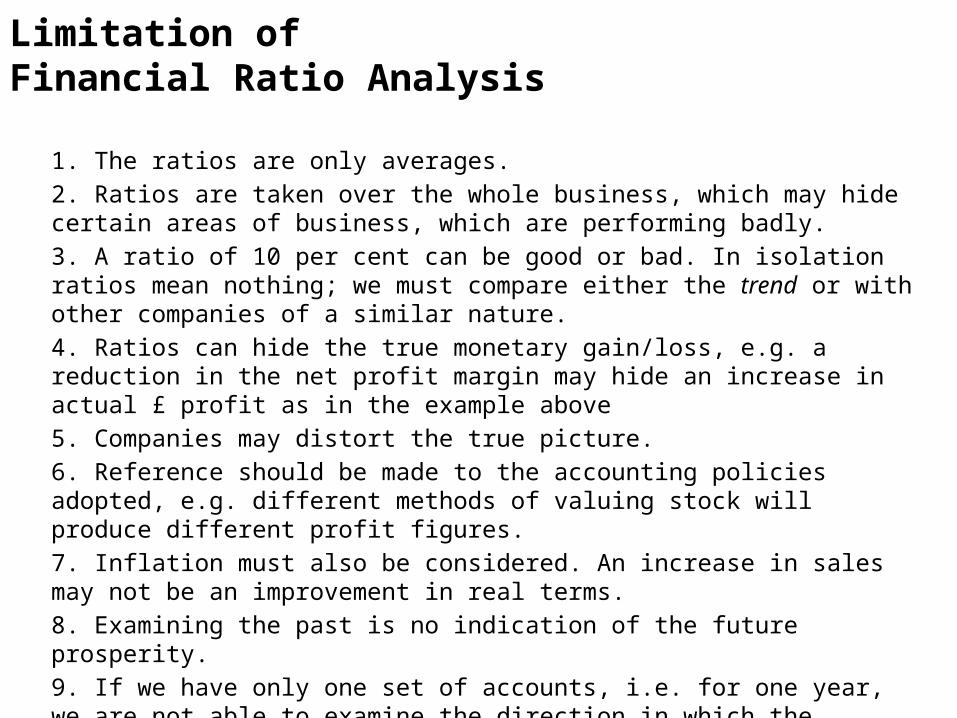
Limitation of Financial Ratio Analysis
1. The ratios are only averages.2. Ratios are taken over the whole business, which may hide certain areas of business, which are performing badly.3. A ratio of 10 per cent can be good or bad. In isolation ratios mean nothing; we must compare either the trend or with other companies of a similar nature.4. Ratios can hide the true monetary gain/loss, e.g. a reduction in the net profit margin may hide an increase in actual £ profit as in the example above 5. Companies may distort the true picture.6. Reference should be made to the accounting policies adopted, e.g. different methods of valuing stock will produce different profit figures.7. Inflation must also be considered. An increase in sales may not be an improvement in real terms.8. Examining the past is no indication of the future prosperity.9. If we have only one set of accounts, i.e. for one year, we are not able to examine the direction in which the company is going.10. Ratios often provide questions rather than answers you must consider why the trend is increasing or decreasing
Other things to consider..
Therefore we must critically consider other things as well as the ratios, e.g. cashflow forecasts, considering whether forecast sales
and expenses are realistic; forecast trading profit and loss account; cashflow statements; management capabilities; what are the company’s
strengths and weaknesses? trading outlook, consider the market and industry the
company is operating in, what future opportunities and threats it is likely to face;
SWOT; PESTLE; Porter (as discussed in Session 1)
Summary
Financial Ratio Analysis, despite its limitations, is clearly a useful tool to aid stakeholder's assessment of a company's performance over a period of time (by examining the trend) or to compare the performance of two similar companies.
It is particularly useful to lenders (banks) who use it as a pre and post-lending tool but what about shareholders who may be more interested in share performance ?
We will examine the needs of shareholders in next lecture