1 fundamentals and application of stress ratio in concrete pavement design edward h. guo consultant...
TRANSCRIPT
1
Fundamentals and Application Fundamentals and Application of Stress Ratio in Concrete of Stress Ratio in Concrete
Pavement DesignPavement Design
Edward H. Guo ConsultantEdward H. Guo Consultant
April 24 - 26, 2012April 24 - 26, 2012
FAA Working Group MeetingFAA Working Group Meeting
2
AcknowledgementsAcknowledgements
This work was sponsored by the FAA This work was sponsored by the FAA Airport Technology R&D Branch, ANG-Airport Technology R&D Branch, ANG-E260, Dr. Satish Agrawal, ManagerE260, Dr. Satish Agrawal, Manager
The views expressed and the The views expressed and the conclusions drawn are those of the conclusions drawn are those of the author aloneauthor alone
This presentation does not represent a This presentation does not represent a standard, specification, or regulation, standard, specification, or regulation, nor does it necessarily represent a nor does it necessarily represent a methodology to be introduced into methodology to be introduced into pavement design standardspavement design standards
3
OUTLINEOUTLINE Can a “STRESS” in a concrete pavement be reliably Can a “STRESS” in a concrete pavement be reliably
predicted ? How? Fundamentals for understanding predicted ? How? Fundamentals for understanding the “STRESS” in “Stress Ratio”, DF = the “STRESS” in “Stress Ratio”, DF = σσ/R /R
Advantages and disadvantages of using DF in Advantages and disadvantages of using DF in concrete pavement design for highway and airportsconcrete pavement design for highway and airports
How to Maximize the Advantage of Using DF and How to Maximize the Advantage of Using DF and Minimize its Uncertainty Effects by Full Scale Minimize its Uncertainty Effects by Full Scale Testing?Testing?
4
Can the “STRESS” in a Can the “STRESS” in a concrete pavement be concrete pavement be reliably predicted ? reliably predicted ?
Fundamentals for Fundamentals for understanding the understanding the
STRESS in STRESS in “Stress Ratio” - “Stress Ratio” - σσ/R /R
55
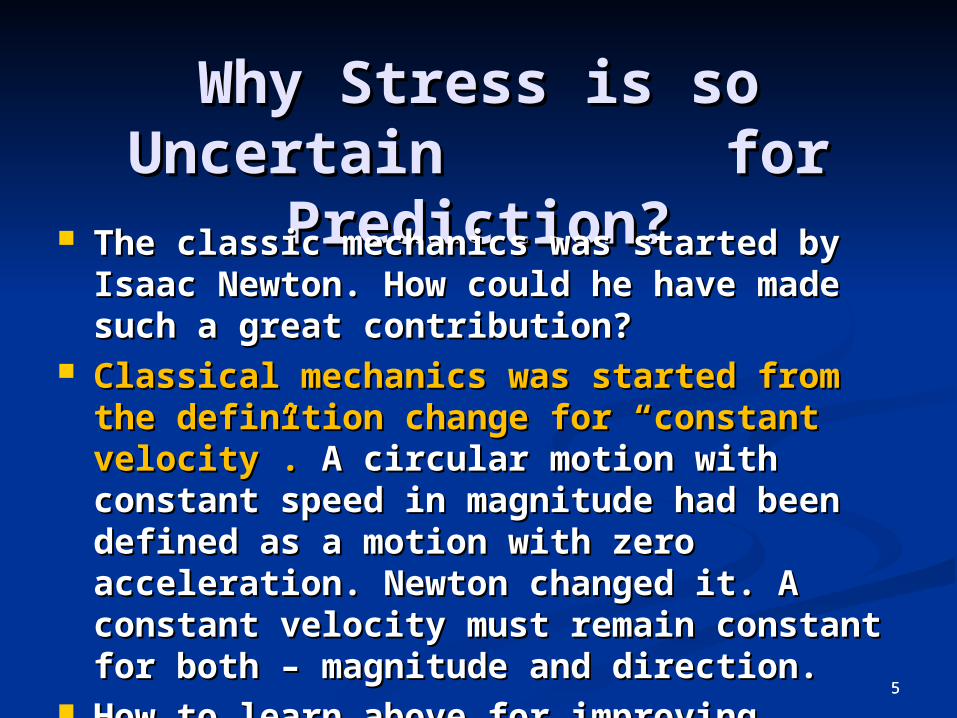
Why Stress is so Why Stress is so Uncertain for Uncertain for
Prediction?Prediction? The classic mechanics was started by The classic mechanics was started by Isaac Newton. How could he have made Isaac Newton. How could he have made such a great contribution? such a great contribution?
Classical mechanics was started from the Classical mechanics was started from the definition change for “constant velocity”. definition change for “constant velocity”. A circular motion with constant speed in A circular motion with constant speed in magnitude had been defined as a motion magnitude had been defined as a motion with zero acceleration. Newton changed with zero acceleration. Newton changed it. A constant velocity must remain it. A constant velocity must remain constant for both – magnitude and constant for both – magnitude and direction. direction.
How to learn above for improving How to learn above for improving researches in pavement engineering?researches in pavement engineering?
66
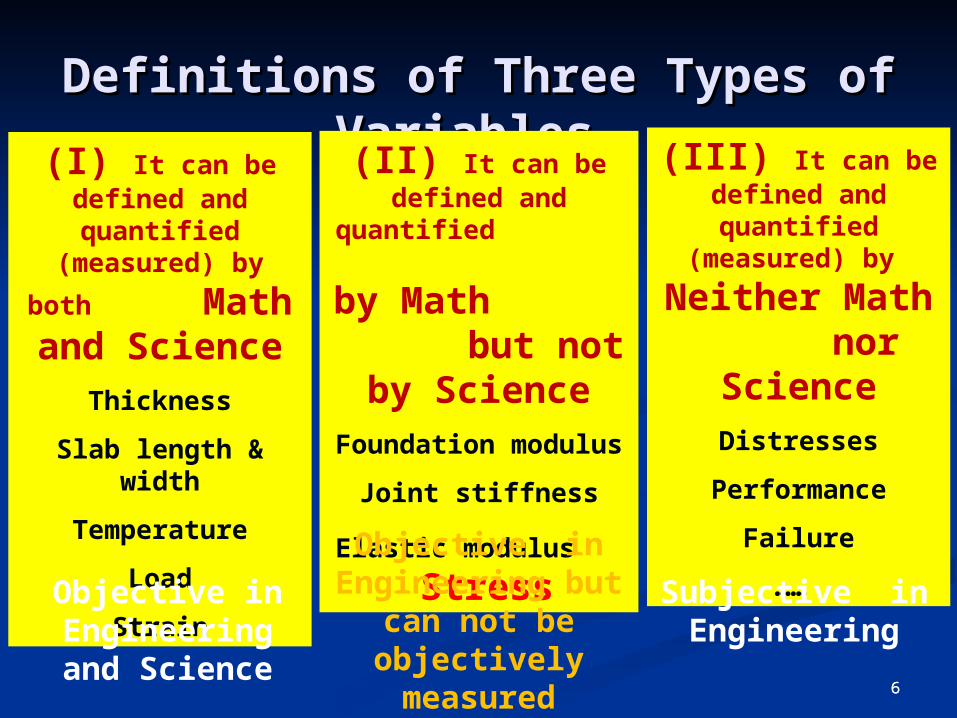
Definitions of Three Types of Definitions of Three Types of Variables Variables
(I) It can be defined and quantified
(measured) by both
Math and ScienceThickness
Slab length & width
Temperature
Load
Strain
(II) It can be defined and quantified
by Math but not by Science
Foundation modulus
Joint stiffness
Elastic modulus
Stress
(III) It can be defined and quantified (measured) by
Neither Math nor Science
Distresses
Performance
Failure
……
Objective in Engineering and
Science
Objective in Engineering but can
not be objectively measured
Subjective in Engineering

Advantages and Disadvantages Advantages and Disadvantages of using DF in Concrete of using DF in Concrete
Pavement Design for Highway Pavement Design for Highway and Airportsand Airports
7
8
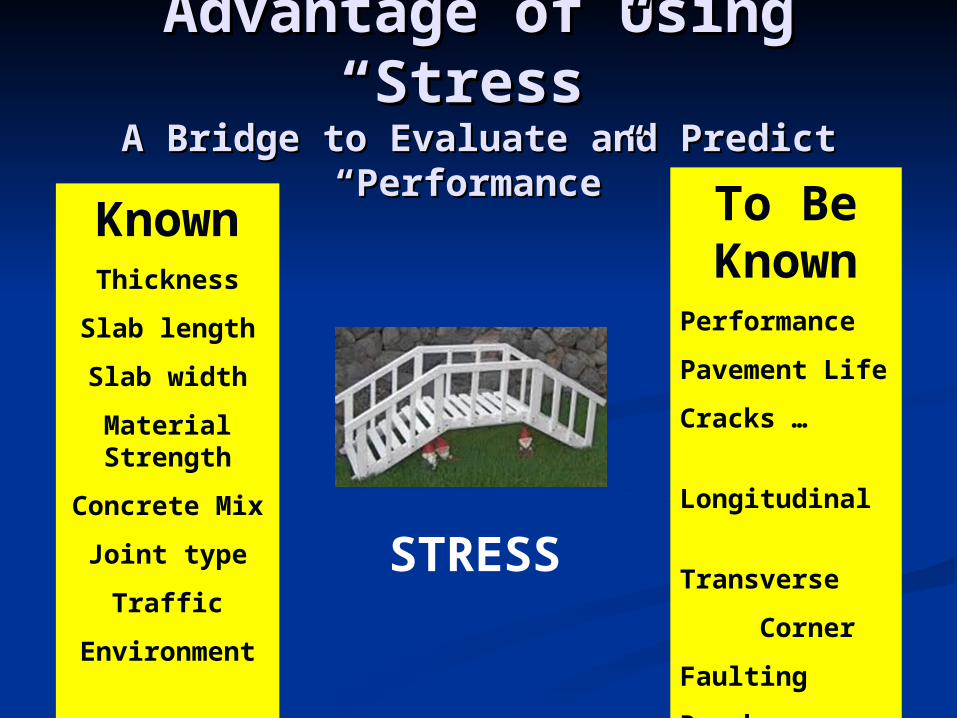
Advantage of Using Advantage of Using “Stress”“Stress”
A Bridge to Evaluate and Predict A Bridge to Evaluate and Predict “Performance”“Performance”
KnownThickness
Slab length
Slab width
Material Strength
Concrete Mix
Joint type
Traffic
Environment
To Be Known
Performance
Pavement Life
Cracks …
Longitudinal
Transverse
Corner
Faulting
Roughness
STRESS
9
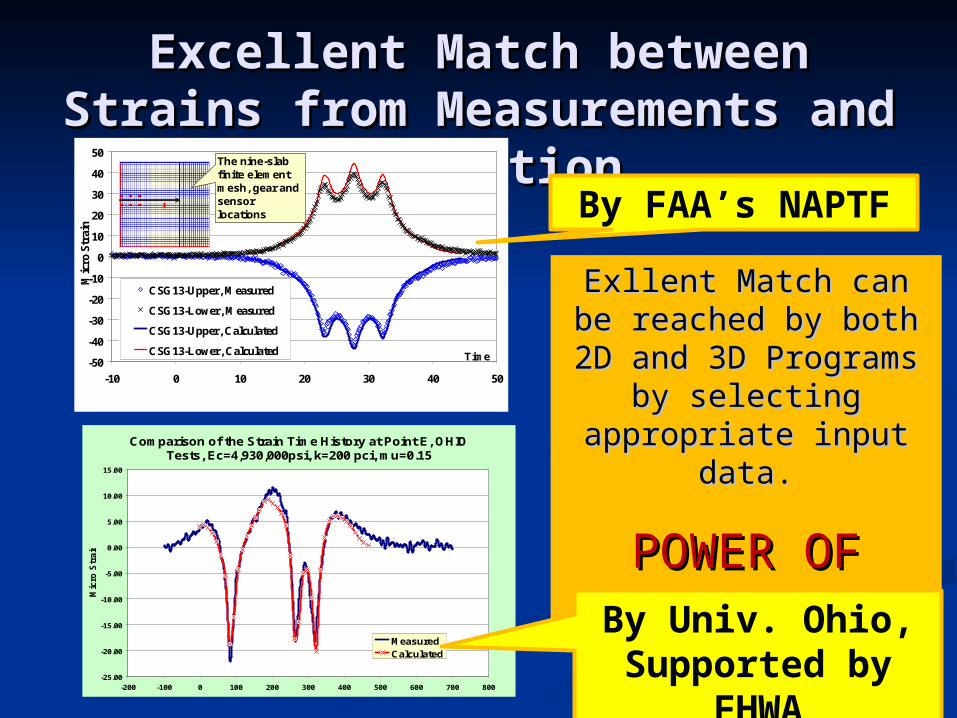
Excellent Match between Excellent Match between Strains from Measurements Strains from Measurements
and Predictionand Prediction
Exllent Match can be Exllent Match can be reached by both 2D and 3D reached by both 2D and 3D
Programs by selecting Programs by selecting appropriate input data.appropriate input data.
POWER OF POWER OF MODELING MODELING
Comparison of the Strain Time History at Point E, OHIO Tests, Ec=4,930,000psi, k=200 pci, mu=0.15
-25.00
-20.00
-15.00
-10.00
-5.00
0.00
5.00
10.00
15.00
-200 -100 0 100 200 300 400 500 600 700 800
Mic
ro S
train
MeasuredCalculated
-50
-40
-30
-20
-10
0
10
20
30
40
50
-10 0 10 20 30 40 50
Time
Mic
ro S
trai
n
CSG13-Upper, Measured
CSG13-Lower, Measured
CSG13-Upper, Calculated
CSG13-Lower, Calculated
The nine-slab finite element mesh, gear and sensor locations
By Univ. Ohio, Supported by FHWA
By FAA’s NAPTF
10
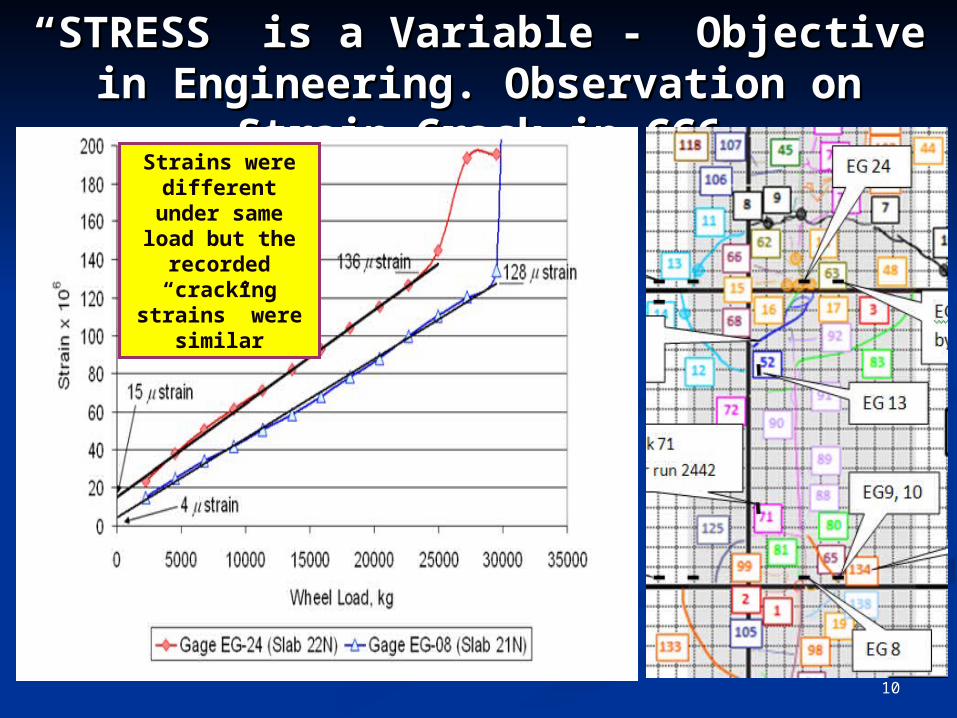
““STRESS” is a Variable - Objective in STRESS” is a Variable - Objective in Engineering. Observation on Strain-Engineering. Observation on Strain-
Crack in CC6Crack in CC6Strains were
different under same load but the
recorded “cracking strains” were
similar
11
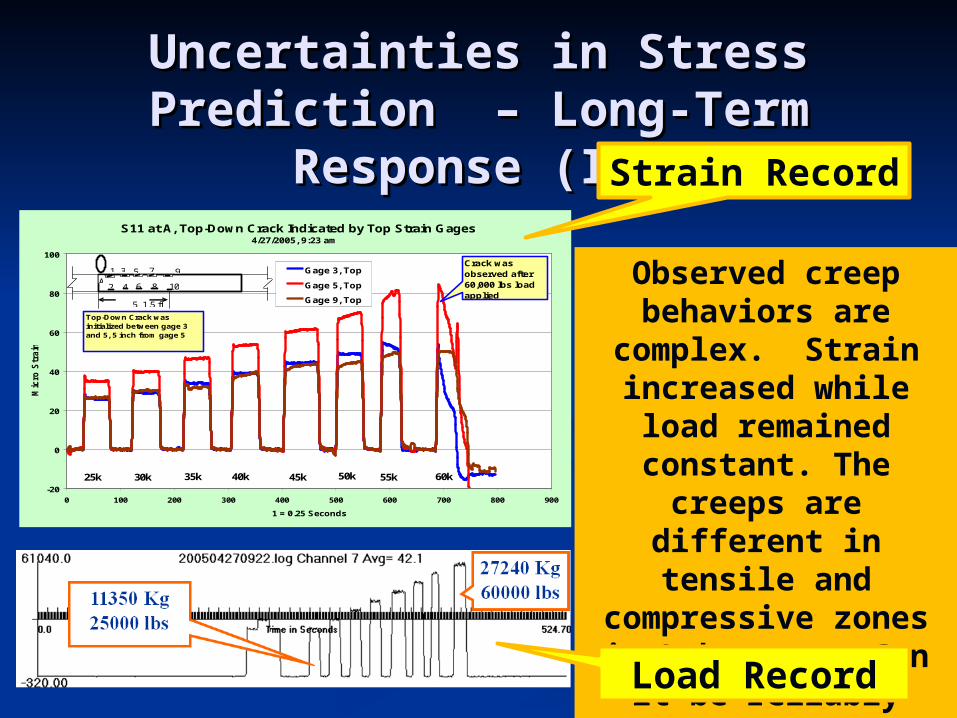
Uncertainties in Stress Uncertainties in Stress Prediction – Long-Term Prediction – Long-Term
Response (I) Response (I) S11 at A, Top-Down Crack Indicated by Top Strain Gages
4/27/2005, 9:23 am
-20
0
20
40
60
80
100
0 100 200 300 400 500 600 700 800 900
1 = 0.25 Seconds
Mic
ro S
train
s
Gage 3, Top
Gage 5, Top
Gage 9, Top
25k 30k 35k 40k 45k 50k 55k 60k
Crack was observed after 60,000 lbs load applied
Top-Down Crack was initialized between gage 3 and 5, 5 inch from gage 5
5 1.5 ft
A1 3 5 7 9
2 4 6 8 10 Observed creep behaviors are complex. Strain increased while load
remained constant. The creeps are different in
tensile and compressive zones in Lab tests. Can it be reliably predictable in
concrete pavement?
Strain Record
Load Record
12
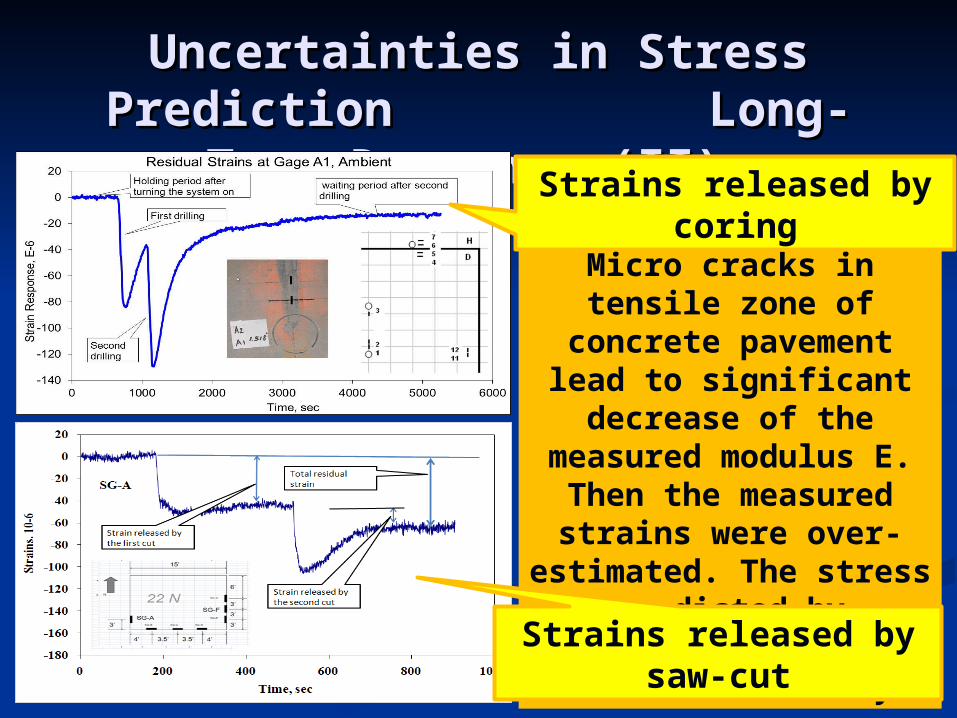
Uncertainties Uncertainties in Stress Prediction in Stress Prediction Long- Term Response (II) Long- Term Response (II)
Micro cracks in tensile zone of concrete pavement lead to
significant decrease of the measured modulus E. Then the measured strains were over-estimated. The stress predicted by mechanistic
model is lack of reliability.
Strains released by coring
Strains released by saw-cut
13
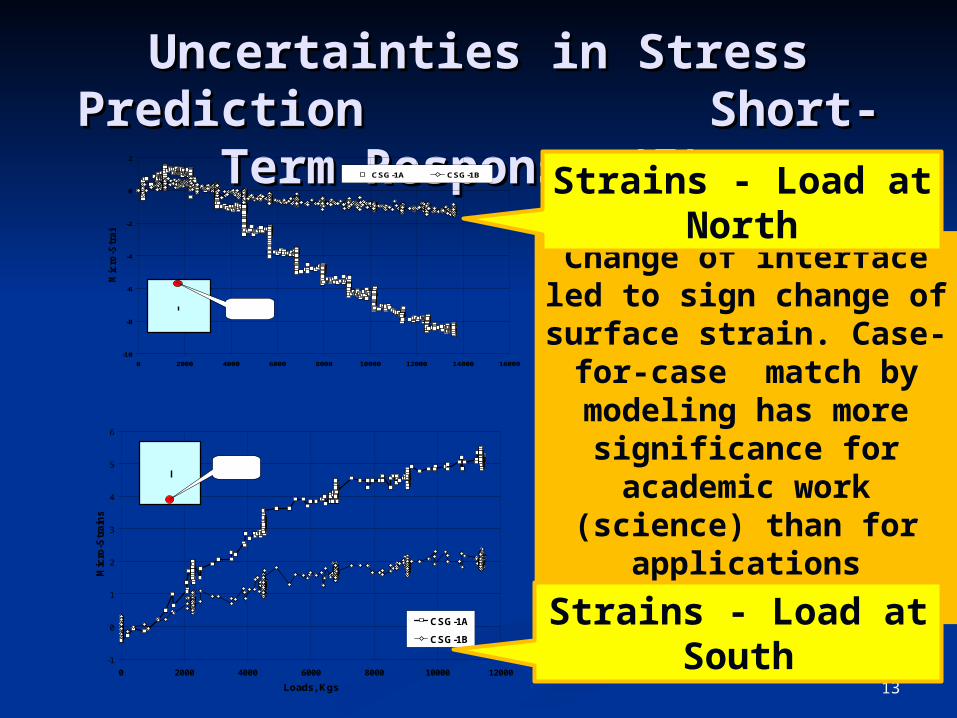
UncertaintiesUncertainties in Stress Prediction in Stress Prediction Short-Term Response (I) Short-Term Response (I)
Change of interface led to sign change of surface strain.
Case-for-case match by modeling has more
significance for academic work (science) than for
applications (engineering).
-10
-8
-6
-4
-2
0
2
0 2000 4000 6000 8000 10000 12000 14000 16000
Mic
ro-S
train
s
CSG-1A CSG-1B
CSG1
LoadLocation
VD2
-1
0
1
2
3
4
5
6
0 2000 4000 6000 8000 10000 12000
Loads, Kgs
Mic
ro-S
train
s
CSG-1A
CSG-1B
CSG1 LoadLocation
VD6
Strains - Load at South
Strains - Load at North
14
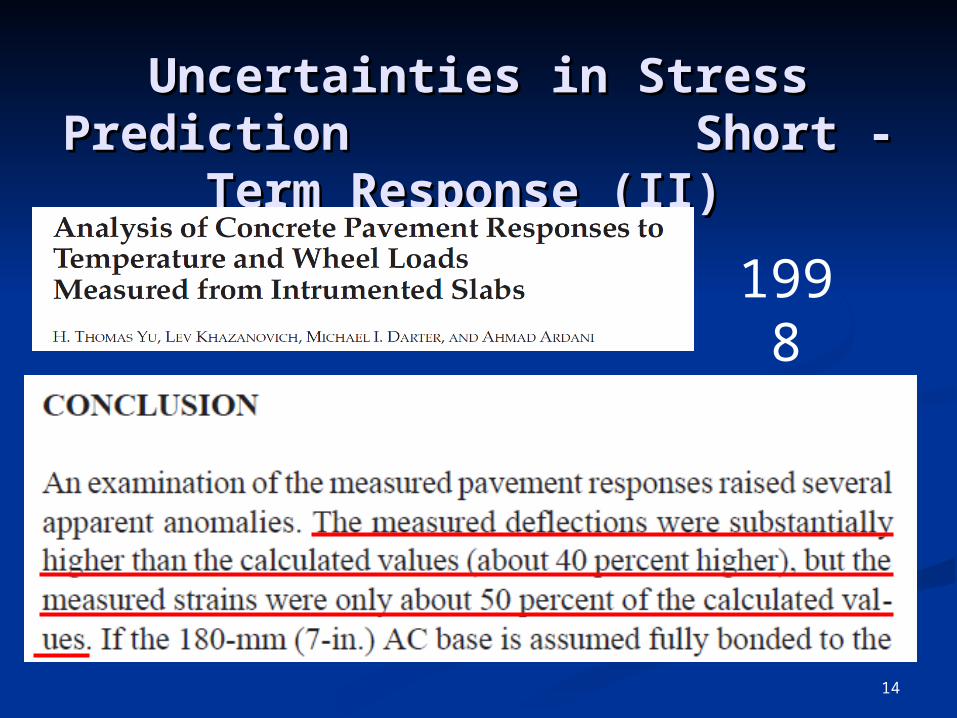
UncertaintiesUncertainties in Stress Prediction in Stress Prediction Short - Term Response Short - Term Response
(II) (II)
1998
15
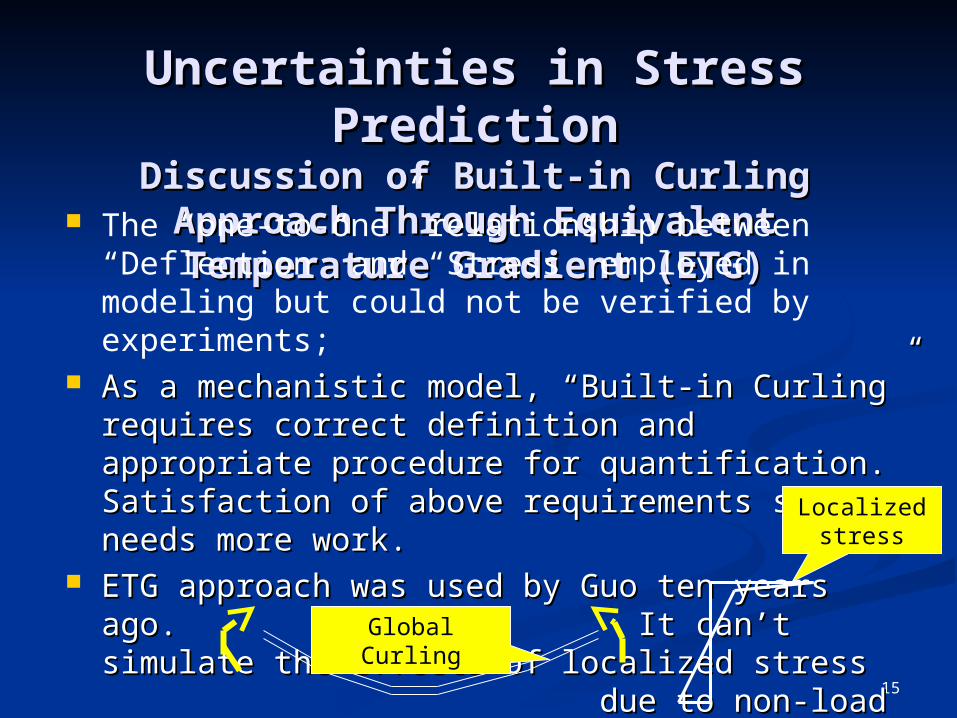
Uncertainties in Stress PredictionUncertainties in Stress PredictionDiscussion of Built-in Curling Approach Discussion of Built-in Curling Approach
Through Equivalent Temperature Through Equivalent Temperature Gradient (ETG)Gradient (ETG) The “one-to-one” relationship between “Deflection” and
“Stress” employed in modeling but could not be verified by experiments;
As a mechanistic model, “Built-in Curling” requires correct As a mechanistic model, “Built-in Curling” requires correct definition and appropriate procedure for quantification. definition and appropriate procedure for quantification. Satisfaction of above requirements still needs more work.Satisfaction of above requirements still needs more work.
ETG approach was used by Guo ten years ago. ETG approach was used by Guo ten years ago. It can’t simulate the effects of localized stress It can’t simulate the effects of localized stress due to non-load excitation. due to non-load excitation.
Localized stress
Global Curling
16
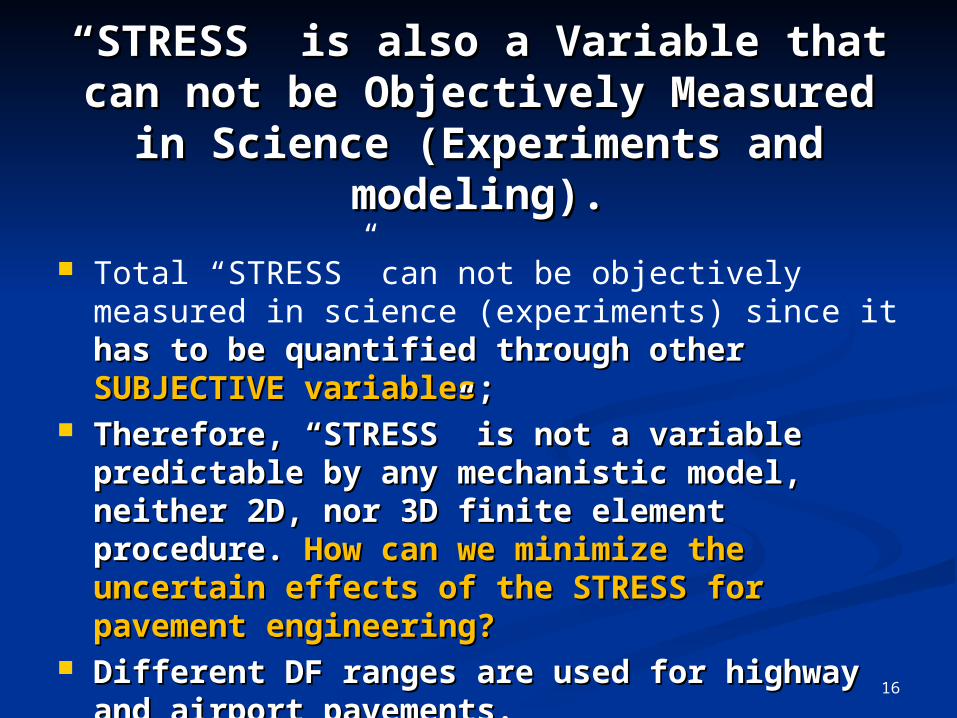
Total “STRESS” can not be objectively measured in science (experiments) since it has to be quantified through has to be quantified through otherother SUBJECTIVESUBJECTIVE variables variables;;
Therefore, “STRESS” is not a variable Therefore, “STRESS” is not a variable predictable by any mechanistic model, neither predictable by any mechanistic model, neither 2D, nor 3D finite element procedure. 2D, nor 3D finite element procedure. How can How can we minimize the uncertain effects of the we minimize the uncertain effects of the STRESS for pavement engineering? STRESS for pavement engineering?
Different DF ranges are used for highway and Different DF ranges are used for highway and airport pavements.airport pavements.
““STRESS” is also a Variable that STRESS” is also a Variable that can not be Objectively Measured in can not be Objectively Measured in
Science (Experiments and Science (Experiments and modeling).modeling).
How to Maximize the How to Maximize the Advantage of Using DF Advantage of Using DF
and Minimize its and Minimize its Uncertainty Effects by Uncertainty Effects by
Full Scale Testing?Full Scale Testing?
17
18
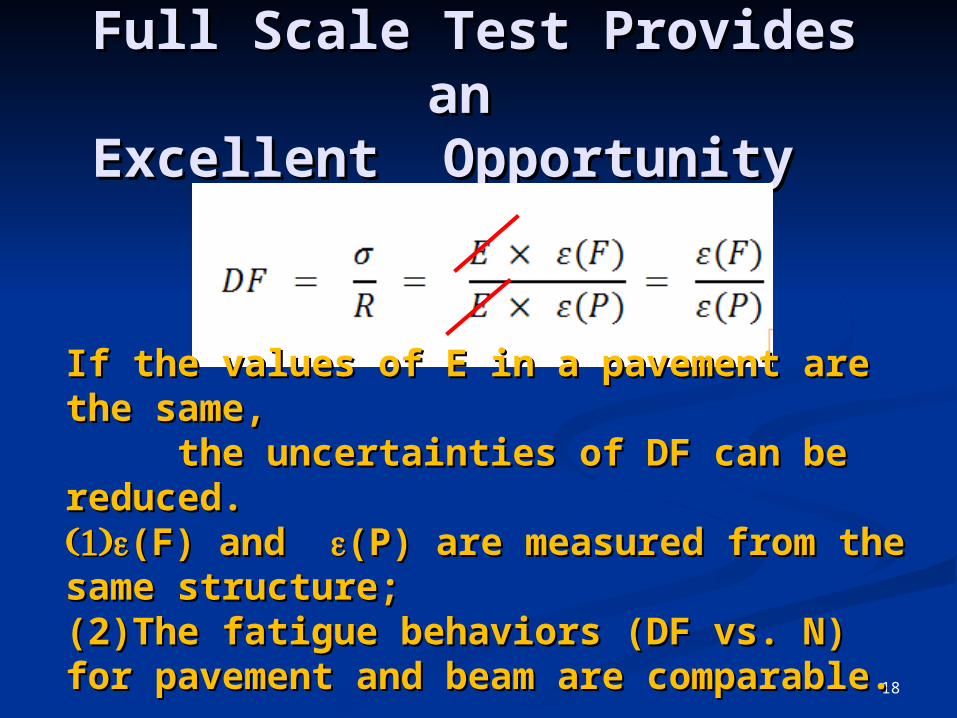
Full Scale Test Provides Full Scale Test Provides an an
Excellent Opportunity Excellent Opportunity
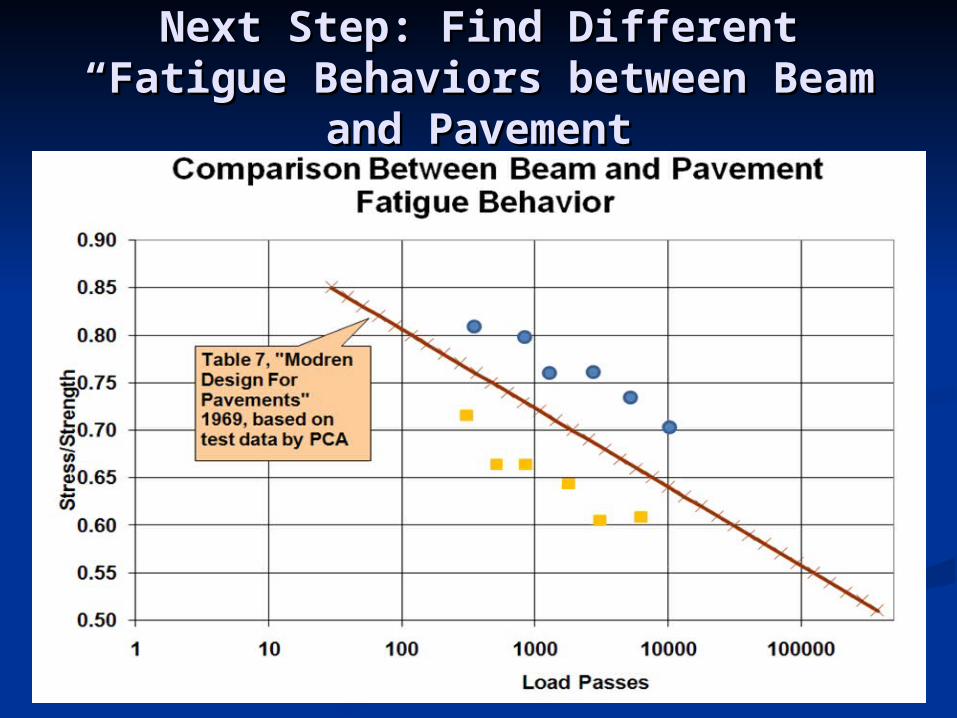
If the values of E in a pavement are the If the values of E in a pavement are the same, the same, the uncertainties of DF can be reduced.uncertainties of DF can be reduced.(1)(1)(F) and (F) and (P) are measured from the (P) are measured from the same structure;same structure;(2)(2)The fatigue behaviors (DF vs. N) for The fatigue behaviors (DF vs. N) for pavement and beam are comparable. pavement and beam are comparable.
19
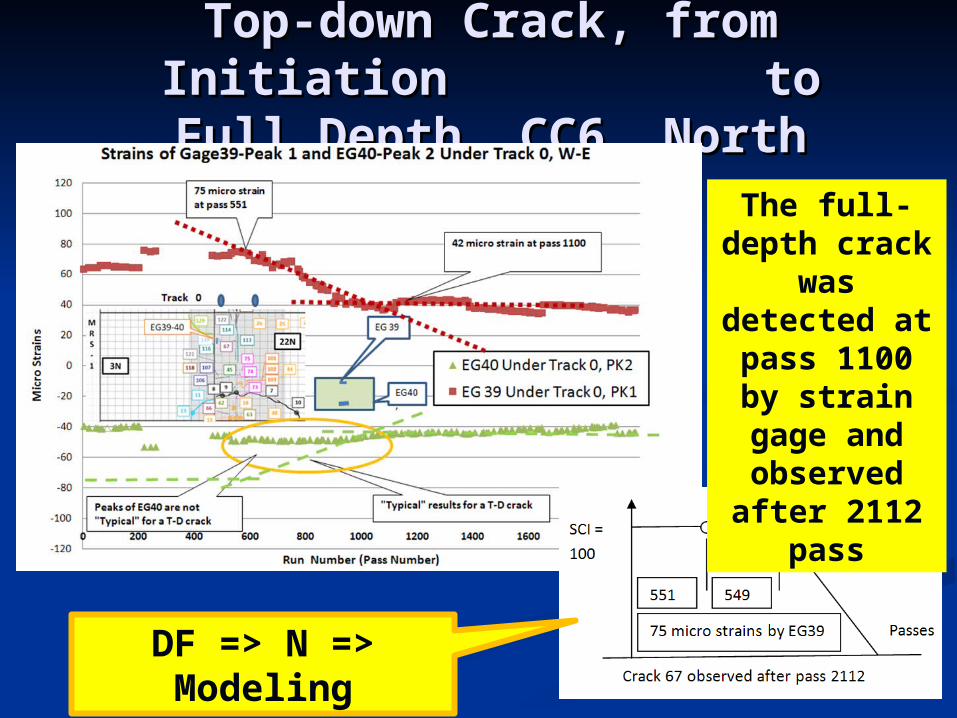
Top-down Crack, from Top-down Crack, from Initiation to Full Initiation to Full
Depth, CC6, NorthDepth, CC6, North
DF => N => Modeling
The full-depth crack was
detected at pass 1100 by strain
gage and observed after
2112 pass
20
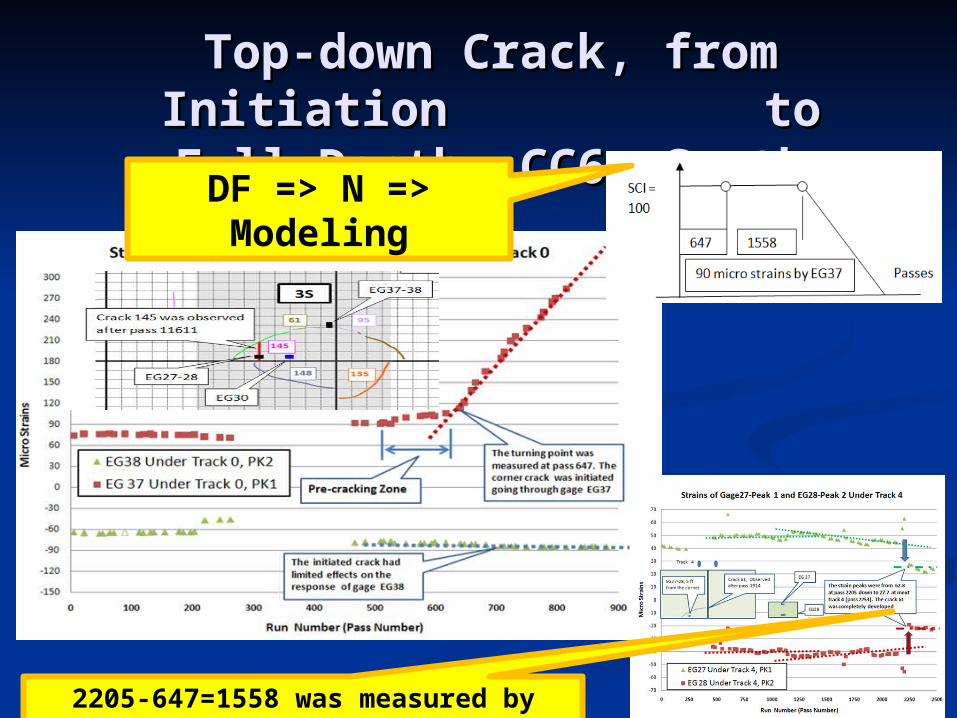
Top-down Crack, from Top-down Crack, from Initiation to Full Initiation to Full
Depth, CC6, SouthDepth, CC6, SouthDF => N => Modeling
2205-647=1558 was measured by gages 27-28
21
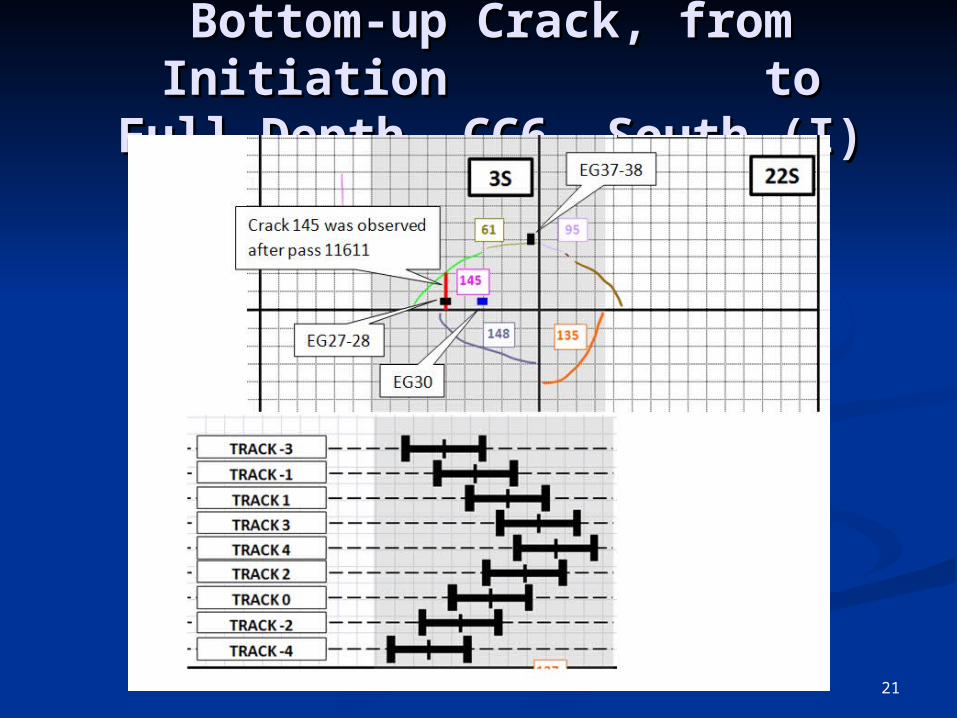
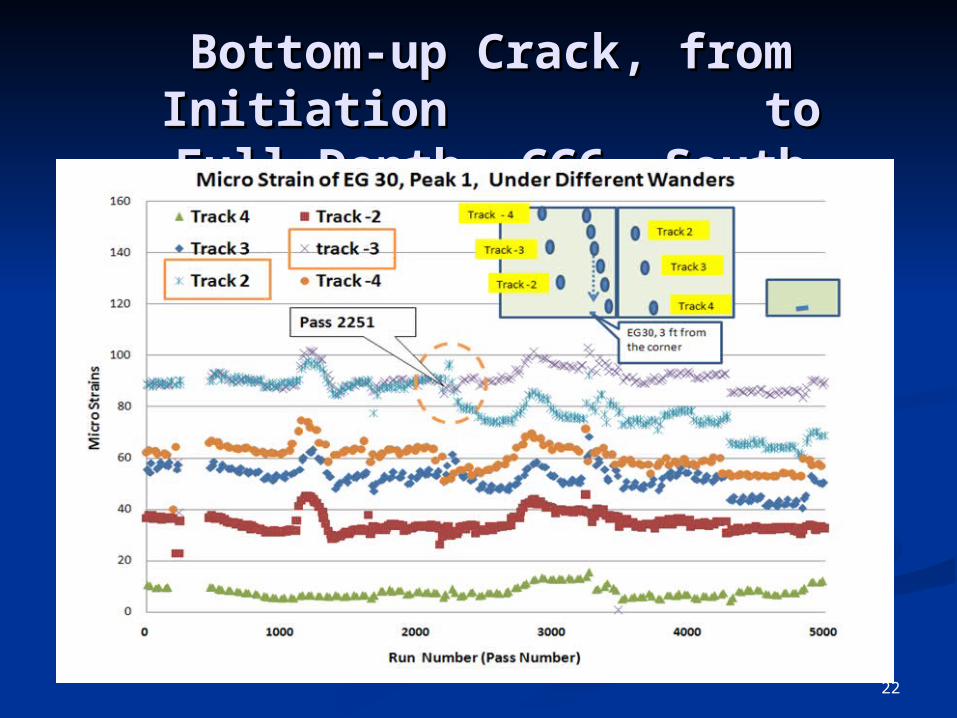
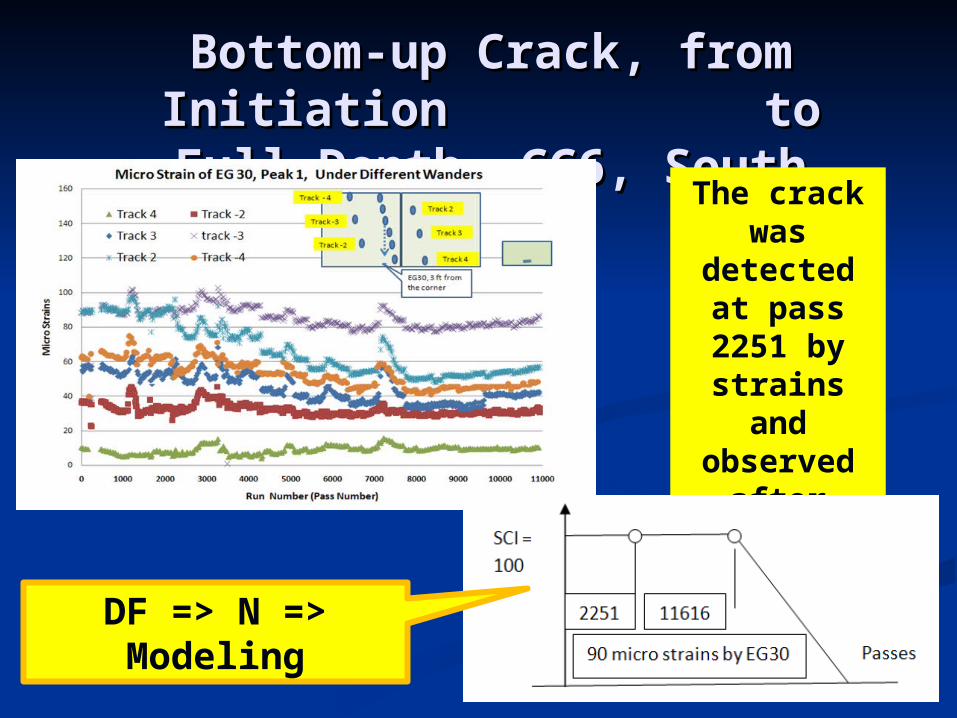
Bottom-up Crack, from Bottom-up Crack, from Initiation to Full Initiation to Full Depth, CC6, South (I)Depth, CC6, South (I)
22
Bottom-up Crack, from Bottom-up Crack, from Initiation to Full Initiation to Full Depth, CC6, South (II)Depth, CC6, South (II)
23
Bottom-up Crack, from Bottom-up Crack, from Initiation to Full Initiation to Full Depth, CC6, South (III)Depth, CC6, South (III)
The crack was detected at pass 2251
by strains and observed after 11616 passes
by survey
DF => N => Modeling
24
Next Step: Find Different “Fatigue Next Step: Find Different “Fatigue Behaviors between Beam and Behaviors between Beam and
PavementPavement
25
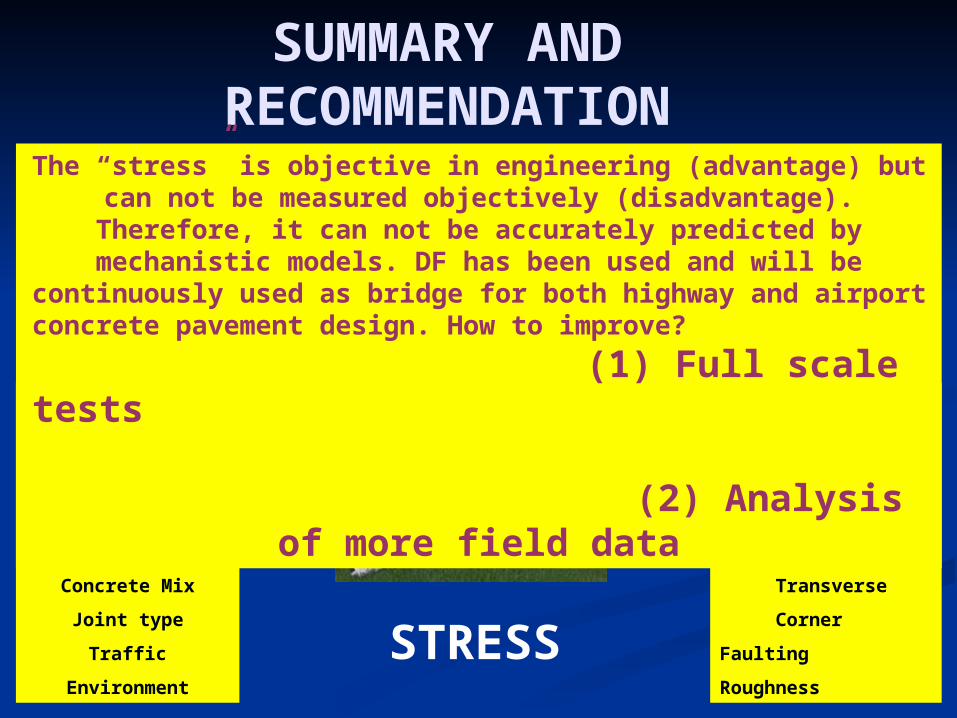
SUMMARY AND RECOMMENDATION
KnownThickness
Slab length
Slab width
Material Strength
Concrete Mix
Joint type
Traffic
Environment
To Be KnownPerformance
Pavement Life
Cracks …
Longitudinal
Transverse
Corner
Faulting
Roughness
STRESS
The “stress” is objective in engineering (advantage) but can not be measured objectively (disadvantage). Therefore, it can not be accurately predicted by
mechanistic models. DF has been used and will be continuously used as bridge for both highway and airport concrete pavement design. How to improve?
(1) Full scale tests (2) Analysis of more
field data

26
Thank You !