1 of 15 09-02-16 4:51 pmkcgjournal.org/kcg/wp-content/uploads/commerce/issue12/issue12_… ·...
TRANSCRIPT

Continuous Issue - 12 | January - February 2015
A Study on Selected Calendar Anomalies in Indian Stock Market
Abstract :
The stock market is having very important place in any Country’s growth and development. Whenwe talk about the workforce of the market, it is generally observed that it will affect by many factorsand it is also depends on the few foreign markets also. A calendar effect is any market anomaly oreconomic effect which appears to be related to the calendar. Such effects include the apparentlydifferent behavior of stock markets on different days of the week, different times of the month, anddifferent times of year (seasonal tendencies). Stock market prices are often changes subject to theseasonal effect because of the availability and demand for an item. Anomalies that are link to aparticular time are called calendar effect. Some of the most popular calendar effect includes theweekend effect, the January effect, the turn-of-the-month effect, the turn-of-the-year effect. Theobjective of this study is to explore the January effect, Friday the 13th effect, Wednesday effect, andweekend effect on the Indian stock exchange. Till the late nineties, empirical studies provided ampleevidence as to the informational efficiency of the capital markets advocating futility of informationin consistently generating abnormal returns. However, later studies identified certain anomalies inthe efficient market postulate. Anomalies reflect inefficiency within market. Some anomalies occuronce and some occurs repeatedly. One major anomaly brought forth was the calendar-relatedabnormal rates of return. Various studies in this domain empirically demonstrated, throughnon-parametric tests on the stock returns, that January, Wednesday, Friday the 13th and Weekendhave consistently generated abnormal equity returns in both the developed and emerging marketsunrelated to the attendant risks. Studies on the Indian stock markets’ and other selected Asianmarkets’ calendar anomalies, are very few. In an attempt to fill this gap, this study explores theIndian stock market’s efficiency in the ‘Semi strong form’ in the context of calendar anomalies,especially in respect of the seasonal effects.
Key words:Calendar Anomalies, Indian Stock Market, Market Efficiency
Introduction
Stock Market Efficiency is an important concept because it helps us to understand the working of theCapital Markets. The term, Market Efficiency, explains the Relationship between Information and SharePrices in the Capital Market. The efficiency of the emerging markets assumes greater importance asthe trend of investments is accelerating in these markets as a result of regulatory reforms andremoval of other barriers for the International Equity Investments. Efficient Market Hypothesis (EMH)suggests that all securities are priced efficiently to fully reflect all the information of the intrinsic valueof the stocks. However, in the context of financial markets, especially in the case of equity returns,several Seasonal Effects, that create higher or lower returns depending on the time, have beennoted.
Anomalies are empirical results that seem to be inconsistent with maintained theories of asset-pricingbehavior. They indicated either market inefficiency (profit opportunities) or inadequacies in theunderlying asset-pricing model. After They Are Documented and Analyzed in the academic literature,anomalies Often Seem to disappear, reverse, or attenuated. This raises the question of profitopportunities whether existed in the past, but have been since arbitraged away, or whether theanomalies were simply statistical aberrations that attracted the attention of academics andpractitioners.
KCG - Portal of Journals http://www.kcgjournal.org/cm/issue12/HardikShah.php
1 of 15 09-02-16 4:51 PM

Investment strategies have received lot of attention in the academic world. Researchers worldwide arepersistently trying to explore newer methods of improving upon the investment yields. Traditionalinvestment theory has established a direct correlation between the risk and returns. It is on thismaxim that William Sharpe, John Lintner and Jan Mossin designed the phenomenal Capital AssetPricing Model. However the researchers and investors all over the world are always looking formaximizing their yields while trying to keep the investment risk at minimum. The objective of theresearch work undertaken is to examine the Risk Anomaly on the scrip traded in National StockExchange. It is an approach which attempts to build a portfolio which maximizes returns for scripwhile keeping volatility at minimum. The volatility in the research undertaken is determined by thestandard deviation of the stock returns
Calendar Effects:
Anomalies that are linked to a particular time are called calendar effects. Some of the most popularcalendar effects include the weekend effect, the turn-of-the-month effect, the turn-of-the-year effectand the January effect.
The weekend effect describes the tendency of stock prices to decrease on Mondays, meaningthat closing prices on Monday are lower than closing prices on the previous Friday. For someunknown reason, returns on Mondays have been consistently lower than every other day of theweek. In fact, Monday is the only weekday with a negative average rate of return.
Turn-of-the-Month Effect: The turn-of-the-month effect refers to the tendency of stock prices torise on the last trading day of the month and the first three trading days of the next month.Turn-of-the-Year Effect: The turn-of-the-year effect describes a pattern of increased tradingvolume and higher stock prices in the last week of December and the first two weeks of January.January Effect: Amid the turn-of-the-year market optimism, there is one class of securities thatconsistently outperforms the rest. Small-company stocks outperform the market and other assetclasses during the first two to three weeks of January. This phenomenon is referred to as theJanuary effect.Day of the Week Effect: The day of the week is calculated by taking average of return of each dayof the week separately.Friday – The 13th Effect: Superstition is deep-rooted in Indian society, where irrational fear stillinfluences the mass mind. In this context, it is pertinent to investigate whether the Indiansecurities market is also affected by superstitions or has it been able to immunize itself againstits force.Monthly Effect: In testing the monthly effect, the first half of the each month is defined as theperiod which includes 30th& 31st calendar days of previous month and 1st to 14th calendar daysof the month, while the second half comprises the rest of the calendar days that are from 15thto 29th.
Literature Review:
Keim and Donald B (1983) examined month-by-month, the empirical relation between abnormalreturns and market value of NYSE and AMEX common stocks. Evidence is provided that dailyabnormal return distributions in January have large means relative to the remaining eleven months,and that the relation between abnormal returns and size is always negative and more pronounced inJanuary than in any other month – even in years when, on average, large firms earn larger riskadjusted returns than small firms. Lee and Chang (1988) studied on three anomalous phenomena instock returns --the firm size effect, the January effect, and the day -of -the -week effect --areexamined in Korea. It is shown that the anomalies exist in the Korean data even after adjusting forbiases suggested by various hypotheses. Further evidence of the anomalies is provided bydecomposing daily close -to -close returns into non trading period returns and trading periodreturns. Branch and Chang (1990) found that the role of per share price in identifying stocksparticularly likely to outperform the market in January. It is found that low price stocks that exhibitedpoor December performance were likely to rebound in January. Zhang and Li (2006) investigated time– varying Calendar Effect in the Chinese Stock Market, using the GARCH (1,1) – GED(General ErrorDistribution) Model. The study found that the Friday Effect exists with low volatility at the early stage,but since 1997, the Positive Tuesday Effect has been noticed. Besides, there was a Small FirmJanuary Effect with high volatility. The Turn-of-the Month Effect has also disappeared in the ChineseStock Market since 1997. Basher and Sadorsky (2006) investigated the Day-of-the-Week Effect in 21Emerging Stock Markets. The results of this study showed that while the Day-of-the-Week Effect was
KCG - Portal of Journals http://www.kcgjournal.org/cm/issue12/HardikShah.php
2 of 15 09-02-16 4:51 PM

not present in the majority of Emerging Stock Markets studied, some Emerging Stock Markets didexhibit strong Day-of-the-Week Effect even after accounting for conditional market risk. Brooks andPersand (2001) examined the evidence for the Day of the Week Effect in five Southeast Asian StockMarkets. The Authors found that neither South Korea nor the Philippines recorded significantCalendar Effects. But both Thailand and Malaysia registered significant positive average returns onMonday and significant negative average returns on Tuesday. In addition, the study also documenteda significant negative Wednesday Effect in Taiwan. Silva (2010) found that the Monday effect couldnot be found in the Portuguese stock market. Bodla and Jindal (2006) found that that none ofanomalies exist in the US market and thus this market can be considered as informationally efficient.On the other hand, the Indian stock market reveals turn of the month effect as well as semi-monthlyeffect but the day effect is not found. Singhaland Bahure (2009) carried out an interesting study onweekend effect. Their results suggest that future examinations of the stock market of the periodfrom April 2003-April 2008 will have residual daily effects, even after the adjustments that are theunexplained part of the weekend effect. This could potentially influence conclusions and raisequestions about market efficiency. Whatever these tests show, they cannot ignore the institutionalnecessity of making adjustments for settlement lags and other effects when using data on dailyreturns, since it would be difficult to accept that investors would ignore two days of interest.Nageswari and Babu (2011) examined the Week End Effect in the Indian Stock Market. The studyfound that the mean returns were positive for all days of the week, highest on Friday and lowest onMonday. It was inferred that the Day of the Week Pattern did not exist in the Indian Stock Marketduring the study period. Nath and Dalvi (2004) examined the day of the week effect anomaly in theIndian equity market for the period from 1999 to 2003 using S&P CNX NIFTY. Their study indicatesthat before introduction of rolling settlement in January 2002, Monday and Friday were insignificantdays. However, after the introduction of the rolling settlement, Friday, being the last day of the weekhas become significant. Monday seems to have higher standard deviation followed by Friday. Dash etal (2011) provided evidence for a month-of-the-year effect in Indian stock markets. In particular,there is clear indication of positive November, August, and December effects, and a negative Marcheffect. The end-of-the-year effect (i.e. positive November and December effects) could be a Diwalieffect, with a huge surge in the purchase of household goods, electronic equipments, and gold inIndia, usually in November. The results of the study also provide evidence for a March effect for stockreturns in India. This could be because the Indian tax year ends in March, in contrast with the US taxyear which ends in December. Kaur (2004) examined Sensex and Nifty returns, it is shown that‘day-of the- week effect’ or the ‘week end effect’ and the ‘January effect’ are not present while thereturn and volatility do show intra-week and intra-year seasonality. The return and volatility onvarious weekdays have somewhat changed after the introduction of rolling settlements. Nageswari,Selvam (2011) found that there was maximum return earned on Wednesday and negative returnsrecorded on Monday during the study period. The regression results confirmed the seasonal effectdoes not exist in stock returns in India. The study further reveal that January, February and Marchhave negative returns and November and December show significant positive high returns. The Studyfound out that the day of the week effect and monthly effect pattern did not appear to exist in IndianStock Market.
Research Methodology
Rational Study Research:
As per the study of literature review of efficient market hypothesis in developed foreignexchanges though there is semi strong form available still the literature proves some of the anomaliesprevalent in market, and in developing countries market like India sometimes weak form andsometimes semi strong form prevails in the market and here also the researchers found someanomalies and trends in the market. So due to this confusion I am conducting my research of somespecific anomalies with same time period in developing Indian market. Friday the 13th effect is foundin global research paper that it exist in market but in Indian market context no conclusion of it stillnot found, so I would like to study it in Indian market situation. Weekend effect was experienced inmany papers which I studied but still there is lack of evidence in concluding it so I have taken thisanomaly in my study.
Objectives:
To investigate the existence of Weekend Effect in the Indian Stock Market.
KCG - Portal of Journals http://www.kcgjournal.org/cm/issue12/HardikShah.php
3 of 15 09-02-16 4:51 PM

To identify the Wednesday effect in the Indian stock market.To discover whether the Friday the 13thEffect exist in the Indian stock market.To investigate the existence of January Effect in the Indian Stock Market.
Sample Selection
Indian Stock Market is one of the most dynamic and efficient markets in Asia. The two national levelexchanges operating in India are the National Stock Exchange (NSE) and the Bombay StockExchange (BSE) . These exchanges are well equipped with Electronic Trading Platforms and handlelarge volume of transactions on a daily basis. For the purpose of this study, S&P CNX Nifty in NSE,BSE Sensex, were considered as sample for this study. I studied Weekend Effect, January effect,Wednesday effect price earning effect, Friday the 13thEffects in two Indian Stock markets for periodof April 2003 to March 2014. Also to find out Indian market is of semi strong form of marketefficiency.
Source of Data:
The present study mainly depended upon Secondary Data and used daily index closing values. Therequired information of every day’s closing values was collected from www.yahoofinance.com andnational stock exchanges sites www.nseindia.com and www.bseindia.com. The other relevantinformation for this study was collected from different Websites, Journals, and Books.
Data Analysis and Interpretation
January Effect:
The January Effect suggests that abnormal returns in January are due to the new informationprovided by the firms at the end of the fiscal year because the financial earning announcement ismade normally in January. It is to be noted that there may be several reasons, why the January Effecthappens, but no one can fully explain the January Effect.
H0: There is no significance difference between mean return of January and mean return of rest ofthe month for the research period.
HA: There is significance difference between mean return of January and mean return of rest of themonth for the research period.
Sensex
The Results of Descriptive Statistics for Sensex Index Daily Returns from January 2004 toDecember 2014
BSEJanuary Rest of the Month
Mean -0.2495 -0.0459Standard Error 0.0951 0.0296Median -0.1832 -0.0322Standard Deviation 1.4270 1.4097Kurtosis 5.8425 4.1412Skewness -0.9603 -0.3743Minimum -8.0392 -10.2717Maximum 4.8998 7.2415Sum -56.1270 -104.3413Count 225 2272Confidence Level (95.0%) 0.1875 0.0580
Year Month Mean SD Effect Found
2004January -0.6606 1.98135
NoRest of the year -0.0276 1.4848
2005January -0.2436 1.4506
NoRest of the year 0.03618 0.98382
KCG - Portal of Journals http://www.kcgjournal.org/cm/issue12/HardikShah.php
4 of 15 09-02-16 4:51 PM

2006January 0.16464 0.88676
YesRest of the year -0.0694 1.57854
2007January -0.0068 1.08463
YesRest of the year -0.0254 1.37101
2008January -0.8213 2.26503
NoRest of the year -0.2356 2.36659
2009January -0.1004 2.44461
NoRest of the year 0.11631 1.72985
2010January -0.3407 0.94006
NoRest of the year 0.05433 0.96185
2011January -0.7271 1.06546
NoRest of the year -0.1808 1.12294
2012January 0.27942 0.83166
YesRest of the year -0.048 0.80239
2013January -0.1092 0.49407
NoRest of the year -0.0816 0.9898
2014January -0.1754 0.62297
NoRest of the year -0.0274 0.71729
Table presents the Results of Descriptive Statistics of Standard Deviation, Skewness,Kurtosis for Sensex during the study period from January 2004 to December 2014. It is clearlyunderstood that the Sensex Index received negative returns for all the sample years. During thestudy period, the January registered the highest mean return (0.27942) for the year 2012. Therewas low and negative returns recorded for the year 2008 because of the impact of the FinancialCrisis.
The highest value of Standard Deviation (2.44461) was recorded in January with negativemean return (-0.1004) in the year 2009 and the Least Value of Standard Deviation (0.49407)was recorded in 2013. This clearly indicates that the stock market was more volatile for the year2008-09 and least volatile in 2013 and 2014 during the study period. Hence it is suggested thatthe Market Regulator may take appropriate steps to stabilize the market. The return distributionwas negatively skewed for all the sample years. The Kurtosis measure of returns distribution wasLeptokurtic for the sample years, showing the highest value (5.8425) in January for the sampleyears and showing less value (4.1412) in rest of the year.
Kruskall-Wallis Test
Test Statisticsa,b
BSE January eff.Chi-Square 5.006Df 1Asymp. Sig. .025
a.Kruskal Wallis Test b.Grouping Variable: VAR00002
According to the results as given in the above Table, the Kruskall-Wallis Statistics Value for theJanuary effect is 0.025 which is less than 0.05. Hence the Null Hypothesis (H0), “There is nosignificance difference between mean return of January and mean return of rest of the month for theresearch period.” can be rejected. Hence the January effect existed for Sensex Index Returns in allyears.
CNX Nifty:
The Results of Descriptive Statistics for CNX Nifty Index Daily Returns from January 2004 toDecember 2014
NSEJanuary Rest of the Month
Mean -0.1549 0.0372
KCG - Portal of Journals http://www.kcgjournal.org/cm/issue12/HardikShah.php
5 of 15 09-02-16 4:51 PM
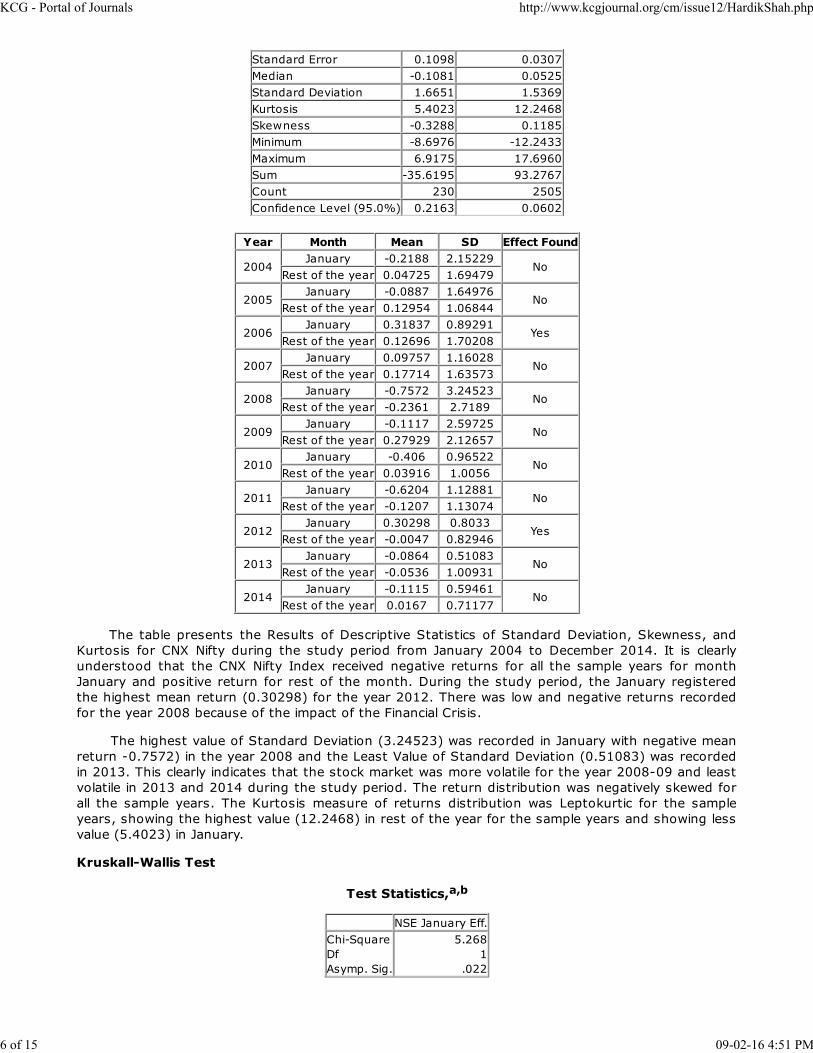
Standard Error 0.1098 0.0307Median -0.1081 0.0525Standard Deviation 1.6651 1.5369Kurtosis 5.4023 12.2468Skewness -0.3288 0.1185Minimum -8.6976 -12.2433Maximum 6.9175 17.6960Sum -35.6195 93.2767Count 230 2505Confidence Level (95.0%) 0.2163 0.0602
Year Month Mean SD Effect Found
2004January -0.2188 2.15229
NoRest of the year 0.04725 1.69479
2005January -0.0887 1.64976
NoRest of the year 0.12954 1.06844
2006January 0.31837 0.89291
YesRest of the year 0.12696 1.70208
2007January 0.09757 1.16028
NoRest of the year 0.17714 1.63573
2008January -0.7572 3.24523
NoRest of the year -0.2361 2.7189
2009January -0.1117 2.59725
NoRest of the year 0.27929 2.12657
2010January -0.406 0.96522
NoRest of the year 0.03916 1.0056
2011January -0.6204 1.12881
NoRest of the year -0.1207 1.13074
2012January 0.30298 0.8033
YesRest of the year -0.0047 0.82946
2013January -0.0864 0.51083
NoRest of the year -0.0536 1.00931
2014January -0.1115 0.59461
NoRest of the year 0.0167 0.71177
The table presents the Results of Descriptive Statistics of Standard Deviation, Skewness, andKurtosis for CNX Nifty during the study period from January 2004 to December 2014. It is clearlyunderstood that the CNX Nifty Index received negative returns for all the sample years for monthJanuary and positive return for rest of the month. During the study period, the January registeredthe highest mean return (0.30298) for the year 2012. There was low and negative returns recordedfor the year 2008 because of the impact of the Financial Crisis.
The highest value of Standard Deviation (3.24523) was recorded in January with negative meanreturn -0.7572) in the year 2008 and the Least Value of Standard Deviation (0.51083) was recordedin 2013. This clearly indicates that the stock market was more volatile for the year 2008-09 and leastvolatile in 2013 and 2014 during the study period. The return distribution was negatively skewed forall the sample years. The Kurtosis measure of returns distribution was Leptokurtic for the sampleyears, showing the highest value (12.2468) in rest of the year for the sample years and showing lessvalue (5.4023) in January.
Kruskall-Wallis Test
Test Statistics,a,b
NSE January Eff.Chi-SquareDfAsymp. Sig.
5.2681
.022
KCG - Portal of Journals http://www.kcgjournal.org/cm/issue12/HardikShah.php
6 of 15 09-02-16 4:51 PM
a.Kruskal Wallis Test b.Grouping Variable: VAR00002
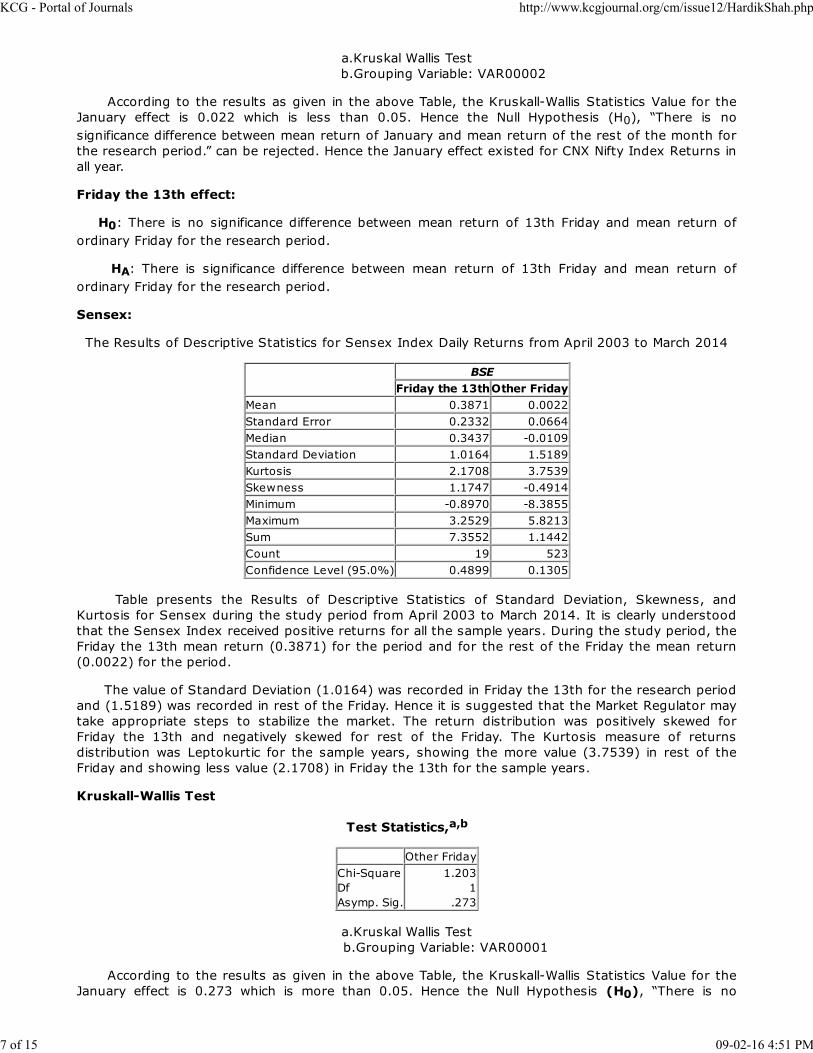
According to the results as given in the above Table, the Kruskall-Wallis Statistics Value for theJanuary effect is 0.022 which is less than 0.05. Hence the Null Hypothesis (H0), “There is nosignificance difference between mean return of January and mean return of the rest of the month forthe research period.” can be rejected. Hence the January effect existed for CNX Nifty Index Returns inall year.
Friday the 13th effect:
H0: There is no significance difference between mean return of 13th Friday and mean return ofordinary Friday for the research period.
HA: There is significance difference between mean return of 13th Friday and mean return ofordinary Friday for the research period.
Sensex:
The Results of Descriptive Statistics for Sensex Index Daily Returns from April 2003 to March 2014
BSEFriday the 13thOther Friday
Mean 0.3871 0.0022Standard Error 0.2332 0.0664Median 0.3437 -0.0109Standard Deviation 1.0164 1.5189Kurtosis 2.1708 3.7539Skewness 1.1747 -0.4914Minimum -0.8970 -8.3855Maximum 3.2529 5.8213Sum 7.3552 1.1442Count 19 523Confidence Level (95.0%) 0.4899 0.1305
Table presents the Results of Descriptive Statistics of Standard Deviation, Skewness, andKurtosis for Sensex during the study period from April 2003 to March 2014. It is clearly understoodthat the Sensex Index received positive returns for all the sample years. During the study period, theFriday the 13th mean return (0.3871) for the period and for the rest of the Friday the mean return(0.0022) for the period.
The value of Standard Deviation (1.0164) was recorded in Friday the 13th for the research periodand (1.5189) was recorded in rest of the Friday. Hence it is suggested that the Market Regulator maytake appropriate steps to stabilize the market. The return distribution was positively skewed forFriday the 13th and negatively skewed for rest of the Friday. The Kurtosis measure of returnsdistribution was Leptokurtic for the sample years, showing the more value (3.7539) in rest of theFriday and showing less value (2.1708) in Friday the 13th for the sample years.
Kruskall-Wallis Test
Test Statistics,a,b
Other FridayChi-SquareDfAsymp. Sig.
1.2031
.273
a.Kruskal Wallis Test b.Grouping Variable: VAR00001
According to the results as given in the above Table, the Kruskall-Wallis Statistics Value for theJanuary effect is 0.273 which is more than 0.05. Hence the Null Hypothesis (H0), “There is no
KCG - Portal of Journals http://www.kcgjournal.org/cm/issue12/HardikShah.php
7 of 15 09-02-16 4:51 PM

significance difference between mean return of 13th Friday and mean return of ordinary Friday for theresearch period.” fail to be rejected. Hence the Friday the 13th effect does not exist for Sensex IndexReturns in all years.
CNX Nifty:
The Results of Descriptive Statistics for CNX Nifty Index Daily Returns from April 2003 to March 2014
d>NSE
Friday the 13thOther FridayMean 0.6064 0.0529Standard Error 0.2863 0.0688Median 0.4437 0.0751Standard Deviation 1.2806 1.6178Kurtosis 1.0597 8.0765Skewness 0.7528 -0.7606Minimum -1.6445 -11.9966Maximum 3.9230 7.0207Sum 12.1276 29.2689Count 20 553Confidence Level(95.0%) 0.5993 0.1351
Table presents the Results of Descriptive Statistics of Standard Deviation, Skewness, Kurtosisfor CNX Nifty during the study period from April 2003 to March 2014. It is clearly understood that theCNX Nifty Index received positive returns for all the sample years. During the study period, the Fridaythe 13th mean return (0.6064) for the period and for the rest of the Friday the mean return (0.0529)for the period.
The value of Standard Deviation (1.2806) was recorded in Friday the 13th for the research periodand (1.6178) was recorded in rest of the Friday. Hence it is suggested that the Market Regulator maytake appropriate steps to stabilize the market. The return distribution was positively skewed forFriday the 13th and negatively skewed for rest of the Friday. The Kurtosis measure of returnsdistribution was Leptokurtic for the sample years, showing the more value (8.0765) in rest of theFriday and showing less value (1.0597) in Friday the 13th for the sample years.
Kruskall-Wallis Test
Test Statisticsa,b
Thirteen FridayChi-SquareDfAsymp. Sig.
2.3461
.126
a.Kruskal Wallis Test b.Grouping Variable: VAR00001
According to the results as given in the above Table, the Kruskall-Wallis Statistics Value for theJanuary effect is 0.126 which is more than 0.05. Hence the Null Hypothesis (H0), “There is nosignificance difference between mean return of 13th Friday and mean return of ordinary Friday for theresearch period.” fail to be rejected. Hence the Friday the 13th effect does not exist for CNX NiftyIndex Returns in all years.
Wednesday Effect
H0: There is no significance difference between mean return of Wednesday and mean return ofrest of the days of the week for the research period.
HA: There is significance difference between mean return of Wednesday and mean return of restof the days of the week for the research period.
KCG - Portal of Journals http://www.kcgjournal.org/cm/issue12/HardikShah.php
8 of 15 09-02-16 4:51 PM

Sensex:
The Results of Descriptive Statistics for Sensex Index Daily Returns from April 2003 to March 2014
BSEWednesday Other Weekdays
Mean -0.0214 -0.0550Standard Error 0.0534 0.0287Median -0.0477 -0.0348Standard Deviation 1.2866 1.3788Kurtosis 5.0837 4.3292Skewness -0.4711 -0.4319Minimum -8.0392 -10.2717Maximum 5.5342 7.2415Sum -12.4300 -127.3566Count 580 2316Confidence Level (95.0%) 0.1049 0.0562
Table presents the Results of Descriptive Statistics of Standard Deviation, Skewness, and Kurtosisfor Sensex during the study period from April 2003 to March 2014. It is clearly understood that theSensex Index received negative returns for all the sample years. During the study period, theWednesday mean return (-0.0214) for the period and for the rest of the days of the week the meanreturn (-0.055) for the period. During the study period, the Wednesday registered the highest meanreturn (0.30138) for the year 2009-10. There was low and negative returns recorded for the year2004-05.
YearRemaining DaysWednesday
Effect FoundMean SD Mean SD
2003-04 0.0198 1.39264 0.0498 1.11293 Yes2004-05 -0.0054 1.47801 -0.208 0.97006 No2005-06 0.06029 0.98989 0.20875 0.89261 Yes2006-07 -0.1637 1.63848 0.01368 1.45001 Yes2007-08 -0.1223 1.6434 -0.0715 1.47978 Yes2008-09 -0.1181 2.30627 -0.3041 2.49721 No2009-10 0.04367 1.52579 0.30138 1.62449 Yes2010-11 -0.0508 1.0682 0.02024 0.93685 Yes2011-12 -0.2041 1.10072 -0.0649 0.98344 Yes2012-13 -0.0475 0.75379 -0.0679 0.51273 No2013-14 -0.0254 0.97628 -0.0484 0.8528 No
2003-14 -0.055 1.37878 -0.0214 1.2866 Yes
The highest value of Standard Deviation (2.49721) was recorded in Wednesday with mean return(-0.3041) in the year 2008-09 and the Least Value of Standard Deviation (0.51273) was recorded in2012-13. This clearly indicates that the stock market was more volatile for the year 2008-09 andleast volatile in 2012-13 during the study period. The return distribution was negatively skewed forWednesday and rest of the weekdays for all the sample years. The Kurtosis measure of returnsdistribution was Leptokurtic for the sample years, showing the more value (5.0837) in Wednesdayand showing less value (4.3292) in rest of the days of the week for the sample years.
Kruskall-Wallis Test
Test Statisticsa,a,b
BSE Wed. EffectChi-SquareDfAsymp. Sig.
.0011
.974
a.Kruskal Wallis Test
KCG - Portal of Journals http://www.kcgjournal.org/cm/issue12/HardikShah.php
9 of 15 09-02-16 4:51 PM
b.Grouping Variable: VAR00001
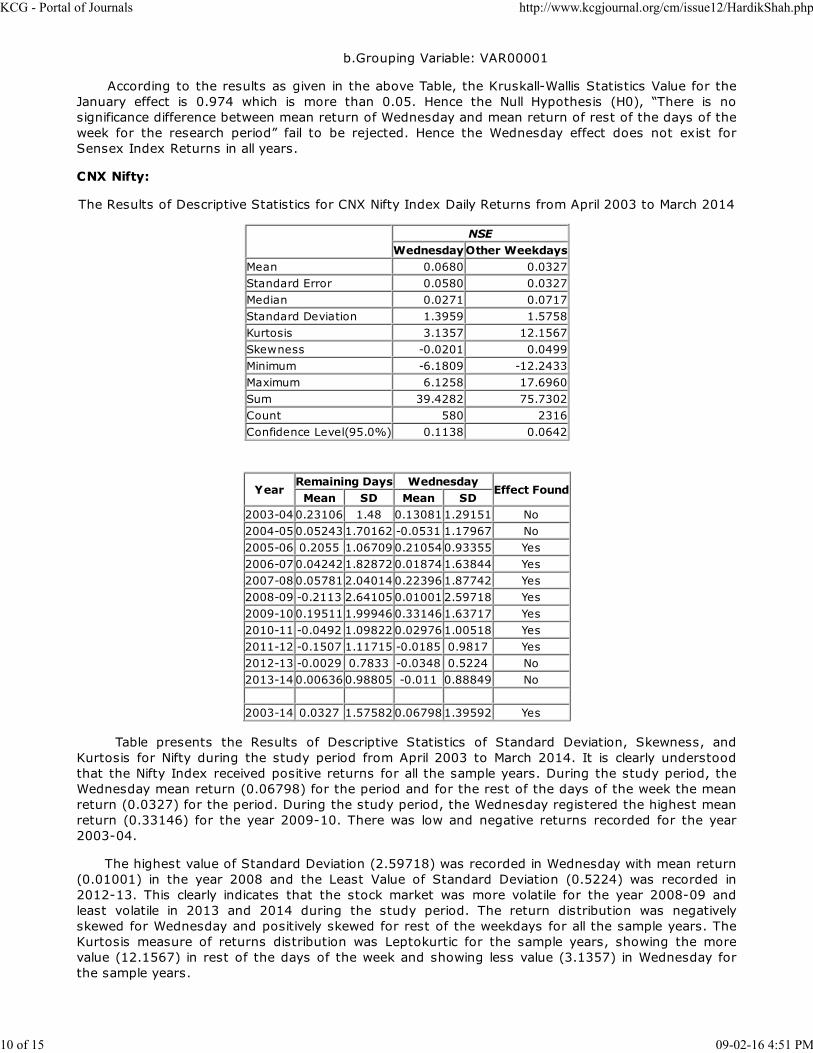
According to the results as given in the above Table, the Kruskall-Wallis Statistics Value for theJanuary effect is 0.974 which is more than 0.05. Hence the Null Hypothesis (H0), “There is nosignificance difference between mean return of Wednesday and mean return of rest of the days of theweek for the research period” fail to be rejected. Hence the Wednesday effect does not exist forSensex Index Returns in all years.
CNX Nifty:
The Results of Descriptive Statistics for CNX Nifty Index Daily Returns from April 2003 to March 2014
NSEWednesday Other Weekdays
Mean 0.0680 0.0327Standard Error 0.0580 0.0327Median 0.0271 0.0717Standard Deviation 1.3959 1.5758Kurtosis 3.1357 12.1567Skewness -0.0201 0.0499Minimum -6.1809 -12.2433Maximum 6.1258 17.6960Sum 39.4282 75.7302Count 580 2316Confidence Level(95.0%) 0.1138 0.0642
YearRemaining Days Wednesday
Effect FoundMean SD Mean SD
2003-04 0.23106 1.48 0.13081 1.29151 No2004-05 0.05243 1.70162 -0.0531 1.17967 No2005-06 0.2055 1.06709 0.21054 0.93355 Yes2006-07 0.04242 1.82872 0.01874 1.63844 Yes2007-08 0.05781 2.04014 0.22396 1.87742 Yes2008-09 -0.2113 2.64105 0.01001 2.59718 Yes2009-10 0.19511 1.99946 0.33146 1.63717 Yes2010-11 -0.0492 1.09822 0.02976 1.00518 Yes2011-12 -0.1507 1.11715 -0.0185 0.9817 Yes2012-13 -0.0029 0.7833 -0.0348 0.5224 No2013-14 0.00636 0.98805 -0.011 0.88849 No
2003-14 0.0327 1.57582 0.06798 1.39592 Yes
Table presents the Results of Descriptive Statistics of Standard Deviation, Skewness, andKurtosis for Nifty during the study period from April 2003 to March 2014. It is clearly understoodthat the Nifty Index received positive returns for all the sample years. During the study period, theWednesday mean return (0.06798) for the period and for the rest of the days of the week the meanreturn (0.0327) for the period. During the study period, the Wednesday registered the highest meanreturn (0.33146) for the year 2009-10. There was low and negative returns recorded for the year2003-04.
The highest value of Standard Deviation (2.59718) was recorded in Wednesday with mean return(0.01001) in the year 2008 and the Least Value of Standard Deviation (0.5224) was recorded in2012-13. This clearly indicates that the stock market was more volatile for the year 2008-09 andleast volatile in 2013 and 2014 during the study period. The return distribution was negativelyskewed for Wednesday and positively skewed for rest of the weekdays for all the sample years. TheKurtosis measure of returns distribution was Leptokurtic for the sample years, showing the morevalue (12.1567) in rest of the days of the week and showing less value (3.1357) in Wednesday forthe sample years.
KCG - Portal of Journals http://www.kcgjournal.org/cm/issue12/HardikShah.php
10 of 15 09-02-16 4:51 PM

Kruskall-Wallis Test
Test Statisticsa,b
NSE Wed. Eff.Chi-SquareDfAsymp. Sig.
.0051
.941
a.Kruskal Wallis Test b.Grouping Variable: VAR00002
According to the results as given in the above Table, the Kruskall-Wallis Statistics Value for theJanuary effect is 0.941 which is more than 0.05. Hence the Null Hypothesis (H0), “There is nosignificance difference between mean return of Wednesday and mean return of rest of the days of theweek for the research period” fail to be rejected. Hence the Wednesday effect does not exist for CNXNifty Index Returns in all years.
Weekend Effect
H0: There is no significance difference between mean return of Friday and mean return of nextMonday for the research period.
HA: There is significance difference between mean return of Friday and mean return of nextMonday for the research period.
Sensex
The Results of Descriptive Statistics for Sensex Index Daily Returns from April 2003 to March 2014
BSEFriday Monday
Mean 0.0107 -0.0994Standard Error 0.0617 0.0605Median -0.0233 -0.0182Standard Deviation 1.4780 1.4599Kurtosis 3.9498 6.0128Skewness -0.4741 -1.0300Minimum -8.3855 -10.2717Maximum 5.8213 5.9707Sum 6.1437 -57.8430Count 574 582Confidence Level(95.0%)0.1212 0.1189
YearMonday Friday
Effect FoundMean SD Mean SD
2003-04 0.03722 1.54131 0.4107 1.29331 Yes2004-05 -0.1749 1.77036 -0.1173 1.5496 Yes2005-06 0.22931 1.02774 0.07025 1.02506 No2006-07 -0.4433 1.79599 -0.0508 1.76982 Yes2007-08 -0.3104 1.88757 0.29159 1.58842 Yes2008-09 -0.348 2.02327 -0.1691 2.90943 Yes2009-10 -0.0053 1.90976 0.26487 1.31866 Yes2010-11 0.3217 1.02168 -0.2474 1.12804 No2011-12 -0.3975 1.15397 -0.2228 1.04542 Yes2012-13 -0.1411 0.7074 -0.0196 0.77427 Yes2013-14 -0.0355 0.82836 -0.0154 0.98988 Yes
2003-14 -0.0994 1.45987 0.0107 1.47797 Yes
KCG - Portal of Journals http://www.kcgjournal.org/cm/issue12/HardikShah.php
11 of 15 09-02-16 4:51 PM

Table presents the Results of Descriptive Statistics of Standard Deviation, Skewness, andKurtosis for Sensex during the study period from April 2003 to March 2014. It is clearly understoodthat the Sensex Index received positive returns for all the sample years. During the study period, theFriday mean return (0.0107) for the period and for the Monday the mean return (-0.0994) for theperiod. During the study period, the Friday registered the highest mean return (0.26487) for the year2009-10 and on Monday mean return (-0.0053) for same year. There was low and negative returnsrecorded for the year 2008-09 because of the impact of the Financial Crisis.
The highest value of Standard Deviation (2.90943) was recorded in Friday with mean return(-0.1691) in the year 2008-09 and the Least Value of Standard Deviation (0.77427) was recorded in2012-13. This clearly indicates that the stock market was more volatile for the year 2008-09 andleast volatile in 2012-13 during the study period. The return distribution was negatively skewed forFriday and Monday for all the sample years. The Kurtosis measure of returns distribution wasLeptokurtic for the sample years, showing the more value (6.0128) in Friday and showing less value(3.9498) in Monday for the sample years.
Kruskall-Wallis Test
Test Statisticsa,b
Weekend effectChi-SquareDfAsymp. Sig.
.4411
.507
a.Kruskal Wallis Test b.Grouping Variable: VAR00001
According to the results as given in the above Table, the Kruskall-Wallis Statistics Value for theJanuary effect is 0.507 which is more than 0.05. Hence the Null Hypothesis (H0), “There is nosignificance difference between mean return of Friday and mean return of next Monday for theresearch period” fails to be rejected. Hence the Weekend effect does not exist for Sensex IndexReturns in all years.
CNX Nifty
The Results of Descriptive Statistics for Nifty Index Daily Returns from April 2003 to March 2014
NSEFriday Monday
Mean 0.0722 0.0300Standard Error 0.0672 0.0761Median 0.0833 0.0868Standard Deviation 1.6095 1.8336Kurtosis 8.0186 19.2378Skewness -0.7469 0.6424Minimum -11.9966 -12.2433Maximum 7.0207 17.6960Sum 41.3965 17.4152Count 573 581Confidence Level (95.0%)0.1321 0.1494
YearMonday Friday
Effect FoundMean SD Mean SD
2003-04 0.30311 1.60281 0.63811 1.35743 Yes2004-05 -0.1257 2.11363 -0.1072 1.75062 Yes2005-06 0.33725 1.06689 0.14844 1.09875 No2006-07 -0.3695 1.84504 0.17241 1.82423 Yes2007-08 -0.1531 2.51794 0.30224 1.90513 Yes2008-09 -0.0192 2.77496 -0.267 3.24275 No
KCG - Portal of Journals http://www.kcgjournal.org/cm/issue12/HardikShah.php
12 of 15 09-02-16 4:51 PM

2009-10 0.39046 3.19752 0.28622 1.32017 No2010-11 0.32758 1.07289 -0.2435 1.13061 No2011-12 -0.3231 1.15832 -0.1991 1.05227 Yes2012-13 -0.0902 0.74669 0.01896 0.79598 Yes2013-14 -0.0115 0.86021 0.04237 0.98342 Yes
2003-14 0.02997 1.83362 0.07225 1.60955 Yes
Table presents the Results of Descriptive Statistics of Standard Deviation, Skewness, andKurtosis for Nifty during the study period from April 2003 to March 2014. It is clearly understoodthat the Nifty Index received positive returns for all the sample years. During the study period, theFriday mean return (0.0722) for the period and for the Monday the mean return (0.0300) for theperiod. During the study period, the Friday registered the highest mean return (0.63811) for the year2003-04 and on Monday mean return (0.30311) for same year. There was low and negative returnsrecorded for the year 2008-09 because of the impact of the Financial Crisis.
The highest value of Standard Deviation (3.24275) of Standard Deviation (-0.267) was recordedin 2008-09. This clearly indicates that the stock market was more volatile for the year 2008-09 andleast volatile in 2012-13 during the study period. The return distribution was negatively skewed forFriday and positively skewed for Monday for all the sample years. The Kurtosis measure of returnsdistribution was Leptokurtic for the sample years, showing the more value (19.2378) in Monday andshowing less value (8.0186) in Friday for the sample years.
Kruskall-Wallis Test
Test Statisticsa,b
NSE WeekendChi-SquareDfAsymp. Sig.
.0061
.936
a.Kruskal Wallis Test b.Grouping Variable: VAR00002
Key Findings
The major findings of the study are as follows:
During the research period January effect found in Indian Market only.Friday the 13th effect does not found in any of the indices which are considered for the researchperiod.The Monday-Friday set for all the indices has the highest positive deviation thereby indicating thepresence of opportunity to make consistent abnormal returns through a trading strategy ofbuying on Mondays and selling on Fridays.In Indian stock market, only January effect was found during research period. It shows thatIndian market moves from semi strong to strong market.
Suggestions and Recommendations
It is necessary for the Indian Investors to carefully study the publically available information,because it plays a major role in analysing the Market Efficiency and changes in the market.The present study would be useful to the native and foreign investors, traders and arbitrageurswho formulate profitable trading strategies in the stock market.From the analyses of the weekend effect, it is suggested that investors may buy the shares onMonday and sell them on Friday because they may get better returns than on other days.From the study it is clear that there was no superstition in the Indian securities market.The analysis of January Effect found that there were Highest Mean Returns in the month ofDecember sample indices. Hence logically speaking, if the investors want to buy new shares theshares may be bought in the month of January which is the best period.From this anomaly the investors got the idea that it is more beneficial to invest on Monday as theprice of the stock is less compared to previous Friday and if investors who want to exit from the
KCG - Portal of Journals http://www.kcgjournal.org/cm/issue12/HardikShah.php
13 of 15 09-02-16 4:51 PM
market Friday is good as the price of the stock is high so they earn money from the market.The study found that the Mean Returns in early days of a month were higher than other days ofthe month. Therefore it is suggested that the Salaried People, who get their salary at the end ofthe month, may invest the same in the early days of next month. It may give good returns tothe Salaried Group of Investors.The Market Regulators should closely observe the investors’ response regarding informationtransmission and its reliability or the trustworthiness of the information released by the IndianCompanies.The study found that there was non-linearity between the risk and return (Low/Negative Returnswith High Risk) for all the sample indices. Hence the Regulators may take necessary steps toreduce it.
Conclusions
The present study investigated the existence of a daily pattern of Seasonality (CalendarAnomalies) Effect on Index Returns for Sensex, Nifty. The study found that after theIntroduction of Compulsory Rolling Settlement, there were Positive Mean Returns recorded for alldays of the week and Highest Mean Return was recorded on Friday, and Lowest Mean Returnrecorded on Monday for all the sample indices. The returns in the Stock Market are notindependent across different trading days of the Week, Month etc. The study also providesevidence that the market was not able to price the risk appropriately as Higher Returns werepossible by taking Less Risk and this indicates Market Inefficiency. The findings of this studywould possibly help in understanding and explaining such seasonality for the Indian stockmarkets. During the research period January effect found in Indian Market only. Friday the 13theffect does not find in any of the indices which are considered for the research period. In Indianstock market, the only January effect was found during the research period. It shows that Indianmarket moves from semi strong to strong market. The Monday-Friday set for all the indices hasthe highest positive deviation thereby indicating the presence of opportunity to make consistentabnormal returns through a trading strategy of buying on Mondays and selling on Fridays. Thesefindings have important implications for Financial Managers, Financial Analysts and Investors. Theunderstanding of Seasonality should help them to develop appropriate investment strategies.
Limitations of the Study
The following are the limitations of the present study covering two major stock exchanges, namely,NSE, BSE.
The present study was restricted to Indian Capital Market.This study was based mainly on secondary data.This study used certain limited statistical tools which have certain inherent limitations.The study did not analyze the relationship between Week of the Month Effect and Monthly Effect.The study did not analyze the Quarterly Effect, Week of the Month Effect, Turn-of the Year Effectetc, due to time constraints.
REFERENCES :
Fama, E.F. and MacBeth, J.D. (1973) “Risk, Return and Equilibrium: Empirical Tests”, Journal ofPolitical Economy, Vol. 81, 607-36.
1.
Keim, Donald B. (1983) Size-Related Anomalies and Stock Return Seasonality: Further EmpiricalEvidence, Journal of Financial Economics., Vol. 12 Issue 1, p13-32.
2.
Lee K. Y. and Chang C. S. (1988), “Anomalies in the Stock Returns over Trading and Non tradingPeriods: Further Evidence in the Korean Stock Market”,Quarterly Journal of Business andEconomics, Vol. 27, No. 2, pp. 139-161.
3.
Ajayi R A, Mehdian S, and Perry M J (2004), “The Day-of-the-Week Effect in Stock Returns:Further Evidence from Eastern European Emerging Markets”, Emerging Markets Finance & Trade,Vol. 40, No. 4, pp. 53-62.
4.
Branch B and Chang K (1990), “Low Price Stocks and the January Effect”, Quarterly Journal ofBusiness and Economics, Vol. 29, No. 3, pp. 90-118.
5.
Bing Zhang, Xindan li (2006). Do Calendar Effects Still Exist in the Chinese Stock Markets? J. ofChinese Economic and Business Studies. 4(2): 151-163.
6.
Gultekin, M.N., and N.B. Gultekin (1983) “Stock Market Seasonality: International Evidence,”Journal of Financial Economics, Vol.12, pp. 469-481.
7.
KCG - Portal of Journals http://www.kcgjournal.org/cm/issue12/HardikShah.php
14 of 15 09-02-16 4:51 PM

Syed A. Basher, Perry Sadorsky (2006). Day-of-the Week Effects in Emerging Stock Markets.Applied Economics letters. 13: 621-628.
8.
Brooks C, Persand G (2001). Seasonality in Southeast Asian Stock Markets: Some new Evidenceon Day-of-the-Week Effects. Applied Economics Letters. 8: 155-158.
9.
PM Silva (2010), “Calendar “anomalies” in the Portuguese stock market” Investment AnalystsJournal – No. 71,p.p.37-50.
10.
Sarma, S.N. (2004) “Stock Market Seasonality in an Emerging Market”, Vikalpa: The Journal forDecision Makers., Vol. 29 Issue 3, p35-41.
11.
Bodla, B. S.; Jindal, Kiran. (2006) “Seasonal Anomalies in Stock Returns: Evidence from Indiaandthe US Decision” (0304-0941), Vol. 33 Issue 1, p163-178.
12.
Singhal A, and Bahure V (2009), “Weekend Effect of Stock Returns in the Indian Market”, GreatLakes Herald, Vol 3, No 1, pp. 12–22.
13.
Nageswari P, Babu M (2011), “Analysis of Week End Effect in Indian Stock Market.” SMART J. ofBusiness Management Studies. 7(1): 78-87.
14.
Amanulla S, Thiripalraiu M (2001), “Week End Effect: New Evidence from the Indian Stock Market”,Vikalpa. 26(2): 33-50.
15.
Ashish Garg, B.S. Bodla and Sangeeta Chhabra (2010), “Seasonal Anomalies in Stock Returns: AStudy of Developed and Emerging Markets” IIMS Journal of Management Science Vol.1, No.2, pp.165-179.
16.
P. Nageswari, Dr.M.Selvam(2011), An Empirical Study on Seasonal Analysis in the Indian StockMarket, International Journal of Management & Business Studies, Vol. 1, Issue 4,p.p.90-95.
17.
***************************************************
Prof Hardik ShahAssistant ProfessorCentre for Management StudiesDharmsinh Desai University
Copyright © 2012 - 2016 KCG. All Rights Reserved. | Powered By : Knowledge Consortium of Gujarat
KCG - Portal of Journals http://www.kcgjournal.org/cm/issue12/HardikShah.php
15 of 15 09-02-16 4:51 PM