1 reliability
TRANSCRIPT

8/3/2019 1 Reliability
http://slidepdf.com/reader/full/1-reliability 1/61
1
OR
1. åôéâúú?2. åôâÿ?

8/3/2019 1 Reliability
http://slidepdf.com/reader/full/1-reliability 2/61
2
8/3/2019 1 Reliability
http://slidepdf.com/reader/full/1-reliability 3/61
3
åë ú : åë ÷õ : åèé

8/3/2019 1 Reliability
http://slidepdf.com/reader/full/1-reliability 4/61
4
Reliability Outline
Reliability Basic Concepts
Reliability Models
Reliability System Configurations Analysis of System Reliability
Application of Reliability in Aviation
Business

8/3/2019 1 Reliability
http://slidepdf.com/reader/full/1-reliability 5/61
5
Reliability in Logistics
Reliability Basic Concepts
± What is Reliability
± Reliability Definitions ± What Affects Reliability
± How is Reliability Used
± Goal of Reliability
± Bathtub Curve
± Reliability Function
8/3/2019 1 Reliability
http://slidepdf.com/reader/full/1-reliability 6/61
6
What is Reliability
± To the user of a product, reliability is problem
free operation
± Reliability is a function of stress
± To efficiently achieve reliability, rely on
analytical understanding of reliability and less
on understanding reliability through testing
Reliability in Logistics

8/3/2019 1 Reliability
http://slidepdf.com/reader/full/1-reliability 7/61
7
Reliability in Logistics
Reliability Definitions
± Reliability is a characteristic of an item,
expressed by the probability that the item will
perform its required function under given
conditions for a stated time interval.
(Prof. Dr. Alessandro Birolini, 1999)
± The probability that an item will perform arequired function without failure under stated
conditions for a stated period of time.
(Patrick D. T. O¶Connor, 1992)
8/3/2019 1 Reliability
http://slidepdf.com/reader/full/1-reliability 8/61
8
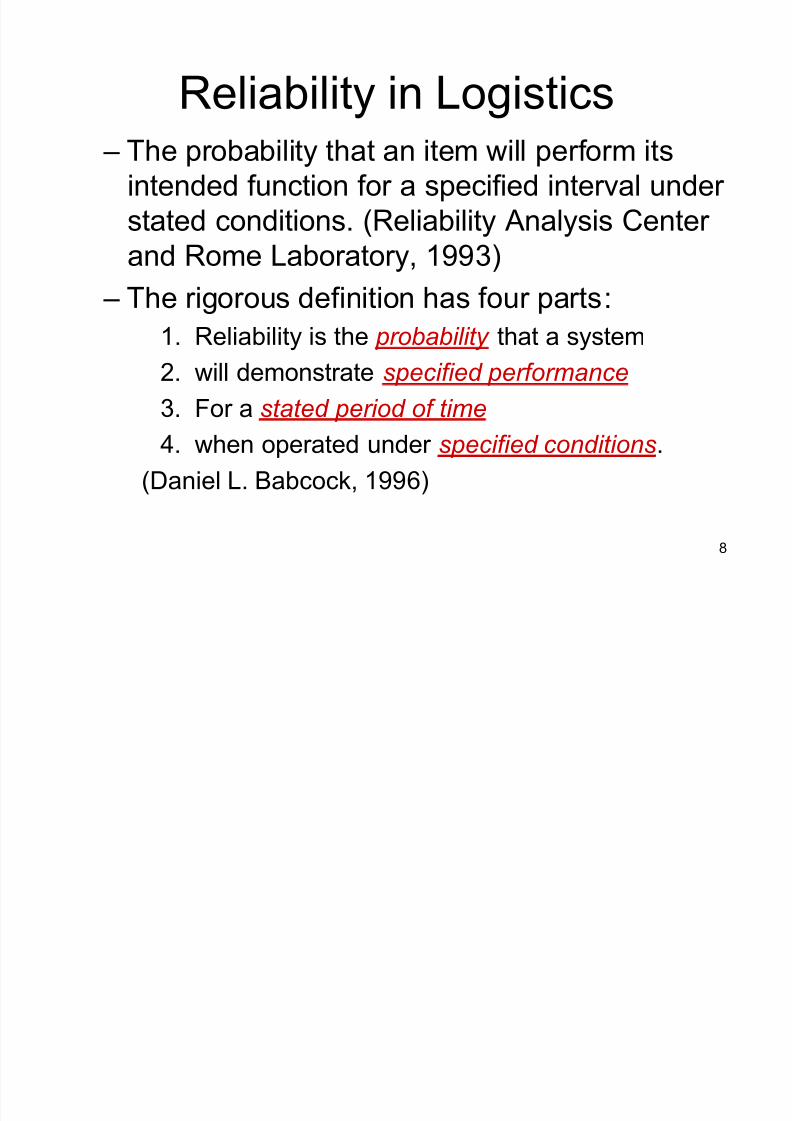
Reliability in Logistics ± The probability that an item will perform its
intended function for a specified interval under
stated conditions. (Reliability Analysis Center
and Rome Laboratory, 1993)
± The rigorous definition has four parts:
1. Reliability is the probability that a system
2. will demonstrate specified performance
3. For a stated period of time4. when operated under specified conditions.
(Daniel L. Babcock, 1996)
8/3/2019 1 Reliability
http://slidepdf.com/reader/full/1-reliability 9/61
9
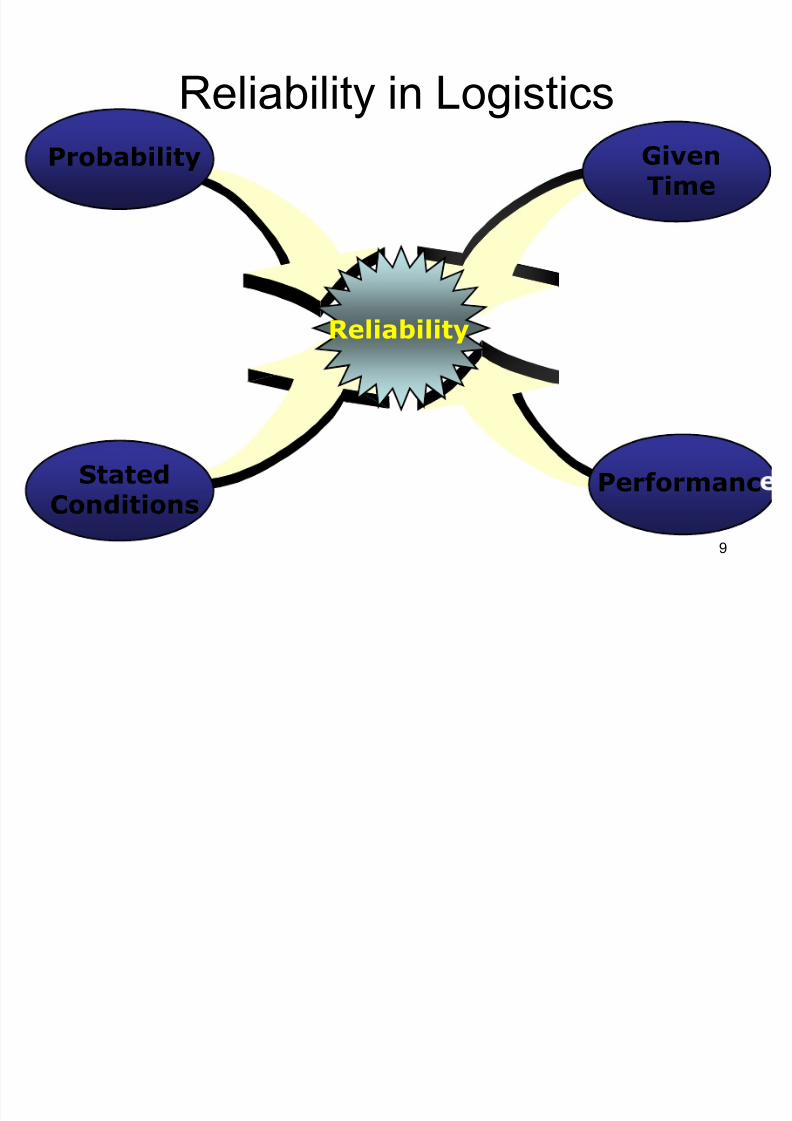
Reliability in Logistics
Probability GivenTime
StatedConditions
Performanc
Reliability
8/3/2019 1 Reliability
http://slidepdf.com/reader/full/1-reliability 10/61
10
Reliability in Logistics

8/3/2019 1 Reliability
http://slidepdf.com/reader/full/1-reliability 11/61
11
What Affects Reliability
± Redundancy (å
úüè)
± Design Simplicity
± Time
± Learning Curve
± Material Quality
± Experience
± Requirements
Reliability in Logistics

8/3/2019 1 Reliability
http://slidepdf.com/reader/full/1-reliability 12/61
12
How is Reliability Used
± It is used to define the longevity of a product
and the associated cost it incurs
± It helps identify risk of the product for both the
consumer and producer
± It incorporates statistics to better identify how
much ³give´ or ³take´ can go into a product or service - usually, the higher the reliability, the
higher the initial cost.
Reliability in Logistics
8/3/2019 1 Reliability
http://slidepdf.com/reader/full/1-reliability 13/61
13
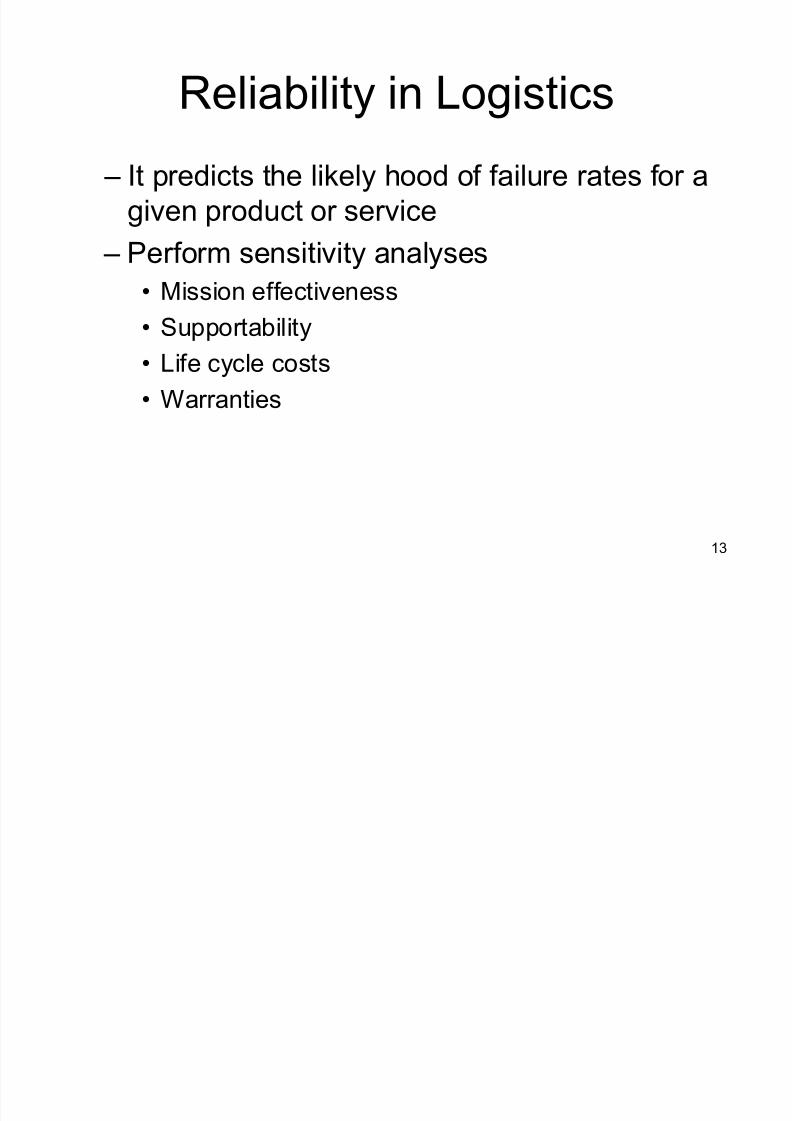
± It predicts the likely hood of failure rates for a
given product or service
± Perform sensitivity analyses
Mission effectiveness
Supportability
Life cycle costs
Warranties
Reliability in Logistics
8/3/2019 1 Reliability
http://slidepdf.com/reader/full/1-reliability 14/61
14
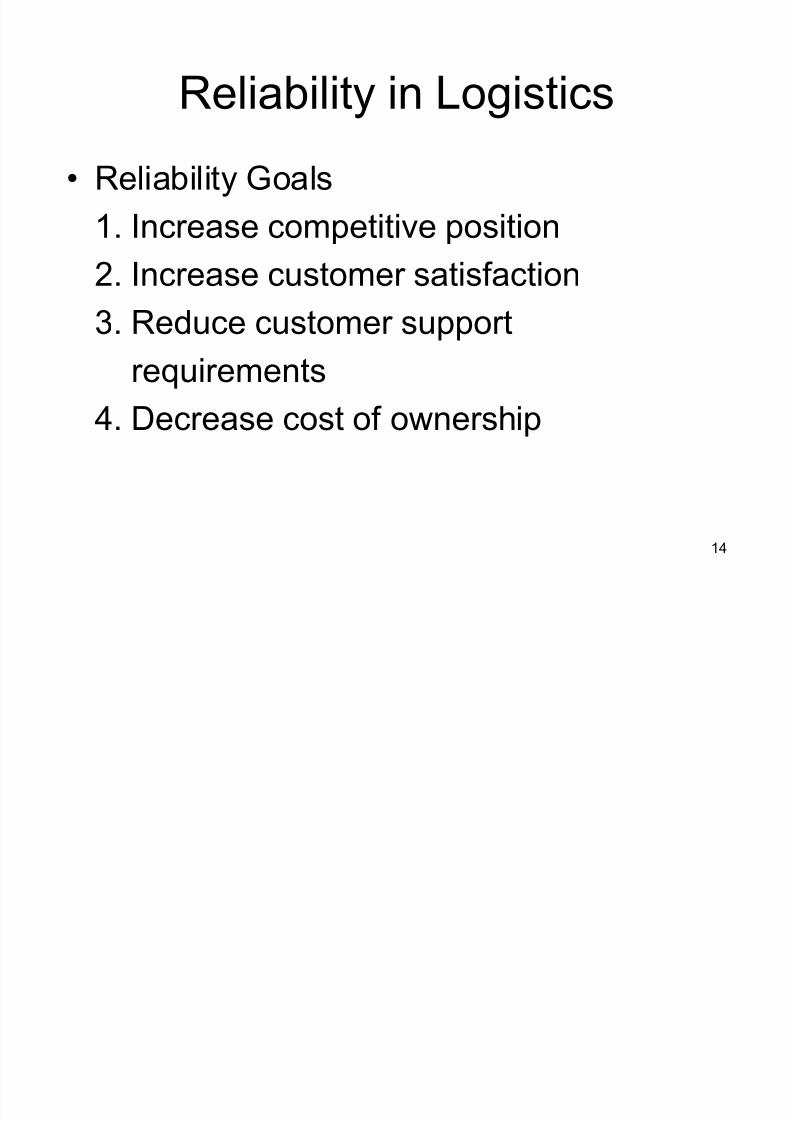
Reliability Goals
1. Increase competitive position
2. Increase customer satisfaction3. Reduce customer support
requirements
4. Decrease cost of ownership
Reliability in Logistics

8/3/2019 1 Reliability
http://slidepdf.com/reader/full/1-reliability 15/61
15
Bathtub Curve
Reliability in Logistics
Infant
Mortality
Wear-outUseful Life
H a z a r d R a t e
P
F a i l u r e R a t
e s
System Life Cycle
Decreasing
Failure
Rate
Constant
Failure
Rate
Region
Increasing
Failure
Rate
Region
Exponential
Law applies
debuggingwearout
8/3/2019 1 Reliability
http://slidepdf.com/reader/full/1-reliability 16/61
16
Reliability in Logistics
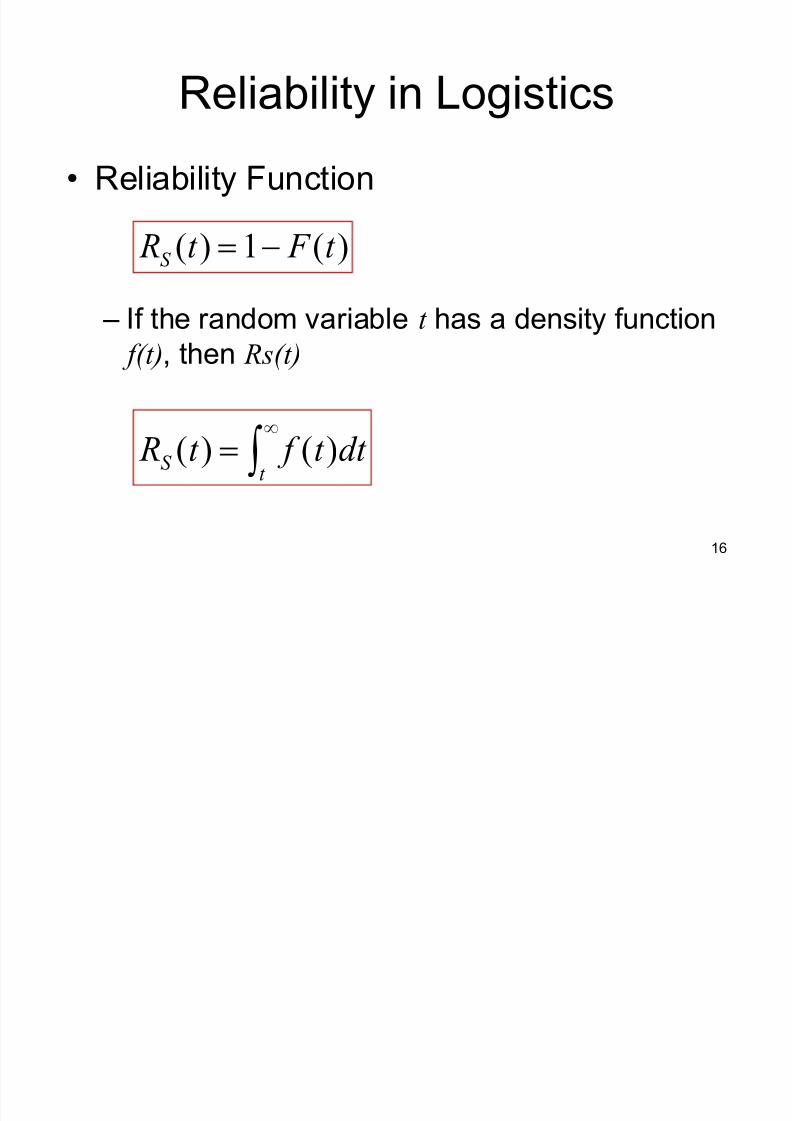
Reliability Function
± If the random variable t has a density function
f(t), then Rs(t)
)(1)( t F t RS !
´g
!t
S dt t f t R )()(
8/3/2019 1 Reliability
http://slidepdf.com/reader/full/1-reliability 17/61
17
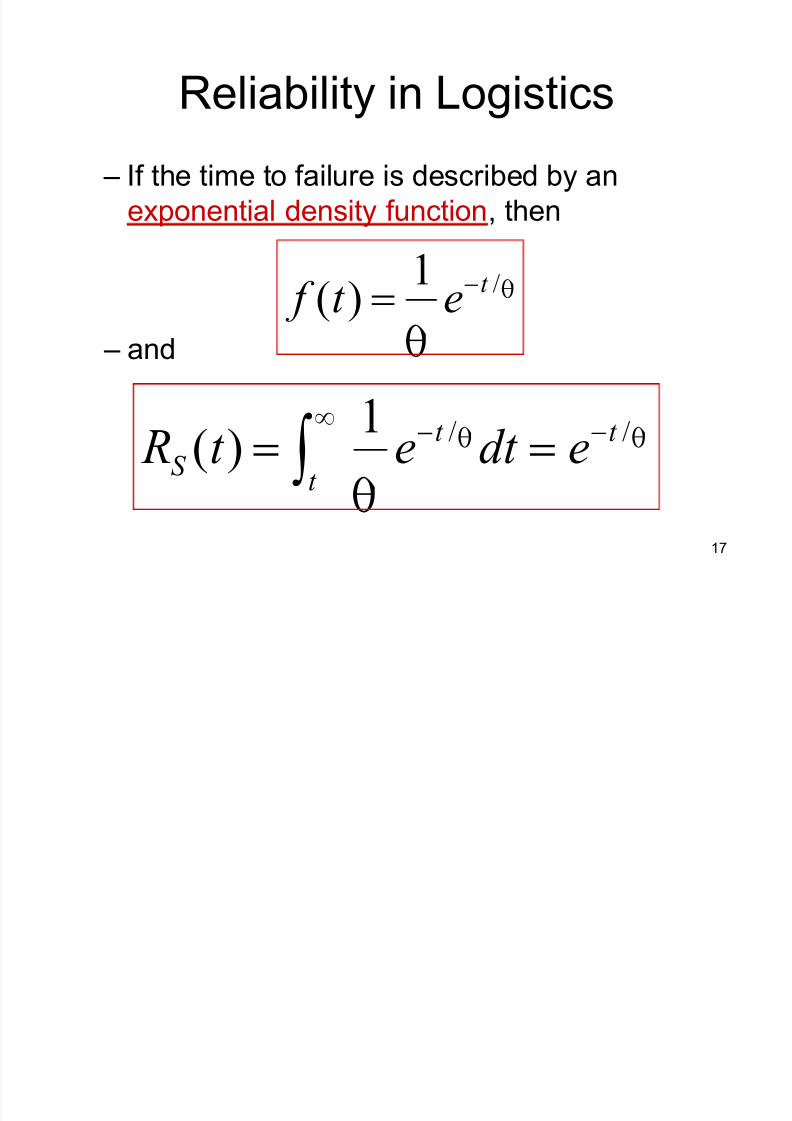
Reliability in Logistics
± If the time to failure is described by an
exponential density function, then
± and
U
U/1)( t et f !
´g !!t
t t
S edt et R U U
U//1)(

8/3/2019 1 Reliability
http://slidepdf.com/reader/full/1-reliability 18/61
18
Reliability in Logistics
± Mean life ( U) is the arithmetic average of the
lifetimes of all items considered5
± The mean life ( U) of the exponential function is
equivalent to the mean time between failure,hence
t S et R P!)(

8/3/2019 1 Reliability
http://slidepdf.com/reader/full/1-reliability 19/61
19
Reliability in Logistics
± Where P is the instantaneous failure rate
± Or
UP
1!
hoursoperatingtotalfailuresof number !P

8/3/2019 1 Reliability
http://slidepdf.com/reader/full/1-reliability 20/61
20
Weibull Distribution:
± Can be considered as a generalizationof the exponential
±Has three parameters
K = the time at which F(t) = 0 and is adatum parameter; i.e., failures start
occurring at time t W = the characteristic life and is a scale
parameter
F = shape parameter
Reliability in Logistics
8/3/2019 1 Reliability
http://slidepdf.com/reader/full/1-reliability 21/61
21
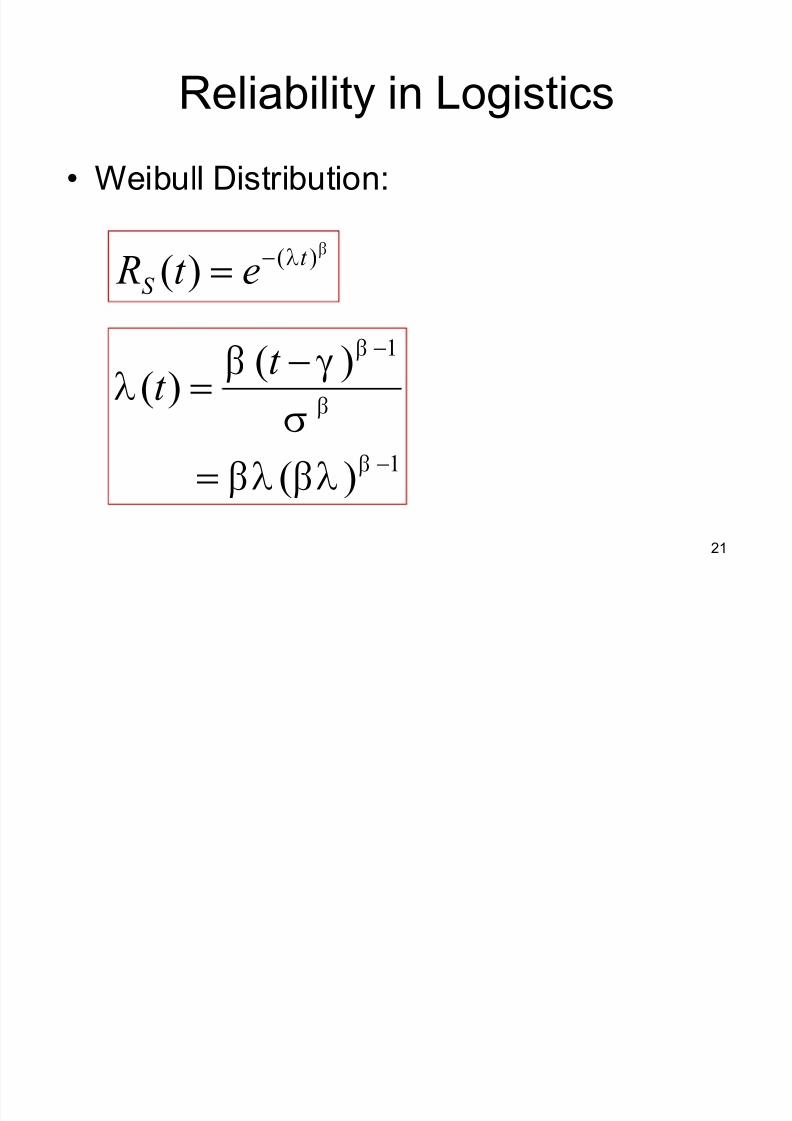
Weibull Distribution:
Reliability in Logistics
FP )(
)(t
S et R
!
1
1
)(
)()(
!
!
F
F
F
FP FPW
K FP
t t
8/3/2019 1 Reliability
http://slidepdf.com/reader/full/1-reliability 22/61
22
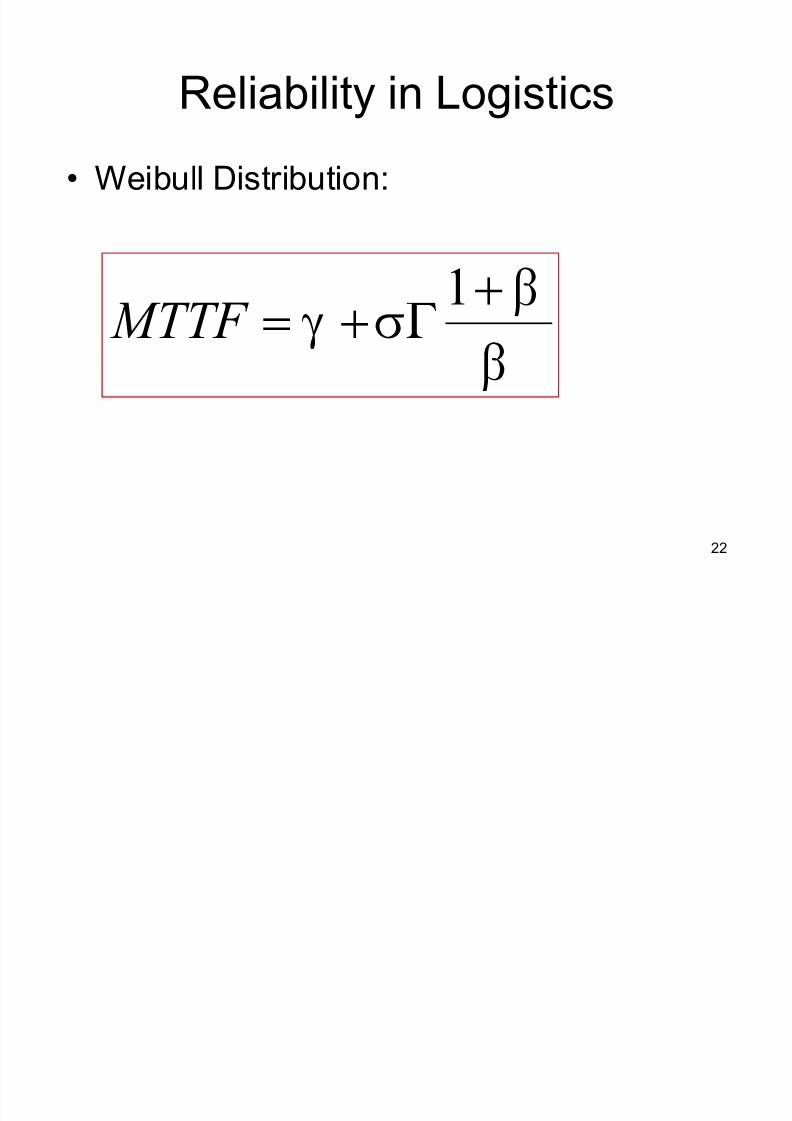
Weibull Distribution:
Reliability in Logistics
F FWK +! 1
MTT F

8/3/2019 1 Reliability
http://slidepdf.com/reader/full/1-reliability 23/61
23
Weibull Distribution:
Reliability in Logistics
H
a z a r d R a t e P
Infant
Mortality
Wear-outUseful Life
F<1 F>1
F=1
F=4
F=1/2
W0
F=1
t K

8/3/2019 1 Reliability
http://slidepdf.com/reader/full/1-reliability 24/61
24
Reliability in Logistics
Example
± Suppose ten
components were tested
under specifiedconditions
± Assume the following
data from the test
± Suppose thecomponents are non
repairable
± What is P?
Component Op Hours Failure
One 250 No
Two 85 Yes
Three 250 NoFour 95 Yes
Five 115 Yes
Six 250 No
Seven 75 Yes
Eight 250 No
Nine 105 YesTen 250 No
1725
8/3/2019 1 Reliability
http://slidepdf.com/reader/full/1-reliability 25/61
25
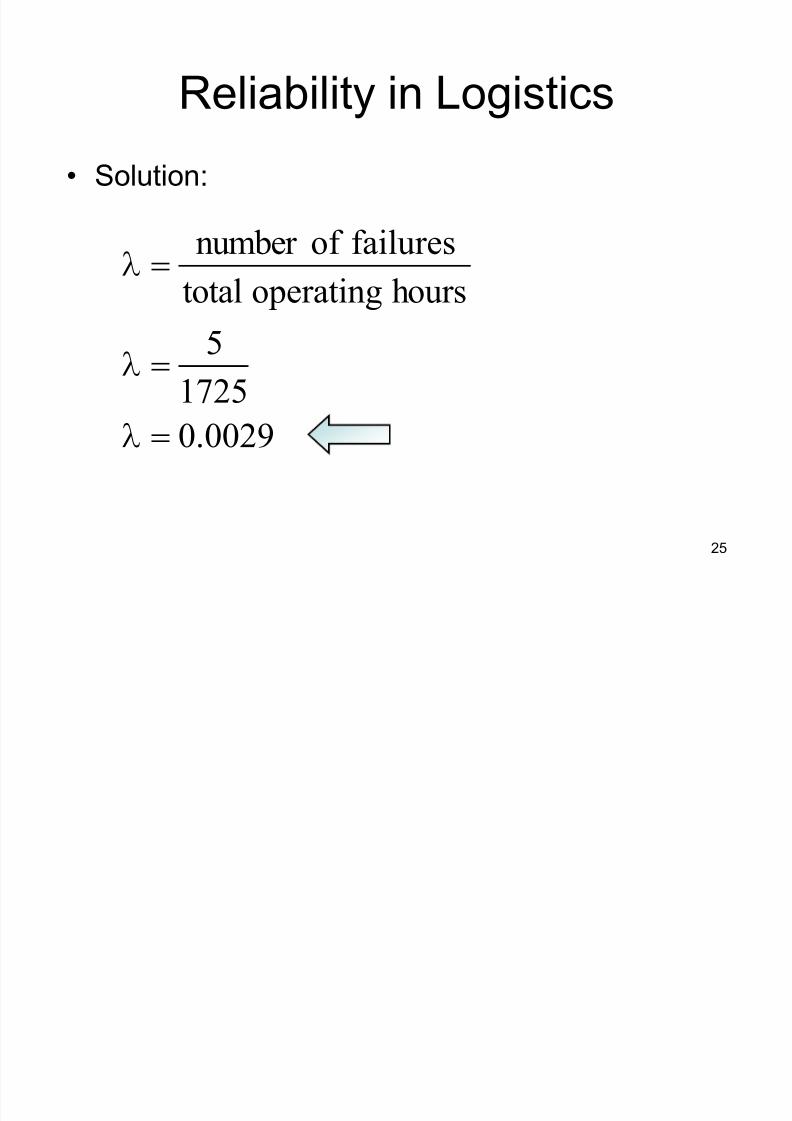
Reliability in Logistics
Solution:
0029.0
1725
5
hoursoperatingtotal
failuresof number
!
!
!
P
P
P
8/3/2019 1 Reliability
http://slidepdf.com/reader/full/1-reliability 26/61
26
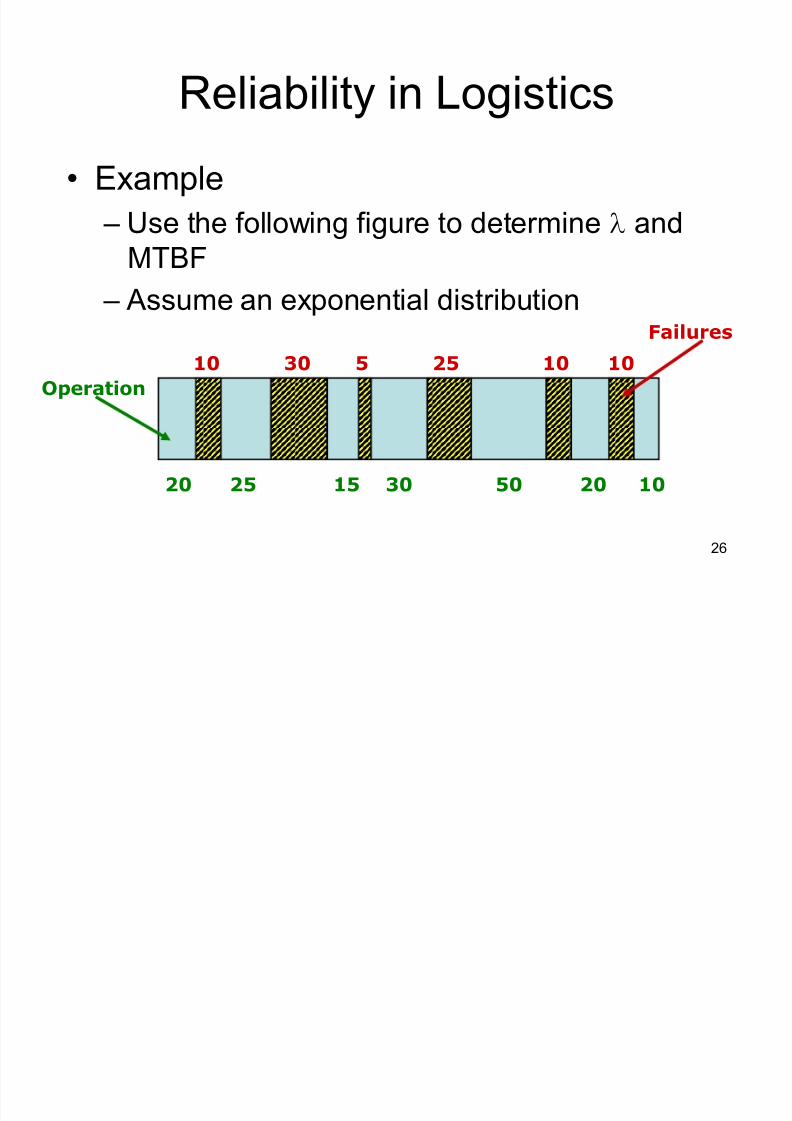
Reliability in Logistics
Example
± Use the following figure to determine P and
MTBF
± Assume an exponential distribution
20 25 15 30 50 20 10
Operation
10 30 5 25 10 10
Failures
8/3/2019 1 Reliability
http://slidepdf.com/reader/full/1-reliability 27/61
27
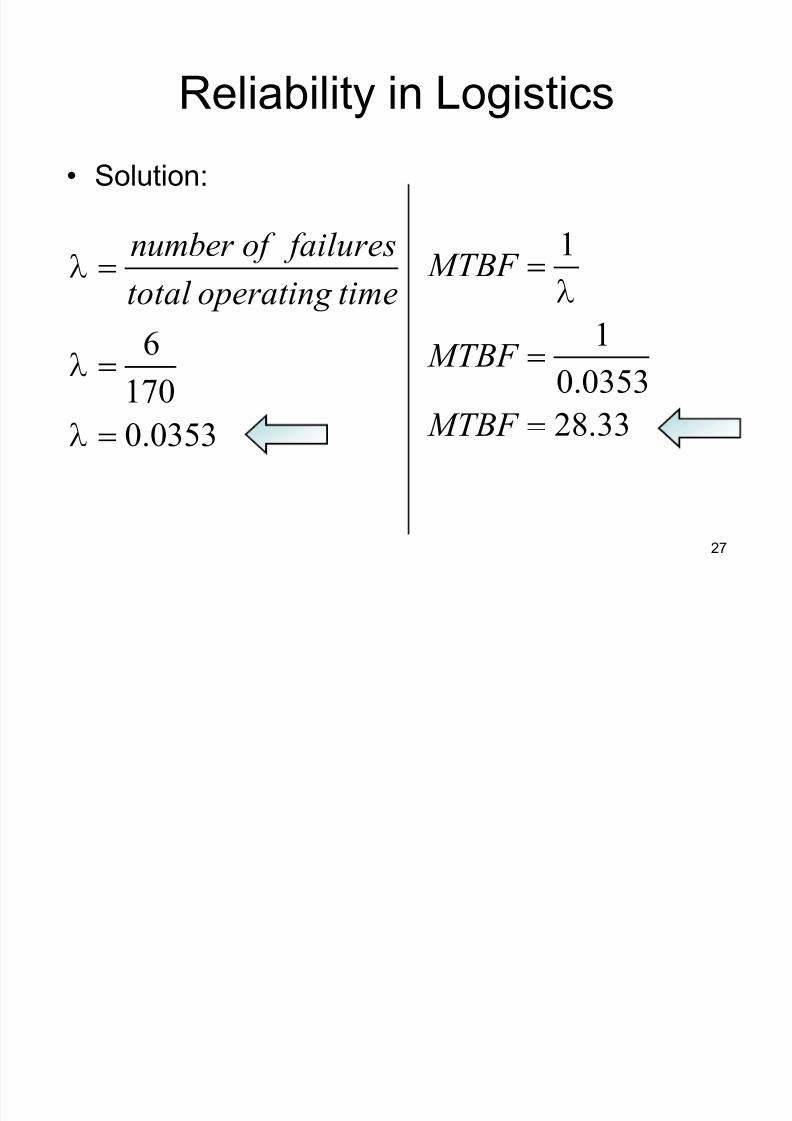
Reliability in Logistics
Solution:
0353.0
170
6
!
!
!
P
P
Ptimeoperating total
failuresof number
33.28
0353.0
1
1
!
!
!
MTB F
MTB F
MTB F
P
8/3/2019 1 Reliability
http://slidepdf.com/reader/full/1-reliability 28/61
28
Reliability in Logistics
System Reliability Models
± The reliability definitions, concepts and
models presented apply at any level of asystem, from a single discretecomponent up
to and including the entire system
8/3/2019 1 Reliability
http://slidepdf.com/reader/full/1-reliability 29/61
29
Reliability in Logistics
± Systems reliability deals with the reliability of
the end-item system and is based on the
system configuration and component failure
rates as well intended service usage
± There are two basic types of reliability
configurations
Series
Parallel or Redundant

8/3/2019 1 Reliability
http://slidepdf.com/reader/full/1-reliability 30/61
30
Reliability in Logistics
Series Configuration
± Simplest and most common structure in
reliability analysis
± Functional operation of the system depends
on the successful operation of all system
components Note: The electrical or
mechanical configuration may differ from thereliability configuration
8/3/2019 1 Reliability
http://slidepdf.com/reader/full/1-reliability 31/61
31
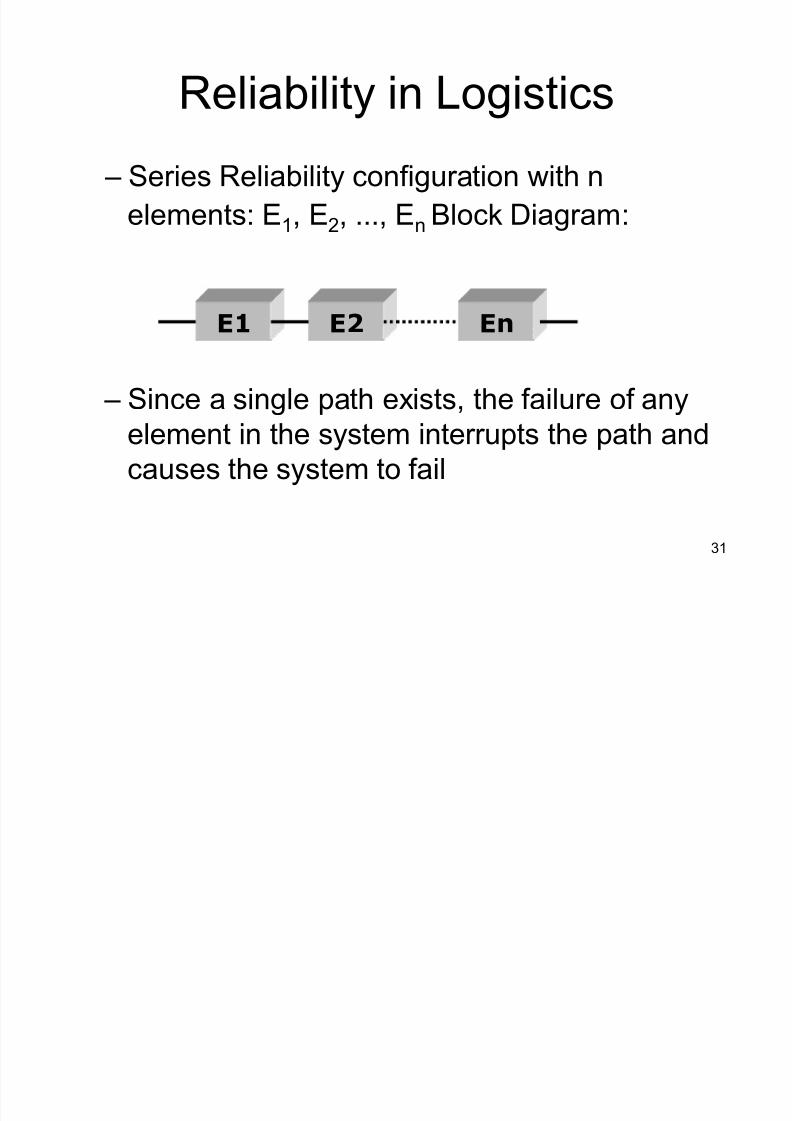
± Series Reliability configuration with n
elements: E1, E2, ..., En Block Diagram:
± Since a single path exists, the failure of any
element in the system interrupts the path and
causes the system to fail
E1 E2 En
Reliability in Logistics

8/3/2019 1 Reliability
http://slidepdf.com/reader/full/1-reliability 32/61
32
Reliability in Logistics
± Ex ponential distributions of element time to
failure Ti ~ I( Ui) for i = 1, 2, ...n
System reliability
Where is the system failure rate
!
!!n
1i
i
t
S)t(R e)t(R S
P
§!
P!P
n
1i
iS )t(

8/3/2019 1 Reliability
http://slidepdf.com/reader/full/1-reliability 33/61
33
Reliability in Logistics
S S
S
MTT F 5!!P
1
System mean time to failure
8/3/2019 1 Reliability
http://slidepdf.com/reader/full/1-reliability 34/61
34
Reliability in Logistics
Parallel Configuration
± Definition - a system is said to have parallel
reliability configuration if the system function
can be performed by any one of two or morepaths
± Reliability block diagram - for a parallel
reliability configuration consisting of n
elements, E1, E2, ... En
8/3/2019 1 Reliability
http://slidepdf.com/reader/full/1-reliability 35/61
35
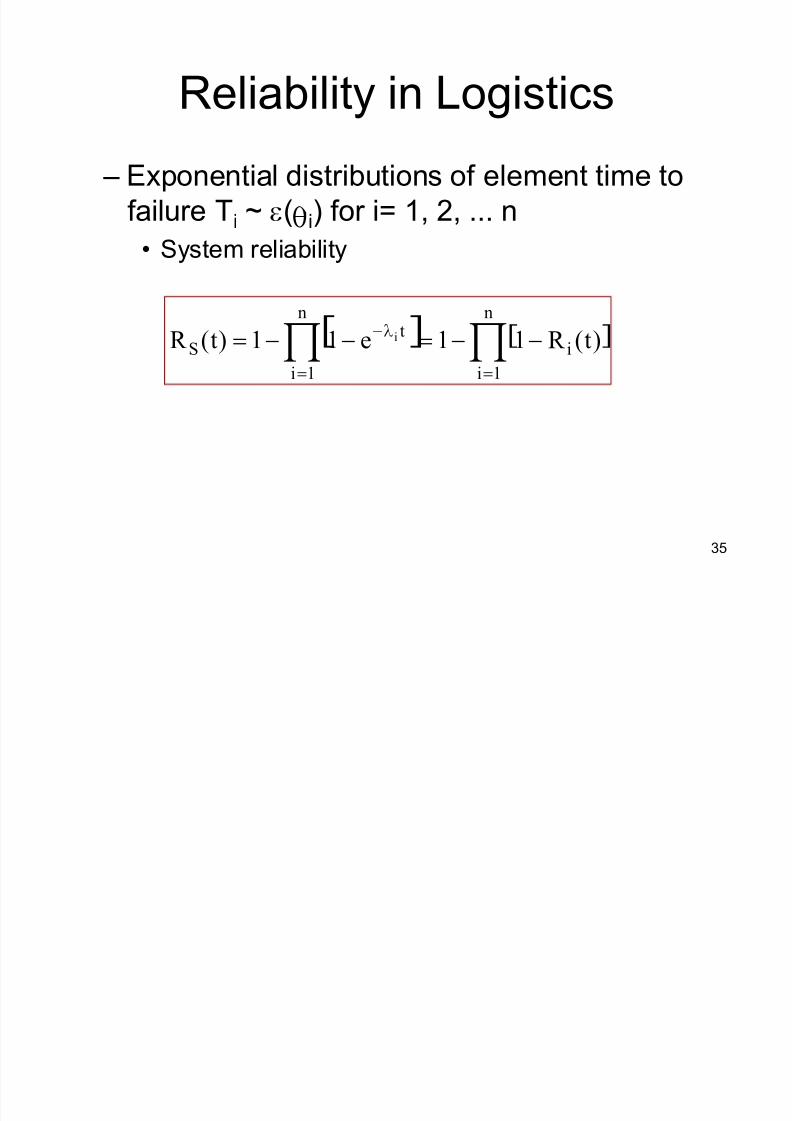
Reliability in Logistics
± Exponential distributions of element time to
failure Ti ~ I( Ui) for i= 1, 2, ... n
System reliability
? A ? A!!
!!n
1i
i
n
1i
t
S)t(R 11e11)t(R iP

8/3/2019 1 Reliability
http://slidepdf.com/reader/full/1-reliability 36/61
36
Reliability in Logistics
System mean time between failure MTBFS =
§§§§!
! P
¹¹ º
¸
©©ª
¨
PPP¹¹ º
¸
©©ª
¨
PPP n
1i
i
1n
k jik ji k ji
ji ji ji
n
1i i
1)1(...111

8/3/2019 1 Reliability
http://slidepdf.com/reader/full/1-reliability 37/61
37
Reliability in Logistics
Parallel Configuration
± Redundant reliability configuration-
sometimes called a redundant reliability
configuration. Other times, the termµredundant¶ is used only when the system is
deliberately changed to provide additional
paths, in order to improve the system
reliability.

8/3/2019 1 Reliability
http://slidepdf.com/reader/full/1-reliability 38/61
38
Reliability in Logistics
± Basic assumptions
All elements are continuously energized starting at
time t = 0
All elements are µup¶ at time t = 0 The operation during time t of each element can
be described as either a success or a failure, i.e.,
degraded operation or performance is not
considered
8/3/2019 1 Reliability
http://slidepdf.com/reader/full/1-reliability 39/61
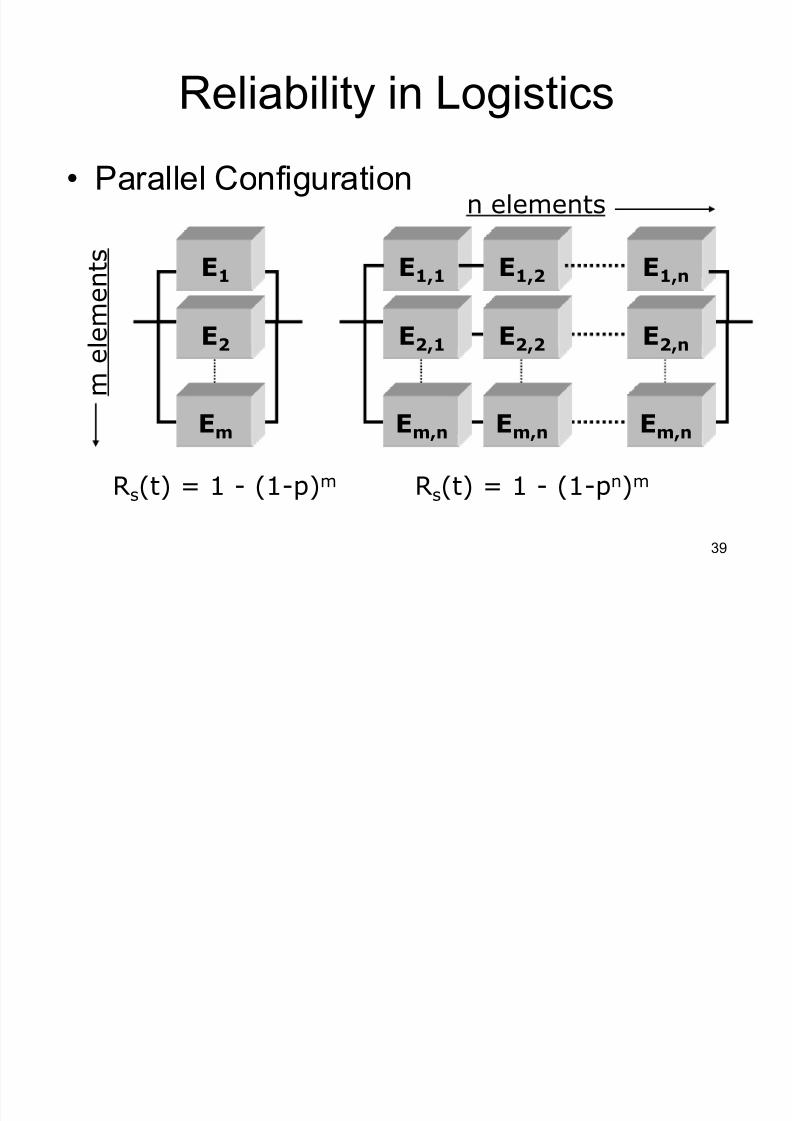
39
Parallel Configuration
Reliability in Logistics
Rs(t) = 1 - (1-p)m
E1,1
m e
l e m e n
t s E1,2
E1,n
n elements
Rs(t) = 1 - (1-pn)m
E2,1 E2,2 E2,n
Em,n Em,n Em,n
E1
E2
Em

8/3/2019 1 Reliability
http://slidepdf.com/reader/full/1-reliability 40/61
40
Parallel Configuration
Reliability in Logistics
E2
E1
Em
m e
l e m e n
t s
n elements
Rs(t) = [1 - (1-p)m ]n
E2
E1
Em
E2
E1
Em
8/3/2019 1 Reliability
http://slidepdf.com/reader/full/1-reliability 41/61
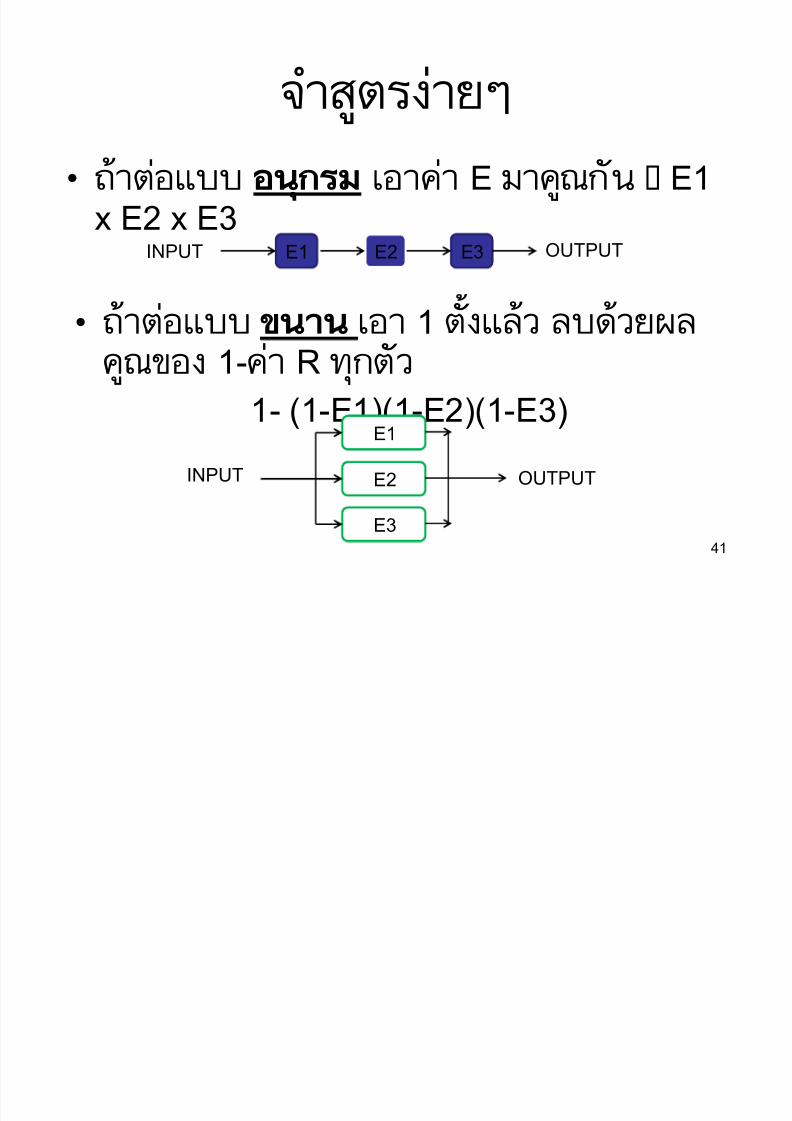
éöè ÷öûû úâ å E åôâú E1
x E2 x E3
41
÷öûû ã úú 1 ö è ûõýåôãè 1-å R øâö
1- (1-E1)(1-E2)(1-E3)
E1 E2 E3INPUT OUTPUT
E1
E2
E3
INPUT OUTPUT
8/3/2019 1 Reliability
http://slidepdf.com/reader/full/1-reliability 42/61
42
Configuration Considerations in Design
± Series Configuration - Relative to R edundant
Configuration
Simpler
Increases Basic Reliability
Reduces Support Resources
Decreases Mission Reliability
Reliability in Logistics
8/3/2019 1 Reliability
http://slidepdf.com/reader/full/1-reliability 43/61
43
± Redundant Configuration - Relative to S eries
Configuration
More Complex - Increases Weight
Requires More Testability
Increases Support Resources
Decreases Basic Reliability
Increases Mission Reliability
Reliability in Logistics

8/3/2019 1 Reliability
http://slidepdf.com/reader/full/1-reliability 44/61
44
Reliability in Logistics
Series Model Example:
± What is the reliability of the following system
given that:
E1 = 0.9400
E2 = 0.9500
E3 = 0.9800
E1 E2 E3
8/3/2019 1 Reliability
http://slidepdf.com/reader/full/1-reliability 45/61
45
Reliability in Logistics
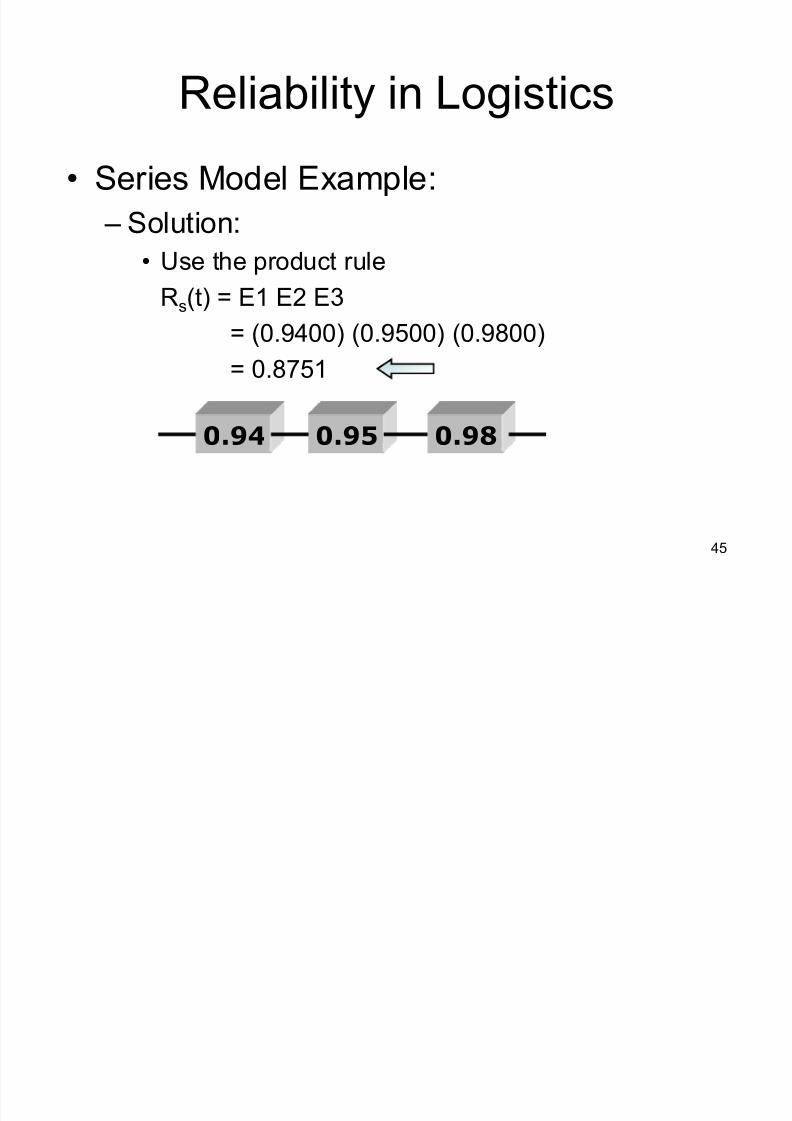
Series Model Example:
± Solution:
Use the product rule
Rs(t) = E1 E2 E3
= (0.9400) (0.9500) (0.9800)
= 0.8751
0.94 0.95 0.98
8/3/2019 1 Reliability
http://slidepdf.com/reader/full/1-reliability 46/61
46
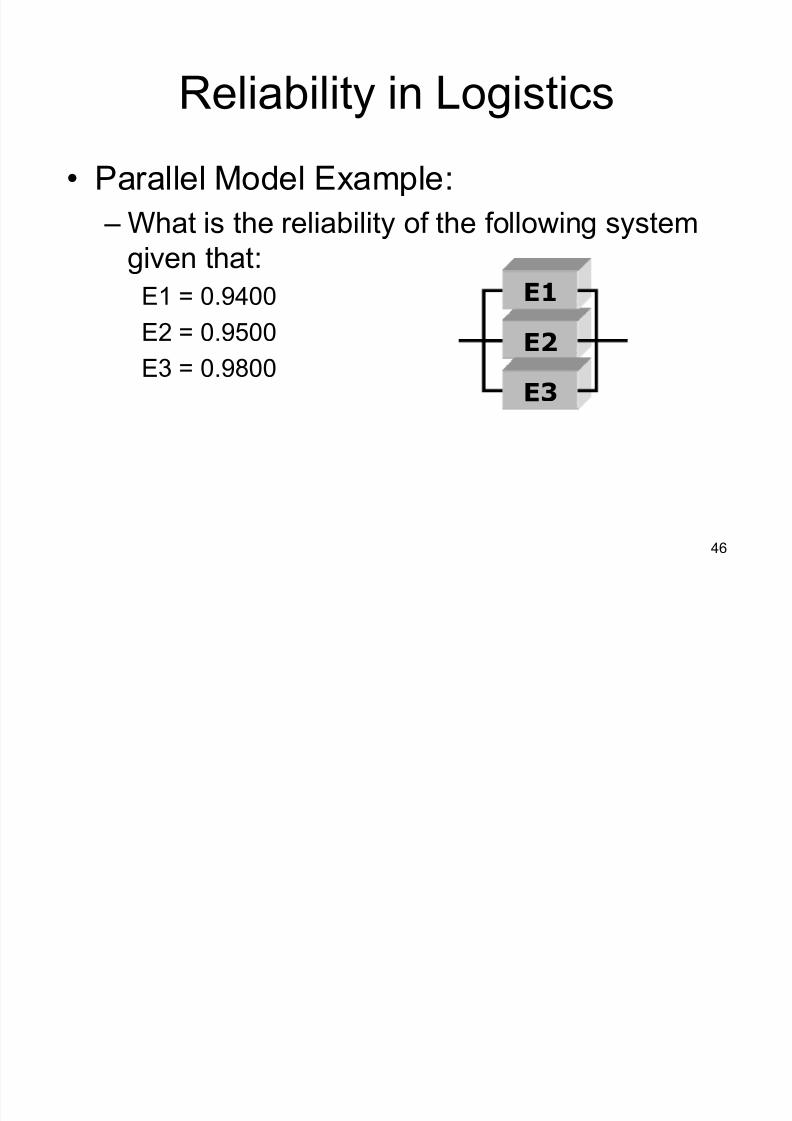
Reliability in Logistics
Parallel Model Example:
± What is the reliability of the following system
given that:
E1 = 0.9400
E2 = 0.9500
E3 = 0.9800E2
E1
E3

8/3/2019 1 Reliability
http://slidepdf.com/reader/full/1-reliability 47/61
47
Reliability in Logistics
Parallel Model Example:
± Solution:
Rs(t) = [1 - (1 - E1) (1 - E2) (1 - E3)]
= [1-(1-0.9400)(1-0.9500)(1-0.9800)]
= [1 - (0.0600)(0.0500)(0.0200)
= 0.9999
0.95
0.94
0.98

8/3/2019 1 Reliability
http://slidepdf.com/reader/full/1-reliability 48/61
48
Reliability in Logistics
Reliability Analysis
± Use to determine reliability of system
± Helps make informative decisions
± Illustrates faults in subsets of system
± Depicts through modeling increasing Rs(t)

8/3/2019 1 Reliability
http://slidepdf.com/reader/full/1-reliability 49/61
49
Bathtub Curve
Reliability in Logistics
Infant
Mortality
Wear-outUseful Life
H
a z a r d R a t e P
8/3/2019 1 Reliability
http://slidepdf.com/reader/full/1-reliability 50/61
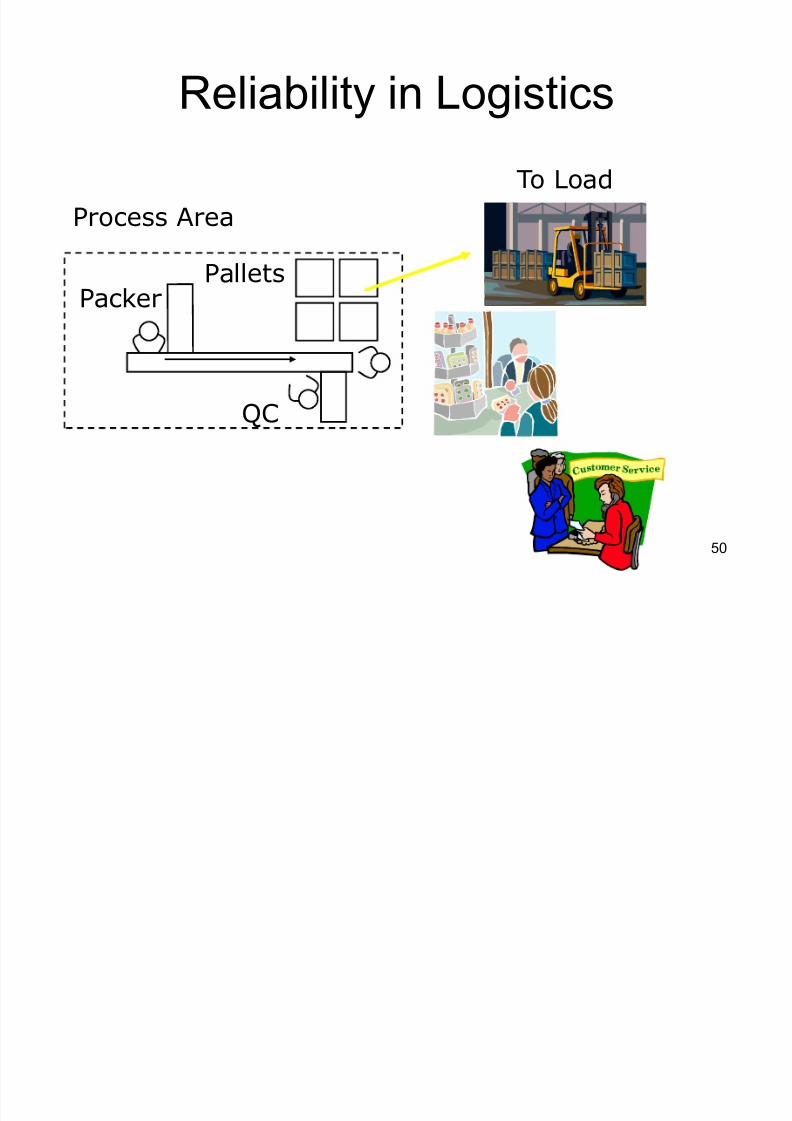
50
Reliability in Logistics
Packer
QC
Pallets
Process Area
To Load
8/3/2019 1 Reliability
http://slidepdf.com/reader/full/1-reliability 51/61
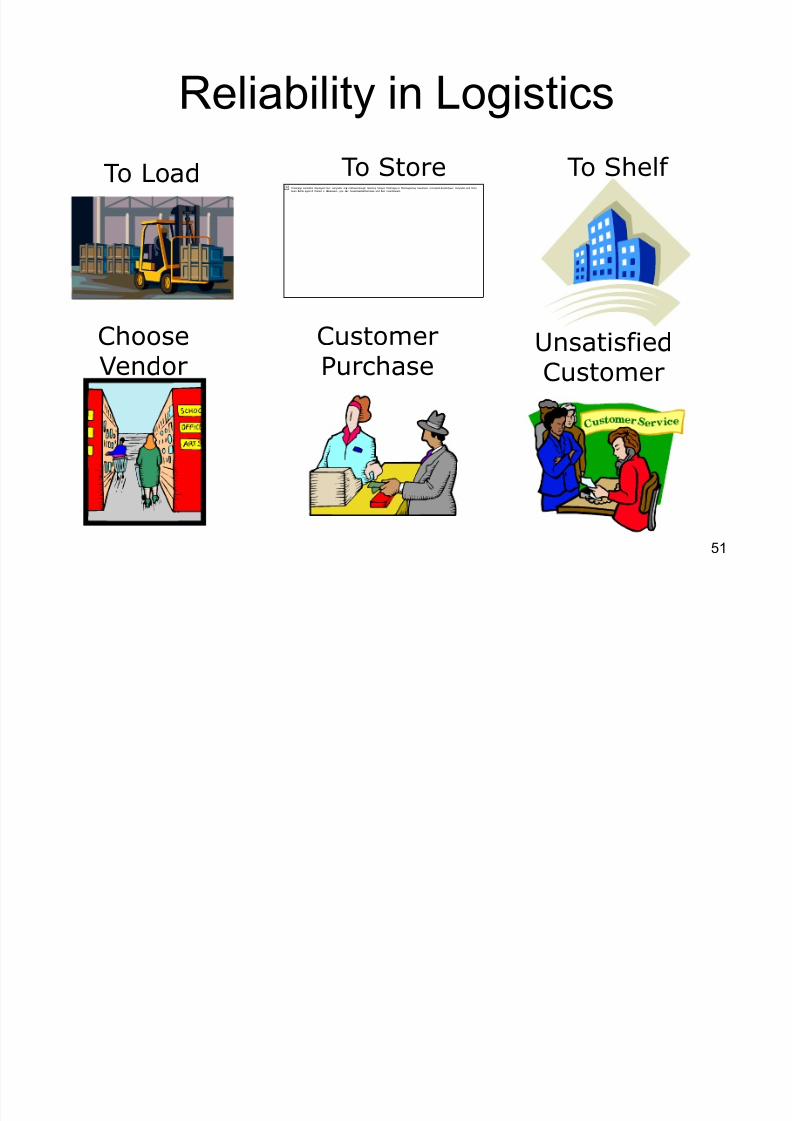
51
Reliability in Logistics
To LoadTheimage cannotbe displayed.Your computer may nothaveenough memory toopen theimage,or theimagemay havebeen corrupted.Restartyour computer,and thenopen thefile again.If thered x stillappears, you may havetodeletetheimage and then insertitagain.
To Store
ChooseVendor
CustomerPurchase
UnsatisfiedCustomer
To Shelf

8/3/2019 1 Reliability
http://slidepdf.com/reader/full/1-reliability 52/61
52
Reliability in Logistics
Exercise 1
± Determine the MTTF and MTTR for the given
data of a system (assume exp):
TTF TTR TTF TTR
(hr ) (hr ) (hr ) (hr )
125 1.0 58 1.0
44 1.0 53 0.8
27 9.8 36 0.5
53 1.0 25 1.7
8 1.2 106 3.646 0.2 200 6.0
5 3.0 159 1.5
20 0.3 4 2.5
15 3.1 79 0.3
12 1.5 27 3.8
8/3/2019 1 Reliability
http://slidepdf.com/reader/full/1-reliability 53/61
53
Reliability in Logistics
Exercise 1
± If the system operates for 8.0 consecutive
hours, what is the reliability of the system?
8/3/2019 1 Reliability
http://slidepdf.com/reader/full/1-reliability 54/61
54
Reliability in Logistics
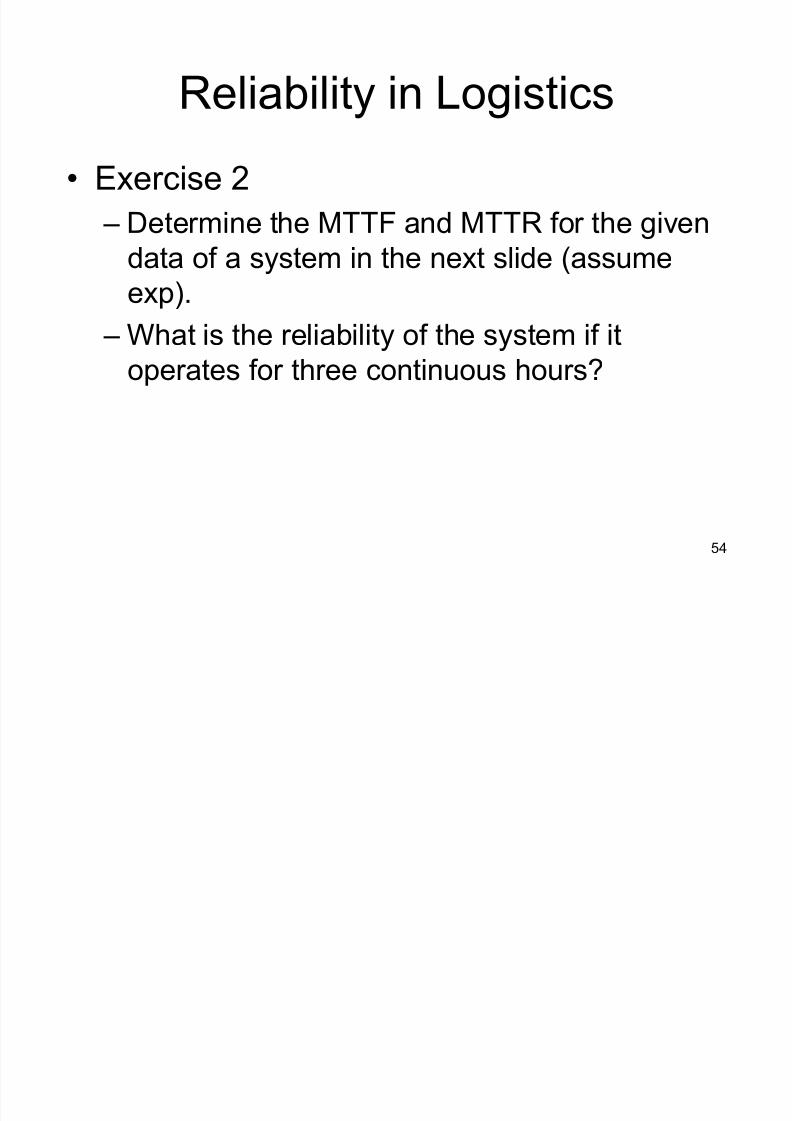
Exercise 2
± Determine the MTTF and MTTR for the given
data of a system in the next slide (assume
exp).
± What is the reliability of the system if it
operates for three continuous hours?

8/3/2019 1 Reliability
http://slidepdf.com/reader/full/1-reliability 55/61
55
Reliability in LogisticsComponent Repair t Failure t Repair At
1 0.0 3.10 4.50
1 4.5 6.60 7.40
1 7.4 9.50
2 0.0 1.05 1.70
2 1.7 4.50 8.50
3 0.0 5.80 6.80
3 6.8 8.80
4 0.0 2.10 3.80
4 3.8 6.40 8.60
5 0.0 4.80 8.30
6 0.0 3.00 6.50
7 0.0 1.40 3.50
7 3.5 5.40 7.608 0.0 2.85 3.65
8 3.7 6.70 9.50
9 0.0 4.10 6.20
9 6.2 8.95
10 0.0 7.35

8/3/2019 1 Reliability
http://slidepdf.com/reader/full/1-reliability 56/61
56
Reliability in Logistics
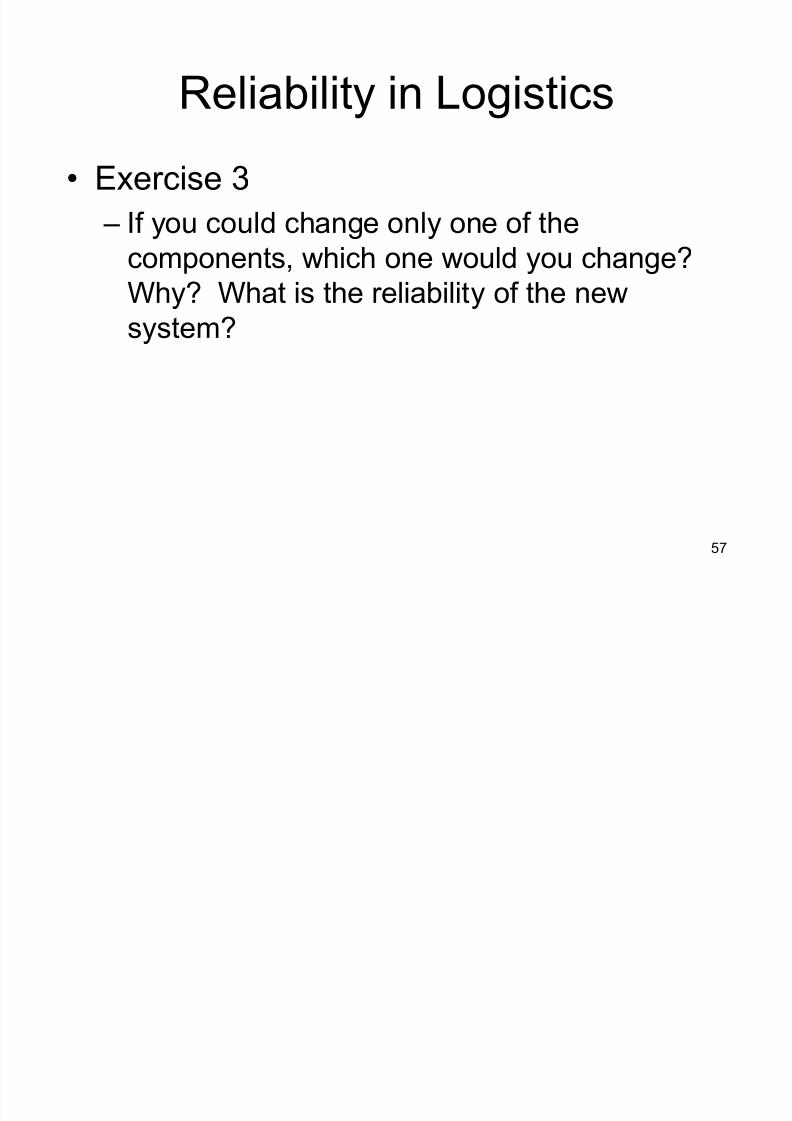
Exercise 3
± What is the reliability of the following system
(assume all components exhibit an
exponential distribution)?
E3E1
E2E2 E3
E1
E1
E2 E3
E2E1
E3
E3
E3E3
E1 = 0.90E2 = 0.95E3 = 0.85
8/3/2019 1 Reliability
http://slidepdf.com/reader/full/1-reliability 57/61
57
Reliability in Logistics
Exercise 3
± If you could change only one of the
components, which one would you change?
Why? What is the reliability of the newsystem?
8/3/2019 1 Reliability
http://slidepdf.com/reader/full/1-reliability 58/61
58
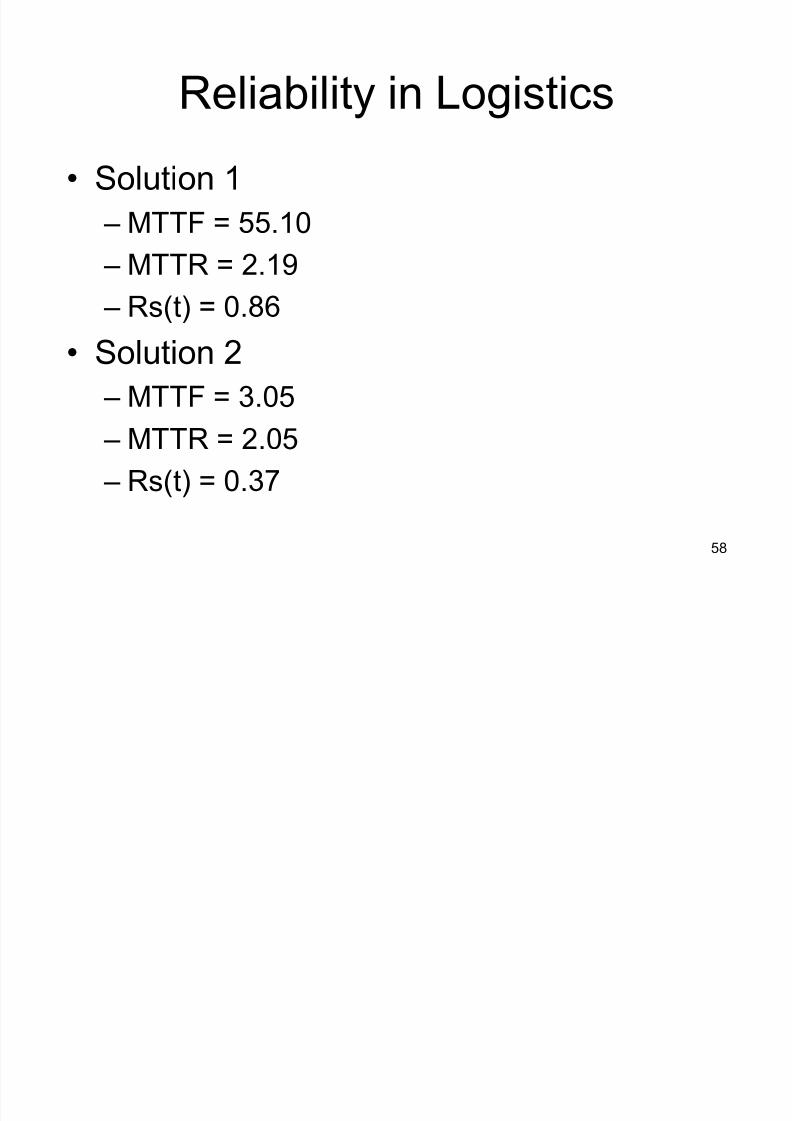
Reliability in Logistics
Solution 1
± MTTF = 55.10
± MTTR = 2.19
± Rs(t) = 0.86
Solution 2
± MTTF = 3.05
± MTTR = 2.05
± Rs(t) = 0.37

8/3/2019 1 Reliability
http://slidepdf.com/reader/full/1-reliability 59/61
59
Reliability in Logistics
Solution 3
± Part I:
Rs(t) = 0.81
± Part II:
Change E3 on the output
In series with system ± failure at this junction
causes system failure
Rs(t) = 0.91

8/3/2019 1 Reliability
http://slidepdf.com/reader/full/1-reliability 60/61
60
1. Prof. Dr. Alessandro Birolini, R eliability E ngineering: Theory and
Practice, (Germany: Springer-Verlag Berlin Heidelberg, Third
Edition, 1999), p.2.
2. Patrick D. T. O¶Connor, Practical R eliability E ngineering , (New
York, New York:John Wiley & Sons, Third Edition, October 1992),p.3.
3. Reliability Analysis Center and Rome Laboratory, R eliability
Toolkit: Commercial Practices E dition, 1993, p.36.
4. Daniel L. Babcock, Managing E ngineering and Technology , (New
Jersey: Prentice-Hall, Inc., Second Edition, 1996), p. 204.
References
8/3/2019 1 Reliability
http://slidepdf.com/reader/full/1-reliability 61/61
61
5. Benjamin S. Blanchard, Logistics E ngineering and Management ,
(Upper Saddle River, New Jersey: Pearson/Prentice Hall, 2004),
p. 47.
6. Ernest J. Henley and Hiromistsu Kumamoto, R eliability
E ngineering and
R isk Assessment , (Englewood Cliffs, NewJersey: Prentice-Hall, 1981), p. 238.
References