1 uncertainty in eio-lca / hybrid lca models. 2 admin issues setting office hours hw 2 coming back...
Post on 20-Dec-2015
215 views
TRANSCRIPT

1
Uncertainty in EIO-LCA /Hybrid LCA Models

2
Admin Issues
• Setting Office Hours
• HW 2 Coming Back
• Setting group presentations – 1 or 2 classes– can we run late? – How much time? – Or do on Friday?
3
Uncertainty in LCA
• Uncertainty exists for all LCA data: mass flows, emissions, impacts, weights and change effects, e.g.– Proprietary data problems– Boundary problems: Lenzen (2000, Journal
Industrial Ecology) finds truncation errors on the order of 50% for Australian LCA. Similar to Hocking result.
– Measurement, transfer, change, etc.

4
Uncertainty Implications
• Consistency and reproducibility of results (e.g. are paper or plastic cups superior).
• Certainty of conclusions and usefulness of LCA.• Uncertainty for LCA studies in general obvious -
we will focus on EIO-LCA– Data problems, combining data problems, allocation..
• Numbers of significant digits – how many digits appropriate for www.eiolca.net result?

5
EIO-LCA Uncertainty Sources
• Survey Errors: sampling and reporting errors – depends on companies and census agencies.
• Old Data: IO tables are typically 2 to 7 years old. Last US benchmark: 1997 released 12/2002.
• Incomplete Data: reports from only some sectors or plants (e.g. tri sector and threshold limits, holes in census surveys). Note: similarity to boundary problem in conventional LCA!

6
EIO-LCA Uncertainty (cont)
• Missing data: Census data missing many topics, such as habitat destruction. Non-monetary inter-sector dependencies also not represented, e.g. congestion effects from truck services.
• Aggregation: Sectors too large for detailed analysis on specific products. Problem sectors: ?
7
Uncertainty (cont.)
• Imports: EIO treats imports as similar to domestic production.
• Model form: Linearity of EIO, lack of substitution as scale economies change.
• Mapping and Allocation Problems
• Product Prices

8
Uncertainty (Pacca 2003)
Sources of problems Temporal constraint
Data
Methodological constraint
Economic boundary
Imported goods
Indirect outcomes
Constant technology
Constant returns to scale
No substitution effect
Old data
Collection
Interpretation
Inaccuracy
Incomplete data
Missing data
Other assumptions
Intra-sectoral resolution
National averages
Inventory method
Price based flows
9
Mitigating Factors and Approaches
• Parameter stability over time
• Positive Correlations
• More and better data
• Simulation analyses
• User adjustments

10
Parameter Stability Over Time
• Requirements matrix relatively stable over time:– Using 1961 final demand from IO tables of
1939 to 1961 found similar intermediate outputs (Carter, 1970).
– Intermediate use relatively constant (Ma, 2003)
• Environmental impact vectors more dynamic.

11
Intermediate Use 1972-1997Total Intermediate Use Percentages
1972 1987 1992 1997
Manufacturing 49% 41% 39% 35%
Natural Resources 11% 9% 8% 9%
Trade 16% 19% 20% 27%
Services 22% 29% 31% 28%
Miscellaneous 2% 2% 2% 2%
Infrastructure 22% 24% 25% 26%
12
Positive Correlations
• Deciding on the best of two designs may be more certain than overall impact due to positive correlations. The designs may share many elements in common, and these elements would be positively correlated. If the element is bad, it is bad for both. If good, it is good for both.
• Numerical analysis of effect – Cano (2000).
13
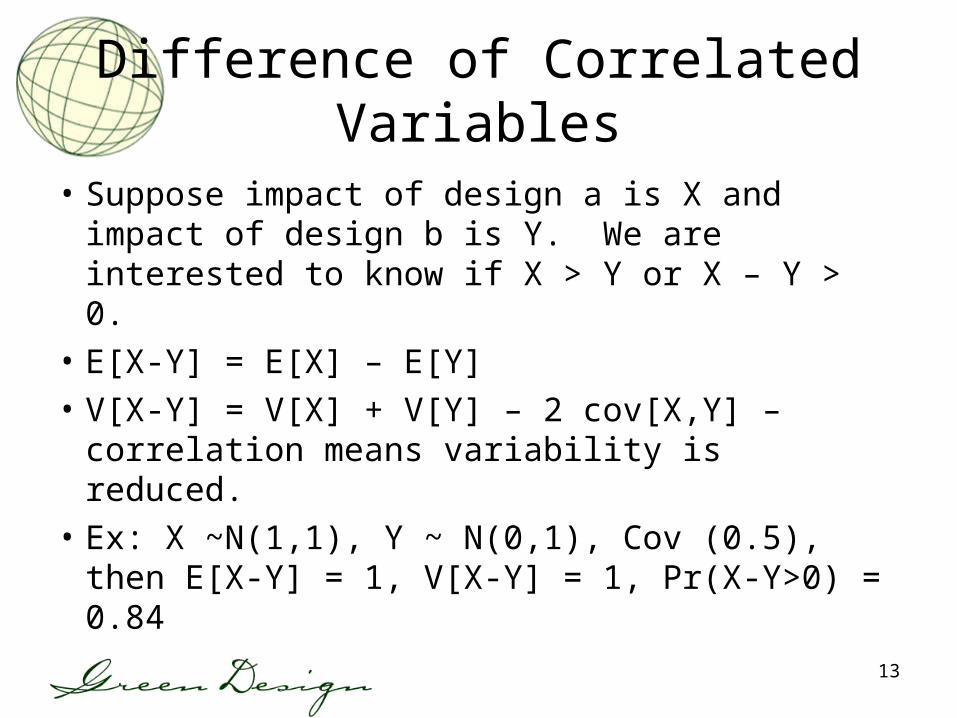
Difference of Correlated Variables
• Suppose impact of design a is X and impact of design b is Y. We are interested to know if X > Y or X – Y > 0.
• E[X-Y] = E[X] – E[Y]
• V[X-Y] = V[X] + V[Y] – 2 cov[X,Y] – correlation means variability is reduced.
• Ex: X ~N(1,1), Y ~ N(0,1), Cov (0.5), then E[X-Y] = 1, V[X-Y] = 1, Pr(X-Y>0) = 0.84

14
More and Better Data
• Mixed picture for more and better data.
• No water use data since 1980s in US.
• No workfiles for 1997 benchmark released.
• Better industrial environmental management systems to collect data.
• More international co-operation and public data – international tri.

15
User Adjustments
• Many adjustments possible due to known aggregation or emissions problems– Hybrid models including EIO and process models.– Parameter adjustments to reflect non-linearities.– Disaggregating individual EIO sectors.
• Bayesian methods applicable here – adjusting estimates based on expectations.
• Multiple approaches: EIO-LCA and Conventional LCA.
16
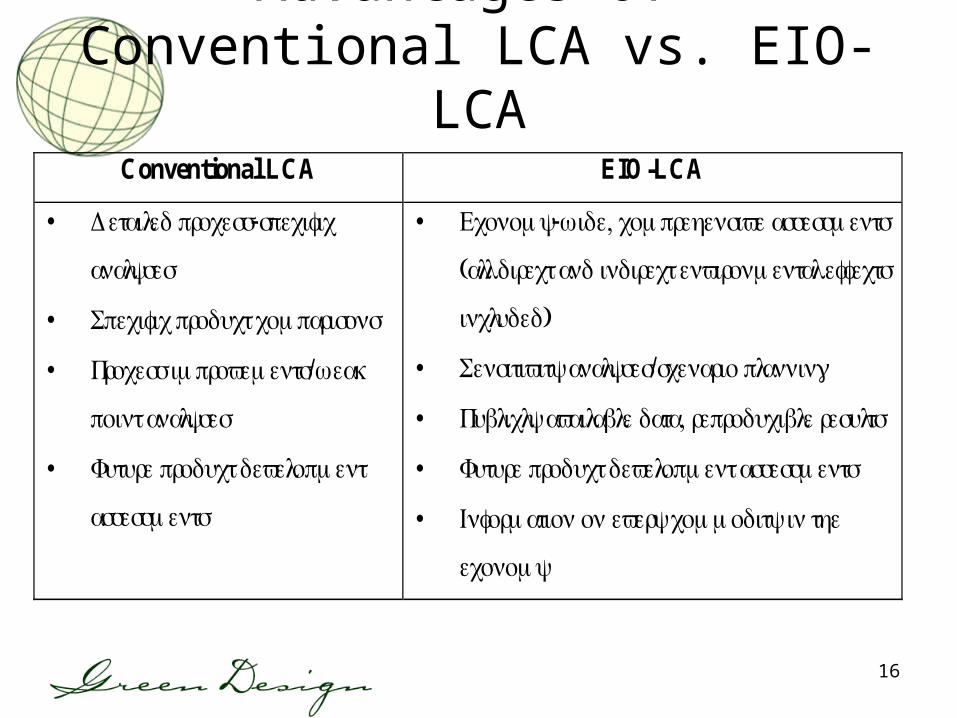
Advantages of Conventional LCA vs. EIO-LCAConventional LCA EIO-LCA
• Detailed process-specific
analyses
• Specific product comparisons
• Process improvements/weak
point analyses
• Future product development
assessments
• Economy-wide, comprehensive assessments
(all direct and indirect environmental effects
included)
• Sensitivity analyses/scenario planning
• Publicly available data, reproducible results
• Future product development assessments
• Information on every commodity in the
economy
17
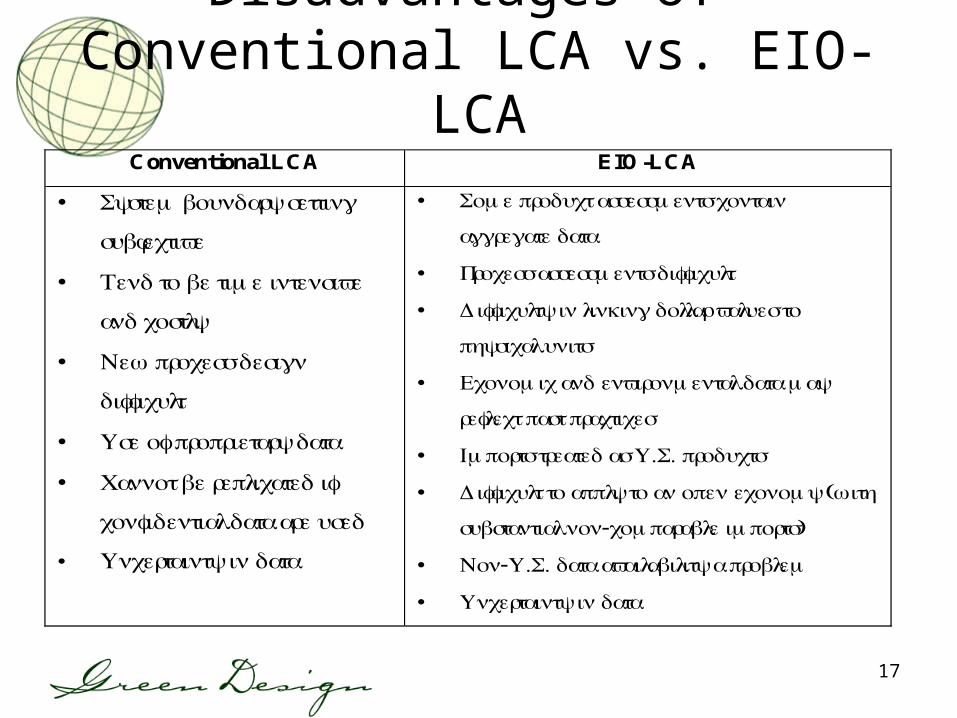
Disadvantages of Conventional LCA vs. EIO-LCA
Conventional LCA EIO-LCA
• System boundary setting
subjective
• Tend to be time intensive
and costly
• New process design
difficult
• Use of proprietary data
• Cannot be replicated if
confidential data are used
• Uncertainty in data
• Some product assessments contain
aggregate data
• Process assessments difficult
• Difficulty in linking dollar values to
physical units
• Economic and environmental data may
reflect past practices
• Imports treated as U.S. products
• Difficult to apply to an open economy (with
substantial non-comparable imports)
• Non-U.S. data availability a problem
• Uncertainty in data

18
References
• Cano-Ruiz, Alexandro Jose, (2000). “Decision Support Tools for Environmentally Conscious Chemical Process Design,” unpublished PhD Dissertation, MIT.
• Lenzen, Manfred, (2000). “Errors in Conventional and Input-Output-based Life-Cycle Inventories,” J. of Industrial Ecology, 4(4), pp. 127-148.
• Pacca, S., (2003). “Global Warming Effect Applied to Electricity Generation Technologies,” PhD Thesis, UC Berkeley.

19
Hybrid Life Cycle Assessment
Combining process models and EIO-LCA

20
Models of LCA
• “Conventional” LCA, developed by SETAC and EPA, based on process models
• Economic input-output analysis-based LCA (EIO-LCA), developed by Carnegie Mellon’s Green Design Initiative and Others
• Hybrid models:– Using eiolca model to guide boundary and scope of process models.– Disaggregating or augmenting io model.– Using eiolca for some processes, products and supply chain elements
(where sector aggregation is not a major issue), with process models for remainder.

21
Utility of Two LCA Approaches
EIO-LCASETAC-EPA
LCA
SETALCESETACLCA
range of information for product design
industry wide
interindustrial
specificprocesses
specific materials
productssystems
22
Goals of Hybrid LCA Models• Incorporate the advantages of the two models,
reduce disadvantages
• Include detailed, process-level data, as well as the economy-wide effects
• Provide environmental and economic information about every major product and process in the economy
• Quantify the widest range of environmental data
• Two obvious high level alternatives for hybrid models

23
Integration of EIO-LCA Data into Conventional LCA
C11 Cn
C1
Cn
system boundary
commodity
commodity
Process models
EIO-LCA

24
Integration of Conventional LCA Data into EIO-LCA
EIO-LCA
process results
product
commodity
commodity
Cj
Cj1 Cj2

25
Economic and Environmental Implications of Online
Retailing and Centralized Stock Keeping in the United
States

26
E-Commerce Retail Quarterly Volume ($B)

27
Traditional Retail Logistics System
• Factory to warehouse to warehouse to retailer.
• Last leg of trip by private vehicle

28
Single Facility Sales
• LL Bean, Lands End - catalogue sales
• Amazon (original), MusicOutpost - web based sales from a single facility

29
Comparison of Freight Modes
0
10
20
Total Energy (TJ/$1M) Direct Energy(TJ/$1M)
Total Energy (MJ/ton-mile)
Direct Energy (MJ/ton-mile)
Air
Truck
Rail

30
How to Model E-Commerce for LCA?
31
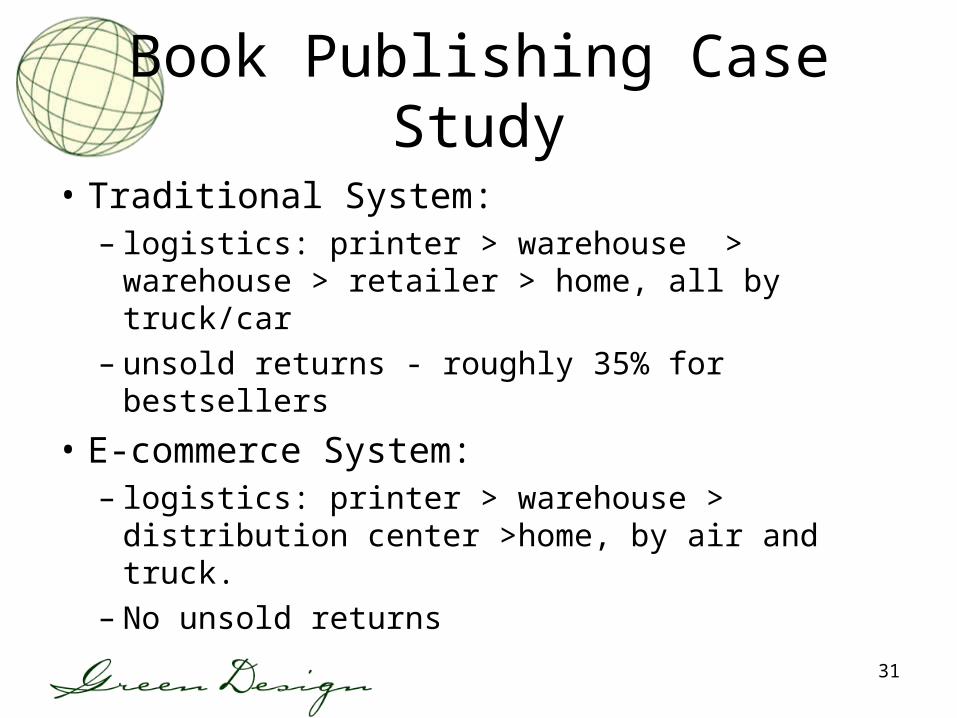
Book Publishing Case Study
• Traditional System:– logistics: printer > warehouse > warehouse >
retailer > home, all by truck/car– unsold returns - roughly 35% for bestsellers
• E-commerce System:– logistics: printer > warehouse > distribution
center >home, by air and truck.– No unsold returns

32
Comparative Analysis: * is EIOLCA Sector Use
• Traditional:– truck transport (1000 mi)*– Warehousing*– production of returns*– reverse travel of returns*– private automobile
transport
• E-Commerce– air transport (500
mi)*– truck transport (500
mi)*– Warehousing*
33
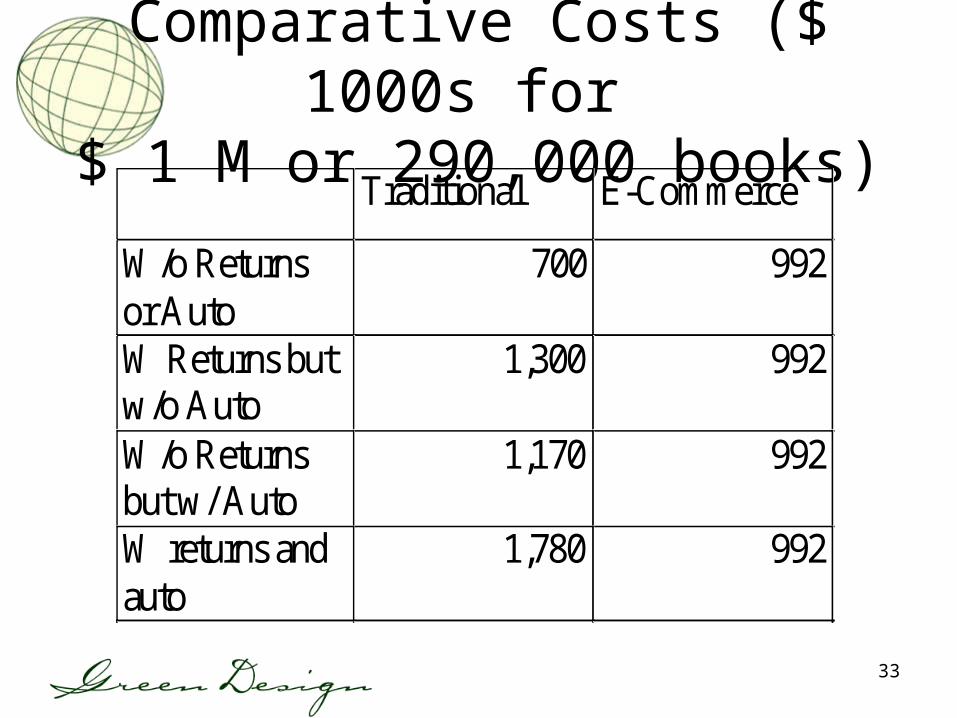
Comparative Costs ($ 1000s for
$ 1 M or 290,000 books) Traditional E-Commerce
W/o Returns or Auto
700 992
W Returns but w/o Auto
1,300 992
W/o Returns but w/ Auto
1,170 992
W returns and auto
1,780 992

34
Why are E-Commerce Costs Lower?
• Higher transportation costs for e-commerce, but:– Returns of unsold copies – Lower retail transactions costs– Lower (private) automobile cost
• Result is cost advantage for e-Commerce

35
Energy(TJ)
*ConventionalAir Pollutants
(mT)
RCRAHazardousWaste (mT)
GreenhouseGas Emissions(CO2 Equiv.,
mT)
Trucking (with returns) 5.3 8.9 9.1 354
Production 9.45 8.1 23 612Packaging 1.2 1.1 3.5 84Passenger Trips 9.7 42 0 611Pass. Fuel Prod. 7 1.7 30 337Total 33 62 66 2000
Trucking 1.2 2 2 80Air 7 3 9 440Production 7 6 17 453Packaging 4 3 11 254Delivery Trips 11 18.5 19 736Pass. Fuel Prod. 0 0 0 0Total 30 33 58 1963% Difference 9 47 12 2

36
Summary Environmental Impacts
(per-book basis)
Trad. E-Com.
Energy (MJ) 115 105
Conventional Air (kg) 0.2 0.1
Hazardous Waste (kg) 0.2 0.2
Greenhouse Gas (kg) 7 7

37
Sensitivity Analysis
• ‘Traditional’ becomes better if:– Local distance to bookstore < 3 miles– Air transport of books > 700 miles– Orders not shipped together
• Ecommerce better if:– Switch from Air transport– Multiple origin sites– Greater density of sales.

38
Harry Potter Case
• 250,000 books shipped on release date by Amazon.com– 9,000 trucks and 100 airplanes
• 2.5 lb. book, 0.7 lb. packaging (3.2 lbs.)– Bookstores got 10 per box
• Shopping trips for books avg. 11 miles– Marginal effects

39This is Research….

40
Some Analysis Issues
• What are E-commerce future scenarios?• What will happen with local manufacturing
technology?• What will be impact of new business
models for controlling inventory (warehousing), manufacturing and shipping.
• What is appropriate time scale of analysis?

41
Analysis Boundary Issues (cont.)
• Buildings - decrease in retail or warehouse space?
• Shopping - will individuals substitute other travel for reduced shopping travel?
• Computers - what fraction of personal computer burdens should be allocated to E-commerce?

42
Will E-commerce Improve or Degrade the Environment?
• Net Effect - hypothesis: depends upon product and processes and upon the analysis boundary.
• Appropriate Public Policy - – Don’t ignore service industries in environmental
policy.– Consider life cycle costs including social costs.– Take advantage of cost savings to create
environmental benefits