1 using data to improve student achievement & to close the achievement gap tips & tools for...
TRANSCRIPT

1
Using Data to Improve Student Achievement
& to Close the Achievement GapTips & Tools for Data Analysis
Spring 2007

2
Making Use of Data to Improve Student Performance Identify 1 effective strategy your district uses to
make use of data. Move to a small group and share strategies. List ideas from others in small group that you
can use in your district. Identify 1 strategy from small group to share
with large group. List ideas from large group that you can use in
your district.
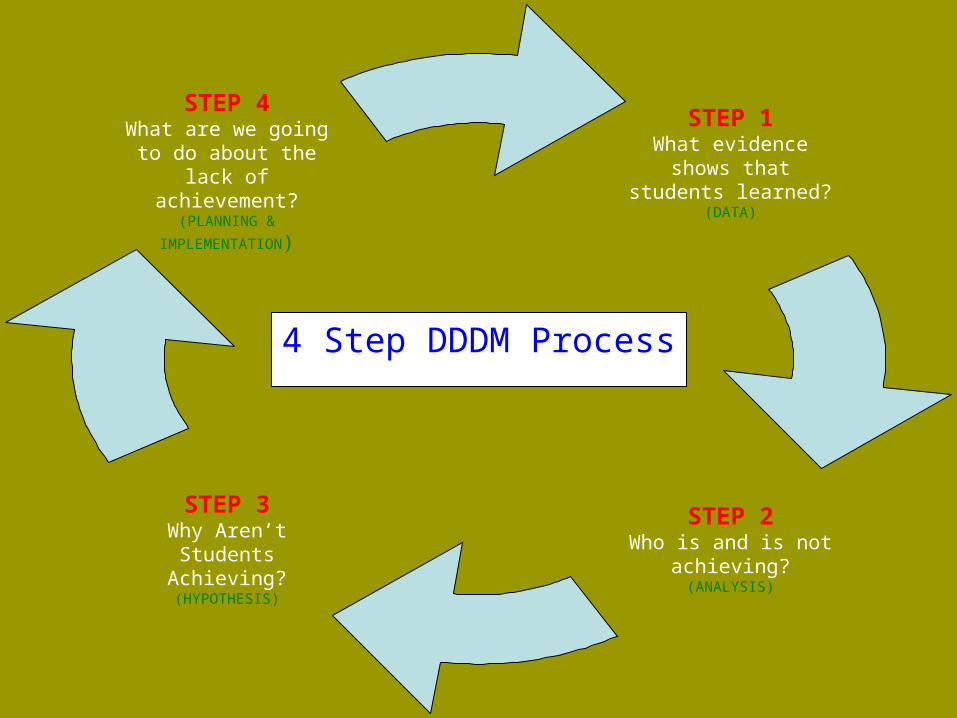
STEP 1What evidence shows that students learned?
(DATA)
STEP 3Why Aren’t Students
Achieving?(HYPOTHESIS)
STEP 4What are we going to do about the lack of
achievement?(PLANNING &
IMPLEMENTATION)
STEP 2Who is and is not
achieving?(ANALYSIS)
4 Step DDDM Process

4
Looking at the BIG Picture

5
Multiple Measures Demographics
Enrollment, attendance, drop-out rate, ethnicity, gender, grade level
Perceptions Perceptions of learning environment, values & beliefs,
attitudes, observations Student Learning
Standardized tests (NRT/CRT), teacher observations of abilities, authentic assessments
School Processes Description of school programs & processes

6
Criterion-Referenced Data What’s required?
Proficiency percentages for combined pop. & identifiable subgroups by
Test Year (for latest 3 years)
Analysis of test by Passage type & type of response for literacy Writing domain & multiple choice for literacy Strand & type of response for math
…in order to identify trends and draw conclusions based on results over 3 year period

7
Norm-Referenced Data What’s required?
National percentile rank & standard score for combined population & identifiable subgroups by
Test Year
Analysis of test by Content subskill & skill cluster
…in order to identify trends, measure growth, and draw conclusions based on results over 2 year period

8
Disaggregated Data Tools CRT
ACSIP Template: # and % of students non-proficient/proficient for combined and subgroup populations
ACSIP Strand Performance Report: combined and subgroup performance averages by test, passage type/domain/strand, & type of response
Data Analysis Set: [email protected]

9
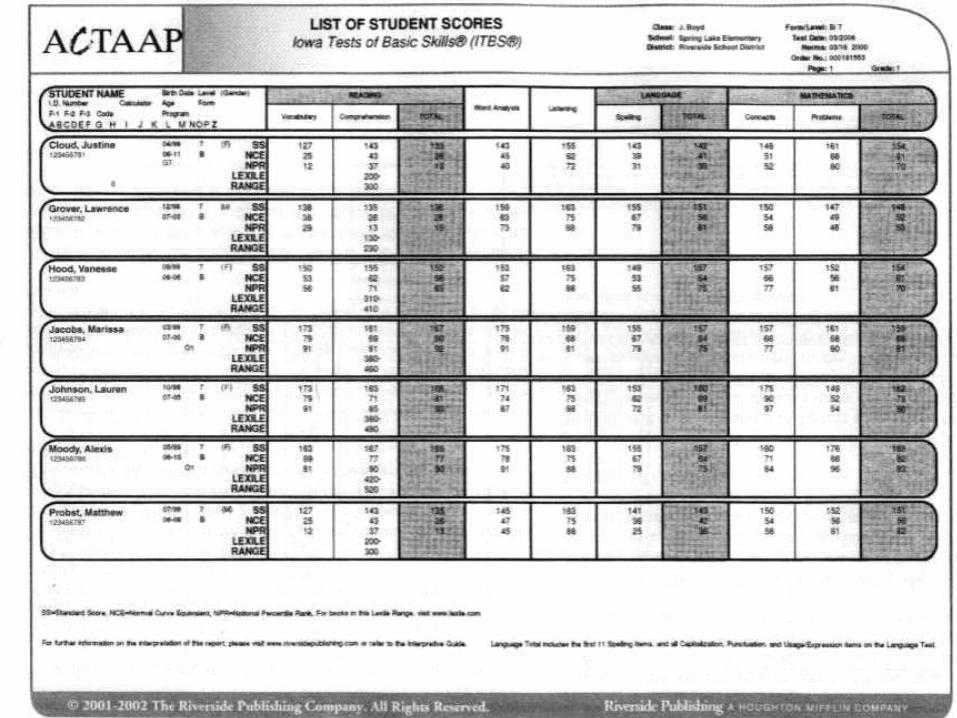
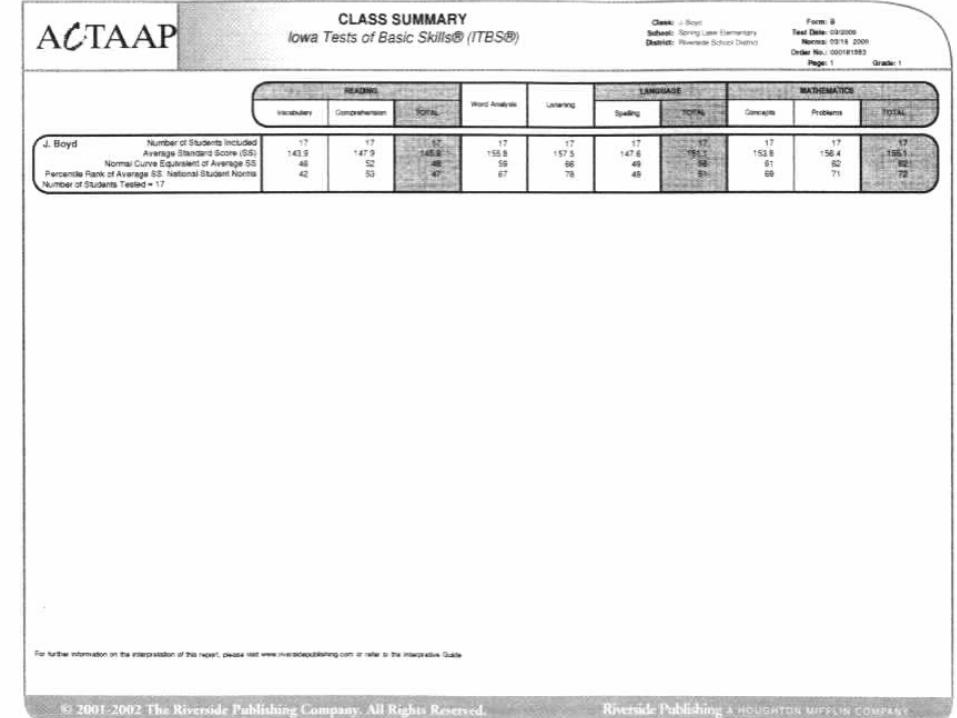
Disaggregated Data Tools NRT
ITBS ACSIP Report: # & % of students performing above the 50th percentile on each test and content subskill for combined & subgroup populations
Performance Profile: standard score & NPR on each test and content subskill for combined population
School Coded Summary: standard score & NPR on each test for subgroup populations
Data Analysis Set: [email protected]

10

11
12
13

14

15
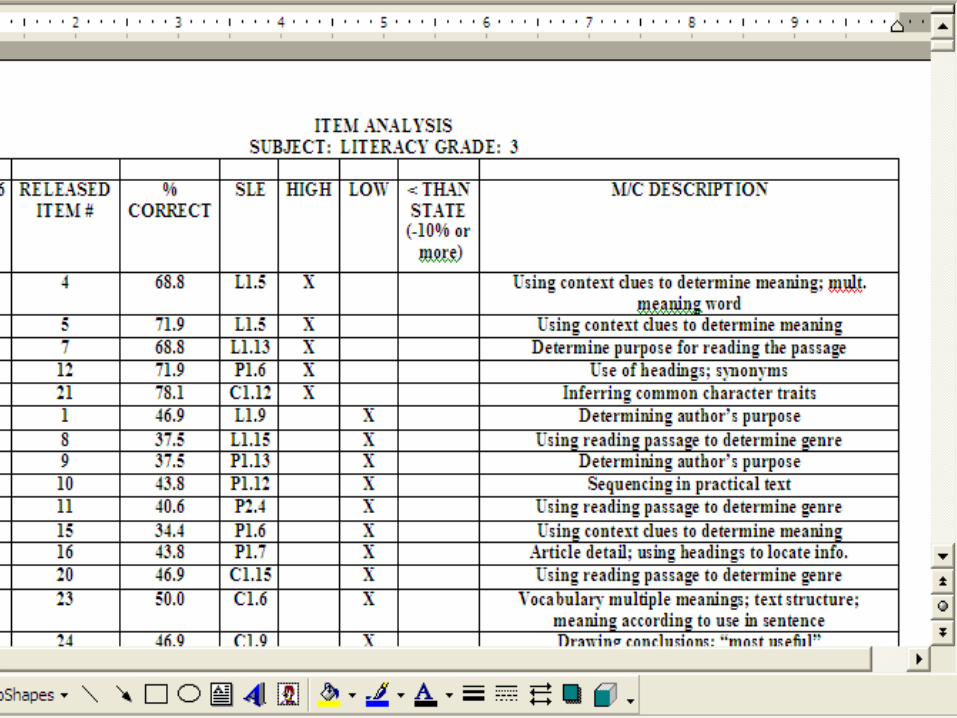
Digging Deeper CRT Item Analysis
Content Standard Language of Question Level of Questioning Distracters

16
Content Standard
What is it that the student must know or be able to do? When is this introduced in the curriculum? How is it paced? Is it a “power standard”? What instructional strategies are used to help students master
this standard? Have I given students the “tools” (e.g. calculator skills, writing
tips, test taking skills, etc.) necessary to respond appropriately? Can this standard easily be integrated into other curricular areas?

17
Language of Question
How is the question worded on the test? Are there vocabulary words used that may hinder
comprehension? Do I teach and test using the same language? Do I have word/learning walls in my content area to support
this standard and related vocabulary?

18
Level of Questioning
According to Bloom’s, what is the level of questioning used to measure mastery of the standard? Highlight the verb(s) in the question. Do I use those same
verbs in my teaching and testing? Have I taught “key” or “clue” words that will help students to
understand what is being asked of them? Is the question “multi-layered”?

19
Distracters
Are there items that “distract” the student from identifying what is being asked, or are there items that may “confuse” the student as he/she makes an answer choice? Labels Additional information Multi-layered tasks Conversions “Not”
20
21
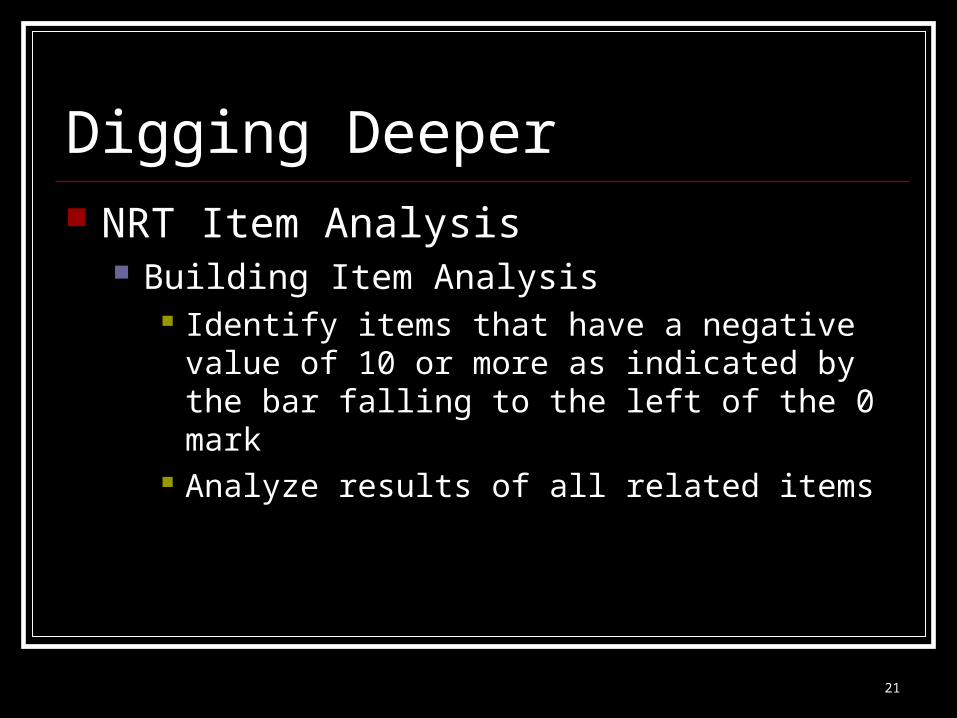
Digging Deeper NRT Item Analysis
Building Item Analysis Identify items that have a negative value of 10 or
more as indicated by the bar falling to the left of the 0 mark
Analyze results of all related items

22

23
(Grade Level & Name of Exam)
Student Population
Year Weakness(see ACSIP
rubric)
Year Weakness(see ACSIP
rubric)
Year Weakness(see ACSIP
rubric)
Combined %age prof./adv./
%age at or above 50th %ile
%age prof./adv./
%age at or above 50th %ile
%age prof./adv./
%age at or above 50th %ile
African American
%age prof./adv./
%age at or above 50th %ile
%age prof./adv./
%age at or above 50th %ile
%age prof./adv./
%age at or above 50th %ile
Hispanic %age prof./adv./
%age at or above 50th %ile
%age prof./adv./
%age at or above 50th %ile
%age prof./adv./
%age at or above 50th %ile
Caucasian %age prof./adv./
%age at or above 50th %ile
%age prof./adv./
%age at or above 50th %ile
%age prof./adv./
%age at or above 50th %ile
Economic. Dis.
%age prof./adv./
%age at or above 50th %ile
%age prof./adv./
%age at or above 50th %ile
%age prof./adv./
%age at or above 50th %ile
LEP %age prof./adv./
%age at or above 50th %ile
%age prof./adv./
%age at or above 50th %ile
%age prof./adv./
%age at or above 50th %ile
Students with Dis.
%age prof./adv./
%age at or above 50th %ile
%age prof./adv./
%age at or above 50th %ile
%age prof./adv./
%age at or above 50th %ile
Trend Analysis: (Summarize 3 year findings from above. Include item analysis for further breakdown.)

24
Peeling the Data: Levels of Looking at Data
District K-12 Feeder Patterns School Levels Grade Level Programs & Tracks Classroom-teacher Student

25
Peeling the Data: Questions to Ask Are there any patterns by racial/ethnic groups? by gender?
by other identifiers? What groups are doing well? What groups are behind? What groups are on target?
Ahead? What access and equity issues are raised? Do the data surprise you, or do they confirm your
perceptions? How might some school or classroom practices contribute to
successes and failures? For which groups of students? How do we continue doing what’s working and address
what’s not working for students?

26
Peeling the Data: Dialogue to Have How is student performance described? (by medians, quartiles,
levels of proficiency, etc.) How are different groups performing? Which groups are meeting
the targeted goals? What don’t the data tell you? What other data do you need? What groups might we need to talk to? (students, teachers) What are the implications for?
Developing or revising policies Revising practices and strategies Reading literature Visiting other schools Revising, eliminating, adding programs Dialogues with experts Professional development goal setting and monitoring progress
How do we share and present the data to various audiences?
27
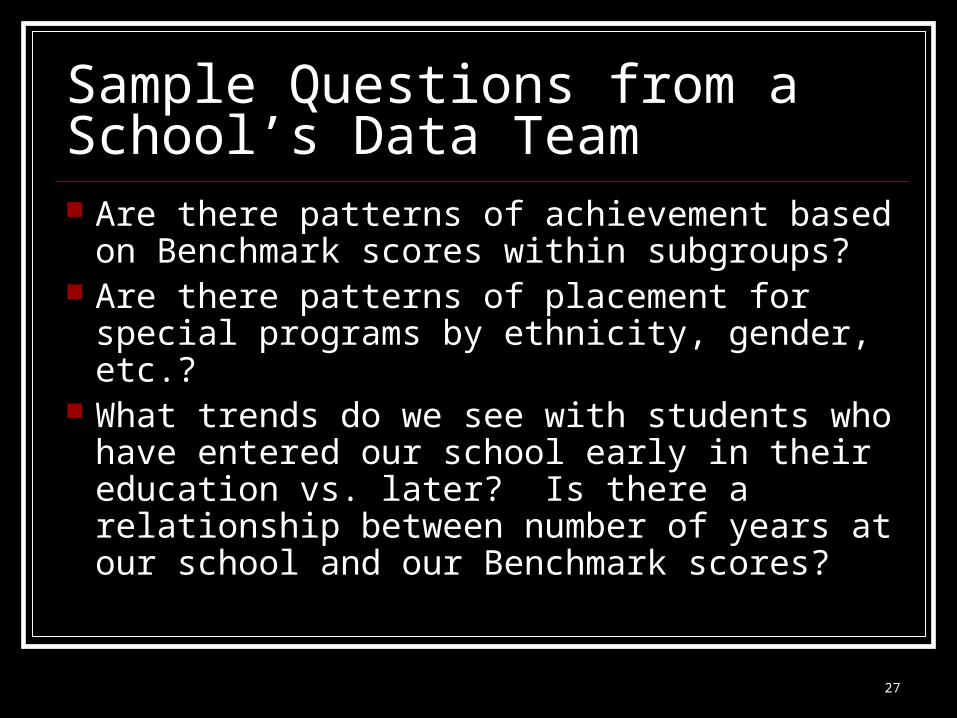
Sample Questions from a School’s Data Team Are there patterns of achievement based
on Benchmark scores within subgroups? Are there patterns of placement for special
programs by ethnicity, gender, etc.? What trends do we see with students who
have entered our school early in their education vs. later? Is there a relationship between number of years at our school and our Benchmark scores?
28
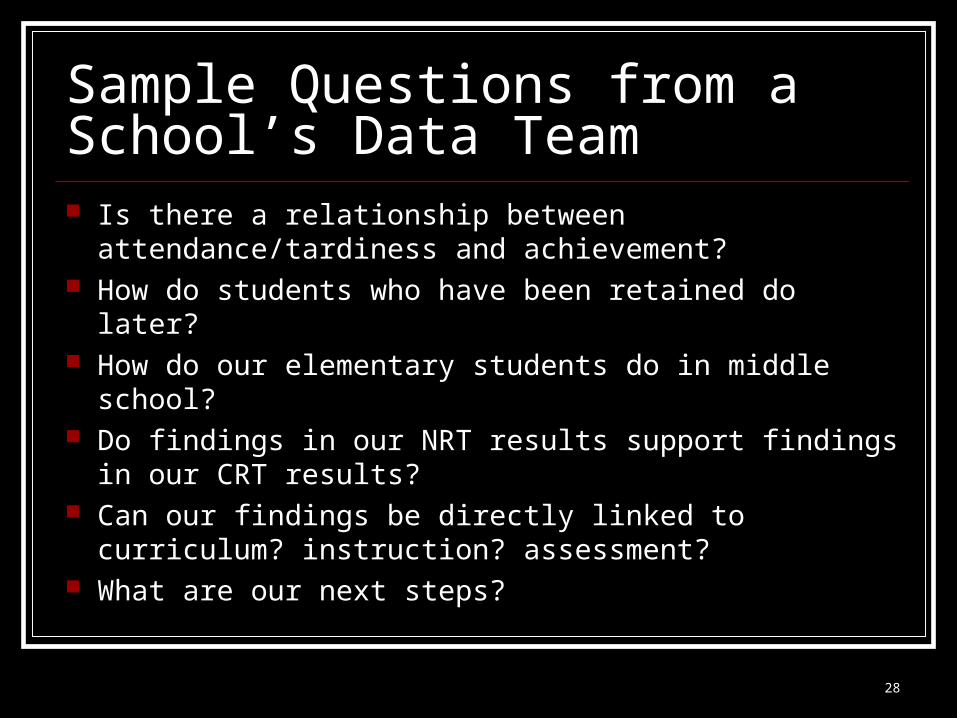
Sample Questions from a School’s Data Team Is there a relationship between attendance/tardiness
and achievement? How do students who have been retained do later? How do our elementary students do in middle school? Do findings in our NRT results support findings in our
CRT results? Can our findings be directly linked to curriculum?
instruction? assessment? What are our next steps?
29
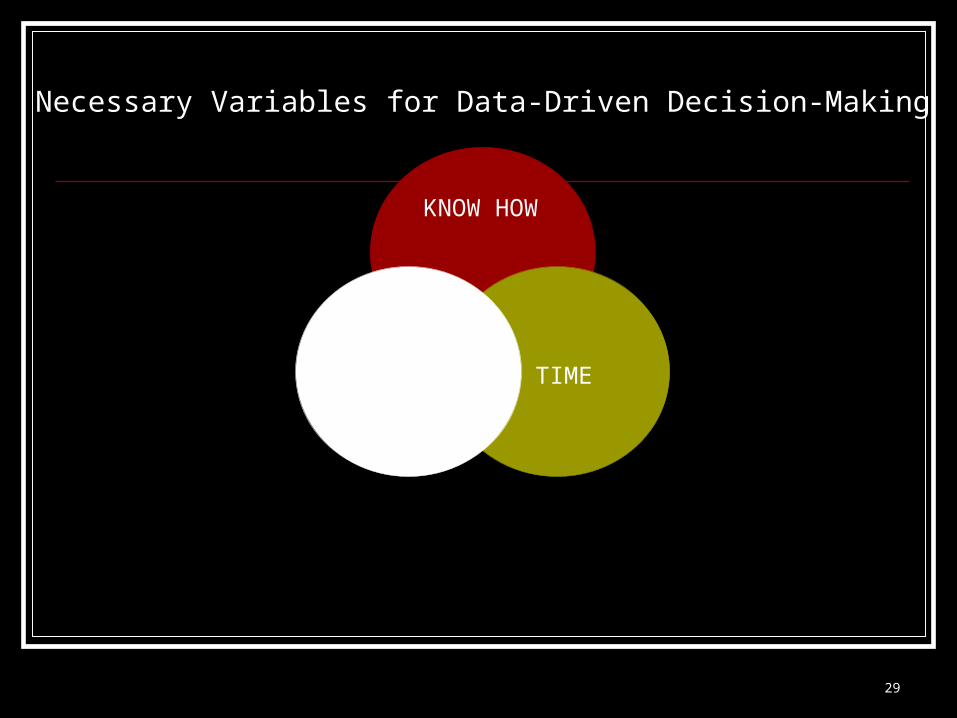
Necessary Variables for Data-Driven Decision-Making
KNOW HOW
TIME WANT TO