1.1 an introduction to the population, economy and society
TRANSCRIPT

1
CHAPTER ONE
INTRODUCTION
1.1 An Introduction to the Population, Economy and Society of North-East India
1.1.1 North-east India: The Land, it’s People and their History1
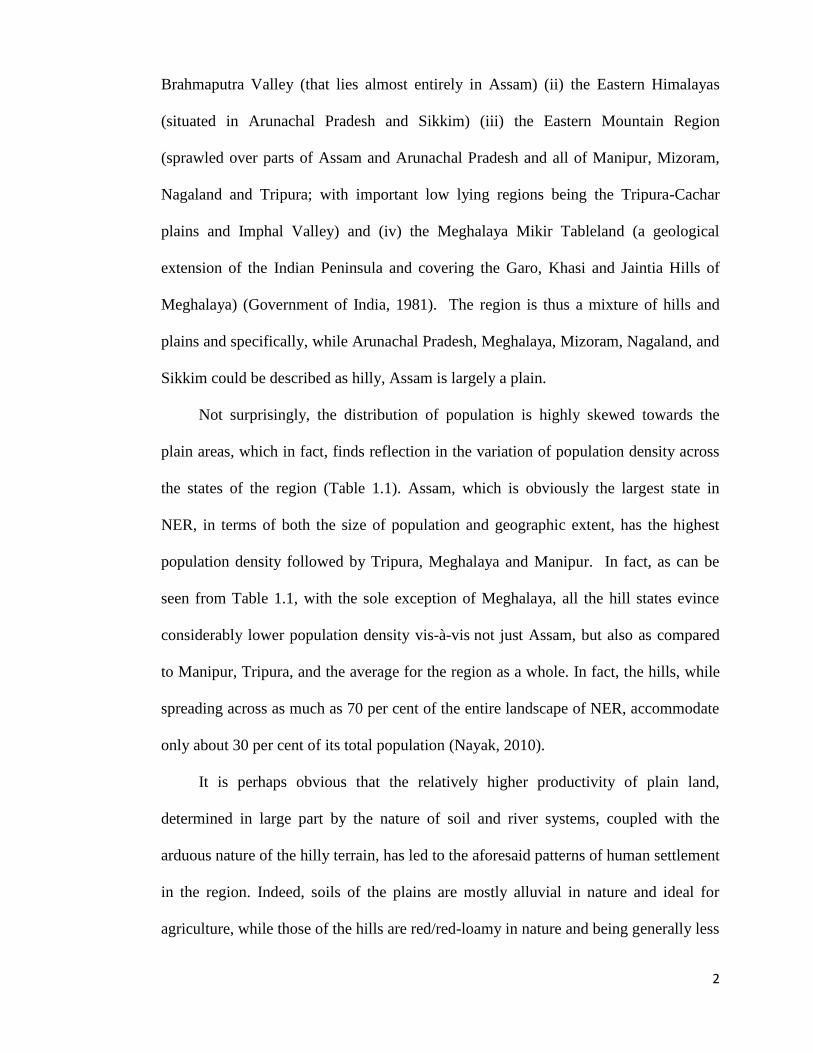
At the convergence of the Indo-Malayan, Indo-Chinese, Palearctic and Indian
bio-geographical realms, lies the North-eastern Region of India (NER hereafter) - a
region that still remains rather obscure from the viewpoint of ‘mainland’ India (Fig. 1).
Situated between the latitudes of 21.57°N and 29.30°N and longitudes of 88°E and
97.30°E, NER comprises currently of eight states: Arunachal Pradesh, Assam,
Manipur, Meghalaya, Mizoram, Nagaland, Sikkim and Tripura, which together cover a
total area of about 2.6 lakh sq. km. and occupy 7.9 per cent of the total geographical
area of the Indian subcontinent (Registrar General, 2004). Remarkably, it shares as
much as 4200 km. of international boundary (that constitutes nearly 98 % of its total
boundary) with four nations-Bangladesh, Bhutan, China and Myanmar- while at the
same time being joined with the rest of India by means of a narrow route popularly
known as the Siliguri corridor or Chicken’s neck (the latter name being rather an apt
description of the relative dimensions of this passage) (Taher and Ahmed, 2000).
Physiographically, the land can be categorized into four distinct regions- (i) the
1 It must be mentioned at the outset that this section does not present a complete discussion on
the history and society of North-east India (which is indeed somewhat outside the scope and
objective of the present research). In fact, the sole purpose of this part and its rather strategic
insertion at the beginning of the thesis is to provide the most important facts on the region that
have a bearing upon the issues to be presented and discussed in the rest of the dissertation.
2
Brahmaputra Valley (that lies almost entirely in Assam) (ii) the Eastern Himalayas
(situated in Arunachal Pradesh and Sikkim) (iii) the Eastern Mountain Region
(sprawled over parts of Assam and Arunachal Pradesh and all of Manipur, Mizoram,
Nagaland and Tripura; with important low lying regions being the Tripura-Cachar
plains and Imphal Valley) and (iv) the Meghalaya Mikir Tableland (a geological
extension of the Indian Peninsula and covering the Garo, Khasi and Jaintia Hills of
Meghalaya) (Government of India, 1981). The region is thus a mixture of hills and
plains and specifically, while Arunachal Pradesh, Meghalaya, Mizoram, Nagaland, and
Sikkim could be described as hilly, Assam is largely a plain.
Not surprisingly, the distribution of population is highly skewed towards the
plain areas, which in fact, finds reflection in the variation of population density across
the states of the region (Table 1.1). Assam, which is obviously the largest state in
NER, in terms of both the size of population and geographic extent, has the highest
population density followed by Tripura, Meghalaya and Manipur. In fact, as can be
seen from Table 1.1, with the sole exception of Meghalaya, all the hill states evince
considerably lower population density vis-à-vis not just Assam, but also as compared
to Manipur, Tripura, and the average for the region as a whole. In fact, the hills, while
spreading across as much as 70 per cent of the entire landscape of NER, accommodate
only about 30 per cent of its total population (Nayak, 2010).
It is perhaps obvious that the relatively higher productivity of plain land,
determined in large part by the nature of soil and river systems, coupled with the
arduous nature of the hilly terrain, has led to the aforesaid patterns of human settlement
in the region. Indeed, soils of the plains are mostly alluvial in nature and ideal for
agriculture, while those of the hills are red/red-loamy in nature and being generally less
3
FIG
. 1: M
AP
OF
TH
E N
OR
TH
-EA
ST
ER
N R
EG
ION
OF
IND
IA
Source: n
atmo.g
ov.in

4
fertile requires extensive treatment before cultivation. In fact, the differential nature of
terrain and soil conditions has given rise to two distinct types of agricultural practice in
NER- (i) settled agriculture in the plains, valleys and gentler slopes and (ii) slash and
burn (called jhum in local terminology) elsewhere (Government of India, 1981).
Needless to say, jhumming is the dominant agricultural practice in (but not restricted
to) the hilly states of Arunachal Pradesh, Meghalaya, Mizoram and Nagaland.
TABLE 1.1: SOCIAL COMPOSITION OF THE POPULATION OF NER, 2011
State/Region Total Population
Population
Density
(persons
Per
Sq.km.)
Percent of
lower castes
(SC)
in total
population
Percent of
tribal (ST)
in total
population
Number of
ST groups*
Arunachal Pradesh 13,83,727 17 0.0 68.7 16
Assam 3,12,05,576 397 7.1 12.4 23
Manipur 27,21,756 122 3.7 35.1 34
Meghalaya 29,66,889 132 0.6 86.1 17
Mizoram 10,97,206 52 0.1 94.4 15
Nagaland 19,78,502 119 0.0 86.5 5
Sikkim 6,07,688 86 5.0 20.6 4
Tripura 36,73,917 350 17.8 31.7 19
NER 4,56,35,261 174 6.6 27.2 133
India 1,21,01,93,422 312 16.6 8.6 659
Source: Census of India, 2011, Provisional Population Totals, Paper-1 of 2011; *tribal.nic.in
What is more important (though hardly surprising) is that the hilly regions of
NER are predominantly occupied by tribes.2 In fact, as is evident from Table 1.1, the
2 It should be mentioned here that the terms ‘tribe’, ‘tribal’(population) and ‘scheduled tribe’
have been used interchangeably in the text, and unless specified otherwise, refer to population

5
four hill states, viz., Arunachal Pradesh, Meghalaya, Mizoram and Nagaland, have a
largely tribal character, with the percentage of tribes in total population ranging from
almost 69 per cent in Arunachal Pradesh to slightly under 95 per cent in Mizoram.
However, the tribal population of the remaining states of NER including Assam cannot
be said to be negligible either, given that they evince a far greater concentration of
tribal population as compared to the all-India average (Table 1.1). Indeed, NER
distinguishes itself in being home to at least 133 Scheduled Tribe groups out of a total
of around 659 such distinct groups presently identified in India (Ministry of Tribal
Affairs, Government of India).3
As mentioned earlier, the concentration of the tribal population in the hilly
regions of NER hardly comes as a surprise. Several scholars (for e.g. Maharatna, 2005;
Raza and Ahmad,1990) observe that the tribes of India, who are arguably the
autochthones of the region, are now found largely concentrated in various hilly,
forested and semi-arid areas of the subcontinent, which are mostly unsupportive of
large agricultural settlements. Indeed, the spatial distribution of the various ethno-
cultural groups within the Indian subcontinent could be explained as resulting from a
process of ‘backwash’; with the invasion and ingress of each new migratory wave,
groups that have been recognized as Scheduled Tribes under Article 342 of the Constitution of
India and declared as such by the President through public notification.
3 As is perhaps well known, the list of Scheduled Tribes (ST) has been expanded and modified
several times since it was first promulgated in the year 1950, the same year that India adopted its
Constitution. In fact, the number of ST groups has increased manifold since then, with the last
Constitutional amendment of 2012 bringing a nearly three-fold rise in their number- from 212
ST groups in 1950 to 659 such distinct groups presently (tribal.nic.in). Indeed, in the context of
NER, talks are underway for granting ST status to six communities of Assam- the tea tribes,
Koch-Rajbongshi, Moran, Motok, Tai-Ahom and Chutia- that together account for around 60 per
cent of the population of Assam presently. In that case, Assam would count among the tribal
majority states of NER with more than 70 per cent of its population belonging to one or other of
the tribal communities (Kalita, 2013).

6
pushing the existing groups to the periphery (Panikker, 1955). Speaking specifically of
the distribution of tribal population in India, it appears that their present predicament
has been largely designed by this historical process of peopling of the subcontinent
coupled with their inability to withstand the aggression of the incoming population
groups. In fact, as argued by Maharatna (2005), in the mainstream perception of the
process of peopling of the Indian subcontinent (and the resulting distribution of the
tribal and non-tribal population), it was possibly the superior social organization and
techno-economy of the non-tribal, Indo-Aryan speaking peoples that had forced the
indigenous peoples, originally settled in the plains and river valleys of India, to recede
gradually to their present locations in these rather inaccessible terrains.
Needless to say, the geographic patterning of the tribes has had historic impact
on the future course of their economic and social development. Here, it seems
worthwhile to quote from Ahmad (1983), who expresses this concern succinctly in the
following words:
“The locational constraints have exercised far-reaching impact on
their (tribal) world view, social responses to the agrarian
formations and the pattern of interaction with the neighbouring
communities…. There is no gainsaying the fact that the problems
of the Indian tribes in contemporary India cannot be understood if
they are delinked from the geographical and social isolation.”
[Ahmad (1983), quoted in Nayak, 1998: 166]
Indeed, it could be argued that, at least in the context of NER, the historical
disadvantage in economic and social development was perpetuated (and possibly
exacerbated) by the colonial, and to a certain extent, post-colonial policies on the
7
socio-political integration of the region with the remaining subcontinent (but more on
this presently).
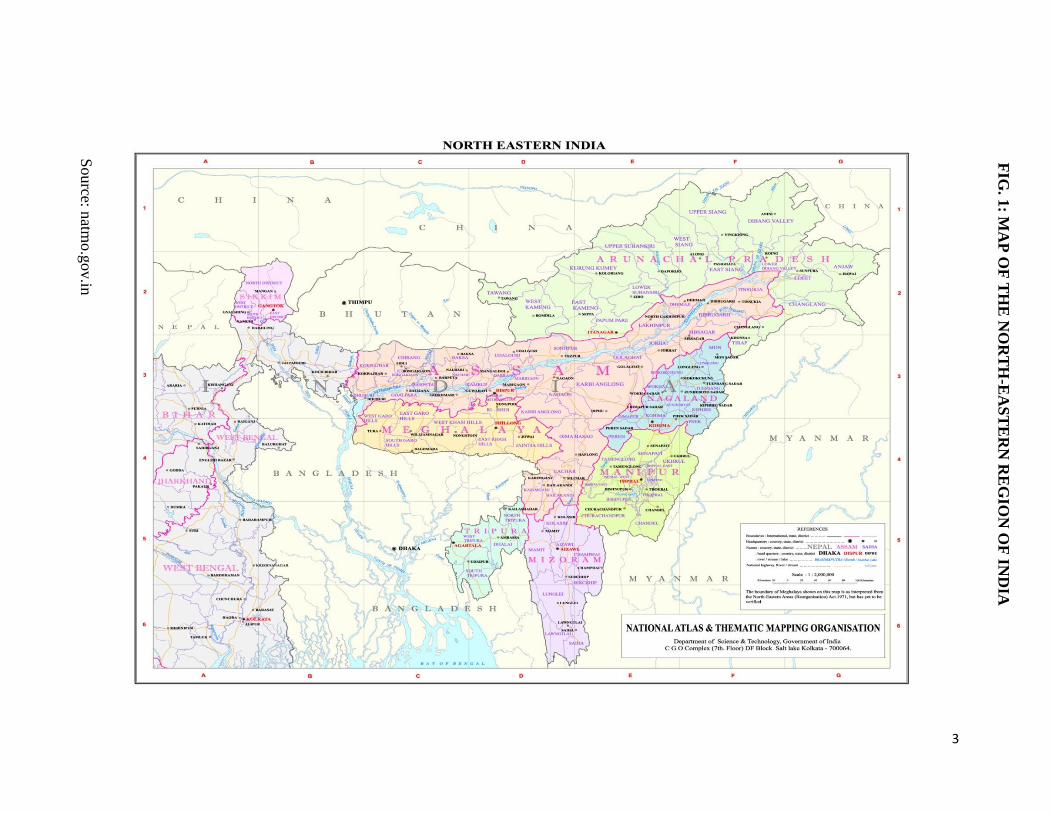
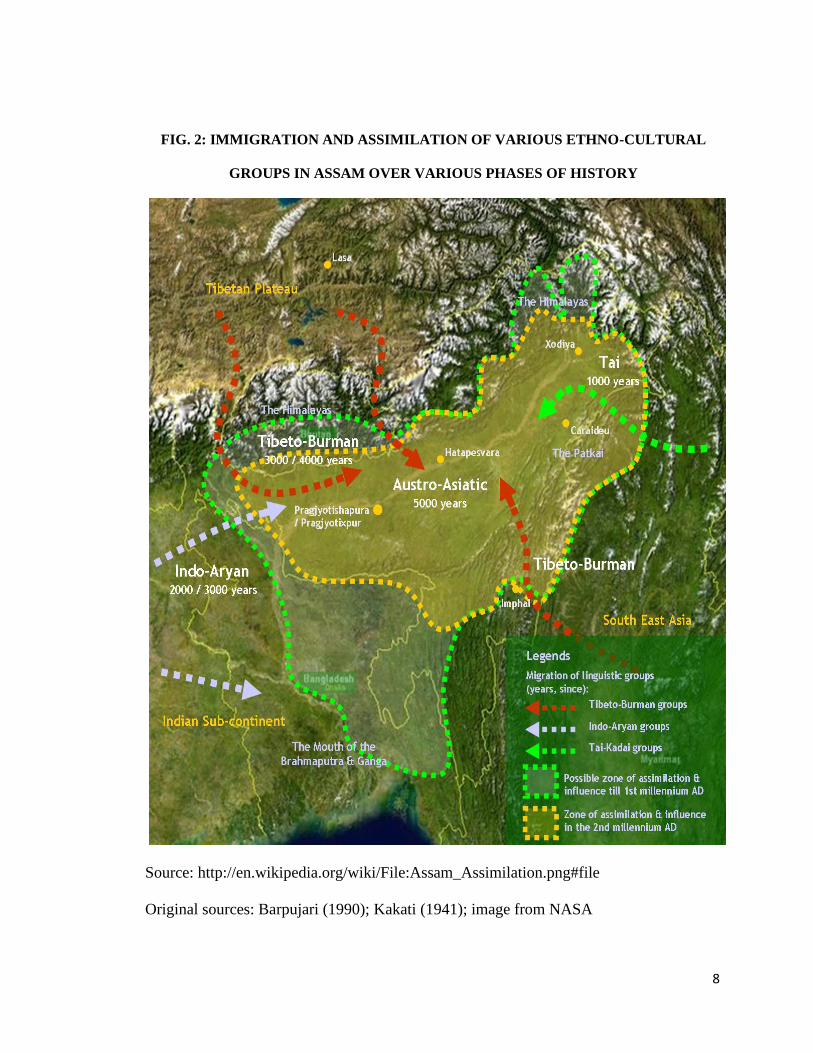
Anthropological research on the region finds its population to be primarily
composed of four distinct ethno-cultural groups, viz., the Austro-Asiatic or Australoid
groups, the Tibeto- Burmans, the Indo-Aryans, and the Tai-Ahoms (Barpujari, 1990;
Baruah and Roy Choudhury, 1999; Kakati 1941, among others). Fig. 2 is a possible
representation of the process of peopling of NER that has resulted in the presence of
the aforementioned identities in the region. The Austro-Asiatic groups, represented
primarily today by the Khasis of Meghalaya, are generally believed to be the earliest
settlers of this region, who were driven from the foothills of the Brahmaputra Valley to
their present habitats in the Khasi hills and the neighbouring hill districts of Karbi
Anglong and Cachar, by the invasion of the Tibeto-Burmans (Nayak, 1998). These
groups, in turn, were driven to their present primarily hilly habitats, by the invading
Indo-Aryan groups who established the ancient kingdom of Pragjyotishpur (later
known as Kamrup) including present day Assam and parts of Bengal and Bangladesh.
The last ethno-cultural group to invade the region during the thirteenth century were
the Ahoms/Tai-Ahoms, who came from the Yunnan province of China and established
a kingdom that survived for nearly six hundred years before its annexation by the
British in 1826 (Baruah, 1999).
Ethno-linguistically, the various dialects spoken in the region can be broadly
assigned under the Austric, Sino-Tibetan and Indo-European language families (Taher,
1979; Moral, 1997). Interestingly perhaps, the Indo-European language finds its sole
8
FIG. 2: IMMIGRATION AND ASSIMILATION OF VARIOUS ETHNO-CULTURAL
GROUPS IN ASSAM OVER VARIOUS PHASES OF HISTORY
Source: http://en.wikipedia.org/wiki/File:Assam_Assimilation.png#file
Original sources: Barpujari (1990); Kakati (1941); image from NASA

9
autochthonous representation in the Assamese (Asamiya) language.4 Likewise, the
only representative of the Austric language family is the Mon-Khmer, spoken by the
Khasis of Meghalaya (Kakati, 1941). Almost all the remaining languages spoken by
the various major and minor population groups in the region including Meitei, Angami,
Ao, Konyak, Bodo, Mising, Kak-borak, Mizo, Hmar etc. can be placed under the
Tibeto-Burman group of the Sino-Tibetan language family. Not surprisingly perhaps,
Assamese (and in several cases pidgins derived from Assamese, such as Nagamese and
Arunachalese) has been serving as the lingua franca among many linguistic groups for
the past several centuries (Moral, 1997). In this connection, it is worth mentioning that
the Asamiya language itself, as it stands currently, is a result of the fusion of the Ahom
dialect of the Tai-Ahoms with the then existing Assamese language of the
Brahmaputra valley (an Apabramsa dialect developed from Magadhi Prakrit of the
eastern group of Sanskritic languages). Indeed, the exchange of several linguistic
features among the various dialects of NER, as indicated by several researches (e.g.
Moral, 1997), indicates considerable acculturation and socio-cultural diffusion among
the various communities residing in and around the Brahmaputra Valley in the pre-
colonial era.
4 Of course, we find other dialects belonging to the Indo-European language family in NER- the
most notable among them being Bengali. However, in contrast to the prehistoric presence of the
other languages, the latter were introduced much later by the British. In fact, as the story goes,
the inability of the Ahom rulers of the eighteenth century to protect themselves from Burmese
invaders, led them to seek assistance from the British, who were equally willing to oblige due to
their commercial interests in the region, and conceded in return for a ‘Commercial Treaty.’ This
treaty, which was signed between Gaurinath Singha of Assam and Captain Welsh in 1793, led to
the opening of free commerce between British occupied Bengal and Assam, which effectively
unlocked the doors of the region to immigrants from Bengal who came to settle in the region in
various medical, legal, and teaching professions as well as many positions in the railways and
post office (Chadha, 2005; Baruah and Roy Choudhury, 1999, Weiner, 1978).

10
Indeed, the Ahom rulers expressed a zeal for secularism marked by a policy of
peaceful co-existence with the surrounding tribes, which even extended towards
cultural synthesis with the latter. Evidence suggests that the Ahoms maintained
commercial ties with many of the tribes during the pre-colonial times. Weekly trade
with the Garos, Nagas and some tribes of Arunachal Pradesh (especially the Apa
Tanis, hill Miris, Adis) was a regular feature during the Ahom rule, to which the
aforementioned Nagamese and Arunachalese languages bear testimony today. Indeed,
there is evidence to suggest that Ahom kings conferred titles (such as Bor Phukan) on
Naga individuals, allotted land to them and appointed them as officers in the army
(Baruah, 1999). In fact, the bonds with the nearby tribes went further than interaction
for commercial and military purposes and many Ahom kings are known to have sought
alliance with women from neighbouring tribal communities. The records of the social
interactions between the former and the latter, maintained carefully by the Ahoms,
demonstrate this by indicating that many leading Ahom families had been formed by
patriarchs belonging to non-Ahom (tribal) communities such as the Varahi, Miri,
Chutiya, Koch, Kachari, and Garo (Ghosh, 2006). The Konyak Nagas maintain that at
least up to 1936, they continued to receive an annual tribute, as acknowledgment of the
marital bond between a certain Ahom king and a daughter of their village (Jacobs
et.al., 1998). Indeed, some historians (e.g. Elwin, 2005) believe that tribes such as the
Nagas may even have been subjects of the Ahom rulers. Overall, it appears that there
was considerable interaction between the tribal communities and those residing in the
plains of the Brahmaputra valley. However, much of that was to change with the
advent of colonial rule in the Brahmaputra valley in 1826.

11
Indeed, the dominion of the Ahoms in the Brahmaputra valley had effectively
come to an end before 1826 when the Burmese, after repeated attempts to overthrow
the Ahom rule, finally succeeded in occupying Assam in 1821 and the Ahom kingdom
came to be ruled by a Burmese commander. However, the Burmese rule in Assam was
short-lived as the British, upon request from the Ahom ruler (and possibly being driven
by the imminent threat of future invasions by the Burmese into Bengal), declared war
against the latter in 1824. What followed was the two year long First Anglo Burmese
war that ended with the Treaty of Yandaboo, signed on 24th February, 1826 between
the Burmese and the British East India Company, leading to the British occupation of
Assam (Baruah, 1999; Baruah and Roy Choudhury, 1999, among others).
However, what is more important from the socio-political (and economic)
standpoint is the divisive policy adopted by the British administration between the
Assam plains and the remaining (tribal) areas of North-east, after they established
themselves in the region. In fact, “[t]he experience of the colonial rule in these areas
(tribal areas), to say the least, was profoundly different from that of the regularly
administered parts of British India,” (Baruah, 1999: 28) (italicized words added to
original quotation). Specifically, while the principally non-tribal districts of the
province of Assam were placed under the regular administrative regime of the Empire5
as in the rest of the British Provinces of India, the tribal tracts surrounding the
Brahmaputra Valley (that today correspond roughly to the four states – Arunachal
5 Indeed, there was also some confusion regarding the position of Assam in the administrative
map of British India (probably stemming in part from a lack of understanding of the region and
its people). Assam was ruled as part of the Bengal Province till 1874, when it was declared a
separate province due to administrative difficulties. However, again between 1905 and 1921, the
region was merged with Bengal and administered as the Bengal and Assam Province. Amidst
strong protests against the merger, it was once again separated from Bengal and constituted as
the Assam Province and placed under the Governor-General of Assam Province (Inoue, 2005).

12
Pradesh, Meghalaya, Mizoram and Nagaland) faced severance and isolation- physical,
social and perhaps even psychological- from the Valley (and as a consequence, the rest
of India), through a series of rules and regulations beginning 1874. “First, the people
living in the settled districts of Bengal and Assam were prohibited from entering these
hills by the introduction of Inner Line System under the East Bengal Frontier
Regulation, 1873. This was followed by removal of all outsiders not required by the
British in the hills or considered undesirable under the Chin Hills Regulation of 1896.
Then the operation of most of the general laws of the country was made inapplicable in
these hills by an order under the Assam Frontier Tracts Regulation, 1880. The
Government of India Acts of 1915 and 1919 termed these areas as "backward" and
excluded them politically from the purview of the new provincial legislature and the
High Court. Finally, the Government of India Act of 1935 created a totally new
political status for these areas by excluding them fully from the federal and provincial
legislatures as well as the jurisdiction of the High Court” (Jafa, 1999).
Thus, the colonial rule in NER, in effect, led to a hardening of the boundaries of
the tribal hinterland with the rest of Assam. It would not be incorrect to say that the
policies followed the British in NER laid the foundations for the balkanization of
Assam witnessed in independent India, by sowing the seeds of ethnic determinism of
nationhood (which is inherently opposed to the character of the Indian state marked by
a multi-ethnic and socio-culturally diverse population) and more importantly, by
creating a political cleavage with the rest of the subcontinent. Indeed, many
researchers and scholars are of the opinion that the ethno-centric political movements
in the tribal dominated areas of NER heralded by the Naga armed conflicts (beginning

13
1963) have their roots in the inability of the rising political consciousness of the
Indians during the final years of the British Raj to penetrate the hills of NER.
It is perhaps interesting to note that the proclaimed reason behind the
introduction of the various regulations on the tribal areas within NER was the
‘protection’ of the tribes from the plains people. Prima facie, the policy of ‘non-
interference’ in the internal affairs of the tribes even adduced support for the
benevolent intentions of the Raj towards the socio-economically backward region in
NER. However, evidence perhaps suggests to the contrary and indeed, the reason
behind granting the tribes the freedom to govern themselves, might have been a lack of
commercial interest in the areas inhabited by them. In fact, a reading of the ‘History of
the Frontier Areas Bordering Assam’ penned by one of the Governors of colonial
Assam, Robert Reid, makes it amply clear that while on the one hand, the Raj started
to raise considerable taxes of various kinds from the tribes, on the other, they thought it
commercially more prudent to dissociate themselves from the direct administration of
these areas, thus leaving them to manage their internal affairs according to existing
rules (Reid, 1942). However, this is not to say that the condition of the directly
administered plains region of Assam, at least as far as socio-economic conditions are
concerned, was any better than the surrounding tribal areas.
In fact, on the eve of Independence, Assam was among the poorest states of
India; the reasons for which can clearly be traced back to the policies adopted during
the colonial period. There is no gainsaying that the administrative and economic
policies followed by the British in India, which were mostly driven by their short-term
commercial interests, led to an overall degeneration of India’s local/village economy,
North-east India being no exception. However, it would be interesting here to point out

14
some drastic changes that occurred by way of the British involvement (or rather
interference) in the economy of Assam.
It is well-known that the British were allured to the region by the possibility of
financial gains from investment in its indigenous resources, of which tea is the primary
example. However, the policies used by the British for the establishment and
expansion of the tea estates (and a few other industries, such as coal and oil) entailed
practically no involvement of local resources; leading to the formation of an enclave
economy in Assam (Guha, 1977, 1991; Sharma, 2011). In fact, “the most significant
aspect of the colonial economy was that the people of the region did not stand to
benefit much from the “enclave” economy that was being developed by the British.
The extracted surplus from the tea industry as well as a substantial portion of the wage
bills went outside the province and there emerged a serious imbalance between the
growing modern sector comprising the tea plantations, coal-mines, oil-fields and the
associated infrastructure on the one hand and the near-stagnant agriculture on the
other. With most of the head offices located in London and Calcutta, the indigenous
sector of the economy may be said to have only marginally benefitted by the colonial
development pattern” (Misra, 2005: 57). Interestingly, even the modest infrastructural
investment undertaken by the British in the plains region of Assam failed to benefit the
populace. For instance, the railway lines that were laid down for tea trade served
merely the interests of the European planters and never connected the districts or towns
of Assam (Sharma, 2011).
Furthermore, there were changes both in the nature and pattern of the existing
trade relations of Assam with its neighbours. While on the one hand, trade with Bengal
received substantial boost, that with the surrounding tribes or even with neighbouring

15
countries such as Bhutan, Tibet, Myanmar and China (even if comparatively marginal)
declined tremendously during the first half of the twentieth century. Alongside with
this, commodities such as tea, oil and jute came to occupy the most important place in
the external trade of Assam replacing others like cotton, lac and ivory (Barpujari,
1996; Misra, 2004, Misra, 2005).
Remarkably perhaps, the financial relations between the Provincial Government
in Assam and the Imperial Government at the Centre, was one marked by inequity and
exploitation and added further to the socio-economic woes of the region. While on the
one hand, the provincial governments had little control over the taxes collected by
them, on the other they were made responsible for the provision of social services,
which no doubt suffered due to lack of resources. In fact, such was the extent of
exploitation that in spite of the presence of quite a few flourishing industries in the
region such as tea, oil and coal, the province steeped deeper into financial deficits with
each passing year. In fact, Assam’s main industries fell under Central taxation, the
profits of which never reached Assam (Jakhalu, 2001).
On the whole, it appears that that the occupation of Assam by the British was a
turning point in the history of the region, one that set the course for its social,
economic and political development (or misery?) in the years to come. In light of the
preceding discussion, we next set out to examine and interpret the economic and social
developments in NER in the post-colonial era, and identify the contemporary issues
facing the people of the region today.

16
1.1.2 Economic and Social Development in NER: An Overview
That NER is economically the least developed region of the Indian subcontinent
is a widely known fact. The average annual per capita income of NER during 2011-12
was around 27,500 I.N.R, which was around 38 per cent lower than the all-India
average for the same period. Indeed, even as many parts of the country have made
significant strides towards modernization, industrialization and economic prosperity,
NER as a whole remains largely a rural agrarian society with the majority of its
workforce engaged in the primary sector. According to the 2001 Census, the
percentage of cultivators was highest in Nagaland (68.4%), followed by Meghalaya
(65.8%), Arunachal Pradesh (61.7%) and Mizoram (60.6%). However, there is little
variation in these figures over the states of the region and overall, agricultural
labourers and cultivators together constituted 54.7% of the total workforce of NER.
Even though the proportion of workers engaged in the primary sector in NER is
comparable to the all-India average of 58.2%, what is distressing is that while the
agricultural sector has witnessed considerable progress elsewhere in India, it continues
to remain backward in NER. Whereas NER accounts for 3.4 per cent of the agricultural
land of the country, it contributes just 2.8 per cent to the total foodgrain production of
India (RBI, 2005); a fact that underscores the extremely low agricultural productivity
of the region. In fact, the agriculture of the region is primarily of the subsistence type
dominated by small farmers. While around 60 per cent of the farmers possess
landholdings below one hectare, around 80 per cent hold below two hectares of land
(CMIE, 2007). Indeed, the entire gamut of factors including an exceptionally low
proportion of total irrigated area (ranging from 5.5 per cent in Assam to 30.2 per cent

17
in Meghalaya- well below the national average of 41.5 per cent), the negligible use of
agricultural inputs in the form of fertilizers (compare for instance the use of 1.5 kg per
hectare in Sikkim or even 60 kg per hectare in Manipur to the all-India average of
104.5 kg per hectare during 2004-05) or even electricity, and the ground level
utilization of credit, points towards the lack of development of the agricultural sector
of NER (Karmakar, 2008). Surprisingly, even though the staple food of all the states of
the region is rice, the lack of required infrastructural support and market forces do not
encourage the region to specialize in foodgrain production (that is especially true of the
hilly states Meghalaya, Mizoram, Nagaland and Sikkim), leading to high dependency.
Indeed, each year more than a thousand crore is expended in importing food from the
rest of the country (Sinha, 2010).
As mentioned earlier, there has been practically no growth of the secondary
sector (manufacturing and industries) in NER. Keeping aside the few large-scale
industries set up in Assam during the colonial period, the region has witnessed very
little progress in this area. Indeed, so little has been the investment in the secondary
sector that at present less than two per cent of the total number of large-scale industries
and only around three per cent of the small and medium enterprises (SME) in the
country is located in the region (Sinha, 2010). In fact, most of the employment outside
the primary sector is concentrated in services, especially in Government
services/public administration, which is in contrast to the reasonably high presence of
the manufacturing and industrial employment elsewhere in the country (e.g. Saha,
2012; Sinha, 2010; Srivastav, 2006).
One of the primary (and immediate) causes of the deficient growth of both
agriculture and industry is the lack of economic/physical infrastructure in NER

18
(Karmakar, 2008; Sinha, 2010). Even basic infrastructural facilities in the form of rail
lines, metalled roads and power are grossly wanting in the region and majority of its
states. The availability of all-weather roads is generally poor in NER. In terms of road
density (as the standard indicator for measuring the development of road network), we
find that all the North-eastern states (with the sole exception of Tripura) evinced lower
figures as compared to the all-India average during 2004-05. In fact, the relative
situation, in terms of differentials between the state figures and national averages, has
worsened since 1979 (Table 1.2). Indeed, Assam had a higher road density compared
to the national average in 1979, but the situation deteriorated rather fast during the
preceding three decades, so that during 2004-05, it lagged behind the rest of India
almost as much as it was ahead during 1979!
This appears even more distressing in the light of the fact that railway
connectivity is practically non-existent in the hill states of NER. Remarkably, railways
are yet to be established in Meghalaya, while rail routes are below 2 km in length in
Arunachal Pradesh, Manipur and Nagaland. In fact, around 98 per cent of railway route
lies within a single state viz., Assam. It perhaps goes without saying that the poor state
of road and rail connectivity, apart from hindering the general mobility of population,
retards the growth of both the agricultural and industrial sector by increasing the
difficulties in accessing markets for finished commodities and material inputs to
production, and even the movement of labour across states.
Indeed, the situation is not very different in the case of other physical
infrastructural facilities as well. For instance, the per capita consumption of electricity
among the North-eastern states is among the lowest in India, and even though

19
Table 1.2: Broad Indicators of Social and Economic Development in NER and Constituent States, A Long Term View
State →
Year ↓
Arunachal
Pradesh
Assam Manipur Meghalaya Mizoram Nagaland Sikkim Tripura NER* India
Compound annual growth rate of per capita NSDP at constant prices
1980-81 to
1996-97a
5.42 0.96 2.38 2.19 - 2.71c 8.85d 3.91 1.54e 3.22
1999-00 to
2006-07b
5.20 3.11 2.71 4.34 3.28 4.42f 6.07 7.09 3.27g 5.21
2004-05 to
2011-12
5.15 4.75 3.65 6.41 7.42 5.13 16.57 7.34 5.25 6.70
Sex Ratio (females per 1000 males)
1901 - 919 1037 1036 1113 973 916 874 939 979
1951 - 868 1036 949 1041 999 907 904 891 965
1971 861 896 980 942 946 871 863 943 906 930
2011 919 953 987 985 975 931 889 961 956 940
Population Literacy Rates (per cent)
1971 11.3 28.7 32.9 29.5 - 27.4 17.7 30.9 28.6 29.4
1991 32.8 42.5 49.9 38.2 66.9 51.1 46.5 49.5 43.9 42.5
2011 66.9 73.2 79.8 75.5 91.6 80.1 82.2 87.7 75.6 74.0
Female Literacy Rates (per cent)
1971 3.7 19.3 19.5 24.6 - 18.6 8.9 21.1 19.3 18.9
2011 59.6 67.3 73.2 73.8 89.4 76.7 76.4 83.2 70.2 65.5

20
State →
Year ↓
Arunachal
Pradesh
Assam Manipur Meghalaya Mizoram Nagaland Sikkim Tripura NER* India
Poverty Rates (Head Count Poverty)
1983 40.9 4.0.5 37.0 38.8 36.0 39.2 39.7 40.0 - 44.5
1993-94 39.3 40.9 33.8 37.9 25.6 37.9 41.1 39.0 - 35.9
1993-94** 54.5 51.8 65.1 35.2 11.8 20.4 31.8 32.9 - 45.3
1999-00 33.5 36.1 28.5 33.9 19.5 32.7 36.5 34.4 - 26.1
2004-05** 31.4 34.4 37.9 16.1 15.4 8.8 30.9 40.0 - 37.2
2009-10** 25.9 37.9 47.1 17.1 21.1 20.9 13.1 17.4 - 29.8
Rural Male Unemployment Rate, Usual Principal Status (Current Daily Status) (per cent)
1993-94 16 (19) 46 (70) 12 (22) 4 (6) 14 (10) 21 (21) 6 (6) 14(34) - 14 (56)
1999-00 8 (13) 32 (64) 21 (24) 5 (6) 14(19) 26 (28) 32 (33) 7 (17) - 17 (72)
2004-05 11 (16) 30 (60) 20 (19) 1 (2) 8 (8) 59 (40) 31 (29) 98 (122 - 21 (80)
Rural Female Unemployment Rate, Usual Principal Status (Current Daily Status) (per cent)
1993-94 2 (4) 77 (124) 7 (11) 0 (2) 4 (5) 0 (6) 16 (17) 58 (104) - 8 (56)
1999-00 1 (1) 66 (125) 15 (26) 3 (5) 3 (5) 20 (31) 19 (25) 4 (57) - 10 (70)
2004-05 6 (11) 70 (87) 12 (11) 6 (7) 1 (3) 33 (22) 17 (21) 350 (374) - 31 (87)
Table 1.2 continued..

21
State →
Year ↓
Arunachal
Pradesh
Assam Manipur Meghalaya Mizoram Nagaland Sikkim Tripura NER* India
Nutritional status among children (2005-06) (figures in parentheses are the respective figures for 1998-99) (per cent)
% 6-35
months with
anaemia
66.3 (54.5) 76.7 (63.2) 52.8 (45.2) 68.7 (67.6) 51.7 (57.2) - 56.9 (76.5) 67.9 (61.8) - 79.2 (74.2)
% with BMI
<18.5 kg/m2 30 (22) 36 (35) 20 (20) 43 (29) 14 (20) 24 (19) 17 (16) 35 (37) - 40 (43)
Nutritional status among adult women (2005-06) (figures in parentheses are the respective figures for 1998-99) (per cent)
% 6-35
months with
anaemia
50.6 (62.5) 69.6 (69.7) 39.3 (28.9) 49.6 (48.0) 40.7 (48.0) - 58.5 (61.1) 67.4 (59.0) - 56.2 (51.8)
% with BMI
<18.5 kg/m2 16.4 36.5 14.8 14.6 14.4 17.4 11.2 36.9 - 35.6
Nutritional status among adult men (2005-06) (per cent)
% 6-35
months with
anaemia
27.4 44.6 14.1 34.2 19.5 - 18.1 39.8 - 4.3
% with BMI
<18.5 kg/m2 15.2 35.6 16.3 14.1 9.2 14.2 12.2 41.7 - 33.7
Road Density (per 100 sq. km.)
1979 13.82 72.59 39.47 16.04 13.82 35.06 - 74.63 - 48.90
2004-05 17.12 47.77 38.73 35.12 19.21 73.24 - 150.49 - 76.84
Notes: a Compound annual growth rates calculated at 1980-81 constant price. b Compound annual growth rates calculated at 1999-00
constant prices c The compound annual growth rate for Nagaland has been calculated for the period 1980-81 to 1993-94 d The compound
annual growth rate for Sikkim has been calculated for the period 1980-81 to 1991-92 e The compound annual growth rate for NER excludes
the figures for Mizoram as data are not available at constant prices. The NER figure excludes the figures for Nagaland for the period 1994-
95 to 1996-97 and the figures for Sikkim for the period 1992-93 to 1996-97 f The compound annual growth rate for Nagaland has been
calculated for the period 1999-2000 to 2005-06 g The compound annual growth rate for NER excludes the figure for Nagaland for the year
2006-07 * population-weighted average ** Tendulkar Methodology
Sources: Government of Meghalaya, 2006; RGI (1951, 1971, 1991, 2011); NSSO (various rounds); www.mospi.gov.in; IIPS (2007)
Table 1.2 concluded

22
there has been some increase in this variable overtime, there remains a substantial gap
between the North-eastern states and the average consumption levels in the country
(not to mention that among the more developed states of India). Remarkably, rural
electrification (the percentage of villages having electricity) has registered
considerable progress among the states of the region, but even here we find that these
states are among the remaining few that have yet to reach full rural electrification in
India (Fig. 3).
Fig. 3 Percentage of Villages Electrified, various states of India, 2008
Source: Government of Meghalaya, 2009
Given the rather tardy progress of both the primary and the secondary sectors in
NER, it should come as little surprise that the growth of real per capita incomes has
been sluggish over the past decades. In fact, as can be seen from Table 1.2, the
0
10
20
30
40
50
60
70
80
90
100
An
dh
ra…
De
lhi
Go
aH
arya
na
Ke
rala
Pu
nja
bTa
mil
Nad
uC
han
dig
arh
Dad
ra a
nd
…G
uja
rat
Kar
nat
aka
Him
ach
al…
Jam
mu
an
d…
Utt
ran
chal
Mad
hya
…W
est
Be
nga
lC
hat
tisg
arh
Sikk
imM
ahar
ash
tra
Utt
ar P
rad
esh
Man
ipu
rA
ll In
dia
Miz
ora
mA
ssam
Raj
asth
anA
nd
aman
…N
agal
and
Me
ghal
aya
Trip
ura
Aru
nac
hal
…O
dis
ha
Bih
arJh
arkh
and
Per
cen
tage
of
Vill
ages
ele
ctri
fied
in v
ario
us
stat
es

23
compound annual rate of growth of per capita net state domestic product (NSDP) was a
meager 1.54% per annum (p.a.) for NER during the period 1981 to 1997, while the
same for all-India was 3.22% p.a. on average. However, the growth rate of per capita
income recorded an increase in later periods, especially after the 1990’s. Indeed while
between 1996 and 2006, per capita incomes grew by 3.37% p.a., growth rates escalated
further to 5.25% p.a. in NER between 2004 and 2012. Nevertheless, the growth rates
were still considerably lower than the all-India figures for the respective periods.
Indeed, at least up to 2005, all the states of the region (barring Tripura) evinced lower
growth rates than the national average. In fact, the relatively higher rates of growth
evinced lately by a few states of the region, viz., Meghalaya, Nagaland and Tripura,
has been primarily fuelled by the growth in the service sector, and especially through
expansion of public administration (Srivastav, 2006)6. Hence, even the economic
growth of the aforementioned states remain uncertain in the future, unless there is
adequate thrust on the development of the agricultural and manufacturing sectors in
these states, and of course, in the region as a whole.
The situation of employment (or rather unemployment) presents another area of
concern in NER. Even as per capita income growth rates were rising in the region
(however slowly), unemployment did not show any clear trend of decline at least after
the 1990’s, as can be seen from the various (and any of the) indicators of
unemployment (Table 1.2). In fact, a remarkable feature among the various states of
NER, which stands in contrast to the all-India pattern, is the lack of significant
difference between the short-term [as measured for instance by the Current Daily
6 Of late, the manufacturing sector of Meghalaya has shown some signs of growth and it has
been contributing substantially to the growth of per capita incomes since at least the middle of
the 1990’s (Srivastav, 2006; Sinha, 2010).

24
Status (CDS)] and long-term unemployment rates [as measured by the Usual Status
(US)], signifying the structural nature of the problem in the region (Government of
Tripura, 2007).
Not surprisingly, between 1993 and 2000, there was increase in the percentage of
unemployed males and females among most of the states of NER according to both the
CDS and US measures and, in rural as well as urban areas. However, the only
exception to the usual pattern was Tripura, and to some extent Assam, that evinced
moderate decline in unemployment during the aforesaid period. Interestingly, from
2000 to 2005, there was very little change in the unemployment rates in NER but for
Nagaland and Tripura, the latter two states revealing a huge increase in both male and
female unemployment. It should also be mentioned that overall, among the various
states of this region, the situation of employment seems better in Meghalaya and
Mizoram (and to some extent Arunachal Pradesh) as these states reveal lower
employment rates over most of the period covered here as compared to the all-India
average. In this context, it is interesting to note that the proportion unemployed, as
perhaps expected, is many times higher among the educated group as compared to the
population average among the North-eastern states. Not surprisingly, the latter two
states perform better in this respect too, but the situation of educated females in both
rural and urban areas appears worrisome even here (Government of Tripura, 2007:181-
182).
Given the history of relative socio-economic backwardness of the region, it
would be rather interesting to look into the progress in poverty reduction among the
states of NER (Table 1.2). Official poverty estimates are available at least since the
early 1980s, but are based on a methodology of estimation that has been modified quite

25
a few times. To keep the discussion simple, we focus here on the changes in
headcount poverty rate between 1993 and 2010, for which we have estimates based on
a uniform methodology (Tendulkar methodology), thus helping us dodge many of the
problems of interpretation of estimates thrown up by dissimilar methods of estimation.
More importantly, the Tendulkar methodology provides estimates based on a wider
and more comprehensive definition of poverty, which includes education, shelter and
clothing in addition to food requirements.7
A look at the level and trend of poverty decline in NER, reveals several
interesting patterns in the data. First, even though there has been a tendency towards
decline, poverty rates show considerable variation among the states of NER. Second,
during 1993-94, NER had one of the highest poverty rates in India and while only a
single state- Mizoram- evinced lower poverty as compared to the national average,
three states- Arunachal Pradesh, Assam and Manipur-evinced vastly higher poverty
compared ranging from around 51 percent in Assam to 65 per cent in Manipur (Table
1.2). However, all the states, including the three mentioned above, witnessed
substantial reduction in poverty in later years, and in fact, at a faster rate vis-à-vis all-
India, so that all of them (with the sole exception of Tripura) evinced lower poverty as
compared to the national average figures during 2004-05. Third, during the period
2004 to 2010, poverty rates increased in as many as five states of the region- Assam,
Manipur, Meghalaya, Mizoram and Nagaland- and in fact, lead to the reversal of
poverty decline experienced earlier by Meghalaya and Mizoram. Thus, in the latter two
7 However, according to the Planning Commission, the Tendulkar methodology has to be put
to disuse as there have been several recent economic changes not accounted for by it. Indeed, a
new committee headed by C. Rangarajan is already underway with a new methodology and as
a result new estimates of poverty, even as we write this.

26
states headcount poverty was higher in 2010 as compared to their levels in 1993!
Indeed, in 2010 all the states of the region, with the exception of Meghalaya and
Sikkim, revealed higher headcount poverty as compared to the national average.
Overall thus, the performance of the North-eastern states in poverty reduction cannot
be said to have been consistently satisfactory since the early 1990s at least.
The last observation is however, intriguing. In fact, the North-eastern states were
the only to reveal rise in poverty since 2005 and this deserves some explanation and
verification. As an explanation, it is quite simply possible that there has been poor
implementation of State sponsored programmes aimed at the generation of
employment among the poor in rural (and urban) areas. For instance, it has been
claimed that the lower rural unemployment rates in Tripura as compared to the all-
India average after 1990 can be directly attributed to the serious implementation of
rural employment programmes in this state compared to other regions of the country
(Government of Tripura, 2007). This obviously has positive implications for the
reduction of poverty. Hence, it is conceivable that administrative failure in terms of
poor implementation of poverty reduction/employment generation programmes in most
of the states in NER have been contributing to the high levels of poverty, and perhaps
even the sudden rise in poverty among the aforesaid states.
Indeed, the evaluation of the State sponsored poverty reduction programmes such
as the National Rural Employment Guarantee Act (NREGA)/ Mahatma Gandhi
National Rural Employment Guarantee Act (MG-NREGA) by several scholars, reveal
that there are more serious administrative problems in the implementation of these
programmes in NER as compared to many other states of India (see for instance,
Rengasamy and Sasi Kumar, 2011). Moreover, several researchers have also noted that

27
states that have performed better in the reduction of poverty rates within the region
such as Meghalaya and Tripura (recently), have also performed better in several ways
in the implementation of poverty reduction (and employment generation) programmes
as compared to others such as Assam, which has performed poorly in both respects
(see for instance Feroze et al., 2012; Panda et al., 2009; Roy, 2010 among others).
It is interesting to note that evidence on the change in the nutritional status of
children and adults, also suggests that improvements in the standard of living in the
recent past in NER have been sluggish at best. For example, between 1999 and 2005,
the percentage of undernourished children- those with anaemia or those who were
underweight- showed significant decline in just a single state, viz., Mizoram, while
undernourishment actually rose in the remaining states (Nagaland presented a unique
case with increase in the percentage of underweight children on one hand and a decline
in those with anaemia on the other). In fact, the situation is almost identical in the case
of women as well, with the percentage of women experiencing nutritional deficiencies
actually rising between 1999 and 2005 among two of the states of the region, viz.,
Manipur and Tripura. It is perhaps noteworthy that regardless of current trends, the
nutritional status of men, women and children appears to be much better among the
tribal dominated states of the region. Indeed, the percentage of undernourished
population in these areas is lower as compared to the average of the region as well as
all-India, reflecting the healthy lifestyle followed by the tribals- at least till recently.
Despite several disadvantages related to economic growth in NER, many states
of the region still stand ahead as far as several social development indicators are
concerned (Table 1.2). Majority of the population of NER is literate, and the region as
a whole, as well as all the states, except Arunachal Pradesh, evinced higher literacy

28
rates vis-à-vis all-India in 2011 (Assam evinced comparable literacy rates with the all-
India level). Interestingly, even though it is generally held that the growth in literacy,
especially that among females, in NER has been huge achievement, it appears only
partially true in the light of evidence. No doubt, female literacy rates among most of
the states of NER, and especially the tribal majority states, was substantially higher
than that attained at all-India level for instance during 2011. However, it cannot be
forgotten that these states had a higher female literacy rate to begin with (Table 2.2). In
fact, between 1981 and 2011, female literacy rates have increased faster at the all-India
level as compared to most of the states of NER- notable exceptions being the states of
Arunachal Pradesh and Sikkim.
Be that as it may, the overall progress in NER along various dimensions of social
development has been noteworthy, at least since the beginning of the 1990s. Indeed,
the human development index (HDI), for instance, shows that the absolute value of
HDI in most of the North-eastern states was higher than the national level in 1991.8
While, the relative ranking among the 32 states and union territories of India placed
NER at the lower end of the development spectrum, the India Human Development
Report 2011 nevertheless reveals that the position of the North-eastern states has been
steadily improving since the 1990s. Whereas the North-eastern states (excluding
Assam) occupied rank 9 (which is itself commendable) during 1999-2000, the states
climbed the ladder further to position themselves at number 6 during 2007-08
(Government of India, 2011).
8 The HDI, as is well known, is a composite measure of the relative progress of a
region/country/state along set benchmarks of consumption, longevity and educational
attainment. And even though we have seen that the growth of income and consumption has not
been impressive in NER, the purpose of studying the HDI is that it is a useful summary
measure of the overall social progress of a population.

29
Further, NER has historically evinced far more balanced sex ratios vis-à-vis
India. Indeed, the sex ratio (female/male) in this part of the country started to look up
much earlier than that at the all-India level, commensurate with the decline in
immigration since the beginning of the 1970s. Indeed, it can be reasonably argued that
the higher proportion of females in the population in NER (among both children and
adults) is a direct outcome of the higher proportion of tribes in the population.
Tribals everywhere have been known for far more egalitarian gender relations in
their societies compared to their non-tribal counterparts. The situation in NER is
broadly in harmony with this larger picture. In addition to the relatively favourable
female to male ratios as compared to the all-India average scenario, we find that the
female singulate mean age at marriage among the North-eastern states has been, and
still is, considerably higher compared to all-India average levels (Maharatna, 2005).
Moreover, recent data from standard sample surveys [National Family Health Survey
(NFHS)] find that women’s participation in decision-making regarding their own
health care, household purchases and physical mobility was highest among the North-
eastern states, and actually even higher than the Southern states (IIPS and ORC Macro,
2007) (but more on this in subsequent chapters).
Unfortunately, there is evidence that the situation may be fast changing in NER.
Even as sex ratios have been rising in NER since 1971/81, the JSR has registered
continuous decline especially since 1981 (Ramaiah et al., 2011). There is a growing
discomfort that tribal societies may in fact, be emulating the culture of discrimination
against females characteristic of large parts of ‘mainstream’ India, leading to an
intensification of gender bias among them. Interestingly enough, recent estimates
indicate that gender discrimination could actually be on the rise in NER; rolling back

30
the earlier trend of relative female advantage in nutritional and mortality outcomes
among most of the states of the region. As an illustration, we present changes in the
gender disparity indices of mortality, nutrition and childcare for the period 1998 to
2005, constructed from NFHS data in Table 1.3 below. These indices, based on
Sopher’s method (Sopher, 1974), measure the disparity between male and female
children along any particular dimension of well being. For instance, the index of
gender disparity in childcare reflects the extent of discrimination against the girl child
in receiving full immunization. A positive value indicates bias against females, while a
negative value would indicate a relative female advantage. When there is no
discrimination between the sexes, the index assumes the value zero. (See Appendix 1
for a full description of the method and the calculation of the various indices).
As far as these indices lead us, none of the states of the region exhibited any
form of gender bias during the late nineties. In fact, what we come across is a relative
female advantage in nutrition, childcare and mortality, which is especially pronounced
in the case of the tribal dominated states of Arunachal Pradesh, Meghalaya, Mizoram
and Nagaland. Surprisingly, the situation is altogether reversed in many states of the
region during the following period.
During 2005-06, in around half of the states, the nutritional status of girls was
found to be relatively worse as compared to boys, and in nearly all the others, the
relative advantage of girls had declined significantly. In fact, the picture is remarkably
consistent with regard to the reversal of female advantage in each of the three
indicators of gender disparity. Surprisingly, we find a relative male advantage even in
the case of immunization. This is especially alarming as the vaccination and
immunization campaigns are sponsored by the Government and do not involve any

31
Table 1.3: Gender Disparity Indices along Various Dimensions of Well-Being
among Children Aged 0-6, NER: 1998-99 and 2005-06
State
Index of Gender Disparity
In Nutrition Index of Gender Disparity
In Childcare
Index of Gender Disparity
In Mortality
1998-99 2005-06 1998-99 2005-06 1998-99 2005-06
Arunachal
Pradesh
-0.40 -0.04 -0.63 0.36 -0.10 -0.04
Assam -0.01 0.10 1.04 -0.17 -0.22 0.10
Manipur -0.01 0.04 -0.22 0.44 -0.22 0.04
Meghalaya -0.02 -0.04 -0.11 -0.01 -0.34 -0.05
Mizoram -0.26 0.04 -0.49 0.41 -0.30 0.04
Nagaland -0.51 -0.16 0.04 0.03 -0.13 -0.16
Sikkim - - - 0.52 - -
Tripura -0.10 0.04 0.95 0.30 -0.62 0.04
Source: Author’s calculations from NFHS data [IIPS (2007)]
direct monetary cost on the part of the family. Indeed, it may not be long before gender
bias against females manifest itself in many other forms in this region as well.
Before concluding this section, we briefly discuss the political situation in the
region and its states, Indeed, any discourse on the society of NER is incomplete
without reference to the socio-political turmoil that has been going on in the region for
a considerably long time now, and which has rather wide-reaching consequences in
several contexts within the region, as shall be evident during the course of this thesis.

32
1.1.3 Socio-Political Situation in NER: The Contemporary Picture
It is perhaps well-known that the ongoing conflicts (especially the armed
conflicts) between various tribal groups and the State in NER, are primarily driven by
either of the two goals: (a) political autonomy within the Indian nation (b) secession
from the Indian nation (see for instance Upadhyay, 2006), which suggests that the
process of nation building is yet to reach conclusion, at least as far as the North-eastern
region of India is concerned. It goes without saying that the process of nation-building
in pluralistic societies (such as India) is universally fraught with such fears and the
progression towards the idea of a single nation cannot be expected to be a smooth and
quick process. However, the fact that such a situation has come to pass as the mainstay
of the politics and polity of NER, is something that deserves special attention. Not
surprisingly then, this issue has received considerable thought from all sections of
society including researchers, and several theories have been put forth towards
explaining the emergence and continuation of conflicts in NER. Among these, a
particularly dominant perspective is the one that suggests that incorrect/misdirected
policies of the Centre towards the (peripheral) North-east, which, it is claimed, is a
continuation of the colonial policy towards NER, have been the root cause of the
socio-political unrest in NER (for instance Baruah, 1989; Haokip, 2010; Upadhyay,
2006). However, this is perhaps not entirely correct.
As will be remembered from the discussion presented in the first section of this
chapter, the British followed the policy of ‘non-interference’ in the internal affairs of
the tribal communities of NER driven primarily by their lack of commercial interest in
these areas. The separate policies adopted by the British towards the Assam plains on

33
the one hand and the hill areas on the other, advertently or accidentally, also led to the
physical and psychological isolation of the tribal-dominated areas of NER from the
Assam plains and the rest of India as well. It cannot be denied that the government of
independent India adopted a socio-political position similar to that of the colonial
rulers by granting a great degree of autonomy to the hilly/tribal-dominated areas of
NER, as embodied in the provisions for self- governance in the Sixth Schedule of the
Constitution of India for the tribal- dominated areas of NER. A critical component of
these provisions has been the extensive legislative as well as executive powers to
protect land and tribal traditions in the scheduled areas (occupied primarily by tribes)
through the system of autonomous district and regional councils. In fact, these are the
very areas that were accorded the position of Excluded and Partially Excluded areas
under the British administration. But, this is perhaps where the similarities end.
In fact, although the strong resemblance between the colonial policies and those
adopted by independent India towards the political administration of NER cannot be
denied, there is possibly also a huge difference in the spirit with which such
administrative mechanisms were introduced in the region by the former and the latter.
Indeed, the implementation of the Sixth Schedule in NER reflected a standpoint that
was almost diametrically opposed to that of the British. Whereas the former was aimed
at the development of the tribes, the latter had no such connotation. Specifically, the
Sixth Schedule was introduced in NER within the broader ‘Nehruvian policy
framework’ that sought adequate protection and freedom to the relatively socio-
economically backward and culturally distinct tribes of the North-east. Within this
framework, the idea was to gradually integrate the tribes within the mainstream, as
distinct from efforts towards the assimilation of the tribal minorities in the Indian

34
society (Haokip, 2010).9 However, the results of the intervention were not satisfactory,
mainly due to problems with structural translation of the idea. Nonetheless, it would
not be correct to view the Centre’s policy towards NER as a colonial legacy in the
context of the region, even if the former were influenced by the latter to a certain
extent.
Having said this, it needs to be pointed out that in the aftermath of the Chinese
aggression of 1962, there was a drastic change in the Centre’s overall policy towards
NER; a shift from the integrationist approach followed earlier to one that broadly
resembled the policy of assimilation as defined earlier. Indeed, it is during this phase
that the policy of the Centre could be said to have been analogous to the one followed
during the British rule. In fact, from that point on, the policies were driven more by a
‘security’ perspective as compared to a ‘development’ perspective; the execution of
which brought about drastic changes in the society and politics in NER. The focus now
was the development of the territory of NER, as distinct from the development of the
tribes, and the earlier policy was replaced by an aggressive regime of politico-
economic and cultural integration of the tribal people to speed up their socio-economic
development (Das, 2001; Haokip, 2010). The overall idea was to pacify any possible
discontent through various means (including even force perhaps) in order to maintain
the territorial integrity of India.
9 Even though the terms ‘integration’ and ‘assimilation’ are generally used loosely and often
interchangeably, in this context, the difference between them formed the defining feature of the
Centre’s policy towards North-east India as envisaged under the Nehruvian or Nehru-Erwin
framework. Whereas, the former (and the one adopted by Nehru) meant political, economic and
administrative integration of the tribes without the loss of linguistic, religious or cultural
features, the latter implied loss of ethnic attributes of tribes and their absorption into the
dominant group, possibly resulting in increasing alienation and antagonism (Haokip, 2010).

35
What followed was the Balkanization of Assam beginning with the formation of
Nagaland in 1963. Indeed, the re-organization (or rather fragmentation) within the
region has been a continuous process, the discontinuation of which does not appear to
be any time soon at present. In fact, there are two interrelated issues at work here. First,
while most of the states of India were organized on linguistic grounds after based on
the States Reorganisation Commission constituted in 1953, those in NER were formed
on ethnic grounds, thus sowing the seeds of ethnic determinism of Statehood (Haokip,
2012b). Second, the security perspective adopted by the Centre towards the region led
to the rather uncritical granting of political autonomy to minorities, which in several
instances took the form of the creation of new states along ethnic lines. These two
factors taken together resulted in the proliferation of demand for separate states, and in
extreme cases, the demand for separate nations, by various ethno-cultural groups who
perceived them to have been wronged in some sense.
Indeed, several scholars are of the opinion that the efforts of the Centre in the
direction of maintaining peace in the region were largely of a stop-gap kind and could
not be expected to deliver the goods in the sense of either sustained economic
development or lasting peace in the region. In fact, the strategy of granting Statehood
to ethnic groups that was adopted by the Centre for dealing with armed conflicts in the
region, has led to the creation of a periphery within a periphery. The ethnic minorities
within these new-formed states in NER claim that their rights and resources are being
impinged upon by the ethnic majorities, and have thus been demanding political
autonomy of their own, paving the way for further divisions of the existing territories
of the states of the region (Baruah, 1989; Barbora, 2002; Roy, 2002; Shimray, 2004).
Thus, this policy seems to have failed, at least till now. However, there is little doubt

36
that the Centre has not taken the repercussions of its ‘minority’ policy into full
cognizance. Indeed, what is perhaps very much lacking from the side of the Center is a
holistic strategy for the development of NER. It would be useful to quote from Baruah
in this context who argues that “[T]o deal with the troubled north-east region, India has
a counter-insurgency strategy, an economic development strategy and even a vacuous
nation-building strategy. What it sorely lacks is a thoughtful state-building strategy -
one that could link state and society in a way that harmonises the interests, cultural
values and aspirations of the peoples of the region with the agendas of the national
state” (Baruah, 2002: 4178, emphasis added).
However, this is hardly all, so far as the ramifications of the ethno-centered
political struggles in the region are concerned. Indeed, in the democratic set-up of the
Indian state, it is hard to miss the development consequences of demographic power
(or the power of numbers) in any region, and especially in NER, where political
supremacy yet remains a contested issue, as should be clear from the discussion in the
preceding few sections. The fates of the various communities of the region are in fact,
inextricably tied to political representation, the lack of which spells economic, social
and cultural marginalization. Indeed, this is what has led sections from many minority
groups to engage in armed conflict with the State in the first instance. For instance, the
socio-political unrest over the issue of migration into the states of NER could be
explained within this framework. Once it is made clear that political power/autonomy
is directly linked to ethno-cultural aspirations (rather agitation in many instances), the
strategy that ethnically larger groups would adopt towards the ethnically dissimilar and
numerically weaker migrants perhaps becomes clear. Indeed, the fear of being driven
down to a minority and the consequent decline of political voice, or in extreme cases,

37
demands for complete autonomy by the migrants, has resulted in the ethnic majorities
resorting to constitutional (and in many cases unconstitutional) remedies in order to
maintain their socio-cultural hegemony.
A related issue concerns the fear of identity loss among the ethnic minorities in
NER, and in some cases even among the majorities within a particular State, when
threatened by large and incessant inflow of migrants, as exemplified by the case of
Meghalaya (see for instance, Saikia, 2005). In fact, there is evidence to suggest that a
cultural assimilation of a different kind has also been going on in the North-east,
whereby, the ethnic majorities are forcing the ethnic minorities to adapt to and accept
the former’s language, culture and way of life in general (Shimray, 2004). Not
unexpectedly then, in many of these instances, the response has been in the form of
stricter adherence to traditional laws including those that support large family size
(Saikia, 2005). However, we discuss this issue in greater depth in a later chapter.
Overall, the discussion till now indicates that the society of North-east India has
been troubled with social, political and economic maladies at least since the British
occupation of Assam in 1826, which resulted in unfavourable changes in socio-
political and economic relations in the region during the colonial era. The experience
of the region in the post-Independence, though not equally depressing, has been largely
one of dealing with profound challenges, the ongoing ethno-political struggles being
the most important among them. Needless to say, the socio-political crisis in NER has
severely crippled the prospects of economic and social growth in the region. NER
remains largely a backward agrarian economy with dire consequences as far as
employment and livelihood opportunities for the masses are concerned. Also, equally
important are the contemporary changes in the socio-cultural milieu of the tribes

38
inhabiting NER, as indicated by the deteriorating position of women, manifested for
instance, in anti-female bias in several areas including health and nutrition as
mentioned earlier. Indeed, gender bias among tribes in general and among those of
NER in particular has been hitherto unknown, and its emergence in NER is particularly
distressing.
With this attempt to provide a brief but detailed review of what is relatively
better known about the North-eastern region and its states, we now come towards such
issues that have received very little attention from researchers historically as well as
currently, but nevertheless remain such important facets that can shed useful light on
the society and gender relations in NER. Indeed, politics has held the spotlight in NER
for so long now, that other issues have been, much to the dismay of many, relegated
(rather buried) to the background for too long now. One could even argue that it is in
fact, ironical that while emphasizing the need to look beyond the ‘politics’ of the
region, most research on NER has in fact, failed to do so.
Specifically, among many aspects and dimensions of inquiry and research on the
region, its demography – for almost obvious reasons – is central to a deeper
understanding of its problems and possible remedies. Unfortunately, the existing
literature on the demographic trends and characteristics in this region is conspicuously
thin. In fact, it is only recently that a few academic attempts at the examination of
some specific demographic indicators e.g. reproductive behaviour, mortality, status of
women, and migration – albeit mostly in the context of some specific locations and/or
tribes of the contemporary states of NER have been made (e.g. Deb, 2010; Nayak,
2010; Saikia, 2005; Tyagi, Chowdhury and Banerjee, 2000; Dass, 1980; Mishra,
1999).

39
In this context, the primary object of the present thesis is to look into the
fertility10 transition in NER and its constituent states from a long –term comparative
perspective vis-à-vis India.11 In fact, it would not be incorrect to say that this research
is one of the very few (if any) that deals with the complexities of the process of fertility
transition in the tribal-dominated NER, and in fact, adds to the existing literature on
regional differences and determinants of fertility in India. Although the importance of
research on fertility can hardly be overemphasized, it could be mentioned here that the
total fertility rate (TFR), per se, as an indicator of reproductive ‘output’ of a
population, has important demographic and gender implications. Apart from the widely
acknowledged facts that first, the TFR is itself an indicator of social development (with
regions and populations with a higher levels of human development, typically posing
lower fertility rates), thereby implying that research on the levels and trends in fertility
in a population deserve attention in their own right, and second that higher fertility
impedes economic growth in various ways, it has been argued of late that reduction in
fertility or a change in the demographic regime from one with high fertility to one with
low fertility, is a pre-requisite for “gender transition” (broadly referring to
transformation of unequal social and institutional structures) (see for instance, Mason,
1995). Interestingly, this issue is also inextricably linked with much of what has been
10 The term fertility or fertility rate, as used in this thesis, and unless specified otherwise, refers
to the total fertility rate, generally understood as the average number of children born to a
woman in any specified population. Formally, the total fertility rate is defined as the average
number of children that would be born to a woman by the time she ended childbearing if she
were to pass through all her childbearing years conforming to the age-specific fertility rates of a
given year (Haupt, Kane and Haub, 2011). 11 Even though mortality studies on the region are also relatively scarce as compared to other
states and regions of India, its determinants are relatively well-known and hence our decision to
focus on fertility in this research. Further, we also do not take up the issue of migration, which
even though remains a germane issue, has received ample academic attention as any scholar
aware of research on NER would perhaps know.

40
discussed in this section relating to the economy, society, and politics in the region, as
will be argued in much of the remainder of this thesis. Besides, as much as the latter
helps us to understand demographic processes in NER, the demographic perspective on
the region and its states, on its part, informs us on the nature and changes in the socio-
cultural and socio-political aspects of the region. With this perspective, we now move
towards the approach and methodology of the present research for answering the
various issues related to fertility transition in NER.
1.2 Research Questions, Methodology, and Structure of the Thesis
As mentioned above, the primary aim of this thesis is to examine and explain the
process of fertility transition in North-east India. However, before moving ahead, it is
imperative to mention here that in clubbing the eight states of the region together, we
adopt a position that is arguably insensitive to the diversity of the sub-national cultures
within NER to a great extent. In fact, it has been pointed out by several scholars that
the very idea of a North-eastern region is a misconception, an artificial construct, born
out of administrative requirements that cannot be used in a meaningful way for
academic or policy purposes (Haokip, 2012a; Hussain, 2004 among others). However,
there are others who point out that there is in fact, a pan- North-East identity (and
commonality) in the minds of both- the people of NER and others outside the region,
and that, more importantly, it could actually be useful to approach the region as a
whole from an analytical standpoint in several cases, thereby attaching greater weight
to the similarities as compared to the diversities among the people of NER (see for
example Ngaihte, 2013). Indeed, one could argue that the relative parity in the nature

41
and extent of economic development of the states of NER, the distinct socio-cultural
moorings of its peoples, especially when compared to ‘mainstream’ India, and most
remarkably, the shared experiences of its inhabitants in the historical past and indeed,
to a great extent in the present, as indicated during the course of the discussion in the
previous section, justifies its treatment as one distinct region. It is specifically from this
perspective that it becomes meaningful also to discuss the pattern and determinants of
fertility transition in NER as a well-defined entity in its own right, especially in a
comparative perspective vis-à-vis other regions or all-India for that matter.
However, this does not preclude us from the analysis of the constituent states (or
for that matter, the districts) of the region. Contrariwise, the analysis of fertility
transition in a region can hardly be conducted without analysis of its constituent units
(states, districts, villages etc). In fact, what we are essentially trying to argue is that it is
rather unnecessary to focus on the dissimilarities within NER to such as extent as to
discard the very notion as untenable, thus ending all possibilities of such discussion
that would throw useful light on various issues facing the North-eastern region as a
whole.
Coming back to the objective of this research, we begin by asking ourselves
several questions such as, what do we know about the demographic regime of NER in
the past? Did the region and its constituent states evince a higher population growth as
compared to the rest of India in the past? If so, was it due to immigration or was the
fertility rate of the region higher then? What is the contemporary situation in NER and
its constituent states pertaining to fertility, mortality and migration, especially as
compared to the all-India scenario? What explains the relatively higher fertility rates in
NER? Is it that the people have a higher fertility preference or do they lack access to

42
family planning methods? How do economic, socio-cultural and socio-political factors
influence the fertility outcome in the region? And finally, what policy relevant
conclusions can one arrive at from the analysis of the process of fertility transition in
NER?
With the intention of finding the answers to the above, we begin by searching for
relevant literature in the form of books and published journal articles. As already
noted, we find very little (indeed, practically negligible) information on fertility in
NER and its constituent states, especially for the historical/colonial period. What we
come across for the colonial period on the North-east that comes closest to our field of
research, is basically ethnographic literature on the larger tribes of NER, primarily
penned by British anthropologists (Allen, 1902; Gurdon and Lyall, 1914; Reid, 1942
among a few others), which though precious in terms of the information they contain,
can hardly be expected to illuminate us on the issue of fertility in the region.12
Surprisingly, even when information on demographic variables such as fertility was
available for the more recent period, we hardly find any analytical discourse on the
issue to inform the present inquiry (but more on this in Chapter 3). 13
The tasks before us then, was to first collect (and in several cases construct) and
then analyze the available information on fertility in the region and its states, which
was found to be especially challenging for the pre-Independence period. Moreover, it
12 However, we do come across one such study by Ghosh (1956) that discusses the demography of
colonial Assam, and proves to be of immense value to us. It has been discussed in the following
chapter. 13 Indeed, a search through some of the highly esteemed social science journals leaves one
distressed with the discovery that is hardly any reference on North-east India. For instance, upon
hunting for fertility related literature in the Economic and Political Weekly, we learn that while
there are more than four dozen articles on fertility in India and its major states for the post-
Independence period itself, that on fertility issues of the states of NER is practically non-existent.

43
was clear by now that dictated by the nature of the central question posited in the thesis
(and available resources), we would be relying mostly on standard secondary sources
for this study, viz., the Census, Civil Registration System, Sample Registration
System, National Family Health Survey and District Level Household Survey.
However, we would like to quickly add here that an analysis of the nature and quality
of the data from these various sources has not been discussed here, but has been taken
up in the individual chapters, as and when they are introduced for the purpose of the
analysis.
As regards the theoretical framework of the thesis, given the breadth of the
research questions we set out to answer, it was difficult to settle on a single theoretical
framework that could fit all the strands together. In fact, for the same reason, there is
no single chapter devoted to a ‘Literature Review’, but a thematic approach is taken to
the issue and relevant literature is discussed alongside each topic. However, for the
latter part of the thesis that discusses the fertility transition in the post-Independence
period in NER and its states, our framework broadly resembles that developed by
Easterlin and Crimmins (1978) generally, in that we begin with an examination of the
proximate determinants of fertility among the states of NER, and then continue with
the investigation of background or contextual factors (economic, social, cultural
political) influencing fertility decline in NER. Each substantive chapter is devoted to
answering a particular or particular set of questions and we employ suitable methods in
order to answer the specific questions raised therein as discussed briefly below. The
general method applied to the thesis is one of examining the issues from multiple
approaches loaded with the notion that “No single analysis will tell the entire story”
(Fricke, 1997: 21).

44
Chapter 2 of the thesis examines long-term demographic trends in NER and its
constituent states, from 1901 to 2011, in a comparative perspective vis-à-vis India. In
fact, this chapter has two major sections; the first one discusses fertility, mortality and
migration during the colonial period beginning 1901, while the second major section
traces the changes in these variables over the post-Independence period (till 2011), and
compares the performance between the former and the latter periods in terms of these
demographic indicators.
The construction of the demography of NER during the British period is largely
based on Census reports, supplemented to some extent by the work of earlier
researchers on the topic, which though scarce proves to be immensely useful. In
addition, we use our own estimates of the TFR using indirect estimation procedures
based on census data to complement existing information on fertility differentials
between the region and all-India during the pre-Independence era. The second part, yet
again, relies on official sources- the Census and the SRS. In the process, we discuss the
quality of the data sources (primarily the Census and SRS) specifically in relation to
the effect of under-registration and misreporting on reported vital rates.
A particularly remarkable finding from the colonial period is that of a differential
in reproductive performance of the region vis-à-vis all-India. In fact, our own
calculation of the TFR for Assam and all-India for the years 1911 and 1931 using Rele
method shows that it might have been higher in the former region as compared to the
latter by nearly a child. This is indeed a significant finding, especially in view of the
fact that previous research on the subject has largely focused on immigration into NER
as possibly the lone cause of its relatively higher population growth vis-à-vis India.
However, our analysis finds that comparatively higher fertility of NER possibly also

45
had a role to play in it. The rather lower levels of socio-economic development and
higher infant mortality rate (IMR) of the region compared to all-India provide clues as
to why such differentials might have existed during that time.14
The post-Independence period presents us with some larger surprises. While
relatively higher birth rates among the major states of NER coupled with heavy
immigration flows, continued to push population growth rates above the national
average throughout this period, there was a dramatic change in the destination of the
primarily non-tribal immigrants from the tribal-minority regions in the pre-
Independence period to the tribal- majority states after Independence15. Indeed, the
ramifications of these developments have been the motivation behind extensive
academic debates and writings on the socio-political turmoil and its possible solutions
and resolutions in NER.
Chapter 3 analyzes fertility levels, trends and differentials among the states of
NER from the early 1970 to late 2000s. Data from three consecutive rounds of the
National Family Health Surveys (NFHS) found that none of the states experienced a
steady decline in fertility for the entire period from 1990 to 2005, which was marked
by statistically significant slowdown, and in some cases even reversal of the fertility
decline witnessed during the preceding decades in these states. Indeed, fertility trends
constructed from indirect estimates for the concerned period substantiate the finding of
a stall, and lead us to conclude that even though fertility had started declining in the
region and its constituent states at nearly the same time as the rest of India, NER
14 The infant mortality rate is defined as the number of deaths of infants below one year, per
thousand live births in a population in a given year. 15 The term birth rate or crude birth rate (CBR) is defined as the number of live births per
thousand population in a given year.

46
witnessed a stalling in fertility decline at considerably higher levels than replacement
level fertility from the middle of the 1990s. We also find substantial rural-urban
differences in fertility among the states of NER, as also by socio-economic categories
such as wealth and education.
We begin the investigation into the determinants of fertility in NER with an
examination of its intermediate determinants utilizing Bongaarts’ Aggregate Fertility
Model in Chapter 4. Among the various proximate determinants, the index of
noncontraception is found to be the most important factor influencing fertility.
Interestingly perhaps, nuptiality is also found to be an important determinant of
fertility- and especially important in determining its decline- among the states of NER.
However, we find very little change in most of the proximate determinants during the
period 1990 to 1998, and in fact, our estimate of the combined index- measuring the
joint influence of the indices of proportion married, noncontraception and postpartum
infecundability- shows practically no change or even a slight rise overtime among the
concerned states confirming the existence of a fertility stall.
Stepping closer towards the contextual factors influencing fertility, we also
examine the relative influence of fertility preferences, and family planning
programmes in determining fertility trends among the states of the region in this
chapter. We carry out the analysis utilizing state-level data drawn from the NFHS.
Interestingly enough, we find that in most cases of a rise in fertility, it is some
deficiency in the family planning programme and the associated rise in unwanted
fertility that has an overriding influence, reversing the effect of the change in fertility
preferences towards a smaller number of children. Among various indicators of socio-
economic development that influence fertility preferences in our model, we find that

47
the stall in fertility decline is associated with increases in infant and child mortality.
Interestingly perhaps, states that did not experience a stalling in fertility decline went
through relatively rapid increases in female literacy rate.
In the final analytical chapter, Chapter 5, we move further with our search into
the socio-economic and cultural correlates of fertility, and introduce a panel data
model to explain district level variations in fertility in NER for the period 1991 and
2001. While most of our explanatory variables have been gleaned from standard
secondary sources like the census, comparable estimates of the TFR at the district level
for 1991 and 2001 were unavailable for the concerned period. Hence, we use our own
indirect estimates of fertility based on the Arriaga-Arretx method (which can be
considered as a refinement over the original Brass P/F method of estimation in relaxing
the assumption of constant fertility). In fact, ours is perhaps the first instance of an
attempt towards quantifying the various social, economic and cultural influences on
fertility in NER, and the results prove that the effort has possibly been worthwhile.
Remarkably, while variables capturing overall levels of economic growth, like
urbanization, are found to be of little consequence in determining fertility in NER,
those that are more closely associated with socio-cultural factors are found to be of
greater consequence. In line with several other studies on the determinants of fertility
in India, and indeed, several countries throughout the world, we find that female
literacy contributes significantly to lowering fertility in NER, thus confirming the near
universal positive impact of female education on fertility decline. As partial evidence
of change in the socio-cultural mores of the tribes of NER, we find that a higher
proportion of Scheduled Tribes leads to higher fertility in NER. This finding is again
of crucial significance as it reflects, at least to a certain extent, a tearing away from

48
past cultural practices related to lower fertility among tribes, a conclusion reached by
several painstaking inquiries on the subject in the past. Interestingly, we do not find
support for the generally held view that adherence to Christianity has a fertility
enhancing effect in NER. Interestingly, we also find evidence in support of the
hypothesis that in certain situations, such as the one we encounter in the newly formed
tribal-majority states of NER, ethnic clashes triggered by demographic imbalance due
to huge in-migration, and the accompanying perceptions of marginalization in the
State’s political processes, can lead to pro-natalist proclivities in the concerned groups
under circumstances where political representation is linked to the size of population,
and the society is passing through a stage where political supremacy remains a
contested issue.
Chapter 6 concludes the thesis and provides a few suggestions. From a policy
perspective, improvement in the family welfare programme with a thrust on its IEC
(information, education and communication) component has the potential of reducing
fertility primarily by reducing unwanted fertility. The study also brings out that greater
effort has to be made towards bringing down the infant and child mortality rates and
increasing the female literacy rate in the North-eastern states of India if there has to be
sustained fertility decline in the region in the coming years. Importantly perhaps, this
thesis makes a case for a deeper understanding of the basic issues of socio-political
organization, not only in their own right, but as they affect myriad dimensions of
people’s lives- both personal and social. The silent but significant changes confronting
the peoples of the region, as for instance, in socio-cultural practices governing fertility
behavior, calls for greater attention and a holistic approach to the various demographic,
economic and social issues facing NER to-day.